Data Compression Approach for Long-Term Monitoring of Pavement Structures

 , , and
Abstract
:
1. Introduction
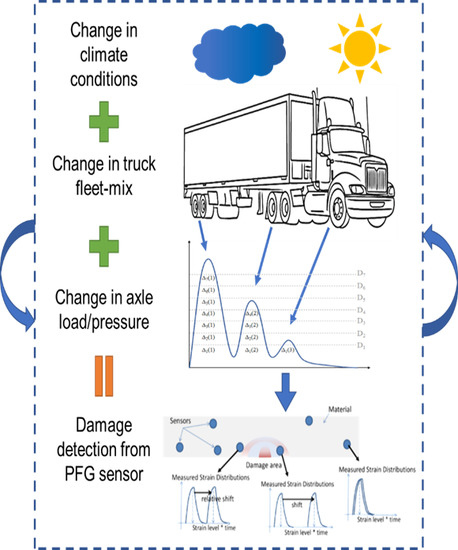
Aim of This Paper
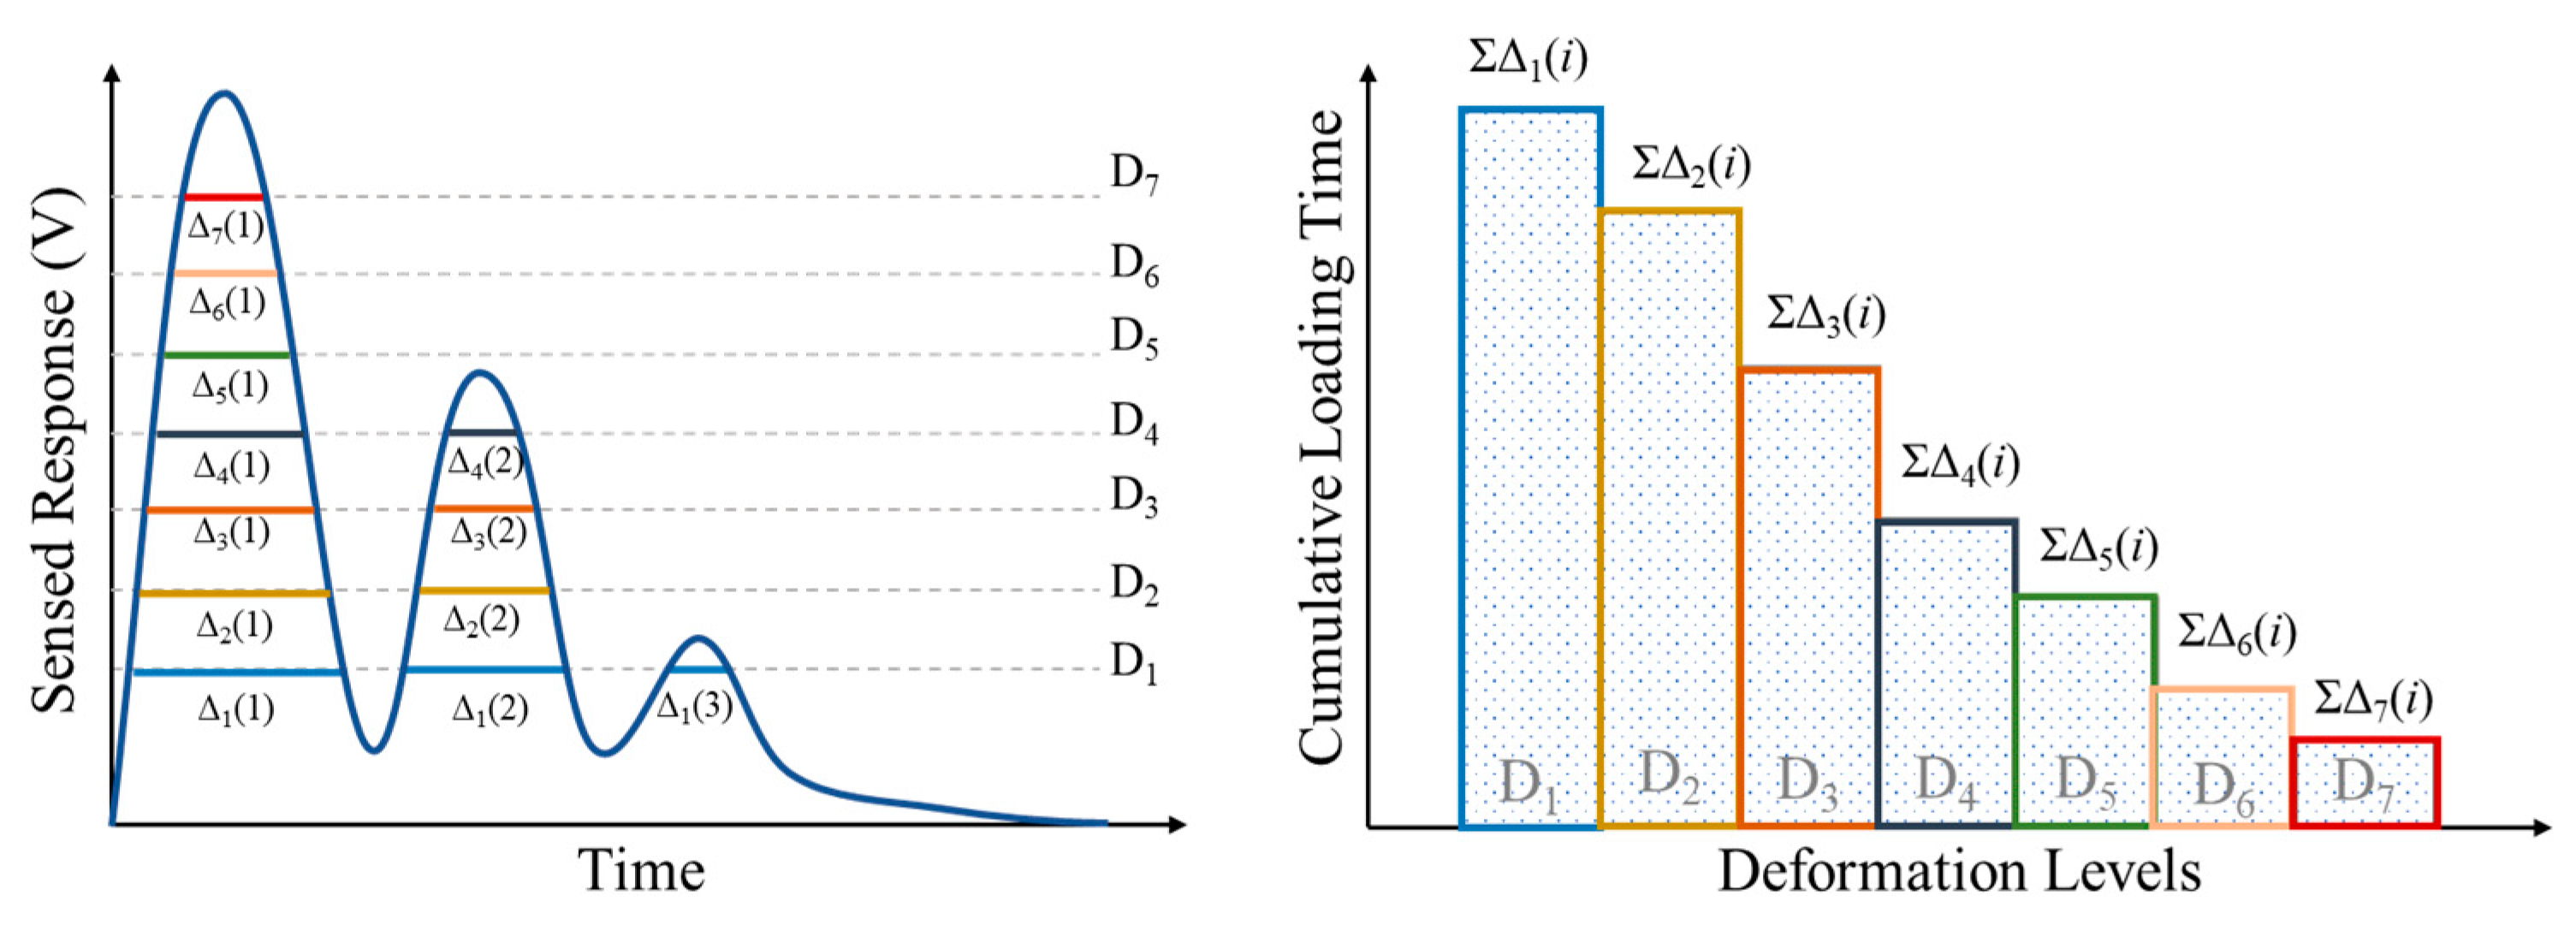
2. Pavement Monitoring System through Piezoelectric Sensors
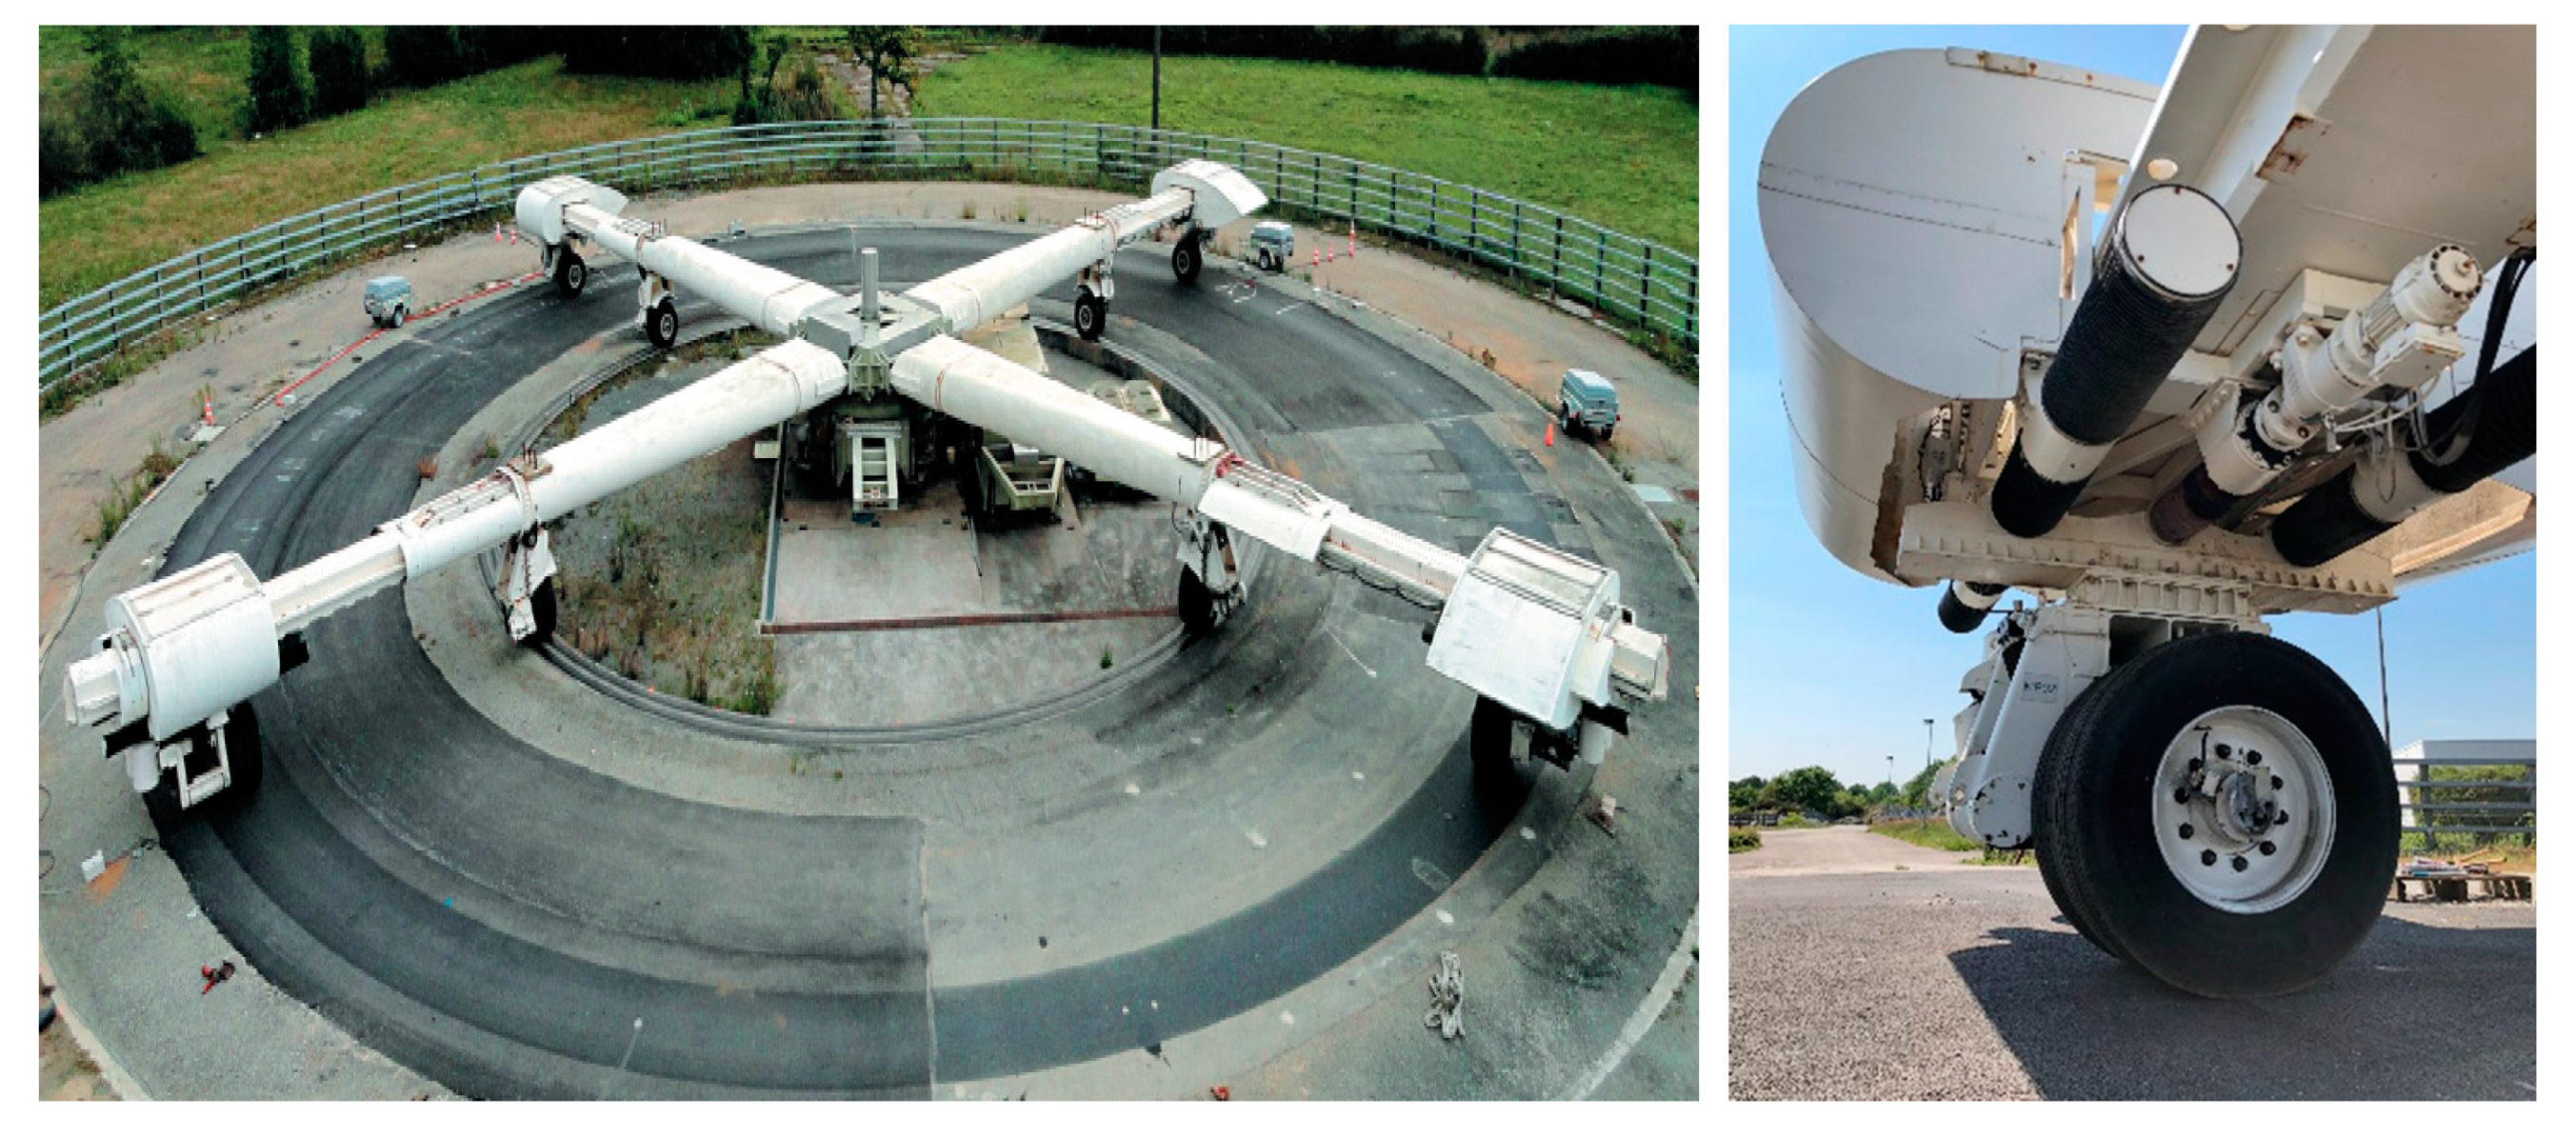
3. Accelerated Pavement Testing
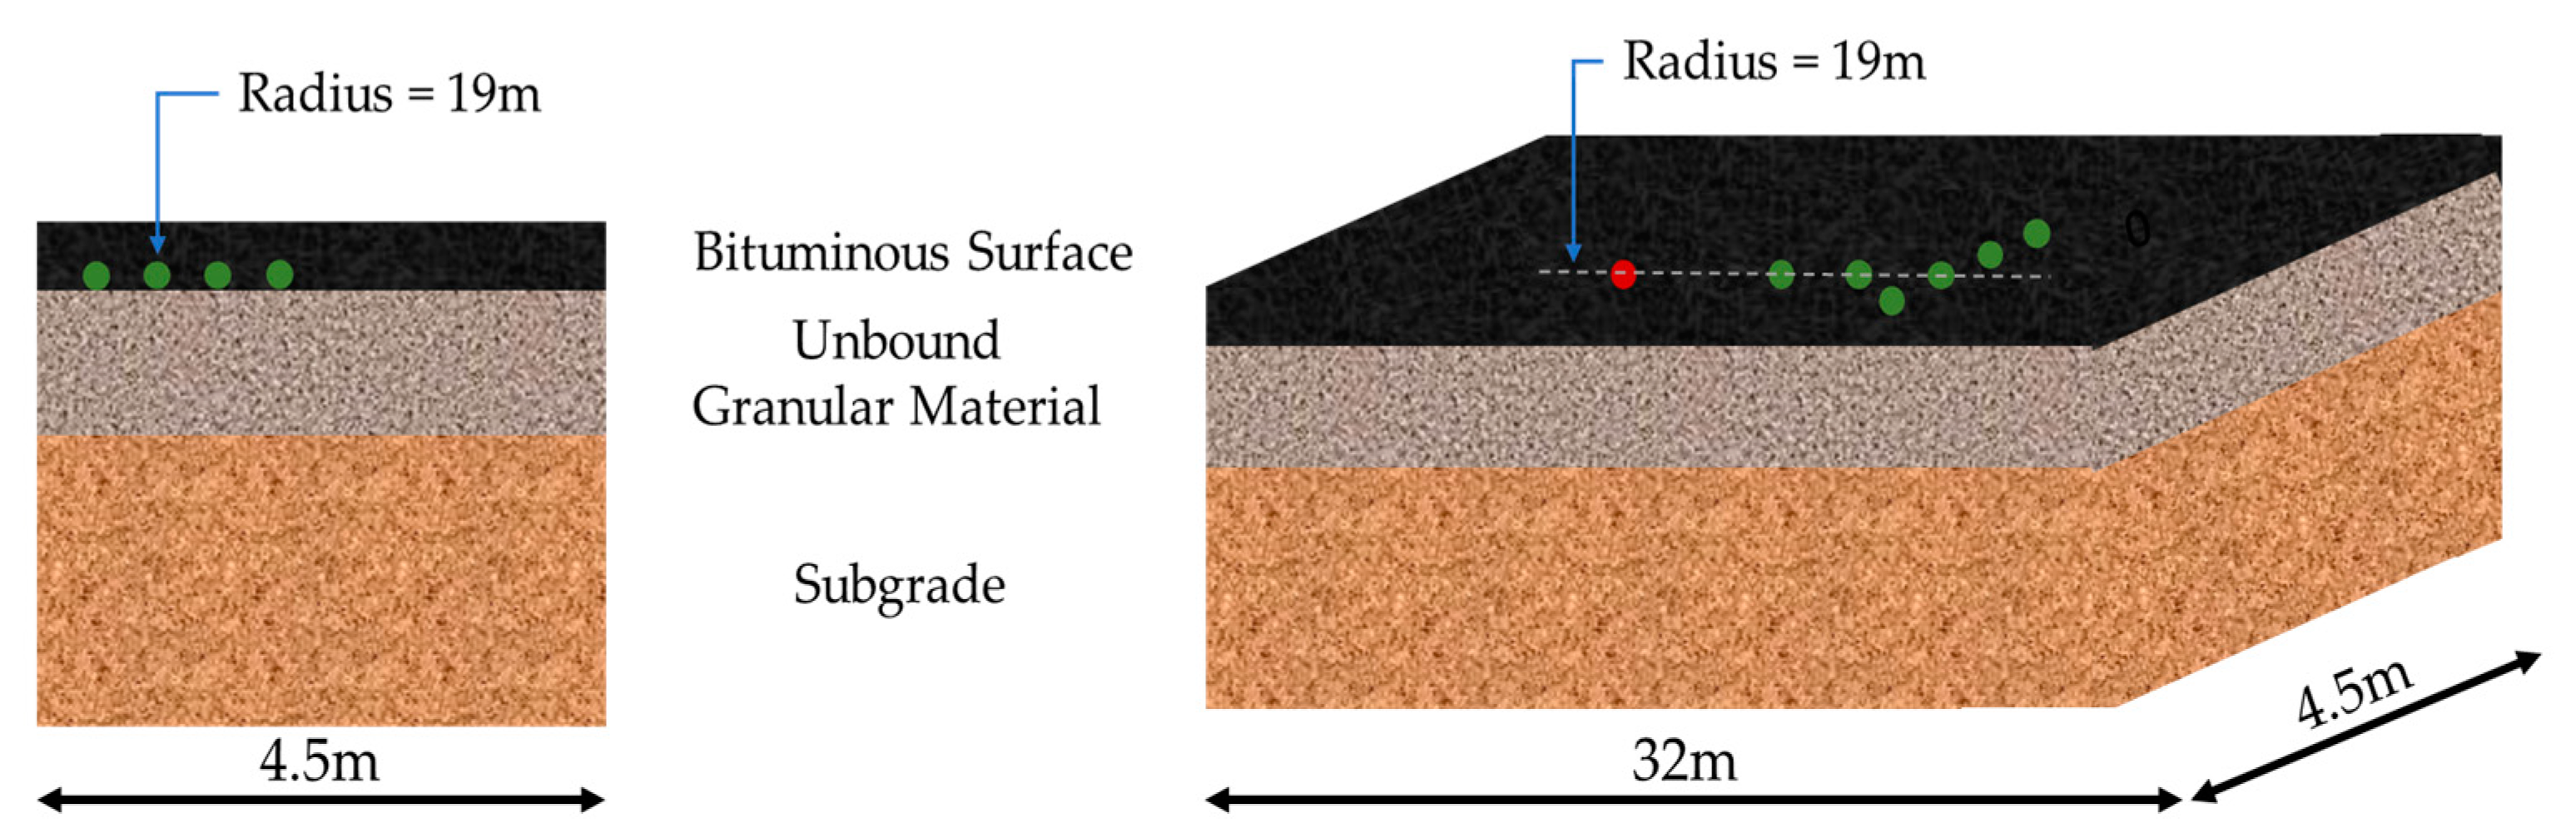
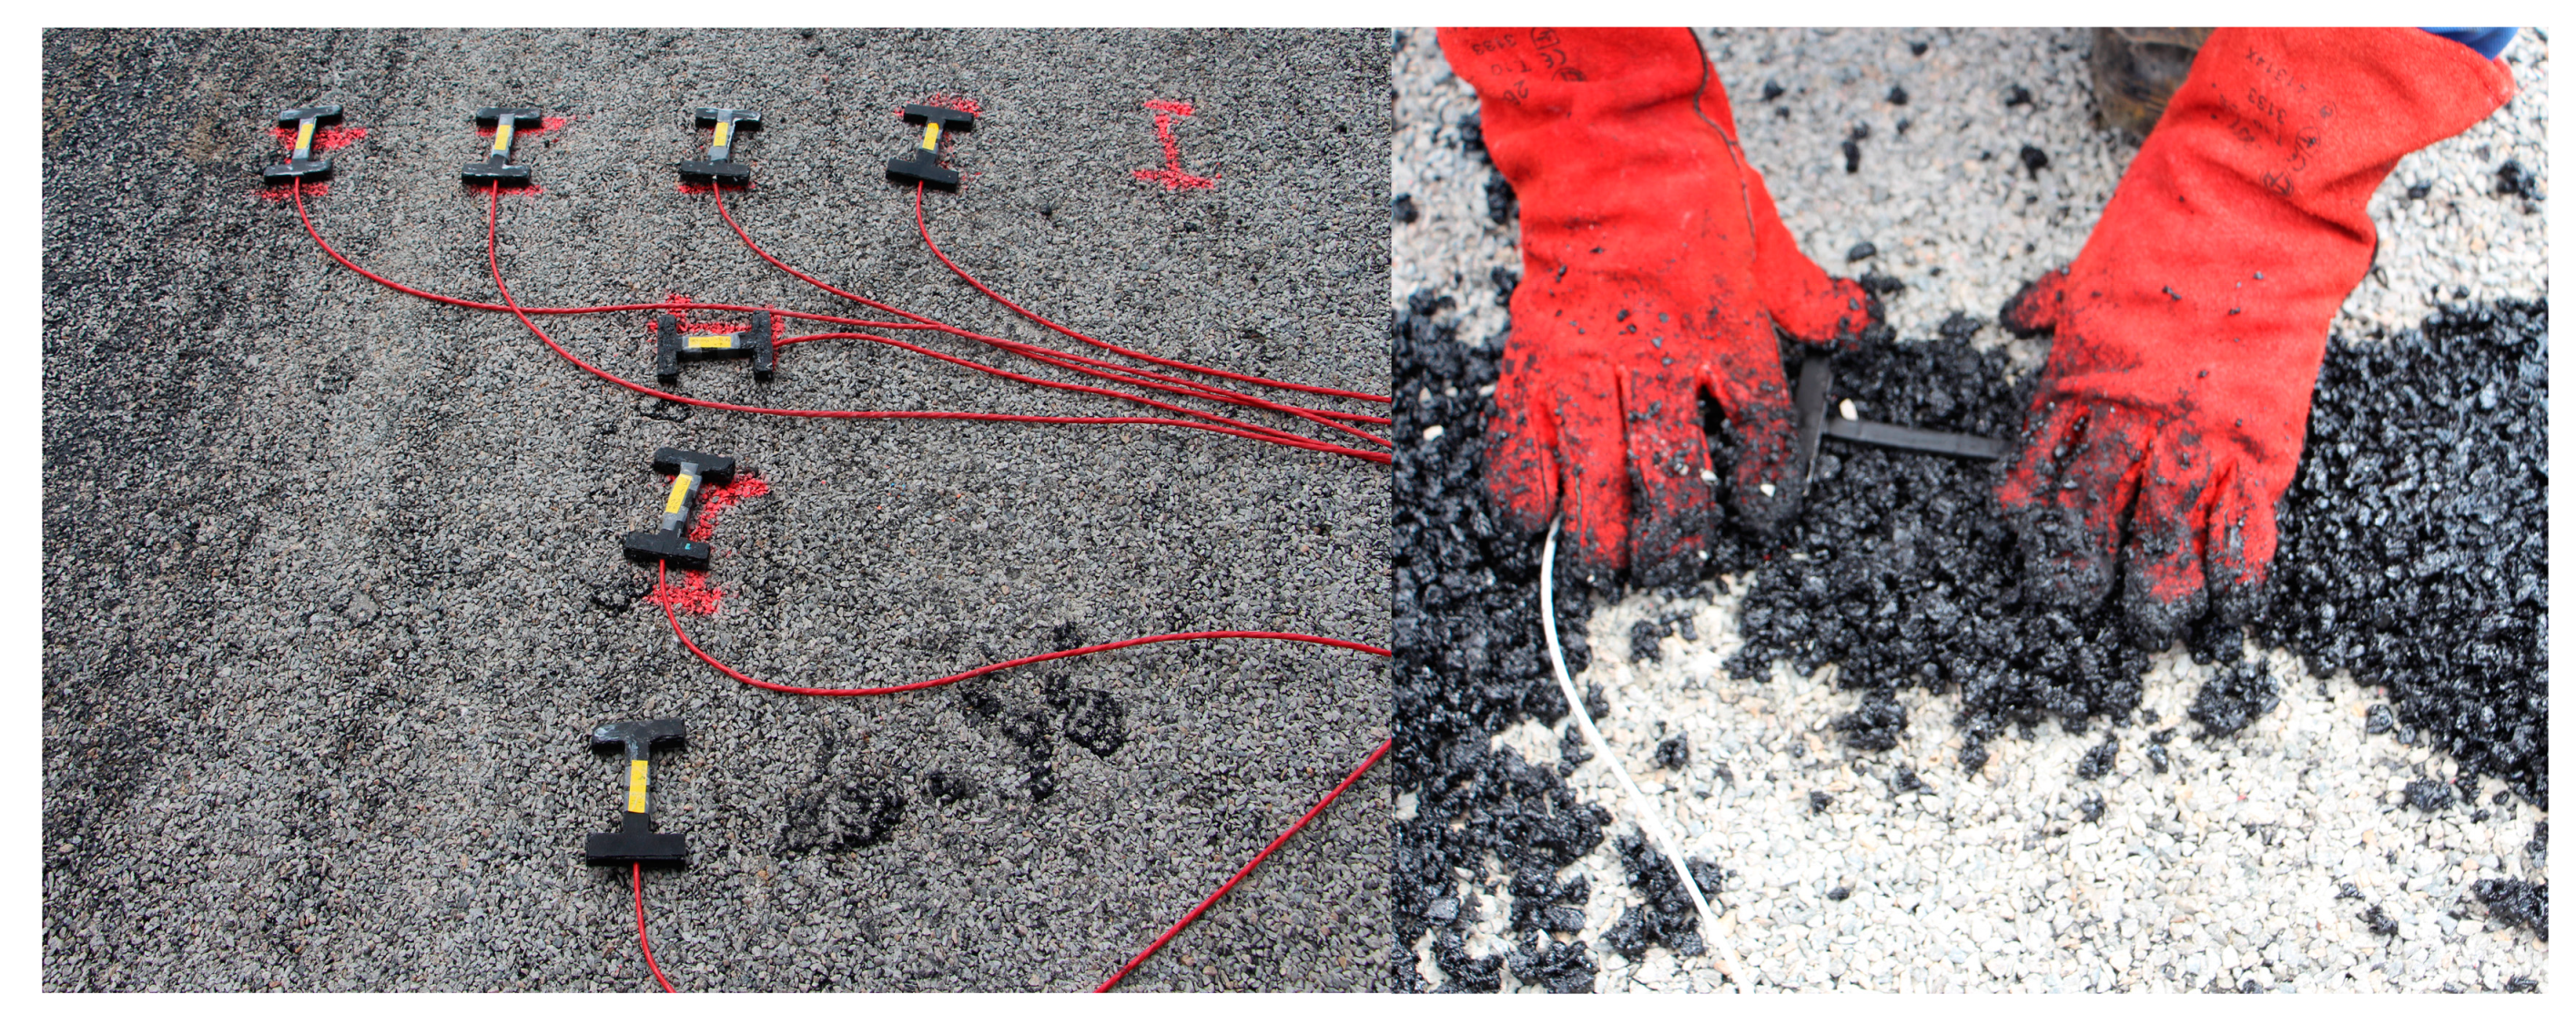
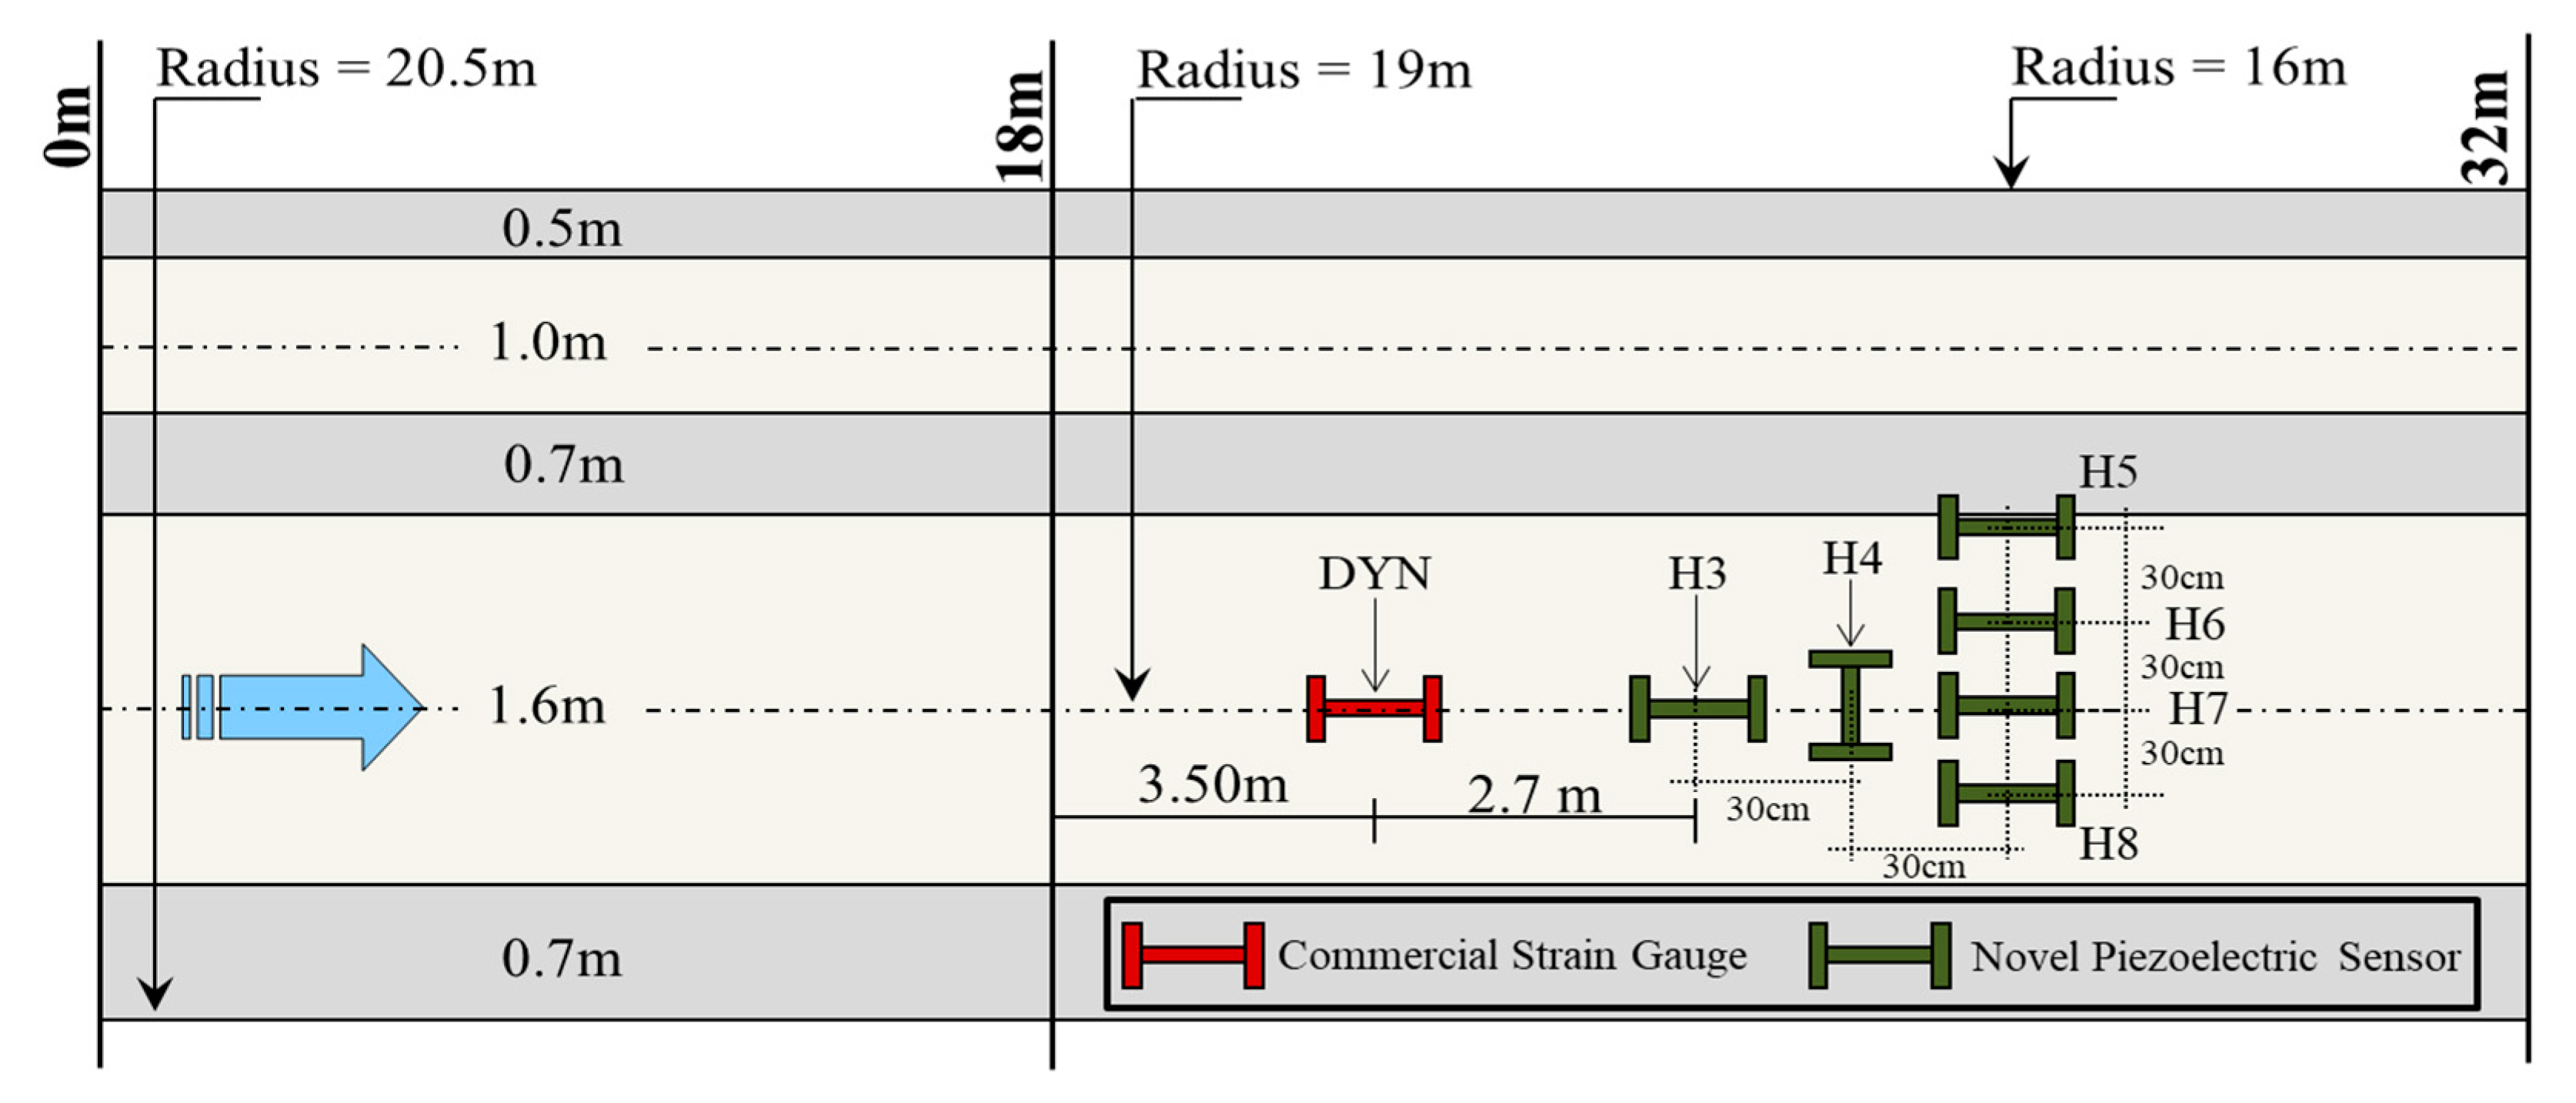
3.1. Pavement Structure and Sensor Ditribution
3.2. Data Collection Program
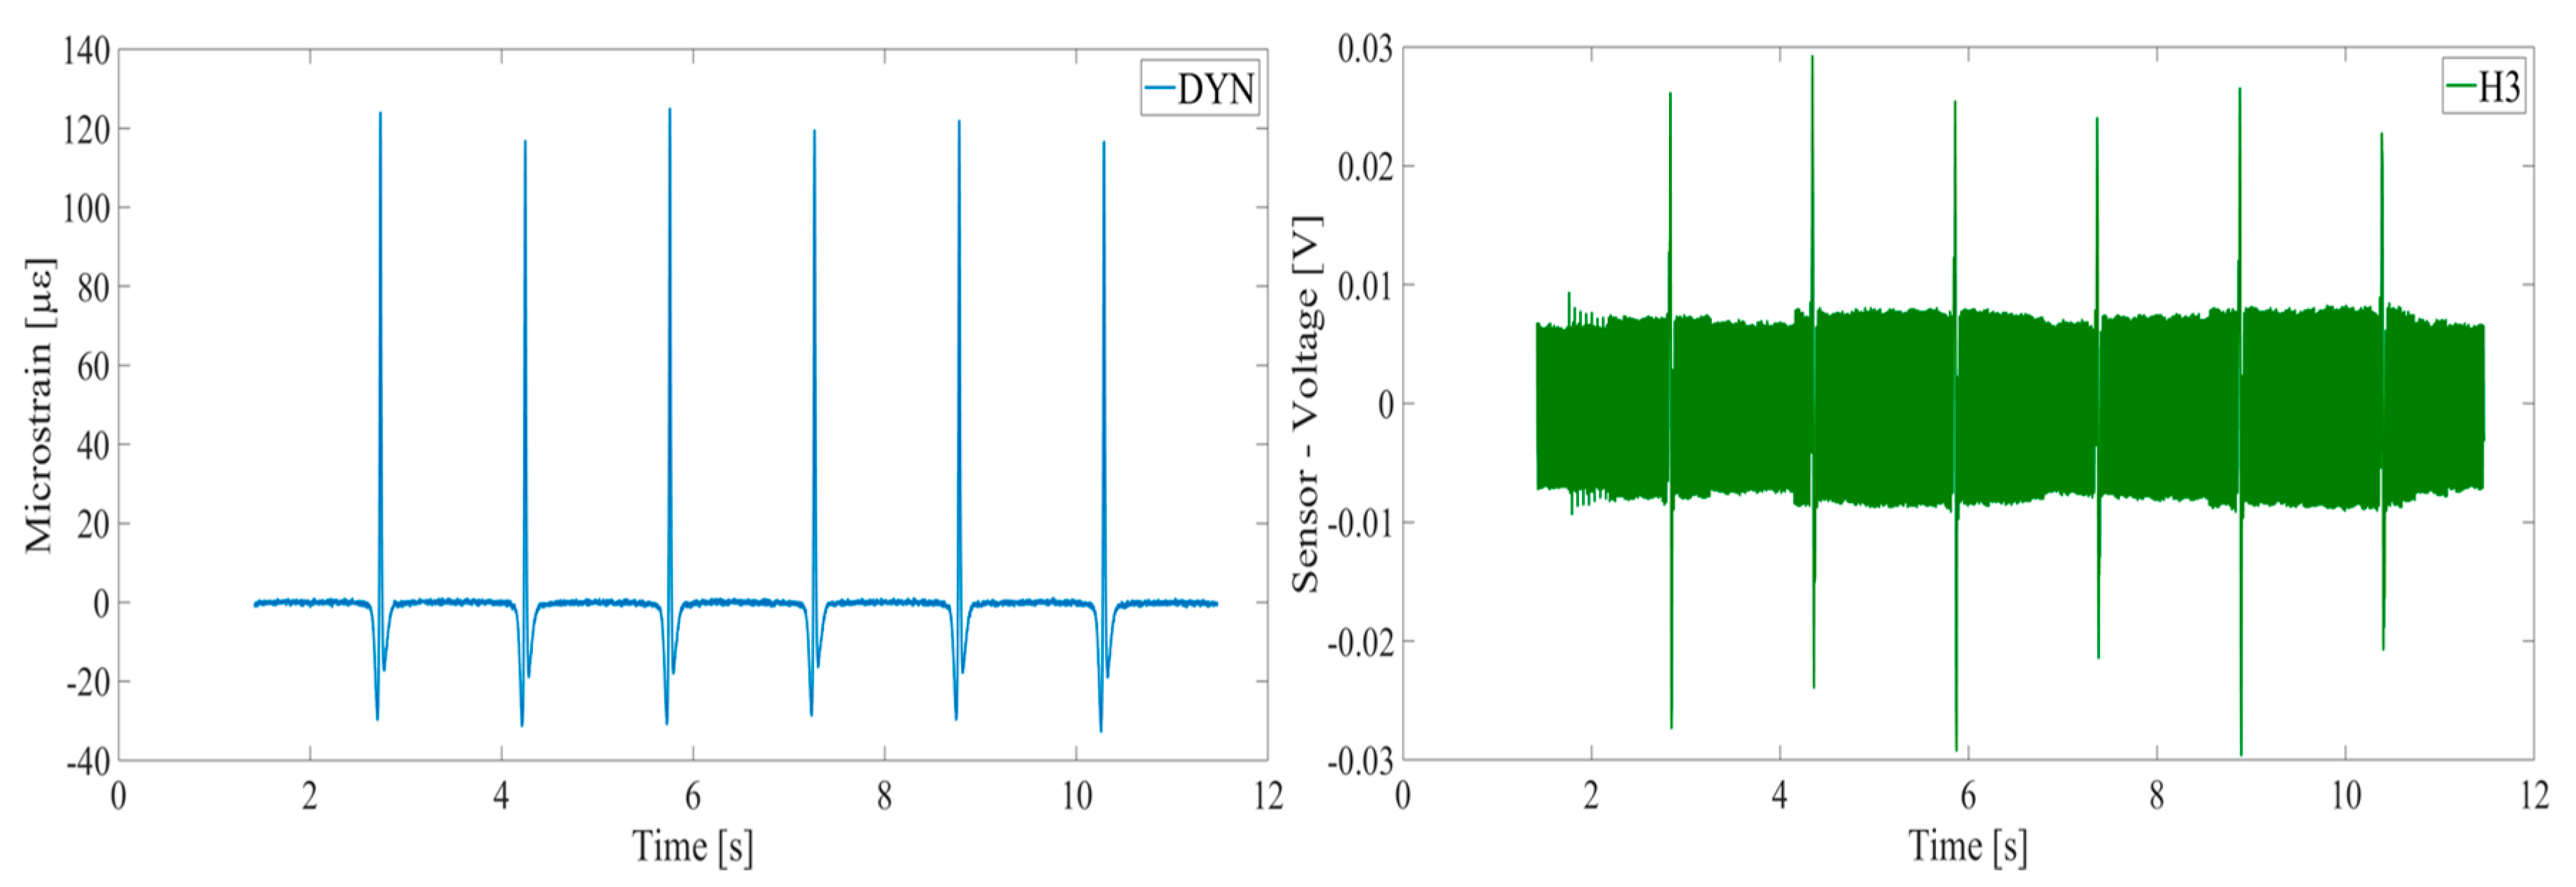
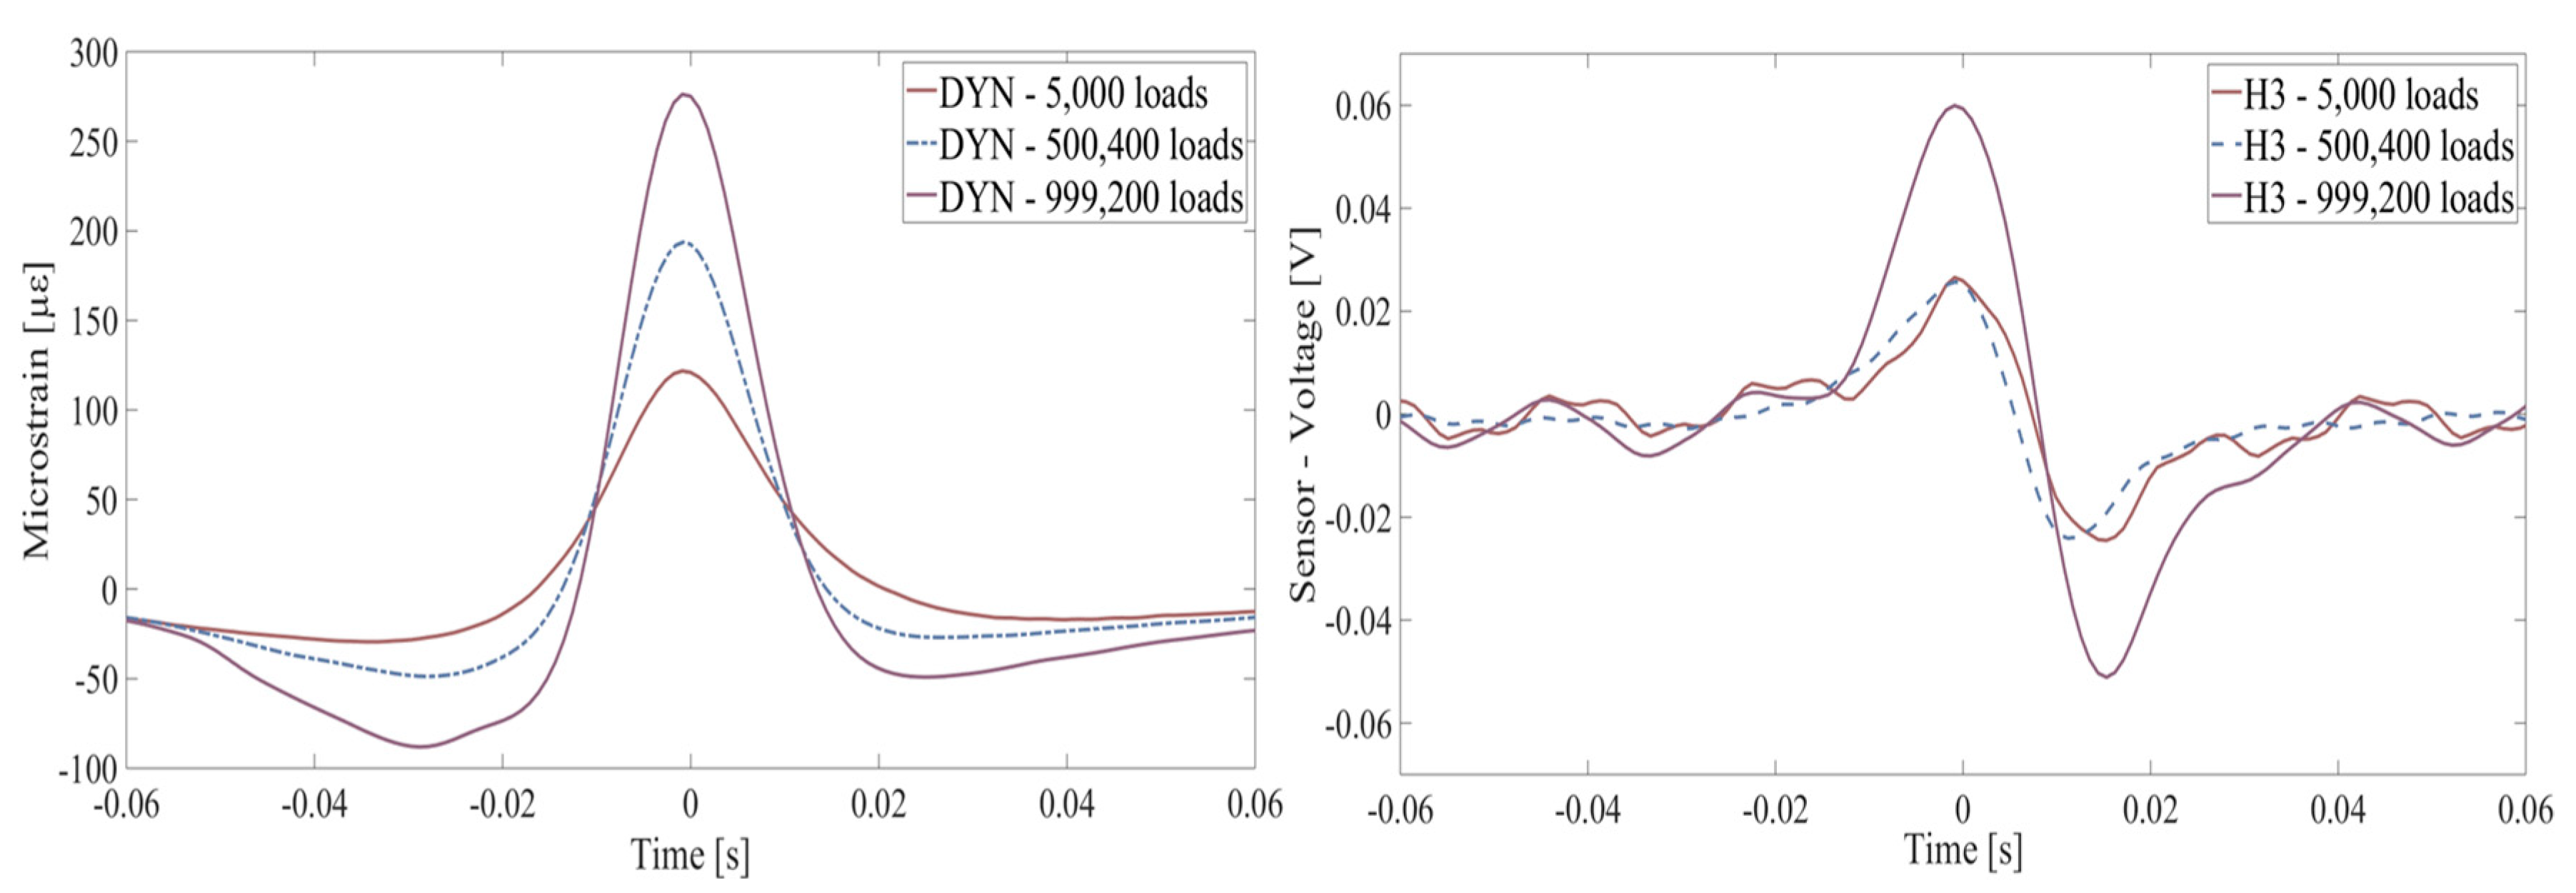
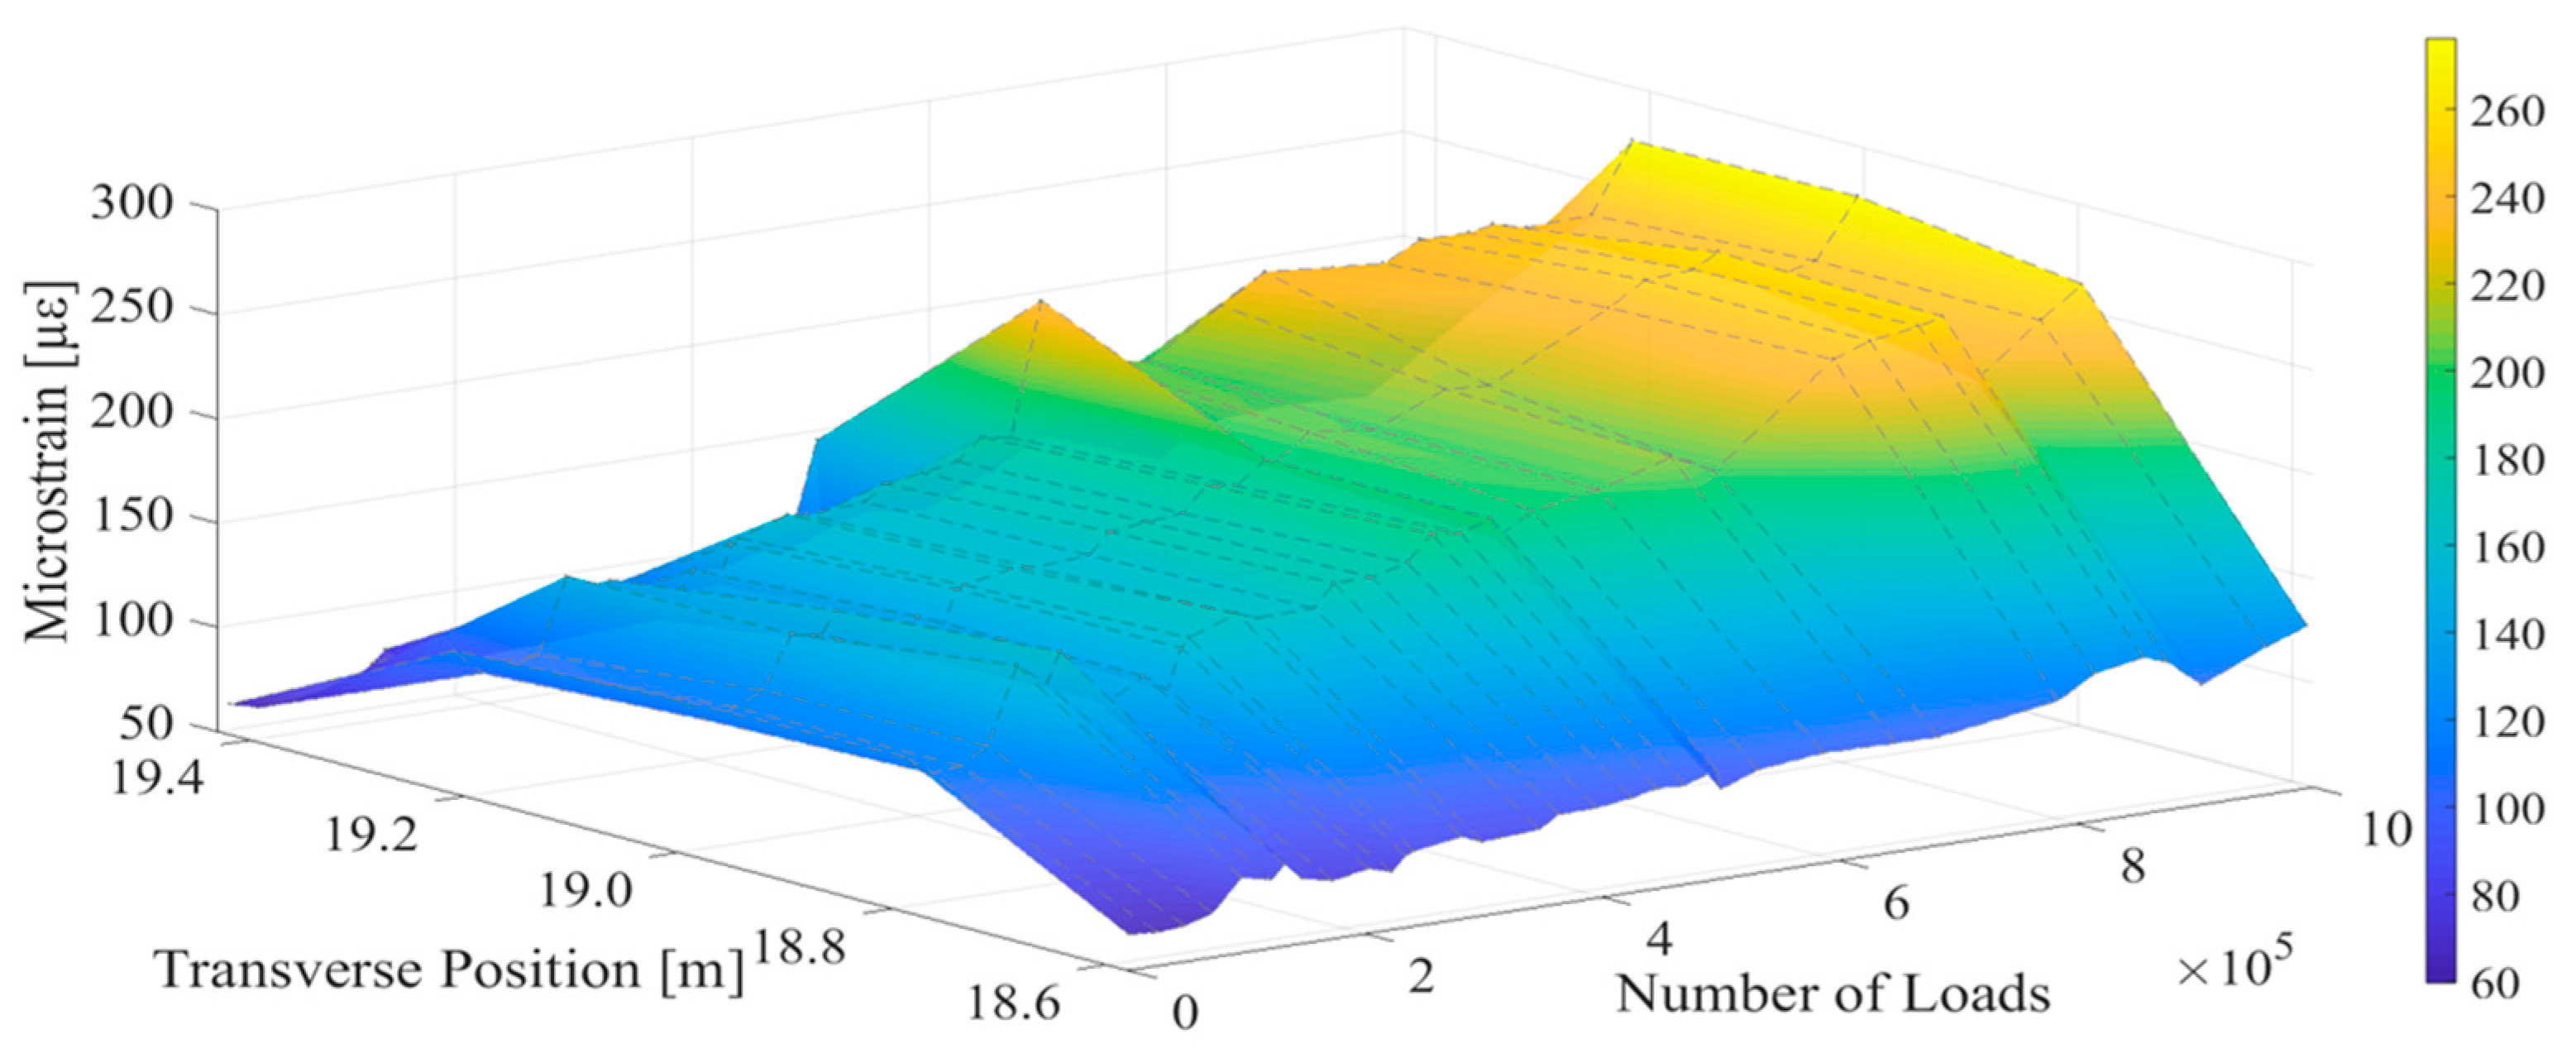
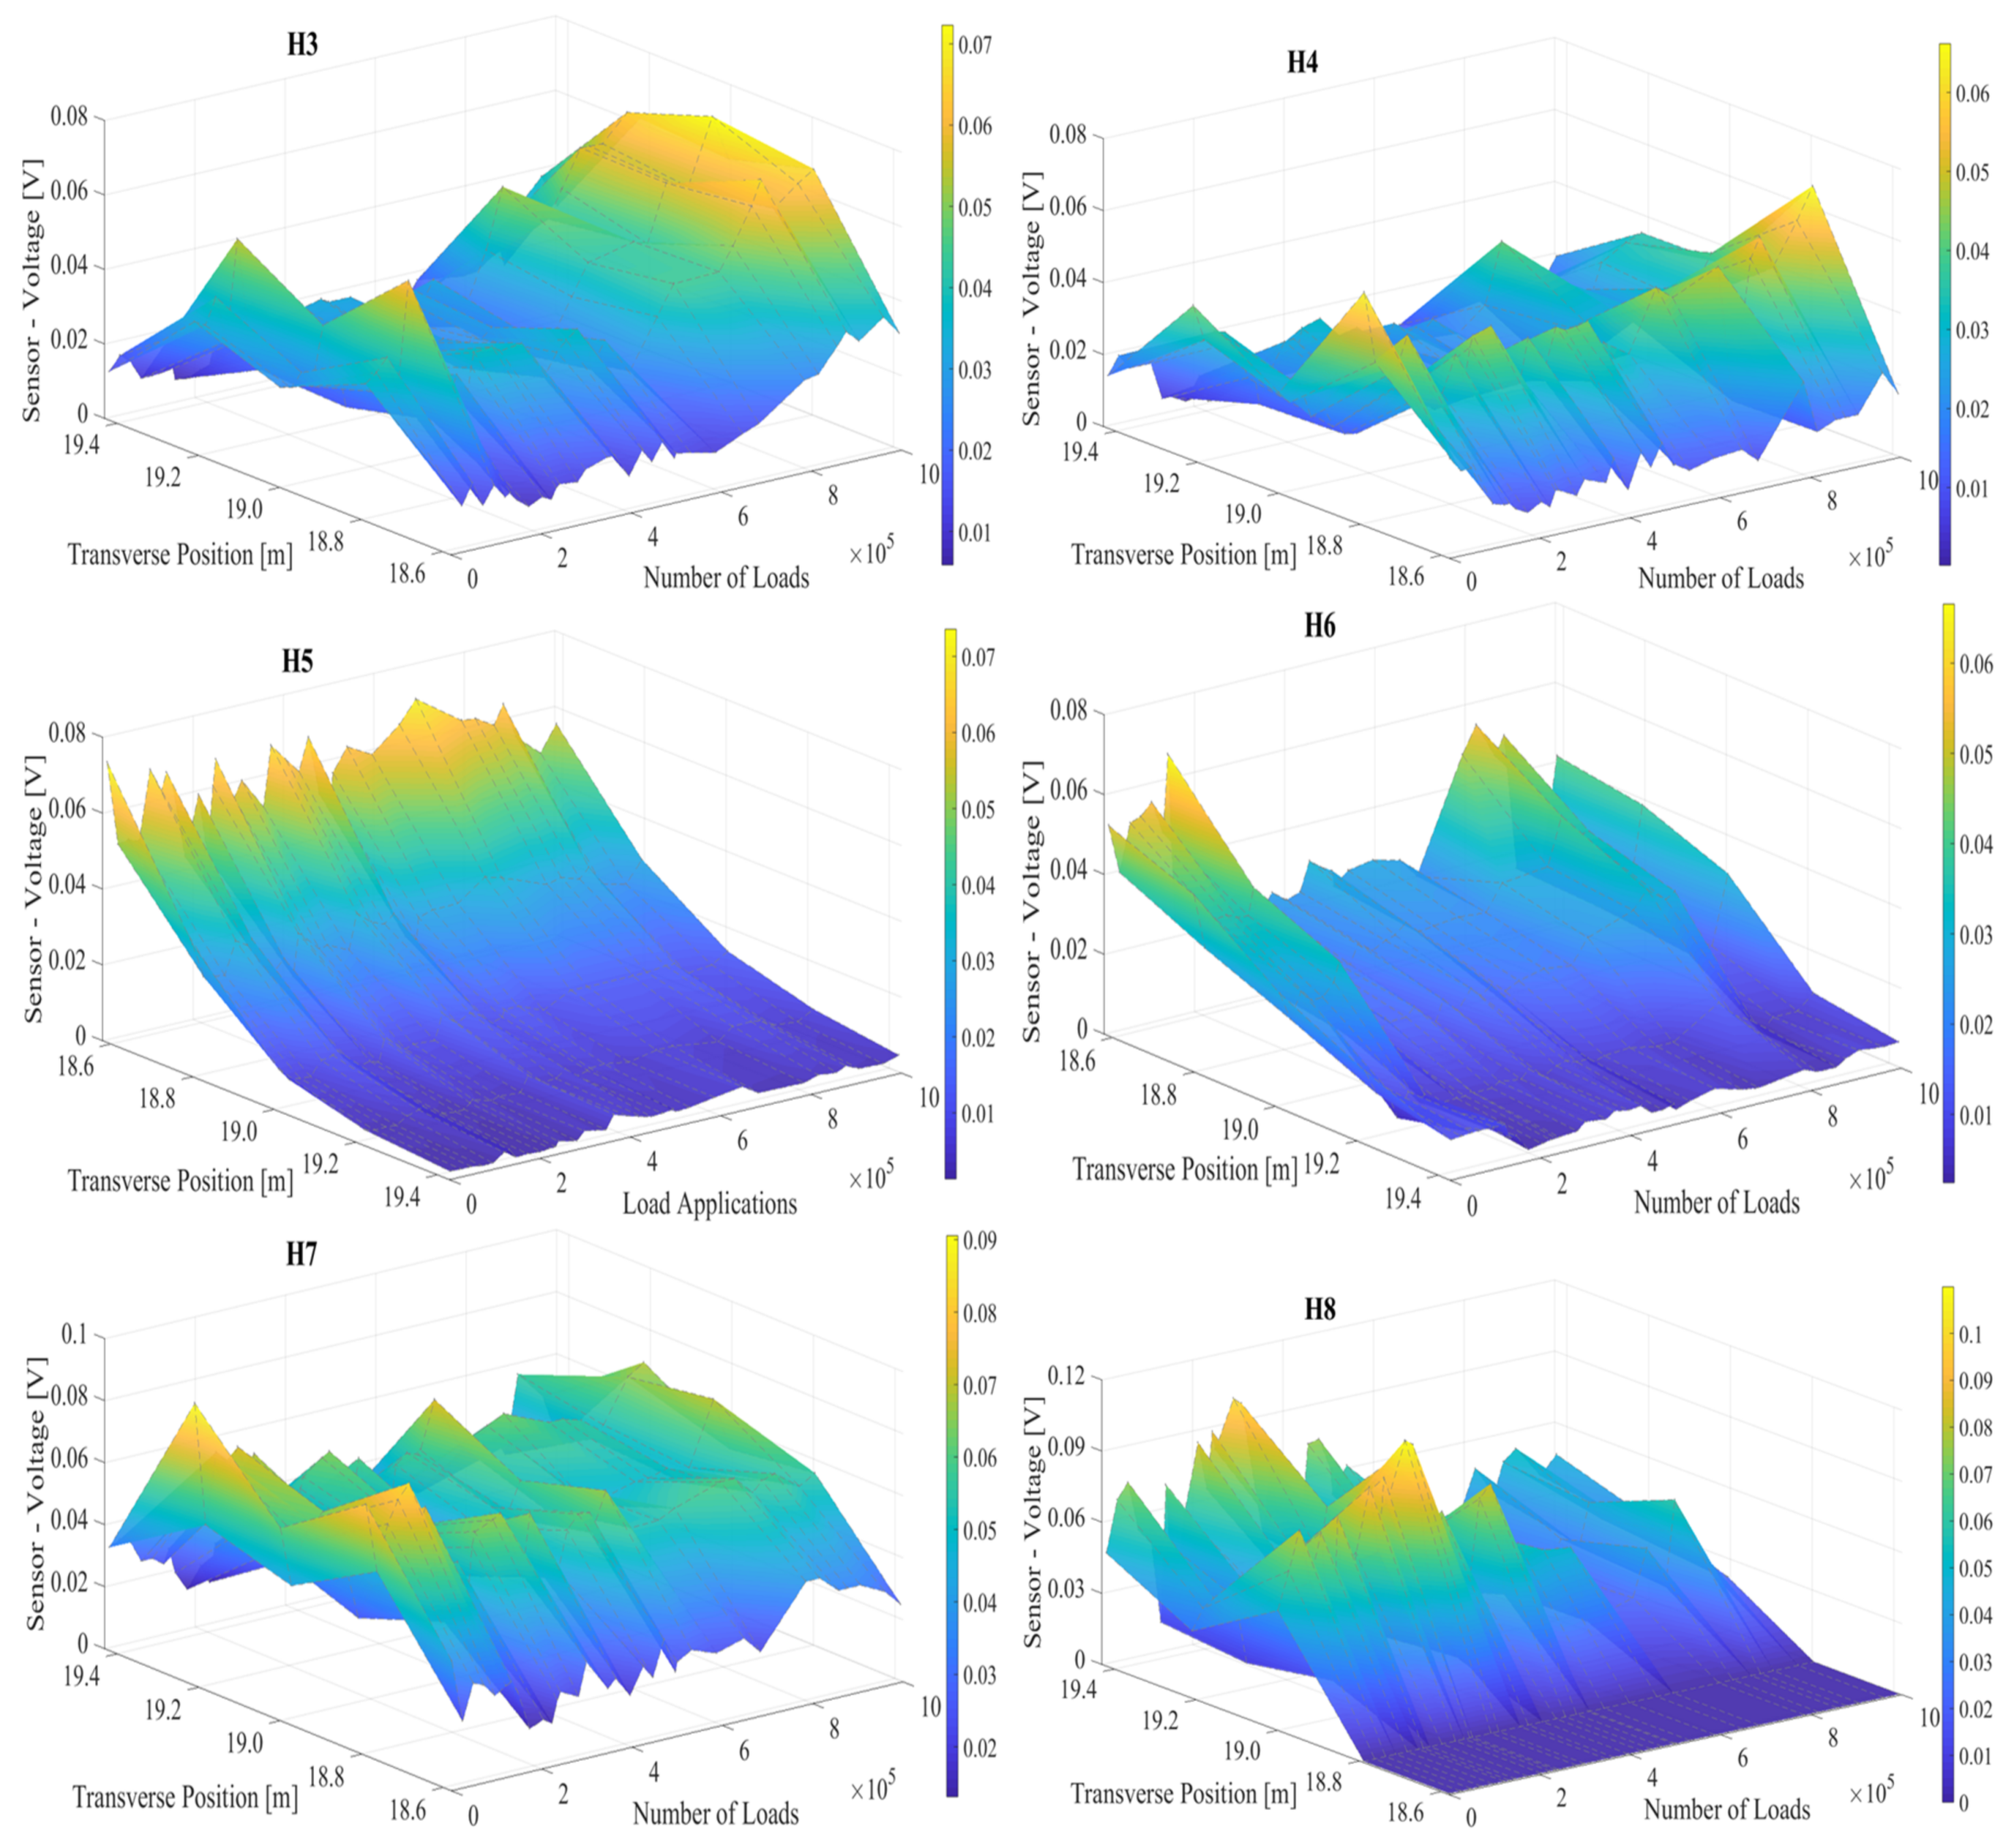
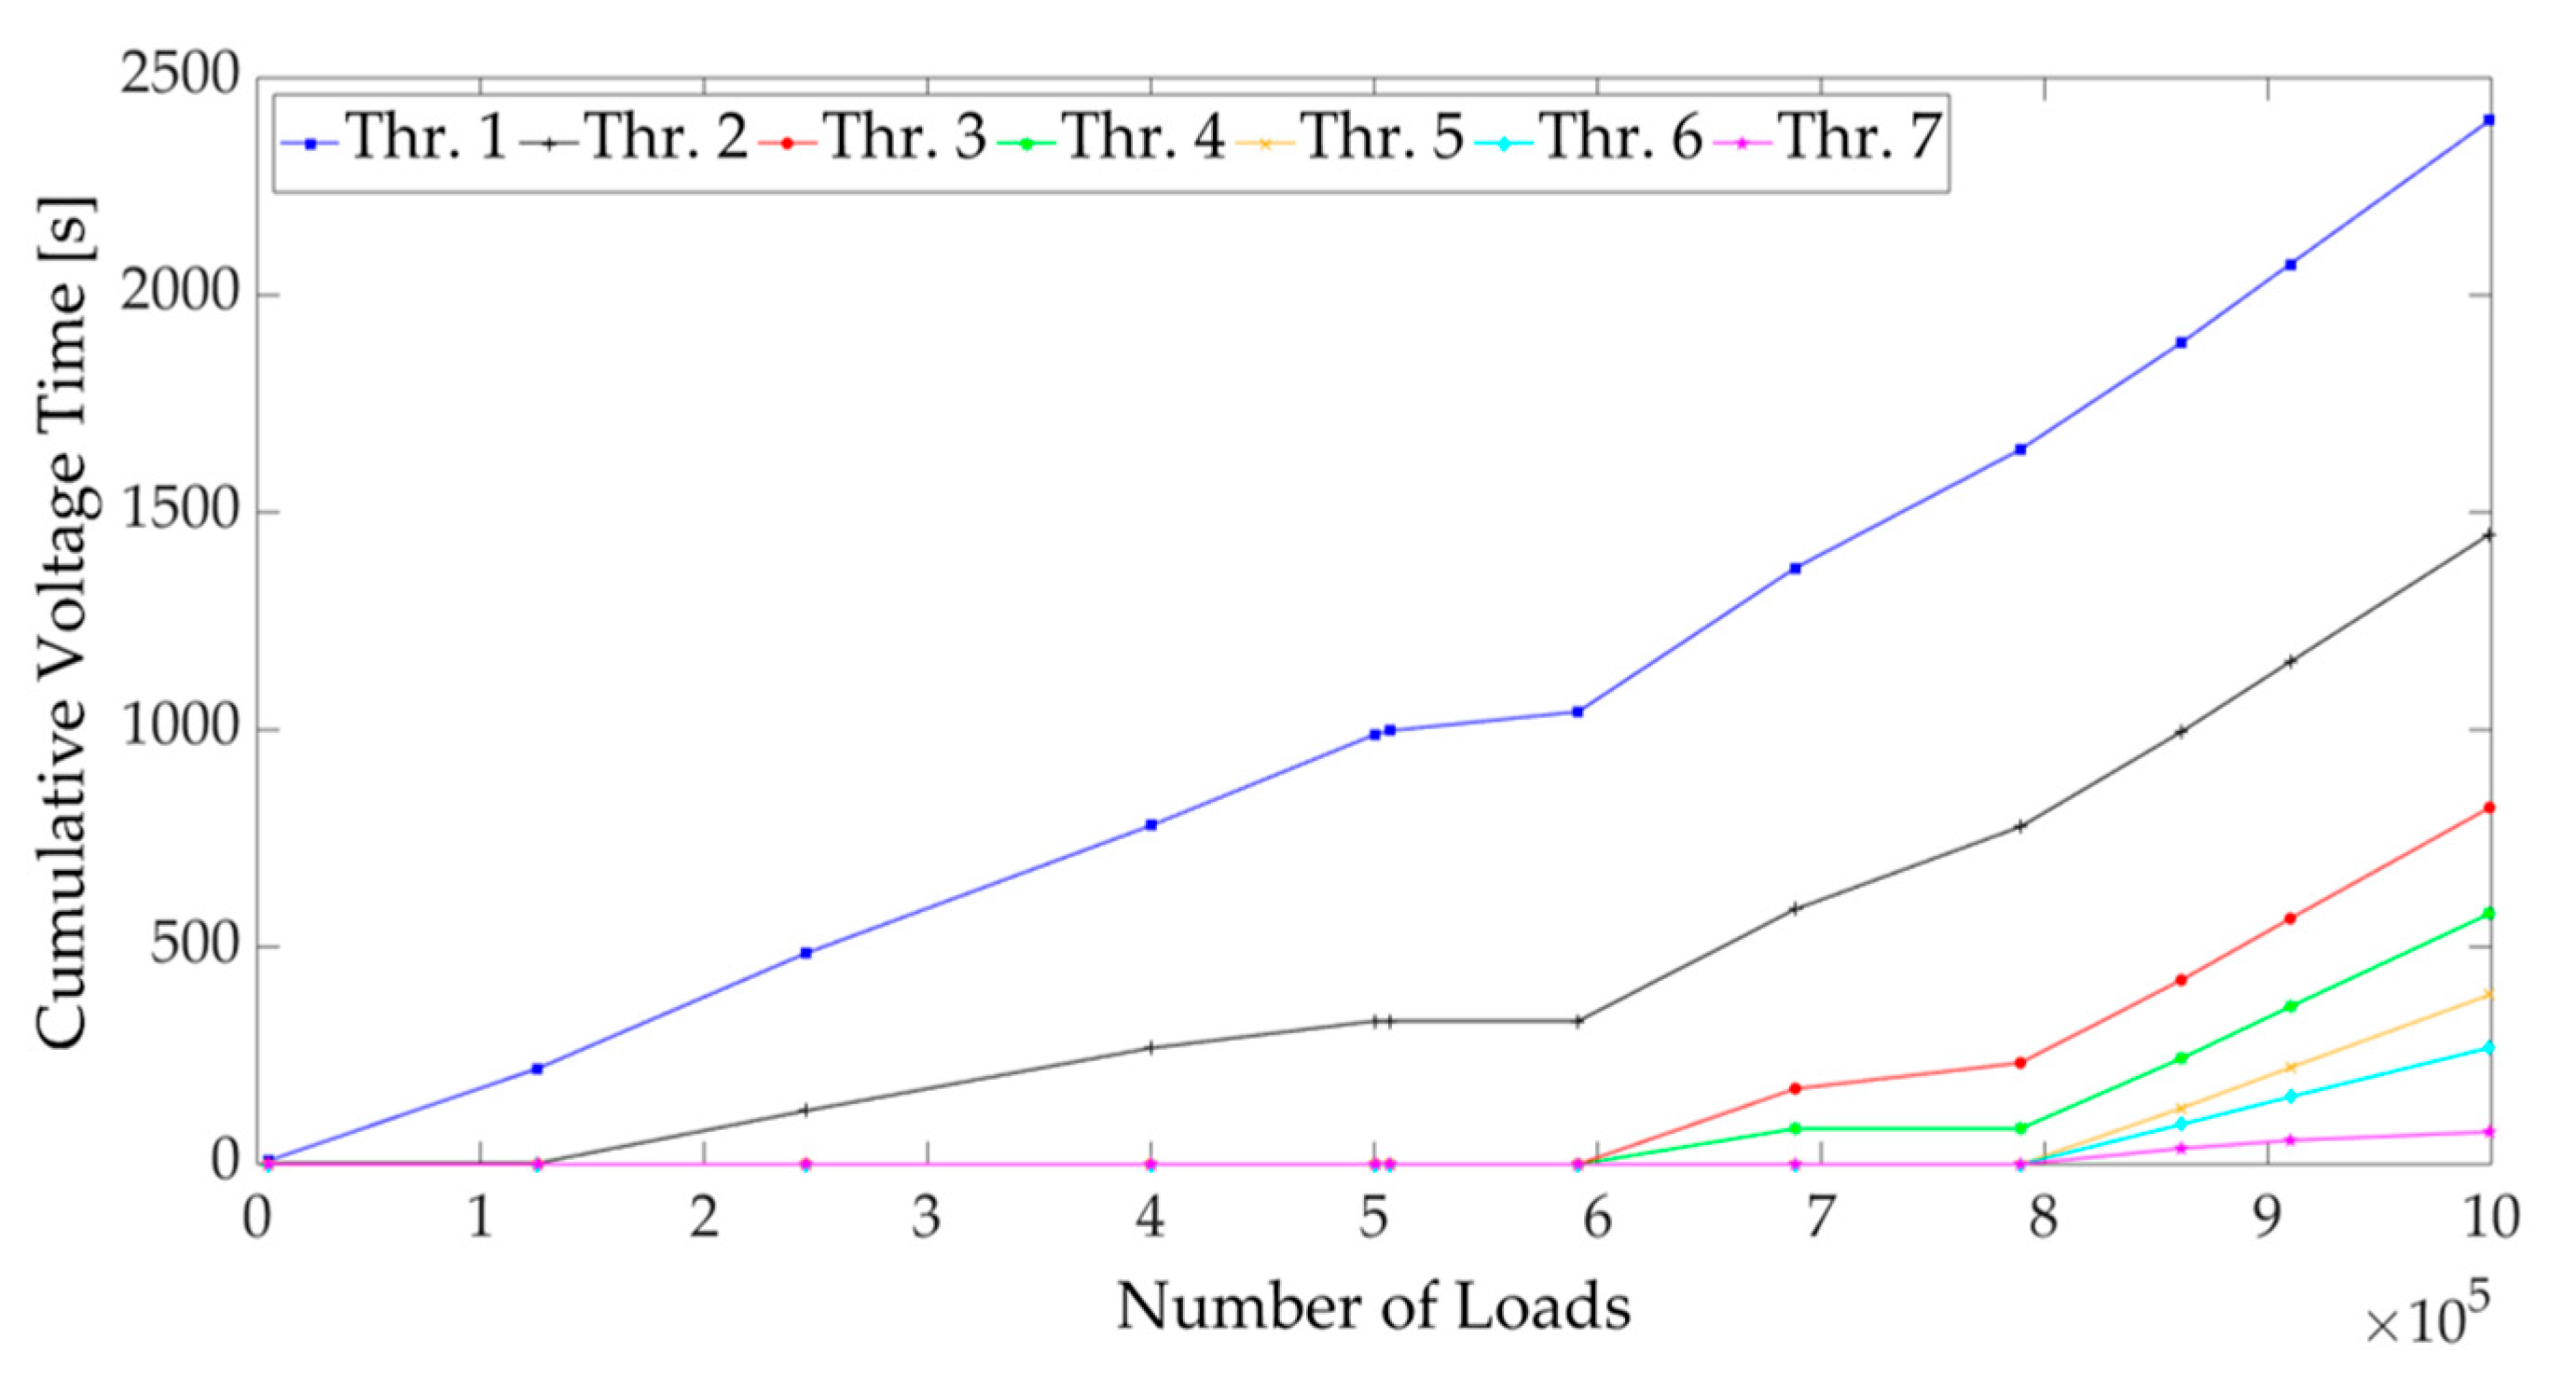
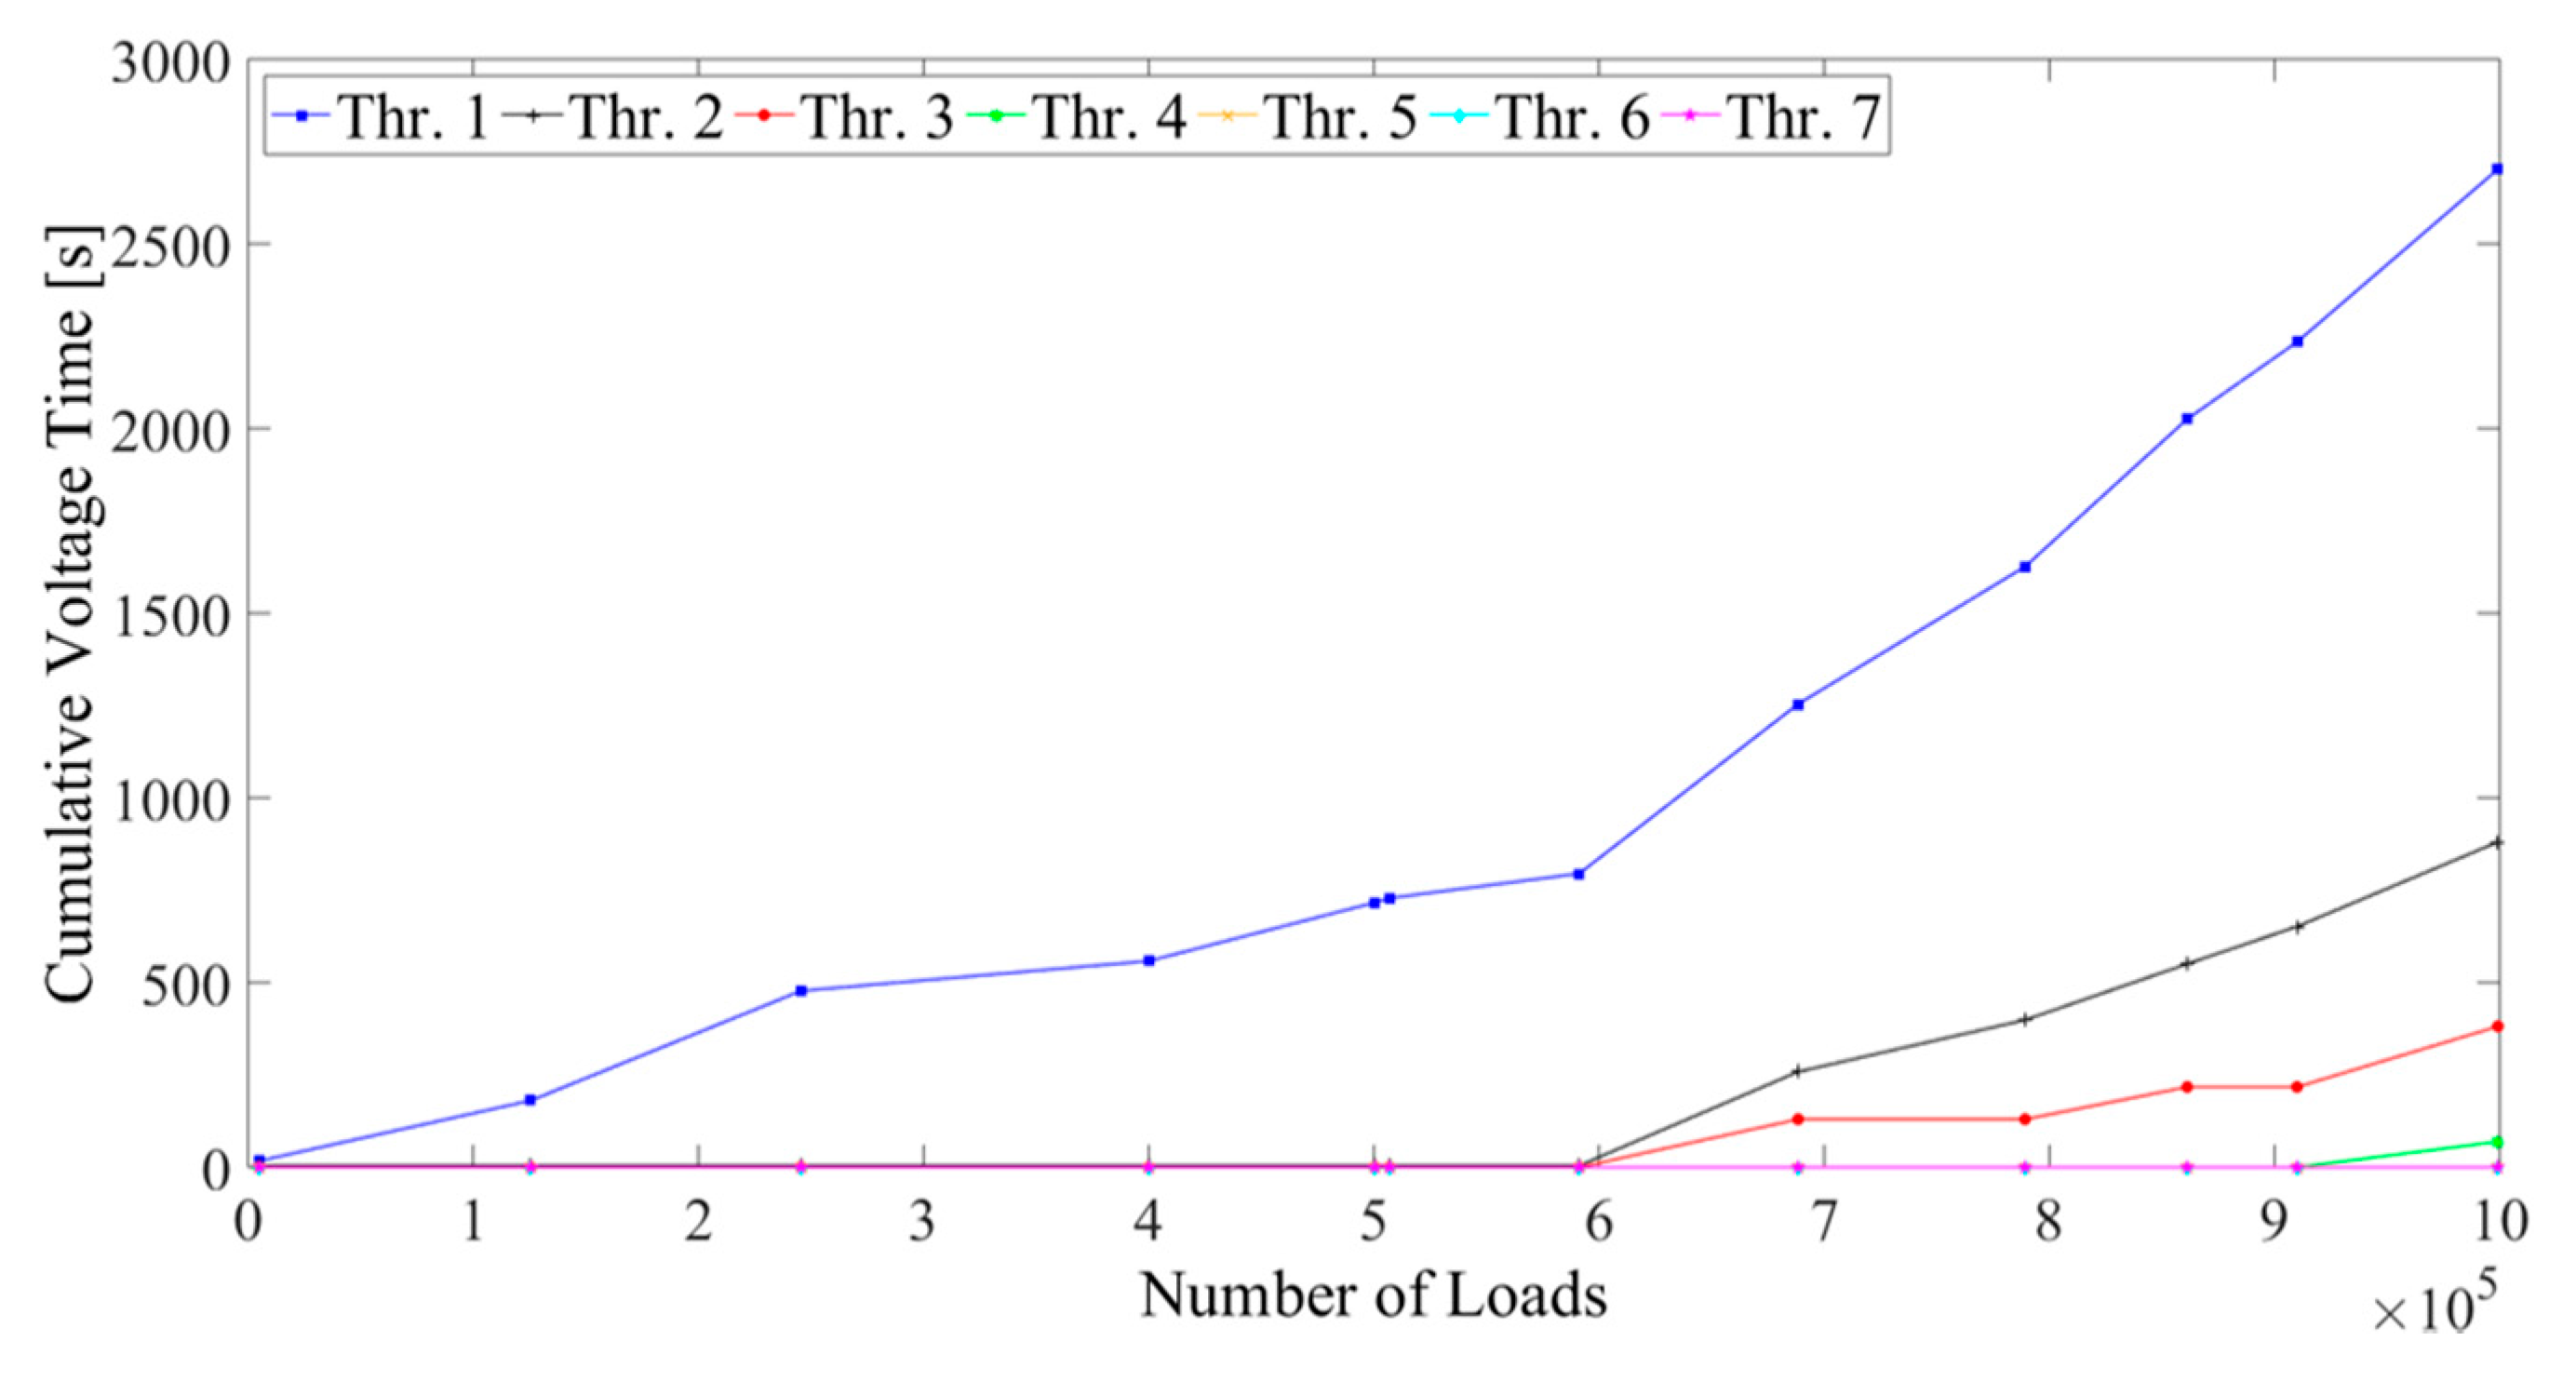
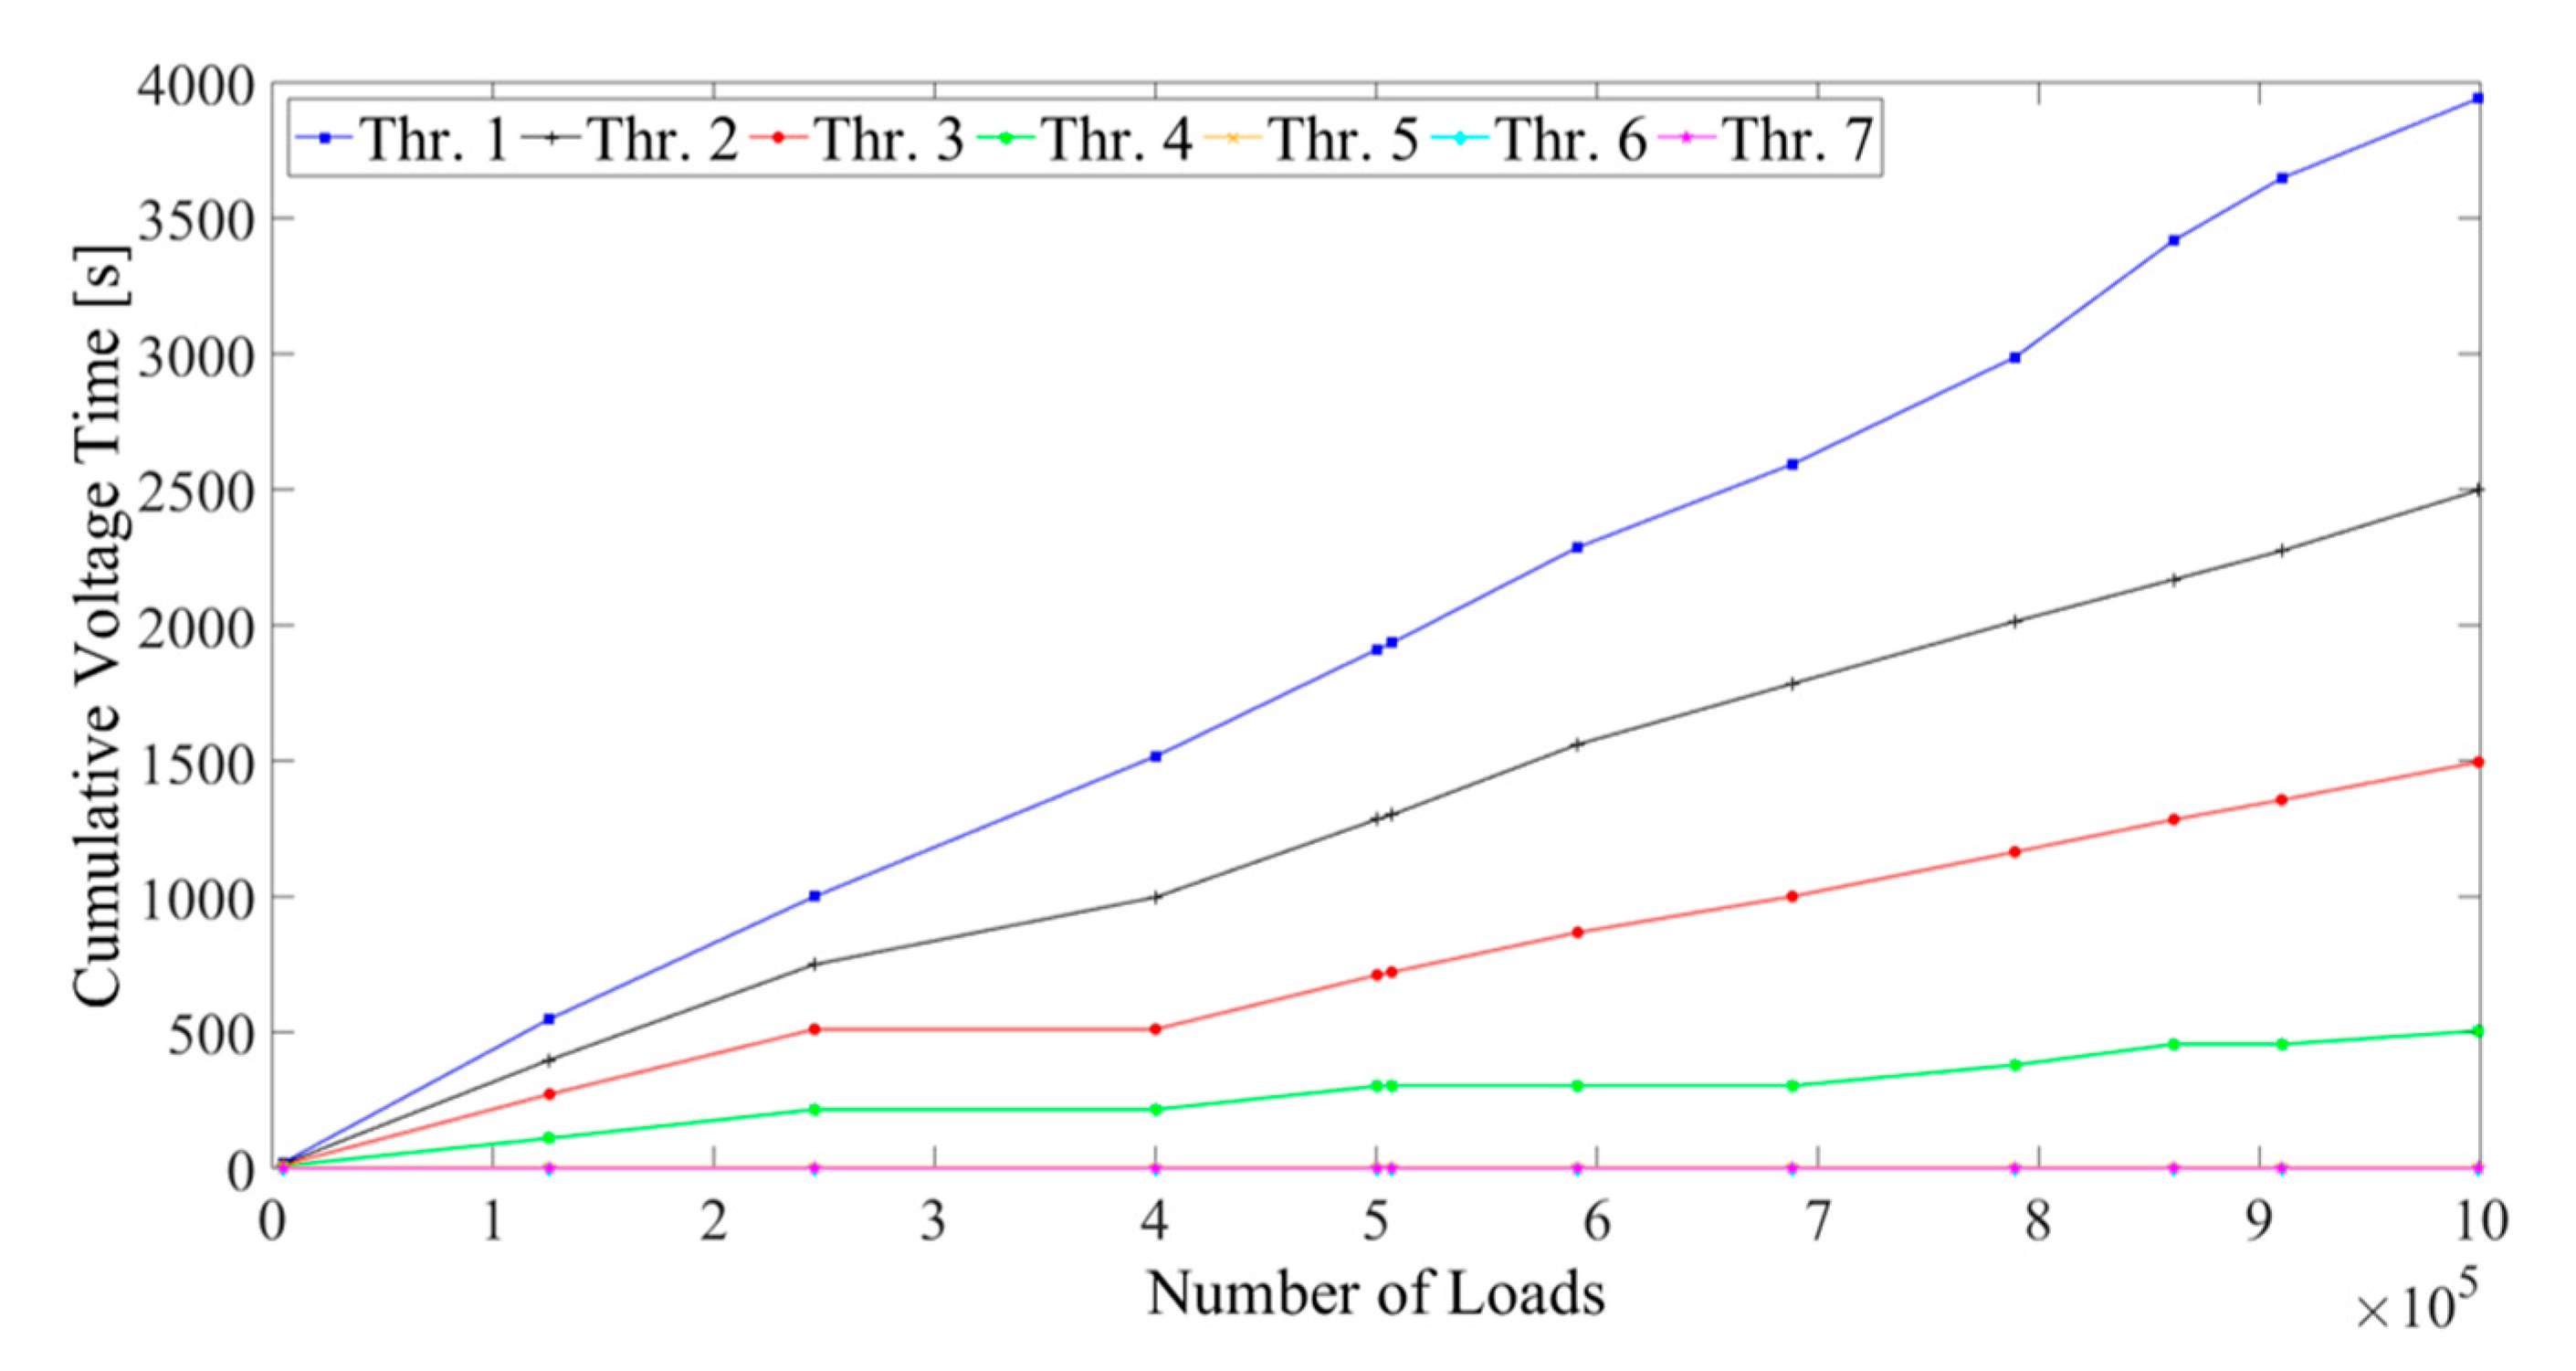
4. Results and Discussions
5. Conclusions
Author Contributions
Funding
Acknowledgments
Conflicts of Interest
References
- National Asphalt Pavement Association; European Asphalt Pavement Association. The Asphalt Paving Industry A Global Perspective, 3rd ed.; National Asphalt Pavement Association: Brussels, Belgium; European Asphalt Pavement Association: Brussels, Belgium, 2011; ISBN 0-914313-06-1. [Google Scholar]
- Xue, W.; Wang, D.; Wang, L. A review and perspective about pavement monitoring. Int. J. Pavement Res. Technol. 2012, 5, 295–302. [Google Scholar]
- Brown, S.F. Developments in pavement structural design and maintenance. Proc. Instn. Civ. Engrs. Transp. 1998, 129, 201–206. [Google Scholar]
- Robbins, M.M.; Rodezno, C.; Tran, N.; Timm, D.H. Pavement ME Design—A Summary of Local Calibration Efforts for Flexible Pavements. NCAT Rep. 2017, 1–98. [Google Scholar]
- Ullidtz, P.; Ertman Larsen, H.J. State-of-the-Art Stress, Strain and Deflection Measurements. In Symposium on the State-of-the-Art of Pavement Response Monitoring Systems for Roads and Airfields; US Army Corps of Engineers: Washington, DC, USA, 1989; pp. 148–161. [Google Scholar]
- Dessouky, S.H.; Al-Qadi, I.L.; Yoo, P.J. Full-depth flexible pavement responses to different truck tyre geometry configurations. Int. J. Pavement Eng. 2014, 15, 512–520. [Google Scholar] [CrossRef]
- Brown, S.F.; Peattie, K.R. The structural design of bituminous pavements for heavy traffic. Third Int. Conf. Struct. Des. Asph. Pavements 1974, 57, 83–97. [Google Scholar]
- Leiva-Villacorta, F.; Vargas-Nordcbeck, A.; Aguiar-Moya, J.P.; Loría-Salazar, L. Development and calibration of permanent deformation models. In Roles of Accelerated Pavement Testing in Pavement Sustainability; Springer International Publishing: Cham, Switzerland, 2016; pp. 573–587. [Google Scholar]
- Lajnef, N.; Chatti, K.; Chakrabartty, S.; Rhimi, M.; Sarkar, P. Smart Pavement Monitoring System; Federal Highway Administration: Washington, DC, USA, 2013.
- Verma, S.K.; Bhadauria, S.S.; Akhtar, S.; Verma, S.K.; Bhadauria, S.S.; Akhtar, S. Review of Nondestructive Testing Methods for Co ndition Monitoring of Concrete Structures. J. Constr. Eng. 2013, 2013, 1–11. [Google Scholar] [CrossRef] [Green Version]
- Marecos, V.; Fontul, S.; de Lurdes Antunes, M.; Solla, M. Evaluation of a highway pavement using Non-Destructive Tests: Falling Weight Deflectometer and Ground Penetrating Radar. Constr. Build. Mater. 2017, 154, 1164–1172. [Google Scholar] [CrossRef]
- Xue, W.; Wang, L.; Wang, D.; Druta, C. Pavement Health Monitoring System Based on an Embedded Sensing Network. J. Mater. Civ. Eng. 2014, 26, 04014072. [Google Scholar] [CrossRef]
- Lajnef, N.; Rhimi, M.; Chatti, K.; Mhamdi, L.; Faridazar, F. Toward an Integrated Smart Sensing System and Data Interpretation Techniques for Pavement Fatigue Monitoring. Comput. Civ. Infrastruct. Eng. 2011, 26, 513–523. [Google Scholar] [CrossRef]
- Sohn, H.; Ferrar, C.; Hemez, F.M.; Czarnecki, J. A Review of Structural Health Monitoring Literature: 1996–2001; Los Alamos National Laboratory: Los Alamos, NM, USA, 2003.
- Duong, N.S.; Blanc, J.; Hornych, P.; Bouveret, B.; Carroget, J.; Le feuvre, Y. Continuous strain monitoring of an instrumented pavement section. Int. J. Pavement Eng. 2018, 8436, 1–16. [Google Scholar] [CrossRef]
- Duong, N.S.; Blanc, J.; Hornych, P.; Menant, F.; Lefeuvre, Y.; Bouveret, B. Monitoring of pavement deflections using geophones. Int. J. Pavement Eng. 2018. [Google Scholar] [CrossRef]
- Farrar, C.R.; Worden, K. An introduction to structural health monitoring. Philos. Trans. R. Soc. A Math. Phys. Eng. Sci. 2007, 365, 303–315. [Google Scholar] [CrossRef] [PubMed]
- Lynch, J.; Loh, K. A Summary Review of Wireless Sensors and Sensor Networks for Structural Health Monitoring. Shock Vib. Dig. 2006, 38, 91–128. [Google Scholar] [CrossRef] [Green Version]
- Huang, C.; Lajnef, N.; Chakrabartty, S. Calibration and characterization of self-powered floating-gate usage monitor with single electron per second operational limit. IEEE Trans. Circuits Syst. I Regul. Pap. 2010, 57, 556–568. [Google Scholar] [CrossRef]
- Rhimi, M.; Lajnef, N.; Chatti, K.; Faridazar, F. A self-powered sensing system for continuous fatigue monitoring of in-service pavements. Int. J. Pavement Res. Technol. 2012, 5, 303–310. [Google Scholar]
- Chakrabartty, S.; Lajnef, N.; Elvin, N.; Gore, A. Self-Powered Sensor. U.S. Patent 8,056,420, 2008. [Google Scholar]
- Hasni, H.; Alavi, A.H.; Jiao, P.; Lajnef, N.; Chatti, K.; Aono, K. A new approach for damage detection in asphalt concrete pavements using battery-free wireless sensors with non-constant injection rates. Measurement 2017, 110, 217–229. [Google Scholar] [CrossRef]
- Hasni, H.; Alavi, A.H.; Chatti, K.; Lajnef, N. A self-powered surface sensing approach for detection of bottom-up cracking in asphalt concrete pavements: Theoretical/numerical modeling. Constr. Build. Mater. 2017, 144, 728–746. [Google Scholar] [CrossRef]
- Aono, K.; Hasni, H.; Pochettino, O.; Lajnef, N. Quasi-Self-Powered Piezo-Floating-Gate Sensing Technology for Continuous Monitoring of Large-Scale Bridges. Frontiers Built Environ. 2019, 5, 29. [Google Scholar] [CrossRef]
- Aono, K. Self-powered Sensors to Facilitate Infrastructural Internet-of-Things for Smart Structures Self-powered Sensors to Facilitate Infrastructural Internet-of-Things for Smart Structures. In Proceedings of the 13th International Workshop on Advanced Smart Materials and Smart Structures Technology, Tokyo, Japan, 22–23 July 2017. [Google Scholar]
- Aono, K.; Covassin, T.; Chakrabartty, S. Monitoring of Repeated Head Impacts Using Time-Dilation Based Self-Powered Sensing; IEEE: Melbourne, Australia, 2014; pp. 1620–1623. [Google Scholar]
- Alavi, A.H.; Hasni, H.; Lajnef, N.; Chatti, K.; Faridazar, F. An intelligent structural damage detection approach based on self-powered wireless sensor data. Autom. Constr. 2016, 62, 24–44. [Google Scholar] [CrossRef]


| Layer | Thickness (mm) | Poisson’s Ratio | Elastic Moduli (MPa) |
|---|---|---|---|
| Bituminous Surface | 100 | 0.35 | 10,524 at 27.9 °C |
| Unbound Granular Base | 760 | 122 | |
| Subgrade | 1600 | 202 |
| Number of Loads | Reference Sensor [µε] | Sensor–Voltage [V] | |||||
|---|---|---|---|---|---|---|---|
| H3 | H4 | H5 | H6 | H7 | H8 | ||
| 5000 | 121 | 0.027 | 0.038 | 0.012 | 0.028 | 0.073 | 0.045 |
| 500,400 | 194 | 0.026 | 0.017 | 0.011 | 0.012 | 0.055 | 0.044 |
| 999,200 | 276 | 0.059 | 0.041 | 0.014 | 0.027 | 0.067 | 0.010 |
| Level Number | H3 | H4 | H7 |
|---|---|---|---|
| D1 | 0.018 | 0.028 | 0.041 |
| D2 | 0.025 | 0.033 | 0.048 |
| D3 | 0.031 | 0.039 | 0.054 |
| D4 | 0.038 | 0.044 | 0.061 |
| D5 | 0.045 | 0.049 | 0.067 |
| D6 | 0.051 | 0.055 | 0.074 |
| D7 | 0.058 | 0.060 | 0.080 |
| Level Number | H3 | H4 | H7 |
|---|---|---|---|
| D3 | 591,200 | 591,200 | 125,600 |
| D4 | 591,200 | 910,000 | 125,600 |
| D5 | 789,200 | N/A | N/A |
| D6 | 789,200 | N/A | N/A |
| D7 | 789,200 | N/A | N/A |
© 2019 by the authors. Licensee MDPI, Basel, Switzerland. This article is an open access article distributed under the terms and conditions of the Creative Commons Attribution (CC BY) license (http://creativecommons.org/licenses/by/4.0/).
Share and Cite
Manosalvas-Paredes, M.; Lajnef, N.; Chatti, K.; Aono, K.; Blanc, J.; Thom, N.; Airey, G.; Lo Presti, D. Data Compression Approach for Long-Term Monitoring of Pavement Structures. Infrastructures 2020, 5, 1. https://0-doi-org.brum.beds.ac.uk/10.3390/infrastructures5010001
Manosalvas-Paredes M, Lajnef N, Chatti K, Aono K, Blanc J, Thom N, Airey G, Lo Presti D. Data Compression Approach for Long-Term Monitoring of Pavement Structures. Infrastructures. 2020; 5(1):1. https://0-doi-org.brum.beds.ac.uk/10.3390/infrastructures5010001
Chicago/Turabian StyleManosalvas-Paredes, Mario, Nizar Lajnef, Karim Chatti, Kenji Aono, Juliette Blanc, Nick Thom, Gordon Airey, and Davide Lo Presti. 2020. "Data Compression Approach for Long-Term Monitoring of Pavement Structures" Infrastructures 5, no. 1: 1. https://0-doi-org.brum.beds.ac.uk/10.3390/infrastructures5010001