1. Introduction
Transportation asset management often requires a data-driven decision-making process to effectively preserve the long-term performance of transportation assets. This data-driven decision-making process requires information obtainable from the quantitative analysis of transportation assets’ inspection records. Thus, there has been an increasing interest in the performance analysis of transportation assets among agencies around the world because each nation’s infrastructure is essential for supporting economic development and sustainability and boosting public health and safety [
1]. Among transportation infrastructure, bridges constitute the most expensive assets, by mile, for transportation agencies across the United States [
2] and around the world. Additionally, bridges are a crucial component of the overall transportation system. A partial or full collapse of a bridge generally causes considerable damage and social loss to the users. Therefore, it is critical to preserve a certain level of bridge performance [
3] and prevent rapid deterioration of bridges. Bridge preservation strategies include preventive maintenance, rehabilitation, and/or replacement (MRR). For an effective application of these measures, bridge agencies need to implement a bridge management framework that effectively prioritizes MRR actions, most especially for large inventories, which form a network of strategic highway systems within the United States, serving as a major pipeline for the national economy, well-being, and defense. FHWA’s Long-Term Bridge Performance (LTBP) program [
4] has developed machine-learning models by mining the historical National Bridge Inventory (NBI) and climate data and employing a deep learning approach. This study provides that a co-active mechanism and a simple decision framework, similar to a decision tree method used for machine learning, can help state and federal transportation agencies (e.g., state DOTs and FHWA in the U.S.) to numerically quantify long-term returns on MRR investments.
1.1. Research Motivation
Most in-service bridges in the United States were constructed between the 1950s and 1970s, with an average lifespan ranging from 50 to 100 years. Consequently, an increasing number of these bridges are in need of MRRs. Adversely, the MRR budget is constrained. Therefore, bridge owners are faced with a difficult task of balancing the condition of their bridges with the cost of maintaining them [
2,
3,
5]. At the level of state transportation agencies, bridge managers are facing ever-increasing challenges in prioritizing investments to maintain the safety and functionality of deteriorating bridges [
6,
7,
8]. Additionally, they are setting long-term performance goals by developing time-dependent bridge performance relationships in order to comply with the Moving Ahead for Progress in the 21st Century Act (MAP-21) [
9].
The main goal of investing in bridge MRRs is to obtain the highest possible return while minimizing the risk associated with it [
10,
11,
12]. Thus, much effort has been focused on the development of bridge prioritization strategies that optimize returns on MRR investments. Most recent studies have adopted a risk-based approach [
1,
3,
6,
13]. They often determine the risk associated with continuing the usage of a bridge based on its current and projected bridge performance. However, consideration for risk alone does not provide a comprehensive solution to bridge asset management. Therefore, tools that can accurately predict future conditions of bridges, as well as their remaining life, are essential for assessing the risk [
2].
However, there are essential questions to answer in order to enhance the prediction accuracy: 1) How condition changes in each bridge element affect the overall bridge health; 2) how they affect the other elements; and 3) how element interactions impact the long-term bridge performance. Bridge element conditions can be assessed by computing their health indices from the recently mandated element-level inspection data [
14]. They became available in the National Bridge Inventory (NBI). Once a bridge prioritization approach is developed, a return on investment (ROI) from the bridge maintenance, rehabilitation, and replacement (MRR) actions, is determined in terms of an associated average change in the bridge service life for a bridge inventory.
To optimize ROIs, a strategic move is defined in this study as a purposeful step taken by transportation agencies in order to increase ROIs on bridge MRRs. This strategic move is implemented in a game theory framework. In computing a time-dependent bridge performance relationship, this study employs a co-active mechanism, which was developed in the previous study [
15]. The mechanism accounts for time-dependent bridge element interactions in predicting time–bridge overall performance relationships. From such relationships, payoffs (or change in service life) for a threshold performance level can be determined. The advantage of employing a co-active mechanism includes more realistic, and thus less overly conservative, performance predictions [
16]. In this study, an extensive research program was developed to formulate time-dependent bridge performance relationships for multiple states’ bridge inventories.
1.2. Literature Review
The application of the bridge management system is increasing due to the growing demand for an improvement in the long-term bridge performance. Consequently, various state departments of transportation (state DOTs) and other agencies are more interested in determining factors that influence the long-term bridge performance. These factors include traffic volume, level of vulnerability to natural hazards, susceptibility to long-term effects of climate, and the service environment [
17,
18,
19,
20,
21]. For an effective bridge management, these factors are typically incorporated into the bridge long-term predictive models. Bridge predictive models, which indicate changes in the performance of bridges over a certain period of time, now constitute an essential component of the agency’s long-term bridge management plans. At present, cutting-edge bridge management systems classify bridge predictive models into two major categories: deterministic models and stochastic models [
22,
23,
24]. For deterministic models, the measure of bridge condition is expressed without probabilistic considerations, whereas a stochastic approach reflects the uncertainties that each bridge condition represents.
Over the years, bridge predictive models have enabled agencies to determine the level of funding required to sustain a certain level of bridge condition over a planning period [
25,
26]. However, as the bridges become older, other critical factors that affect long-term bridge performance include the types, frequency, and effectiveness of preservation, and maintenance, repair, or rehabilitation actions performed on bridges by the owner. Therefore, over the years, studies have focused on improving the efficiency of bridge maintenance strategies with the aim of enhancing long-term bridge performance [
21,
27]. A study conducted by Elbehairy et al. [
28] investigated the application of two evolutionary-based optimization techniques that are capable of handling large-sized problems, namely genetic algorithms and shuffled frog leaping, to optimize bridge decks’ maintenance and repair decisions.
A risk-based year-by-year optimization strategy, coupled with the use of a pre-processing function to allocate repair funds first to critical bridges, was recommended. Another approach by Zhang and Gao [
8] proposed an optimization model and the search algorithm was consequently applied to three bridge decks maintenance scenarios. The optimization model was developed to determine the optimal length of the maintenance period based on the proposed maintenance policy, to minimize the system’s life cycle cost per unit time.
Zhang and Wang [
6] developed a decision model for bridge network management and project prioritization that enables the operational performance of a transportation system to be optimized, given the safety requirements mandated by the American Association of State Highway and Transportation Officials (AASHTO) and the inevitable budgetary constraints imposed by limited resources. The previous efforts relating to the prioritization of bridges for MRR are commendable because they attempted to maximize a return on investments in bridge MRR. In this study, the feasibility of implementing a proposed co-active mechanism within a game theory framework nationwide (specifically in the United States) was investigated. The co-active bridge prioritization model additionally accounts for the effects of time-dependent element interactions on the long-term bridge performance. Additionally, the model was implemented within a game theory framework and thus quantifies payoffs of the two players, FHWA and state DOTs. Finally, the model was used to investigate the performance of National Highway System (NHS) and non-NHS bridges.
1.3. Research Goals and Scope
This study aimed to determine the feasibility of implementing a proposed co-active prioritization model nationwide in the United States. Specifically, this study aimed to answer the following three key questions by analyzing bridge inventories in four states (Georgia, Virginia, Pennsylvania, and New York):
Does the proposed co-active model have an application to other U.S. state agencies?
Is there any difference in the performance of National Highway System (NHS) state-owned and non-NHS state-owned bridges?
How should one quantify payoffs for two players, the FHWA and a state DOT, using a game theory?
1.4. Background and Overall Approach
Bridge inventories in four states, which are known to have proactive maintenance strategies, were investigated. Title 23 of the United States Code §150(c)(3), in compliance with the Moving Ahead for Progress in the 21st Century (MAP-21) legislation, requires state DOTs to establish, as part of their governance of performance measures, “minimum standards for States to use in developing and operating bridge and pavement management system”. For bridges on the National Highway System (NHS), Title 23 of the United States Code §119(f) stipulates that no more than 10% of the total NHS bridge deck area be structurally deficient (SD) in a bridge network [
29]. Equation (1) quantifies the percentage of SD bridges:
A bridge is classified as SD when at least one of its National Bridge Inventory (NBI) items, 58 (deck), 59 (superstructure), 60 (substructure), or 62 (culverts), has a condition rating of 4 or less (out of the maximum rating of 9). Therefore, the Federal Highway Administration’s (FHWA’s) approach to the maintenance of NHS bridges can be described as the ‘worst case scenario’, where each bridge component is required to have a minimum condition rating of 4 in the preceding three years. However, other important factors for measuring bridge performance, such as the average life cycle, must be considered.
2. Methodology
2.1. Quantifying Depreciation of Bridge Assets, a Strategic Move, and Payoffs
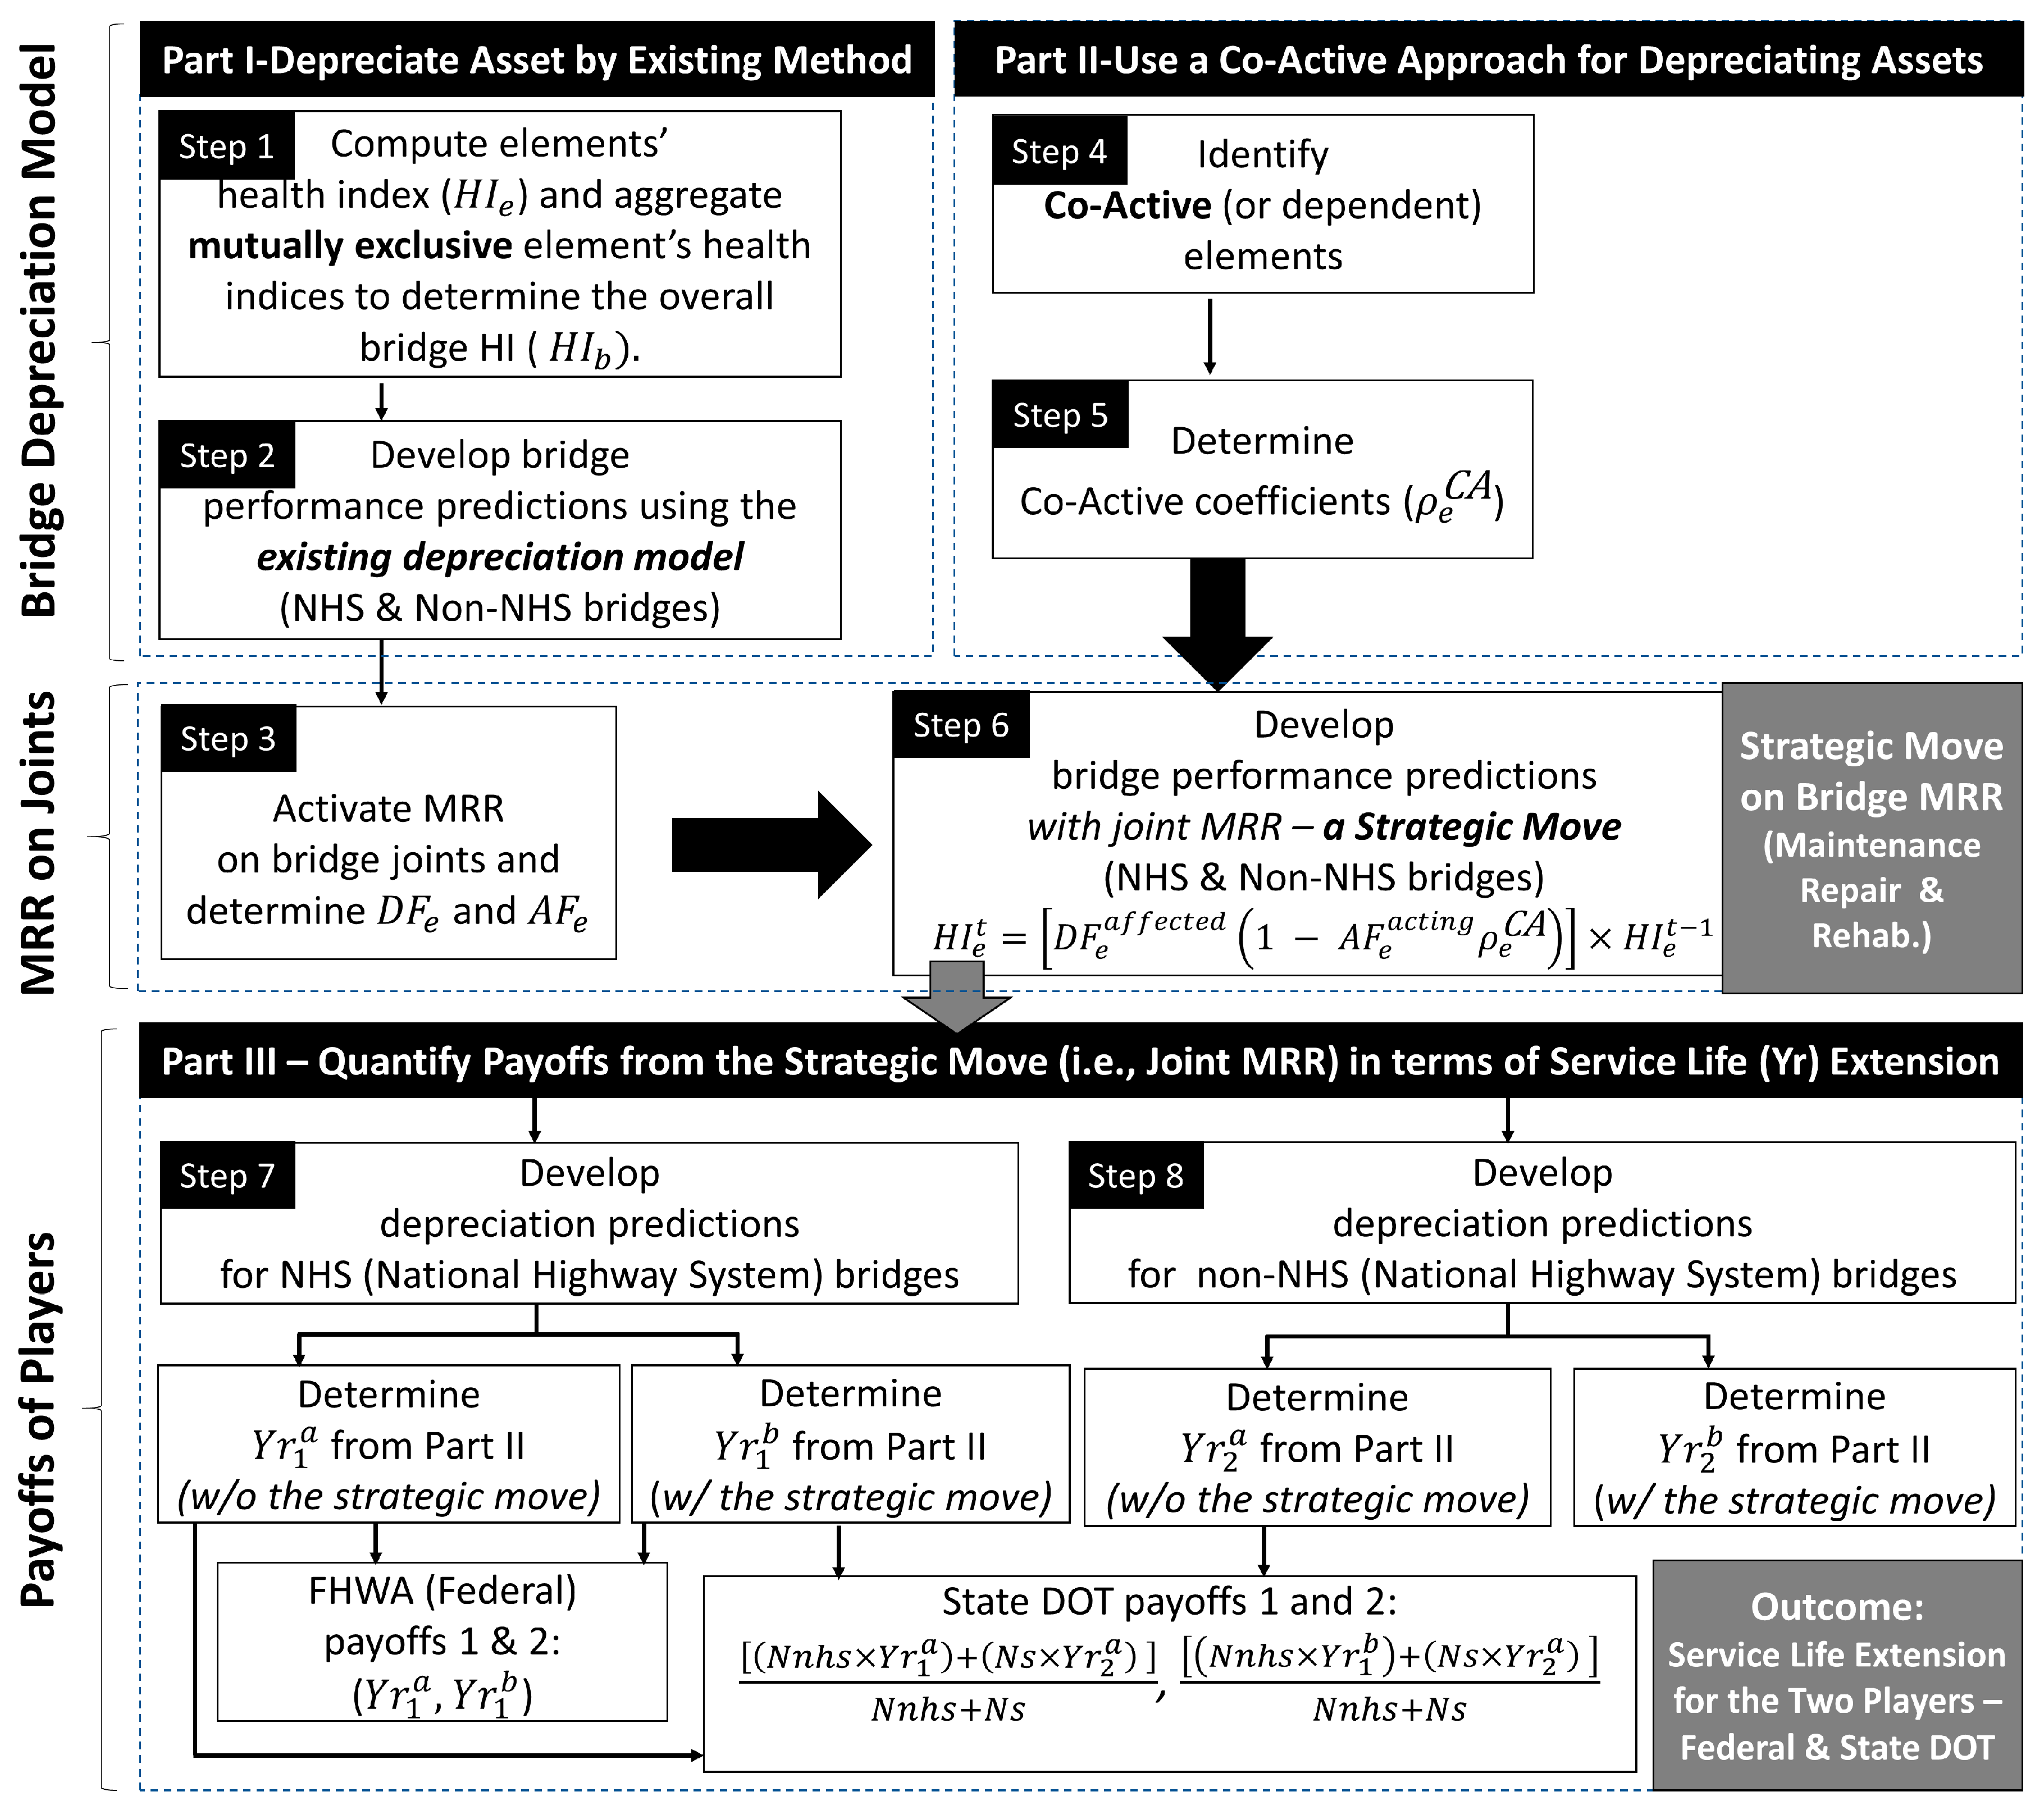
The process implemented in this study was divided into three main parts.
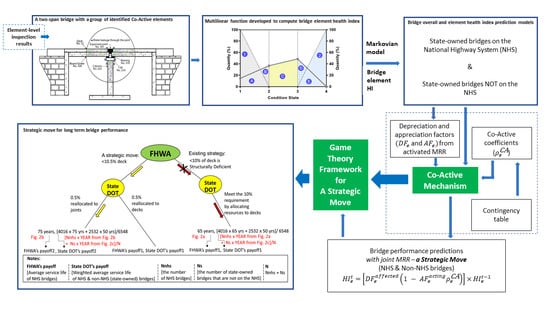
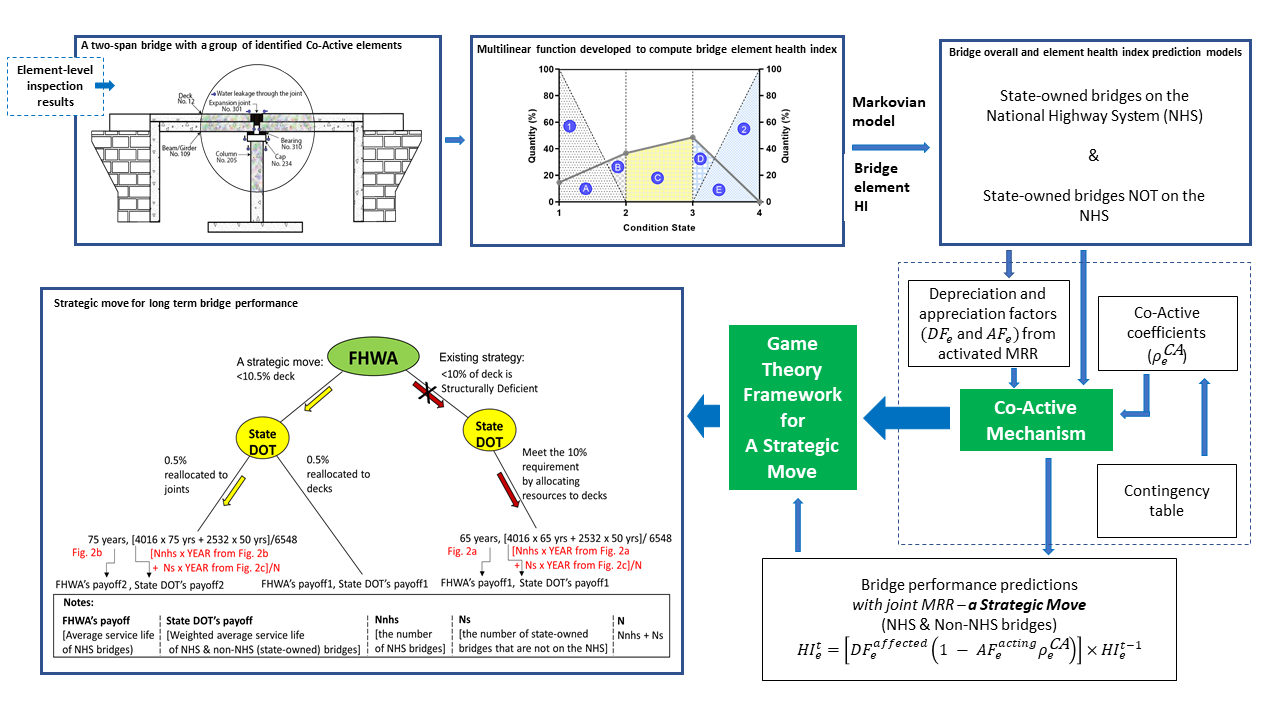
Figure 1 presents a flow chart showing the proposed approach for determining the three components shown in Parts I through III:
(
Part I) Long-term bridge performance (or depreciation of bridge assets) using the existing method [
22]. In this step, it is assumed that health indices of bridge elements are mutually exclusive. The elements’ health indices are used as input to develop bridge performance predictions.
(
Part II) Long-term bridge performance by recognizing dependent and thus co-acting elements (i.e., a co-active approach [
15]) with and without a strategic move—improving all joints or conducting joint MRRs. In this part, the depreciation models determined from Part I and the co-active coefficients determined by studying correlations among elements [
15] are used to predict the bridge performance resulting from the strategic move.
(Part III) Payoffs of the players (federal and state agencies) in terms of an associated service life extension from the strategic move.
2.2. Co-Active Approach
Part II identified and computed the co-active parameters that influence the overall bridge health indices (BHIs). The co-active approach was first introduced and described in detail in the previous study [
15]. In brief, the co-active model hypothesizes that when one repairs an element, it should reduce the deterioration of the other elements. Subsequently, the improved element(s) reduce the deterioration of itself and other co-active elements. Therefore, the co-active model enables data-driven time-dependent element interactions for preventive maintenance, rehabilitation, or replacement (MRR) decision-making.
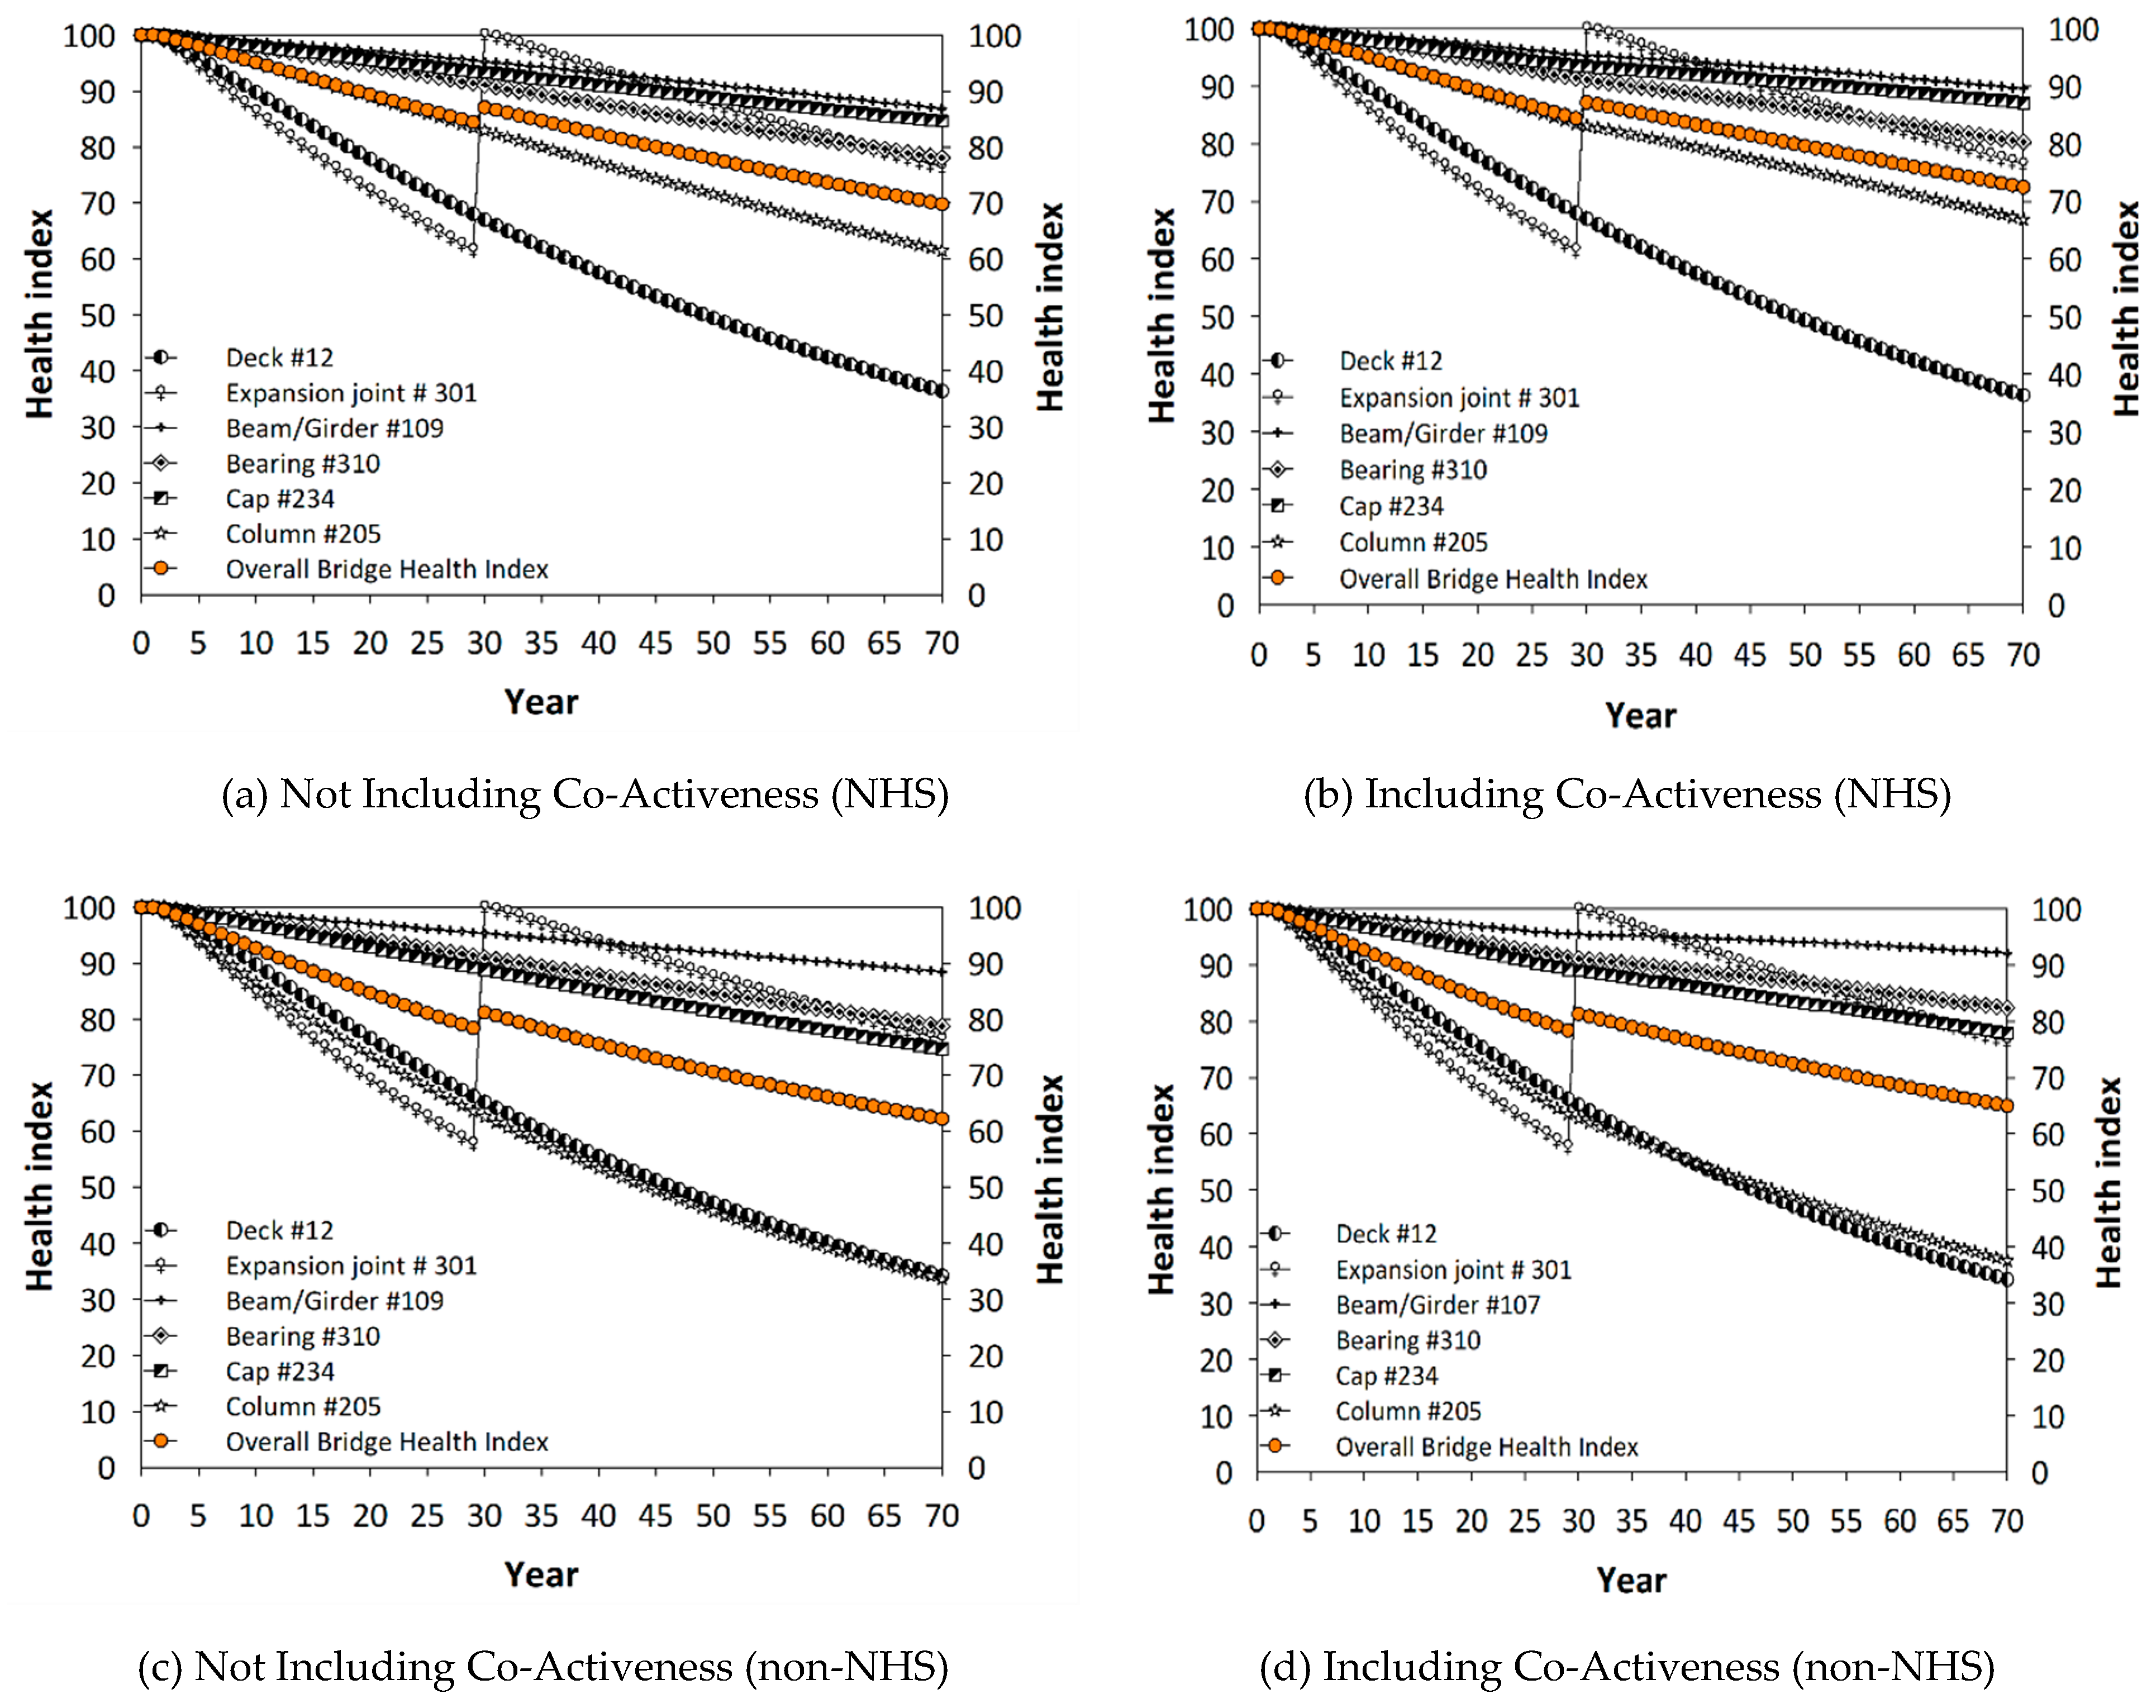
The computation relevant to this study is shown in Equation (2). For each element deterioration model, there are year-to-year depreciation factors (DFs) for each element’s HIs (i.e., the element’s deterioration rates). For example, if the reinforced concrete deck’s HIs are 89.01 and 88.12 in the years (Yrs) 2015 and 2016, respectively, the DF is 0.01, which is computed by (89.01–88.12)/89.01. Therefore, when one of the co-active elements is maintained, rehabilitated, or replaced (MRR), it decreases the DFs for the other co-active elements as shown in Equation (2) and becomes an acting element. Consequently, the decrease in the DF of each element affects the other elements’ HIs and the overall BHI (see
Figure 2a,b):
where:
Health index for an element in the year, t (e.g., 2018);
Health index for an element in the preceding year, t − 1 (e.g., 2017);
Depreciation factor calculated for an element (e.g., column) not being maintained, repaired, and rehabilitated;
Appreciation factor calculated for an element (e.g., expansion joint) being maintained, repaired, and rehabilitated; and
Co-active coefficient between the acting element (e.g., expansion joint) and its co-active elements (e.g., column).
The approach involved in the co-active model [
15] is not repeated here in detail, and the process below focuses on describing how a game theory approach is used for optimal decision-making.
2.3. Determination of Service Life Using a Game Theory Approach
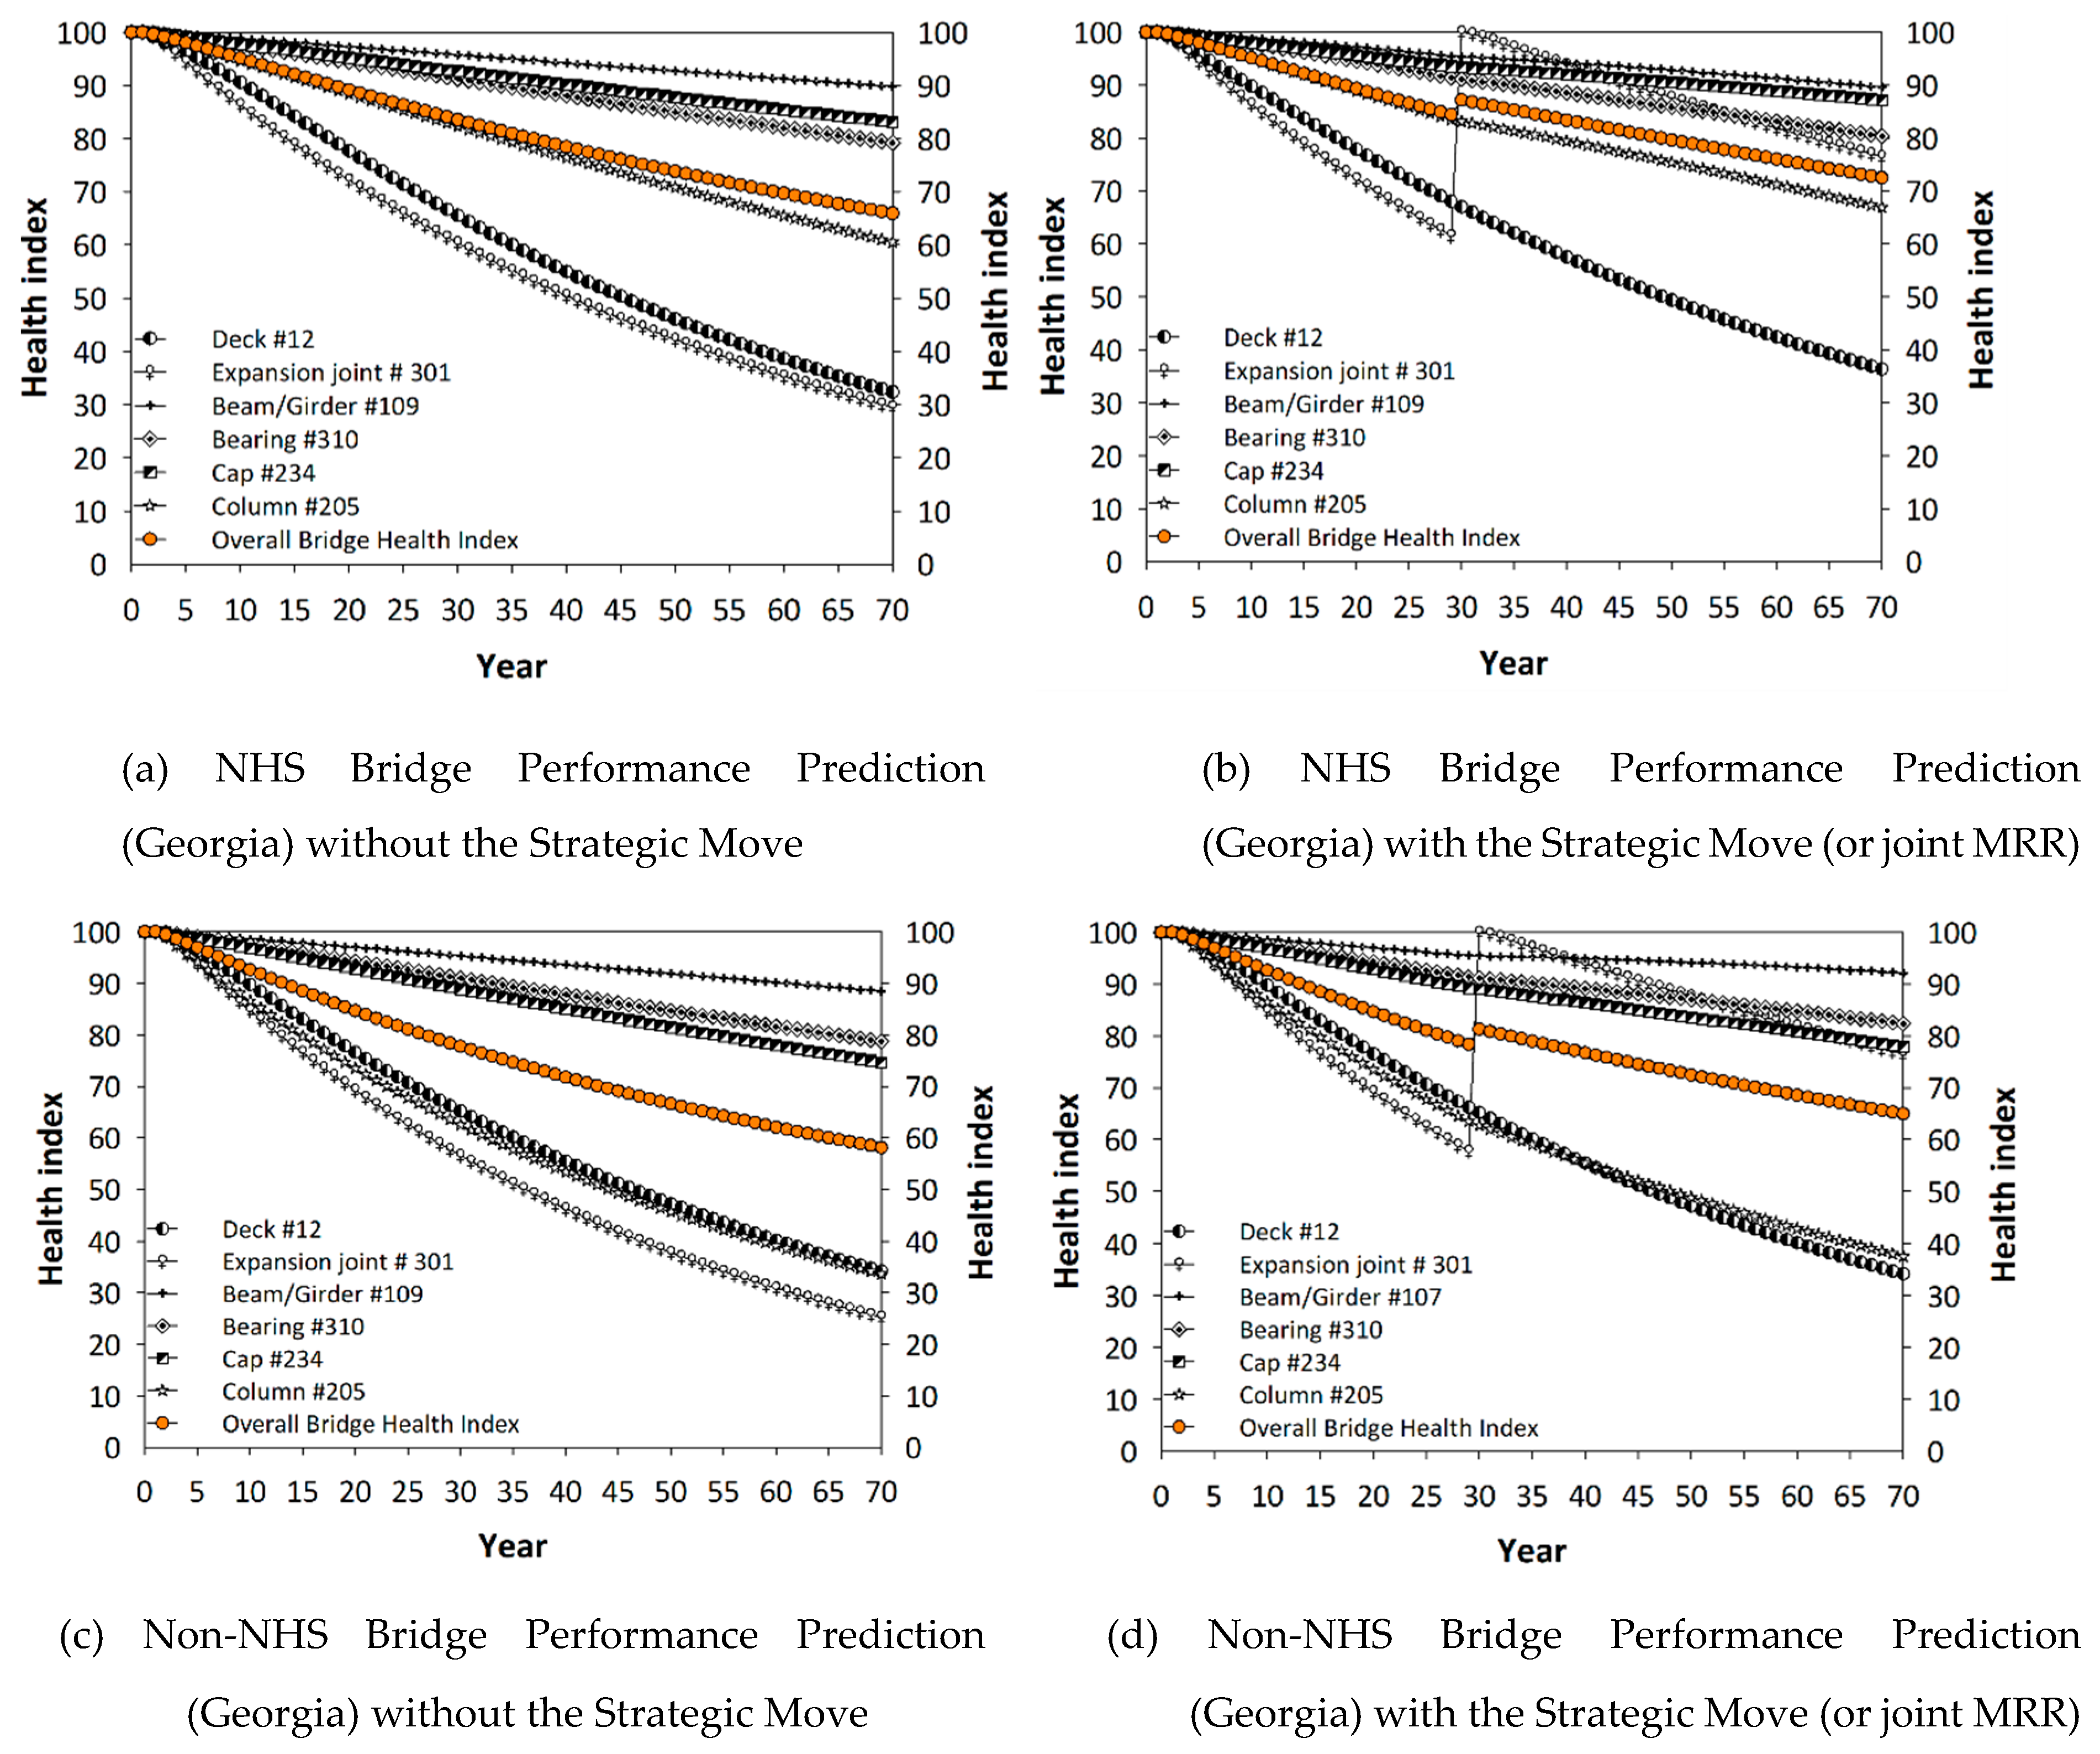
In Part III, the proposed co-active model was implemented within a game theory approach described below to determine the payoffs of 2 player: federal and state players, specifically the Federal Highway Administration (FHWA) and a state Department of Transportation (state DOT). The payoffs are determined by Equations (3) and (4). Within this game theory approach, the co-active model determined the NHS and non-NHS performance predictions (i.e., depreciations) shown in
Figure 2, which were in turn used to calculate the bridge service years (
,
, and
) from two moves using Equations (3) and (4).
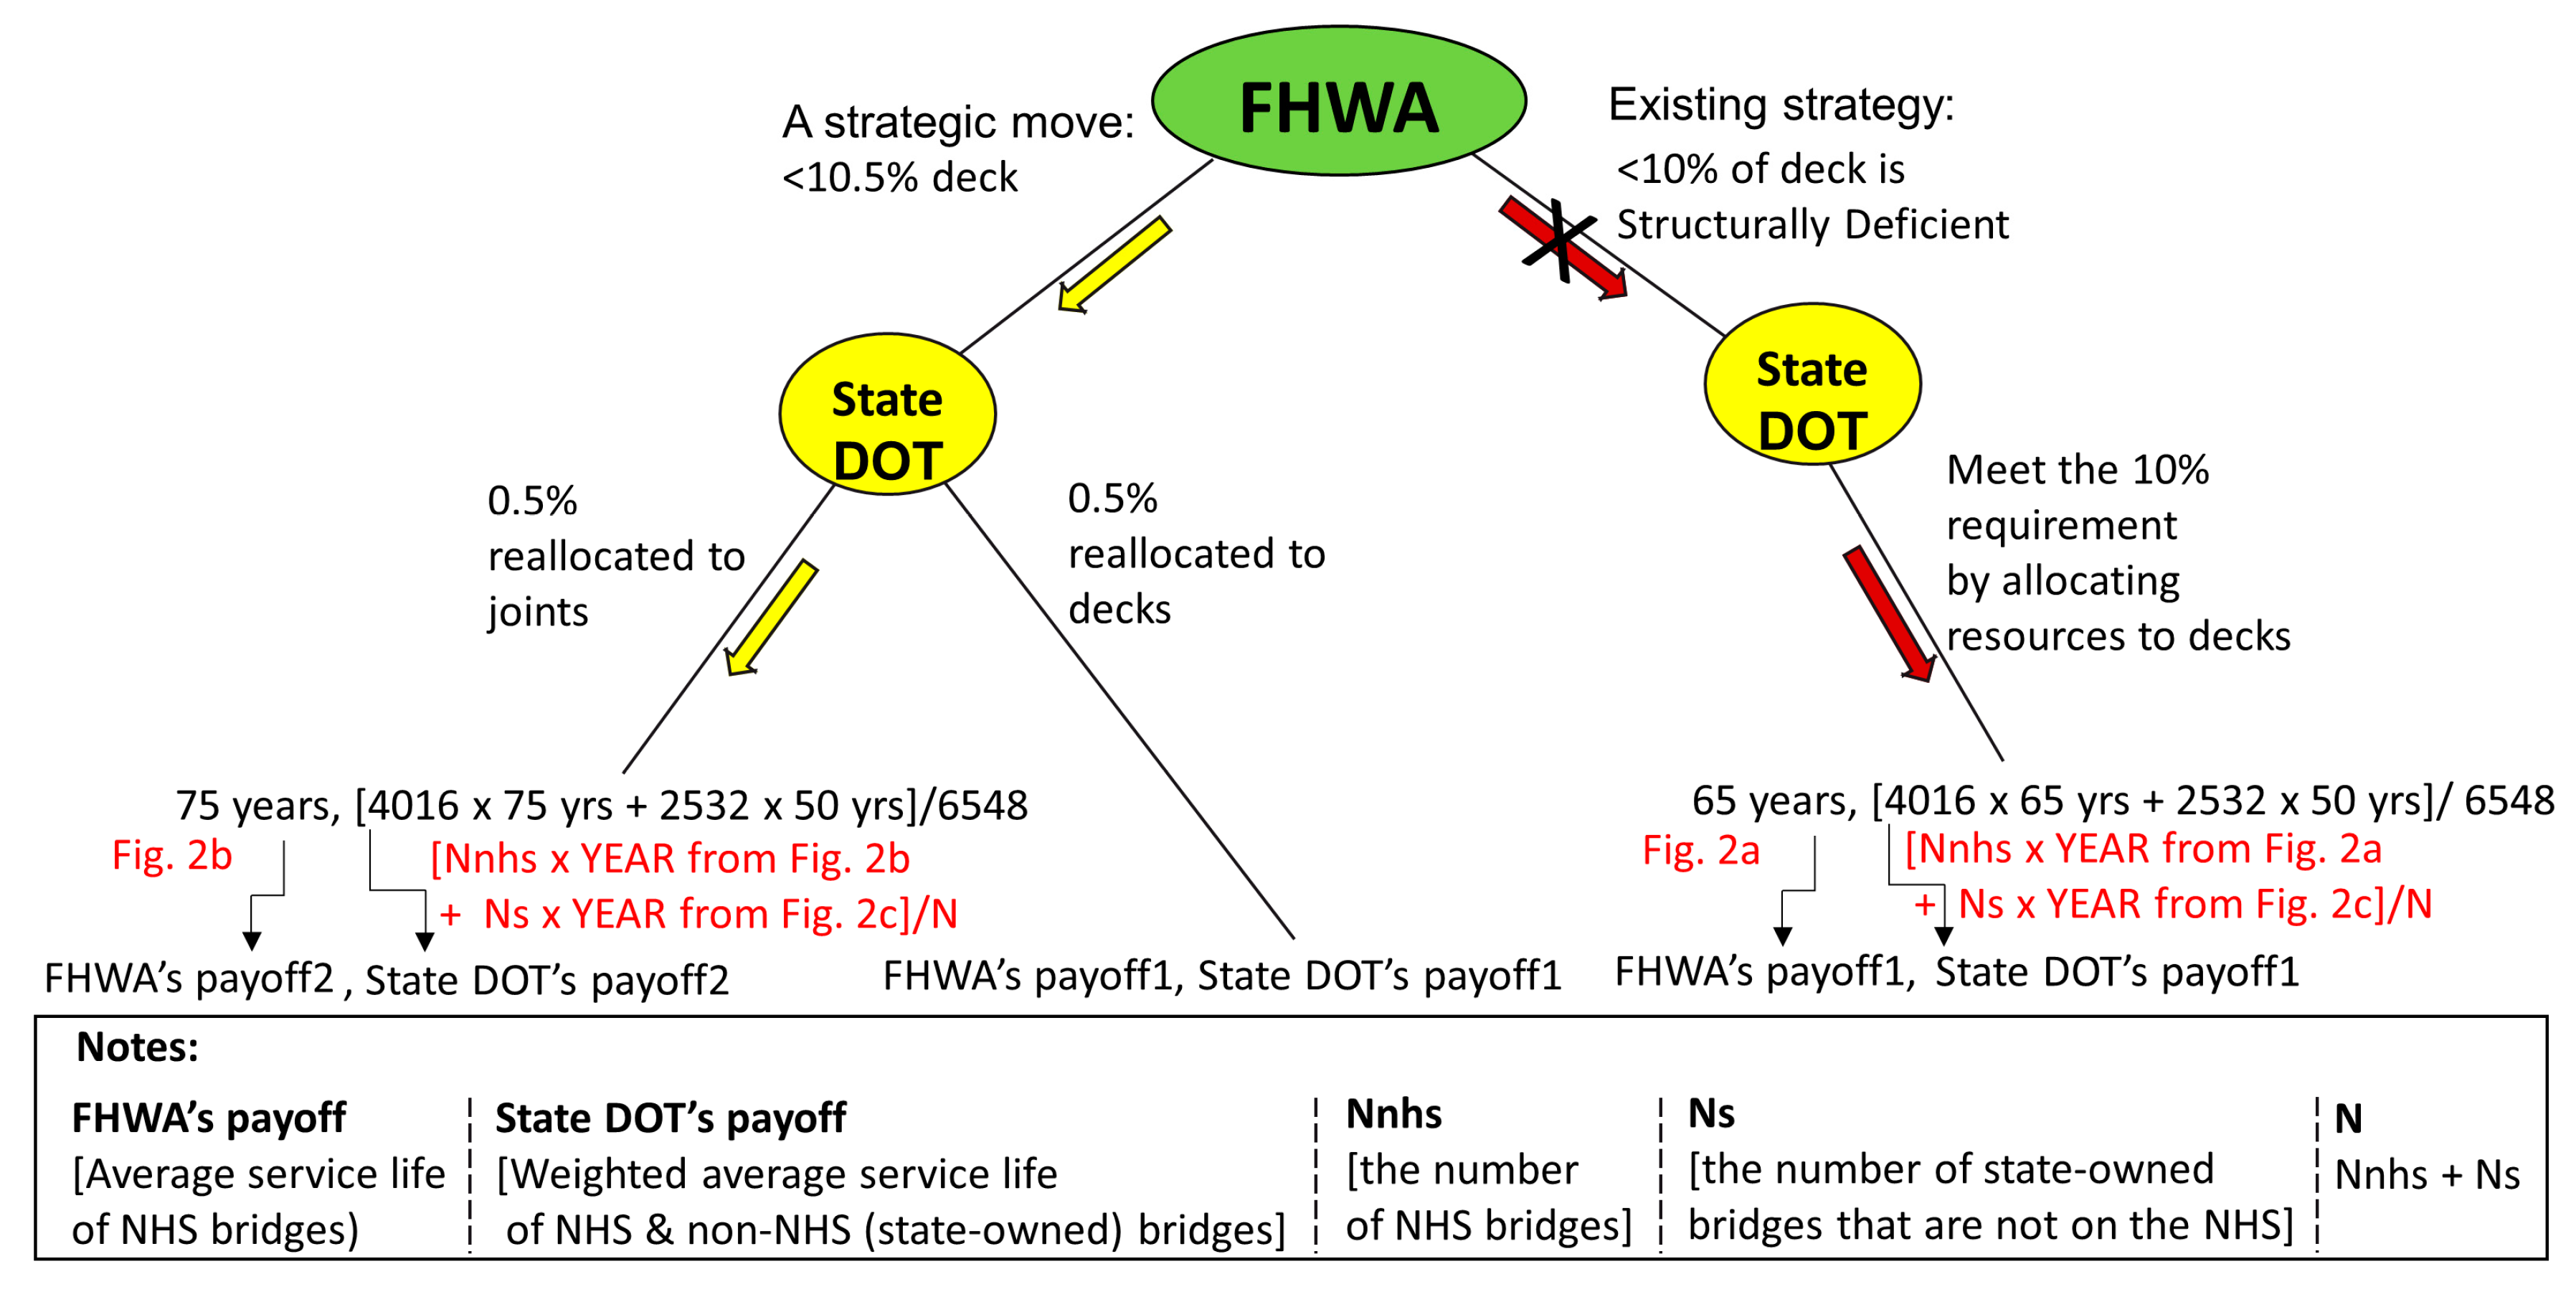
The game theory approach modeled a strategic interaction between two players, the FHWA and a state DOT. A sequential game with two FHWA’s strategic moves was conducted, one imposing the 10% deck requirement and the other with a strategic change in deck requirement (10.5%) while requiring states to maintain all joints in superior conditions. Both NHS bridges and non-NHS bridges were investigated to review the effectiveness of FHWA’s strategic moves. For example,
Figure 3 shows the game tree illustrating a strategic move and payoffs of 2 players in Georgia. State DOT payoffs (1) and (2) shown in
Table 1 were calculated using Equations (3) and (4):
where:
Payoff obtained from a move #1—the existing approach (<10% deck is structurally deficient);
Payoff obtained from a move #2—the proposed strategic move (<10.5% deck is structurally deficient);
= Number of bridges on the National Highway System;
= Number of bridges NOT on the National Highway System;
= Total number of bridges (;
= Bridge service year corresponding to the threshold BHI set at 70 (obtained from
Figure 2(a));
= Bridge service year corresponding to the threshold BHI set at 70 (obtained from
Figure 2b);
and
= Bridge service year corresponding to the threshold BHI set at 70 (obtained from
Figure 2(c)).
Finally, the payoffs of the two players in prioritizing element MRR were quantified based on a service life extension of bridges when a threshold bridge health index (BHI) was set to be 70. In this study, a threshold BHI of 70 was selected because it is the dividing factor for determining whether a bridge needs preventive maintenance or rehabilitation [
30,
31,
32]. For a fair comparison, the threshold BHI of 60 was used for New York because the observed bridge performance in the state appears to be relatively lower than the other states. The cost of reducing deck MRR by 0.5% was assumed to be equivalent to the cost of rehabilitating all expansion joints and joint seals in a bridge inventory. This reduction was substantiated by calculating the total quantity of deck areas and the total linear footage of joints.
3. Results
The results are presented to review the effect of the second move (or reallocate deck resources to improve all joints). Thus, this move is referred to as the “strategic move” in this section.
3.1. Analysis of Georgia DOT’s Element Data
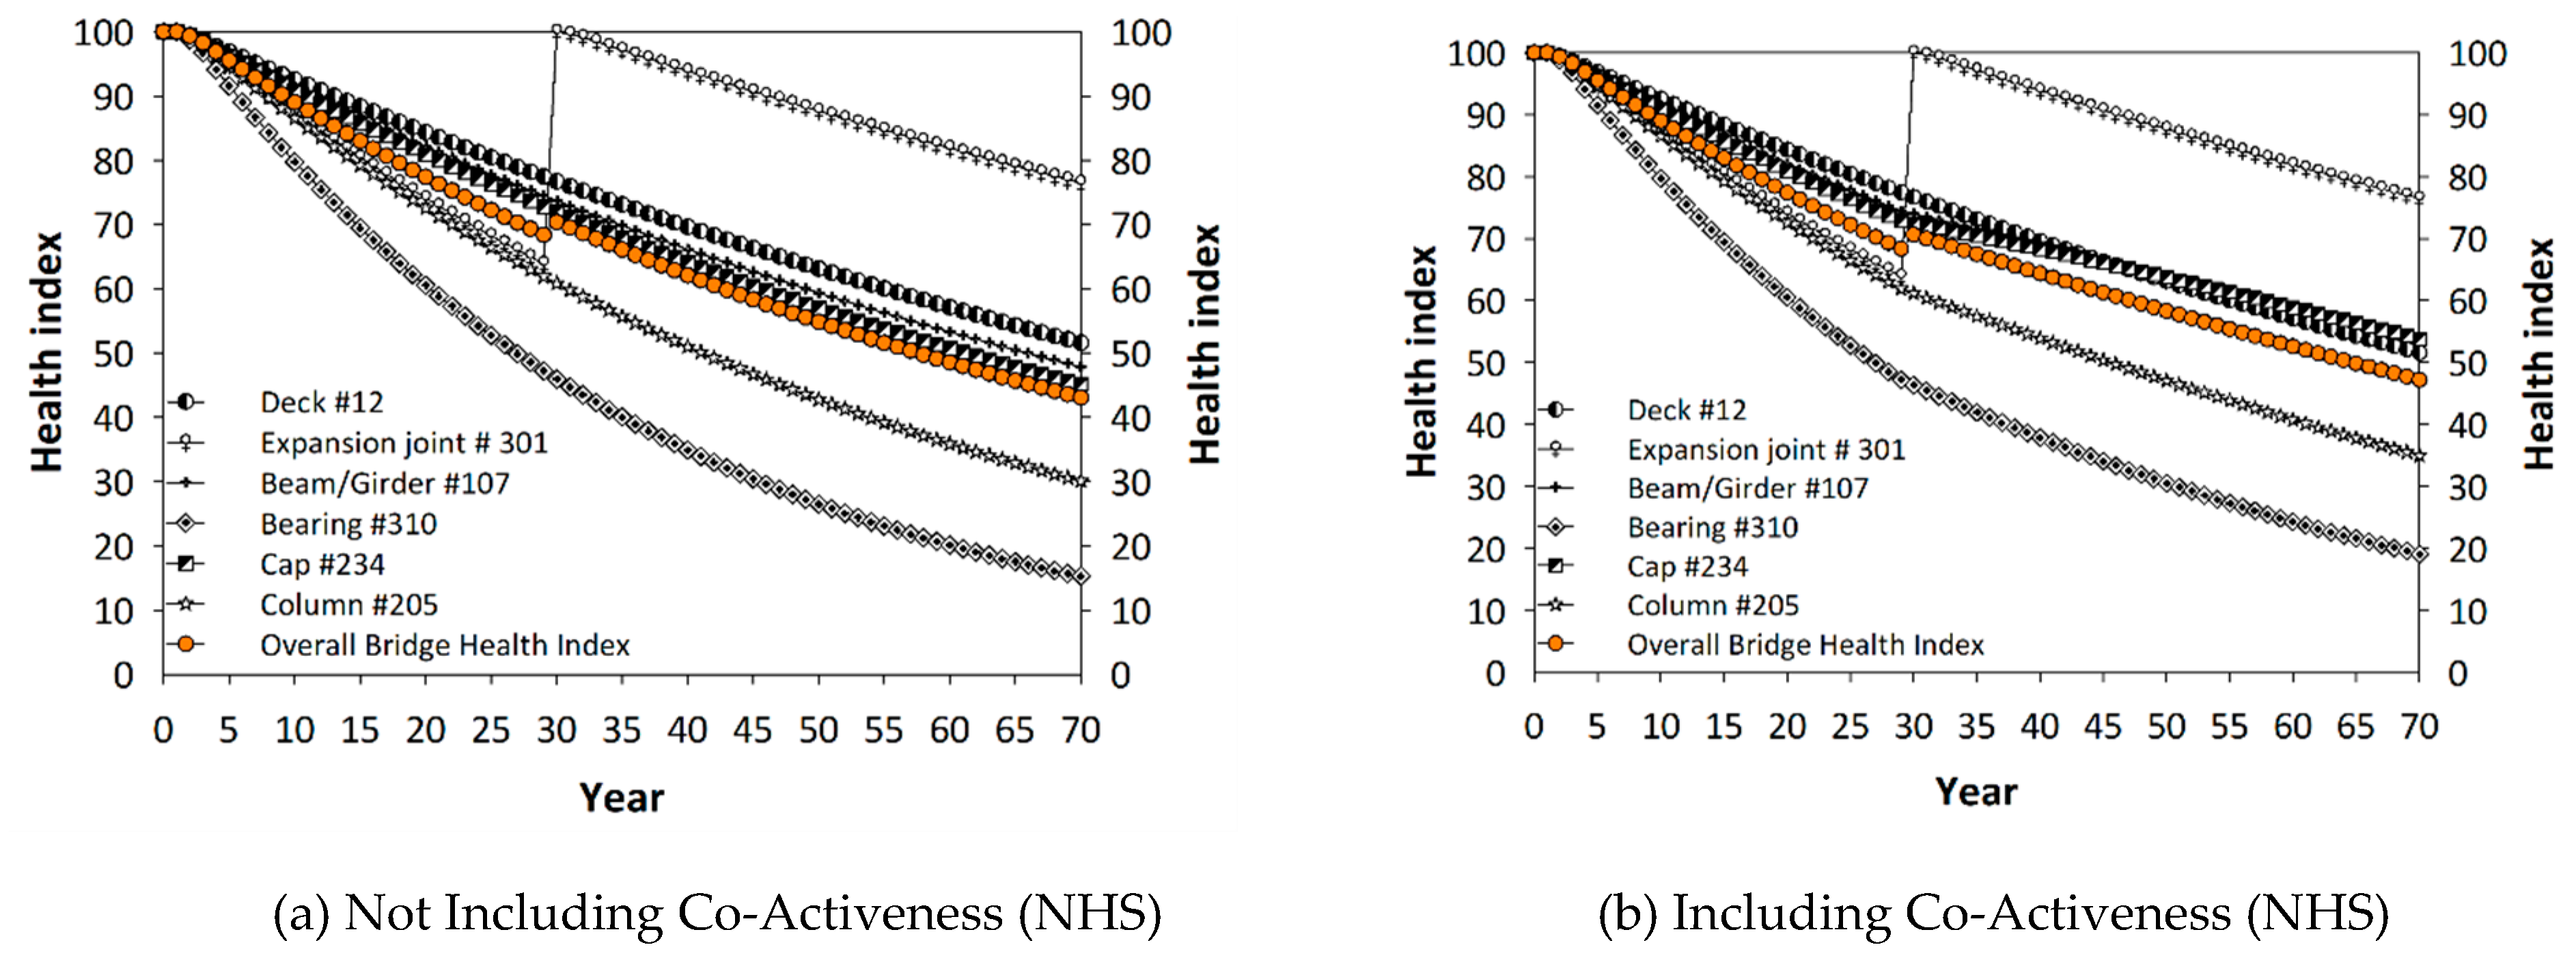
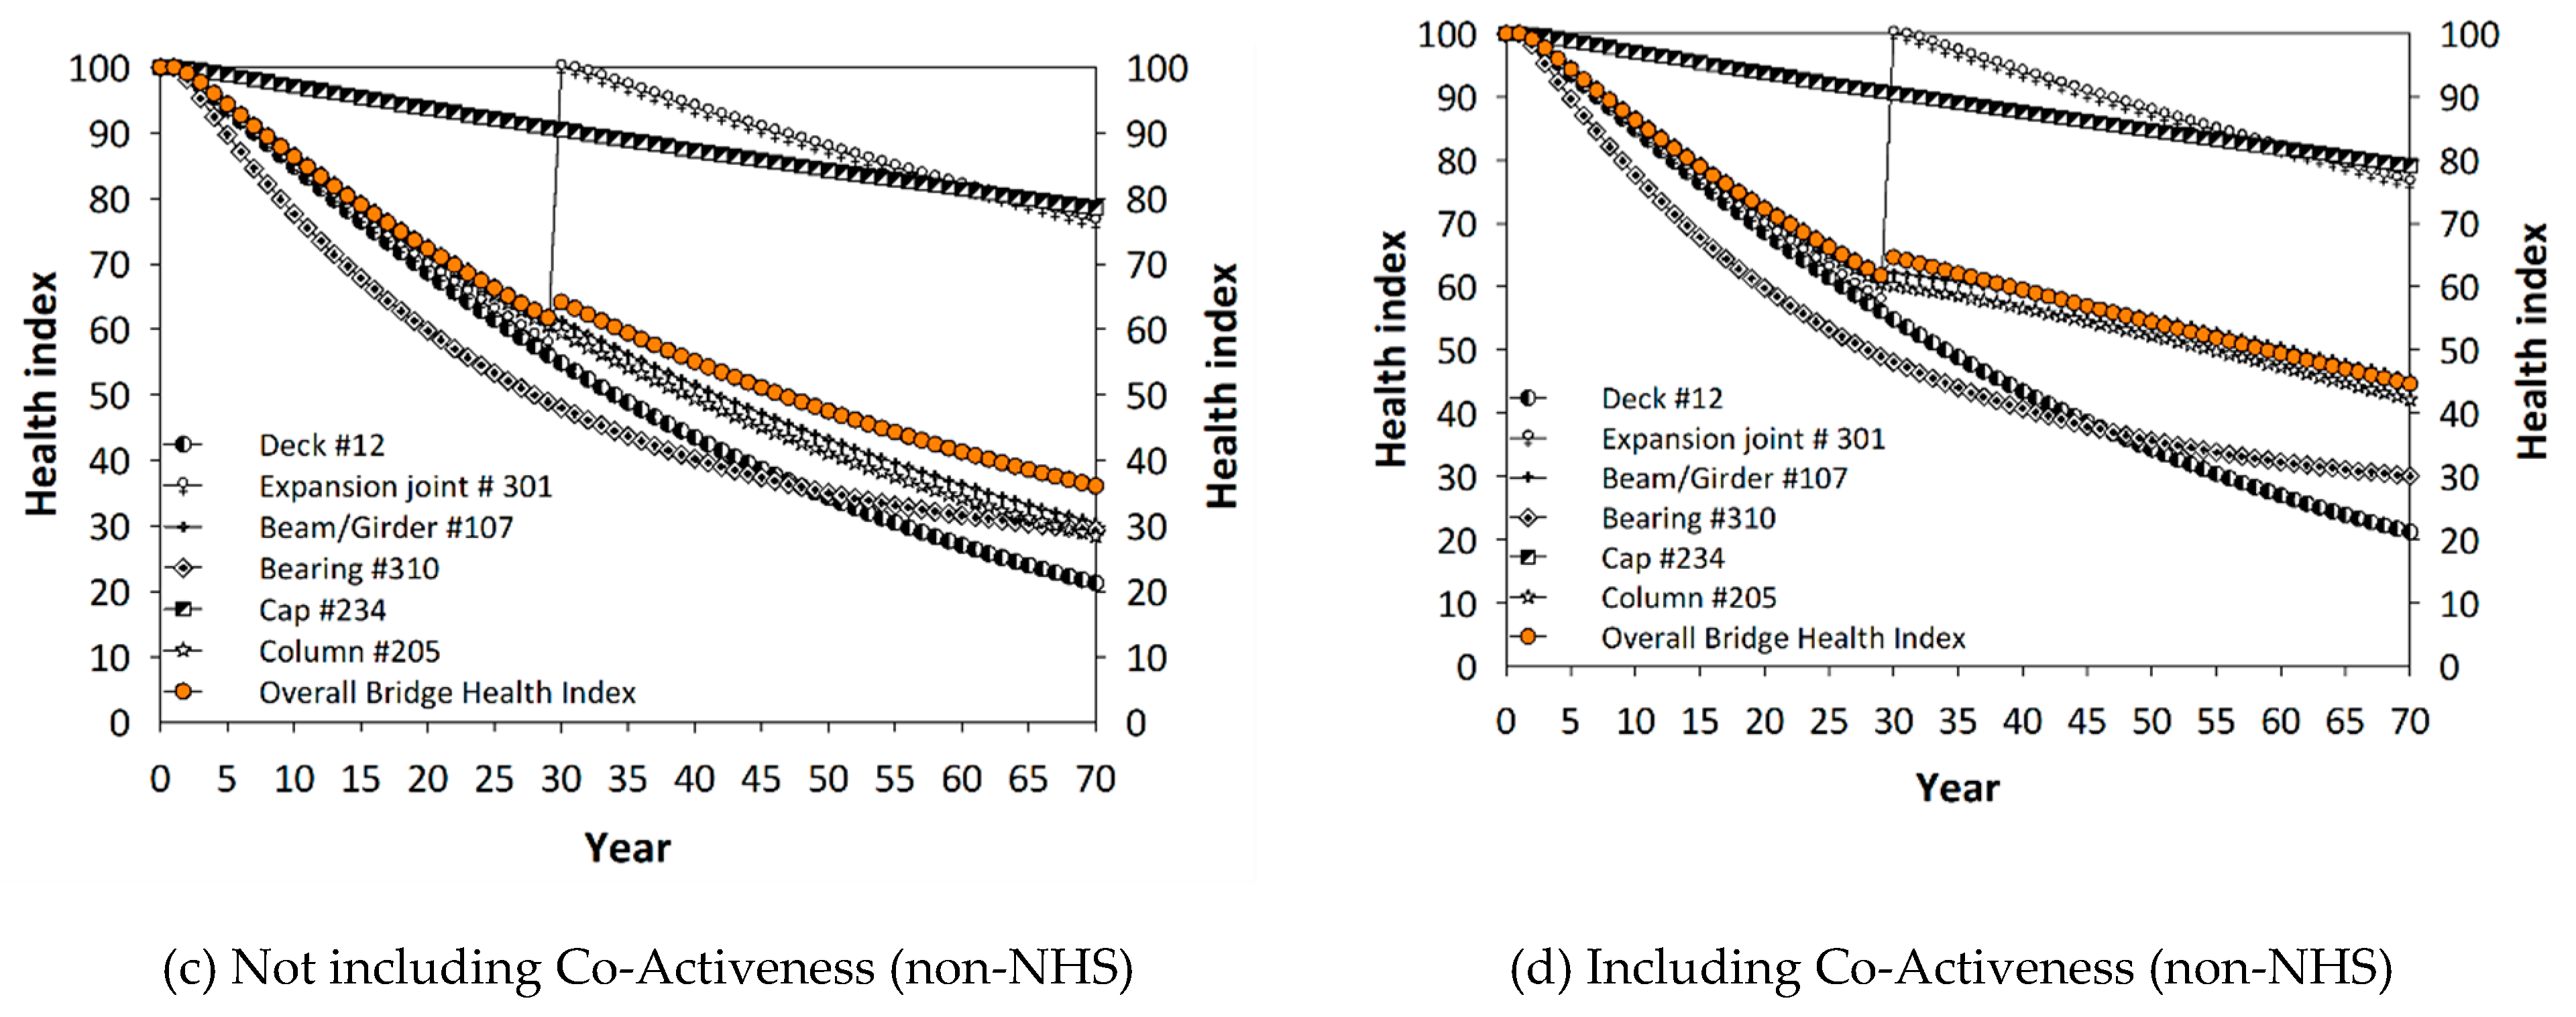
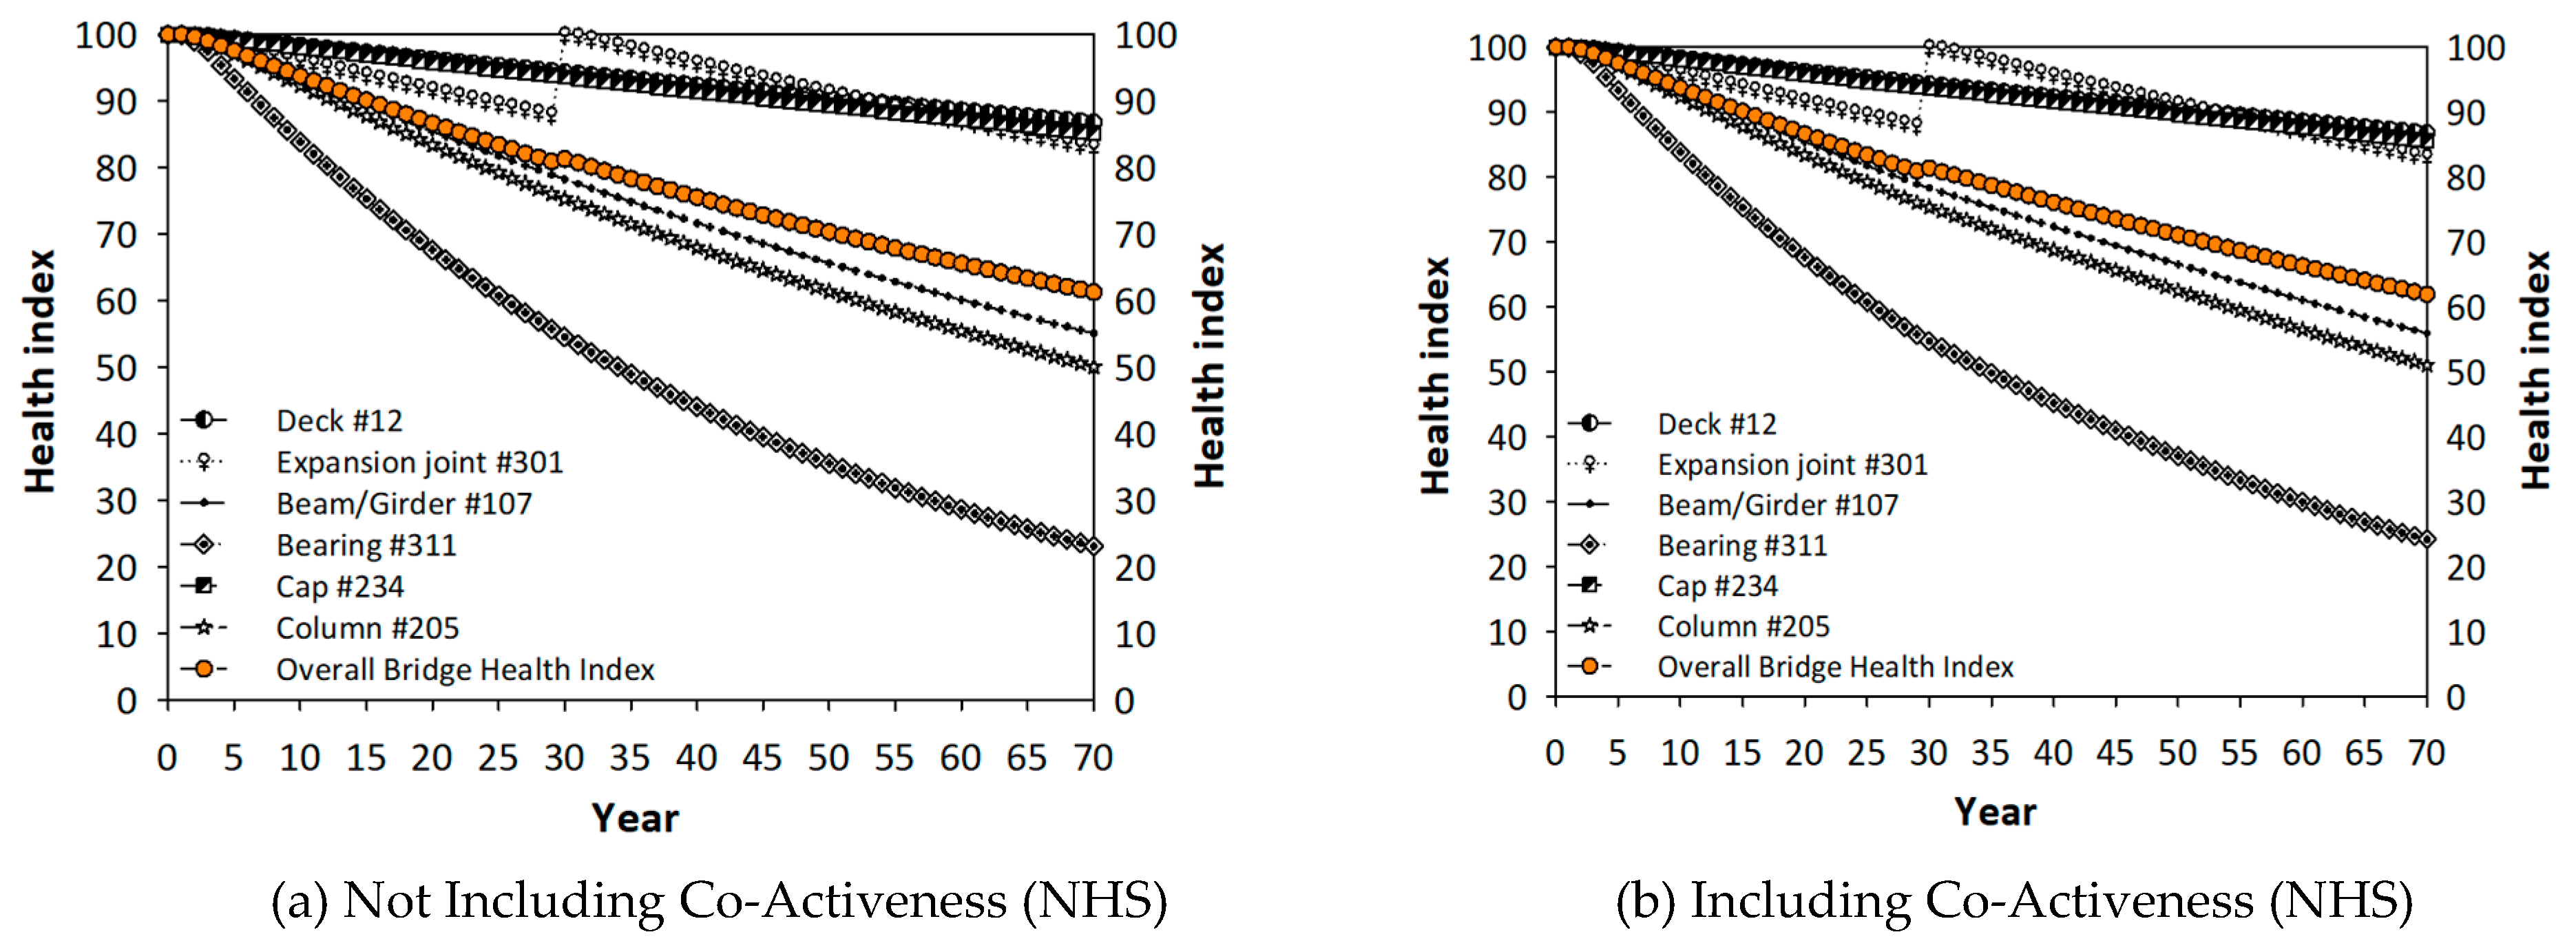
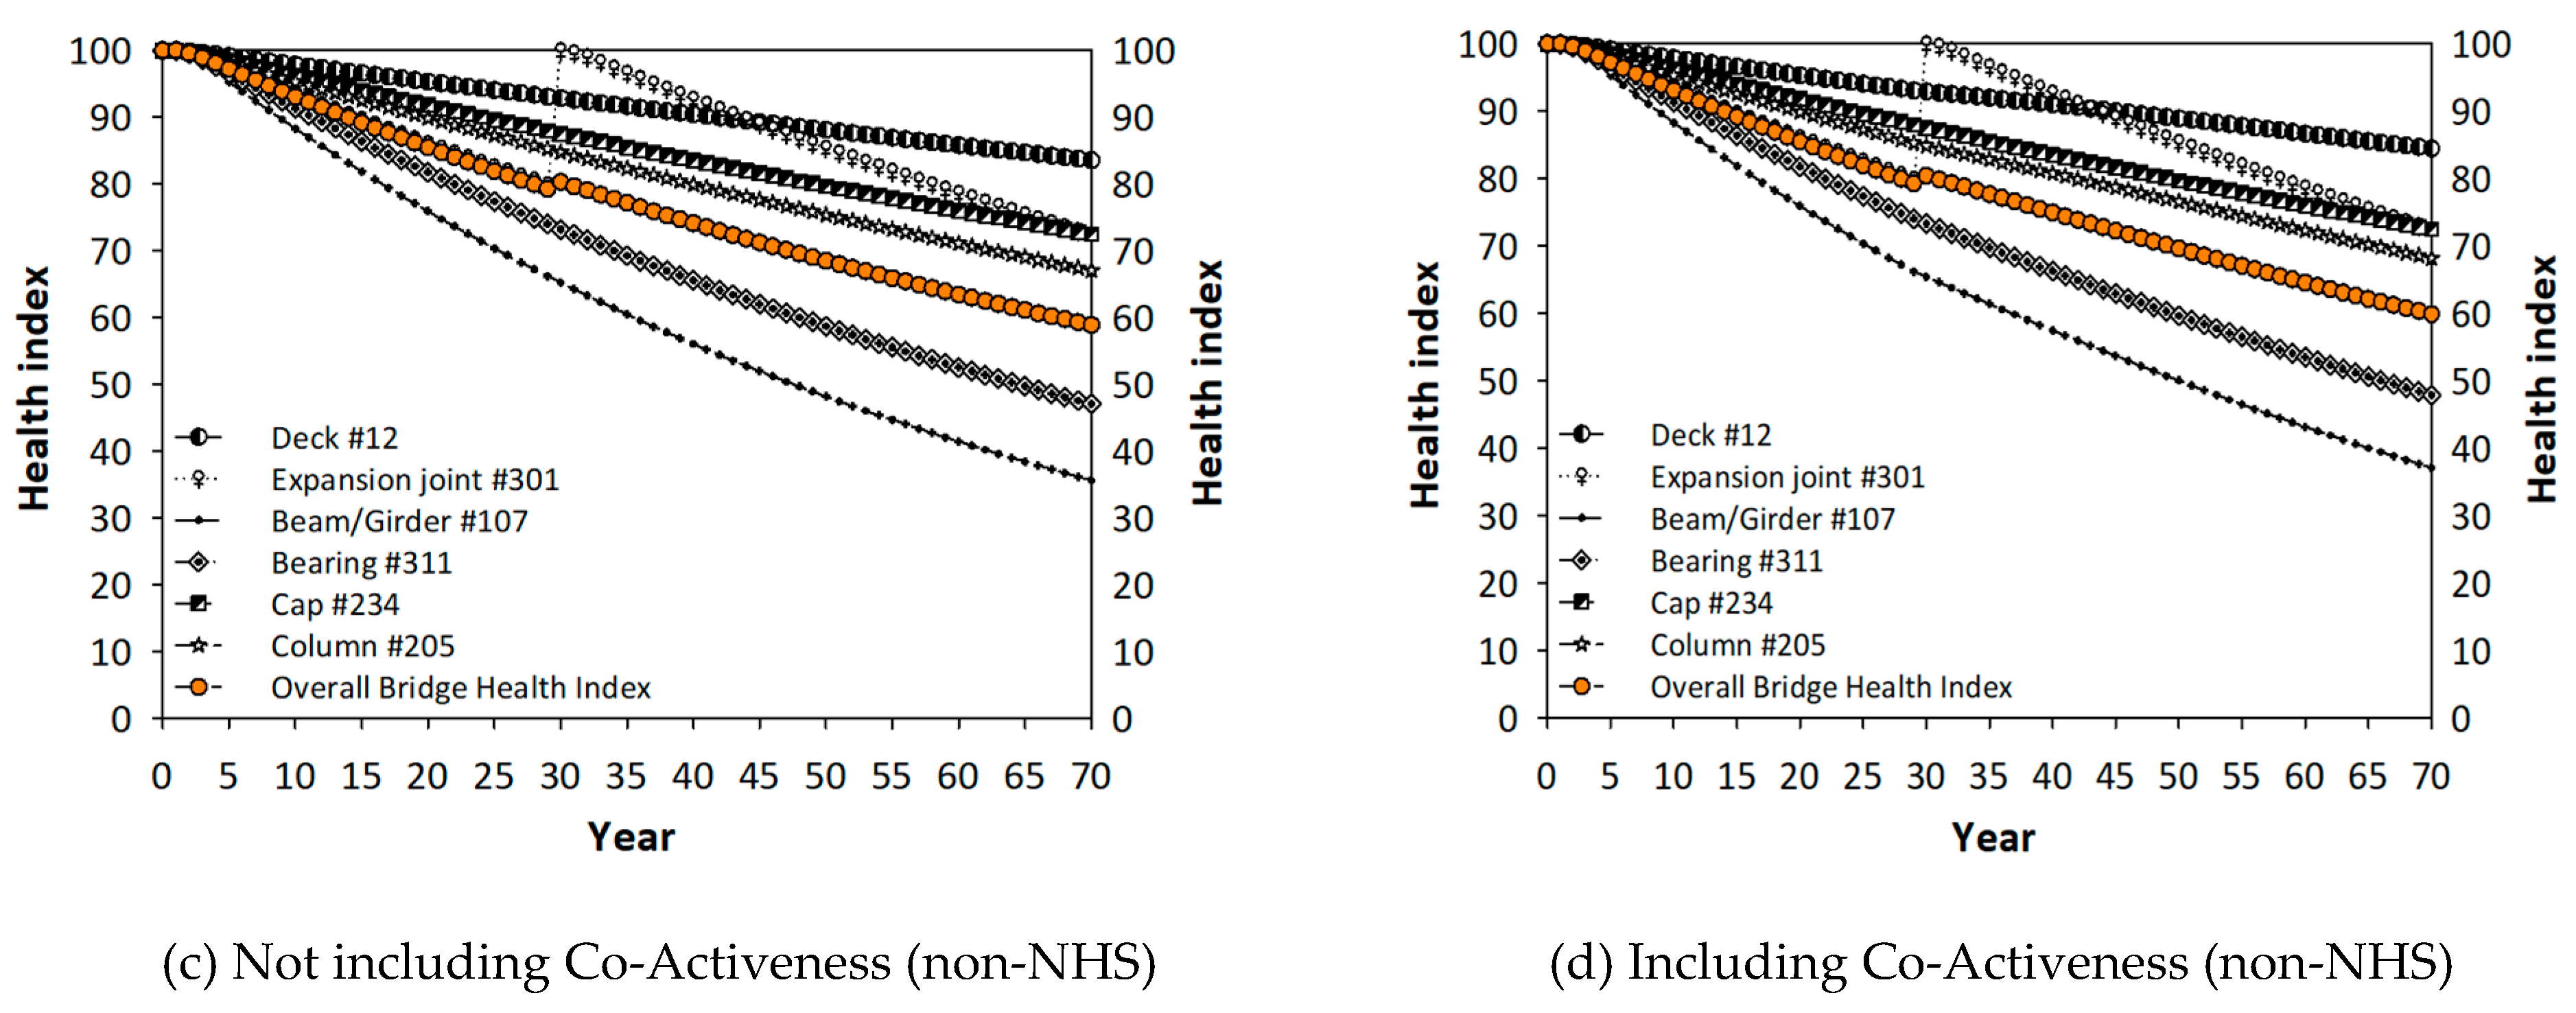
Figure 2a shows the average service life of NHS bridges in Georgia when no joints are rehabilitated or replaced.
Figure 2b presents the NHS bridge performance when additional resources are allocated to expansion joints and joint sealant rehabilitation and/or replacements, the main strategic move (move #2 above) investigated herein.
The average service life was extended by 10 years because the service life is 65 and 75 years in
Figure 2 a,b, respectively, for the BHI threshold of 70. Similarly,
Figure 2c,d show the non-NHS bridge performance. In
Figure 2a through to
Figure 2d, the proposed joint replacement affects the performance predictions at similar rates (overall BHI increases from 65 to 75 in NHS bridges, and 50 to 65 in non-NHS bridges). This observation can be attributed to the similar values of the co-active coefficients computed for NHS and non-NHS bridges in Georgia.
The extent to which the maintenance, rehabilitation, or replacement (MRR) of an element affects the performance prediction of the other co-active elements largely depends on the degree of dependency that exists in the co-active elements. The higher the co-active coefficient is between two elements, the more likely the changes in the performance of one element affect the performance of the other dependent element. Thus, in addition to the previously identified factors in the literature (e.g., present condition of bridges/elements, depreciation models, traffic volume, network priority, etc.), transportation agencies should consider the influence of interdependencies among bridge elements when planning MRR for a network of bridges. That is, the co-active model presented in this study must be implemented in the existing bridge management systems to account for such interdependencies.
Figure 3 illustrates a payoff of the two players, Federal Highway Administration (FHWA) and state Department of Transportation (DOT).
Table 1 gives the payoffs for the four states analyzed. The table shows that the strategic move in the proposed game theory approach gives higher payoffs for FHWA and state DOT. This is an optimal outcome for the two players: the Nash equilibrium deduced from a backward induction.
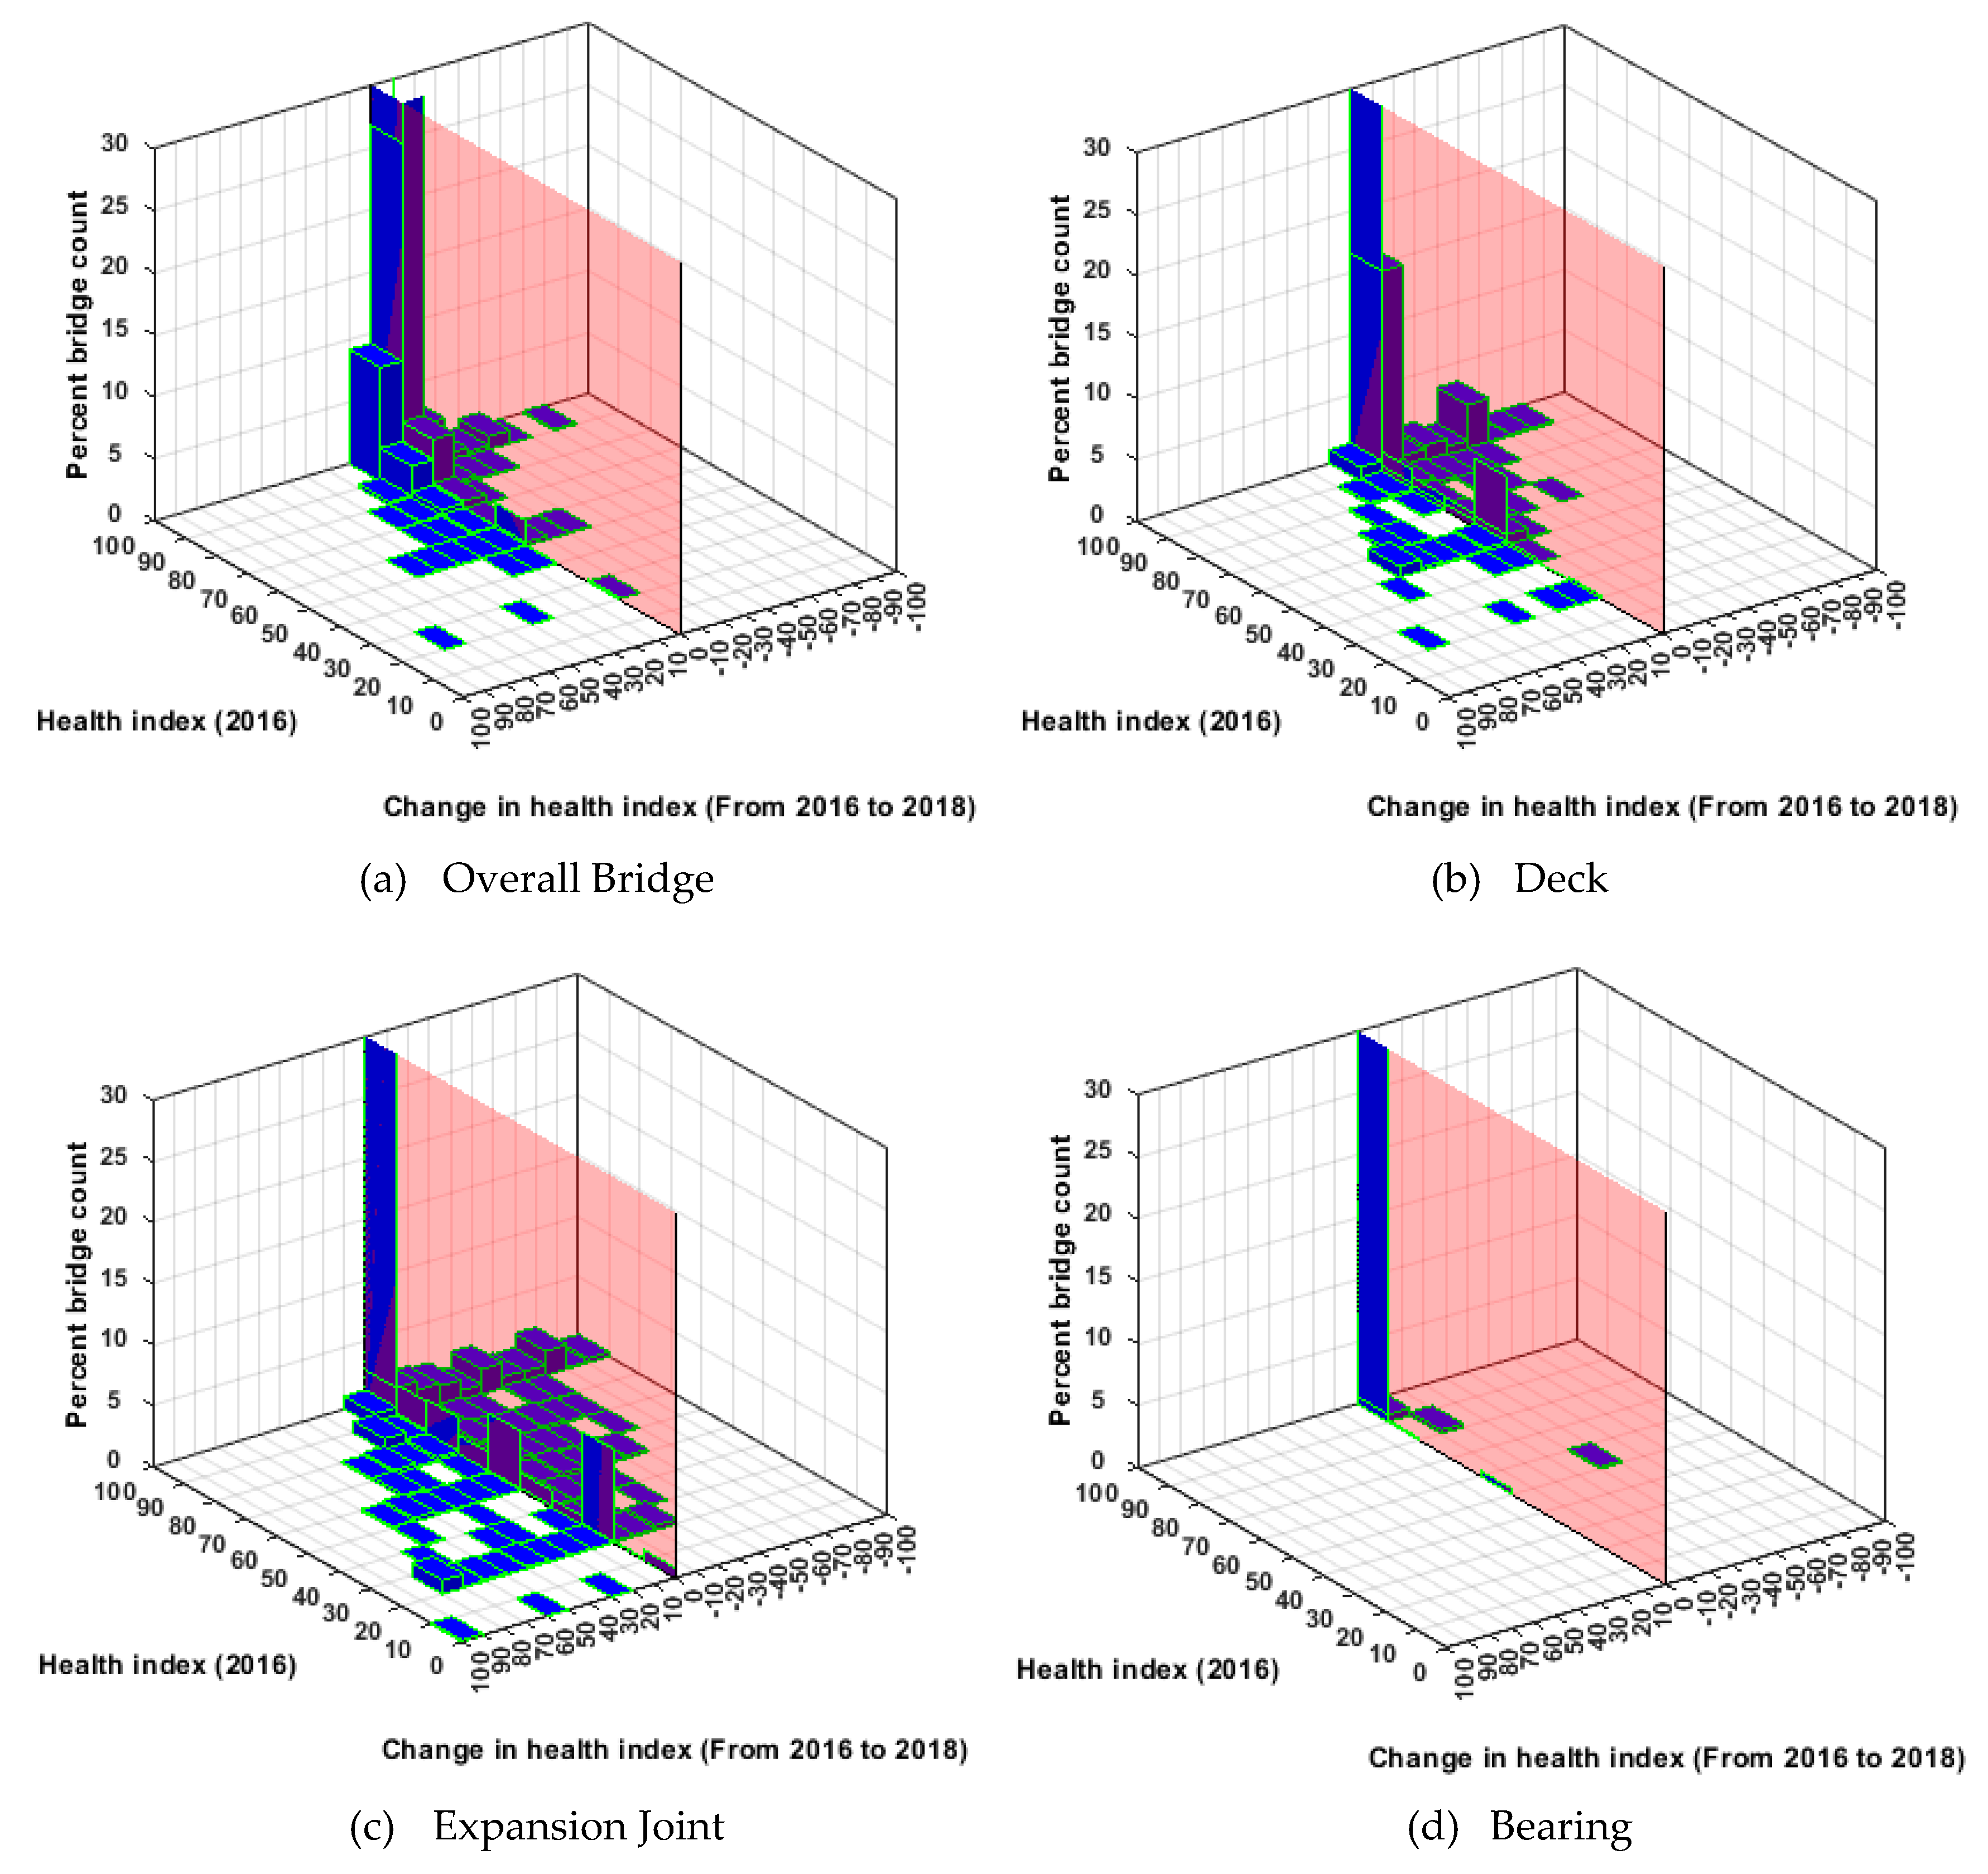
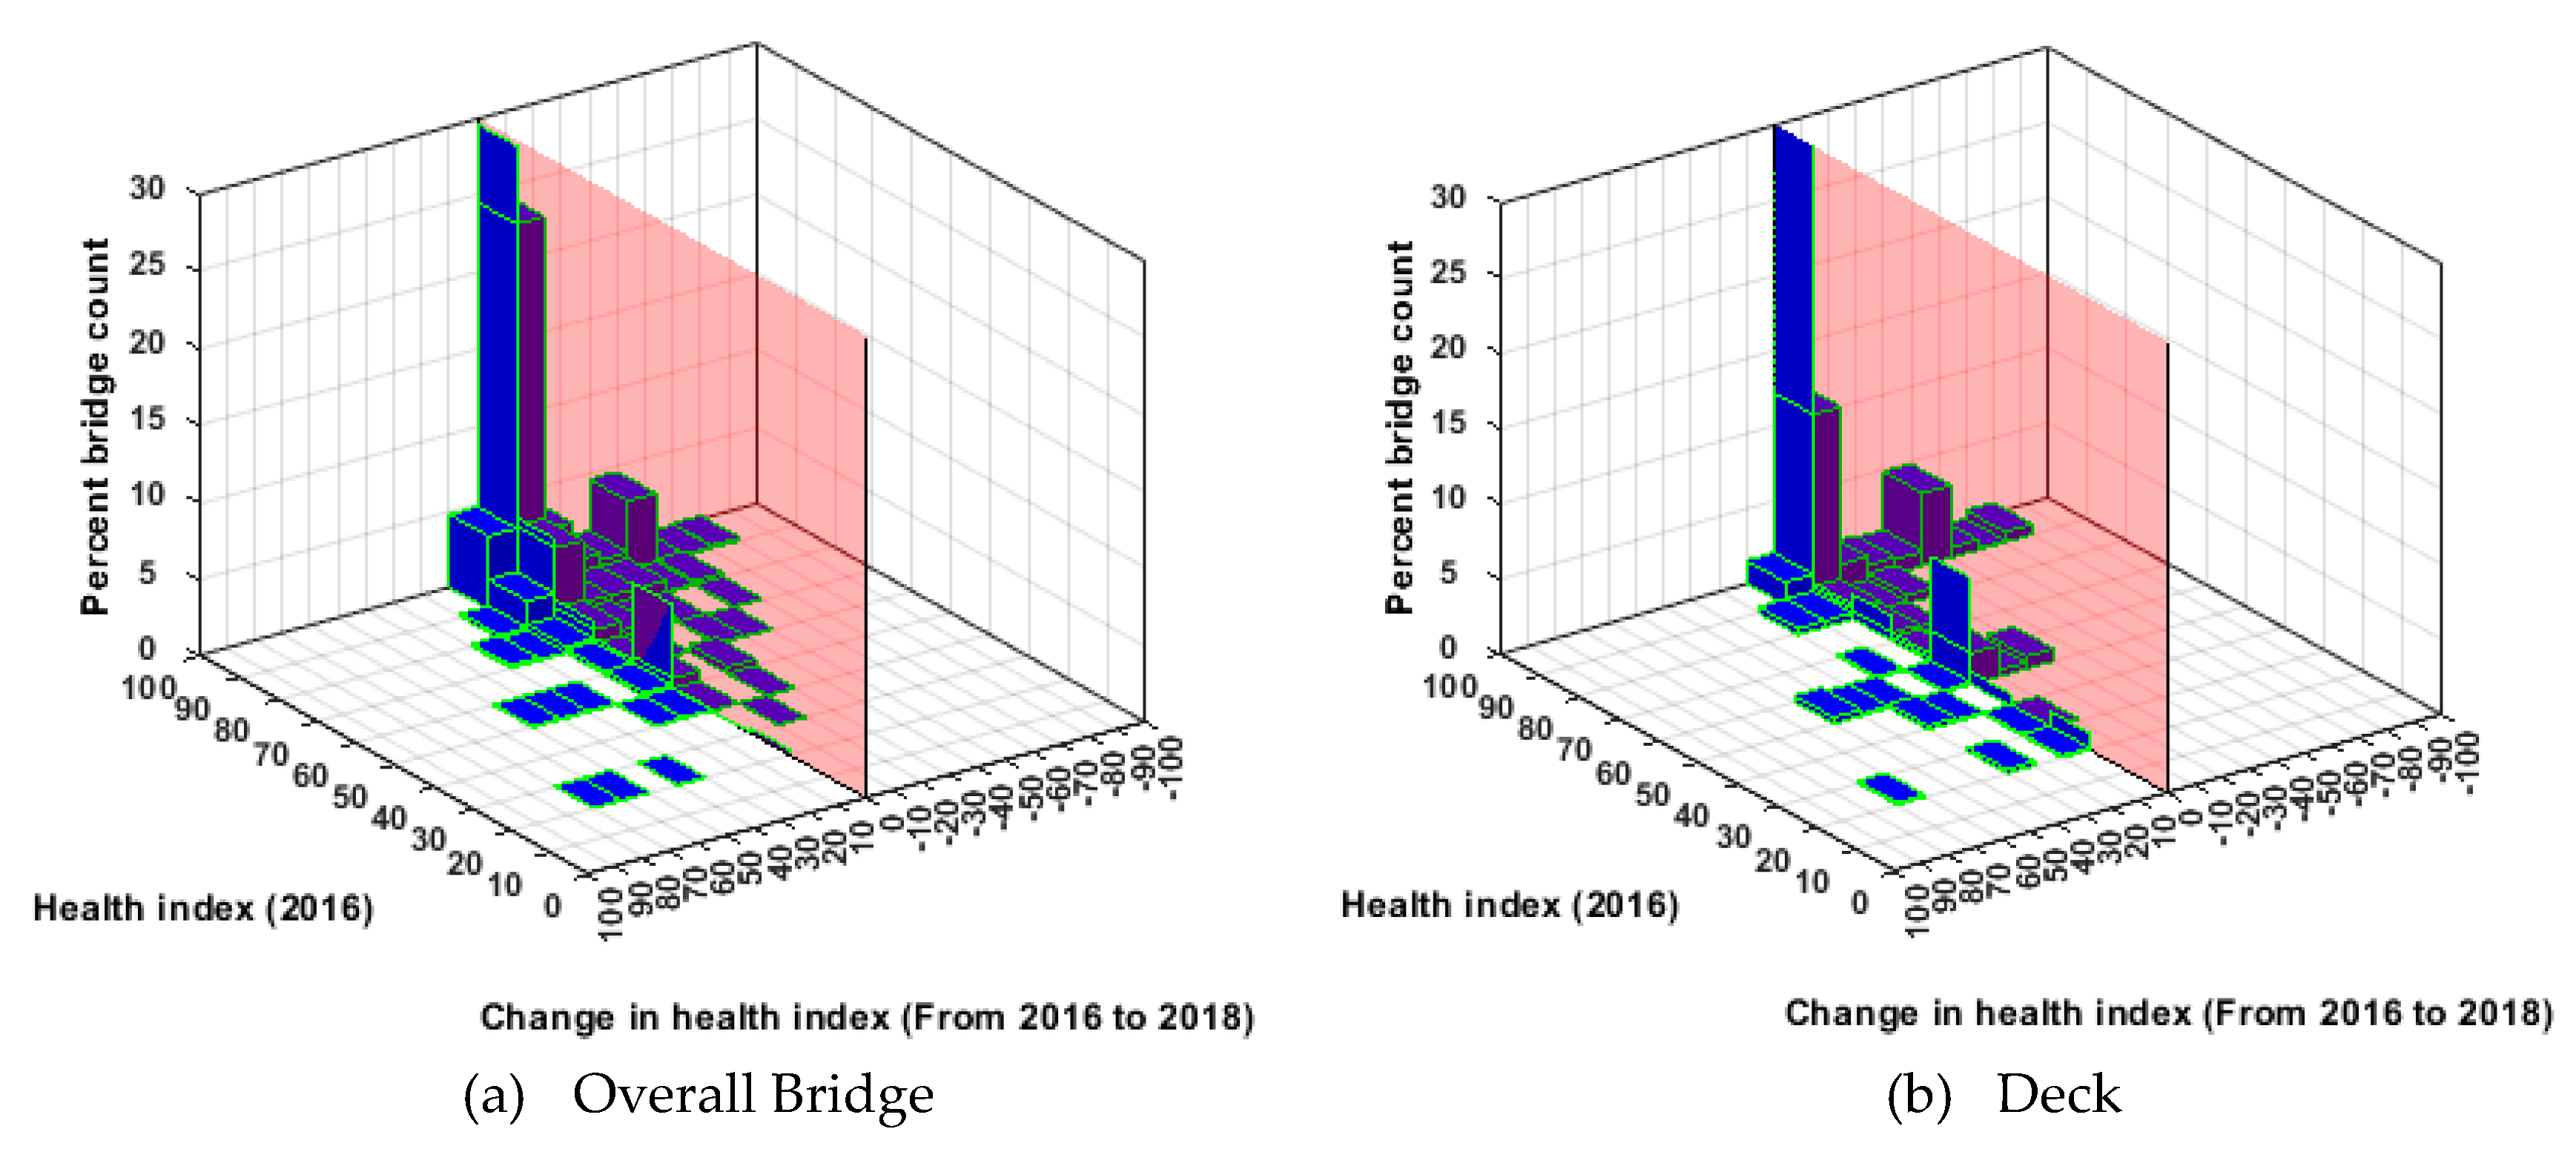
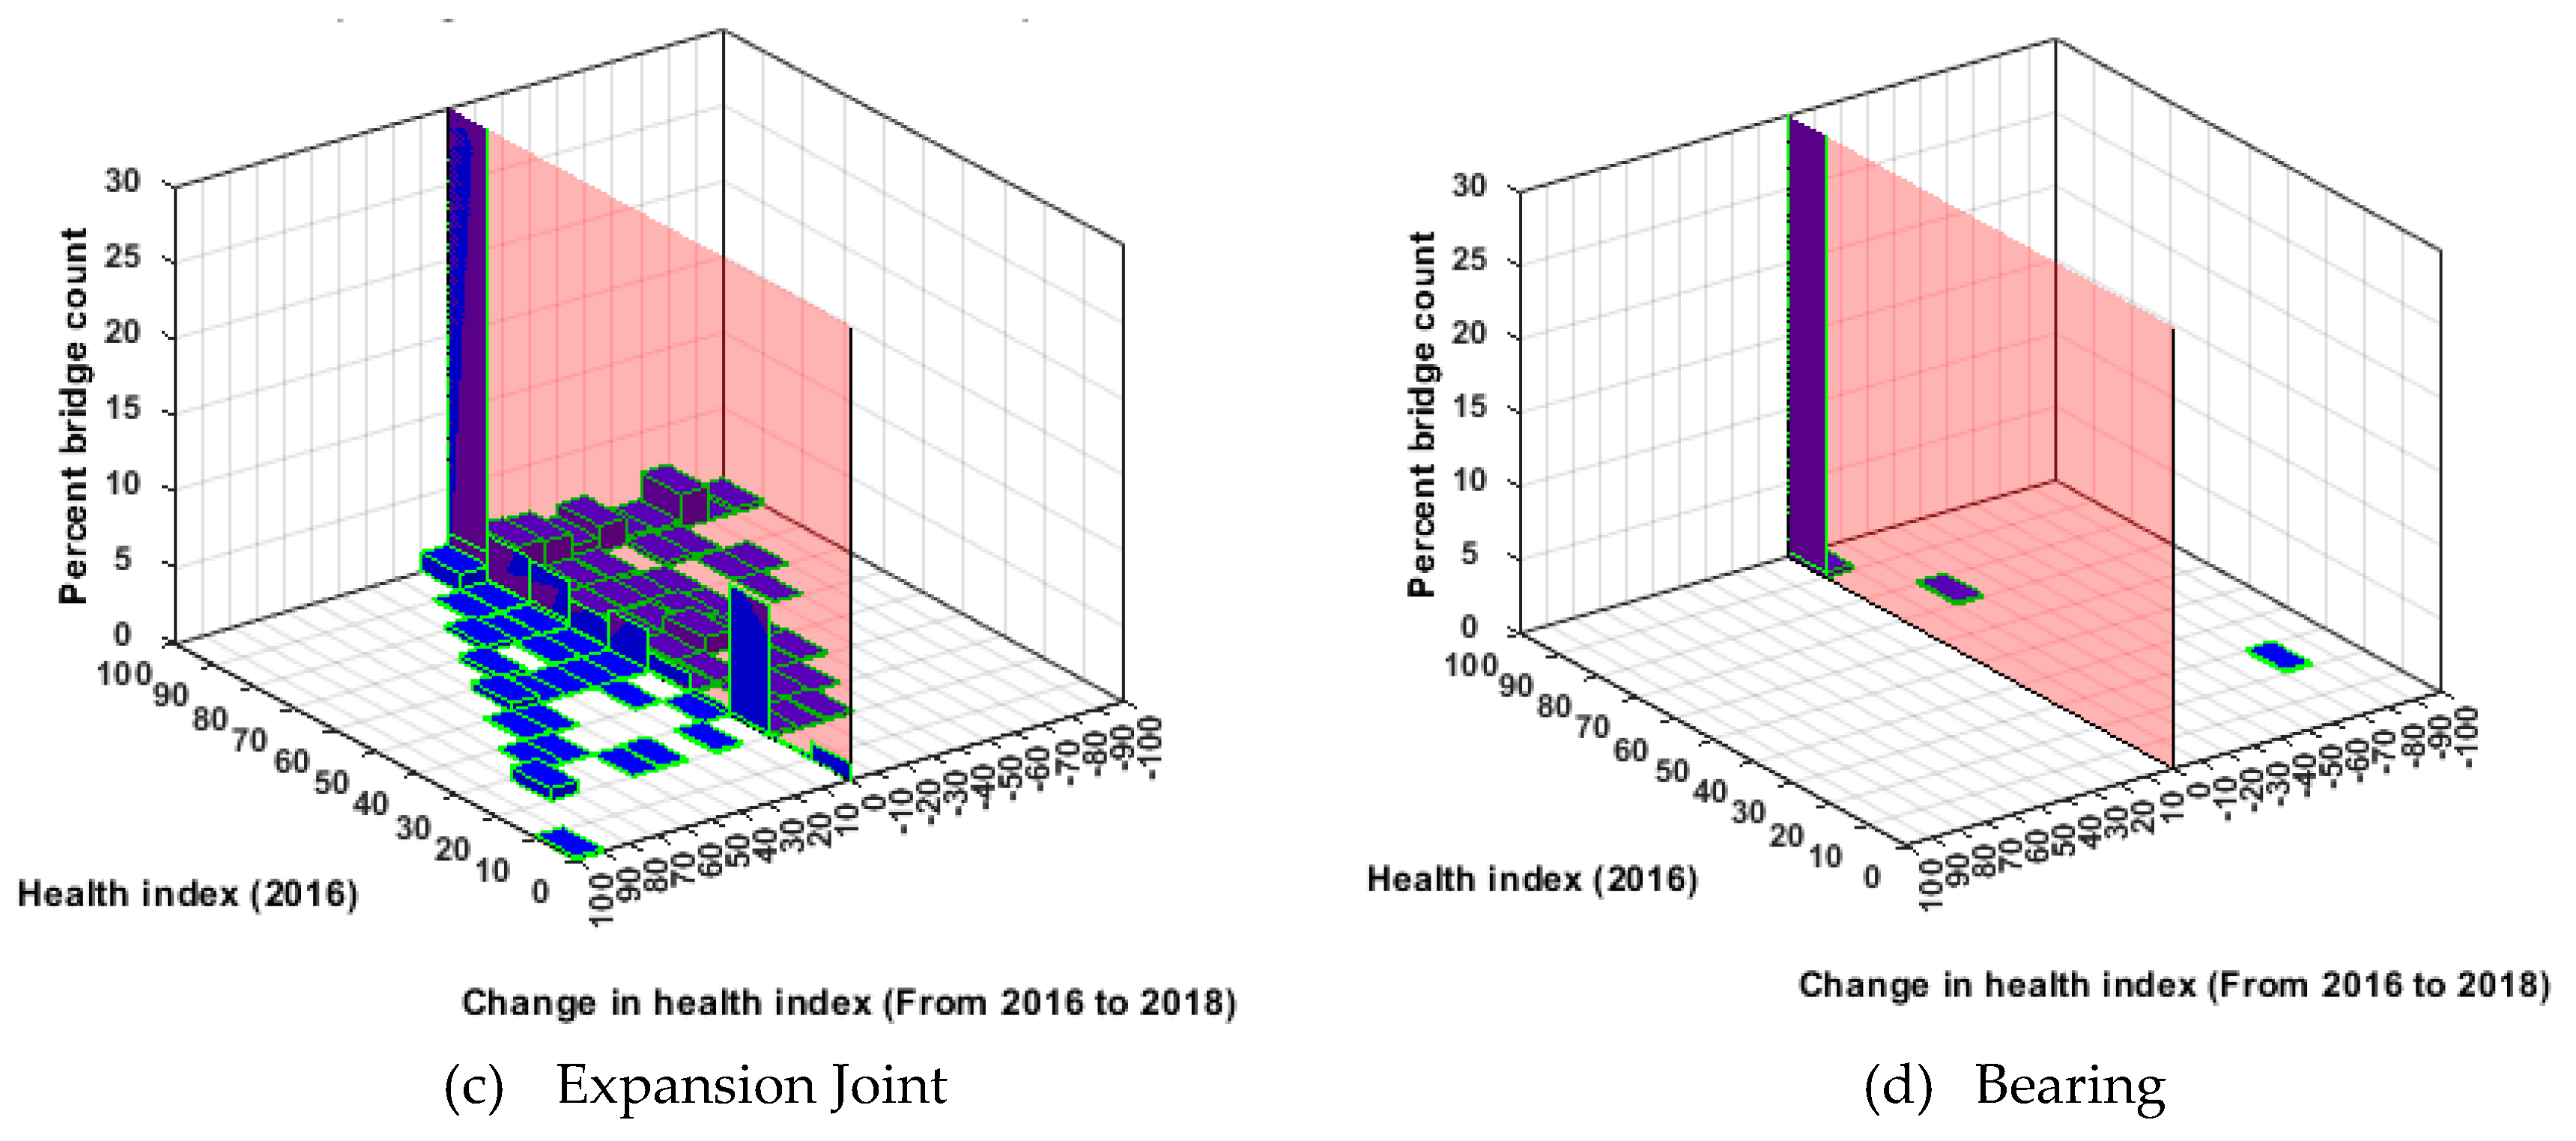
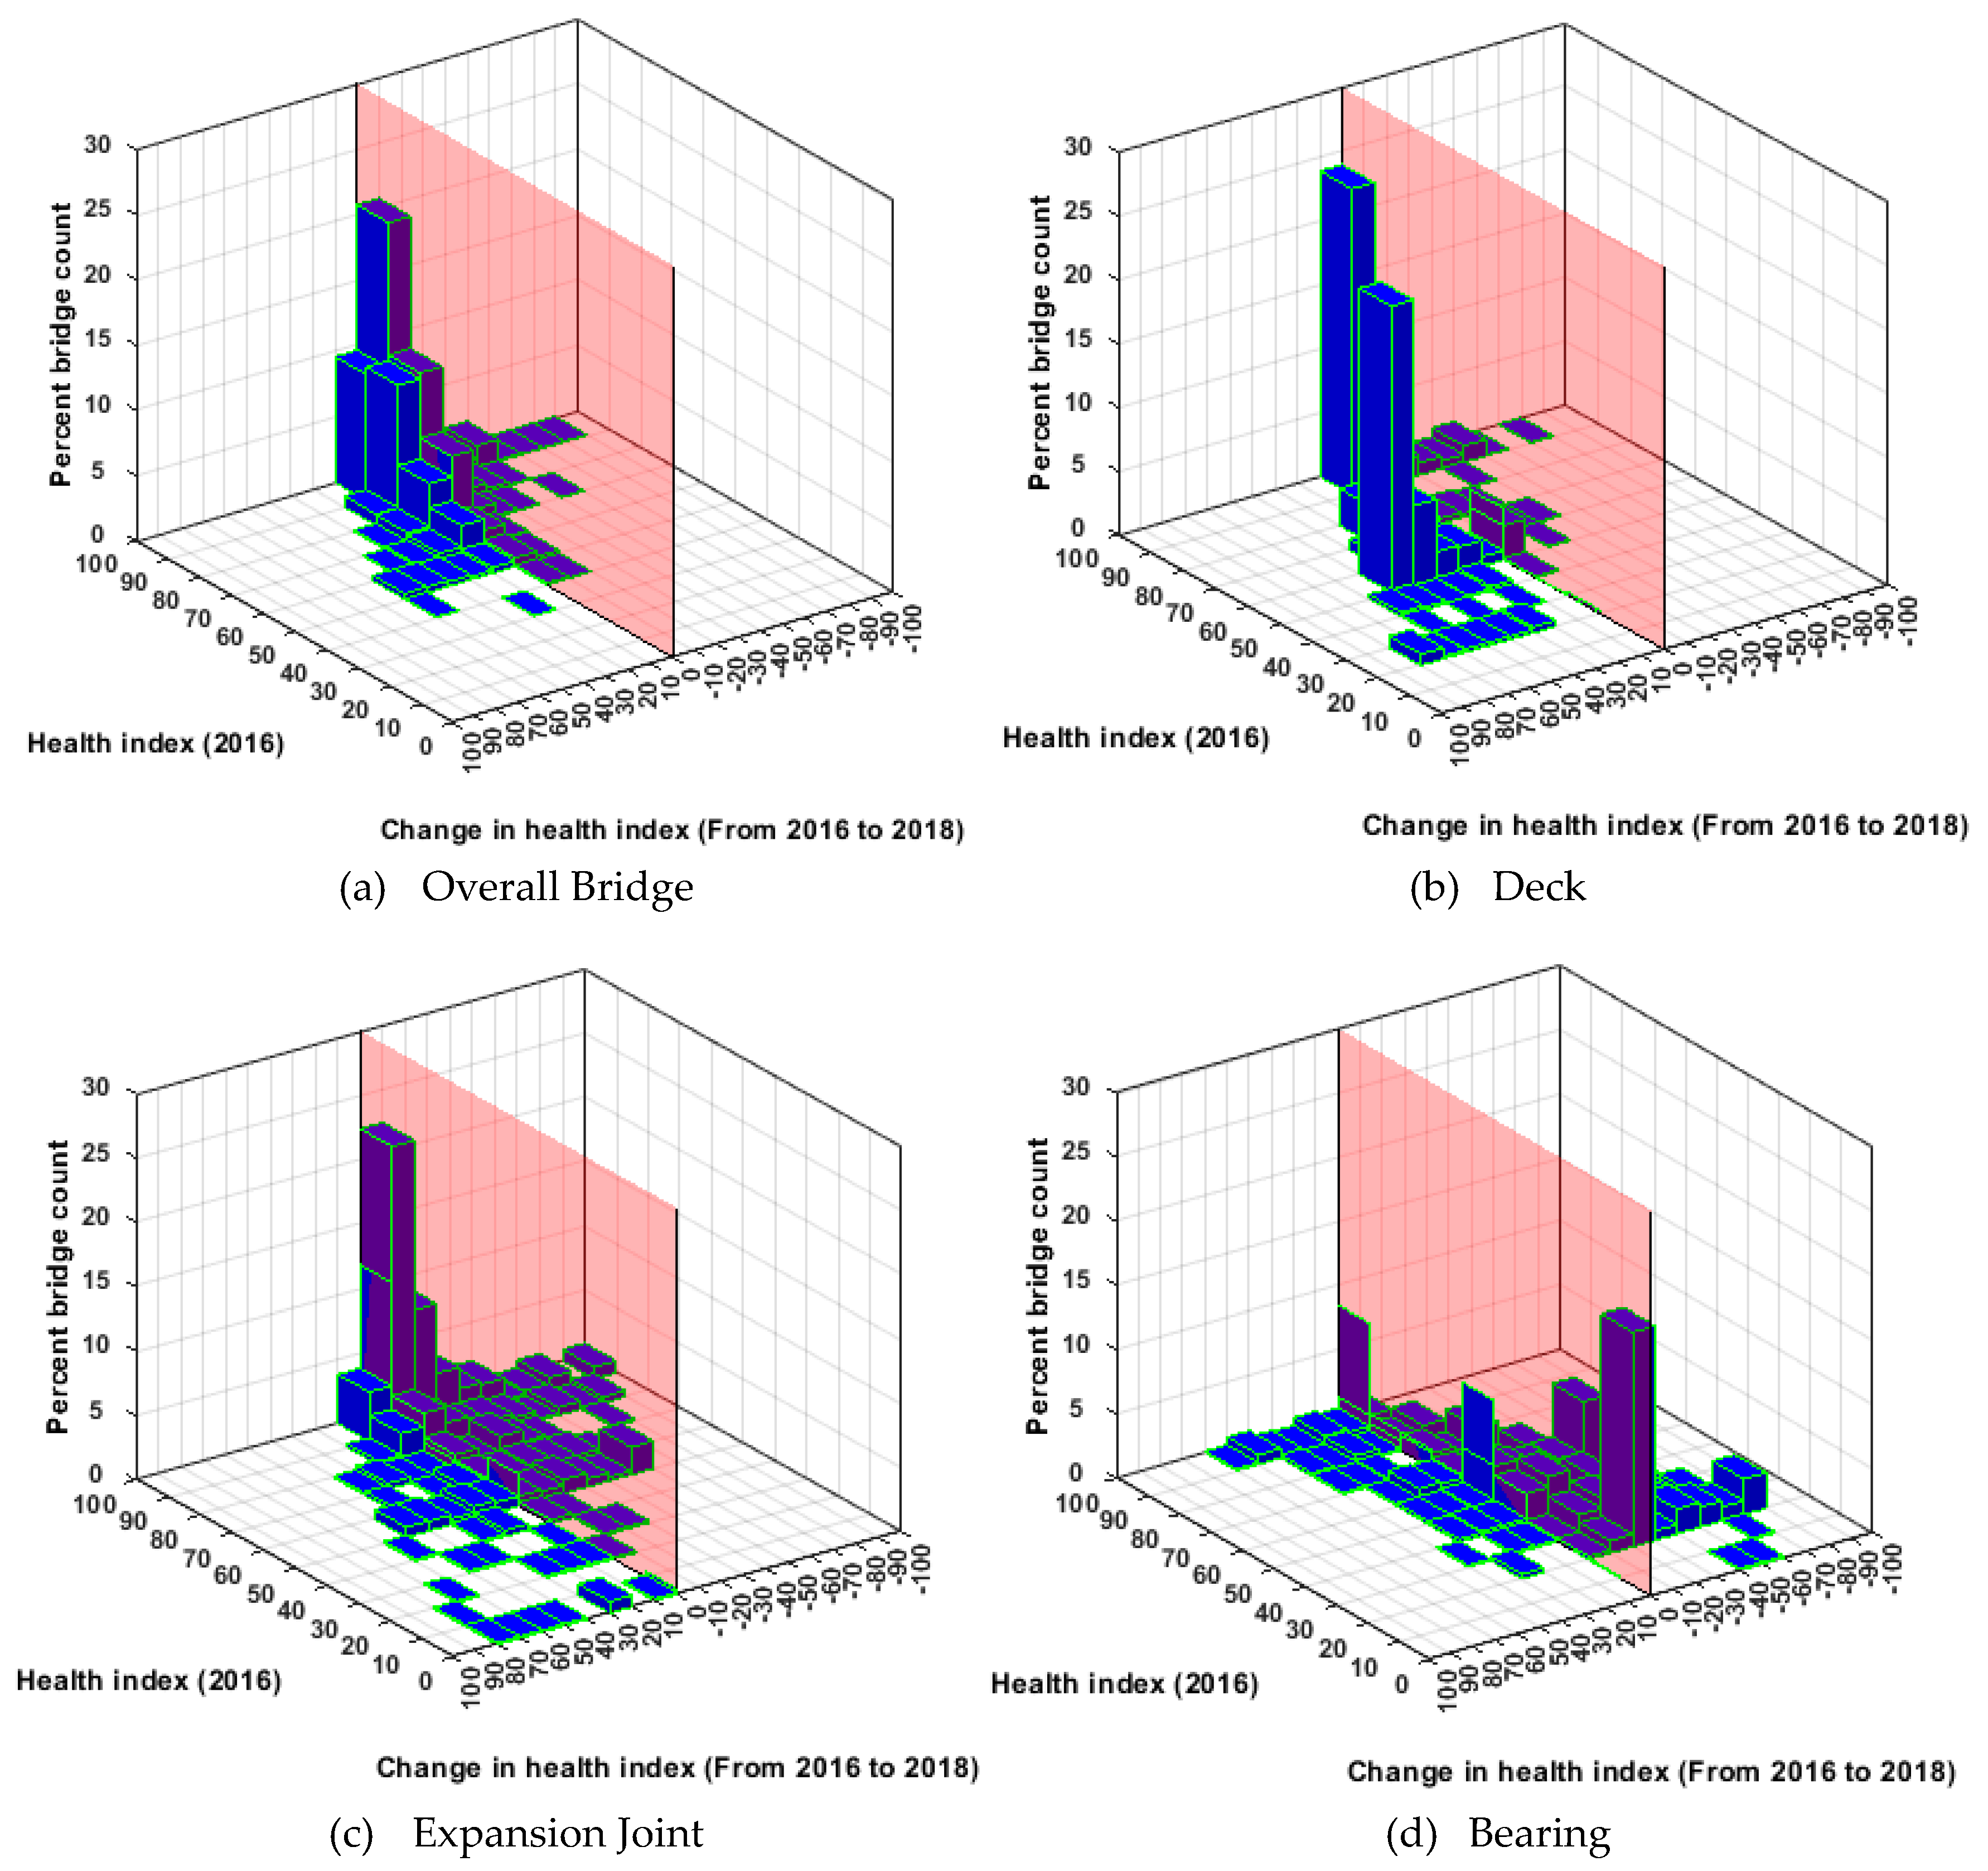
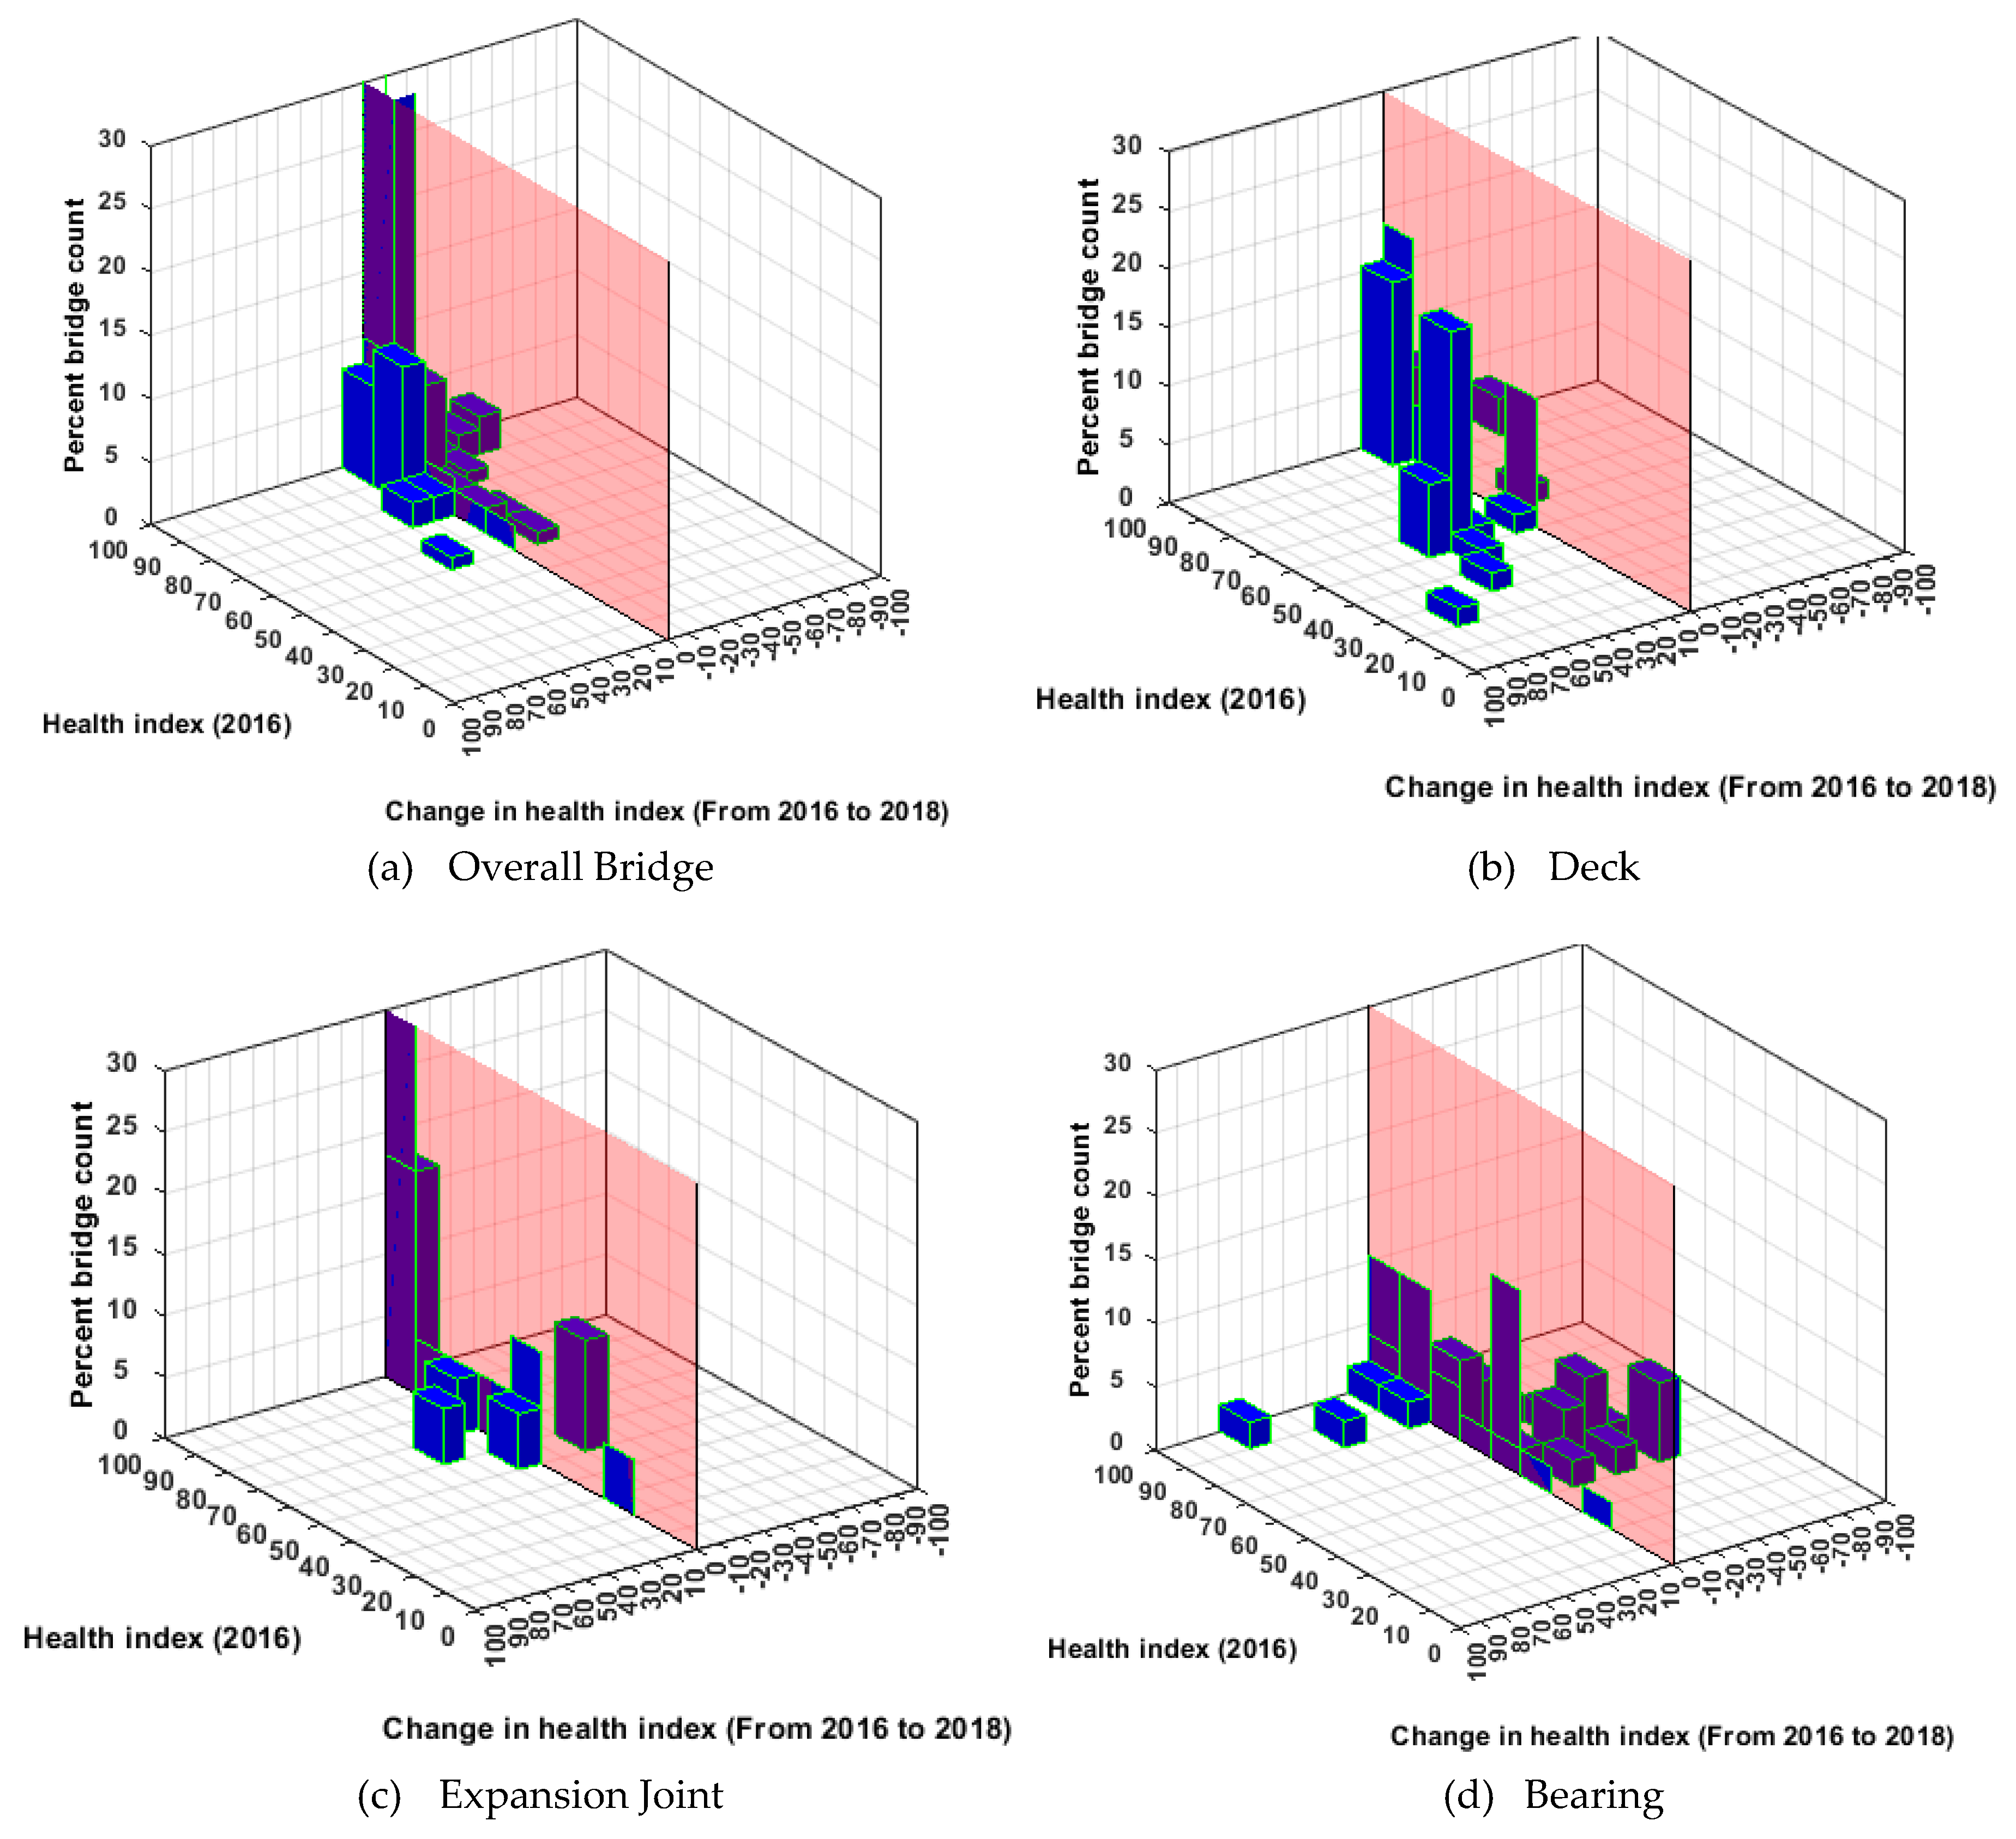
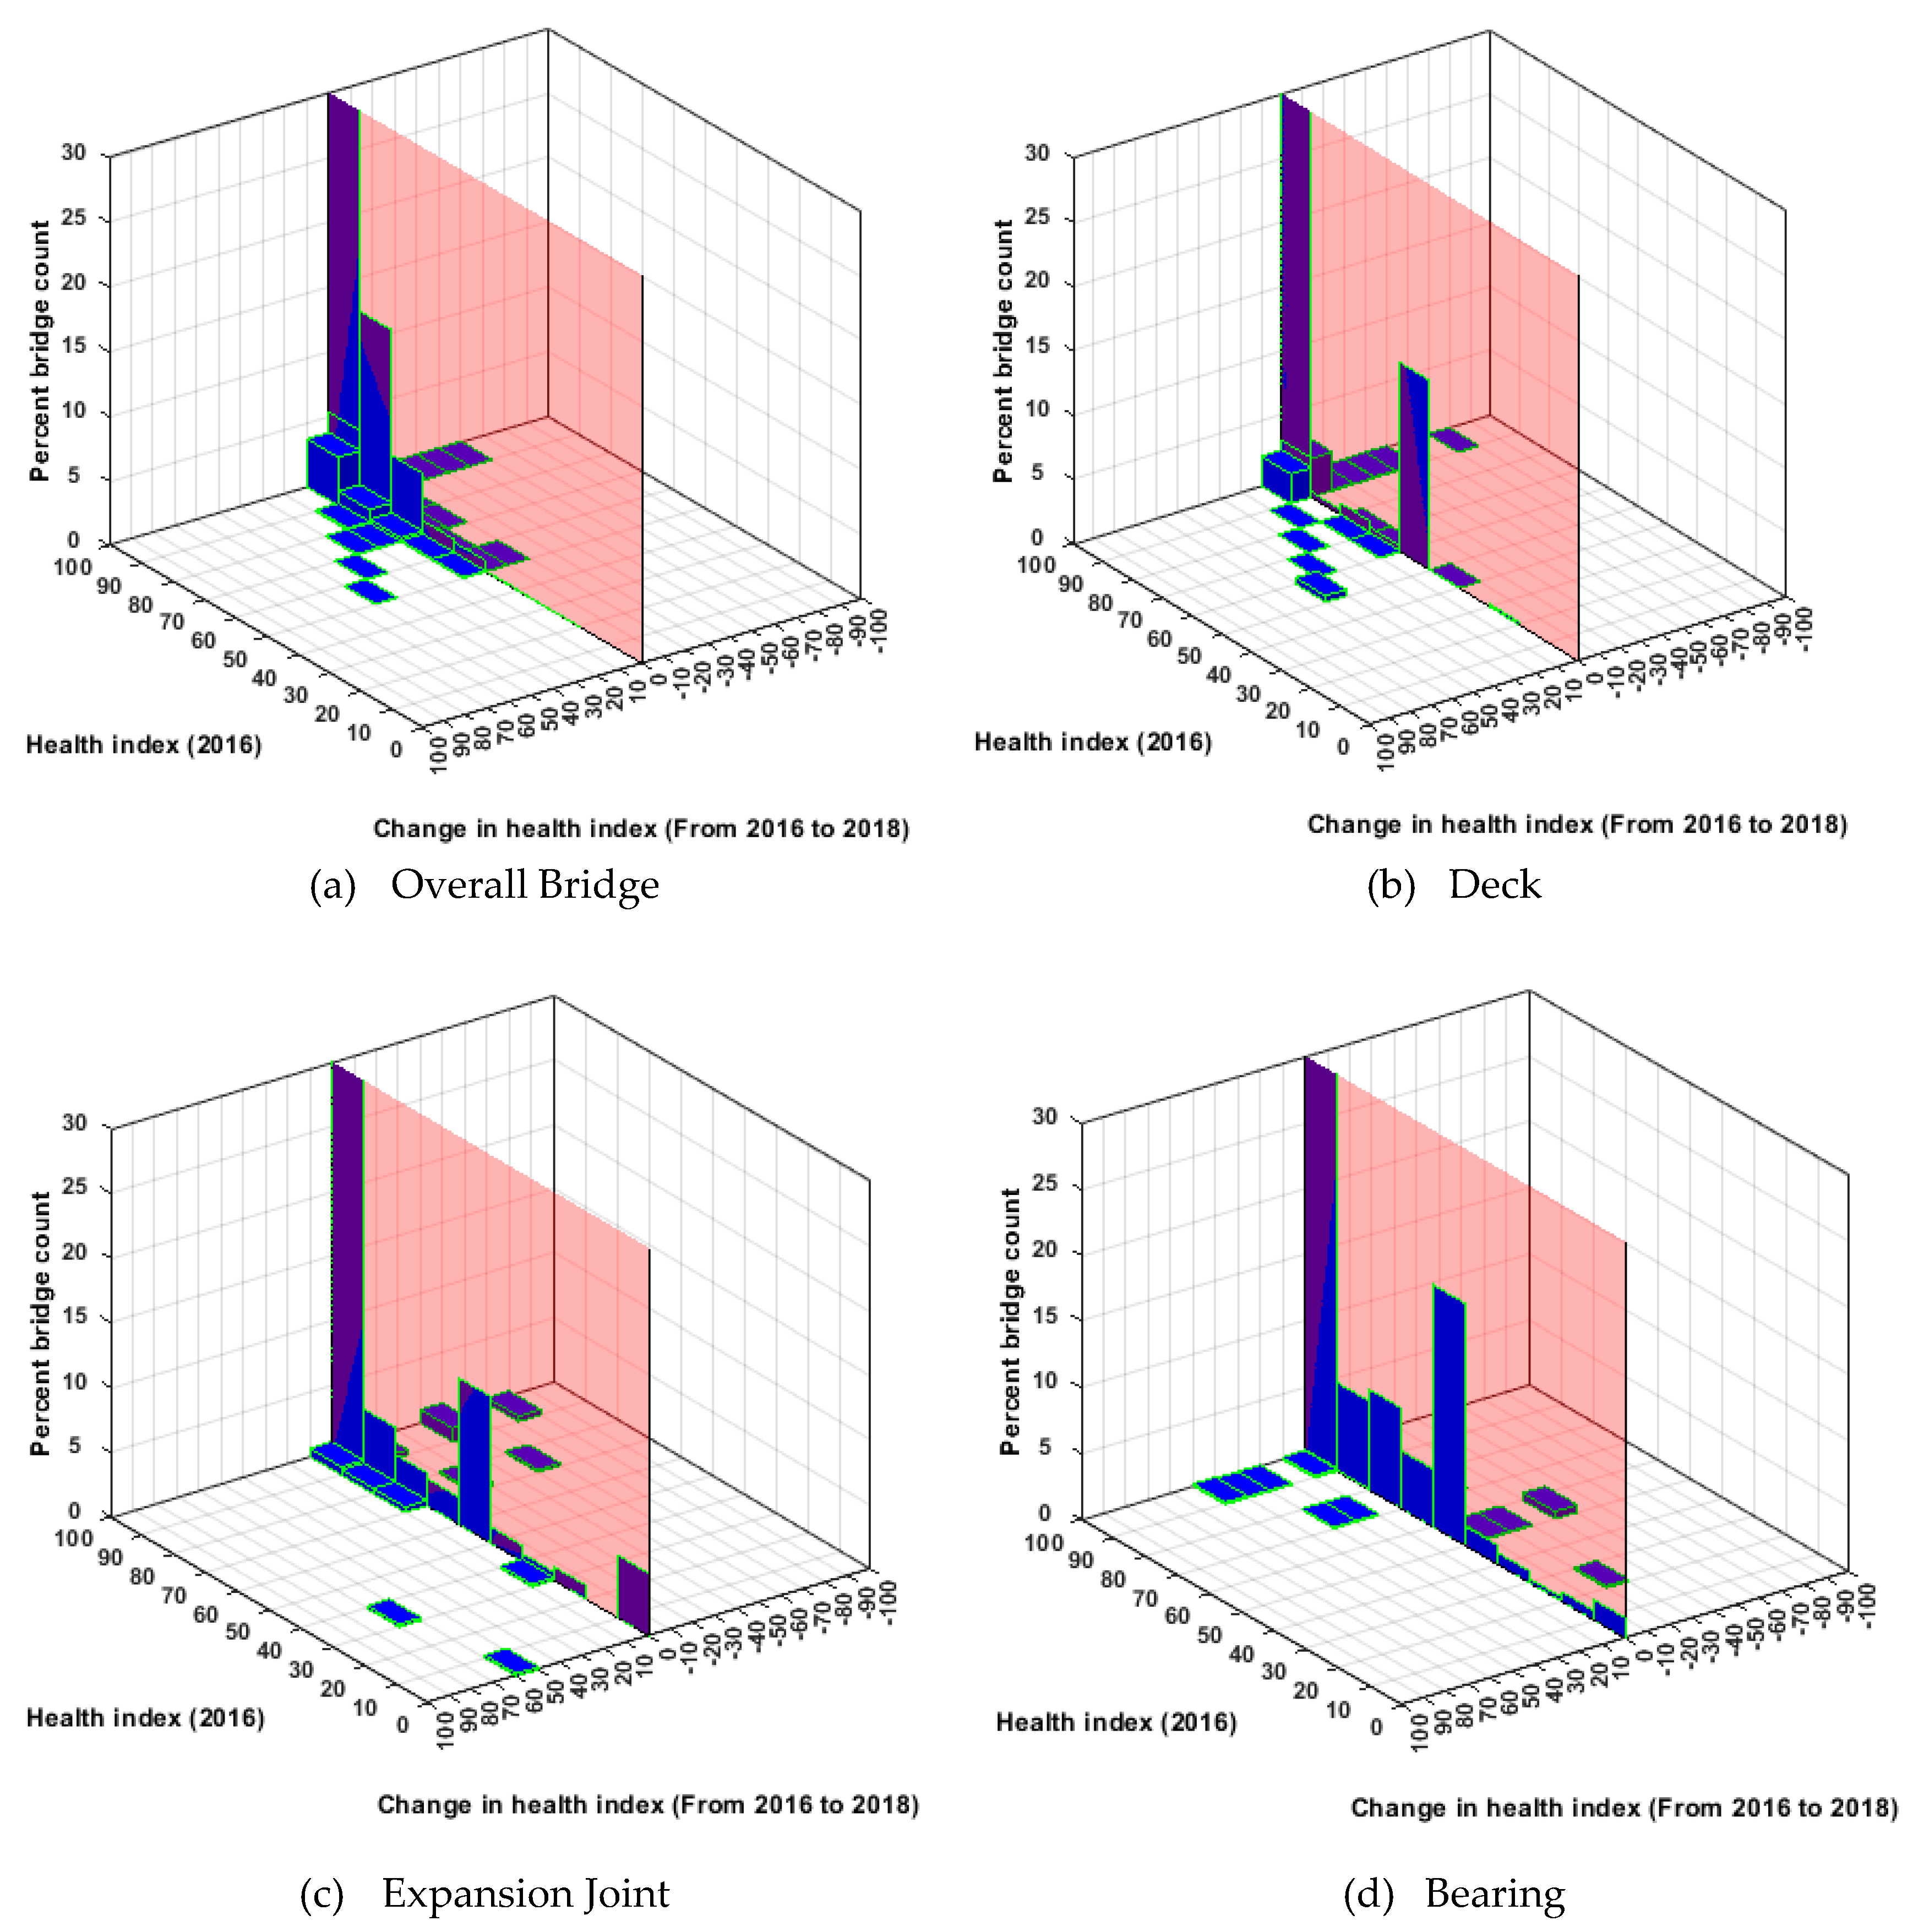
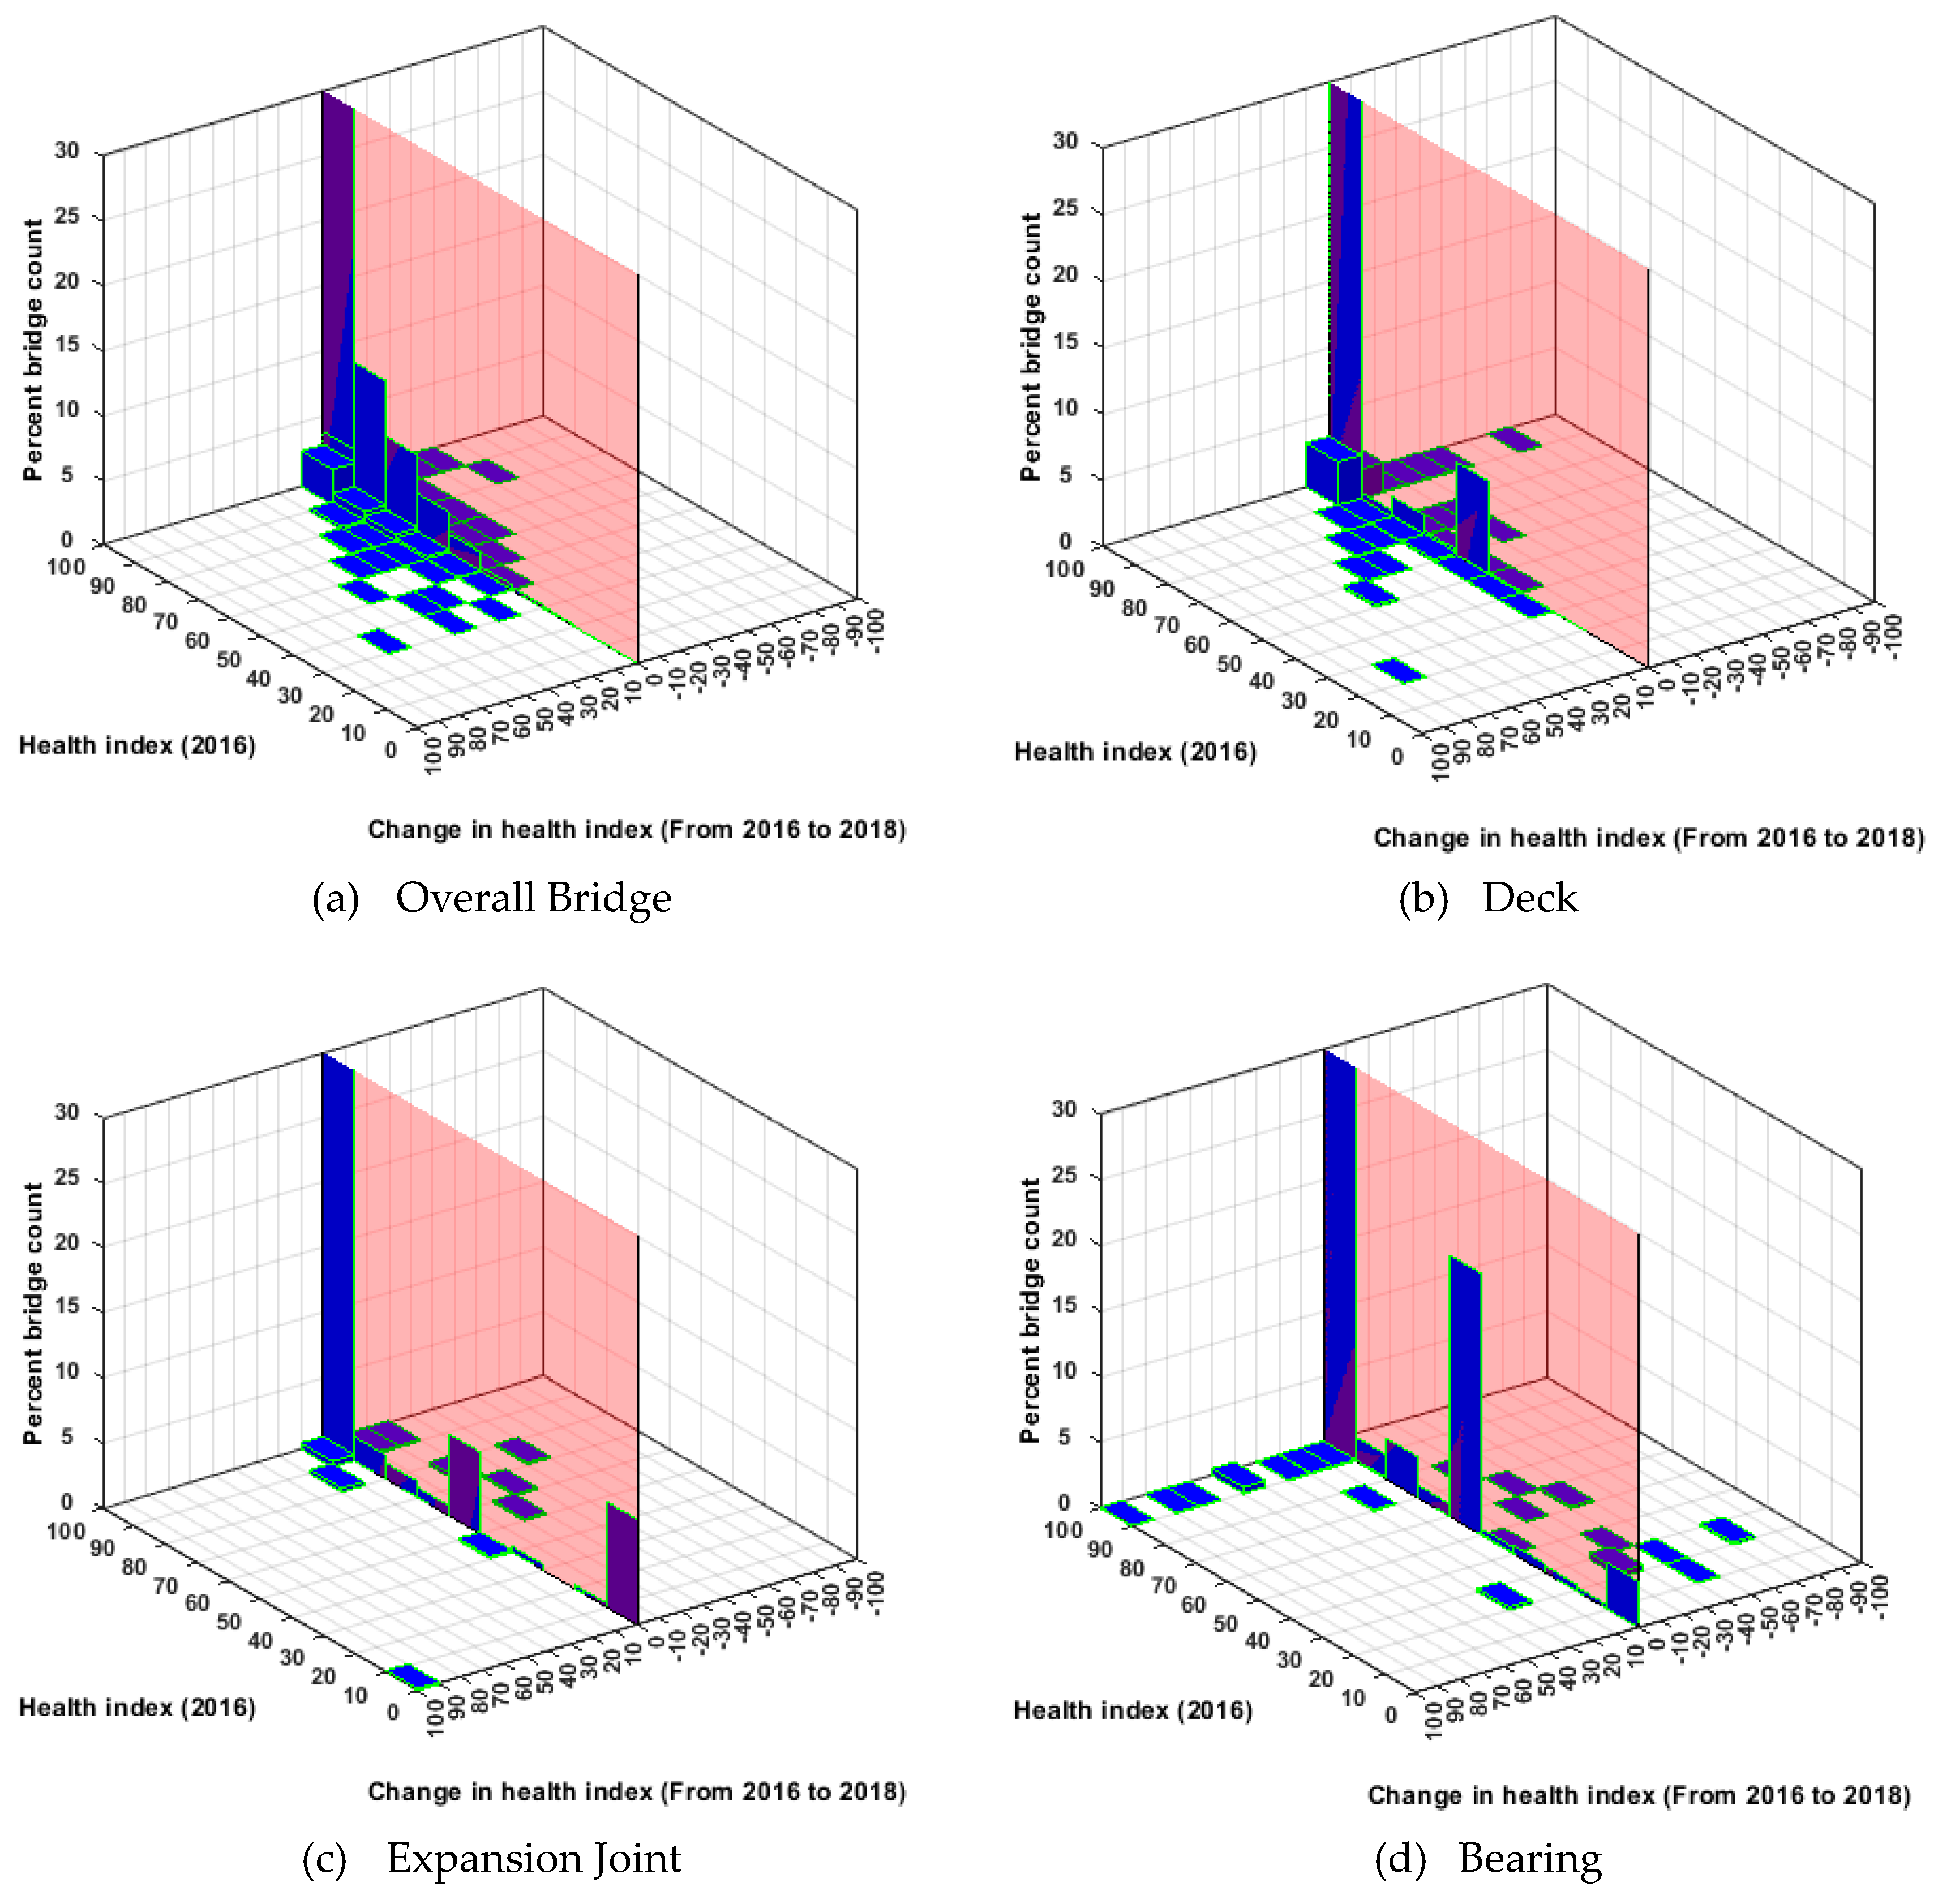
Figure 4 and
Figure 5 show changes in the health index (from 2016 to 2018) with respect to health indices in 2016, for NHS and non-NHS bridges. In comparison with NHS bridges, non-NHS but state-owned bridge performance and performance predictions are investigated. In the absence of a strategic incentive and resources, non-NHS bridges are not as well maintained as the NHS bridges (see
Figure 4 and
Figure 5). This may be attributed to the disparity in the available funding for the NHS and non-NHS bridges. NHS bridges receive federal funding, while the maintenance of non-NHS bridges is mostly funded by a state DOT.
Finally,
Figure 6 shows that the proposed co-active mechanism yields less conservative deterioration predictions. Therefore, the results presented in
Figure 2 were a more realistic comparison, which resulted in a 2–3-year service life extension for the bridges in Georgia.
3.2. Analysis of Virginia DOT’s Element Data
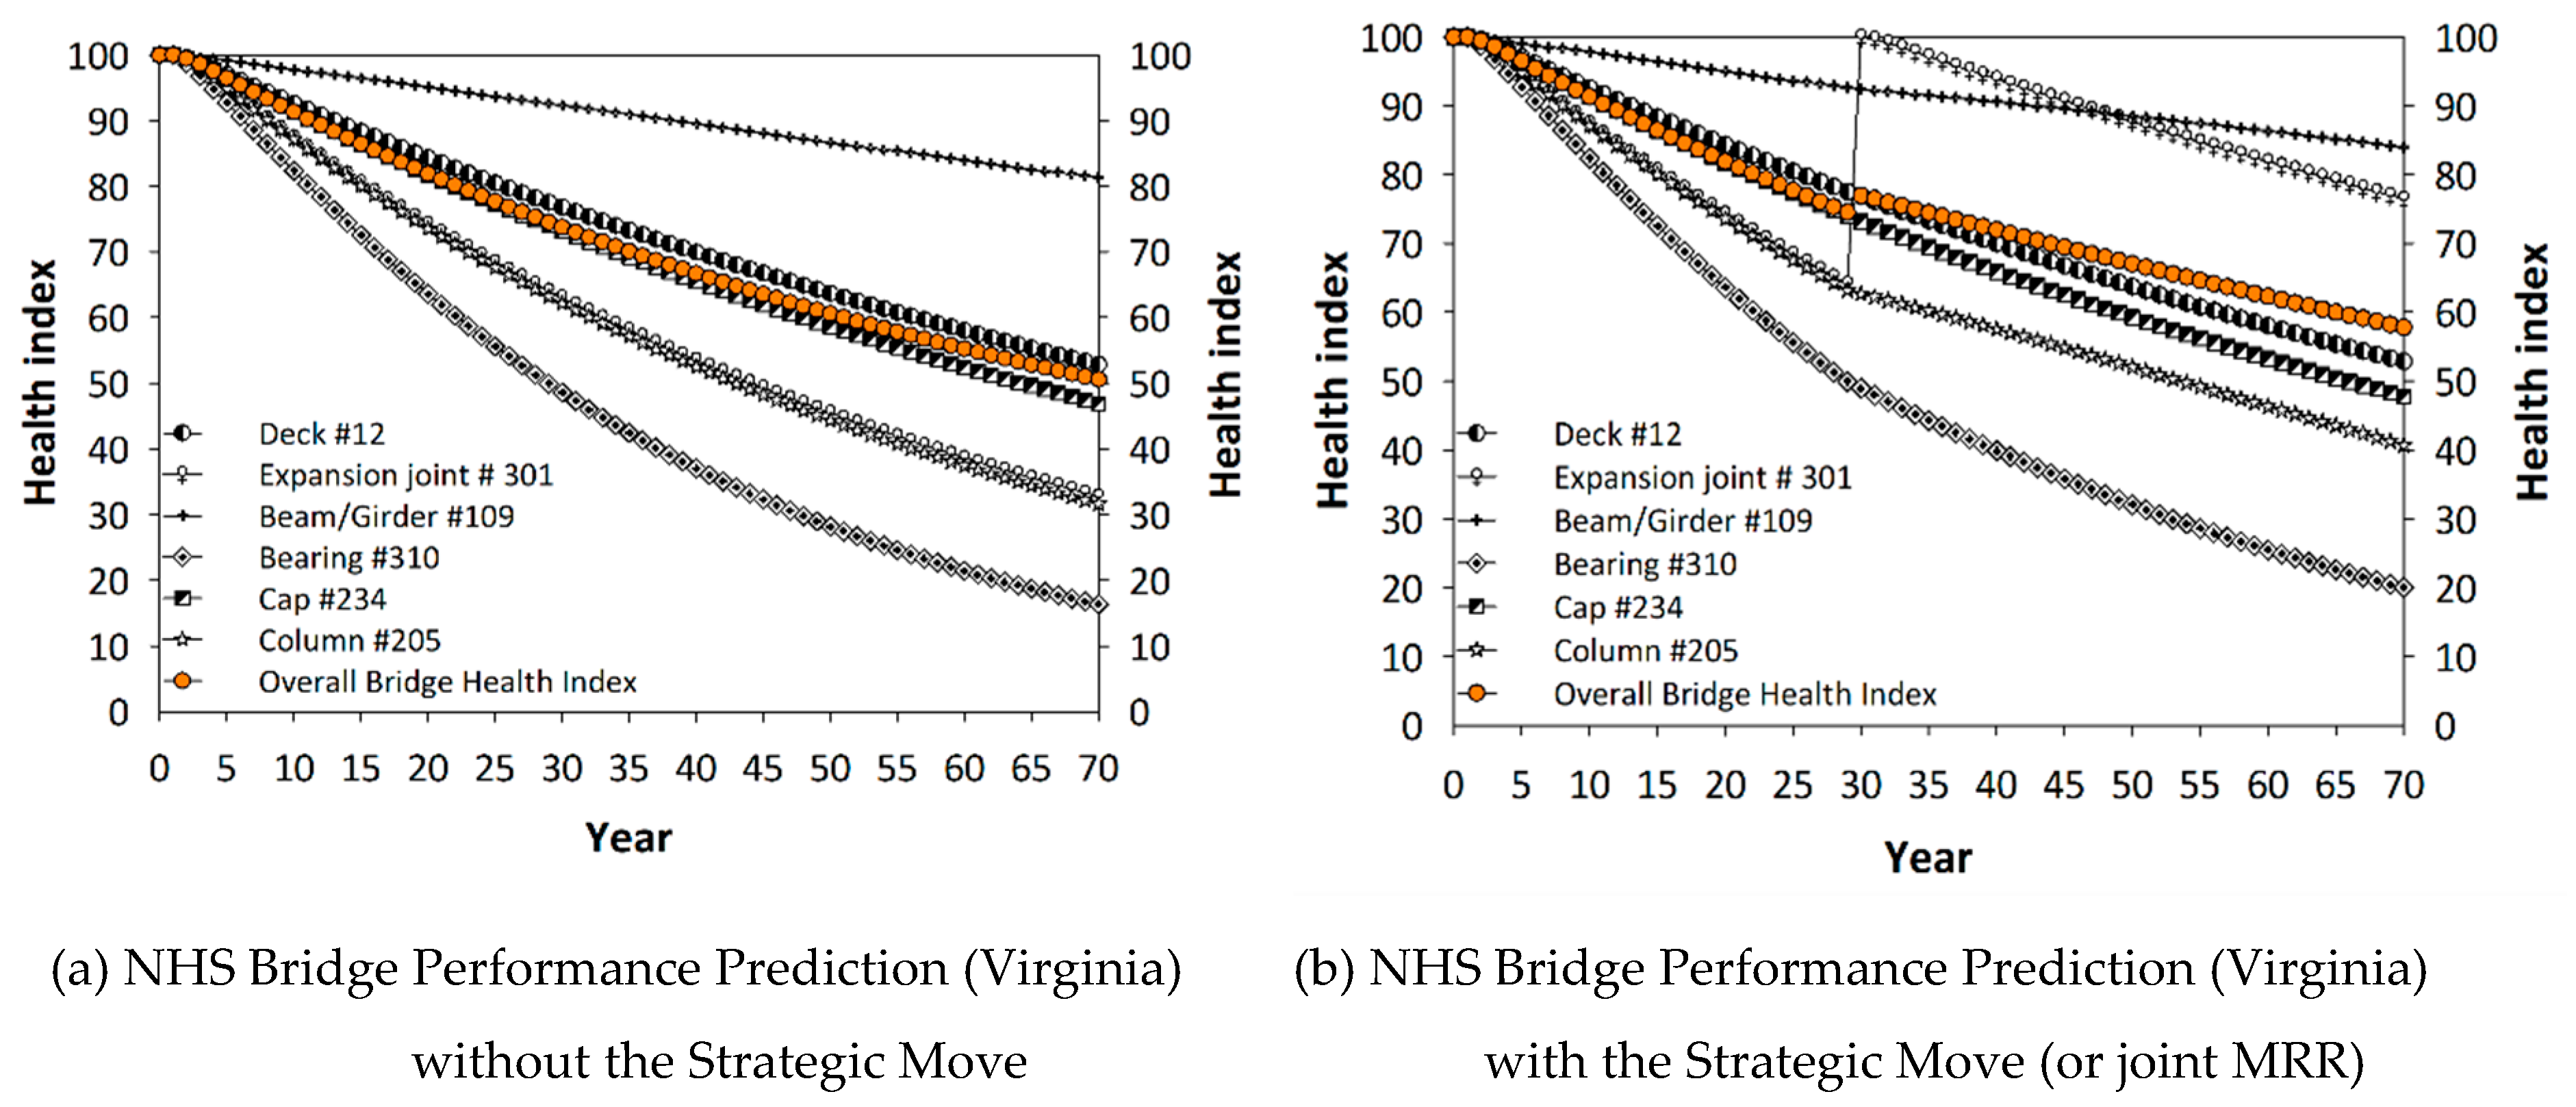
Figure 7a shows the average service life of NHS bridges in Virginia when no joints are rehabilitated or replaced.
Figure 7b presents the bridge performance when additional resources are allocated to expansion joints and joint sealant rehabilitation and/or replacements, which is the strategic move investigated in this study. The co-active model is used in this figure. The average service life was extended by 10 years because the service life is 35 and 45 years in
Figure 7a,b, respectively, for the health index threshold of 70.
Table 1 summarizes the payoff of the players for existing and new strategies.
Figure 7a,c show that NHS and non-NHS bridges in Virginia are depreciating faster than similar bridges in Georgia (see
Figure 2a,c). However, the co-active model yields a similar service life extension of 10 years for Virginia and Georgia. This is due to the differences in the values of the co-active coefficients computed for the two states. They are data-driven factors. Although bridges in Virginia are depreciating faster than those in Georgia, the elements’ co-active coefficients are relatively lower. States with relatively lower health indices are more likely to benefit from the co-active mechanism identified from its element-based inspection database.
Similarly, non-NHS but state-owned bridge performance and performance predictions were investigated, in comparison with NHS bridges. In the absence of a strategic incentive and resources, non-NHS bridges are not as well maintained as the NHS bridges (see
Figure 8 and
Figure 9). Finally,
Figure 10 shows that the proposed co-active mechanism yields less conservative (and possibly more realistic) deterioration predictions.
3.3. Analysis of Pennsylvania DOT’s Element Data
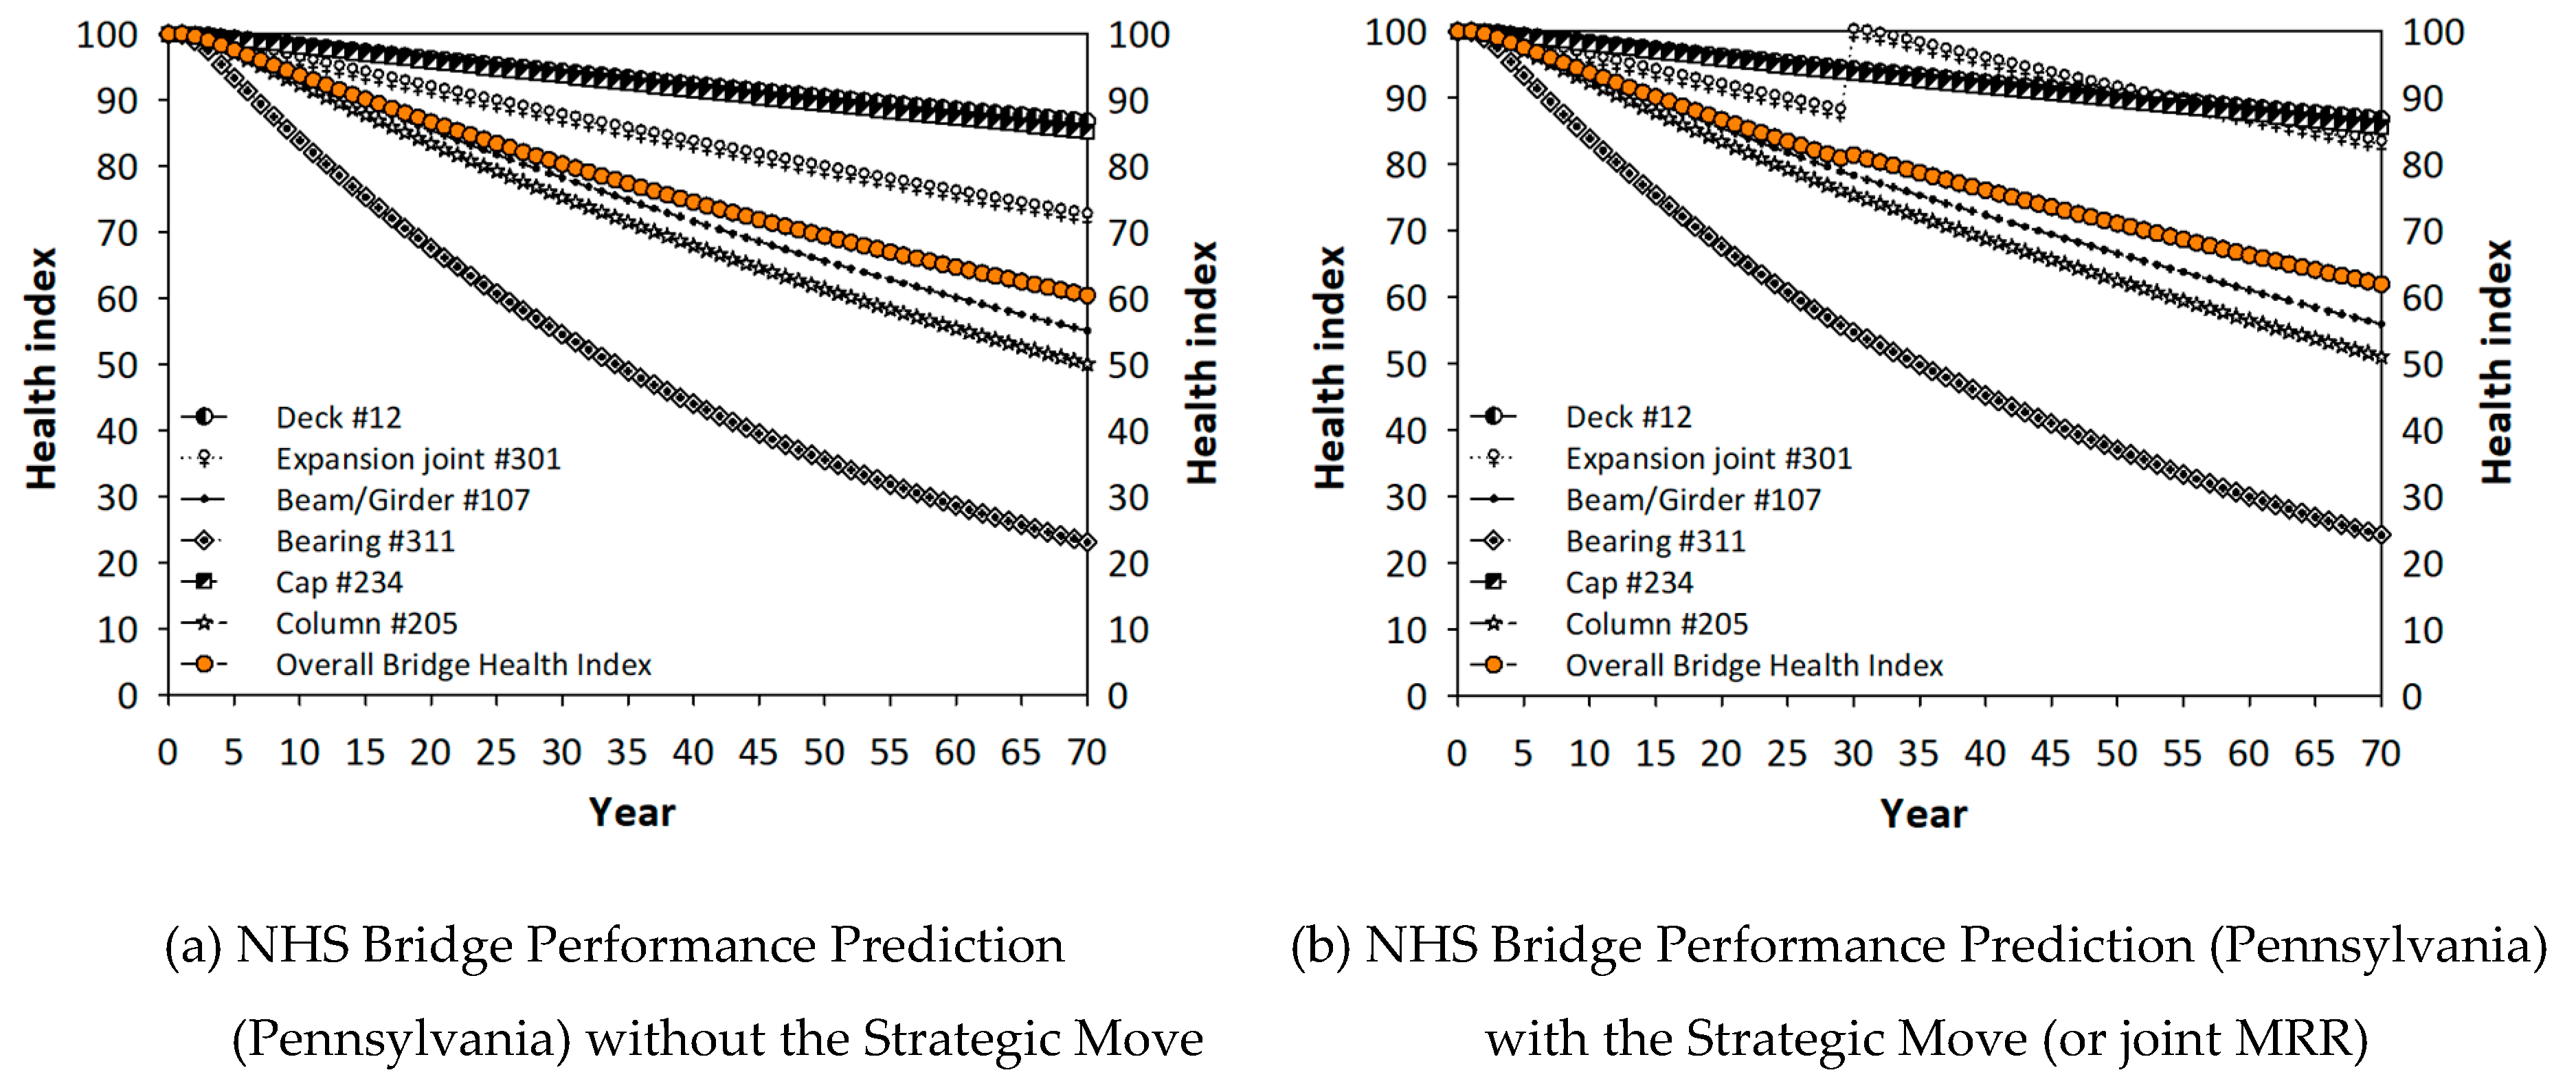
Figure 11a shows the average service life of NHS bridges in Pennsylvania when no joints are rehabilitated or replaced.
Figure 11b presents the NHS bridge performance when additional resources are allocated to expansion joints and joint sealant rehabilitation and/or replacements. The co-active model is used in this figure. The average service life was extended by 5 years because the service life is 50 and 55 years in
Figure 11a,b, respectively, for the HI threshold of 70.
Table 1 summarizes the payoff of the players for existing and new strategies.
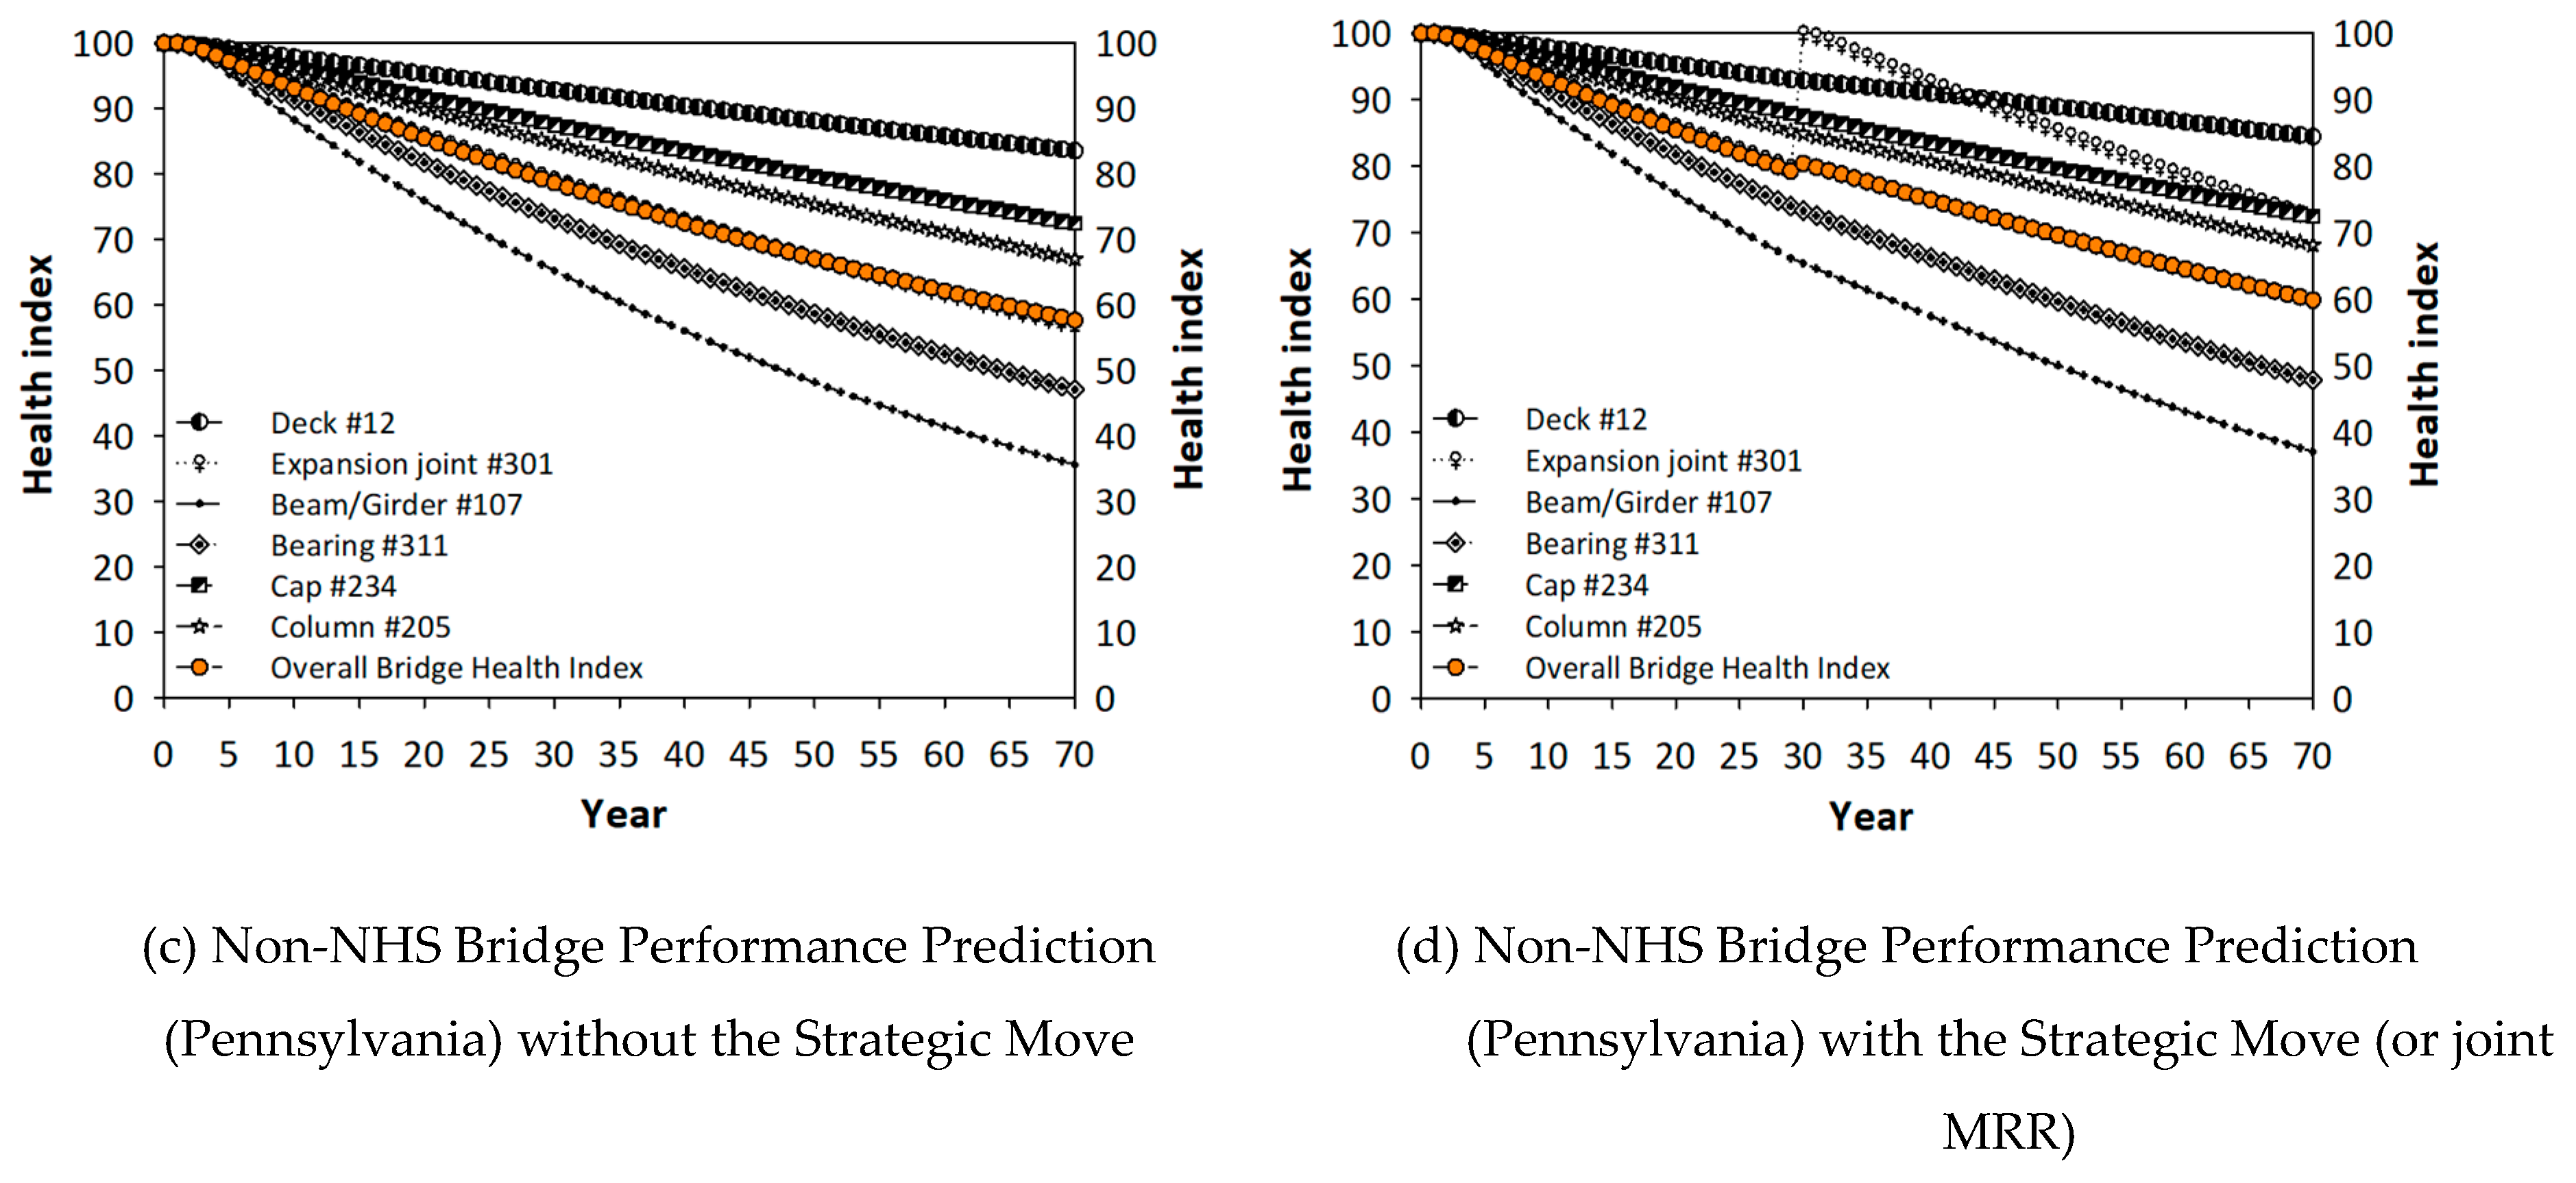
In
Figure 12 and
Figure 13, the performances of NHS bridges are compared with the non-NHS but state-owned bridge performance. In the absence of a strategic incentive and resources, non-NHS bridges are not as well maintained as the NHS bridges. However, the disparities in the performances of the NHS and non-NHS bridges in Pennsylvania (
Figure 12 and
Figure 13) are relatively less significant than in the state of Georgia (see
Figure 4 and
Figure 5). Factors, such as traffic volume (ADDT), bridge geographical location, bridge design, and bridge construction materials, might also be responsible for the disparities in the performances of the NHS and non-NHS bridges. Future research should therefore investigate how these factors affect NHS and non-NHS bridge performances, and the possible variation in the effects across the United States.
Finally,
Figure 14 shows that the proposed co-active mechanism yields less conservative deterioration predictions.
3.4. Analysis of New York DOT’s Element Data
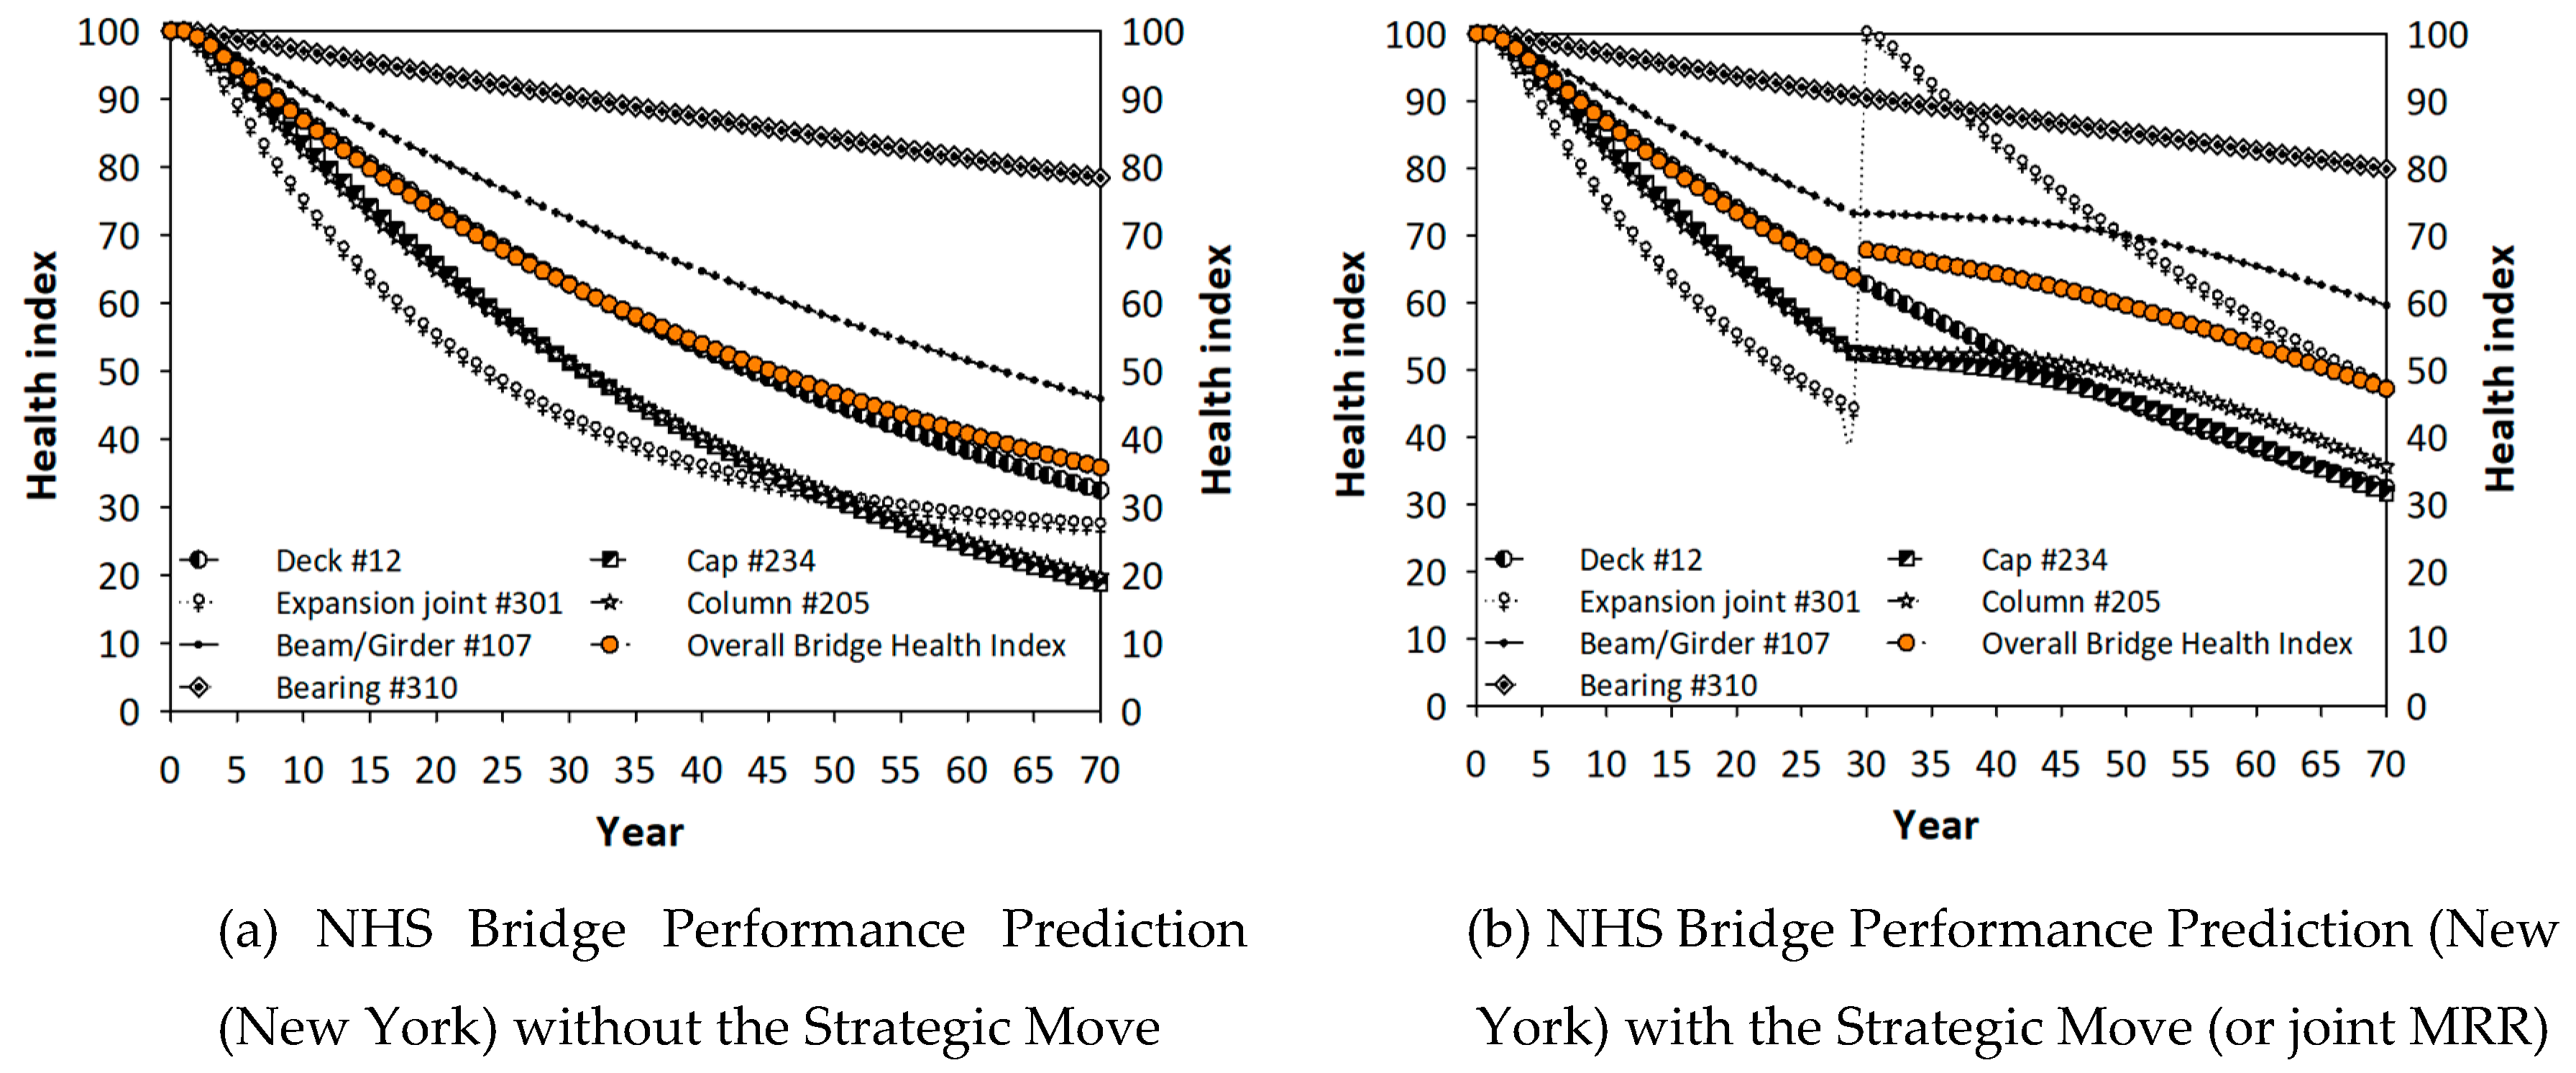
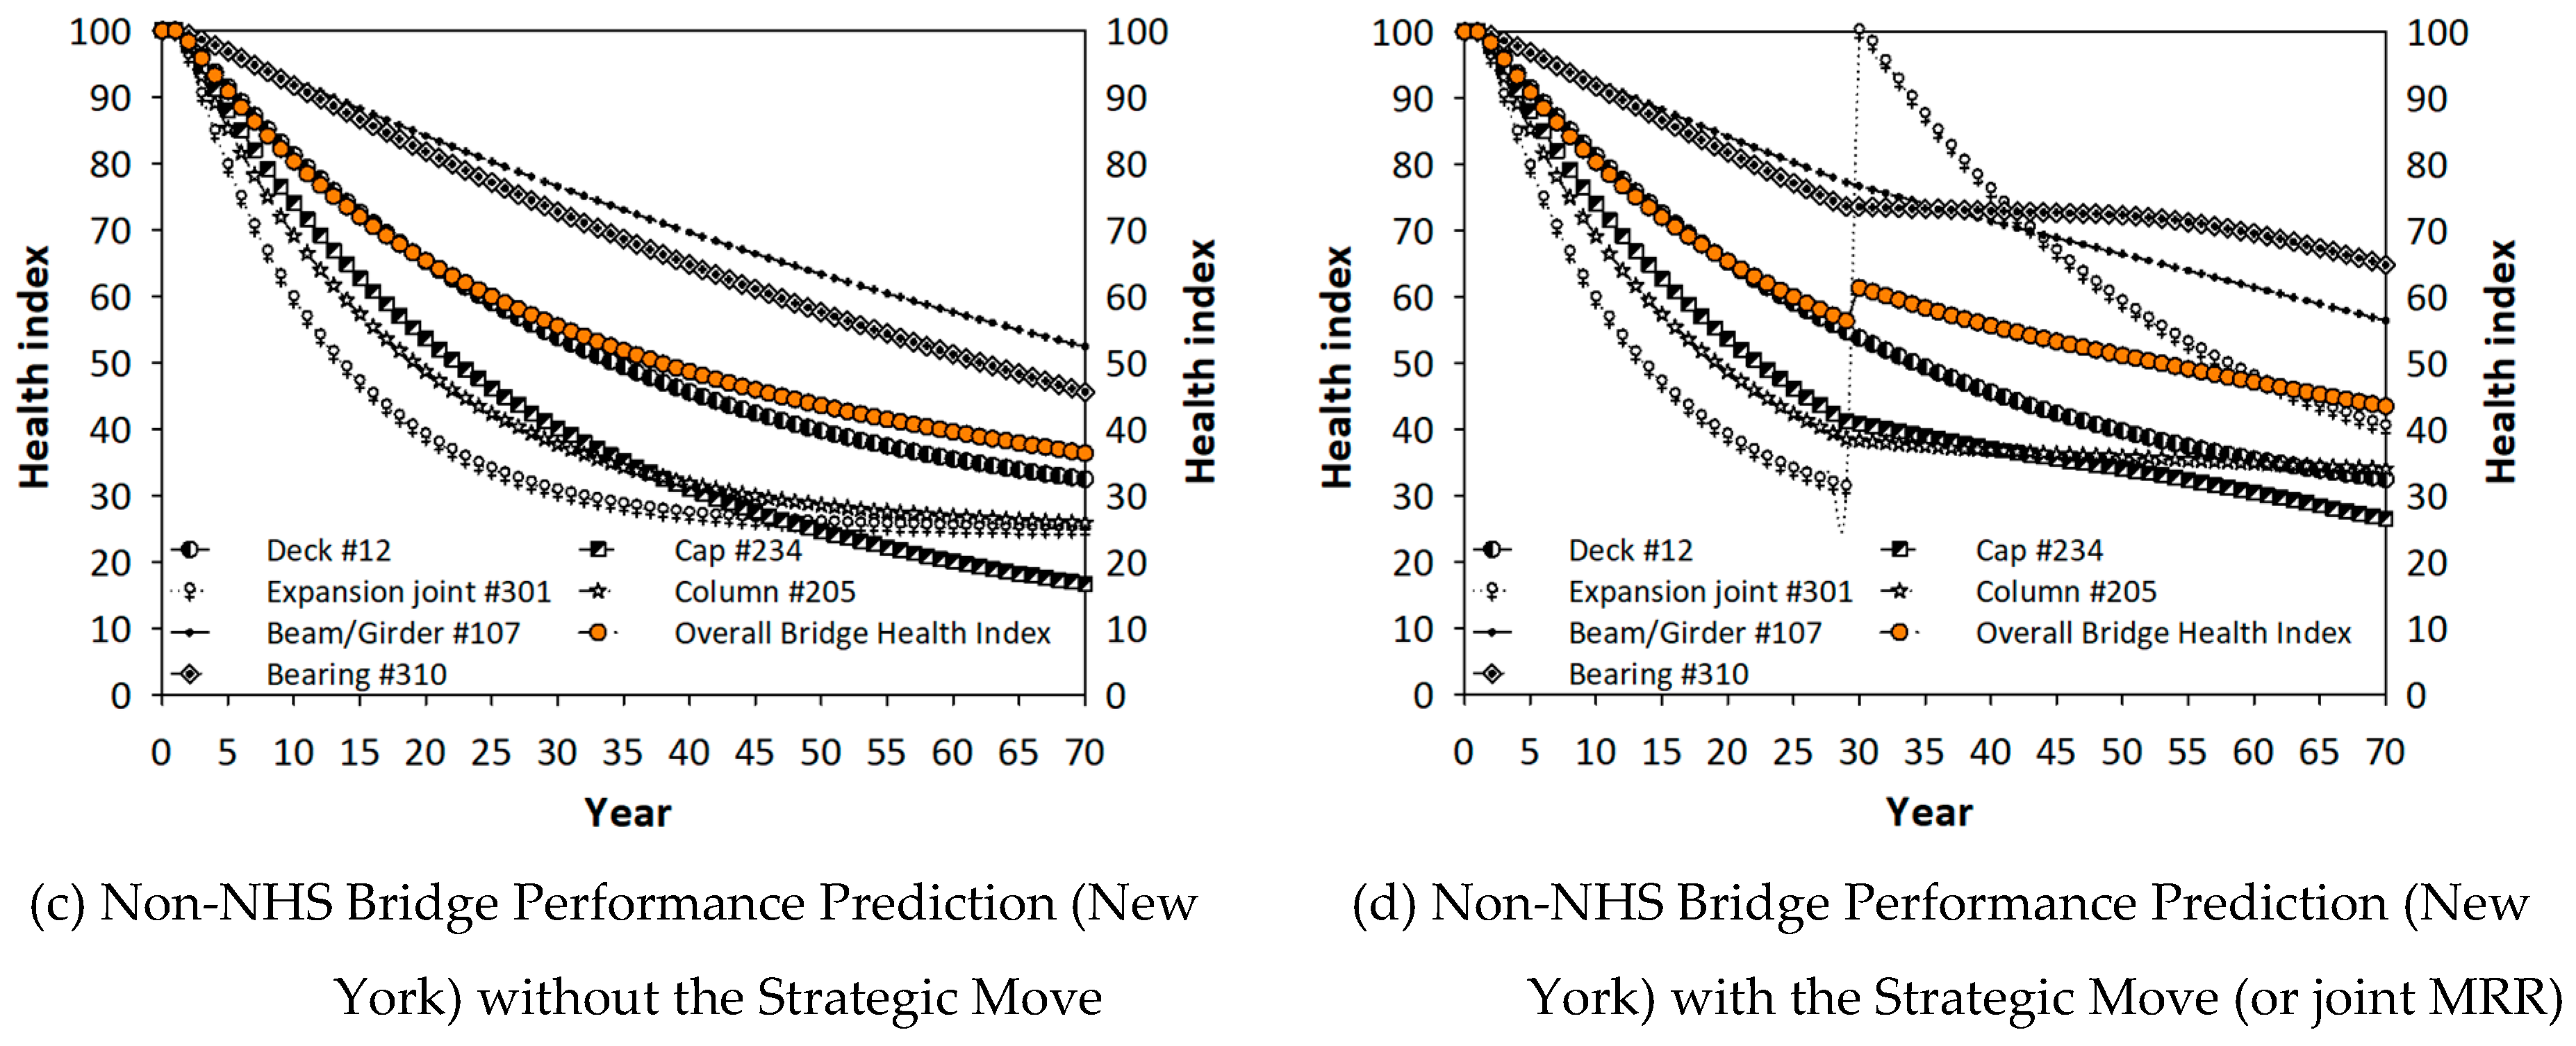
Figure 15a shows the average service life of NHS bridges in New York when no joints are rehabilitated or replaced.
Figure 15b presents the NHS bridge performance when additional resources are allocated to expansion joints and joint sealant rehabilitation and/or replacements. The co-active model is used in this figure. The average service life was extended by 15 years because the service life is 35 and 50 years in
Figure 15a,b, respectively, for the health index threshold of 60.
Table 1 summarizes the payoff of the players for existing and new strategies.
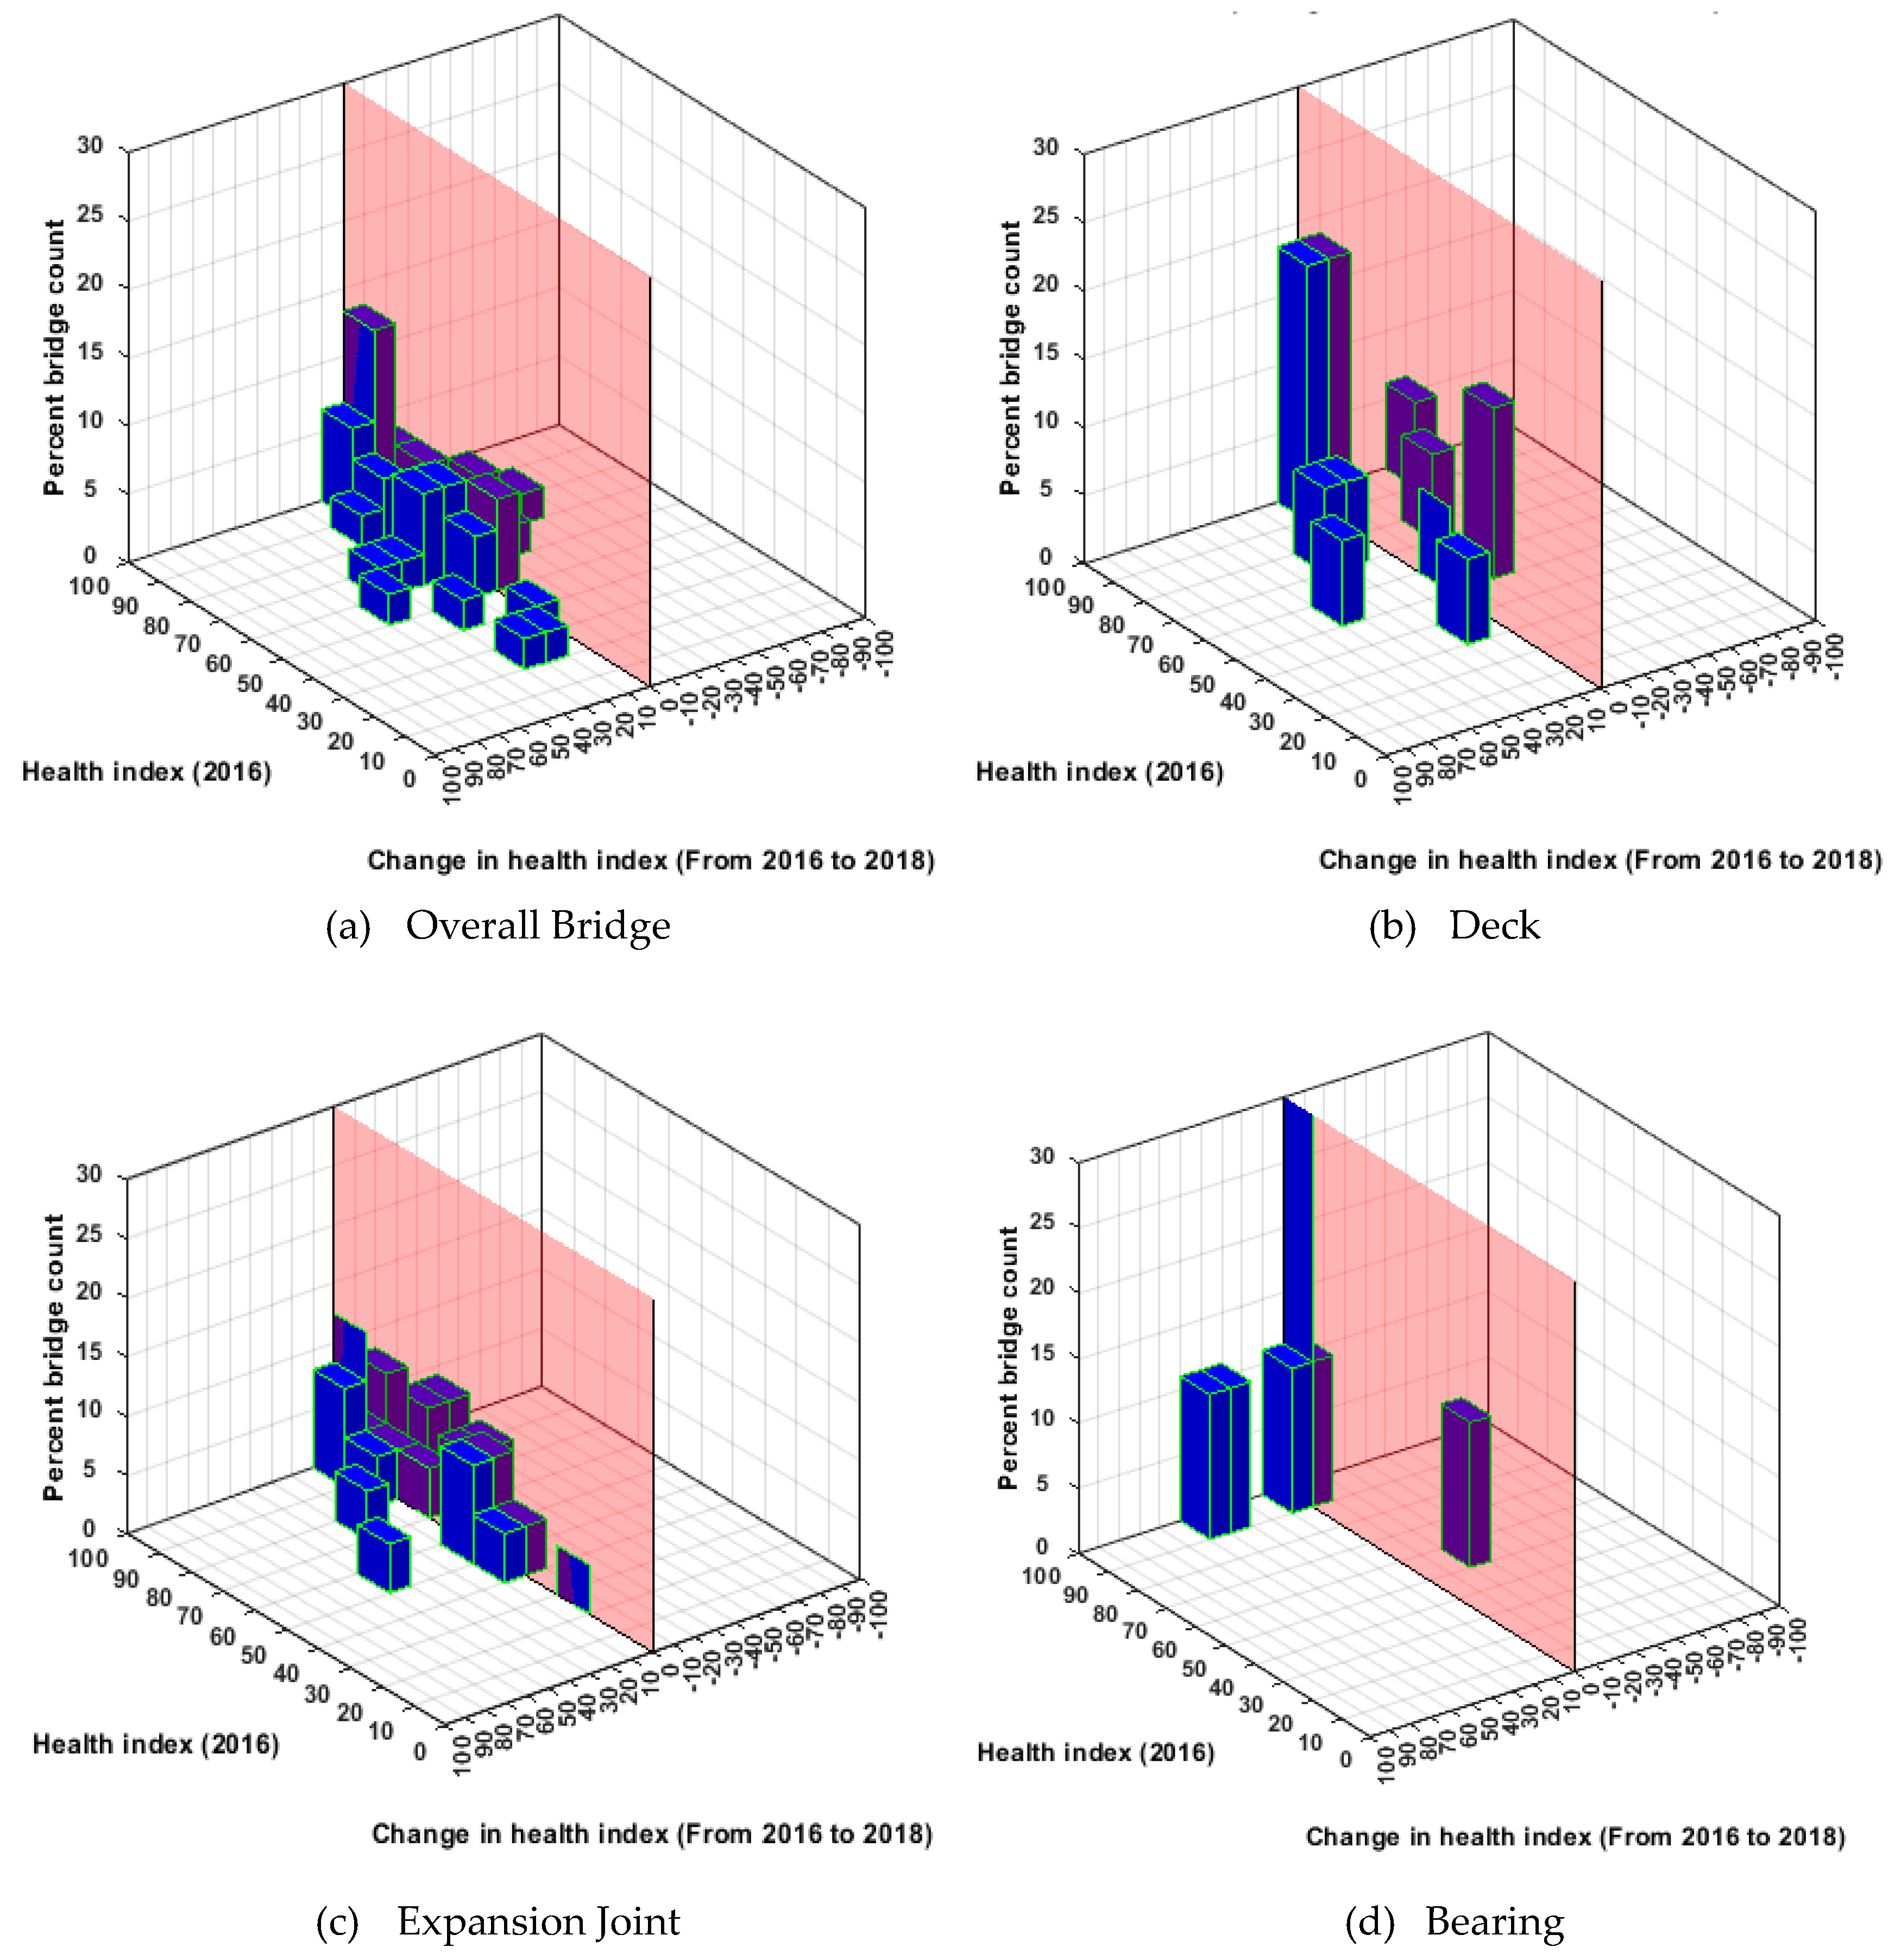
In
Figure 16 and
Figure 17, in comparison with NHS bridges, non-NHS but state-owned bridge performance and performance predictions are investigated. In the absence of a strategic incentive and resources, non-NHS bridges are not as well maintained as the NHS bridges.
Finally,
Figure 18 shows that the proposed co-active mechanism yields less conservative deterioration predictions.
4. Discussion of Results
The bridge performance analysis presented in this study integrates a co-active model and a game theory approach to optimize a return on investment (ROI) from the bridge maintenance, rehabilitation, and replacement (MRR) actions. Joint MRRs were selected to illustrate the proposed approach, which is not currently being considered by transportation agencies. The game theory approach models a strategic interaction between two players, the federal and state transportation agencies (or FHWA and a state DOT). The game theory utilizes a sequential game with two FHWA’s strategic moves, one imposing the 10% deck requirement (which is the current requirement) and the other with a strategic change in deck requirement (10.5%) while requiring states to maintain all joints in superior conditions.
In each of the four states investigated, the co-active model leverages on element interactions and gives a realistic long-term bridge performance prediction. The proposed co-active model and the game theory approach are most effective in prioritizing bridge actions in New York, where the bridge average service life is extended by 15 years. This may be attributed to the relatively lower bridge health indices and high co-activeness among the elements in the New York bridge inventory. The effectiveness of the co-active model in the Georgia and Virginia bridge inventories is similar. In both states, the bridge average service life is extended by 10 years. The proposed co-active model and the game theory approach resulted in a bridge average service life extension of 5 years in Pennsylvania. This lower value of service life extension in Pennsylvania, compared to the other states investigated in this study, may be attributed to Pennsylvania’s bridge management strategy, which currently leverages the proposed co-activeness mechanism in their bridge MRR, even though bridges in Pennsylvania are exposed to aggressively deteriorating environment conditions similar to what is obtainable in Virginia and New York.
This study serves to highlight (1) the need for maintaining bridges worldwide and (2) the prevalence of depreciating transportation assets without accounting for bridge elements’ interdependencies. The proposed co-active scheme, on the other hand, yields less conservative and thus more realistic performance predictions, which account for element interactions. Furthermore, a strategic move that involves leveraging the co-active mechanism and quantifying payoffs can result in significant service life extension and cost savings. In the absence of a strategic incentive and resources, some bridges (e.g., state- and county-owned bridges) may be left out of maintenance, repair, and rehabilitation. For example, in this study, non-NHS bridges are not as well maintained as the NHS bridges. With the strategic move invested in this study, both state and federal transportation agencies were able to achieve positive outcomes.
5. Conclusions
The bridge element-based inspection data from four U.S. states (Georgia, Virginia, Pennsylvania, and New York) were investigated to determine the feasibility of implementing a proposed co-active mechanism nationwide in the United States. It is concluded that co-activeness exists in the element data, and the extent of co-activeness among elements affects the long-term bridge performance. Based on the findings of this study, the following conclusions are made:
The Federal Highway Administration (FHWA) requires that states have less than 10% of the total deck area that is structurally deficient. Therefore, the FHWA has a minimum risk benchmark, which can be described as a “worst-case scenario”, for its investments on the nation’s NHS bridges. However, criteria for obtaining the highest return on investment on bridge maintenance, rehabilitation, and replacement (MRR) are lacking.
Long-term bridge performance predictions reflecting a co-active mechanism that is present in a bridge inventory are effective in prioritizing elements for MRR decisions.
Investments on the bridge MRR are optimized when the co-active mechanism that exists in a bridge network is determined and considered in the long-term bridge performance predictions.
By applying a game theory approach, it is possible to identify an inherent and particular payoff structure between FHWA and a state DOT. The 10% limit on deck maintenance in the current requirements may not be the most cost beneficial for extending the service life in the long term. By changing this requirement to 10.5%, both FHWA and state DOTs will be able to allocate additional resources to expansion joints and joint seals. The outcome of such a strategic move yields a higher payoff for the players.
State agencies with relatively lower bridge health indices are more likely to benefit from using the proposed method that accounts for the co-active mechanism because condition changes in one element are more likely to significantly influence the bridge health indices.
6. Future Work
The results presented in this paper are limited to NHS and non-NHS bridge inspection and asset management in the United States. Future work should consider applying the proposed co-active mechanism to locally owned bridges, which are known to have much-limited resources for MRR. The cause of the differences between the performances of NHS and non-NHS bridges should be investigated in detail. Finally, additional pairs/groups of players and strategic moves should be identified for a broader implementation of the proposed approach.
Author Contributions
The authors confirm contribution to the paper as follows: methodology, O.B.O., M.G.C.; development of co-active model, O.B.O., M.G.C.; data analysis and paper writing, O.B.O., M.G.C. All authors have read and agreed to the published version of the manuscript.
Funding
The study presented in this paper was conducted by the University of Georgia and was partially completed under the auspices of the Georgia Department of Transportation (GDOT) RP 17-28.
Acknowledgments
The authors extend our sincere appreciation to GDOT staff and engineers that supported this research. The funding sponsors had no role in the design, analyzes, or interpretation of data. The opinions, findings, and conclusions may not reflect the views of the funding agency or other individuals. All authors have read and agreed to the published version of the manuscript.
Conflicts of Interest
The authors have no implicit or explicit conflict of interest of any kind in this study.
References
- Contreras-Nieto, C.; Shan, Y.; Lewis, P.; Hartell, J.A. Bridge maintenance prioritization using analytic hierarchy process and fusion tables. Autom. Constr. 2019, 101, 99–110. [Google Scholar] [CrossRef]
- Lu, P.; Phares, B. Integration of Structural Health Monitoring (SHM) into Multilayer Statewide Bridge Maintenance and Management Practices–SHM-Facilitated Condition-Based Maintenance (SHM-CBM) Prioritization System; Iowa State University: Ames, IA, USA, 2018. [Google Scholar]
- Kim, D.; Lee, Y.; Lee, M.J. Development of Risk-Based Bridge Maintenance Prioritization Methodology. KSCE J. Civ. Eng. 2018, 22, 3718–3725. [Google Scholar] [CrossRef]
- Parvardeh, H.; Babanajad, S.; Ghasemi, H.; Maher, A.; Gucunski, N.; Zobel, R. The Long-Term Bridge Performance (LTBP) Program Bridge Portal. In Proceedings of the 4th International Conference on Road and Rail Infrastructure, Šibenik, Croatia, 23–25 May 2016; pp. 389–395. [Google Scholar]
- Sarhosis, V.; De Santis, S.; de Felice, G. A review of experimental investigations and assessment methods for masonry arch bridges. Struct. Infrastruct. Eng. 2016, 12, 1439–1464. [Google Scholar]
- Zhang, W.; Wang, N. Bridge network maintenance prioritization under budget constraint. Struct. Saf. 2017, 67, 96–104. [Google Scholar] [CrossRef]
- Van Erp, H.N.; Orcesi, A.D. The use of nested sampling for prediction of infrastructure degradation under uncertainty. Struct. Infrastruct. Eng. 2018, 14, 1025–1035. [Google Scholar] [CrossRef]
- Zhang, X.; Gao, H. Determining an optimal maintenance period for infrastructure systems. Comput. Aided Civ. Infrastruct. Eng. 2012, 27, 543–554. [Google Scholar] [CrossRef]
- FHWA. Moving Ahead for Progress in the 21st Century Act (MAP-21): A Summary of Highway Provisions. Available online: https://www.fhwa.dot.gov/map21/summaryinfo.cfm (accessed on 1 July 2020).
- Agdas, D.; Rice, J.A.; Martinez, J.R.; Lasa, I.R. Comparison of visual inspection and structural-health monitoring as bridge condition assessment methods. J. Perform. Constr. Facil. 2016, 30, 04015049. [Google Scholar] [CrossRef] [Green Version]
- Andrijcic, E.; Haimes, Y.Y. Metamodeling of interdependent systems: Application to bridge infrastructure management. J. Infrastruct. Syst. 2017, 23, 04016028. [Google Scholar] [CrossRef]
- Sabatino, S.; Frangopol, D.M. Decision support system for optimum lifetime sustainability-based maintenance planning of highway bridges. In Proceedings of the International Conference on Sustainable Infrastructure, New York, NY, USA, 26–28 October 2017; pp. 65–72. [Google Scholar]
- Puls, E.; Hueste, M.B.D.; Hurlebaus, S.; Damnjanovic, I.; Policy. Prioritization of a bridge inventory for historic preservation: A case study for Tarrant County, Texas. Public Work. Manag. Policy 2018, 23, 205–220. [Google Scholar] [CrossRef]
- AASHTO. The AASHTO Manual for Bridge Element Inspection, 2nd ed.; American Association of State Highway and Transportation Officials: Washington, DC, USA, 2019. [Google Scholar]
- Oyegbile, O.B.; Chorzepa, M.G. Co-Active Prioritization by Means of Contingency Tables for Analyzing Element-level Bridge Inspection Results and Optimizing Returns. Infrastructures 2020, 5, 13. [Google Scholar] [CrossRef] [Green Version]
- Oyegbile, O.B. Novel Element-Data Driven Coactive Prioritization for Bridge Asset Management. Ph.D. Thesis, University of Georgia, Athens, GA, USA, 2020. [Google Scholar]
- Mandić Ivanković, A.; Skokandić, D.; Žnidarič, A.; Kreslin, M. Bridge performance indicators based on traffic load monitoring. Struct. Infrastruct. Eng. 2019, 15, 899–911. [Google Scholar] [CrossRef]
- Hooks, J.M.; Frangopol, D.M. LTBP Bridge Performance Primer; Federal Highway Administration: McLean, VA, USA, 2013. [Google Scholar]
- Zanini, M.A.; Faleschini, F.; Casas, J.R. State-of-research on performance indicators for bridge quality control and management. Front. Built Environ. 2019, 5, 1–22. [Google Scholar] [CrossRef] [Green Version]
- Strauss, A.; Mandić Ivanković, A.; Matos, J.; Casas, J.R. Performance indicators for road bridges—Overview of findings and future progress. In Proceedings of the Value of Structural Health Monitoring for the Reliable Bridge Management, Zagreb, Croatia, 2–3 March 2017; pp. 1–6. [Google Scholar]
- Frangopol, D.M.; Dong, Y.; Sabatino, S. Bridge life-cycle performance and cost: Analysis, prediction, optimisation and decision-making. Struct. Infrastruct. Eng. 2017, 13, 1239–1257. [Google Scholar] [CrossRef]
- Agrawal, A.K.; Kawaguchi, A.; Chen, Z. Deterioration rates of typical bridge elements in New York. J. Bridge Eng. 2010, 15, 419–429. [Google Scholar] [CrossRef]
- Li, L.; Sun, L.; Ning, G. Deterioration prediction of urban bridges on network level using Markov-chain model. Math. Probl. Eng. 2014, 2014, 1–10. [Google Scholar] [CrossRef]
- Chang, M.; Maguire, M.; Sun, Y. Framework for mitigating human bias in selection of explanatory variables for bridge deterioration modeling. J. Infrastruct. Syst. 2017, 23, 04017002. [Google Scholar] [CrossRef]
- Zanini, M.A.; Faleschini, F.; Pellegrino, C. Cost analysis for maintenance and seismic retrofit of existing bridges. Struct. Infrastruct. Eng. 2016, 12, 1411–1427. [Google Scholar] [CrossRef]
- Ghodoosi, F.; Abu-Samra, S.; Zeynalian, M.; Zayed, T. Maintenance cost optimization for bridge structures using system reliability analysis and genetic algorithms. J. Constr. Eng. Manag. 2018, 144, 04017116. [Google Scholar] [CrossRef]
- Fang, Y.; Sun, L. How do funds allocation and maintenance intervention affect the deterioration process of urban bridges in Shanghai. In Proceedings of the International Symposium on Pavement. Roadway, and Bridge Life Cycle Assessment, Sacramento, CA, USA, 3–6 June 2020; p. 72. [Google Scholar]
- Elbehairy, H.; Elbeltagi, E.; Hegazy, T.; Soudki, K. Comparison of two evolutionary algorithms for optimization of bridge deck repairs. Comput. Aided Civ. Infrastruct. Eng. 2006, 21, 561–572. [Google Scholar] [CrossRef]
- USC. Title 23—Highways, Chapter 1: Federal-Aid Highways. Available online: https://uscode.house.gov/view.xhtml?path=/prelim@title23&edition=prelim (accessed on 15 June 2019).
- FHWA. Bridge Preservation Guide: Maintaining a Resilient Infrastructure to Preserve Mobility. Available online: https://www.fhwa.dot.gov/bridge/preservation/guide/guide.pdf (accessed on 14 August 2020).
- Robert, W.E.; Marshall, A.R.; Lin, S.S.; Shepard, R.W.; Aldayuz, J. Integration of agency rules with the preservation optimization model in the Pontis bridge management system. Transp. Res. Rec. 2002, 1795, 74–81. [Google Scholar] [CrossRef]
- Roberts, J.E.; Shepard, R. Bridge management for the 21st century. In Proceedings of the Structures Congress, Washington, DC, USA, 21–23 May 2001; pp. 1–12. [Google Scholar]
Figure 1.
A flow chart showing the methodology.
Figure 1.
A flow chart showing the methodology.
Figure 2.
National Highway System (NHS) vs. non-NHS bridge in Georgia.
Figure 2.
National Highway System (NHS) vs. non-NHS bridge in Georgia.
Figure 3.
Game tree illustrating a strategic move and payoffs of two players in Georgia.
Figure 3.
Game tree illustrating a strategic move and payoffs of two players in Georgia.
Figure 4.
NHS bridge performance in Georgia. (a) Overall Bridge; (b) Concrete Deck; (c) Expansion Joint; (d) Bearing.
Figure 4.
NHS bridge performance in Georgia. (a) Overall Bridge; (b) Concrete Deck; (c) Expansion Joint; (d) Bearing.
Figure 5.
Non-NHS bridge performance in Georgia. (a) Overall bridge; (b) concrete deck; (c) expansion joint; (d) bearing.
Figure 5.
Non-NHS bridge performance in Georgia. (a) Overall bridge; (b) concrete deck; (c) expansion joint; (d) bearing.
Figure 6.
The effect of an expansion joint replacement not including and including the co-active mechanism: (a) and (b) in NHS bridges, (c) and (d) in non-NHS bridges in Georgia.
Figure 6.
The effect of an expansion joint replacement not including and including the co-active mechanism: (a) and (b) in NHS bridges, (c) and (d) in non-NHS bridges in Georgia.
Figure 7.
National Highway System (NHS) vs. non-NHS bridge in Virginia.
Figure 7.
National Highway System (NHS) vs. non-NHS bridge in Virginia.
Figure 8.
NHS bridge performance in Virginia. (a) Overall bridge; (b) concrete deck; (c) expansion joint; (d) bearing.
Figure 8.
NHS bridge performance in Virginia. (a) Overall bridge; (b) concrete deck; (c) expansion joint; (d) bearing.
Figure 9.
Non-NHS bridge performance in Virginia. (a) Overall bridge; (b) concrete deck; (c) expansion joint; (d) bearing.
Figure 9.
Non-NHS bridge performance in Virginia. (a) Overall bridge; (b) concrete deck; (c) expansion joint; (d) bearing.
Figure 10.
The effect of an expansion joint replacement not including and including the co-active mechanism: (a) and (b) in NHS Bridges, (c) and (d) in Non-NHS bridges in Virginia.
Figure 10.
The effect of an expansion joint replacement not including and including the co-active mechanism: (a) and (b) in NHS Bridges, (c) and (d) in Non-NHS bridges in Virginia.
Figure 11.
National Highway System (NHS) vs. non-NHS bridge in Pennsylvania.
Figure 11.
National Highway System (NHS) vs. non-NHS bridge in Pennsylvania.
Figure 12.
NHS bridge performance in Pennsylvania. (a) Overall bridge; (b) concrete deck; (c) expansion joint; (d) bearing.
Figure 12.
NHS bridge performance in Pennsylvania. (a) Overall bridge; (b) concrete deck; (c) expansion joint; (d) bearing.
Figure 13.
Non-NHS bridge performance in Pennsylvania. (a) Overall bridge; (b) concrete deck; (c) expansion joint; (d) bearing.
Figure 13.
Non-NHS bridge performance in Pennsylvania. (a) Overall bridge; (b) concrete deck; (c) expansion joint; (d) bearing.
Figure 14.
The effect of an expansion joint replacement not including and including the co-active mechanism: (a) and (b) in NHS Bridges, (c) and (d) in non-NHS bridges in Pennsylvania.
Figure 14.
The effect of an expansion joint replacement not including and including the co-active mechanism: (a) and (b) in NHS Bridges, (c) and (d) in non-NHS bridges in Pennsylvania.
Figure 15.
National Highway System (NHS) vs. non-NHS bridge in New York.
Figure 15.
National Highway System (NHS) vs. non-NHS bridge in New York.
Figure 16.
NHS bridge performance in New York. (a) Overall bridge; (b) concrete deck; (c) expansion joint; (d) bearing.
Figure 16.
NHS bridge performance in New York. (a) Overall bridge; (b) concrete deck; (c) expansion joint; (d) bearing.
Figure 17.
Non-NHS bridge performance in New York. (a) Overall bridge; (b) concrete deck; (c) expansion joint; (d) bearing.
Figure 17.
Non-NHS bridge performance in New York. (a) Overall bridge; (b) concrete deck; (c) expansion joint; (d) bearing.
Figure 18.
The effect of an expansion joint replacement not including and including the co-active mechanism: (a) and (b) in NHS bridges, (c) and (d) in non-NHS bridges in New York.
Figure 18.
The effect of an expansion joint replacement not including and including the co-active mechanism: (a) and (b) in NHS bridges, (c) and (d) in non-NHS bridges in New York.
Table 1.
Payoffs (years) of the strategic moves.
Table 1.
Payoffs (years) of the strategic moves.
| State | FHWA payoff2 | stateDOT payoff2 | FHWA payoff1 | stateDOT payoff1 |
|---|
| GA | 75 | 65 | 65 | 59 |
| VA | 45 | 45 | 35 | 35 |
| PA | 55 | 52 | 50 | 48 |
| NY | 50 | 39 | 35 | 31 |
© 2020 by the authors. Licensee MDPI, Basel, Switzerland. This article is an open access article distributed under the terms and conditions of the Creative Commons Attribution (CC BY) license (http://creativecommons.org/licenses/by/4.0/).


