Investigating Daylight in the Apartment Buildings in Melbourne, Australia

Sustainable Building Innovation Lab, School of Property, Construction and Project Management, RMIT University, Melbourne 3000, Australia
*
Author to whom correspondence should be addressed.
Infrastructures 2020, 5(10), 81; https://0-doi-org.brum.beds.ac.uk/10.3390/infrastructures5100081
Submission received: 18 August 2020
/
Revised: 30 September 2020
/
Accepted: 3 October 2020
/
Published: 7 October 2020
(This article belongs to the Section Sustainable Infrastructures)
Abstract
:Daylighting improves users’ experience in visual comfort, aesthetics, behaviour and perception of space and plays an important part in enhancing the health and wellbeing of occupants inside a dwelling. However, daylighting design is challenging for high rise living since configuration of multiple apartments together often results in deep plans and wrongly oriented apartments with poor daylighting. Melbourne considered as the most liveable city in the world has witnessed a boom in high rise apartments in recent years, where bedrooms were designed without windows or with one small opening. Previous studies indicated that one out of two apartments in Melbourne’s central business district (CBD) failed to provide daylighting in the bedrooms. This has led to amendments in planning policy with the aim of providing access to daylight in all habitable rooms. This paper investigates the daylighting conditions in apartment buildings using field measurement and daylight simulations. Daylight levels in 12 apartment units in Melbourne CBD were measured. Additionally, daylight simulations were conducted to identify ways for optimizing light levels in standard layouts. The field measurements showed that daylighting levels were insufficient in one third the apartments due to the presence of deep floor plates and external obstructions. The results from the daylight simulations showed that window to floor area ratio (WFR) of approximately 30% is required for achieving acceptable daylighting levels in bedrooms that have south orientation.
1. Introduction
Daylight plays an important role in enhancing the health and wellbeing of occupants by providing a dynamic interior environment and improving users’ experience in visual comfort, aesthetics and perception of space. Due to the balanced spectrum of colour and the change of intensity that varies according to the time of the day and seasons, daylight provides a better visual environment than artificial lighting. Daylight is preferred by most of the people as it provides signals about the weather, season, orientation, time of the day, that are essential in improving comfort and better adaptation to the environment. In addition, perception of uniformity contributes to people’s preference to daylighting. Daylight also reduce energy required for artificially lighting the interior spaces.
Daylight has a significant influence on circadian rhythms, the 24 h cycles of body’s internal clock. Stephens et al. [1] note that light is the most studied environmental exposure that can disrupt circadian rhythms. Though early research had suggested that humans are insensitive to the resetting effect of light unlike other animals, daylight is now recognized as the main synchronizer capable of producing weak or strong resetting of our internal circadian clock depending on stimulus strength and timing [2]. A human body reaches its coolest point in the early morning. Exposing it to the bright and early sun helps to energize the body. The circadian system significantly influences the physiology, behaviour, sleep-wake cycles, and alertness and mental health in general. Lack of exposure to the 24 h day night cycle can impact neuroendocrine system, lead to insomnia and compromised physiological and metabolic processes [1]. In a study involving four independent office environments, Figueiro et al. [3] demonstrated that lighting systems delivering a circadian stimulus 0.3 can reduce sleepiness and increase vitality and alertness in office workers.
Assessment of natural light is challenging due to its dynamic nature. There are several quantitative metrices available to assess the performance of daylighting. In addition to general illuminance, Daylight factor (DF), daylight autonomy (DA), and useful daylight illuminance (UDI) are the most commonly used metrices. DF is one of the simple metrics and is evaluated under overcast conditions and ignores the light produced under clear sky conditions [3]. DA is defined as the percentage of the occupied hours of the year when a minimum illuminance threshold is met by daylit alone. This dynamic metric uses the target illuminance for a space according to the Illuminating Engineers Society of North America (IESNA) requirements [4]. DA is likely to be very different according to the orientation of the window, therefore specific window size as per the orientation may be stipulated. Spatial daylight Autonomy (sDA) incorporates spatial scale in the DA metrics and examines whether a space receives enough daylight during standard operating hours (8 a.m. to 6 p.m.) on an annual basis. In order to help designers to control excessive sunlight in a space, this is normally complemented with Annual Sunlight Exposure (ASE) which describes how much of space receives too much direct sunlight. Boubekri and Lee [5] reported that not all daylighting metrics lead to the same conclusions and metrices should be selected based on the specific design goals. Dogan and Park [6] developed framework that overcomes these shortcomings, called the residential daylight score.
Many studies have reported the positive effect of daylighting on human health. However, in a review of scientific studies on the effect of daylight and health, Aries et al. [7] found only limited statistically significant proof for the link between daylight and its potential health consequences. Dogan and Park [6] note that most of the current research on daylighting mainly focus on office spaces with limited study on residential spaces. Additionally, research on daylight and health benefits is limited in residential buildings compared to other building types such as schools, workplaces and hospitals. Using an epidemiological study, Grimaldi et al. [8] found that poor illumination levels at home have a negative impact on the quality of life. Furthermore, Brown and Jacob [9] note that self-reported inadequate light in housing is associated with depression and falls.
There have been many attempts to identify the building design features that can enhance daylighting. Anderson et al. [10] used historic Boston row houses as a case study to examine the effects of housing design upon the amount of daylight available for maintaining synchronization of the human circadian system considered in conjunction with human movement. This study found that large positive changes in Daylight Autonomy can be achieved by relatively small changes in an apartment’s like painting the space a lighter colour. Few such studies were conducted in Hongkong. Cheung and Chung [11] investigated the subjective preference to daylit indoor environment of a residential room using conjoint analysis and found that features including quality of view, general brightness are among the important attributes. Xue et al. [12] in a survey of residential units found that external obstruction is the major physical factor affecting luminous comfort. Later on, Xue et al. [13] used questionnaire survey and computer simulation to investigate residents’ subjective luminous comfort in living rooms. The results showed that the uniformity level should be above 0.112 and the threshold of Average DA300 is 29.6%. Acosta et al. [14] reported that for a moderate circadian stimulus value of 0.3 for 75% of the year, window to wall ratio (WWR) of 60% is required in a room with a depth of 4-6 m. International WELL building standard sets a precondition of DA200,40% for at least 30% of regularly occupied space. WELL building standard also uses equivalent melanopic lux (EML) as a metric for measuring biological effect of light on humans. For circadian lighting system, it also allocates three points for achieving a minimum threshold of 250 EML (equivalent to 226 lx from D65), available for at least 4 h each day [15]. In a recent study, Truong et al. [16] presented a model for evaluating non-visual light effects by vertical illuminance, correlated colour temperature and colour rendering index. Mangkuto et al. [17] used simulation study and determined a combination of WWR 30%, wall reflectance of 0.8, and south orientation as the optimum for a simple building in the tropical climate.
Majority of the studies discussed above use computer simulations or occupants’ perception on visual environment. There is a lack of studies involving field-based performance monitoring and objective evaluation of daylight in homes particularly in high rise, high density urban context. Morning light exposure in the ”resetting period” that is from 6 a.m. to 10 a.m. is found to be important for circadian stimulus [18]. Most of this time people are at home before they go to work. The current COVID-19 pandemic lockdowns have transformed homes into workspaces, stressing the importance of adequate daylighting in homes. In Australia, situated in the southern hemisphere, north facing houses are considered most desirable because they get direct sunlight throughout the day. However, daylight design is more challenging for high rise livings since it involves configuration of multiple apartments together. This often results in deep plans and wrongly oriented apartments with poor light quality. Australia has seen a boom in the high-rise apartment development in the last few decades which has affected the liveability of apartments in the central business district (CBD) area. This paper investigates the daylighting levels in the bedrooms of apartment unit in Melbourne CBD to understand the impact of current legislations and recommend modifications for improving the daylighting conditions.
2. Current State
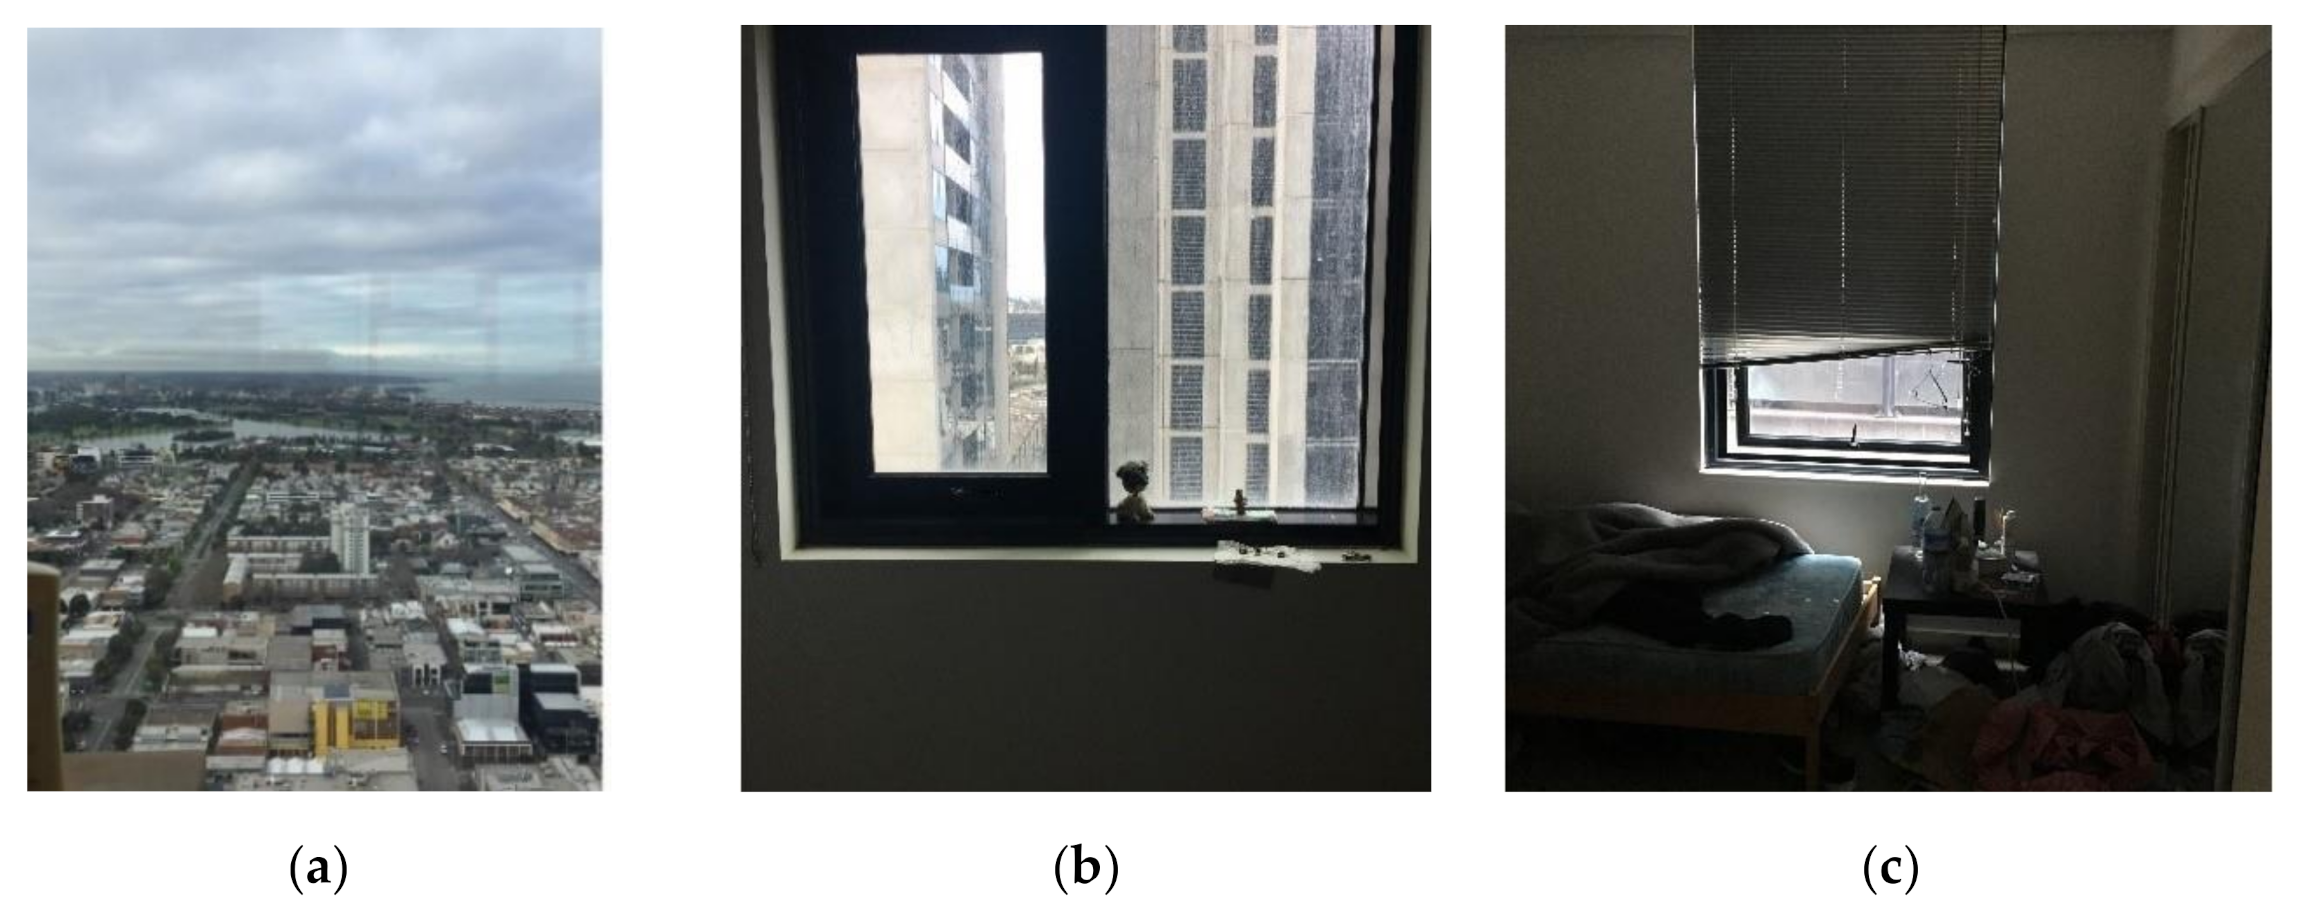
Increasing urbanization has resulted in a compact development and population concentration in the inner-city areas. In Australia, one third of the residential buildings constructed are apartments majority of which are in Melbourne, Sydney and Brisbane [19]. High-rise apartments constructed in central Melbourne have been around four times denser than that allowed in the world’s most populated cities like New York, Hong Kong, and Tokyo [20]. Figure 1a shows a view of the high-rise apartments in Melbourne CBD. As a result of the market demand for micro apartments, most of the new high-rise apartment buildings comprises of 1- or 2-bedroom units with small floor area and are usually clustered around the building core with limited scope for the provision of daylight and ventilation. The deep floor plates of the apartment buildings cause design constraints due to the limited external wall surface leaving designer with no solution other than borrowing daylight from adjacent spaces or providing snorkel layouts in the bedrooms. The deep plans and limited access to quality daylight in the apartments have been a major concern for the celebrated liveability of Melbourne. Some of these apartments fail to provide windows in the habitable spaces including bedrooms, with daylight in the bedrooms either borrowed or compromised. They often have a glass panel opening to the living room of the house or into small light corridors as shown in Figure 1b. In a survey, every one out of two apartments in Melbourne CBD was found to face these design issues [20]. It is interesting to note that housing designs without windows in the bedrooms are considered as illegal in the cities like Hongkong and New York, whereas Melbourne considered as one of the most liveable cities in the world fails to provide this basic requirement [21].
The poor design strategies and regulations have left many apartments in Melbourne only as an investment for the owners than a choice of living. Apartment layouts in Melbourne was in scrutiny by the Victorian government for its inadequate design as a result of which Better Apartment discussion paper was launched [22]. The discussion paper targeted to provide new regulations and guidelines for better and affordable apartment designs. The bedrooms without windows or with borrowed lights from an internal space were the key concerns. As a result, amendment VC136 was introduced in the Victoria planning provisions, where minimum of 1.2 m wide windows in all the bedrooms is mandated for an apartment more than 5-storied as per Clause 58 [23].
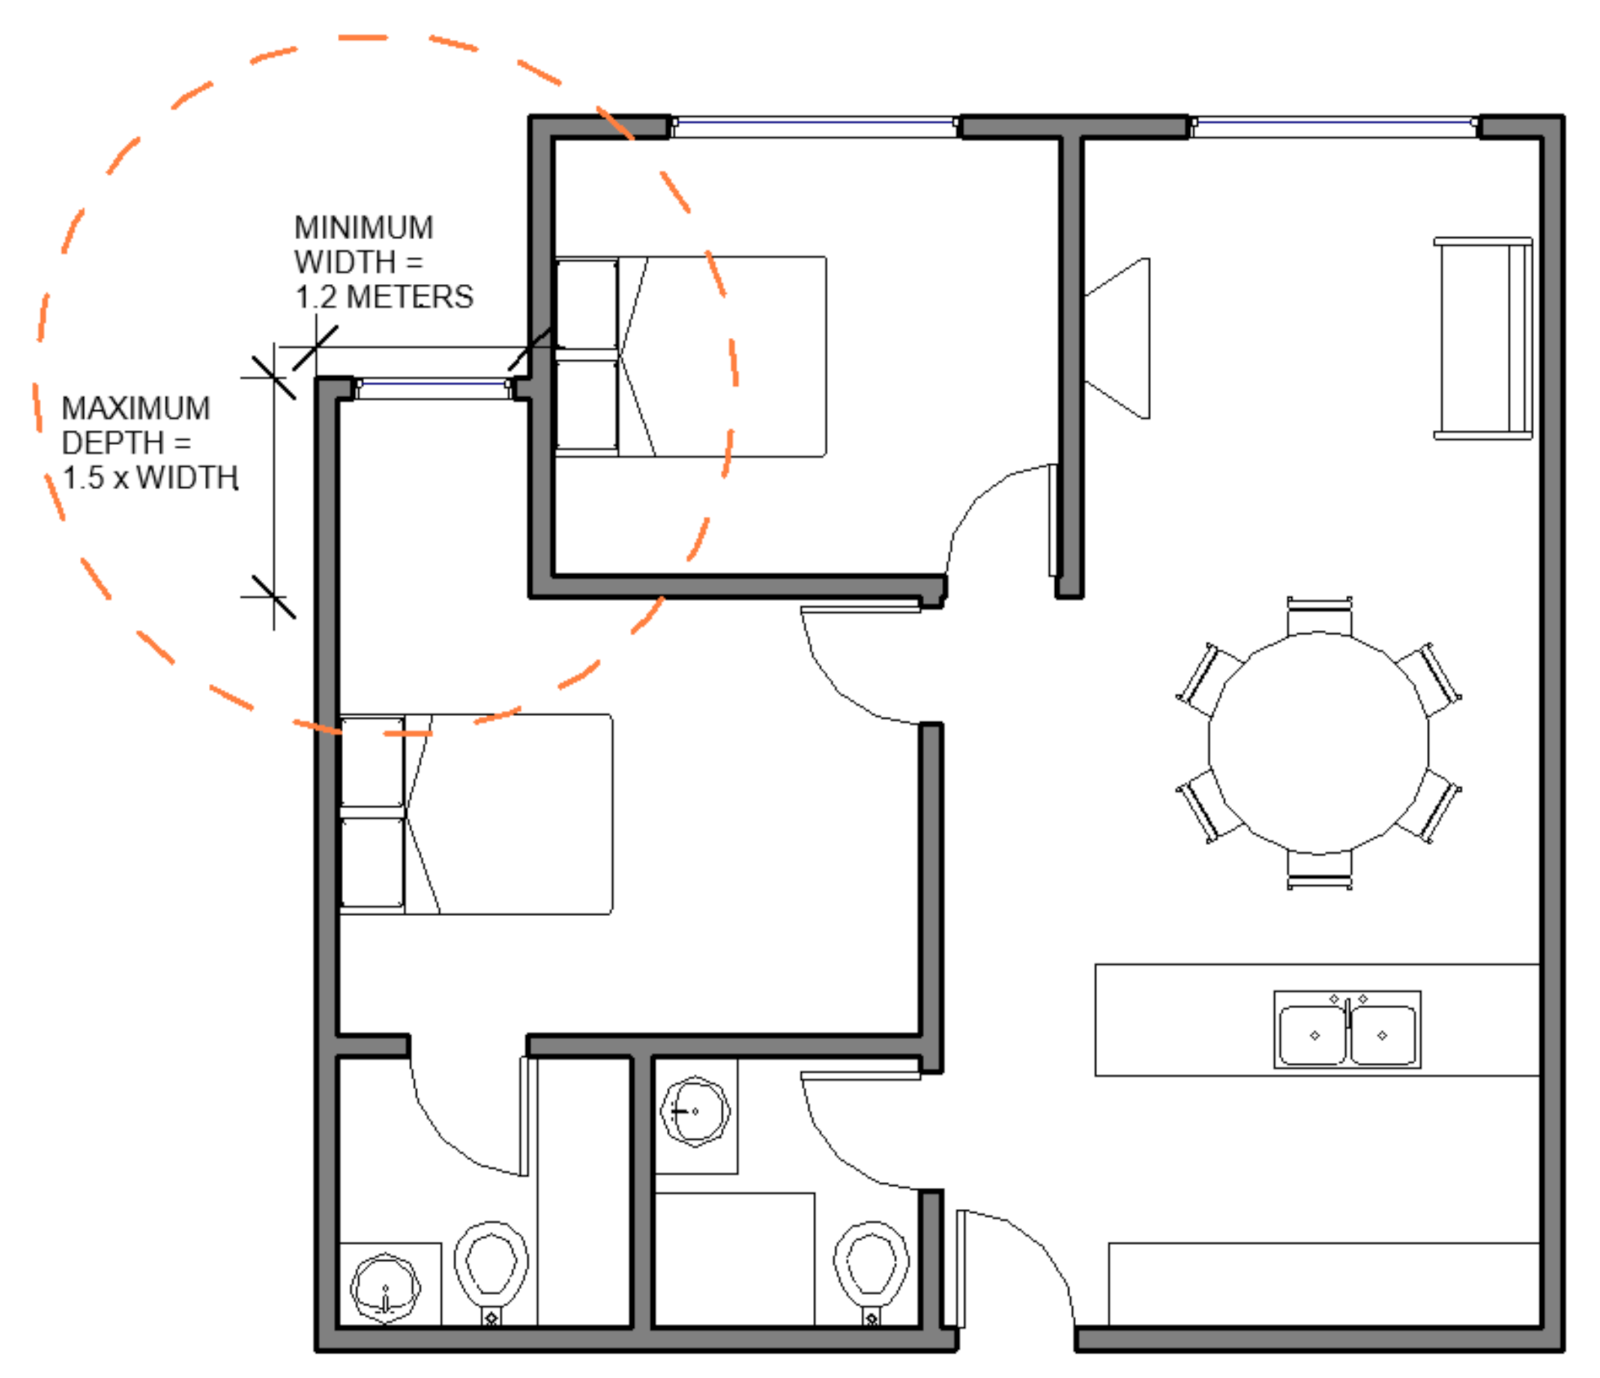
As per National Construction Code [24], habitable rooms should have opening with a size of 10% of floor area. However, this size may not be enough to provide the adequate daylight levels required. The amendment does talk about the window requirements but does not mention the minimum daylight requirements anywhere in its statement. Ambient light in a dwelling should be enough to carry out any type of work during the daytime. The Australian standards 1680.1 [25] recommends 320 lx for moderately difficult tasks including reading and writing. The Illuminating Engineers Society of North America [26] recommends minimum light of 300 lx and for the areas used for productive work is 800 lx depending upon the climate-based daylight factor. Therefore, it is very important to identify if the windows are also capable of providing the required amount of natural light. As per the amendment VC136, in bedrooms, windows of 1.2 m width were allowed with a corridor 1.5 times longer than the width as shown in Figure 2 where one bedroom has a window on its external face receiving direct sunlight and the other bedroom has snorkel layout and might not receive adequate daylight requiring the use of artificial light during the daytime. The adequacy of the clause 58 in providing required daylight levels in bedrooms should be investigated.
3. Methodology
A total of 12 apartment units with different bedroom layouts within Melbourne CBD area were selected for the study. All rooms were occupied at the time of study with standard bedroom furniture (e.g., bed, side table and study table etc.). Horizontal illuminance levels were measured using a Testo 545 light meter (range 0 lx to 100,000 lx, accuracy ± 8.5%) at standard desk height, which is 800 mm above the floor level. The dimension of the room and windows were also noted to estimate WFR. The type of available view from each room were also recorded. Selection of apartment units was performed according to the year of construction, window size and orientation and external obstruction. As discussed before, the design of apartment is expected to be different after year 2015 since the amendment in planning provisions in 2015. There were no policies in place for the window provisions prior to 2015, other than the requirement of 10% opening. Therefore, scenario with no windows in the bedrooms are very likely to be found in these buildings.
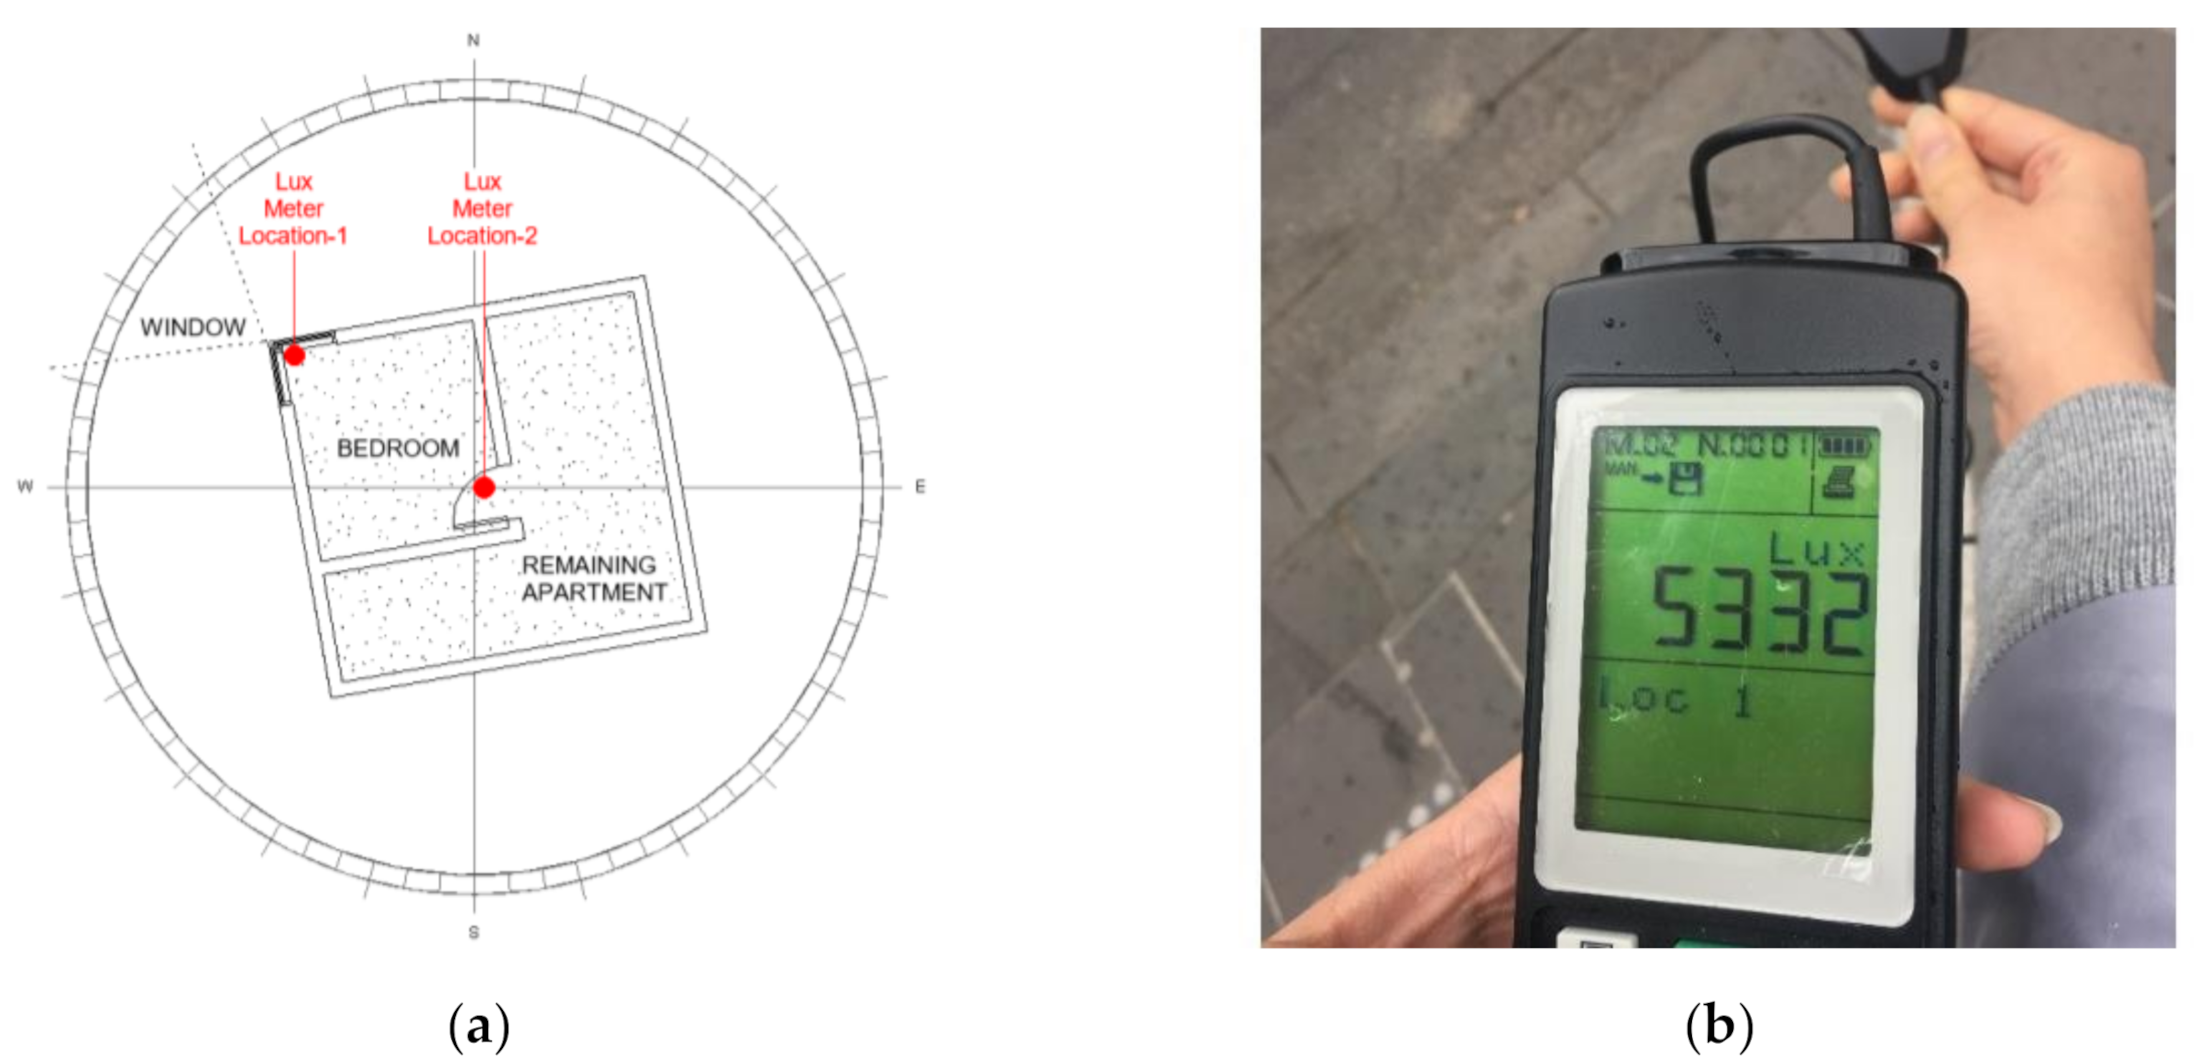
Spot measurement of illuminance in the 12 bedrooms were conducted in the morning between 9.00 a.m. and 12 noon on a day with clear sky. Two locations were selected for measurements, one next to the window receiving maximum light and second at the farthest corner from the window receiving the minimum light (Figure 3). External illuminance was also recorded immediately after measuring the internal readings. It was made sure that the sky conditions were same for both measurements. The ratio of internal to external illuminance is calculated. Under overcast conditions, this ratio can be considered as DF and the values are generally much lesser. As per the Built Environment Sustainability Scorecard [27] an assessment tool created by local governments in Victoria to show how a proposed development meets sustainable design benchmarks and requirements, minimum DF required for bedroom is 0.5%. However, EN17037, European standard for daylighting [28], stipulates a minimum of 300 lx over 50% of the space for more than half the daylight hours in the year.
Subsequently, daylight simulations were conducted using daylight analysis tool in the Revit software. Perez All-Weather Sky model which yields accurate results for all sky types from clear to fully overcast was used for the simulation. The reflectance of walls and ceiling were set as 80% and reflectance of floor and furniture were set as 45% and 35% respectively. The aim is to analyse the annual conditions in the whole room using weather data from Melbourne, situated in the southern hemisphere. Lighting levels during different times of the day and during different seasons are analysed to identify strategies for optimizing daylight levels. The results are presented in the form of light distribution in the floor plans, and percentage of the floor area above or below certain threshold value set in the software as well as sDA and ASE percentages. Assessing daylighting through DF is a traditionally followed, simple and easy method. However, since it is measured in percentage, an actual illuminance value can never be obtained. Climate based daylight modelling (CBDM) approved by IESNA [26] has been adopted for presenting the indoor illuminance levels and its temporal and spatial variability of the illuminance levels. CBDM is mainly based on two metric systems, sDA and AES. sDA or Spatial Daylight Autonomy is a scale to define the percentage of floor area that receive a minimum of 300 lx at 800 mm height for almost 50% of hours, between 8 a.m. to 6 p.m. annually. Although, 75% is a preferred condition, 50% is considered acceptable. Therefore, in sDA 300/50, the Figure 300 refers to the minimum illuminance levels required and 50 refers to the percentage of occupied hours per year. ASE or Annual Sunlight Exposure refers to the visual discomfort caused by the excess light. This is measured as the percentage of room area that receives an illuminance level equal or more than 1000 lx for 250 h in a year. ASE1000/250, hence refer to 1000 lx and 250 operational annual hours for which the light is been measured. The recent advancements in the simulation tools have enabled easier estimation of sDA and ASE for architects and designers.
4. Results
4.1. Description of the Apartments
Most of the apartment units selected were 2- and 3-bedroom units, with some 1-bedroom units. Table 1 shows details of the apartments including year of construction, bedroom and window dimension, window orientation, WFR and view to outside. The apartment unit are arranged as per the type of views to outside which are classified as four levels: (1) pleasant (distant panoramic view), (2) standard, (3) obstructed and (4) no view (no window or no view). Figure 4 shows the types of views. The floor area of the bedroom ranged from 4.5 to 9 m2 and the window area ranged from 0 to 7 m2.
4.2. Daylight Measurements
The daylight levels measured in each of the room are presented in Table 2, where the illuminances close to the window and far away from the window and outdoor levels are shown. Indoor illuminances were divided by the outdoor illuminance levels to calculate the ratio in each of the locations. Table 2 shows the ratio of internal illuminance to external illuminance in different rooms. The illuminance levels were almost zero from cases with no windows and with borrowed light. The horizontal illuminance levels were also converted to EML levels to understand the biological effects of light. EML levels are calculated by multiplying the illuminance levels with a Melanopic Ratio based on the light source. Melanopic Ratio of daylight is 1.1. The WELL building standards target an EML of 250 and this was met for areas close to the windows for all the bedrooms that has windows. However, for areas away from the window, EML of 250 was only met by SW full window, West large window, SW standard window and West standard window.
NW large window, SW full window and SE full window have internal to external illuminance ratio ranging from 18.5–39.5%. These rooms with large WFR were found to have high ratios particularly close to the windows. Orientations of the windows also affected the ratios in these rooms. Even though the WFR for SW full window (100%) is more than NW large window (66%), the north west orientation resulted in higher ratios during the morning. West standard window, West large window, NE standard window and East obstructed were found to achieve internal to external illuminance ratio between 3–7%. These cases have WFR between 30–40%. Also, rooms with windows located in the north direction were found to have the higher internal to external illuminance ratio during the morning. Cases no window and no window-borrowed light did not have any daylight entering in the room and hence ratios were found to be nearly zero. Case North obstructed had some light next to the window and very minimum as moved away from the window. Some of these poorly designed apartment bedrooms borrow light from the living rooms.
4.3. Daylight Simulations
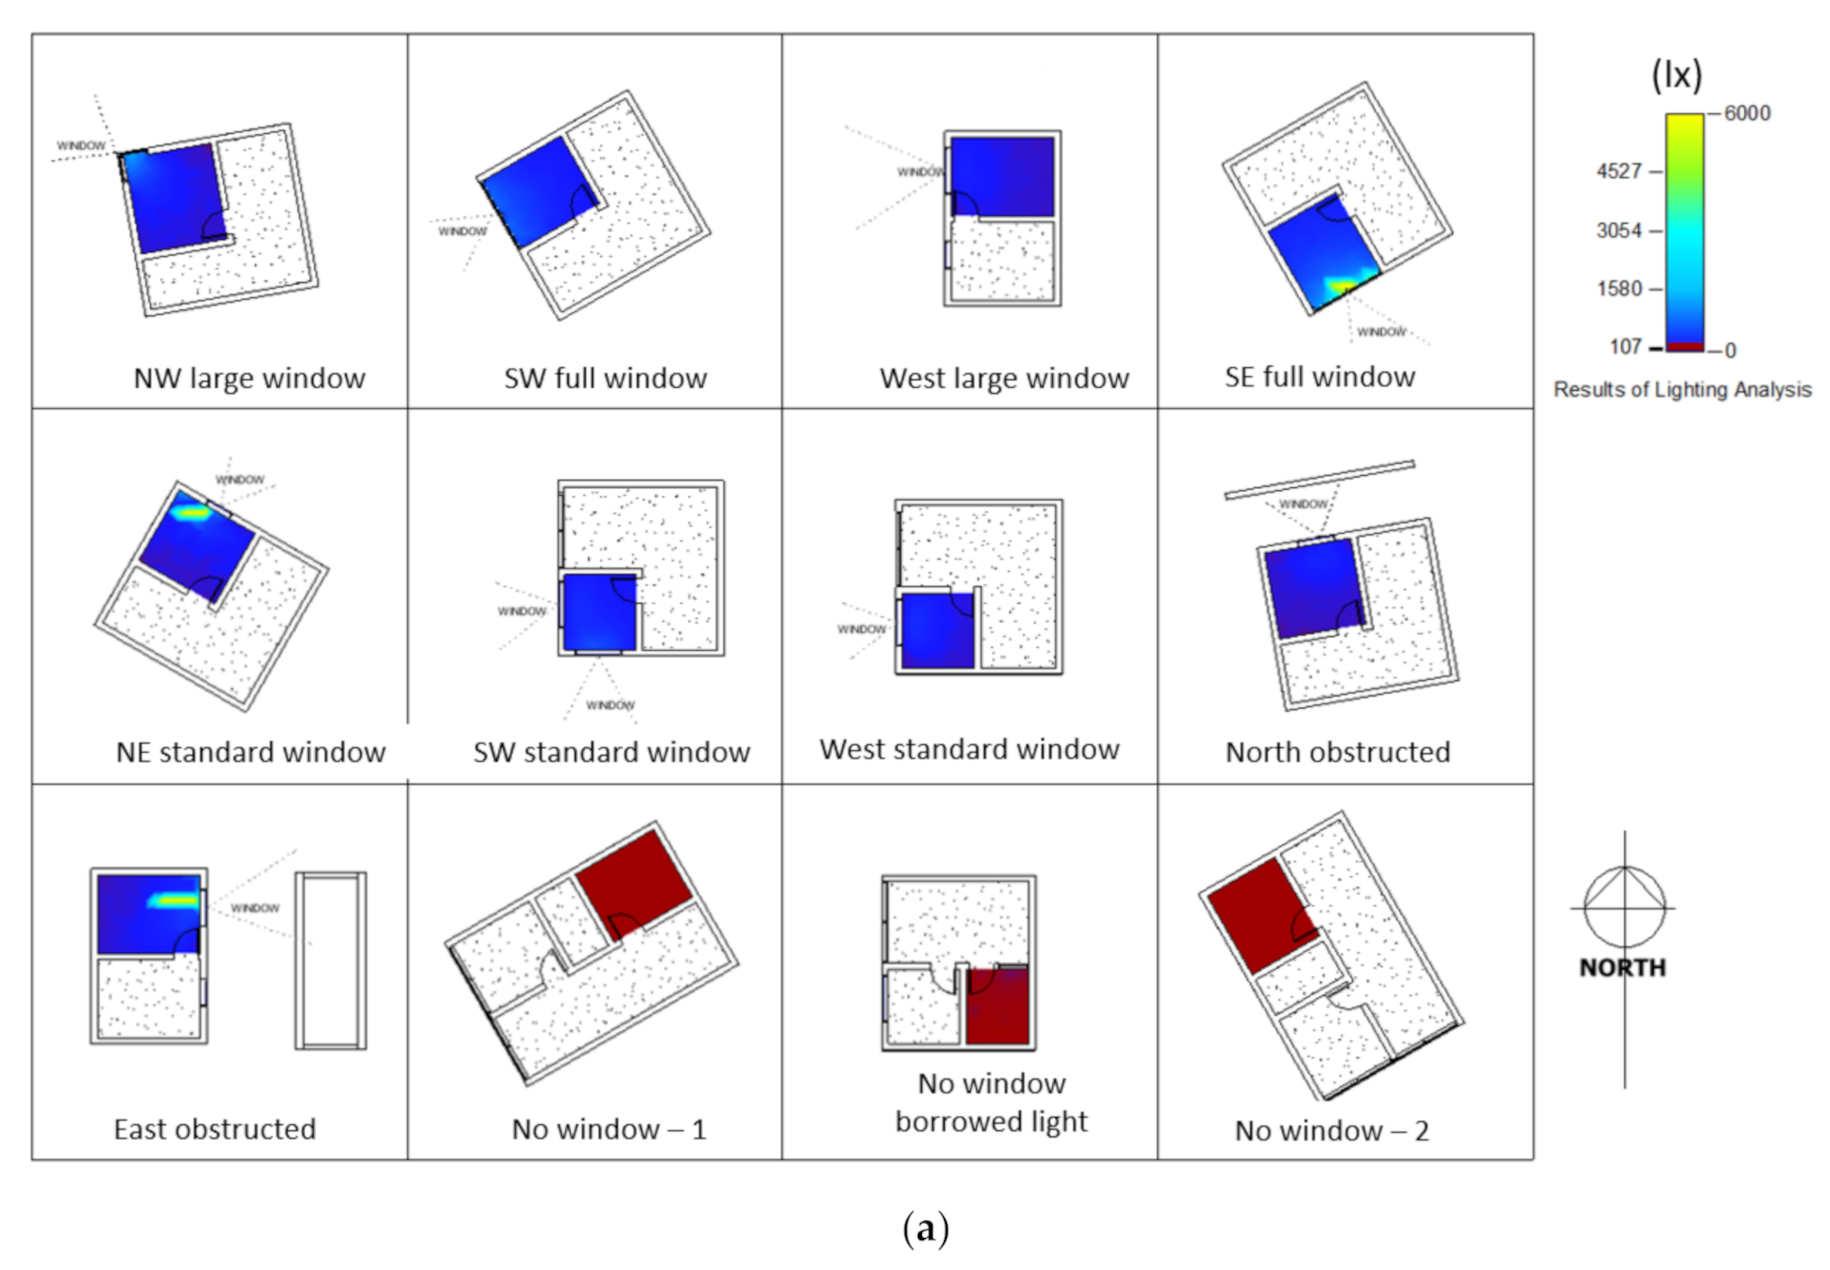
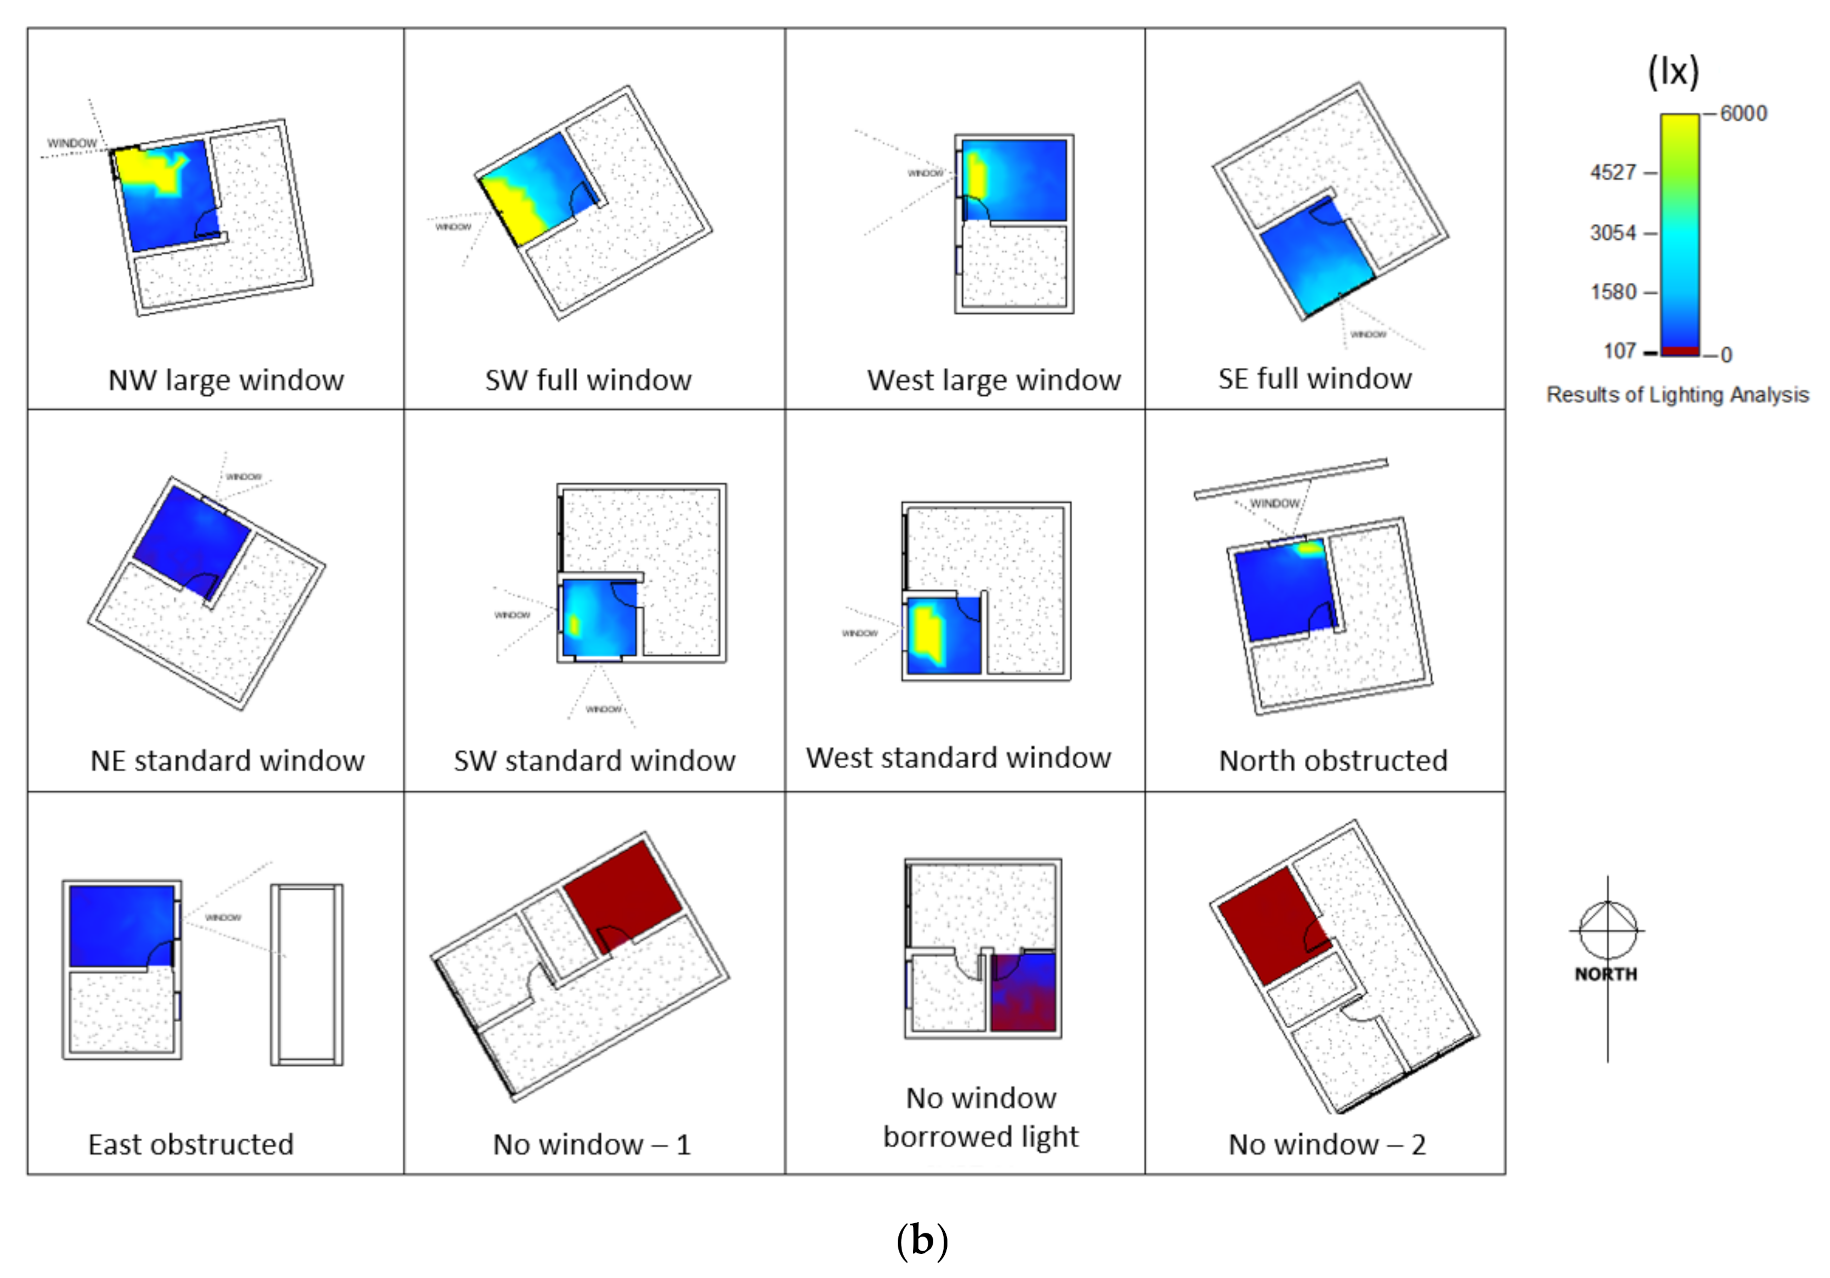
All the 12 units were modelled, and the spatial distribution of daylight during morning and afternoon were analysed. Figure 5 shows the illuminance distribution in all the units at 9 a.m. and 3 p.m. for a day in November representing the spring season. Figure 6 shows the percentage of areas with Illuminances within specified a range which is set between 300–1000 lx. Area with illuminances below 300 lx, between 300–1000 lx and above 1000 lx at 9 a.m. and 3 p.m. are shown in Figure 6.
As discussed in Section 4.2, cases no window and borrowed light did not have any light entering the rooms during the morning and afternoon. Simulation results also showed a similar pattern. For North obstructed, minimum light levels were not met both at 9 a.m. or 3 p.m. For NW large window, SW full window, West large window, SE full window and SW standard window, majority of the floor area had illuminances above 800 lx particularly in the afternoon. For NE standard window, 73% of the floor area was below 300 lx at 9 a.m. and 96% of the floor area was below 300 lx at 3 p.m. For SW full window, SW standard window and West large window, 85%, 88% and 74% of the area have illuminances above 800 lx at 3 p.m. which could probably cause some glare closer to the window. For West standard window, 44% area was below the required illuminance at 9 a.m. whereas all the area was well-lit at 3 p.m. Table 3 shows the percentage of annual distribution of daylight in terms of sDA and ASE. NW large window, SW full window, West large window, SW standard window and West standard window could have issues related to excessive daylight more than 250 h. SE full window and East obstructed seem to be meeting the criteria of good daylight levels in most of the areas without excessive light levels that can lead to glare. The daylighting performance was compared with the requirements of two international rating systems: Leadership in Energy and Environmental Design (LEED), which is one of the most widely used green building rating system [29] and WELL rating system which has an emphasis on health and well-being of the occupants. LEED stipulates minimum sDA 55% for scoring credits under the daylighting category. The points that could be achieved applying LEED and WELL criteria are shown in Table 3. While two WELL points can be achieved for NW large windows, SW full window, West large window, SE full window and SW standard window, three and two LEED points respectively can be achieved for SE full window and East obstructed. Additionally, according to the Green Building Council of Australia’s Green star—Design and as Built rating system, Visual comfort section awards one credit for high level of daylight and one point for high quality view available from a room [30].
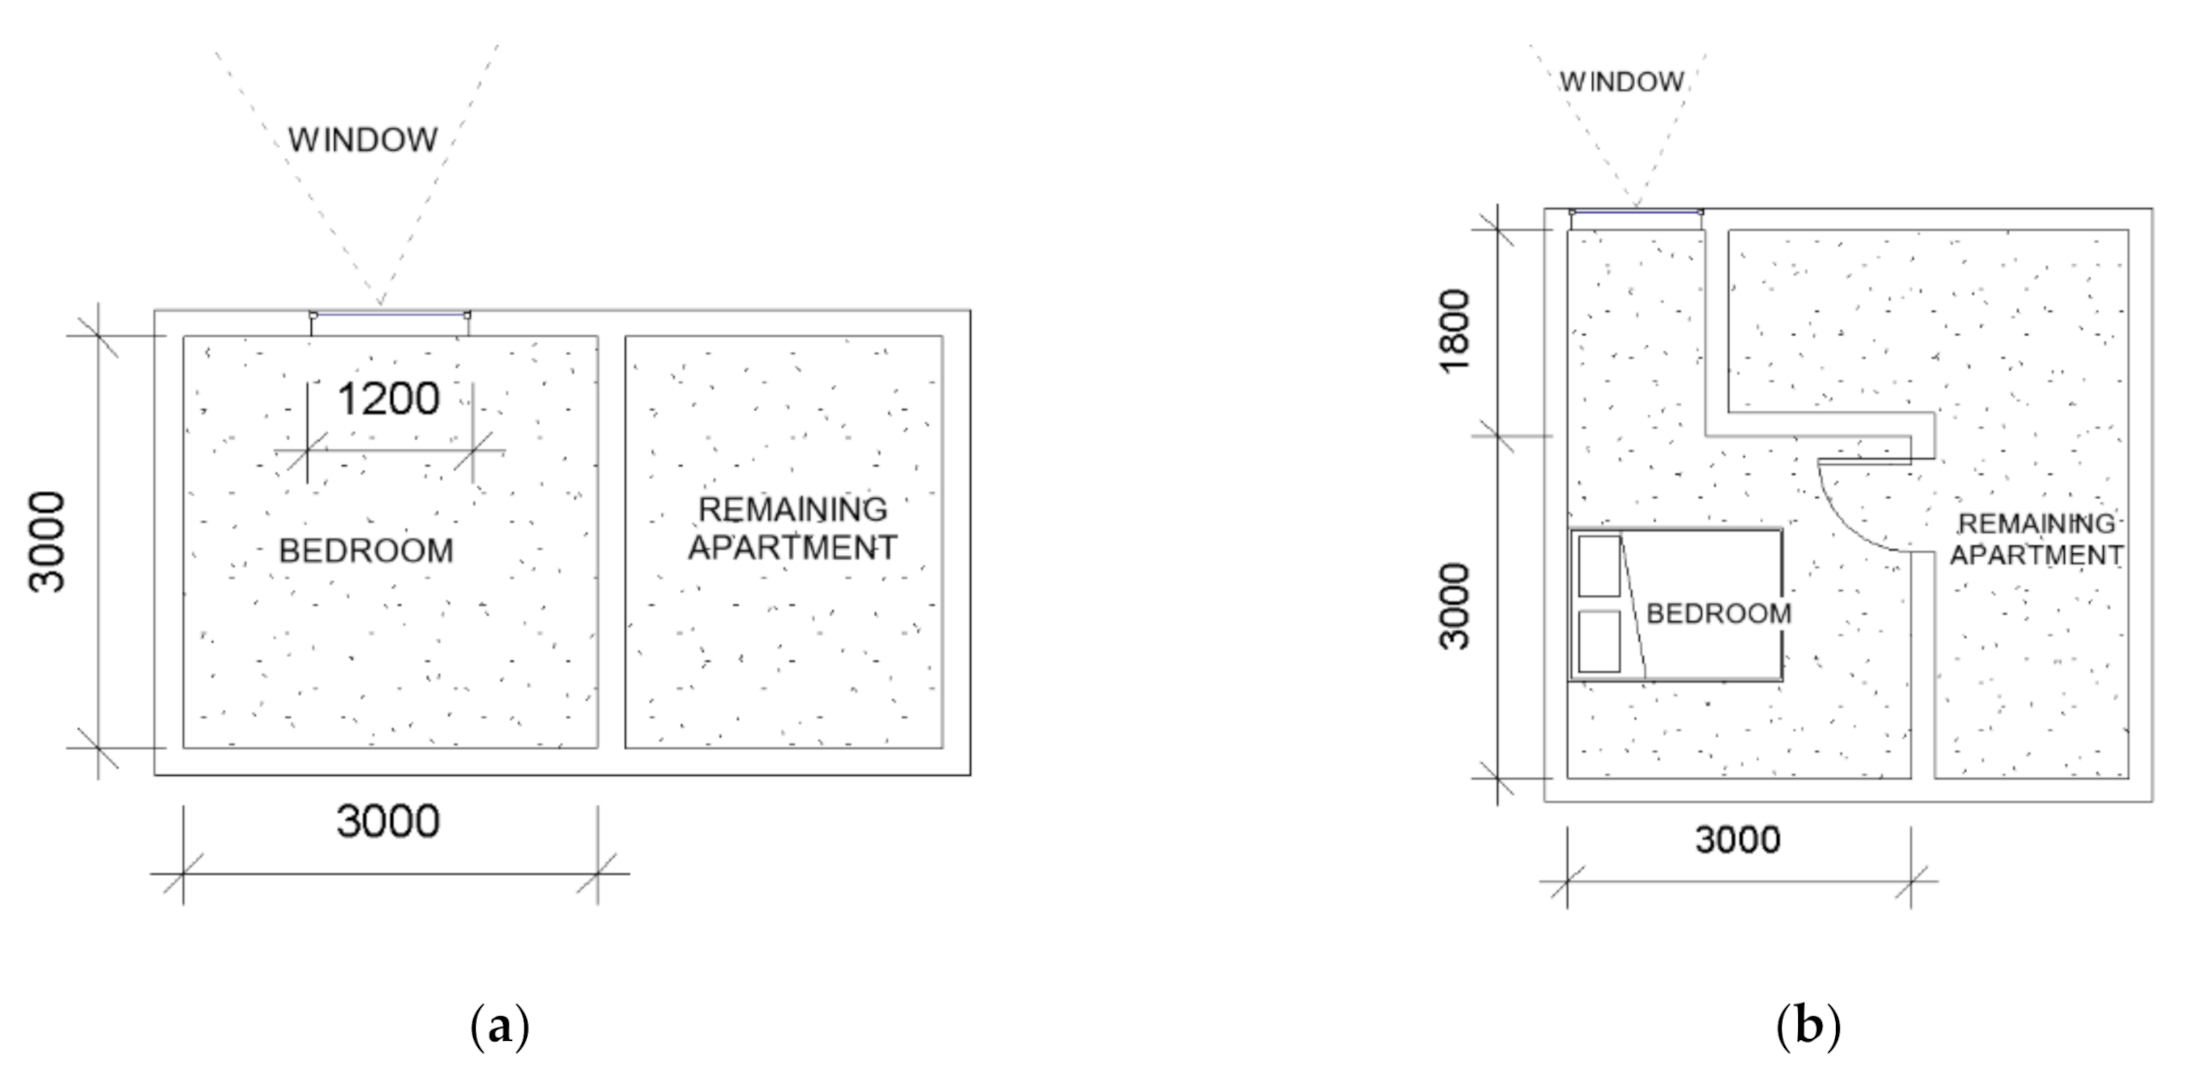
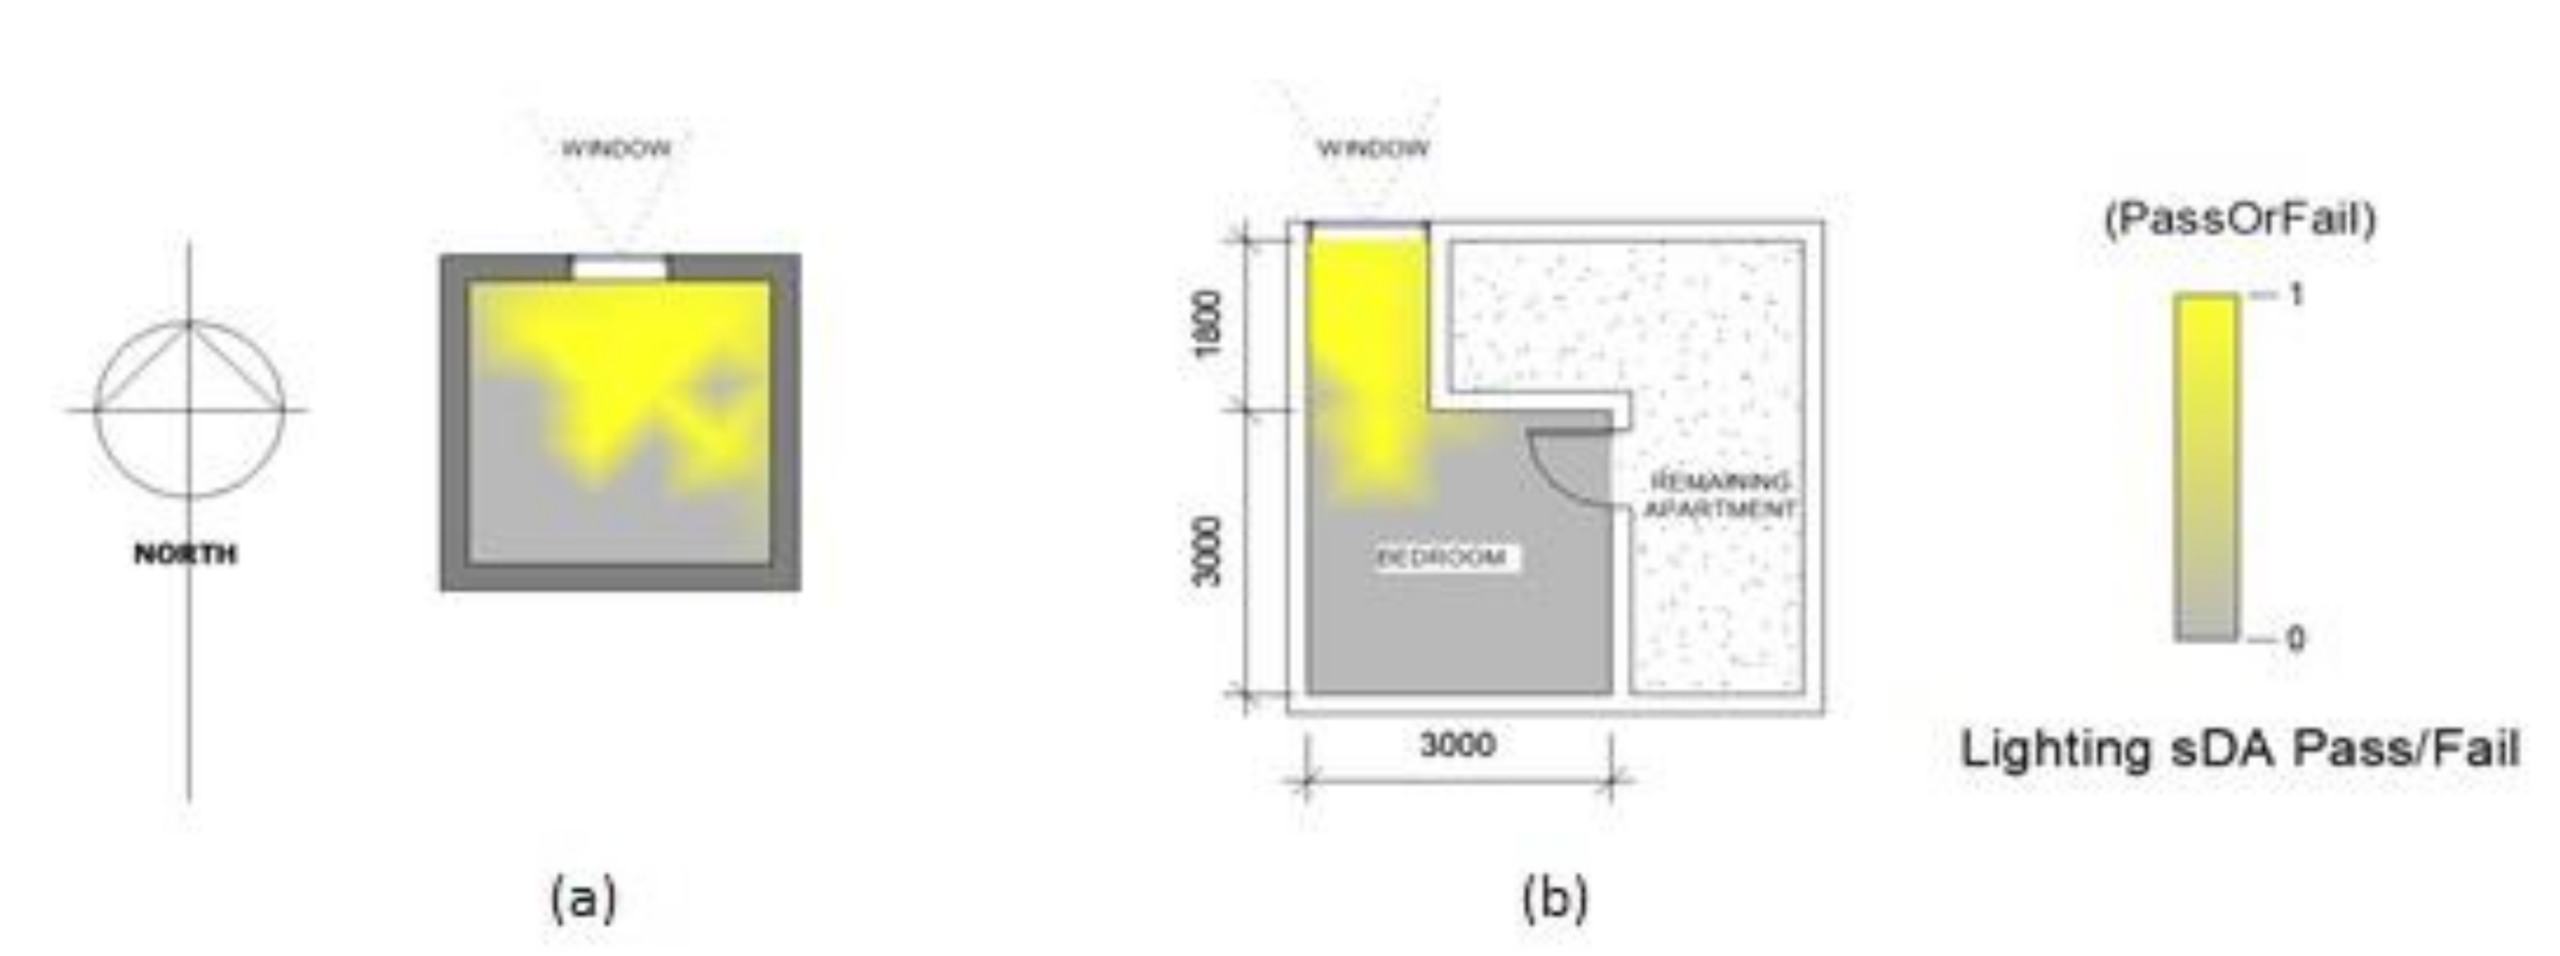
The next round of simulation, with the aim of finding the optimum size of windows focuses on those layouts which did not meet the minimum daylight levels. First, a standard layout was modelled as per the National Construction Code 2019 [31] standard, where the opening size is required to be 10% of the total floor area of the room (Figure 7a). For a standard room size of 3 m × 3 m, 10% window size is equal to 0.9 m2. Considering the minimum width of the window as 1.2 m and the height was calculated as 0.75 m. Secondly a standard snorkel layout with a size of 3 m × 3 m was modelled (Figure 7b). For windows, 1.2 m width as per the minimum width required as per Better Apartment design guide [23] was assumed. The size of the corridor is 1.8 m which is 1.5 times the opening width.
Figure 8 shows the light distribution in the standard and snorkel layout for sDA 300/50, which means minimum 300 lx for 50% of the standard operating hours from 8 a.m. to 6 p.m. The yellow coloured areas show that required standard of light scale sDA 300/50 is achieved. Pass/Fail shows if the area achieves the required standard or not, with 1 being the area equal to or above 300 lx for at least 50% of the time and zero being below 300 lx. For the snorkel layout, areas close to the window along the corridor have good illuminances whereas most part of the bedroom have very limited light levels.
In order to establish an optimum WFR, different window sizes were tested. Orientation of the room is kept as south to simulate worst case scenario, and sDA 300/50 and ASE1000/250 were analysed. WFR of 10%, 15%, 20%, 25%, 30%, 35% and 40% were simulated. For 10% WFR, sDA was only 4%. When WFR was increased to 15% and 20% sDA increased to 16% and 24% respectively. 25% WFR resulted in 32% sDA. When WFR was increased to 30%, sDA was 60% which is equivalent to 2 points as per the LEED criteria. There was not excessive light noted as demonstrated by ASE1000/250 value of less than 20%.
5. Discussion
The density of cities has raised concerns on the liveability of apartments in terms of daylight. After investigating the daylight levels in 12 apartment units, the main issues identified for daylighting were the window size and external obstructions. In scenarios where WFR ratio was more than 60%, the light levels were mostly high during the day, such as in NW large window and SW full window. However, also in cases such as West standard window and East obstructed with a WFR of nearly 30%, rooms received acceptable light levels. Orientation of these windows do influence the light levels, but the difference in the values was minimal. There were certain scenarios like North obstructed where the room was under lit even after an acceptable window size and orientation. When analysed these cases it was found that the sun was obstructed due to the presence of adjacent buildings. In West standard window the WFR was 30% and west orientation. A similar orientation in West large window shows that the room was over lit in the afternoon. Orientation has a major role in the daylight levels in a room. When designing numerous units around the same service core, it is not possible to place all the houses in the same direction suitable for daylight. However, by increasing the size of the window opposite to sun directions this problem can be easily rectified. For SW full window, WFR was almost 100% whereas for West large window it was 37% only. Incremental increase in window size of a standard layout showed that WFR between 25–30% in the south direction can achieve acceptable light levels for 55% of the floor area. Hence, for a low ambient light in a room, the issue of orientation can be rectified. A window of such size facing any direction is likely to achieve a minimum of 1% DF, however for east and west orientation, glare issues should be addressed. For cases where there are no windows, artificial lighting could be used to counterbalance circadian stimulus. For e.g., tuneable while light that can mimic daylighting and change the spectrum between 6500 K in the morning and 2700 K in the evening can be installed in these rooms.
6. Conclusions
The analysis of the daylight levels in the bedrooms of 12 selected apartment show that almost 33% of the cases have lighting levels lower than the minimum illuminances required either due to the absence of windows in the room or the window was opening to an internal space in the apartment. This was identified as a major void in the planning policies which has been amended through introducing a requirement of windows in the all the habitable rooms by the better apartment guidelines. Though this revision assured windows in the bedrooms, it failed to mandate minimum daylight levels in bedrooms. This is because the recommended opening size was too small. The corridor in the snorkel layout doesn’t assist in sunlight to reach most of areas inside the room. Simulations of the layouts showed that the bedrooms struggle to attain minimum required light levels during the day if the size of the window is less the 30% of the floor area of the room. Further studies involving a large number of apartment units monitored under varying sky conditions should also include a survey of residents to understand their satisfaction with the light levels and possible glare issues from excessive lighting. In addition, measurement of vertical illuminance will enable the accurate estimation of EML to provide a better understanding about the health effects of daylight.
Author Contributions
Conceptualization, P.R.; methodology, S.A. and P.R.; software, S.A.; validation, S.A. and P.R.; formal analysis, S.A. and P.R.; writing—original draft preparation, S.A.; writing—review and editing, P.R.; All authors have read and agreed to the published version of the manuscript.
Funding
This research received no external funding.
Conflicts of Interest
The authors declare no conflict of interest.
References
- Stevens, R.G.; Blask, D.E.; Brainard, G.C.; Hansen, J.; Lockley, S.W.; Provencio, I.; Rea, M.S.; Reinlib, L. Meeting Report: The Role of Environmental Lighting and Circadian Disruption in Cancer and Other Diseases. Environ. Health Perspect. 2007, 115, 1357–1362. [Google Scholar] [CrossRef] [PubMed] [Green Version]
- Czeisler, C.A.; Gooley, J.J. Sleep and circadian rhythms in humans. Cold Spring Harbor Symposia Quant. Biol. 2007, 72, 579–597. [Google Scholar] [CrossRef] [PubMed] [Green Version]
- Figueiro, M.G.; Kalsher, M.; Steverson, B.C.; Heerwagen, J.; Kampschroer, K.; Rea, M.S. Circadian-effective Light and Its Impact on Alertness in Office Workers. Lighting Res. 2018, 51, 171–183. [Google Scholar] [CrossRef]
- Reinhart, C.F.; Jan, W. The Daylighting Dashboard—A Simulation-based Design Analysis for Daylit Spaces. Build. Environ. 2011, 46, 386–396. [Google Scholar] [CrossRef]
- Boubekri, M.; Lee, J. A comparison of four daylighting metrics in assessing the daylighting performance of three shading systems. J. Green Build. 2017, 12, 39–53. [Google Scholar] [CrossRef]
- Dogan, T.; Ye Chan Park, Y.C. A New Framework for Residential Daylight Performance Evaluation. In Proceedings of the 15th IBPSA Conference, San Francisco, CA, USA, 7–9 August 2017. [Google Scholar]
- Aries, M.B.C.; Aarts, M.P.J.; Van Hoof, J. Daylight and Health: A Review of the Evidence and Consequences for the Built Environment. Lighting Res. Technol. 2013, 47, 6–27. [Google Scholar] [CrossRef]
- Grimaldi, S.; Partonen, T.; Saarni, S.I.; Aromaa, A.; Lönnqvist, J. Indoors Illumination and Seasonal Changes in Mood and Behavior Are Associated with the Health-Related Quality of Life. Health Qual. Life Outcomes 2008, 6, 56. [Google Scholar] [CrossRef] [PubMed]
- Brown, M.J.; Jacobs, D.E. Residential Light and Risk for Depression and Falls: Results from the LARES Study of Eight European Cities. Public Health Rep. 1974, 126, 131–140. [Google Scholar] [CrossRef] [PubMed] [Green Version]
- Andersen, M.; Gochenour, S.J.; Lockley, S.W. Modelling ‘non-visual’ Effects of Daylighting in a Residential Environment. Build. Environ. 2013, 70, 138–149. [Google Scholar] [CrossRef] [Green Version]
- Cheung, H.D.; Chung, T.M. A Study on Subjective Preference to Daylit Residential Indoor Environment Using Conjoint Analysis. Build. Environ. 2008, 43, 2101–2111. [Google Scholar] [CrossRef]
- Xue, P.; Mak, C.M.; Cheung, H.D. The Effects of Daylighting and Human Behavior on Luminous Comfort in Residential Buildings: A Questionnaire Survey. Build. Environ. 2014, 81, 51–59. [Google Scholar] [CrossRef]
- Xue, P.; Mak, C.M.; Huang, Y. Quantification of Luminous Comfort with Dynamic Daylight Metrics in Residential Buildings. Energy Build. 2016, 117, 99–108. [Google Scholar] [CrossRef]
- Acosta, I.; Campano, M.Á.; Molina, J.F. Window Design in Architecture: Analysis of Energy Savings for Lighting and Visual Comfort in Residential Spaces. Appl. Energy 2016, 168, 493–506. [Google Scholar] [CrossRef]
- IWBI International WELL Building Institute. 2020, WELL V2 Pilot, Light Exposure and Education. Available online: https://v2.wellcertified.com/v/en/light/feature/1 (accessed on 10 August 2020).
- Truong, W.; Zandi, B.; Trinh, V.Q.; Khanh, T.Q. Circadian Metric–Computation of Circadian Stimulus Using Illuminance, Correlated Colour Temperature and Colour Rendering Index. Build. Environ. 2020, 184, 107146. [Google Scholar] [CrossRef]
- Mangkuto, R.A.; Rohmah, M.; Asri, A.D. Design optimisation for window size, orientation, and wall reflectance with regard to various daylight metrics and lighting energy demand: A case study of buildings in the tropics. Appl. Energy 2016, 164, 211–219. [Google Scholar] [CrossRef]
- Konis, K A Novel Circadian Daylight Metric for Building Design and Evaluation. Build. Environ. 2017, 113, 22–38. [CrossRef]
- Shoory, M. The Growth of Apartment Construction in Australia, Reserve Bank of Australia Bulletin June Quarter. 2016. Available online: https://www.rba.gov.au/publications/bulletin/2016/jun/pdf/bu-0616-3.pdf (accessed on 5 September 2019).
- Hodyl, L. 2014, To investigate planning policies that deliver positive social outcomes in hyper-dense, high-rise residential environments, The Winston Churchill Memorial Trust Australia, Churchill Trust, Australia. Available online: https://www.churchilltrust.com.au/project/?id=PR0014010 (accessed on 10 September 2019).
- Horne, R.; Nethercote, M. 2015, ‘Life in a Windowless Box: The Vertical Slums of Melbourne’ The Fifth State, 18 May, viewed 17 August. Available online: https://www.thefifthestate.com.au/innovation/design/life-in-awindowless-box-the-vertical-slums-of-melbourne/74004/ (accessed on 5 September 2019).
- Wynne, R. 2015, ‘The Planning Minister Richard Wynne on Better Apartments’, Urban, 3 June, viewed 14 August 2019. Available online: https://www.urban.com.au/news/the-planning-minister-richard-wynne-on-betterapartments (accessed on 5 September 2019).
- Victoria State Government. 2017, Apartment Design Guidelines for Victoria, Australia. Available online: https://www.planning.vic.gov.au/__data/assets/pdf_file/0030/80994/Apartment-Design-Guidelines-for-Victoria_August-2017.pdf (accessed on 10 August 2019).
- Australian Building Codes Board. (2011) Building Code of Australia: National Construction Code 2019 Volume 1. Available online: https://ncc.abcb.gov.au/20/05/19 (accessed on 1 September 2019).
- Australian/New Zealand Standard™. Interior and Workplace Lighting–General Principles and Recommendations; Standards Australia: Sydney, Australia; Standards New Zealand: Wellington, New Zealand, 2006; AS/NZS 1680.1:2006. [Google Scholar]
- The Illuminating Engineering Society of North America (IES). IESNA 2013, LM-83-12: Approved Method: IES Spatial Daylighting Autonomy (sDA) and Annual Sunlight Exposure (ASE). Available online: http://www.ies.org/store/product/approved-method-ies-spatial-daylight-autonomysda-and-annual-sunlight-exposure-ase-1287.cfm (accessed on 20 October 2019).
- BESS, Built Environment Sustainability Scorecard. 2020, Muncipal Authority of Victoria. Available online: https://bess.net.au/ (accessed on 5 August 2020).
- BS EN 17037:2018. Daylight in Buildings; British Standards Institution: London, UK, 2008. [Google Scholar]
- U.S. Green Building Council. LEED v4 for Homes Design and Construction; USGBC: Washington, DC, USA, 2019. [Google Scholar]
- Green Building Council of Australia. (2020) GreenStar Design & As-Built v1.2 Submission Guidelines. Available online: https://new.gbca.org.au/rate/rating-system/design-and-built/ (accessed on 10 August 2020).
- Australian Building Codes Board. (2019) Building Code of Australia: National Construction Code 2019 Volume 2. Available online: https://ncc.abcb.gov.au/20/05/19 (accessed on 5 September 2019).
Figure 1.
(a) High rise apartments in Melbourne. (b) Light borrowed from the living room.
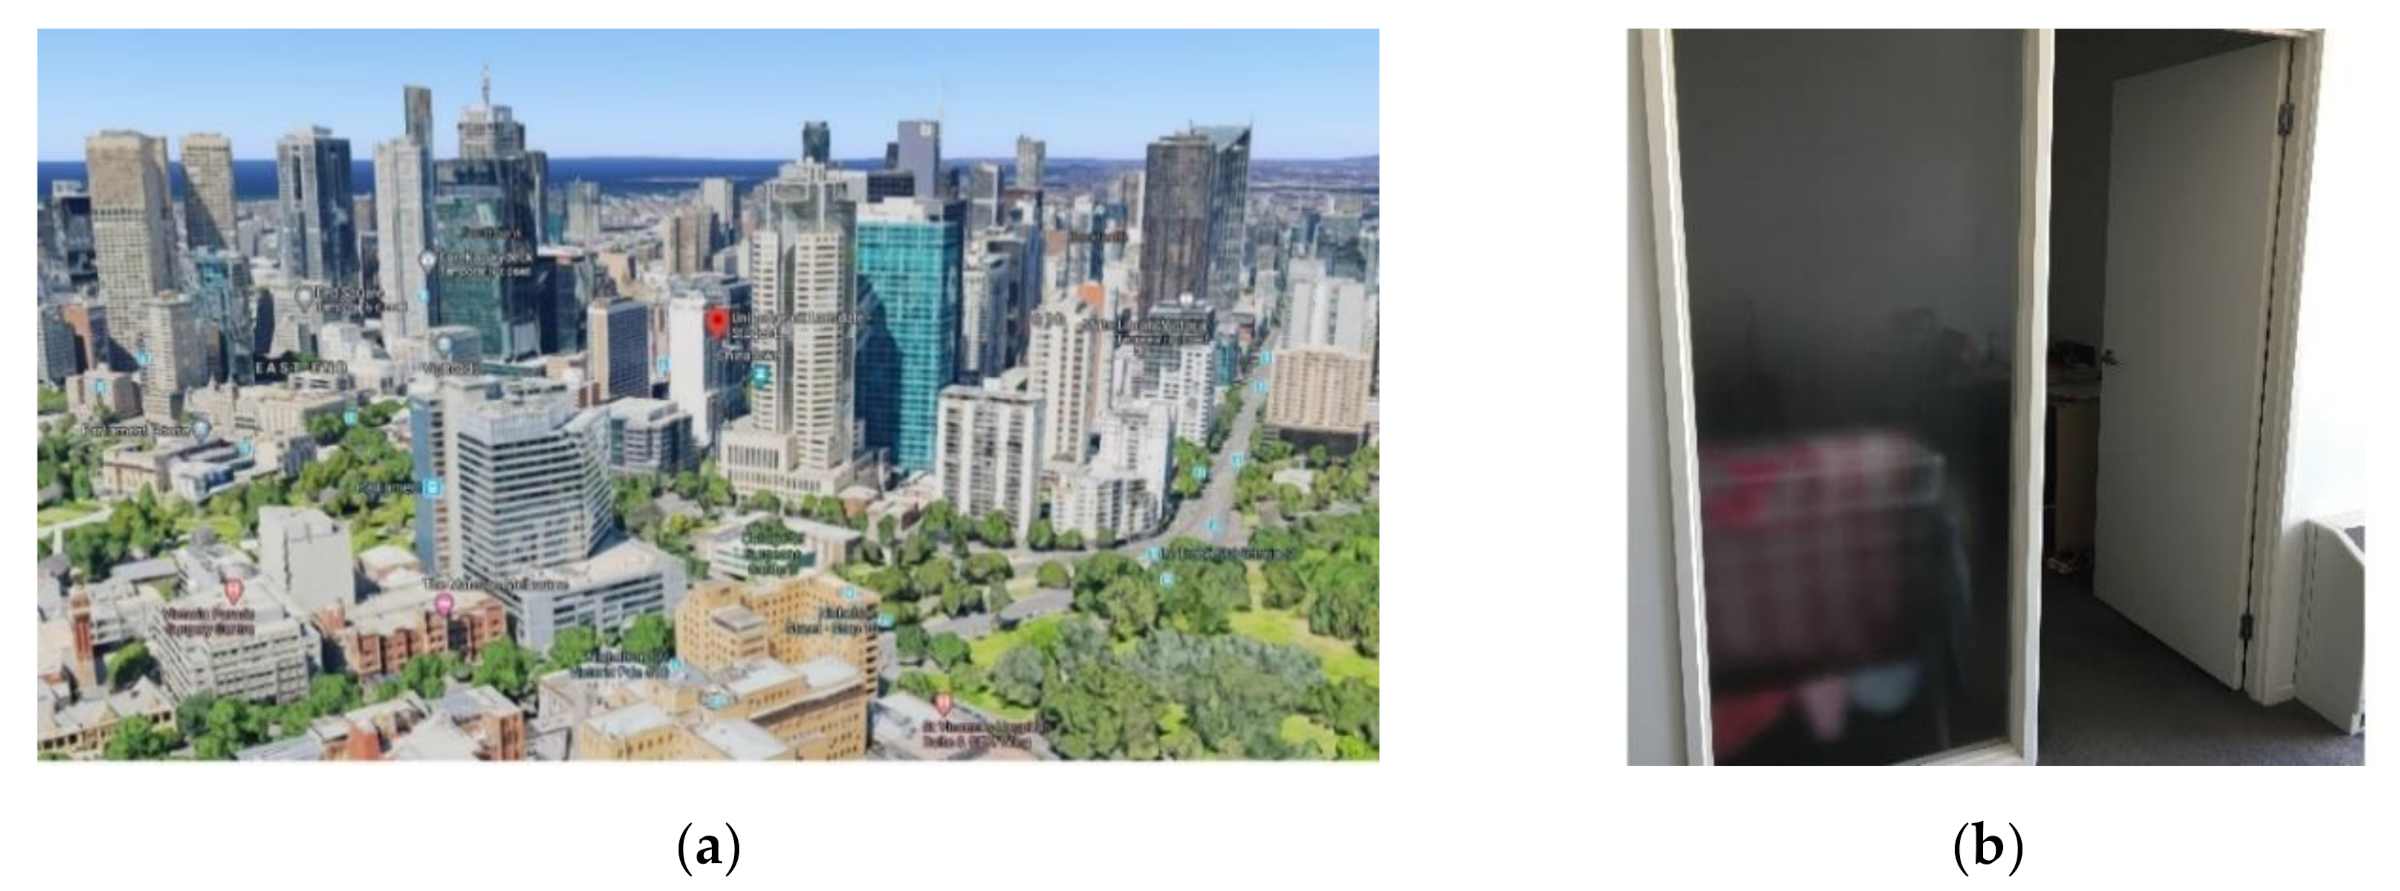
Figure 2.
Plan showing the snorkel design window as per Victoria Planning Provision Amendment VC136.
Figure 2.
Plan showing the snorkel design window as per Victoria Planning Provision Amendment VC136.

Figure 3.
(a) Measurement location in the bedroom (b) measuring external illuminance.

Figure 4.
View from the bedroom: (a) pleasant (b) standard (c) obstructed.

Figure 5.
Distribution of illuminances: (a) 9 a.m. (b) 3 p.m.


Figure 6.
Percentage of daylight at 9 a.m. and 3 p.m.
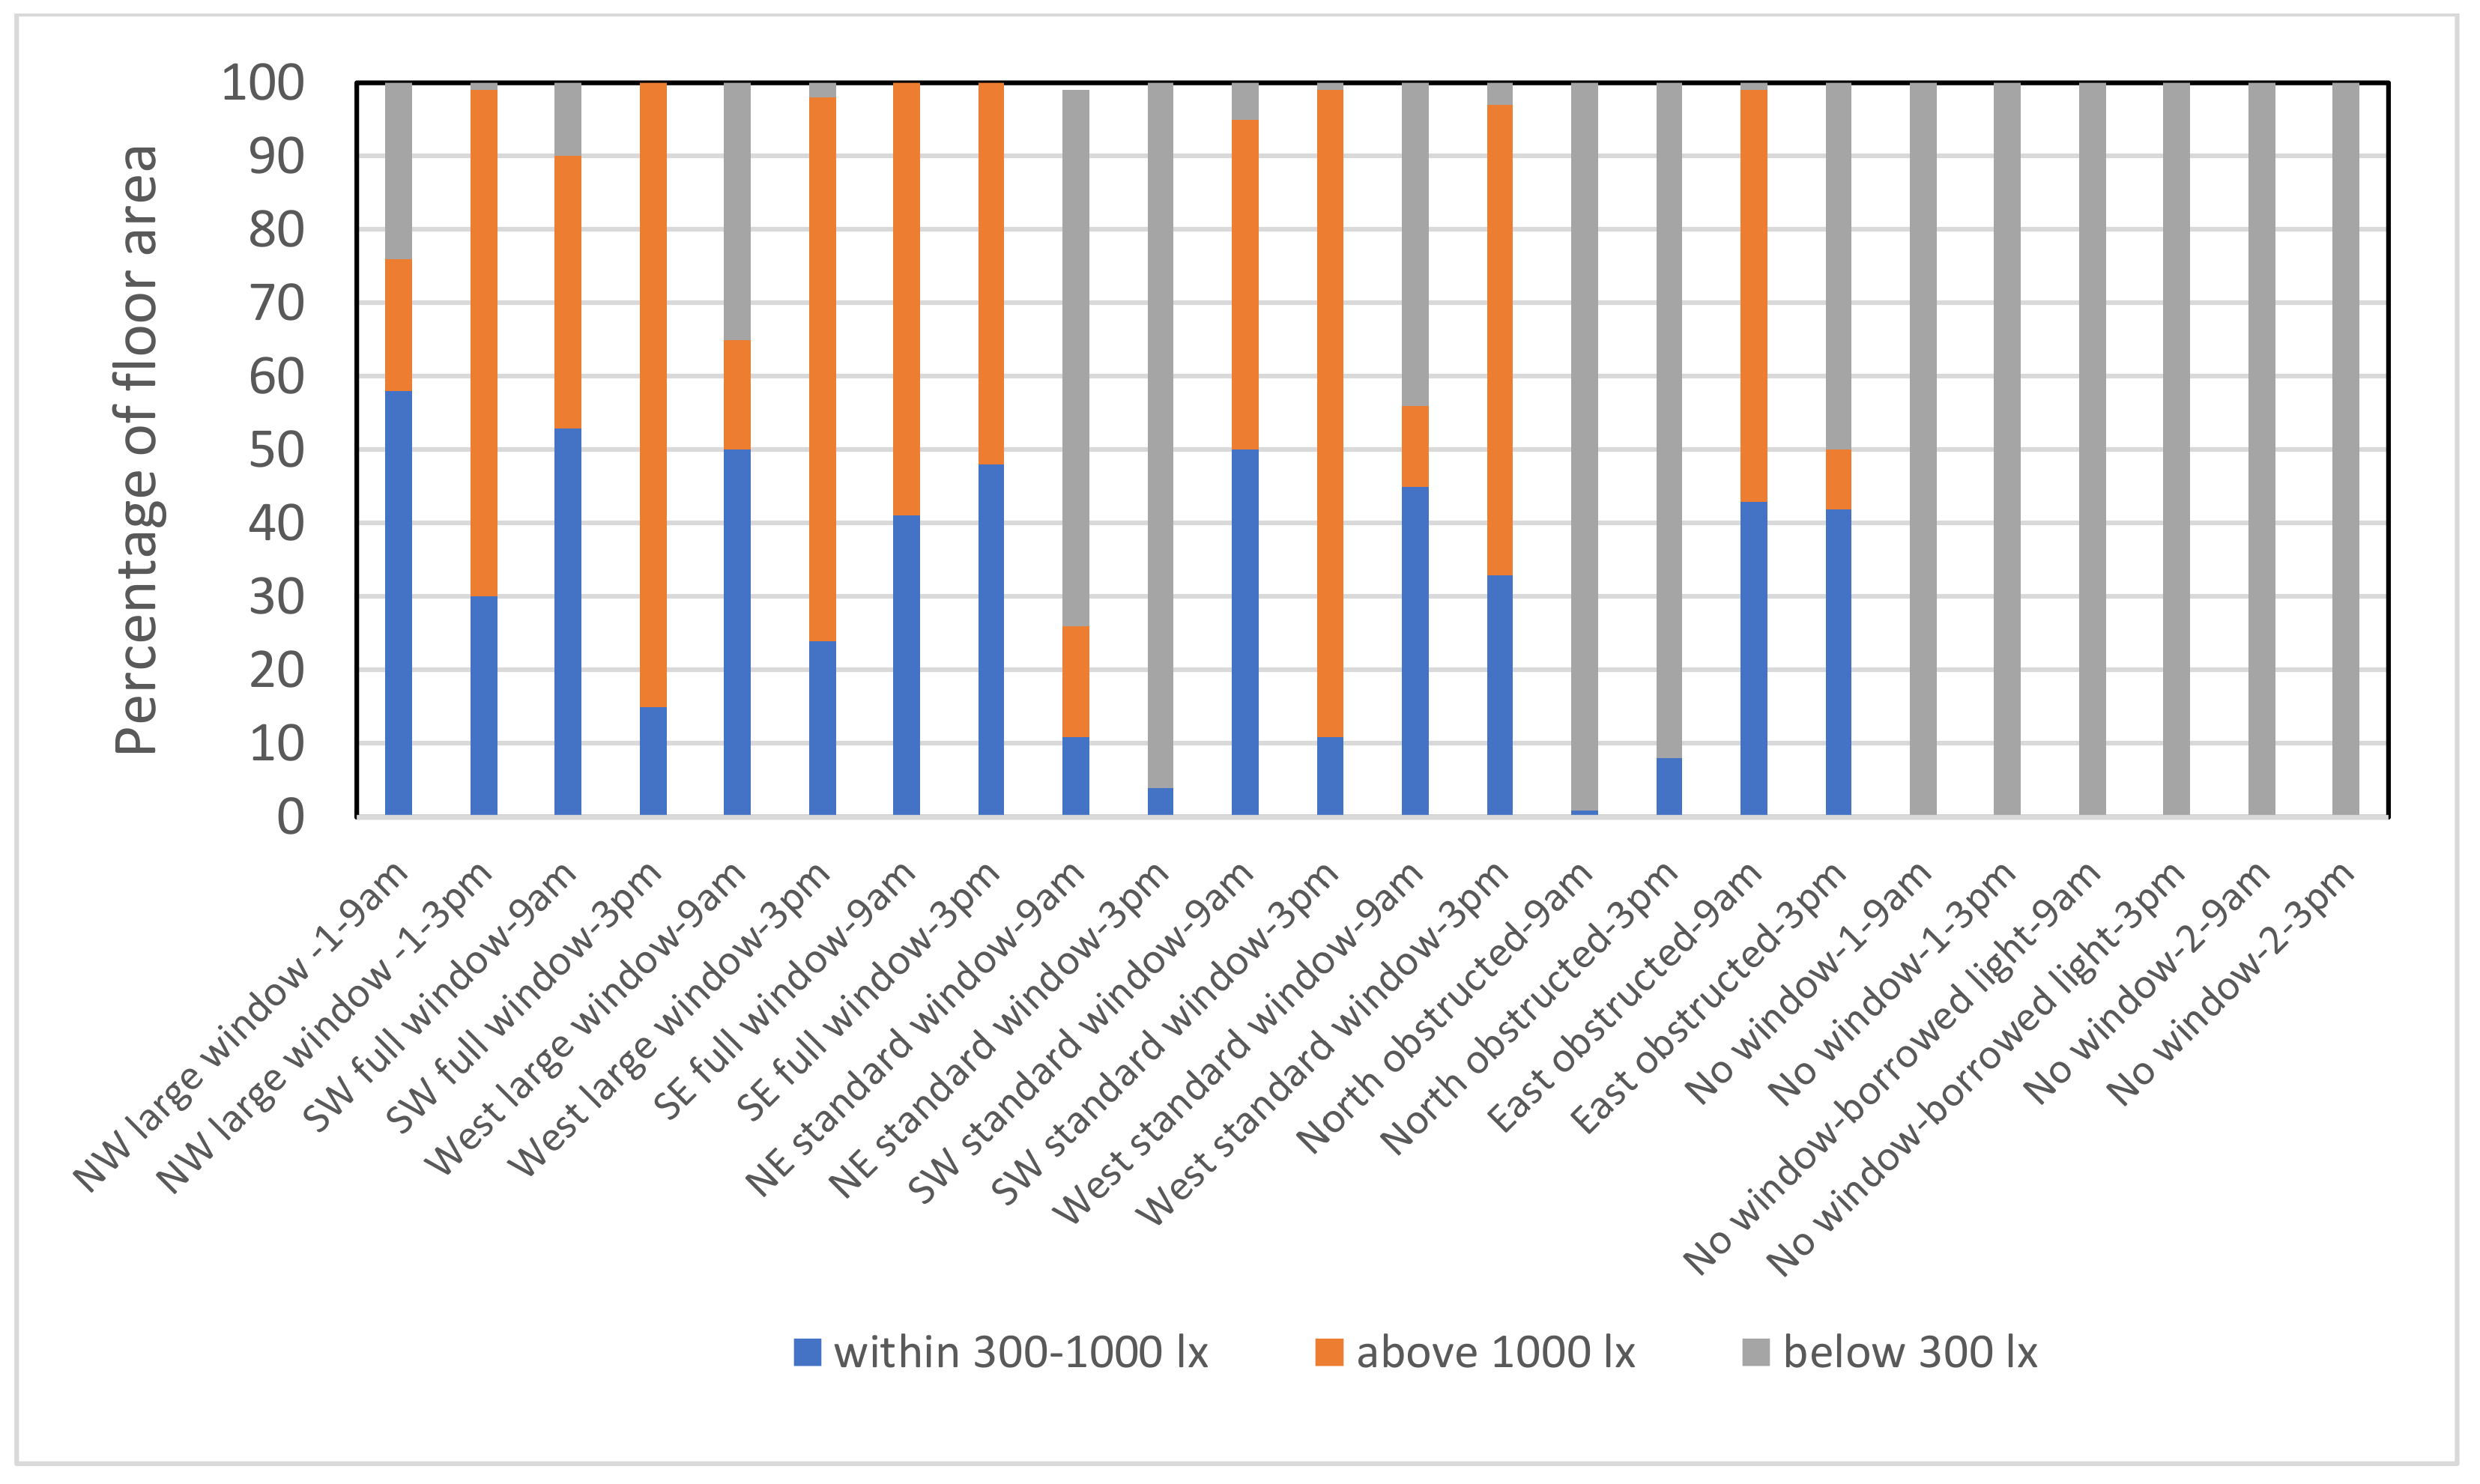
Figure 7.
(a) Bedroom with standard layout. (b) Snorkel layout.

Figure 8.
Light distribution as sDA in (a) standard layout (b) Snorkel layout.


Table 1.
Details of the apartment units.
| Case No. | Name | Year of Construction | Floor Level | Bedroom Size (m2) | Window Size (m2) | Window Orientation | Window to Floor Ratio (%) | Views |
|---|---|---|---|---|---|---|---|---|
| 1 | NW large window | 2007 | 22 | 9 | 6 | North-West | 66 | 1 |
| 2 | SW full window | 2016 | 37 | 7 | 7 | South-West | 100 | 1 |
| 3 | West large window | 2009 | 1 | 8 | 3 | West | 37.5 | 1 |
| 4 | SE full window | 2016 | 13 | 7 | 7 | South-East | 100 | 1 |
| 5 | NE standard window | 2016 | 25 | 7 | 2 | North-East | 30 | 2 |
| 6 | SW standard window | 2004 | 12 | 6 | 3.8 | South-West | 62.5 | 2 |
| 7 | West standard window | 2003 | 11 | 6 | 2 | West | 33 | 2 |
| 8 | North obstructed | 2007 | 11 | 8 | 2 | North | 30 | 3 |
| 9 | East obstructed | 2009 | 1 | 8 | 2 | East | 27 | 3 |
| 10 | No window-1 | 2016 | 37 | 7 | 0 | No Window | 0 | 4 |
| 11 | No window-borrowed light | 2003 | 11 | 4.5 | 2 | Borrowed | 44 | 4 |
| 12 | No window-2 | 2016 | 25 | 7 | 0 | No Window | 0 | 4 |
Table 2.
Measured daylight levels.
| Case Name | Internal Illuminance (lx) | EML | External Illuminance (lx) | Ratio of Internal to External Illuminance | |||
|---|---|---|---|---|---|---|---|
| Next to Window | Away from Window | Next to Window | Away from Window | Next to Window | Away from Window | ||
| NW large window | 2093 | 78 | 2302 | 86 | 5332 | 39.5 | 1.5 |
| SW full window | 6613 | 602 | 7274 | 662 | 31,644 | 21 | 2 |
| West large window | 1637 | 320 | 1801 | 352 | 45,000 | 3.5 | 0.7 |
| SE full window | 1258 | 94 | 1384 | 103 | 6753 | 18.5 | 1.4 |
| NE standard window | 2203 | 79 | 2423 | 87 | 31,644 | 7 | 0.3 |
| SW standard window | 1731 | 993 | 1904 | 1092 | 5122 | 4 | 0.6 |
| West standard window | 1639 | 341 | 1803 | 375 | 45,000 | 3.5 | 0.75 |
| North obstructed | 375 | 5 | 413 | 6 | 6728 | 5.5 | 0.07 |
| East obstructed | 1459 | 94 | 1605 | 103 | 45,000 | 3 | 0.2 |
| No window-1 | 3 | 3 | 3 | 3 | 5122 | 0.05 | 0.05 |
| No window-borrowed light | 85 | 12 | 94 | 13 | 45,000 | 0.2 | 0.02 |
| No window-2 | 5 | 5 | 6 | 6 | 6728 | 0.07 | 0.07 |
Table 3.
Annual daylight percentage.
| Case Names | sDA300/50 (%) | ASE 1000/250 (%) | LEED Points | WELL Points |
|---|---|---|---|---|
| NW large window | 84 | 44 | 0 | 2 |
| SW full window | 100 | 45 | 0 | 2 |
| West large window | 96 | 58 | 0 | 2 |
| SE full window | 95 | 0 | 3 | 2 |
| NE standard window | 55 | 25 | 0 | 1 |
| SW standard window | 94 | 62 | 0 | 2 |
| West standard window | 56 | 62 | 0 | 1 |
| North obstructed | 10 | 10 | 0 | 0 |
| East obstructed | 71 | 12 | 2 | 1 |
| No window-1 | 15 | 5 | 0 | 0 |
| No window-borrowed light | 0 | 0 | 0 | 0 |
| No window-2 | 15 | 10 | 0 | 0 |
© 2020 by the authors. Licensee MDPI, Basel, Switzerland. This article is an open access article distributed under the terms and conditions of the Creative Commons Attribution (CC BY) license (http://creativecommons.org/licenses/by/4.0/).
Share and Cite
MDPI and ACS Style
Abidi, S.; Rajagopalan, P. Investigating Daylight in the Apartment Buildings in Melbourne, Australia. Infrastructures 2020, 5, 81. https://0-doi-org.brum.beds.ac.uk/10.3390/infrastructures5100081
AMA Style
Abidi S, Rajagopalan P. Investigating Daylight in the Apartment Buildings in Melbourne, Australia. Infrastructures. 2020; 5(10):81. https://0-doi-org.brum.beds.ac.uk/10.3390/infrastructures5100081
Chicago/Turabian StyleAbidi, Sehar, and Priyadarsini Rajagopalan. 2020. "Investigating Daylight in the Apartment Buildings in Melbourne, Australia" Infrastructures 5, no. 10: 81. https://0-doi-org.brum.beds.ac.uk/10.3390/infrastructures5100081