Article

The Structural Diagnosis of Existing RC Buildings: The Role of Nondestructive Tests in the Case of Low Concrete Strength

Department of Architecture, Roma Tre University, Largo G. Marzi 10, 00153 Rome, Italy
*
Author to whom correspondence should be addressed.
Submission received: 28 October 2020 / Revised: 5 November 2020 / Accepted: 6 November 2020 / Published: 12 November 2020

Abstract

:
In the structural safety assessment process of existing structures, knowledge of the mechanical properties of the materials is key. Different experimental activities carried out on materials extracted from existing reinforced concrete buildings show a high strength variability, especially concrete. In the past, the lack of standardized quality control for materials and workmanship caused nonuniform and homogeneous properties within the same structure. The most accurate and reliable experimental technique consists of performing direct tests on the materials, but these are considerably expensive and invasive. In this paper, alternative indirect methods that estimate material properties by correlating different physical measures were proved to reduce invasive inspections on existing buildings and infrastructures, especially in built heritage. A complete experimental activity concerning destructive and nondestructive tests was conducted on elements (four portions of a column and a beam portion) removed from an Italian school building built in 1940. Destructive and nondestructive methods were compared and appropriate correlation laws developed to predict the main mechanical properties of the studied material. Reliable correlations were identified considering the pull-out test, Sonic–Rebound (SonReb) combined method and ultrasonic pulse velocities (UPVs). The latter were mapped by tomography, which highlighted the compression properties of concrete in the different structural sections.

1. Introduction

The diagnostic phase is crucial for structural safety evaluation, especially for monitoring and maintenance processes. In Europe, particularly in Italy, many existing reinforced concrete (RC) structures show an advanced state of degradation since they were built over 50 years ago, which is the usual working lifetime for ordinary structures. The aging of this reinforced concrete heritage requires paying more attention to the evaluation of material properties since no information is available concerning the mechanical characteristics of the original construction materials. For these reasons, to assess an existing reinforced concrete (RC) building, a significant experimental campaign is needed. Experimental tests must be conducted in such a way to avoid high structural damage. Nondestructive tests (NDTs) or semidestructive tests (SDTs) play an important role in reducing the number of specimens that can be extracted from the structure for destructive tests (DTs). The advantage of SDT and NDT test methods is that they can be used extensively with limited damage, i.e., without damage to the existing structures. The drawback is that the measured values are not of a mechanical nature, as in the case of DT tests, which implies a need for reliable correlation laws. Among the indirect methods for concrete, the most common NDTs are the ultrasonic pulse velocity test, which measures the longitudinal wave propagation speed, and the rebound hammer, which measures the hardness of the concrete surface. Both measures are often used in a combined solution well known as the SonReb method [1,2], which allows a reliable prediction of the compression properties of concrete [3]. The most used SDT methods are the pull-out test and the Windsor Probe test. The most suitable solution, as highlighted by several authors and standards [4,5,6,7], is to use indirect measures (NDTs) together with mechanical properties measured from a reduced number of direct compression (DTs) tests on cores.
In this paper, the reliability of results from indirect methods was tested on structural elements extracted from an existing reinforced concrete school building. This school was located in Tuscany and demolished in 2003 for a structural safety deficiency. Four portions of columns and one beam were transported to the Proof Testing and Research in Structures and Materials (PRiSMa) Laboratory of Roma Tre University, where the authors had already described similar experiences in the field of diagnosis on existing reinforced concrete elements [8,9,10]. It is to be noted that in the above-mentioned research, as well as in the school building presented, the specimens are real RC elements removed from an existing building.
Firstly, the concrete compressive strength and stabilized elastic modulus were calculated for twenty concrete cores. The correlation law between the resulting modulus of elasticity and concrete strength was compared with those given by the European [11] and American Standards [12] to highlight problems related to the evaluation of the elastic properties of the old and low-strength concrete. Secondly, ultrasonic pulse velocity, SonReb and pull-out tests were performed to evaluate proper correlations with the concrete strength and modulus of elasticity. A focus was subsequently put on tomography, which allowed mapping wave propagation velocity and detecting flaws in concrete [13]. Finally, conventional compression tests and a three-point bending test were carried out on removed columns and beams to validate the efficiency of indirect methods in predicting mechanical properties.

2. Case Study

The experimental activity was conducted on five reinforced concrete specimens extracted from the structure of an Italian school building demolished in 2003 (Figure 1). The building, located in Tuscany (Aulla (MS)), was built in 1940 (ground and first floor) and completed in 1957 (second floor). To exclude attacks from chemical agents attributable to sulfates and chlorides, which could modify the properties of the materials and the durability of the structural element, the five elements were stored until the beginning of the tests in controlled environmental conditions in a covered location inside the laboratory. To evaluate the carbonation of the concrete, a phenolphthalein hydroalcoholic solution was applied to the concrete cores. Core drilling and steel extractions for direct tests (Section 3), as well as indirect measures (Section 4), were performed on two column portions and the beam. The remaining column portions were subjected to cyclic compression tests and the beam to a three-point bending test (Section 6).

3. Direct Tests on Materials

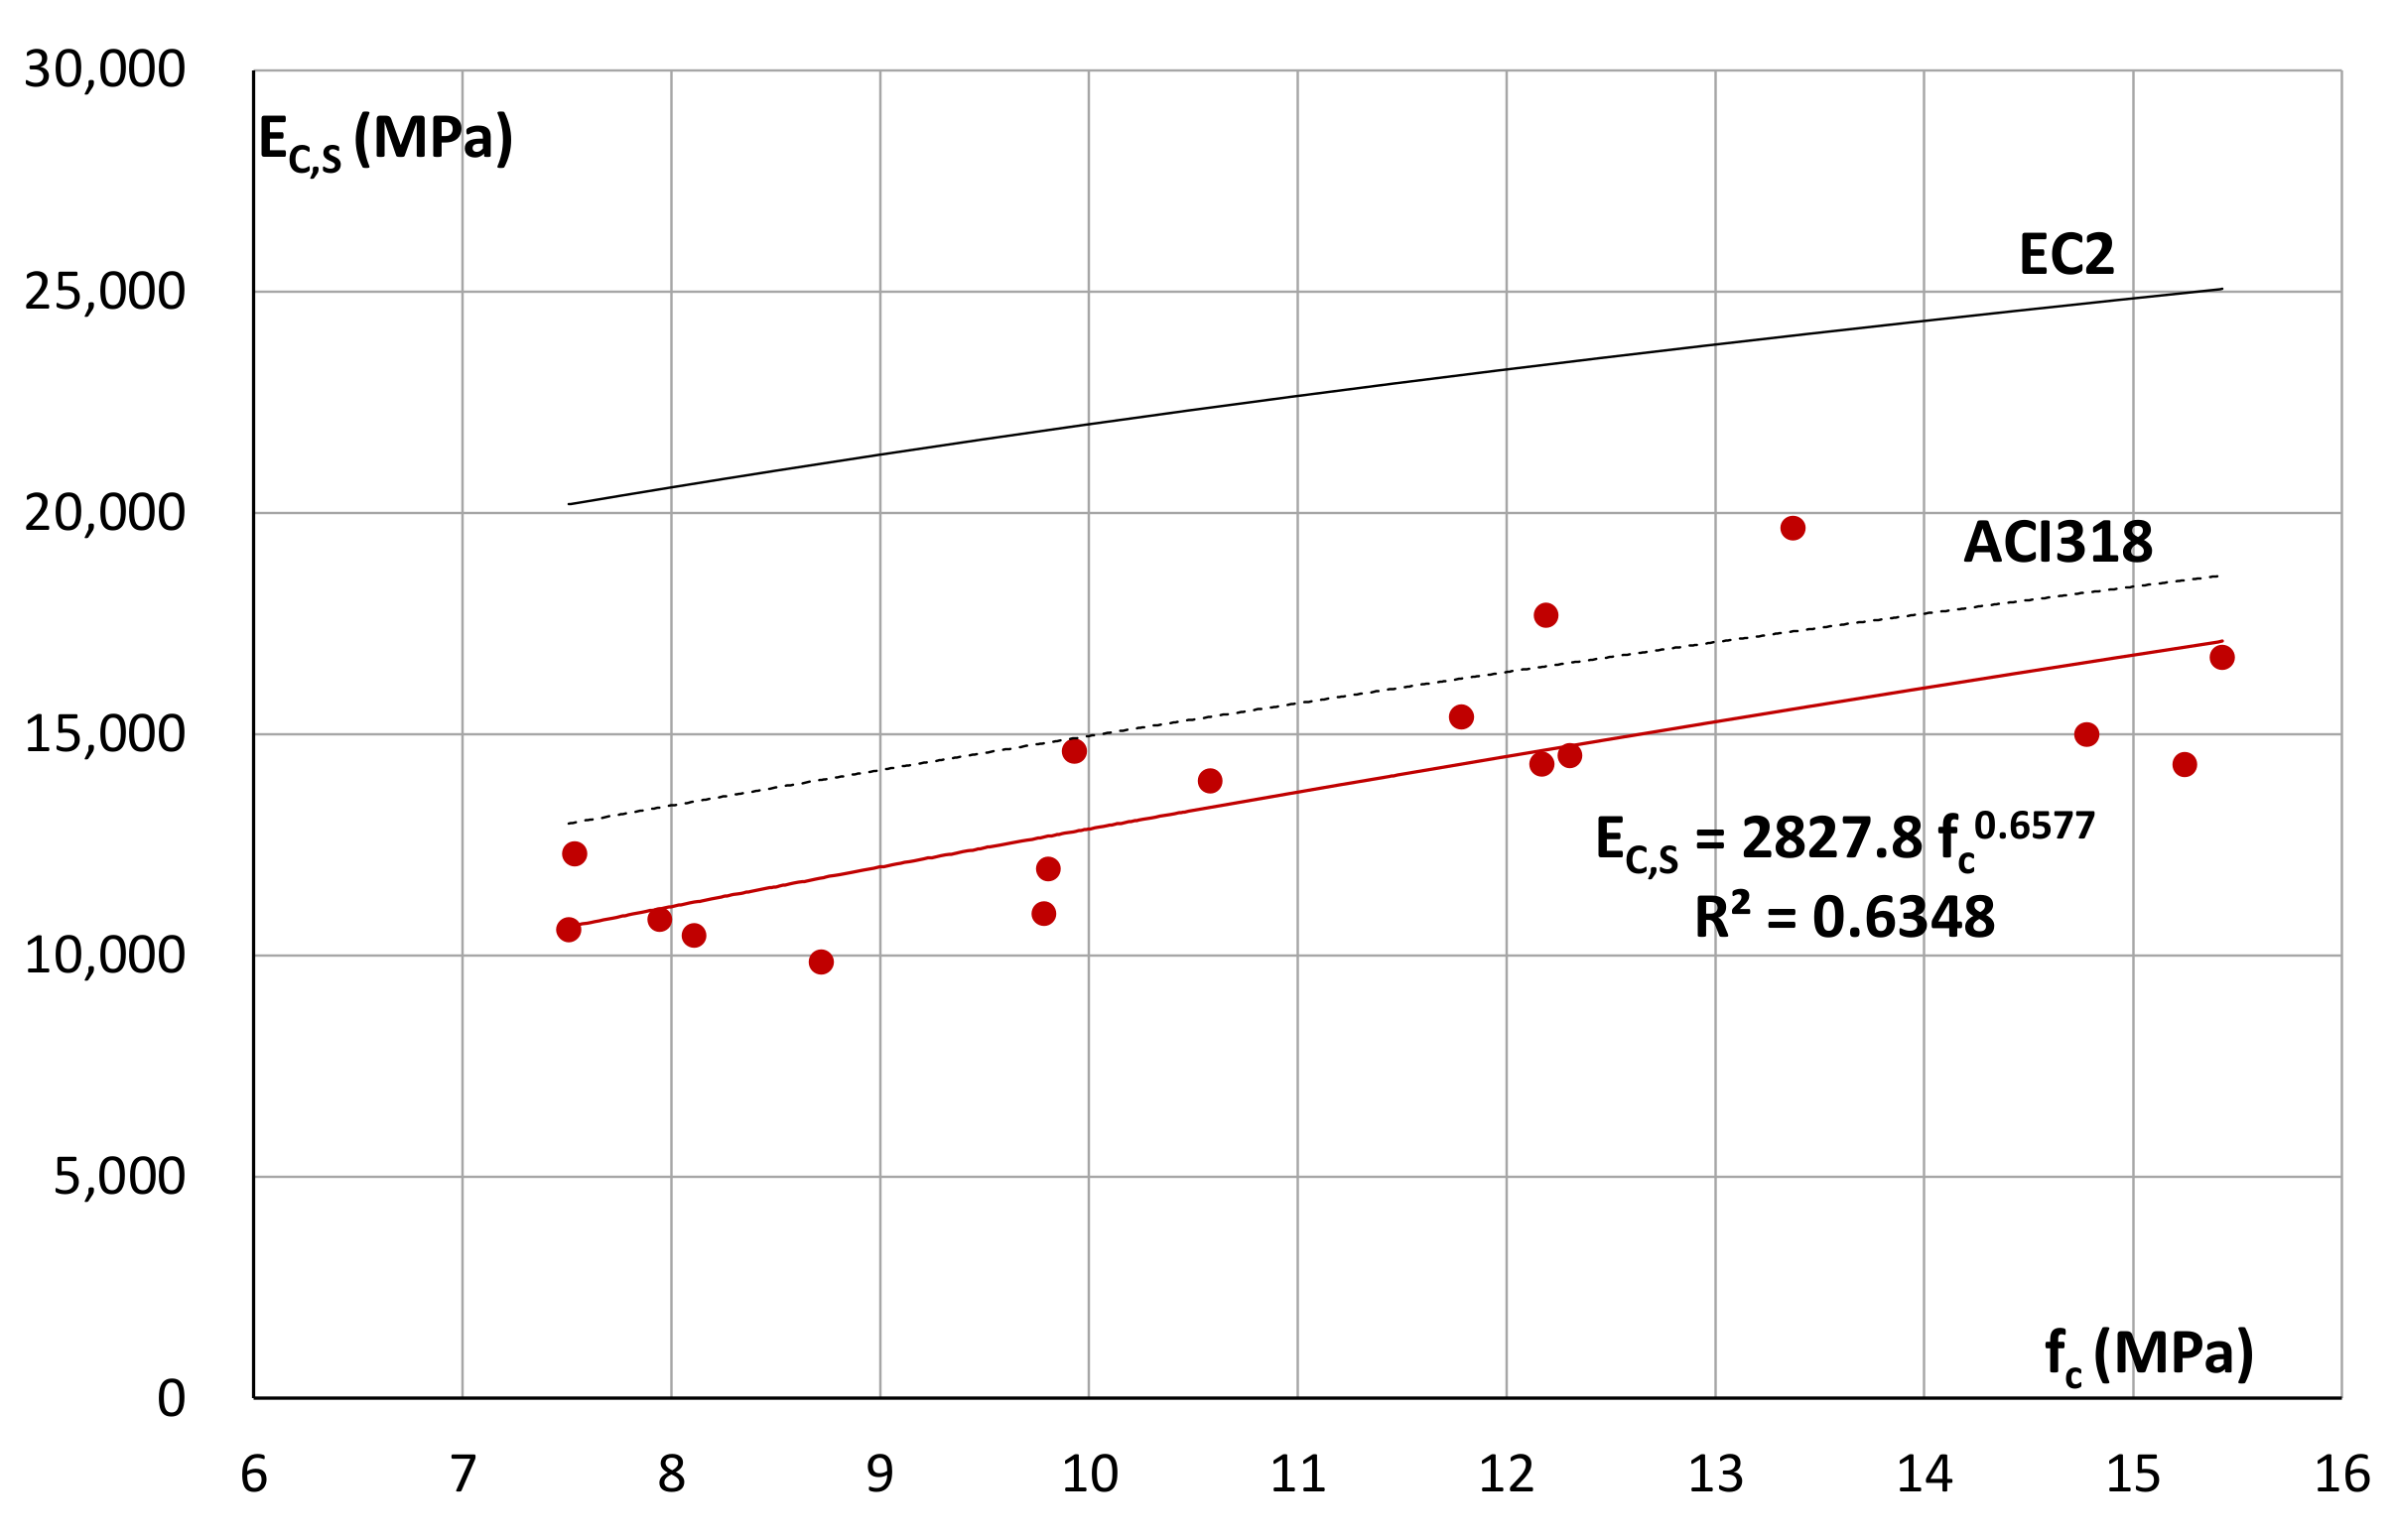
3.1. Compression Test on Cylindrical Concrete Specimens

Compression tests on cylindrical specimens extracted directly from the structure are the most reliable solution to estimate the in-place concrete strength, giving a direct mechanical measure, even if some geometrical and physical factors affect the result. For this reason, the FEMA274 [14] suggest using calibration factors in order to correct the obtained core strength:
fc = Fd · Fmc · Fr · FΦ · FH/Φ · ftest
where Fd considers the damage induced by drilling, Fmc is related to the moisture condition, Fr considers the possible presence of reinforcing steel, FΦ depends on the diameter of the specimen, and FH/Φ depends on the height/diameter ratio. During the experimental activities, 20 cores with a diameter of 94 mm were extracted by drilling from the structural elements: four from the second-floor column (29 cm × 29 cm) (CL II-2), six from the first-floor column (28 × 40 cm) (CL I-1), and 10 from the undamaged areas of the beam (BEAM) after the bending test. Some of the latter cores were long enough to obtain two specimens. Subsequently, from 10 cores, 17 specimens were obtained. Finally, 27 specimens were available, 17 of which had a H/F ratio equal to 2. This ratio allowed performing the compression test, including the determination of the secant modulus of elasticity, according to the European Standard EN 12390-13:2013 [15]. The remaining specimens with a H/F ratio of less than 2 were subjected to a compression test only. Their strength values were used to calibrate the three load cycles, required by EN 12390-13 to be set between 1/10 and 1/3 of the estimated ultimate load. The stabilized modulus (EC,Sm) was computed on the third loading branch of the stress–strain graph, where the strains were measured using three strain gages with a gage length of 80 mm, applied at 120° along the cylindrical surface. All the tests were performed with the 500 kN capacity universal machine MTS810. The resulting compressive strengths were corrected using the calibration factors proposed in FEMA274 [14].
Table 1 summarizes the results for each element, giving the mean value of the concrete cylindrical strength (fc,m) and the stabilized modulus (EC,Sm) together with the number of the specimens (N) and the relative coefficient of variation (CV).
Results show a considerably low concrete strength, especially for the second floor of the building, confirming why the school was demolished. It is interesting to compare the correlation law found between the compression strength and the modulus of elasticity with the relationships given by the European and American Standards [11,12]. Figure 2 shows how the two standards, particularly the European Standard, give an overestimate of EC, though the three lines are almost parallel. Several authors in the literature also highlighted the problem relative to the estimation of the modulus of elasticity for existing low-strength concrete [16,17], considering its importance for a reliable structural analysis.

3.2. Tensile Test on Steel Reinforcement

The variability of the steel reinforcement strength is usually lower than the concrete strength; for this reason, NDTs are less common for evaluating steel strength. However, for concrete, the destructive tests performed on few samples extracted from the structure are the most reliable for estimating the mechanical characteristics of the steel rebars, such as stiffness and strength.
Concerning the case study, several tensile tests were performed on the longitudinal (L) and transversal (T) smooth rebars, extracted from the column specimens CL I-1 and CL II-2 and the beam (BEAM) after the bending test. The tensile tests were performed with the 500 kN capacity universal machine MTS810, and the strains were measured using an axial extensometer with a gage length of 50 mm. In Table 2, the number of specimens for each group (N), the diameter (Φ), and the mean values of the yield strength (σy,m), ultimate strength (σu,m), and elastic modulus (Es,m), with the relative coefficients of variation (CV), are reported. However, in some cases, the modulus of elasticity was determined just for one specimen within the group and therefore the coefficient of variation is zero.
Results show mean values of the yield and ultimate strength corresponding to the typical smooth steel rebars employed in Italy during the 1940s and 1950s [18]. The coefficients of variation of the yield strength are generally low, except for the longitudinal rebars extracted from the beam, probably because they were evaluated according to different positions along the element (midspan, intermediate, and support) and then were differently stressed during the bending test.

4. Indirect Test Methods

NDT tests are considerably suitable especially for ancient buildings; however, as already observed in the introduction, they require correlation laws between the in-place measurements and the concrete strength, which can be computed on a case-by-case basis.
In order to estimate the mechanical properties of concrete, the most common nondestructive techniques are the rebound hammer test, the ultrasonic pulse velocity method, and the SonReb combined method, as well as the semidestructive pull-out test. These methods are mainly supported by the code framework [19,20,21]. However, the strength quality estimation may be affected by many uncertainties caused by the testing methods, the physical properties of the material, the reliability of the NDT–strength relationship, human factors, and so on [1].
In this section, results from the application of the main semidestructive and nondestructive methods for the concrete strength estimation on the structural elements from the school structure are presented to increase knowledge concerning their interpretation.

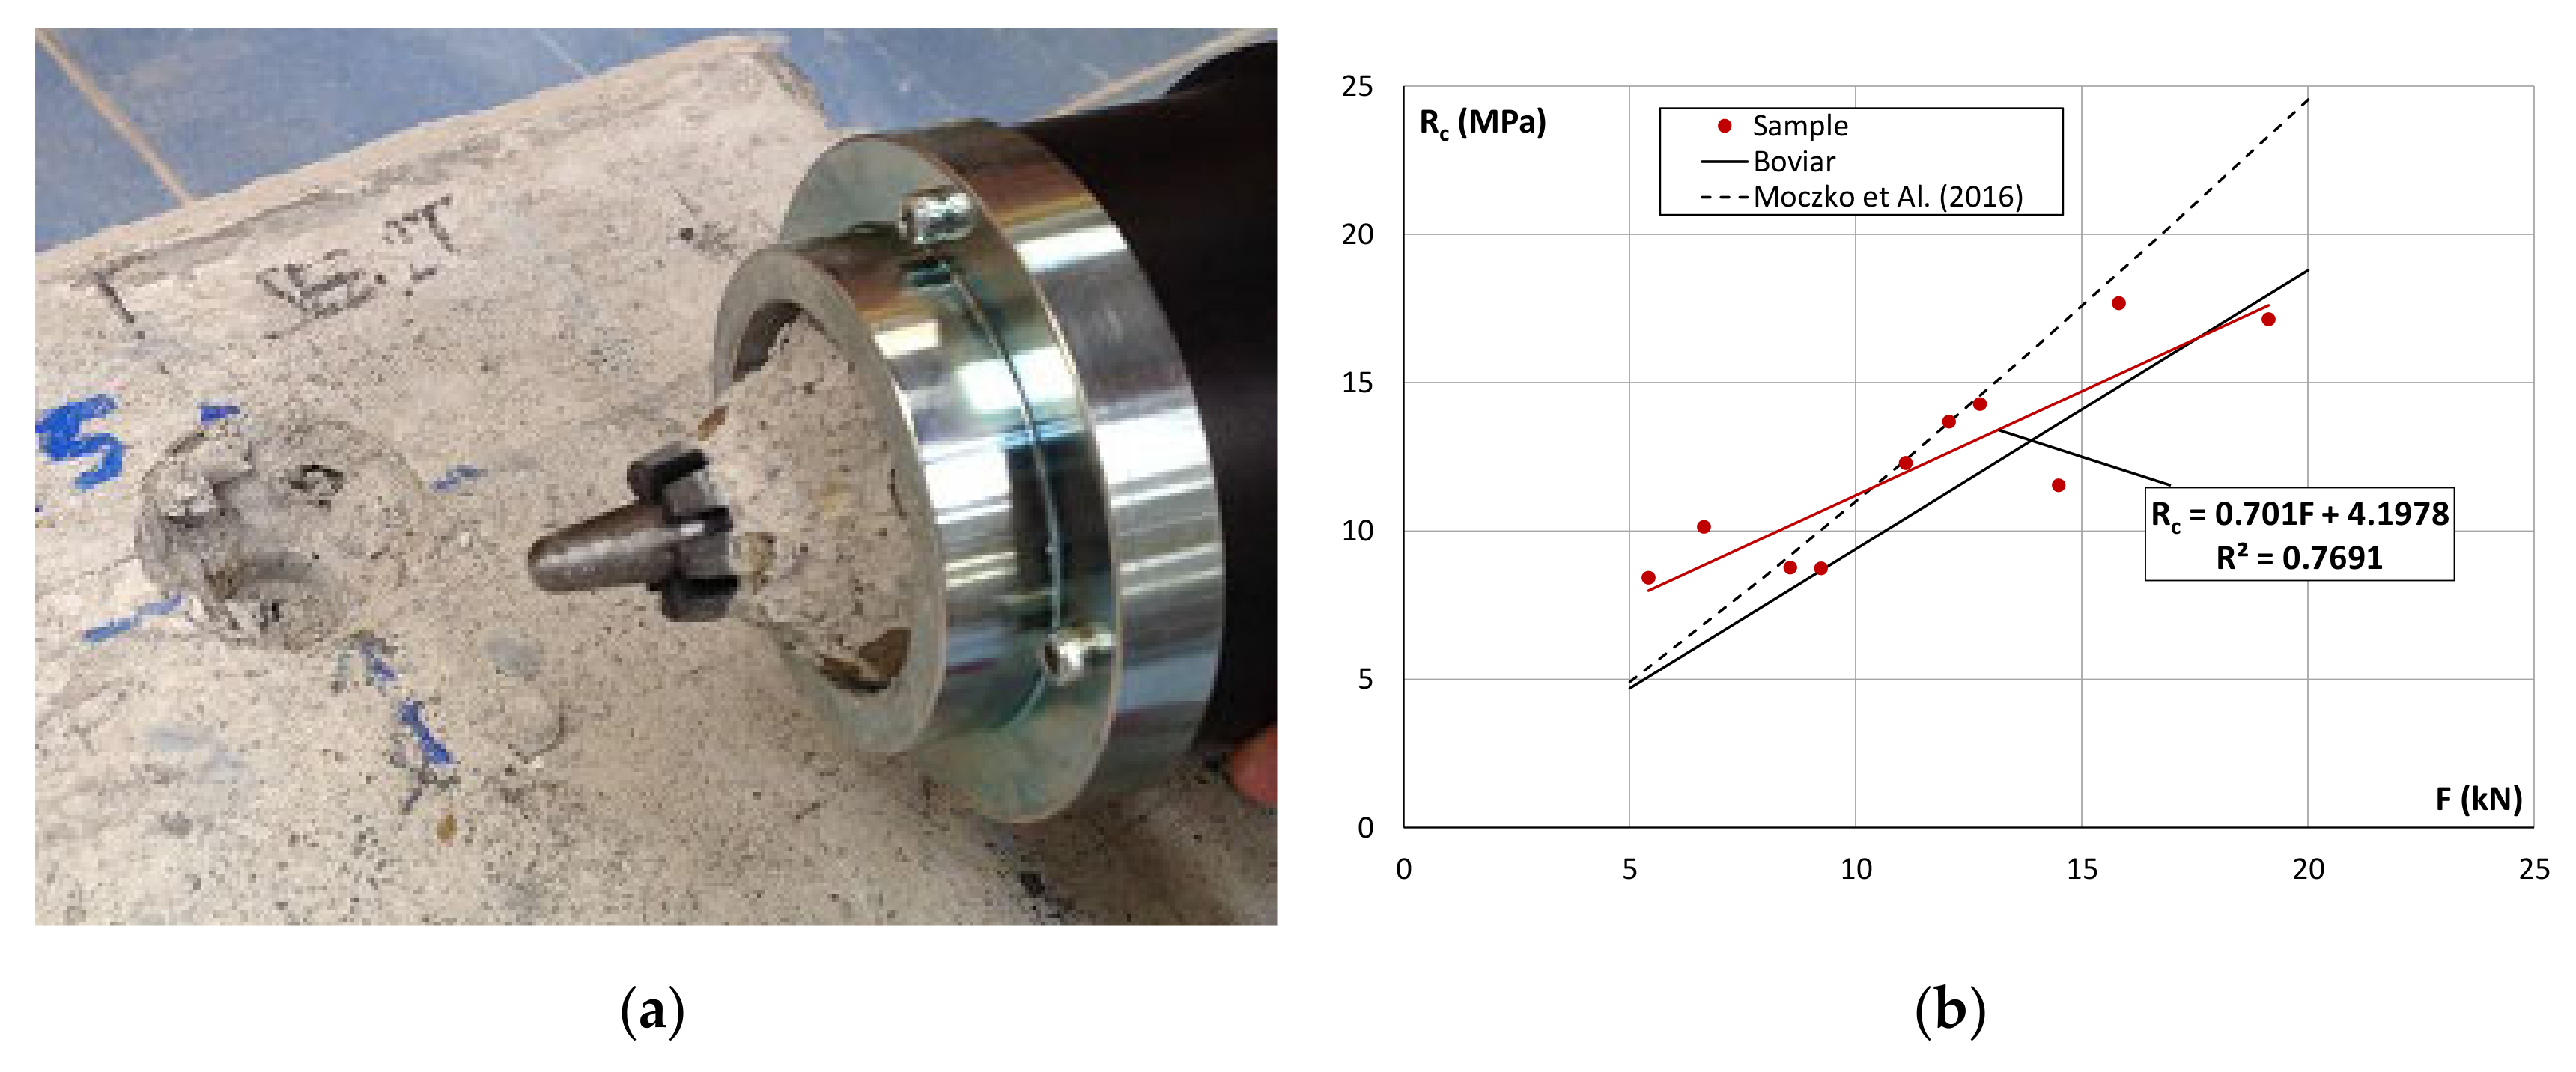
4.1. Pull-Out Method

The pull-out SDT method, standardized by the European Standard EN 12504-3:2005 [20], measures the force needed to extract a small conical concrete sample (Figure 3a), causing small-scale damage to the structure and allowing estimation of the cubic compression strength. For the assessment of the existing structures, the extraction is performed using a postinserted device. For this research, the pull-out equipment employed conformed to [20], and the correlation law used to convert the extraction force to the concrete strength is that provided by the producer, Boviar S.r.l.:
fcub [Mpa] = 0.94 · F [kN]
where Rc is the cubical compression strength of concrete and F is the extraction force.
Ten tests were performed on the columns where cores were extracted. The cylindrical strengths obtained from the compression tests were transformed in cubical strengths Rc. The regression line toward the extraction forces F is plotted in Figure 3b and a strong correlation is obtained. The sample is also compared with the producer law and the correlation law proposed by [22] as the best-fit curve obtained from twelve correlations given by the literature. The graph shows that the producer law underestimates the concrete strength, while the correlation law fits well, albeit only with six samples.
Synthesis of the measured and estimated values from the test is reported in Table 3 where the extraction force (F), the estimated compressive strength (Rpull), the effective strength (Rc), and the ratio between them are given.

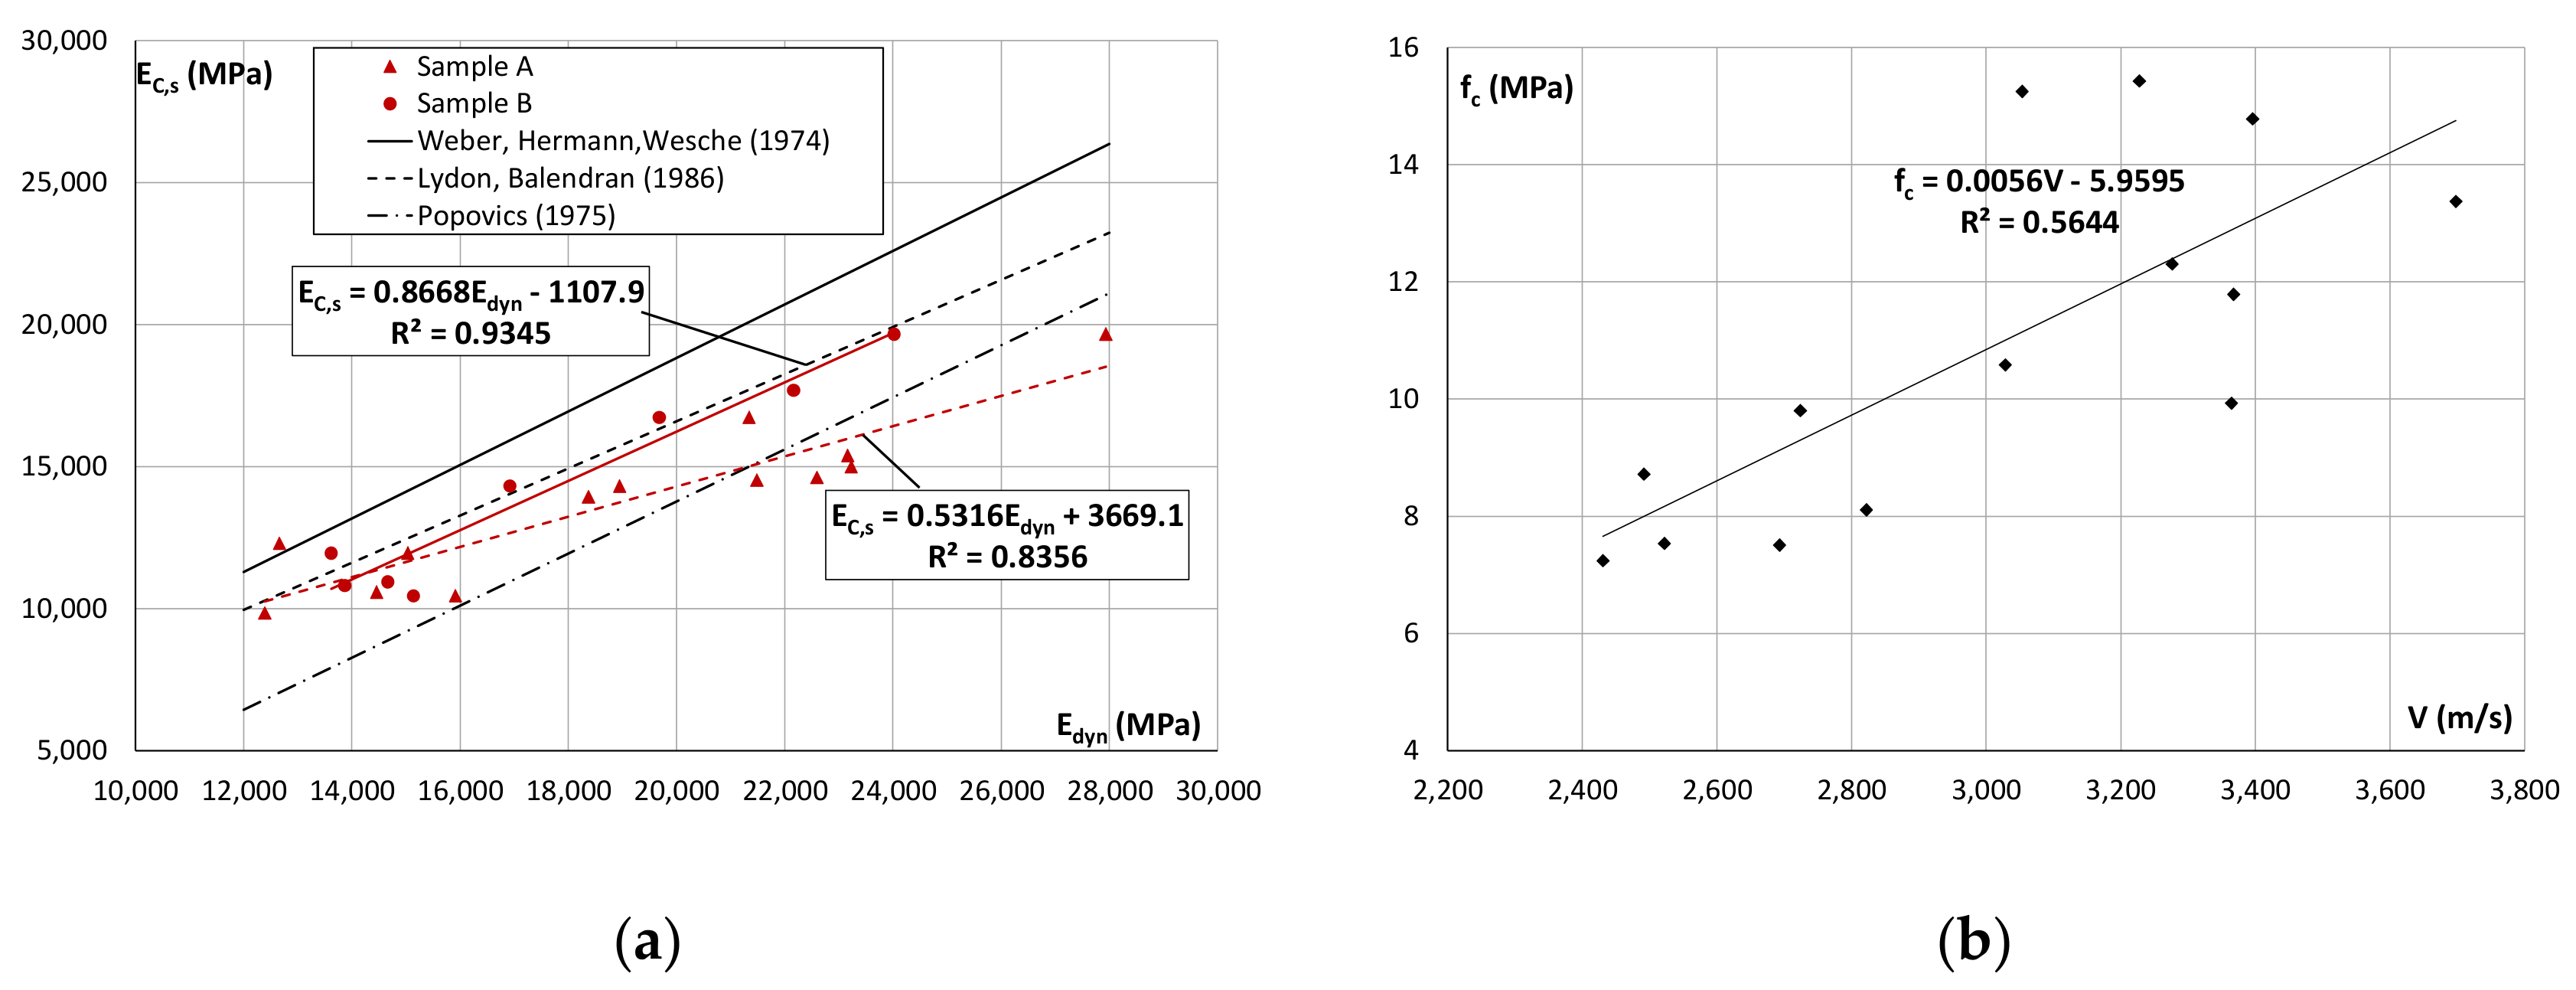
4.2. Ultrasonic Pulse Velocity Method

The ultrasonic pulse velocity is related to the properties of the material through the well-known relationship for longitudinal waves:
V = √{[Edyn (1 − ν)]/[ρ(1 + ν) (1 − 2ν)]}
where Edyn is the dynamic elastic modulus, ν is the Poisson’s ratio, and ρ is the density mass [23].
The ultrasonic pulse measurements can be carried out in different ways related to transducer positions (direct, semidirect, and indirect testing); however, the direct method is the most reliable for carrying out the test. In the literature [1], many correlation laws exist between the resulting velocity and concrete strength. Still, none can be generalized because too many factors affect the method, such as the aggregate size and type, the kind of cement, the water/cement ratio, and the age of the concrete and its temperature and moisture condition. A specific correlation is always needed [24]. A direct relationship exists between the velocity and dynamic modulus of elasticity; therefore, some interesting considerations can be drawn concerning the elastic properties of concrete besides those on strength.
The ultrasonic tests were performed on the structural elements in the same points where 13 cores were extracted, with results collected in Sample A, and directly on 8 cores before the execution of the compression test, with results collected in Sample B (Table 4). The CMS HLF-P SG02_0128 ultrasonic system with 55 kHz piezoelectric transducers was employed. Given the density of each core, the dynamic modulus of elasticity was calculated, supposing a Poisson’s ratio of ν = 0.2, which is considered a reasonable value for common concrete [25]. The dynamic modulus is higher than the static modulus; however, in this case, there is a significant difference between the Edyn evaluated directly on the structure (Sample A) and the cores (Sample B).
The correlation laws between the static and dynamic modulus were then found in both cases and compared with the relationships proposed by [26,27,28] (Figure 4a). As can be seen, Edyn and EC,S have a strong correlation, especially for Sample B. The regression line of Sample B has a similar slope than the compared relationships, almost overlapping that proposed by [27], while the regression line obtained with Sample A has a completely different trend.
Finally, the classic regression line between the ultrasonic pulse velocity V and the concrete strength fc was found with a moderate correlation for Sample A (Figure 4b).

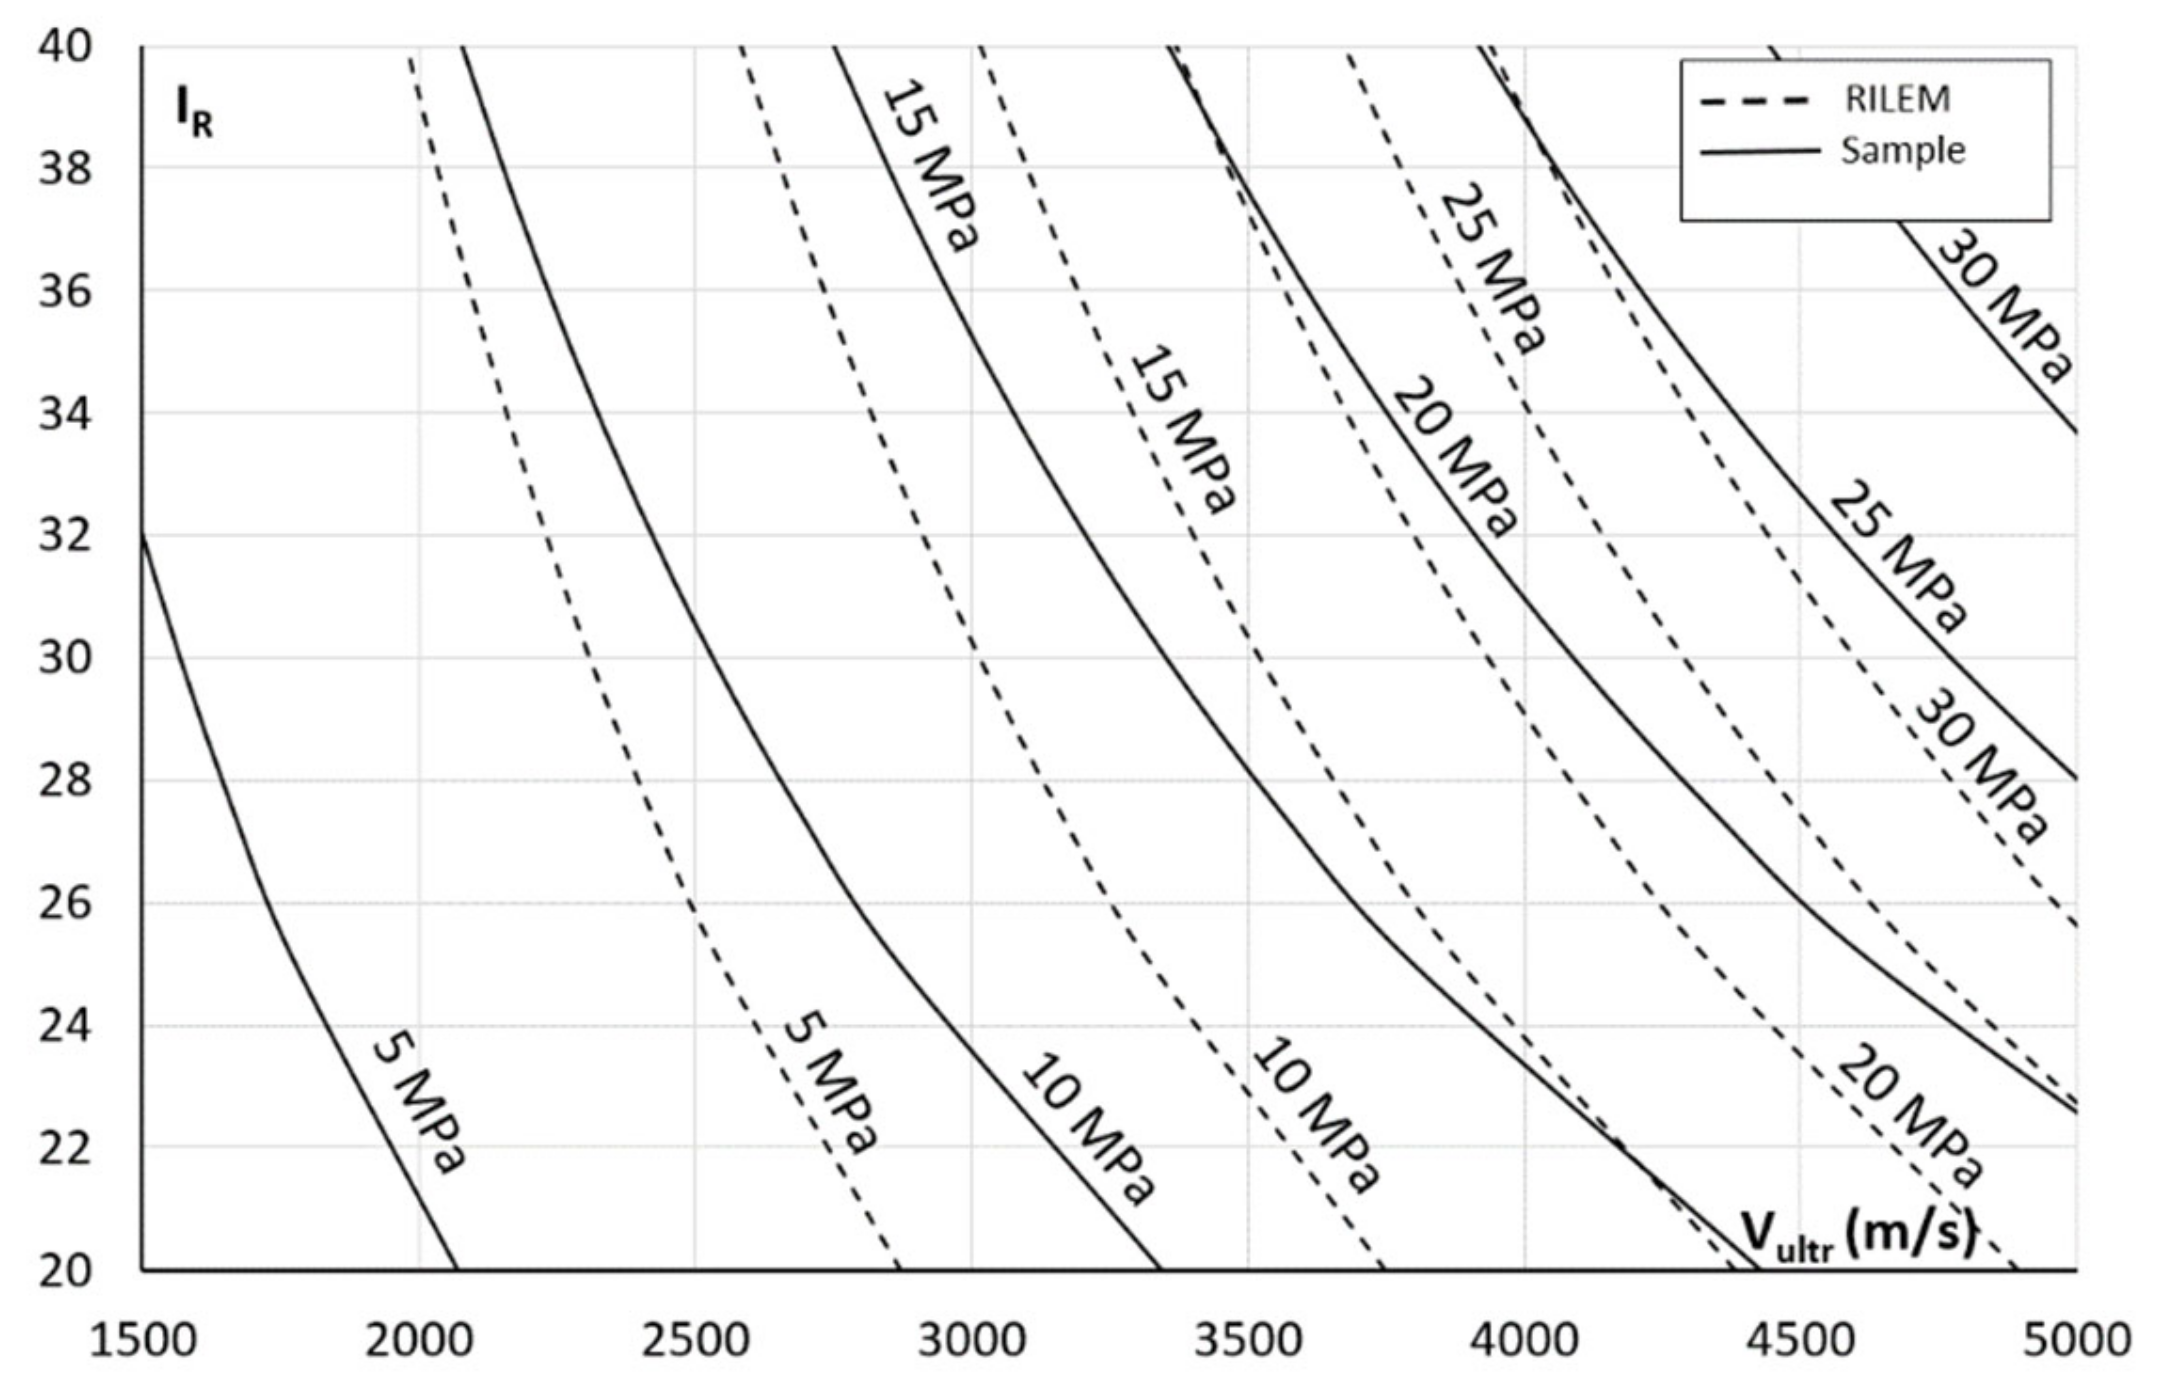
4.3. SonReb Combined Method

The combined SonReb method (SONic + REBound) was developed to reduce the errors of two methods used separately [5]. In fact, the moisture content underestimates the rebound index and overestimates the ultrasonic pulse velocity. When the concrete age increases, the rebound index increases, while the ultrasonic pulse velocities decrease. Therefore, the SonReb method application requires the evaluation of the local ultrasonic velocity V and the rebound index IR from which it is possible to estimate the cubical concrete strength Rc using the following general equation:
Rc = a Vb IRc
The main formulations in the literature are given by RILEM [29], Gasparik [30], and Di Leo and Pascale [31], hereinafter referred to Rc,1, Rc,2, and Rc,3, respectively. The authors of [6] suggest identifying a prior model calibrated to fit the test results. Starting from a PRiSMa’s database, a sample of 127 ultrasonic velocities and rebound indices, with the related concrete strengths, was collected. This selection was made according to the following parameters: the same location of the case study (Tuscany, Italy), the same function (school building), and the period of construction. The latter is intended as the 40 years of validity (1939–1971) of the first Italian law regulating the reinforced construction of concrete structures [32]. From these data, characterized by an average low concrete strength, a specific SonReb formulation was computed by multivariate regression, and the equation is described as follows:
Rc,S = 4.13 · 10−6 V1.445 IR0.995
where Rc,S is the cubical concrete strength (MPa), IR is the rebound index, and Vultr is the ultrasonic pulse velocity (m/s). Figure 5 shows the author’s formulation with equal strength lines drawn, giving the variation of Vultr an IR compared with the RILEM.
The ultrasonic pulse velocities and rebound index were measured on the first- and second-level columns (CL I-1 and CL II-2) in the same points where 10 cores were subsequently extracted. The estimation of the cubic strengths through the three different formulations given by the literature (Rc,1, Rc,2, and Rc,3) and those proposed by the authors (Rc,S) was calculated and compared with the results coming from the direct compression tests on the concrete specimens (Rc). The accuracy of the SonReb formulation results was evaluated by the ratio:
Cs,i = Rc/Rc,i
This ratio is generally used as a corrective coefficient to calibrate the relative formulation of the sample. In Table 5, the mean value μ and coefficient of variation CV (%) are evaluated for each parameter, considering the two specimens separately. The total mean value with the relative CV is computed for the corrective coefficients.
The RILEM formulation shows the most reliable corrective coefficient, while SonReb shows a lower coefficient of variation (CV).
Figure 5 shows that the old RILEM formulation underestimates the results for low strengths and overestimates the results for high strengths. For the assessment of old concrete structures with low material strengths, when the available data are few, as often occurs in the professional practice, the calibration of a specific model is not possible, and the RILEM formulation may not be used as a prior model. For this reason, and just for this case, the author’s formulation adopted as a prior model, according to [6], may reduce the uncertainties and variability of the results since it seems to better match the real concrete strength. Due to the limited number of elements available, the estimation quality level (EQL) [6] and uncertainties on strength estimates [33] were not evaluated.

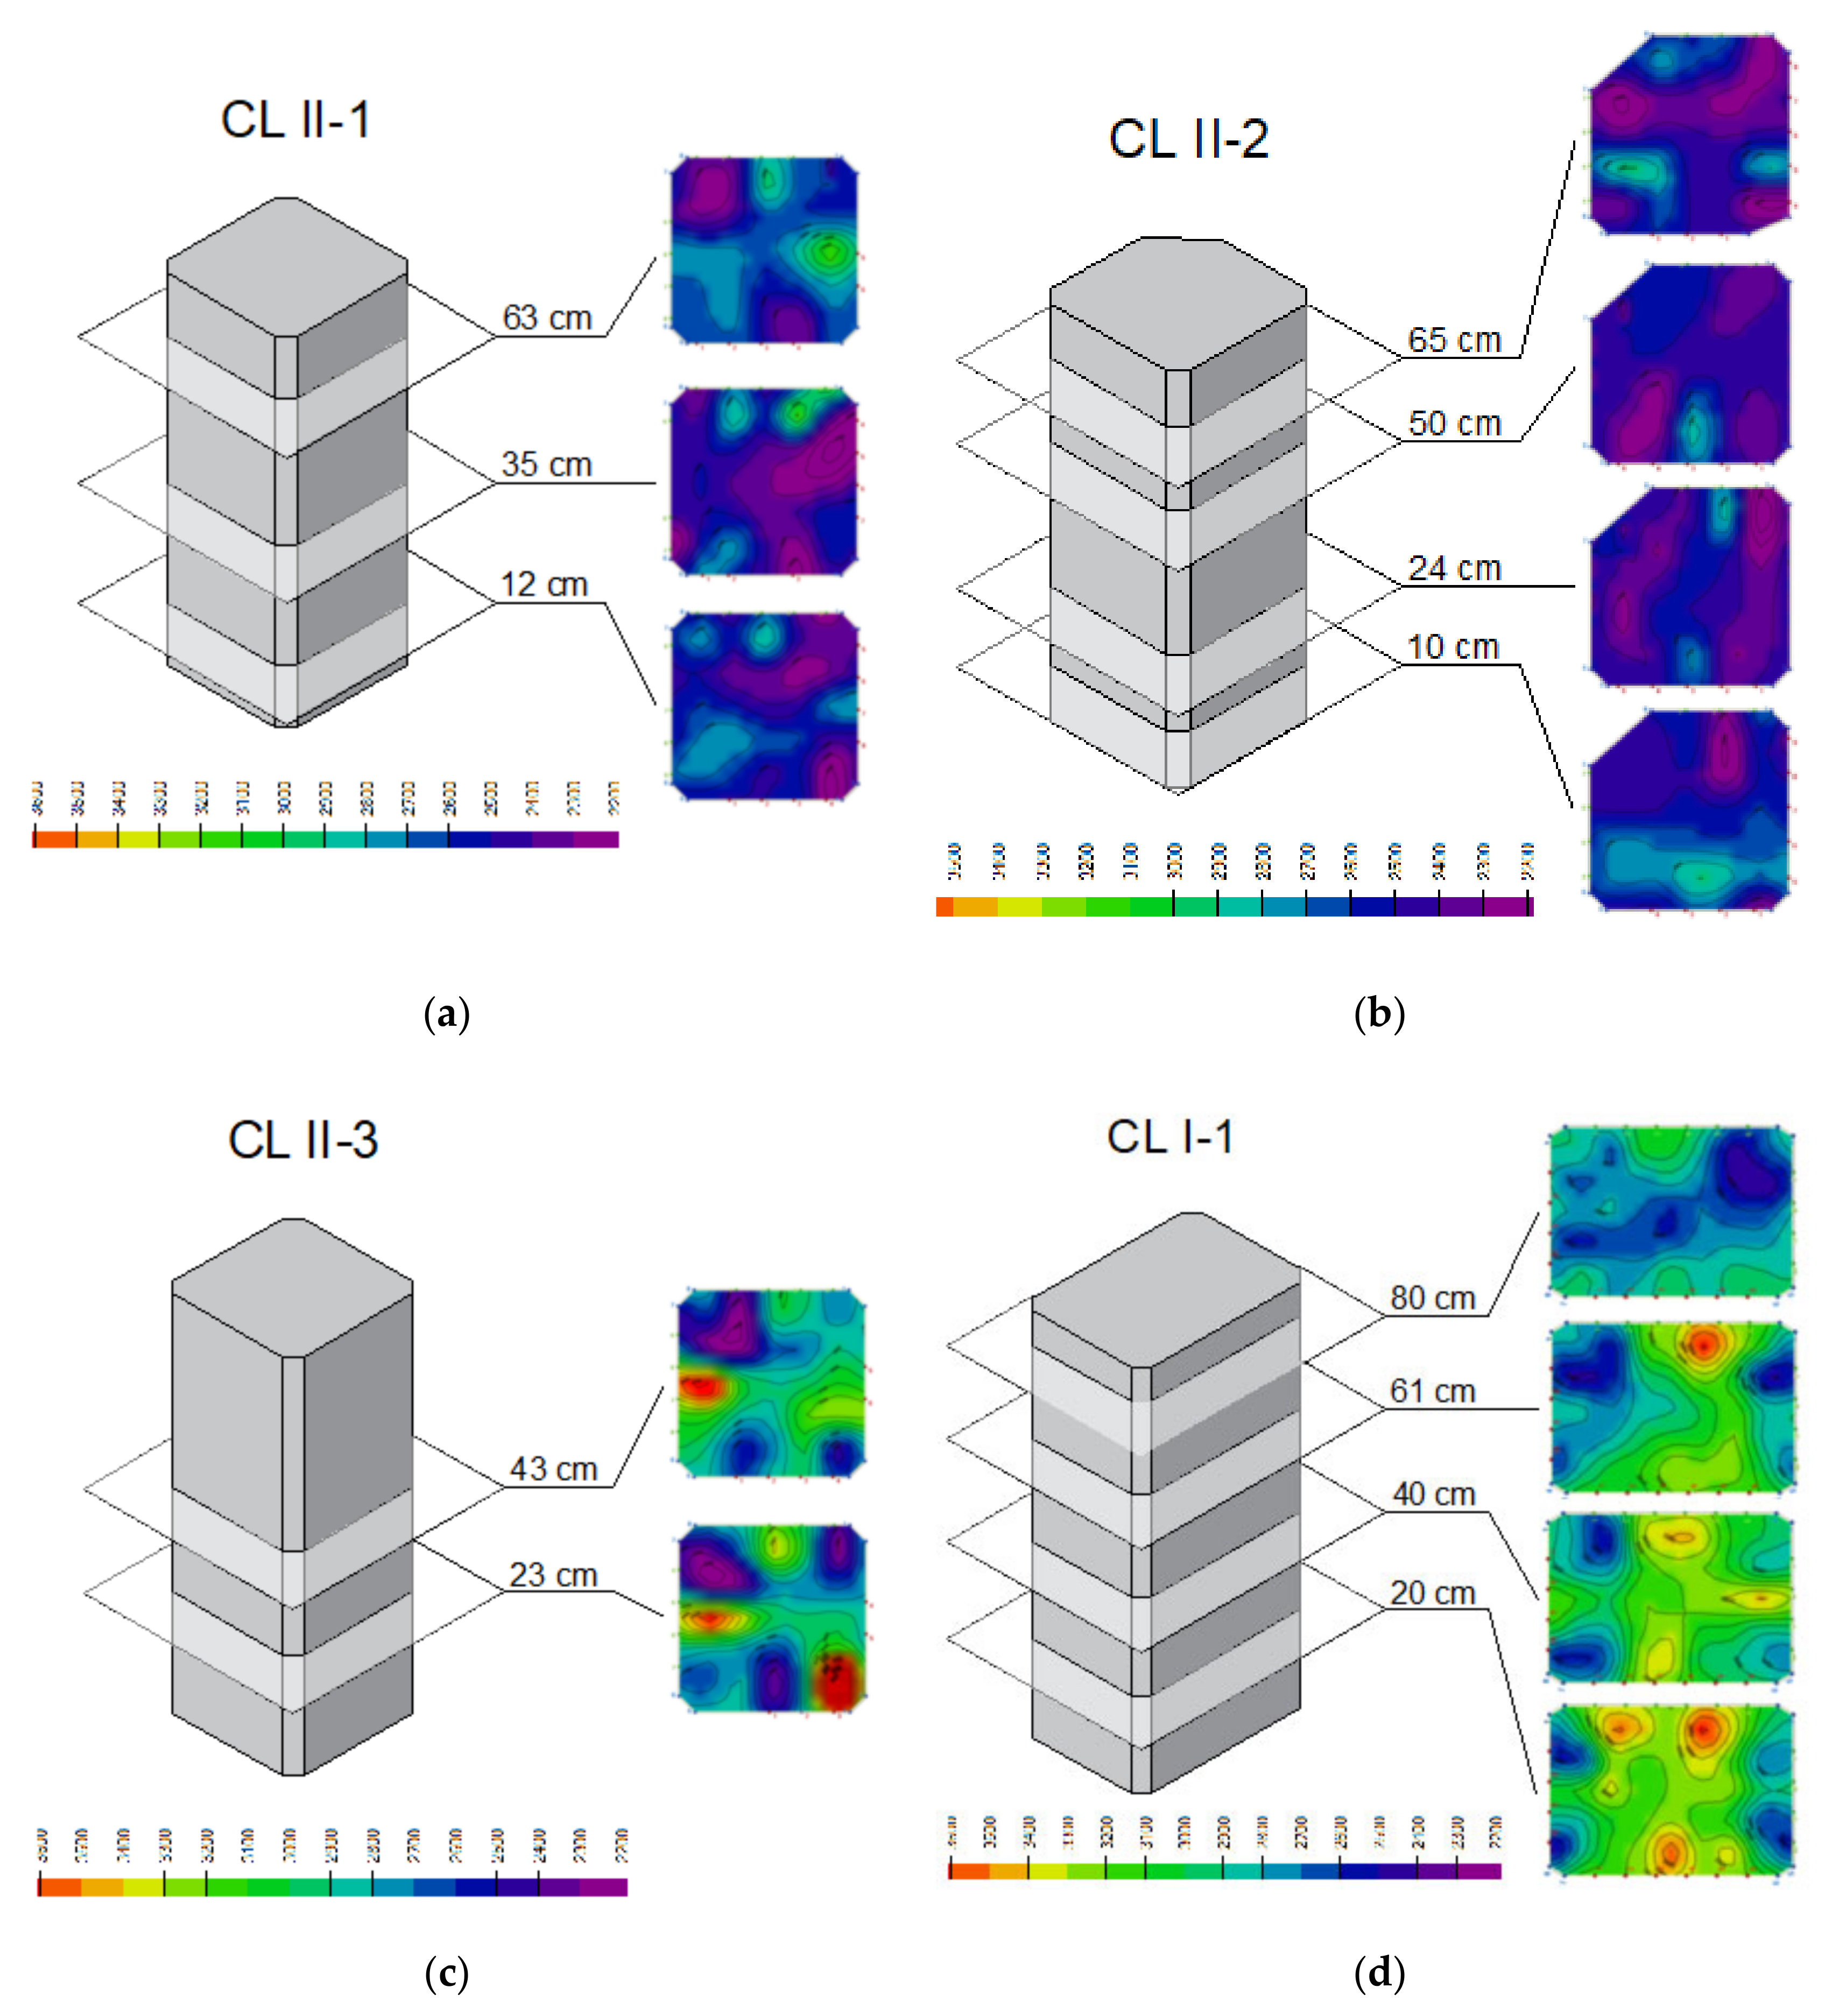
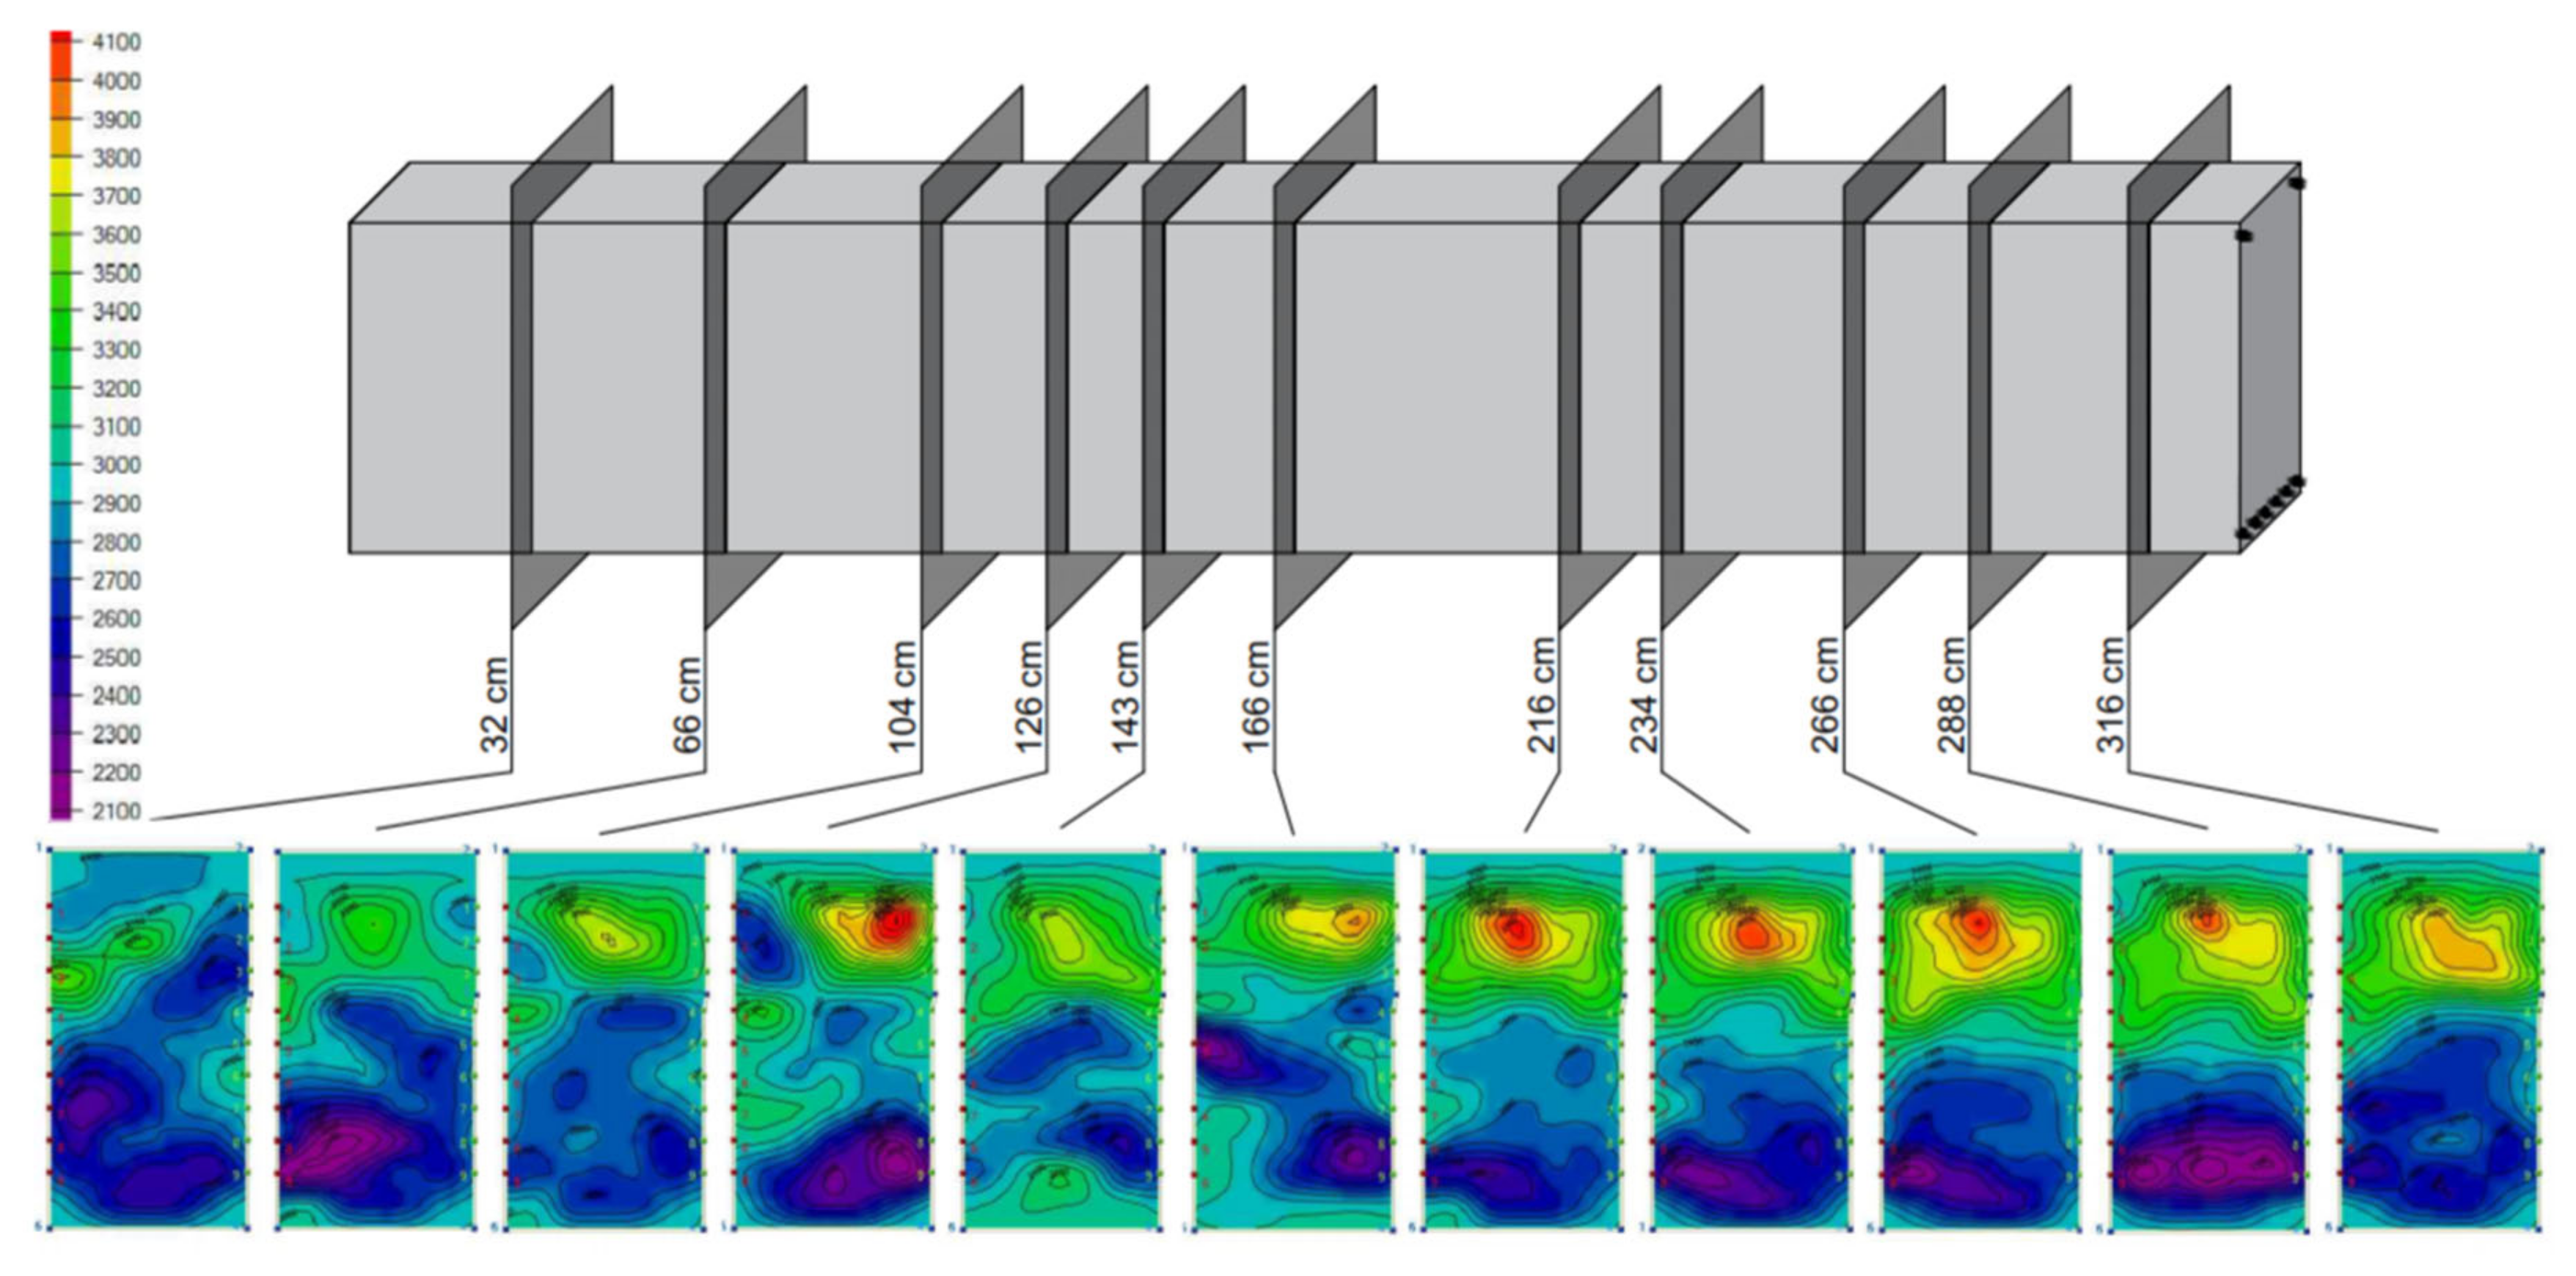
5. Tomography on Structural Elements

Tomography represents an efficient and accurate imaging technique helping the reliable assessment of the safety and serviceability of RC structures. In recent years, elastic stress wave methods were developed by researchers to have more instruments to employ for the monitoring of the structures, as well as for a quantitative evaluation of the damage. Behnia et al. [34] evaluated the fracture development in beams according to parametric analysis and tomographic reconstruction. In other cases, a vertical spectral tomogram is used to provide a direct image of the concrete cross-section. As described by Liu and Yeh [35], a tomographic map can be a useful tool in the nondestructive inspection of concrete structures. Pahlavan et al. [36] used ultrasonic waves to evaluate mechanical-load-induced cracks on reinforced concrete beams.
However, as highlighted by Buyukozturk [37], the imaging of concrete structures presents an interesting challenge, since concrete is a nonhomogeneous material. The variable grain size distribution and different properties of the constituent materials make it difficult to produce accurate images. In addition, the generally complex physical geometry of the structure, the restricted accessibility, and the existence of the reinforcement and prestressing tendons further complicate the problem.
The ultrasonic tomographic method allows obtaining maps (or tomograms) of the wave propagation velocity distribution along a cross-section. These maps elaborately process the propagation times of the longitudinal waves through a large number of paths. The latter, according to different inclinations, cross each other mutually. The transmission and reception signal points delimit the area. A denser distribution of these points corresponds to a higher resolution of the resulting map, especially if frequencies around 50 kHz are used [35]. The investigated cross-section is discretized through a grid (usually based on rectangular meshes), where the velocities are determined in the nodes.
In this work, an iterative inversion algorithm, simultaneous iterative reconstruction technique (SIRT), was used to obtain the velocities’ fields. The method was employed to investigate the beam, as well as the four portions of the column. For each investigated section, the transmission and reception points were positioned with a 50 mm step, since this dimension is also the diameter of the 55 kHz piezoelectric transducers employed, along the four sides of the column specimens and the front and back faces of the beam.
The tomography maps show, on average, low-quality concrete, with velocities mainly in the range of 2400–3400 m/s, resulting from the standard ultrasonic test performed on the elements. Figure 6 shows the cross-section of the four column specimens. The comparison among the maps highlights the different quality of concrete between the two floors, confirming the results coming from the compression tests on the cores, suggesting that the concrete of the lower portions is better than the upper portions on both floors. This lack of homogeneity of the concrete along the same column may be due to its position (from the bottom to the top) and to a different level of constipation.
Concerning the beam, 11 sections were mapped (Figure 7). The upper band of the beam shows higher velocities than the lower band. This difference is more evident along the span (right side of the beam) and decreases going toward the joint (left side of the beam). The upper band of the beam was included in the slab, but the slab and beam were poured together with the same concrete. This difference may be ascribed not to the quality of the material but the stress distribution. The concrete in the lower part of the beam was probably cracked because of the tension stress induced by a positive moment, while in the upper part, it was compressed. This compression disappears close to the joint where the moment is negative.
To conclude, it can be observed that the results obtained, investigating both the columns and beam, show how the stress wave velocity is affected mainly by the degradation of concrete rather than its quality. This result may confirm what was observed by Haach and Ramirez [38], who did not find any significant differences between the maps of several prisms made with different concrete strengths. However, they easily detected the presence of heterogeneities and defects as damaged areas by cracks. Tomography may give more information about the concrete than the classic ultrasonic test performed alone.

6. Experimental Tests on Structural Elements

Structural safety estimation is the aim of researchers and professionals in the field of the assessment of existing structures. As seen in the previous sections, existing reinforced concrete structures show great variability of material properties within the same structure and also in the same structural element. For this reason, structural capacity tests are the best way to understand the real capacity of elements according to geometry and material properties.
In this section, three structural capacity tests are presented and analyzed. Starting from the case study, two cyclic axial compression tests are performed on two portions of the upper column (CL II-1 and CL II-3), and a bending moment test is performed on the portion of the beam extracted from the same floor. The experimental tests were carried out at the PRiSMa Laboratory of Roma Tre University, with the aim of analyzing the mechanical failure of the column and beam and comparing the structural capacity with the material investigations.

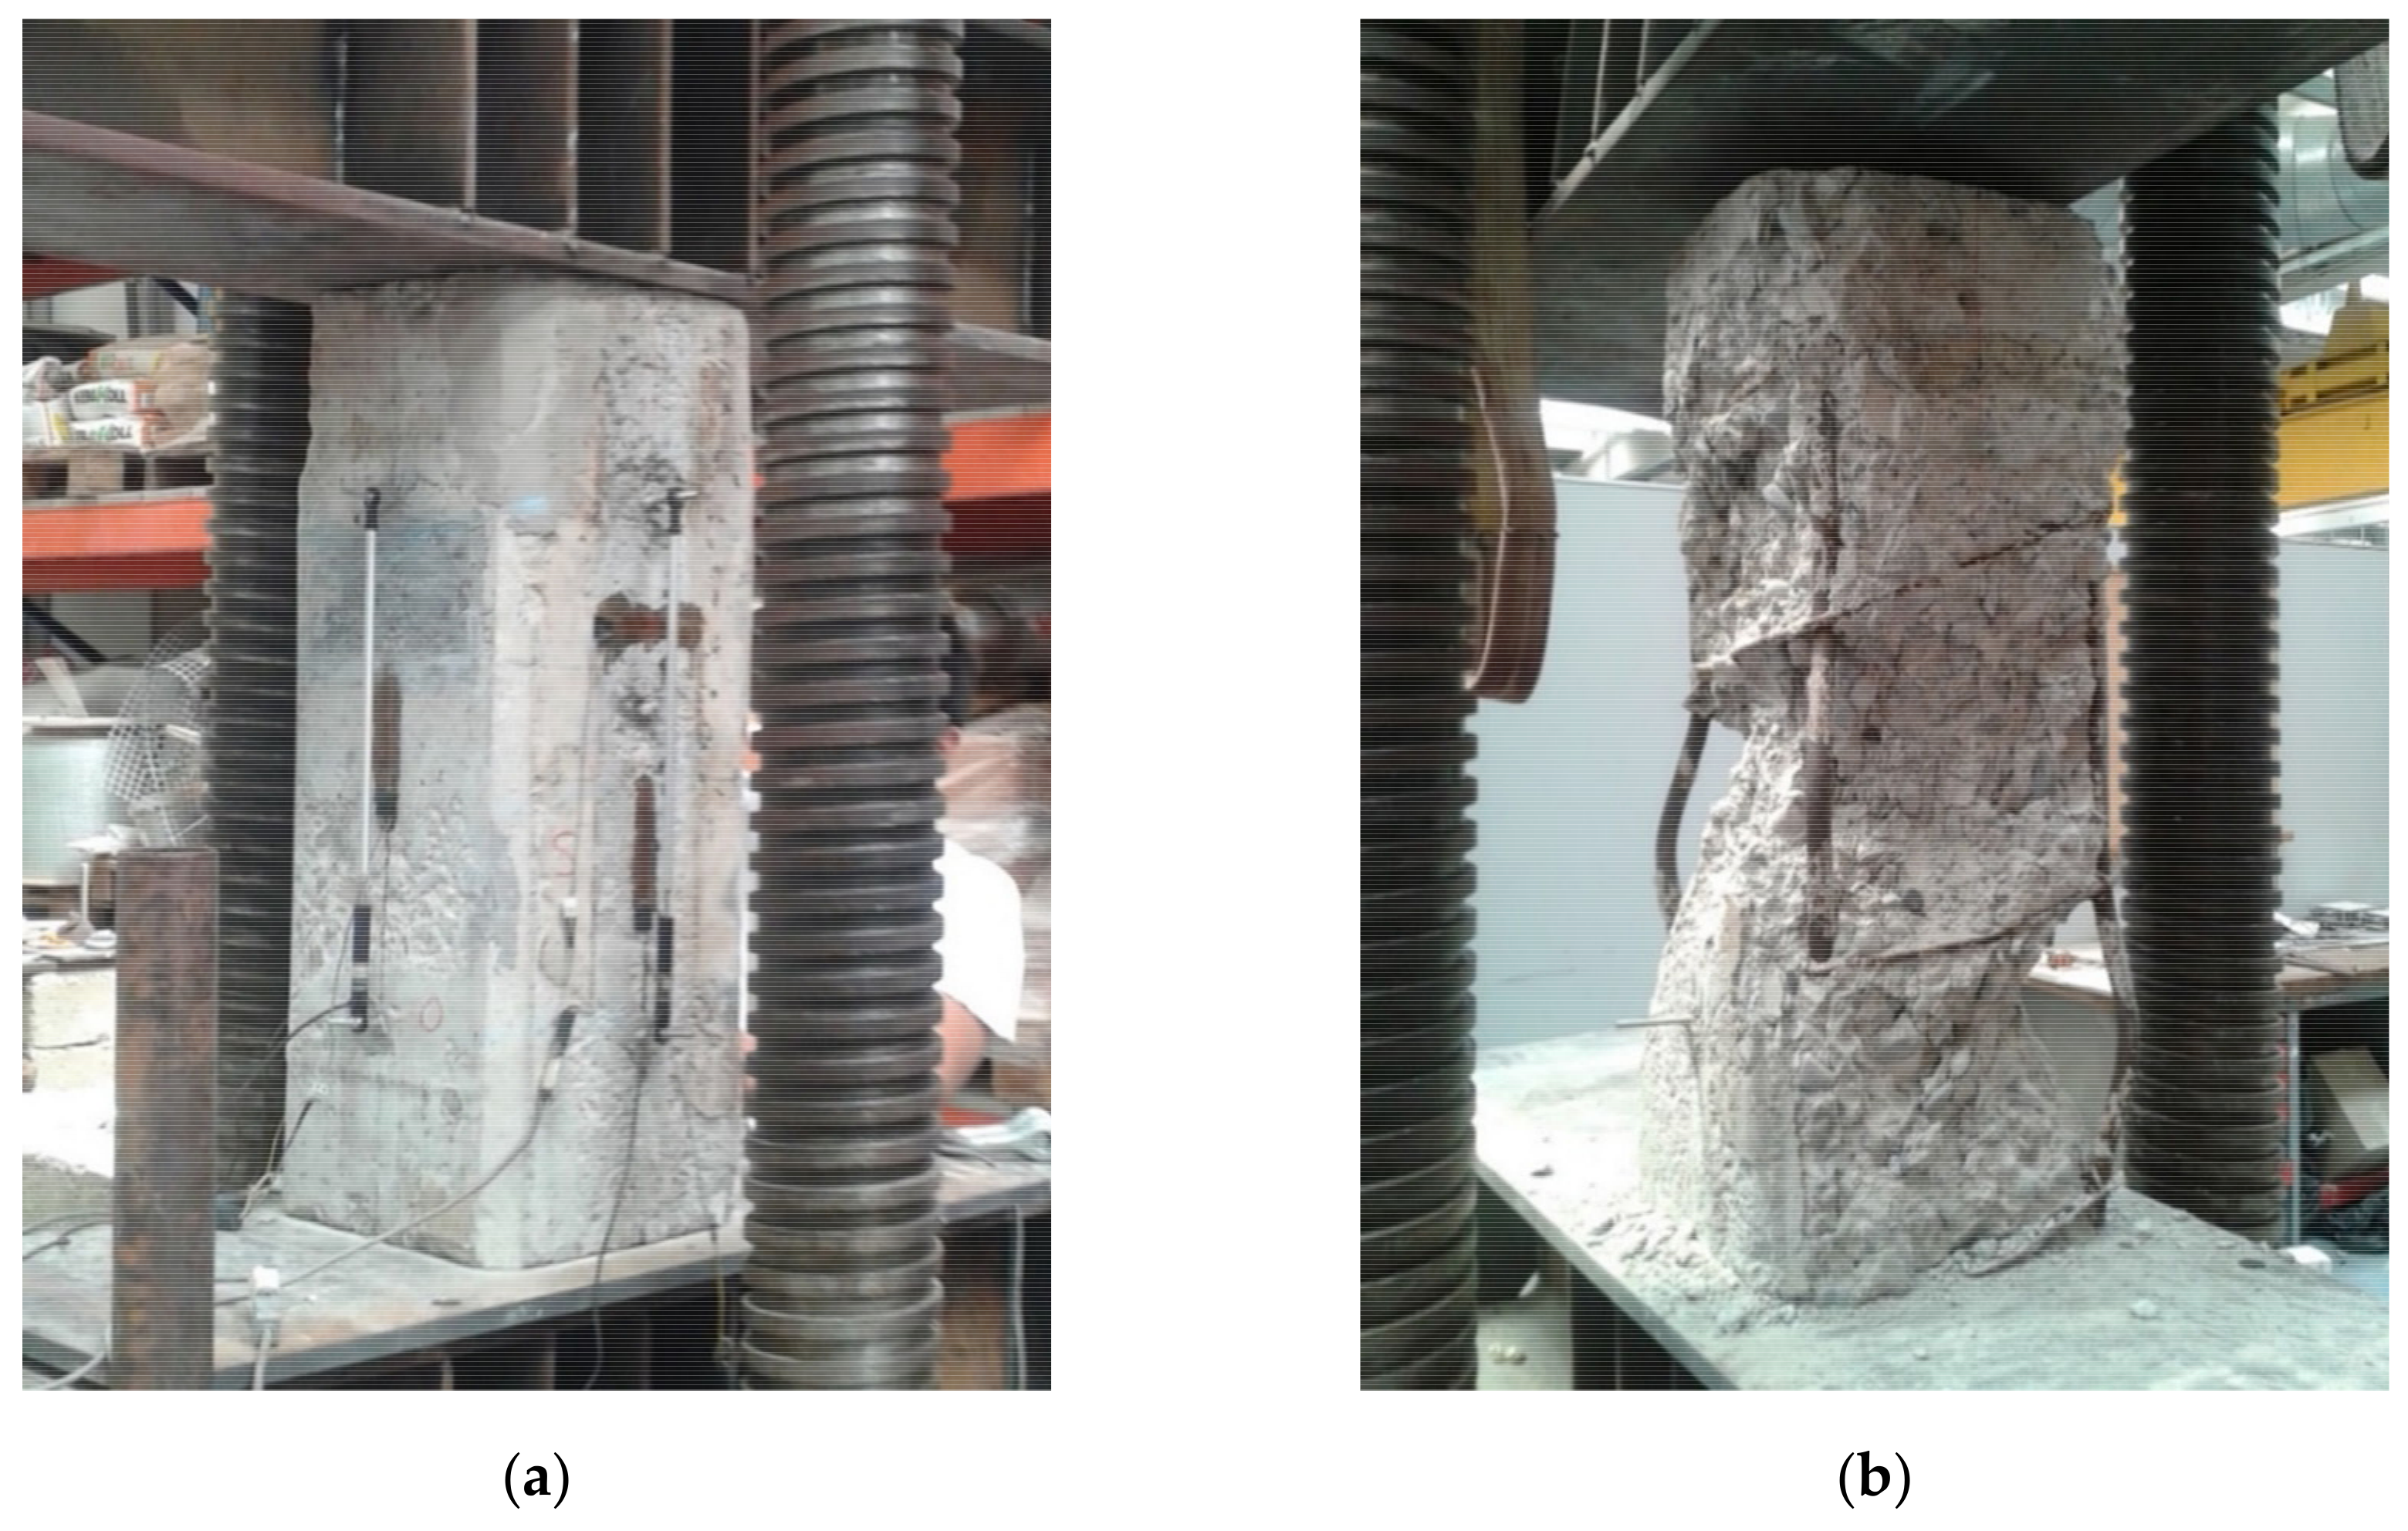
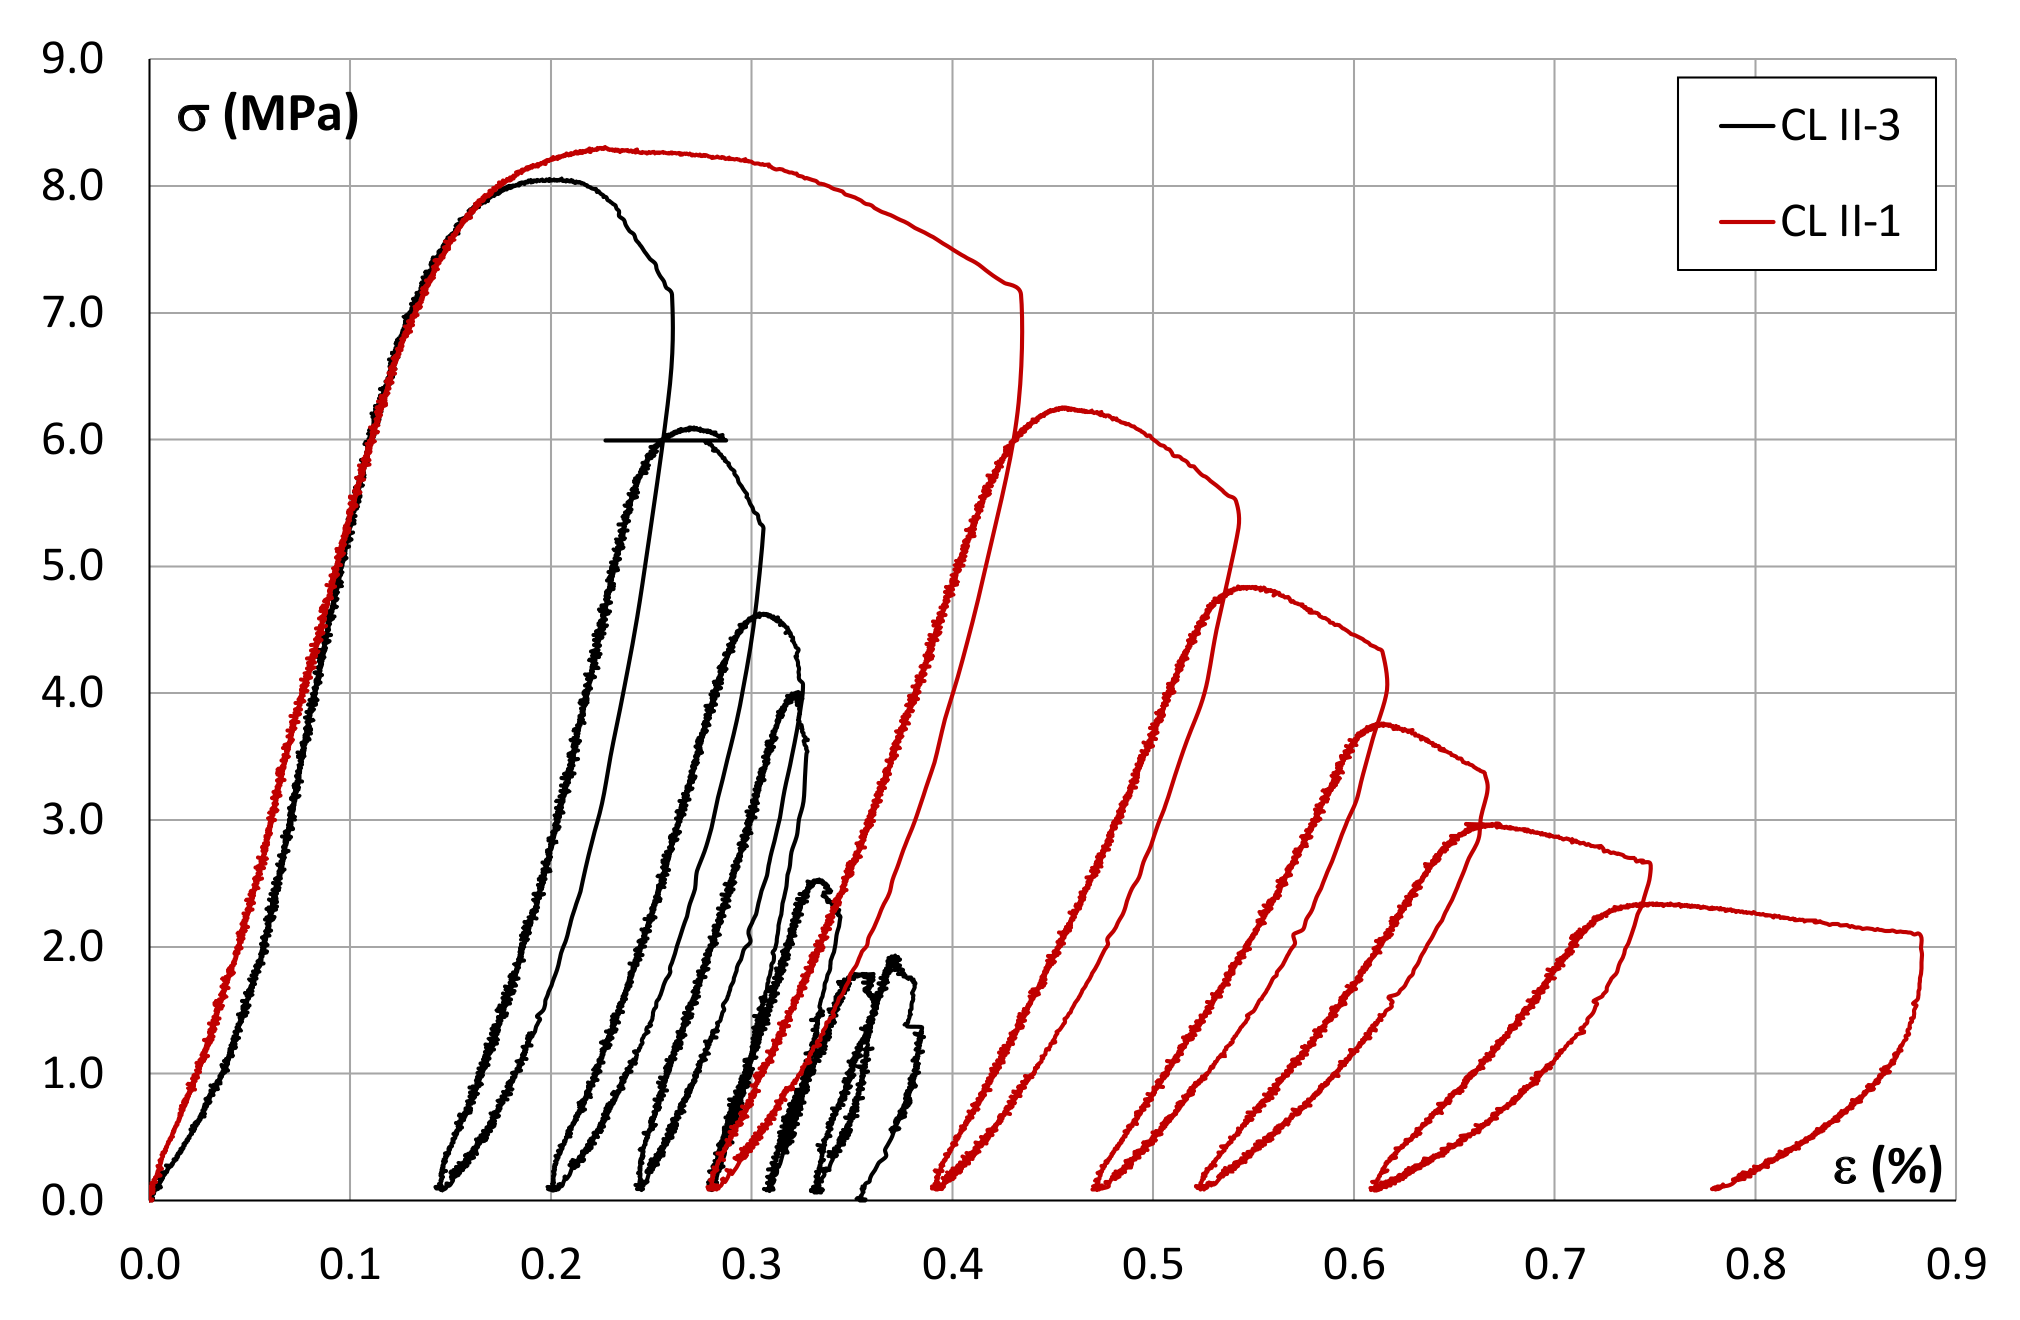
6.1. Cyclic Axial Compression Test

The collapse of the frame structures often results from a deficiency in the concrete strength, which strongly affects the capacity of the columns to carry vertical loads, as described by Kaltakci et al. [39]. For this reason, Braga et al. [40] investigated the problem by evaluating cyclic compression tests on RC columns confined with stirrups or retrofitted with FRP jackets. In the axial compression test, the size effect of the column with circular and square cross-sections assumes a fundamental role in structural behavior, as investigated by Du et al. [41].
In this section, the experimental results of the column specimens CL II-1 and CL II-3, tested under a cyclic axial compression test, are given. The geometry and material properties of these elements, evaluated by nondestructive tests, are presented in the previous sections.
The column presents a square cross-section (29 cm × 29 cm), longitudinal bars equal to 4F16, and helicoidal stirrups equal to F6/20 cm. The experimental tests aimed to evaluate the structural capacity and compare the test results with the material properties estimated by destructive and nondestructive tests. The test was performed using a compression machine, with a capacity of 3000 kN, which allows controlling the applied force. To evaluate the displacements during the test and the modulus of elasticity, four vertical wire transducers with a gage length of 400 mm were applied to each surface. Four strain gages with an 80 mm grid were applied in the middle of each face to measure the local vertical deformations together with two additional strain gages positioned horizontally on two orthogonal faces to evaluate the Poisson’s ratio. Two wire transducers were applied between the press plates to evaluate any eccentricity (Figure 8a). Finally, the cycle compression test was performed with a very low loading rate of 2 kN/s to avoid a sudden collapse. Each cycle ended when the maximum load was attained. Data were acquired by a NI system with a frequency of 10 Hz.
The predicted collapse load was evaluated before testing considering the medium compression strength of the cores extracted from the third portion of the column and a standard value of the homogenization coefficient of n = 15. The predicted collapse load was 775 kN.
According to the National Standard [15], the secant elastic modulus (Ec,sec) was evaluated through the following equation:
Ec,sec = (sa − sb)/(ea − eb)
where sa and sb are, respectively, the upper (smax/3) and lower (smax/10) stress to consider for the modulus evaluation. ea and eb are the corresponding strains computed as the medium value registered by the transducers.
The secant modulus was computed considering the wire transducers, which represent the global behavior of the column, and the strain gages, which give a local evaluation. The Poisson’s ratio was evaluated considering the same range along the horizontal stress–strain diagram and the local deformation of the middle part of the column given by the vertical strain gages. Finally, considering the congruence hypothesis underlying the calculation of the homogenization coefficient, n was computed with the local deformation and the value of the modulus of elasticity was obtained using the tensile tests on the longitudinal rebars extracted from CL II-2 (Table 2).
In Table 6, the collapse load (Fmax), homogenization coefficient (n), concrete strength (sc), modulus of elasticity evaluated with the transducers (Ec,sec,T) and strain gages (Ec,sec,S), and the Poisson’s ratio (n) are reported.
The concrete strength resulting from both tests is similar to the cylindrical strength (7.75 MPa) obtained with the compression test on the cores extracted from the third portion of the upper column. The secant modulus of elasticity is less than half if computed considering the global behavior of the element or around 60% with the local evaluation. For this reason, the effective homogenization coefficient, evaluated in relation to the local modulus, is almost two times the theoretical coefficient. Finally, the Poisson’s ratio is consistent with the usual values considered for concrete. Figure 9 reports the stress–strain cyclic diagram of the two elements registered with the transducers.
The graph shows the similar behavior of the two specimens during the first cycle before breaking. The collapse load is almost the same as the modulus of elasticity, while the following behavior is completely different. The cycles of the bottom part of the column are very tight when compared with the cycles of the upper part, highlighting the more brittle behavior of the first. This result is probably due to the position of the specimens along the column. During the structure life, the bottom part of the column supported a greater load, and the concrete was better constipated during the construction, as highlighted by the tomography maps. In both cases, the test stopped when the buckling of the longitudinal bars occurred (Figure 8b): at the seventh cycle for the bottom part and at the sixth cycle for the upper part.

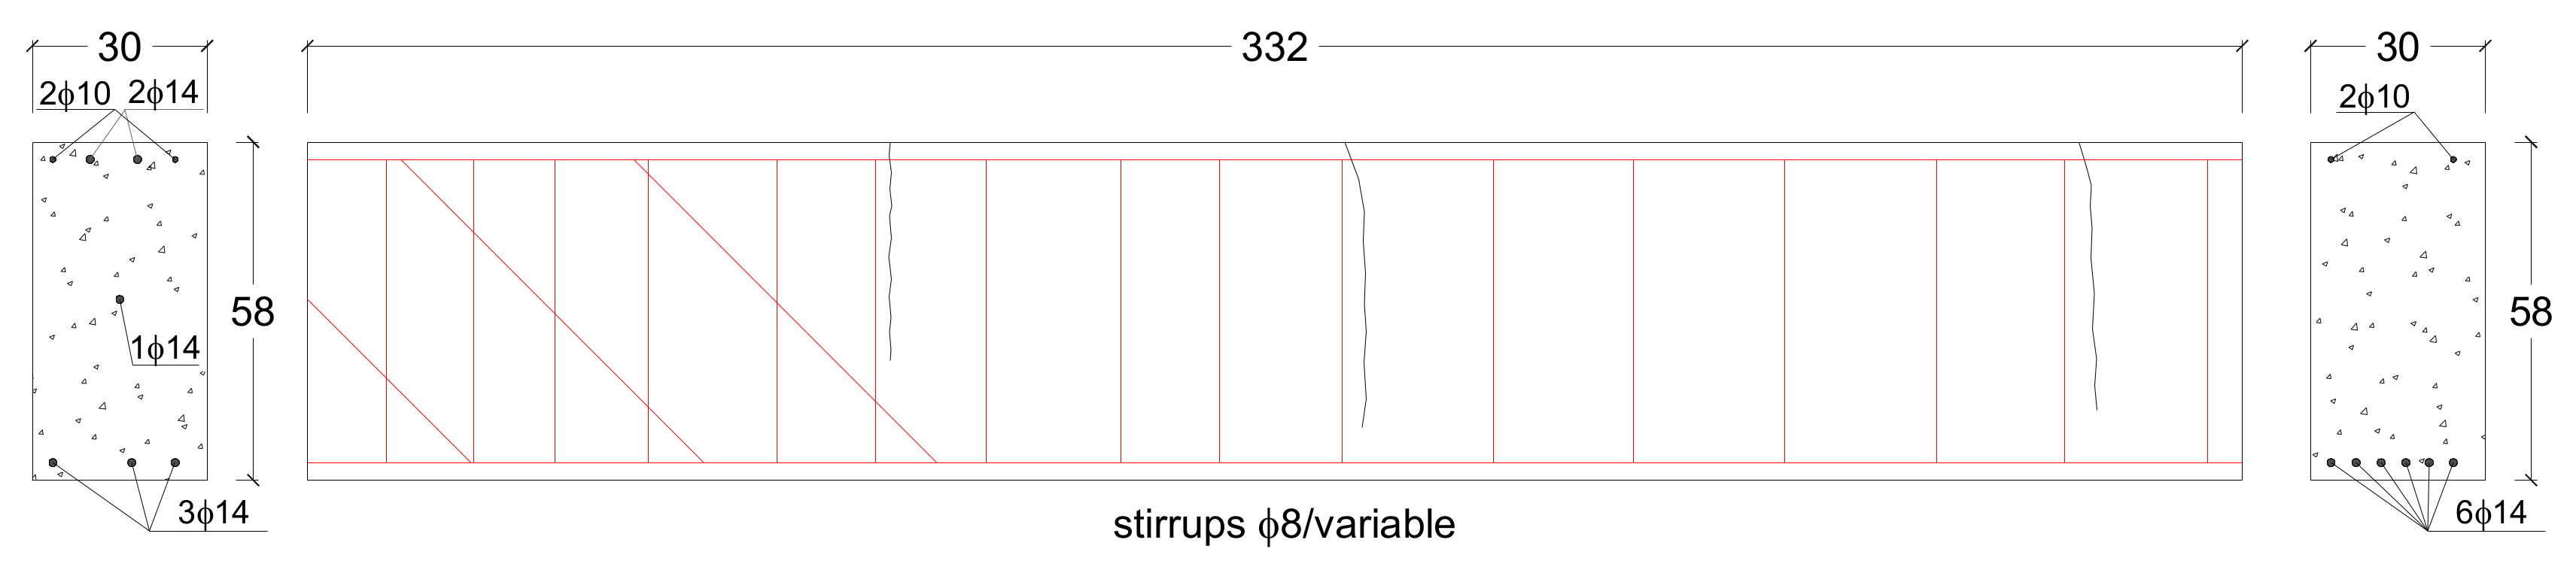
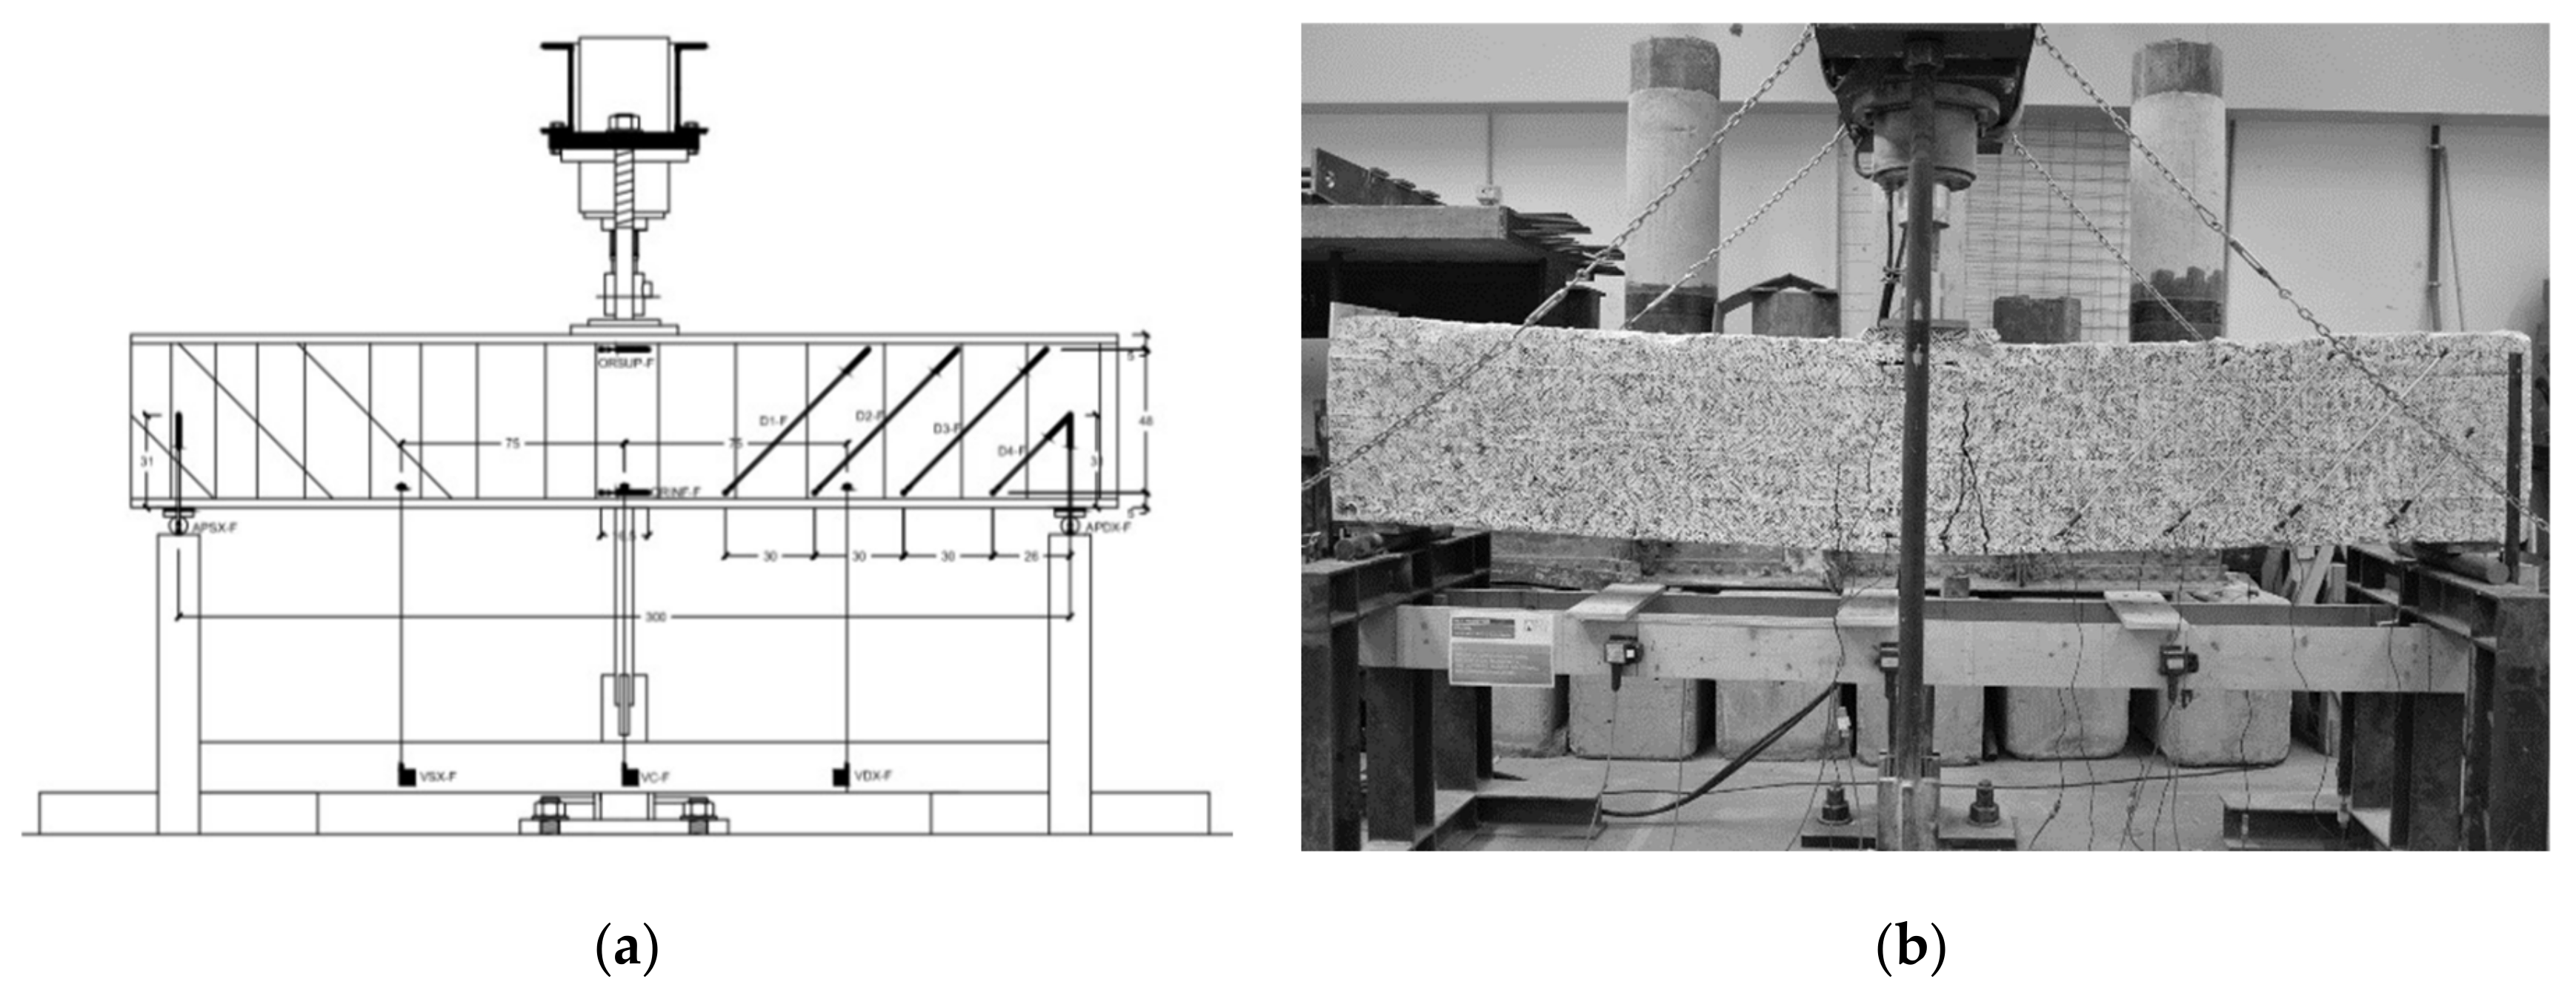
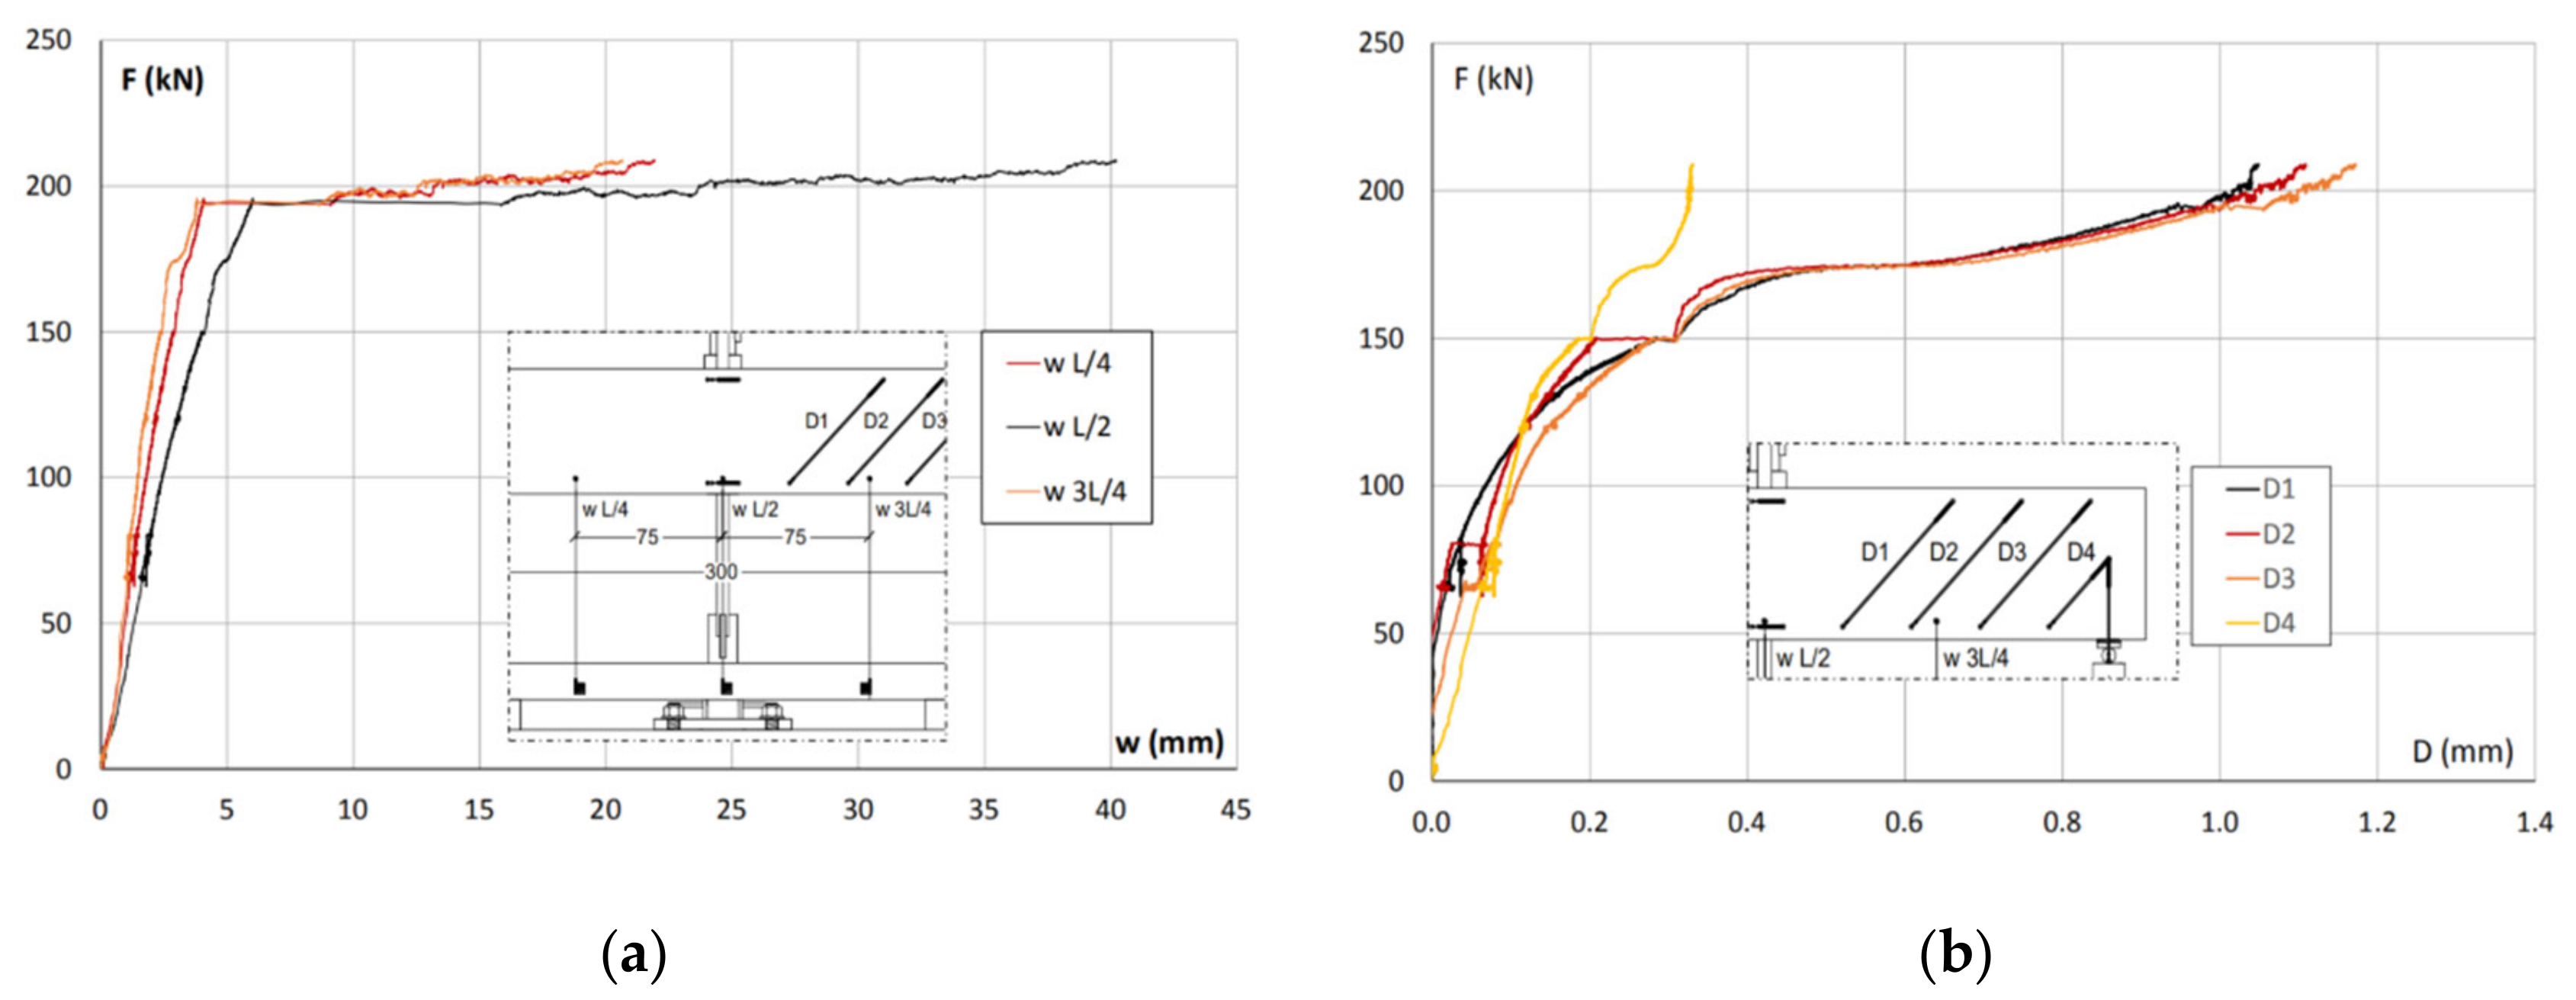
6.2. Three-Point Bending Test

Structural capacity evaluation of existing reinforced concrete beams is a topic frequently investigated. Usually, steel reinforcement in existing RC beams is designed with low safety tolerances (at the beginning of XX century, material cost was very high). Often, as described by Lavorato et al. [8], the shear strength of reinforced concrete beams reveals insufficient transversal steel reinforcement, mainly due to design or construction defects or increased design load requirements. In this context, the three-point bending test is used to evaluate the structural capacity of beams without and with retrofitting solutions, for example by carbon fiber reinforced polymer (CFRP) reinforcements, as shown by Lavorato et al. [42] and Nuti et al. [9].
Herein, the portion of the beam extracted from the Italian school building was tested and its structural capacity was evaluated. Before the three-point bending test, the material properties were evaluated by the nondestructive methods and the destructive tests performed on the cores and the rebars extracted from the two portions of columns (CL II-1 and CL II-3). The cores and rebars from the beam were extracted afterwards.
The rectangular cross-section of the beam was equal to 30 cm × 58 cm. The longitudinal steel reinforcement layout shows an evident asymmetry, as presented in Figure 10. The left section of the beam was cut close to the joint, while the right section was cut toward the span (Figure 1). Thus, at the middle cross-section, there are 6F14 (lower reinforcement) and 2F10 (upper reinforcement), as well as at the right cross-section. At the left cross-section, there are 3F14 (lower reinforcement) and 2F10 + 2F14 (upper reinforcement), with a third F14 positioned at half the height of the beam, since 3F14 rebars bend toward the joint side (at 45°), which was usual in ancient existing RC structures to optimize the steel reinforcement according to the bending and shear stress. The transversal steel reinforcement was identified using a pacometer, constituted by several stirrups F8 with a distance of around 15 cm close to the joint and around 25 cm along the span.
The beam presented some relevant cracks, probably due to some damages that occurred during the extraction and the transport operations. The main cracks are shown in Figure 10. Before the experimental test was performed, the longitudinal steel reinforcement was fixed at the ends to permit steel bonding, since it cannot be guaranteed by smooth rebars without a reliable anchorage.
A preliminary study was conducted to evaluate the failure mechanism. Bending moment and shear resistances were estimated according to the static scheme, loading point, geometry (concrete cross-section, longitudinal and transversal rebars), and material properties evaluated by the nondestructive test results and the tensile tests performed on the rebars extracted from the columns. Thus, the expected failure mechanism was the bending mechanism produced by a maximum load of 211 kN, considering that the shear stress carried by the stirrups on the right side (without considering the concrete contribution) is around 170 kN, which means a total load of 340 kN.
According to the static scheme, the expected mechanical failure, and the asymmetry of the steel reinforcement, the vertical displacements of the beam during the test and the deformations induced by the shear stress on the weaker side of the element were measured by several vertical and diagonal transducer as described in Figure 11a.
The beam collapsed in bending for Fmax = 209 kN, almost the same value of the predicted maximum load, with the opening of some wide cracks in the middle span (Figure 11b). The vertical transducers showed a perfect elastic-plastic beam behavior, with slight hardening, which includes a linear phase until a load value of 190 kN and then a plastic one until the failure load (Figure 12a). It seems clear that the behavior of the beam in bending was led from the beginning by the steel rebars, because of the very low resistance of the concrete which was probably already cracked.
According to the diagonal transducers (D1, D2, D3 and D4), the force–deformation behavior in shear is shown in Figure 12b. The four transducers show almost the same behavior until a load value of 150 kN. Then, several diagonal cracks, related to the shear stress, occurred in concrete. With the increase of the load, the cracks disappeared on opening, but not enough to produce a shear failure before bending.

7. Conclusions

The experimental campaign on structural elements removed from existing reinforced buildings, like the current case, differently from tests usually performed on specimens built ad hoc, is an opportunity to measure the effective state of degradation due to the consequence of aging on the built heritage. The experimental results include destructive tests on materials, nondestructive measures, and destructive tests on structural elements. The diagnostic phase is a crucial step for the structural safety assessment. Its main objective is the evaluation of the key properties given as the first instance in terms of strength and elastic modulus.
The first result from destructive tests on materials showed that, in the case of compression tests on concrete specimens from old, degraded structures, code formulations overestimate modulus of elasticity values in the range 15% (ACI318) and 50% (EC2), especially for very low concrete strengths, similar to the case study. For this reason, a specific formulation between EC,S and fcyl is given.
Regarding indirect measures, in which a great advantage is that they can be made extensively without damage, the best estimation of the compressive strength of concrete is given by the pull-out method, while the best estimation of elastic properties is given by the ultrasound method, even with some elaboration due to the correlation between the measured dynamic modulus and elastic modulus useful in structural evaluation. The ultrasonic pulse velocity method can be used. In fact, the dynamic modulus of elasticity has a strong correlation (R2 = 0.84 ÷ 0.94) with the static modulus, especially if the test is performed directly on the cores as shown by the experimental results. The correlation laws between EC,S and Edyn with the ultrasonic pulse velocity measured on the specimens and directly on the structure were extrapolated and they are in good agreement with some of the formulations given in the literature [26,27,28]. A great help in diagnosis based on the acquisition of waves propagation velocity is given by the ultrasonic tomographic method, which allows obtaining graphical maps of the cross-section that detect eventual discontinuities, concrete quality, and different states of tension inside contiguous sections. Therefore, tomographic maps, elaborated without any damage for the building and are very useful in the case of the built heritage of historical and monumental value, can be considered a valid tool for degradation assessment, as well as for maintenance purposes.
In conclusion, indirect measures seem to play a key role in the assessment of existing buildings and infrastructures reducing the volume of direct experimental tests that inevitably require invasive actions on built heritage.

Author Contributions

Conceptualization, S.S; data curation and elaboration, A.F.; experimental tests, L.S.; validation and writing, S.S., A.F. and L.S. All authors have read and agreed to the published version of the manuscript.

Funding

This research received no external funding.

Conflicts of Interest

The authors declare no conflict of interest.

References

  1. Breysse, D. Nondestructive evaluation of concrete strength: An historical review and a new perspective by combining ndt methods. Constr. Build. Mater. 2012, 33, 139–163. [Google Scholar] [CrossRef]
  2. Amini, K.; Jalalpour, M.; Delatte, N. Advancing concrete strength prediction using non-destructive testing: Development and verification of a generalizable model. Constr. Build. Mater. 2016, 102, 762–768. [Google Scholar] [CrossRef] [Green Version]
  3. Ivanchev, I.Y.; Slavchev, V.S. Experimental determination of homogeneity, compressive strength and modulus of elasticity of concrete in reinforced concrete elements by non-ultrasonic pulse velocity method. In Proceedings of the 16th International Conference on New Trends in Statics and Dynamics of Buildings, Bratislava, Slovakia, 18–19 October 2018. [Google Scholar]
  4. Giannini, R.; Sguerri, L.; Paolacci, F.; Alessandri, S. Assessment of concrete strength combining direct and ndt measures via bayesian inference. Eng. Struct. 2014, 64, 68–77. [Google Scholar] [CrossRef]
  5. Masi, A. La stima della resistenza del calcestruzzo in situ mediante prove distruttive e non distruttive. G. Prove Distr. Monit. Diagn. 2005, 1, 2005. [Google Scholar]
  6. Breysse, D.; Balayssac, J.P.; Biondi, S.; Corbett, D.; Goncalves, A.; Grantham, M.; Luprano, V.A.; Masi, A.; Monteiro, A.V.; Sbartai, Z.M. Recommendation of RILEM TC249-ISC on non destructive in situ strength assessment of concrete. Mater. Struct. 2019, 52, 71. [Google Scholar] [CrossRef]
  7. EN 13791: 2019. Assessment of In-Situ Compressive Strength in Structures and Precast Concrete Components; European Commettee for Standardization: Brussels, Belgium, 2019. [Google Scholar]
  8. Lavorato, D.; Bergami, A.V.; Fiorentino, G.; Fiore, A.; Santini, S.; Nuti, C. Experimental tests on existing RC beams strengthened in flexure and retrofitted for shear by C-FRP in presence of negative moments. Int. J. Adv. Struct. Eng. 2018, 10, 212–232. [Google Scholar] [CrossRef] [Green Version]
  9. Nuti, C.; Santini, S.; Sguerri, L. Experimental tests on FRP shear retrofitted RC beams. In Proceedings of the CICE 2010—The 5th International Conference on FRP Composites in Civil Engineering, Beijing, China, 27–29 September 2010. [Google Scholar]
  10. Forte, A.; Santini, S.; Fiorentino, G.; Lavorato, D.; Bergami, A.V.; Nuti, C. Influence of materials knowledge level on the assessment of the shear strength characteristic value of existing RC beams. In Proceedings of the 12th fib International PhD Symposium in Civil Engineering, Prague, Czech Republic; 2018; pp. 979–986. [Google Scholar]
  11. EC2. Eurocode 2: Design of Concrete Structures—Part 1-1: General Rules and Rules for Buildings; European Commettee for Standardization: Brussels, Belgium, 2004. [Google Scholar]
  12. American Concrete Institute. Building Code Requirements for Structural Concrete; American Concrete Institute: Farmington Hills, MI, USA, 2014; ACI318-2014. [Google Scholar]
  13. Slonski, M.; Schabowicz, K.; Krawczyk, E. Detection of Flaws in Concrete Using Ultrasonic Tomography and Convolutional Neural. Materials 2020, 13, 1557. [Google Scholar] [CrossRef] [Green Version]
  14. FEMA 274. NHERP Commentary on the Guidelines for the Seismic Rehabilitation of Buildings; Federal Emergency Management Agency: Washington, DC, USA, 1997. [Google Scholar]
  15. European Commettee for Standardization. Testing Hardened Concrete—Part 13: Determination of Secant Modulus of Elasticity in Compression; European Commettee for Standardization: Brussels, Belgium, 2013; EN 12390-13:2013. [Google Scholar]
  16. Ahmad, S.; Pilakoutas, K.; Neocleous, K. Stress-strain model for low-strength concrete in uni-axial compression. Arab. J. Sci. Eng. 2015, 40, 313–328. [Google Scholar] [CrossRef]
  17. Ispir, M.; Dalgic, K.D.; Kuran, F.; Ilki, A. Modulus of elasticity of low-strength concrete. Proceeding of the 9th International Congress on Advances in Civil Engineering, Trabzon, Turkey, 27–30 September 2010. [Google Scholar]
  18. Verderame, G.M.; Ricci, P.; Esposito, M.; Sansiviero, F.C. Le caratteristiche meccaniche degli acciai impiegati nelle strutture in ca realizzate dal 1950 al 1980. In Proceedings of the XXVI Convegno Nazionale AICAP, Padova, Italy, 19–21 May 2011. [Google Scholar]
  19. European Commettee for Standardization. Testing Concrete in Structures—Part 2: Non-Destructive Testing—Determination of Rebound Number; European Commettee for Standardization: Brussels, Belgium, 2012; EN 12504-2:2012. [Google Scholar]
  20. European Commettee for Standardization. Testing Concrete in Structures—Part 3: Determination of Pull-Out Force; European Commettee for Standardization: Brussels, Belgium, 2005; EN 12504-3:2005. [Google Scholar]
  21. European Commettee for Standardization. Testing Concrete in Structures—Part 3: Determination of Ultrasonic Pulse Velocity; European Commettee for Standardization: Brussels, Belgium, 2005; EN 12504-4:2005. [Google Scholar]
  22. Moczko, A.T.; Carino, N.J.; Petersen, C.G. Capo-test to estimate concrete strength in bridges. ACI Mater. J. 2016, 114, 827–836. [Google Scholar] [CrossRef]
  23. Luo, Q.; Bungey, J.H. Using compression wave ultrasonic transducers to measure the velocity of surface waves and hence determine dynamic modulus of elasticity for concrete. Constr. Build. Mater. 1996, 10, 237–242. [Google Scholar]
  24. Hannachi, S.; Guetteche, M.N. Review of the ultrasonic pulse velocity evaluating concrete compressive strength on site. In Proceedings of the Scientific Cooperations International Workshop on Engineering Branches, Istanbul, Turkey, 8–9 August 2014. [Google Scholar]
  25. Byung, J.L.; Seong-Hoon, K.; Taekeun, O.; Yun-Yong, K. Evaluating the dynamic modulus of concrete using shear-wave velocity measurements. Adv. Mater. Sci. Eng. 2017, 17, 1651753. [Google Scholar]
  26. Hermann, V.; Weber, J.W.; Wesche, K. The dynamic modulus of elasticity as an equivalent for the initial tangent modulus of static testing. In Proceedings of the 2nd International Symposium on “New Developments in Non-Destructive Testing of Non-Metallic Materials”, Constanta, Rumania, 4–7 September 1974. [Google Scholar]
  27. Lydon, F.D.; Balendran, R.V. Some observations on elastic properties of plain concrete. Cem. Concr. Res. 1986, 16, 314–324. [Google Scholar] [CrossRef]
  28. Popovics, S. Verification of relationships between mechanical properties of concrete like-materials. Matér. Constr. 1975, 8, 183–191. [Google Scholar] [CrossRef]
  29. RILEM. NDT 4 Recommendations for In Situ Concrete Strength Determination by Combined Non-Destructive Methods—Compendium od RILEM, Technical Recommendations; E.F.N. Spon: London, UK, 1993. [Google Scholar]
  30. Gasparik, J. Prove Non Distruttive Nell’edilizia; Quaderno Didattico AIPnD: Brescia, Italy, 1992. [Google Scholar]
  31. Di Leo, A.; Pascale, G. Prove non distruttive sulle costruzioni in c.a. II G. Prove Distruttive 1994, 4. [Google Scholar]
  32. Sanpaolesi, L. L’evoluzione delle normative tecniche per la progettazione delle strutture in cemento armato. In Proceedings of the Giornate AICAP 2014, Bergamo, Italy, 22–24 May 2014. [Google Scholar]
  33. Breysse, D.; Balayssac, J.P. Strength assessment in reinforced concrete structures: From research to improved practices. Constr. Build. Mater. 2018, 182, 1–9. [Google Scholar] [CrossRef]
  34. Behnia, A.; Chai, H.K.; Yorikawa, M.; Momoki, S.; Terazawa, M.; Shiotani, T. Integrated non-destructive assessment of concrete structures under flexure by acoustic emission and travel time tomography. Constr. Build. Mater. 2014, 67, 202–215. [Google Scholar] [CrossRef]
  35. Liu, P.; Yeh, P. Vertical spectral tomography of concrete structures based on impact echo depth spectra. NDTE Int. 2010, 43, 45–53. [Google Scholar] [CrossRef]
  36. Pahlavan, L.; Zhang, F.; Blacquière, G.; Yang, Y.; Hordijk, D. Interaction of ultrasonic waves with partially-closed cracks in concrete structures. Constr. Build. Mater. 2018, 167, 899–906. [Google Scholar] [CrossRef]
  37. Buyukozturk, O. Imaging of concrete structures. NDTE Int. 1998, 31, 233–243. [Google Scholar] [CrossRef]
  38. Haach, V.G.; Ramirez, F.C. Qualitative assessment of concrete by ultrasound tomography. Constr. Build. Mater. 2016, 119, 61–70. [Google Scholar] [CrossRef]
  39. Kaltakci, M.Y.; Arslan, M.H.; Korkmaz, H.H.; Ozturk, M. An investigation on failed or damaged reinforced concrete structures under their own-weight in turkey. Eng. Fail. Anal. 2007, 14, 962–969. [Google Scholar] [CrossRef]
  40. Braga, F.; Laterza, M.; Gigliotti, R.; Dragonelli, G.; Nigro, D. Prove di compressione ciclica su pilastri in ca confinati con staffe e/o con tessuti in fibra di carbonio. In Proceedings of the XI Congresso Nazionale “L’ingegneria Sismica in Italia”, Siena, Italia, 25–28 September 2004. [Google Scholar]
  41. Du, M.; Jin, L.; Du, X.; Li, D. Size effect tests of stocky reinforced concrete columns confined by stirrups. Struct. Concr. 2017, 18, 454–465. [Google Scholar] [CrossRef]
  42. Lavorato, D.; Santini, S.; Nuti, C. Experimental investigation of the shear strength of rc beams extracted from an old structure and strengthened by carbon frp u-strips. Appl. Sci. 2018, 8, 1182. [Google Scholar] [CrossRef] [Green Version]
Figure 1. The five reinforced concrete elements extracted from the Italian school building.
Infrastructures 05 00100 g001
Figure 2. Correlation law between EC,S an fc (comparison with the standards).
Infrastructures 05 00100 g002
Figure 3. (a) Pull-out test; (b) correlation laws between F and Rc.
Infrastructures 05 00100 g003
Figure 4. (a) Correlation laws between Edyn and Ec,s; (b) regression line between V and fc for Sample A.
Infrastructures 05 00100 g004
Figure 5. SonReb method: comparison between the RILEM and the author’s formulations.
Infrastructures 05 00100 g005
Figure 6. Tomographic maps of the column elements: (a) specimen CL II-1; (b) specimen CL II-2; (c) specimen CL II-3; (d) specimen CL I-1.
Infrastructures 05 00100 g006
Figure 7. Tomography maps of the BEAM.
Infrastructures 05 00100 g007
Figure 8. (a) CL II-1, test set-up; (b) specimen CL II-1 after the collapse.
Infrastructures 05 00100 g008
Figure 9. Stress–strain cyclic graph of the two specimens.
Infrastructures 05 00100 g009
Figure 10. Global dimensions and steel reinforcement of the beam.
Infrastructures 05 00100 g010
Figure 11. (a) Test set-up of the BEAM specimen; (b) failure mechanism in bending.
Infrastructures 05 00100 g011
Figure 12. (a) Force–displacement, given by three vertical transducers applied at L/4, L/2 and 3L/4; (b) force–diagonal displacement, given by the four diagonal transducers.
Infrastructures 05 00100 g012
Table 1. Results from compression tests.
ElementTotal NCompression TestDetermination of the Secant Modulus of Elasticity
Nfc,m (Mpa)CV (%)NEC,SmCV (%)
CL I-16612.4417.45614,6273.48
CL II-2447.758.49310,90711.54
BEAM171712.2025.31814,07125.40
Table 2. Results from the tensile tests performed on the steel rebars.
ElementBar Type Mechanical Parameters
NΦσy,m (MPa)CV (%)σu,m (MPa)CV (%)Es,mCV (%)
CL I-1L318/20347.474.4530.836.2176,000-
CL I-1T36335.432.0410.321.7199,0201.9
CL II-2L316298.783.3426.692.4191,980-
CL II-2T36394.337.6545.021.1183,1357.7
BEAML1614293.3111.4381.413.7195,7237.6
BEAMT68360.654.8462.853.5196,780-
Table 3. Pull-out test results.
SampleNRc (Mpa)F (kN)Rpull (Mpa)Rpull/Rc
CL I-1614.4414.2212.350.86
CL II-249.027.467.010.78
Table 4. Static and dynamic modulus of elasticity from compression and ultrasonic tests.
SampleNEC,Sm (MPa)CV (%)Edyn,m (MPa)CV (%)Edyn,m/EC,Sm
A1313,79119.9919,04024.901.38
B814,07125.4017,51022.761.24
Table 5. Sonic–Rebound (SonReb) method results: cubical compressive strengths and corrective coefficients.
N IRVultr (m/s)Rc (Mpa)Rc,1 (Mpa)Rc,2 (Mpa)Rc,3 (Mpa)Rc,S
(Mpa)
Cs,1Cs,2Cs,3Cs,S
CL I-16m36329914.4416.6419.0518.0717.720.880.760.810.82
CV3.84.017.314.311.012.68.720.218.319.617.5
CL II-24m3225469.026.909.838.2010.551.310.921.100.86
CV3.23.98.55.73.36.22.511.39.811.69.4
TOT10m-------1.050.820.930.83
CV -------24.716.321.213.4
Table 6. Results from the compression tests.
ElementF (kN)nsc (MPa)Ec,sec,T (MPa)Ec,sec,S (MPa)n
CL II-3864.04298.05513666400.225
CL II-1874.00268.30511472280.131
Publisher’s Note: MDPI stays neutral with regard to jurisdictional claims in published maps and institutional affiliations.

