Review

Ballast Contamination Mechanisms: A Criterial Review of Characterisation and Performance Indicators

1
Department of Civil Engineering, Covenant University, Ota 30750, Nigeria
2
Department of Civil Engineering, Michael Okpara University of Agriculture Umudike, Umuahia 440, Nigeria
*
Author to whom correspondence should be addressed.
Submission received: 28 August 2020 / Revised: 24 September 2020 / Accepted: 24 September 2020 / Published: 2 November 2020

Abstract

:
Across the world, ballasted railway tracks are utilised extensively due to their cost efficiency, ease of drainage, and capacity to withstand cyclic imposed loadings from heavy trains. In spite of these benefits, the ballast is often considered as a flexible medium; as such, its continuous deterioration is largely disregarded. Geotechnical challenges such as ballast contamination in the form of particle fragmentation, deposition of weathered materials, upward pumping of clay and fines from underlayers, and coal intrusion have led to differential settlements and reduced drainability of tracks, thereby exacerbating track maintenance costs. This study reviews existing works of literature to expound on the mechanisms for ballast contamination and to highlight the fundamental parameters that guide the characterisation and performance evaluation of railway ballasts. The study shows that ballast fragmentation accounts for about 76% of commonly recorded contaminations, while it is also observed as the most critical to track stability. As such, a variety of indices and specifications for ballast gradation have been established worldwide to guide practice in ballast characterisation and performance evaluation. However, the mechanisms of ballast fragmentation and deterioration require further research to guide the improvement of contemporary guidelines, and mitigate the risk of abrupt track failures, especially in developing countries.

1. Introduction

Ballasted railway tracks constitute the major transportation grids in many countries across the globe; they convey commuters, as well as freight and bulk cargoes, between cities, mines, farmlands, and ports [1]. The railtrack structure can be categorised into two groups: the substructure and the superstructure. The substructure comprises the subgrade, the sub-ballast, and the ballast, while the superstructure encompasses the sleepers (timber or concrete), the fastening mechanism, and the steel rails [2]. However, the ballast may be regarded as a superstructure component in certain regions of Europe [3]. The safety and efficiency of ballasted track railways rely entirely on the complex and integrated collaboration of all track components in response to the recurrent loads imposed by high-speed locomotives. While components of the superstructure are mostly elastic in nature and generally endure minimal deformations, granular-layered substructures such as the sub-ballast and the ballast frequently undergo deformations of high significance subject to the massive recurring stresses induced by the combined effects of aggravatingly heavier and speedier locomotives and the dynamic loading initiated by rail or wheel irregularities [4]. As such, the reactions of the substructure often introduce substantial challenges to the initial rail track design and the successive maintenance and preservation operations after assemblage [1].
Ballast materials form a layer which encases the sleepers to provide both vertical and transversal stability to rail tracks. In the classical (conventional) design of railway tracks, the ballast is often considered as a flexible medium to simplify behavioural simulations during track analysis; as such, its continuous deterioration and accompanying plastic deformation are often disregarded. These issues result from the inadequate understanding of the complicacy of ballast particle rupture and other fouling mechanisms, as well as the lack of a properly definitive model. These have been consequential in the adoption of basic empirical methods in the planning and assemblage of railway track substructures, which often further require repetitive remedial operations and cost-intensive maintenance. The points at which the ballast particles interact with each other are the locations where load transfer occurs between adjacent particles. These tiny positions of contact continually and considerably deform with loading cycles while providing the requisite magnitude of resilience [5,6]. The high recurring loads concentrated on micro contact areas result in the wearing effect at contact points and, subsequently, fragmentation of the materials, with applied pressures exceeding the material’s bearing capacity [7]. The most commonly utilised materials for railway ballasts are described in Table 1.
On the basis of track design speed, traffic frequency, and aggregate composition, a variety of specifications for ballast gradation have been adopted worldwide including the CN 12-20C:2003 (Canadian National Railways Specification) [10], the BS EN 13450:2003 (European Standard) [11], the AREMA: 2010 (American Railway Engineering Maintenance-of-Way Association) [12], the RDSO, 2016 (Indian Specifications for Railways) [13], and the AS 2758.7:2009;2015 (Australian Standards) [14,15], amongst others [16]. These standards endorse the utilisation of ballast aggregates of high angularity due to their improved frictional interlockability and shearing resistance. Nonetheless, under massive load cycles, these aggregates lose their angularity [17]. Koohmishi and Palassi [18] assessed ballast degradation rated under variations in particle gradations and subgrade conditions. They found that ballast deformation is less with flexible subgrades and broad gradations [18]. However, Ebrahimi et al. [19] reported that the deformational behaviour of ballasts is representative of its level of contamination and resultant reduced permeability [19]. Several experimental studies have been conducted to understand ballast performance under various performance criteria [7,16,17,19,20,21].
This paper is focused on highlighting the fundamental parameters that guided the characterisation and performance evaluation of railway ballast aggregates in the past few years. It presents a concise but comprehensive review of existing literature on the sampling, contamination, granulometry and aggregate shape properties, durability, and drainability requirements for modern railway ballast materials. In line with Sustainable Development Goals 9 and 11, this review is anticipated to provide sustained guidance for future studies and practical applications on ballasted railway track construction and maintenance.

2. Ballast Contamination (Fouling)

A major reason for railway track maintenance is the accrual of contaminants in the voids between ballast aggregates. The deterioration of large ballast materials under loading further leads to the formation of fouling materials (particles ≤1.2 cm) [19]. Fouling influences the performance of tracks by altering the strength characteristics of substructure components via reduced durability, mud-hole formations, reduced permeability (drainage), reduced vertical, transverse, and longitudinal stability, and increased permanent deformation rates [22,23,24,25,26,27]. Railway maintenance frequency is linked to ballast quality, which constantly varies as a result of the intrusion and generation of fouling materials [1,7,19].
As reported in past studies, ballast fouling may occur as a result of one or the combination of five different mechanisms which include fragmentation of ballast (76%), migration of underlying sub-ballast materials (13%), surface infiltration of weathered particles and coal droplets (7%), upward migration of fines from subgrade formations (3%), and sleeper wearing (1%) [19,28,29]. Ballast fragmentation accounts for a significant fraction of commonly recorded contaminations, especially in the United States (US), and it has also been observed to be the most critical to track stability [19,30,31,32]. On the contrary, in the United Kingdom (UK), the main source of fouling observed is surface weathering [33]. As such, railway researchers have, over the decades, concluded that fouling significantly alters railway track deformational performance. [19,28]. However, Sussman et al. [5] argued that, except under high saturation levels, the high plasticity of clays causes it to stick and, as such, prevents the material from pumping into higher ballast layers. Rather, ballast materials often settle into the subgrade, thereby resulting in fouling [5]. Figure 1 illustrates the mechanisms of ballast fouling.

2.1. Effects of Fouling on Track Strength, Resilience, and Drainability

Ballast fragmentation results in the formation of tinier aggregates; when left unfouled by other fouling agents, these aggregates attain a consistency similar to gravels, which can result in a growth in the strength of the ballast layer. In this case, the strength growth can be attributed to the high-strength fragments present in the voids after fouling, thus restraining the movement of the larger ballast aggregates and, therefore, hypothetically increasing the stability and strength of tracks, but reducing its resilience [5]. Nonetheless, a thin line exists between the strengthening of ballast layers by fragmentation and drainability inhibition. Studies have simulated a wide range of challenges accompanying ballast fouling [7,30,31]. Generally, little variations in the size of voids in ballasts can considerably adversely affect their drainability and, subsequently, deter their life-cycle behaviour [34].
The behaviour of coal fouling is quite similar to that of silty and clayey soils, except for its highly damaging characteristics, which include high plasticity and water affinity, and low strength and stiffness [5]. Contrary to other ballast-fouling mechanisms, coal fouling may occur prior to the ballast fragmentation process, assuming that coal gets to tracks from weathered debris or via droplets from coal-conveying trains; subsequent moving trains then vibrate this debris into the voids between the ballast aggregates [5]. This can result in a top-down fouling situation with 100% coal. The coal contaminants initially alter the strength of the top ballast, which is responsible for a great percentage of the resistance to impact loads. Basically, the top ballast region is critical in the stability of the track with a high capacity to resist transversal and vertical movements; as such, a strength compromise in this region can lead to an increased possibility of track buckling or misalignment under recurrent loadings. As the coal migrates deeper into the ballast, under repeated vibrations, the vertical support of the track is reduced [5,23,35].

2.2. Ballast Fouling-Related Terminology and Indices

Ballast fouling agents are generally quantified and recorded before comparing on the basis of their relative weights in cases where past fouling conditions have aided the establishment of thresholds. As for coal and other fouling agents with relatively lower specific gravity values compared to coarse aggregates, an equivalent mass of the fouling material is contained in a greater percentage of the voids between ballasts compared to larger fouling agents [5]. Bearing in mind the common specific gravity values for coal, granite, and clay (0.8–1.3, 2.65–2.75, and 2.3–2.6, respectively), an equal mass of coal, because of its lesser specific gravity, can be contained in twice the volume of either granite or clay [36]. This indicates that the quantity of coal fouling debris required to fill ballast voids and substantially deter its performance (especially its drainability) is only half the weight of conventional soil-fouling agents. Additionally, the established experience-based thresholds available specifying permissible quantities of ballast-fouling agents are all weight-based. They are, as such, unsuitable for evaluating fouling materials with lower values of specific gravity. Moreover, the obtainable experience-driven thresholds of tolerable extents of ballast fouling are all on the basis of weight. They are not valid for fouling agents with a lesser specific gravity [5]. Some of the common indices for assessment of fouling are described below.
Fouling index: Particle fouling can be defined in terms of particle size as smaller-sized grains in matrices of larger-sized ballast aggregate [19,37]. Various indices and correlations have been specified to representatively define the effective particle size of fouling agents, and their effects on tracks. Selig and Waters [28] developed the fouling index (FI) (Equation (1)), which has since been extensively adopted in the US.
F I = P % 4 + P % 200 ,
where P % 4 is the percentage by mass of the sampled ballast material finer than the 4.75 mm (No. 4) sieve, and P % 200 is the percentage by mass finer than the 0.075 mm (No. 200) sieve. The resultant classifications based on FI are presented in Table 2 [5,31].
Another fouling index extensively adopted was proposed by the South African Railway Spoornet; it is presented in Equation (2) and defined parametrically in Equations (3)–(6). This index takes into consideration a larger variety of sieves in assessing ballast fouling and sets a cleaning criterion at 80% [31].
F B = [ 0.1 P 0.15 ] + [ 0.2 P 1.18 ] + [ 0.3 P 6.7 ] + [ 0.4 P 19 ] ,
where
P 0.15 = ( %   b y   m a s s   o f   m a t e r i a l   f i n e r   t h a n   t h e   0.15   m m   s i e v e ) × 100   27 ,
P 1.18 = ( %   b y   m a s s   o f   m a t e r i a l   f i n e r   t h a n   t h e   1.18   m m   s i e v e ) × 100   11.5 ,
P 6.7 = ( %   b y   m a s s   o f   m a t e r i a l   f i n e r   t h a n   t h e   6.7   m m   s i e v e ) × 100   18 ,
P 19 = ( %   b y   m a s s   o f   m a t e r i a l   f i n e r   t h a n   t h e   19   m m   s i e v e ) × 100   27 .
Volumetric fouling index: Because of the variation in specific gravity values, and considering the fact that fouling content is typically defined in terms of percentage by mass, equal masses of coal and mineral fouling can occupy dissimilar volumes in the voids of the ballast. As such, the fouled points of ballast contacts are said to be proportional to the relative void volumes filled up by the fouling agent. Hence, a volumetric fouling index (VFI) was established by Ebrahimi et al. [19] to evaluate the actual volumes of contaminants in ballasts subjected to different fouling agents; the VFI is expressed in Equation (7).
V F I = F I × G s r G s f ,
where F I is the fouling index expressed in Equation (1), G s r is the specific gravity value of the reference ballast material (approximately = 2.6), and G s f is the specific gravity value of the present fouling agent. This expression corresponds with a study by Feldman and Nissen [38]. They developed the percentage void contamination model (PVC) to evaluate the fraction of the total void volume of ballast that is contaminated. Indraratna et al. [39] also developed a VFI termed the void contamination index (VCI). Indraratna et al. reported that the VCI accurately captures the volume of various foulers (for example, clay and coal) in relation to the total volume of ballast voids.
Figure 2 presents the results of a thorough study into the specification of ballasts undertaken by Committee D182 of the European Rail Research Institute (ERRI) and issued by the European committee for standardisation (CEN). On the basis of these observations, cleaning of the ballast is needed if the fouling, defined as the mass finer than the 22.4 mm rectangular sieve, exceeds 30% [8].
Ballast particle contact-point contamination: With the presence of fines coating the points of ballast particle contact, the stability and strength of the ballast layer are decreased [17,19,22,40]. Polito and Martin [41] observed that the presence of fines (particles finer than 0.075 mm) in the 25% to 45% range in gap-graded aggregate mixtures could instigate the development of instability. Ebrahimi et al. [19] further reported that a similar situation occurs when the ballast is fouled. As shown in Figure 3, with increasing amounts of fouling agents, larger ballast particles sooner or later get embedded between the fines, thereby increasing the macro voids. To understand the extent of fouling at ballast contact points, a comparison of the volume of macro voids developed in contaminated and clean ballasts can be made. Equation (8) has been adopted for the determination of the ratio of macro voids in ballast matrices under varied conditions of fouling [19].
e m a c B =   ( G s r   γ w   V M b 1 ) ,
where e m a c B is the ratio of macro voids of the ballast, G s r is the specific gravity value of the ballast, γ w is the density of water, V is the total volume of the sample ballast, and M b is the mass of ballast particles (>12 mm) in the volume.

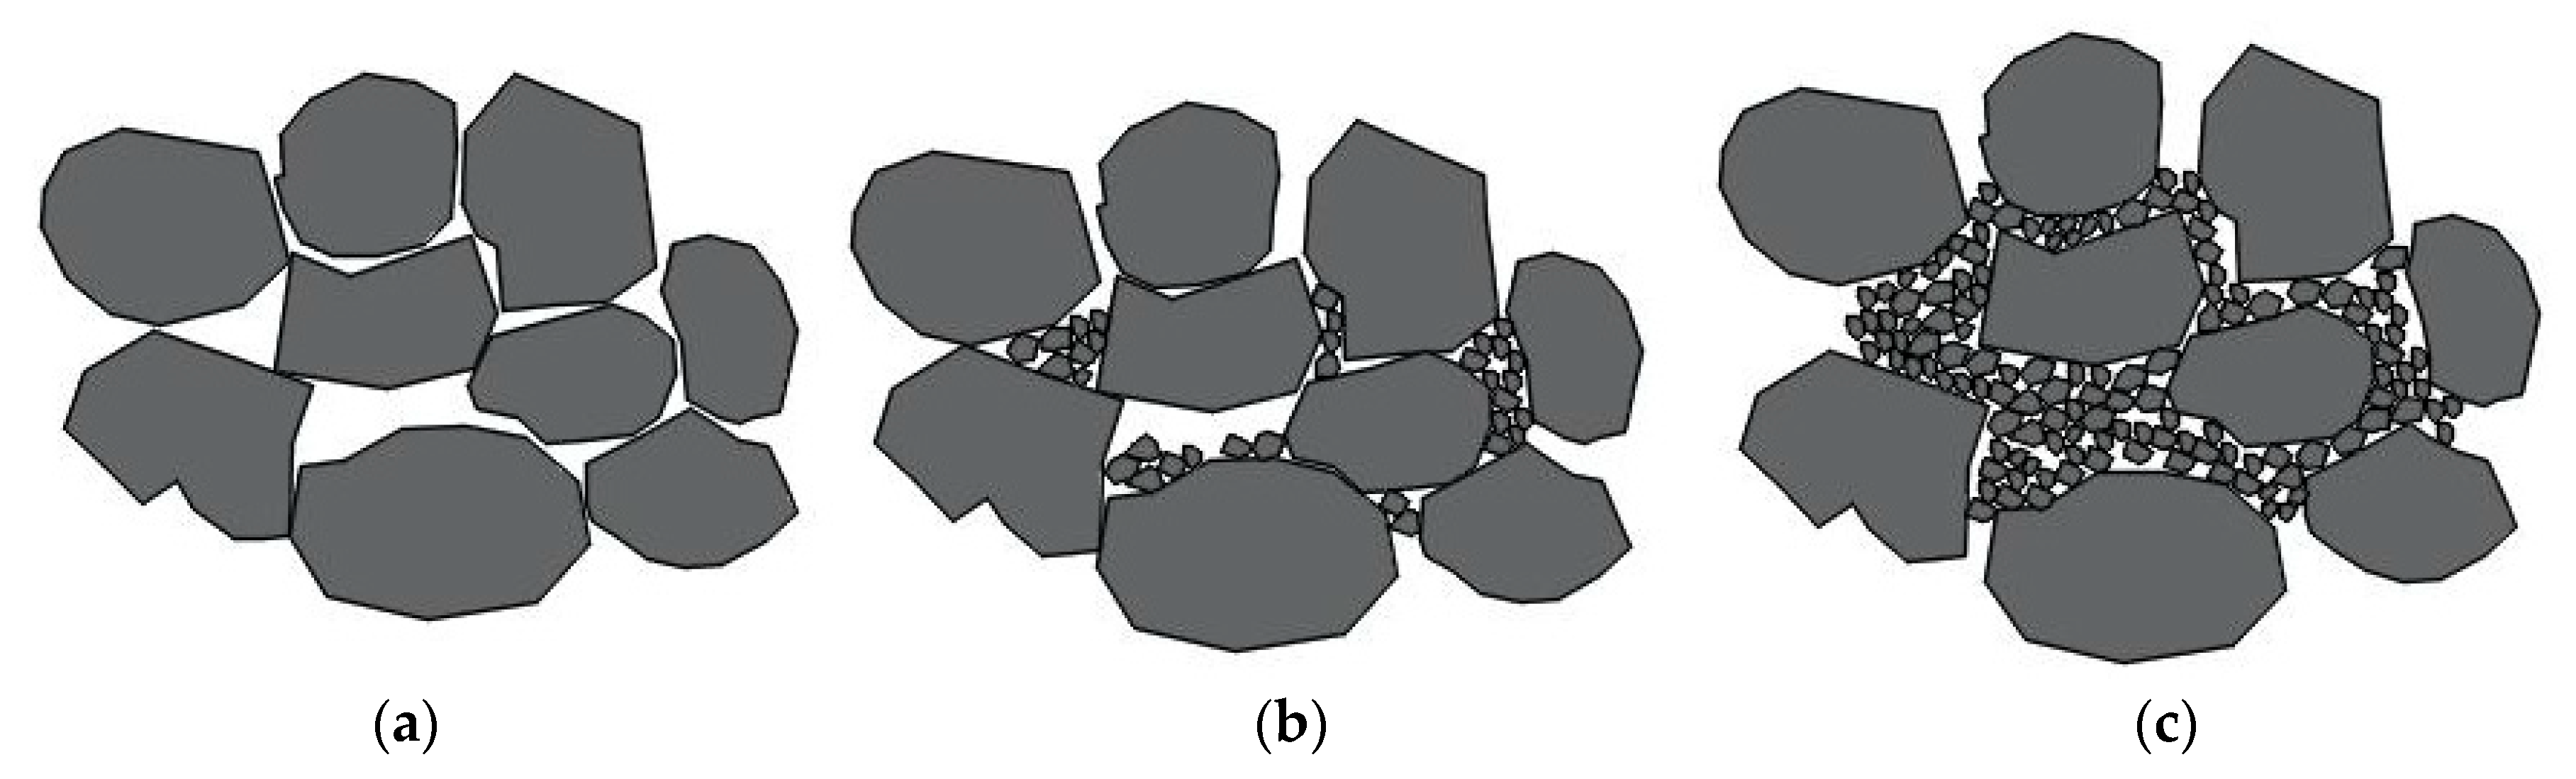
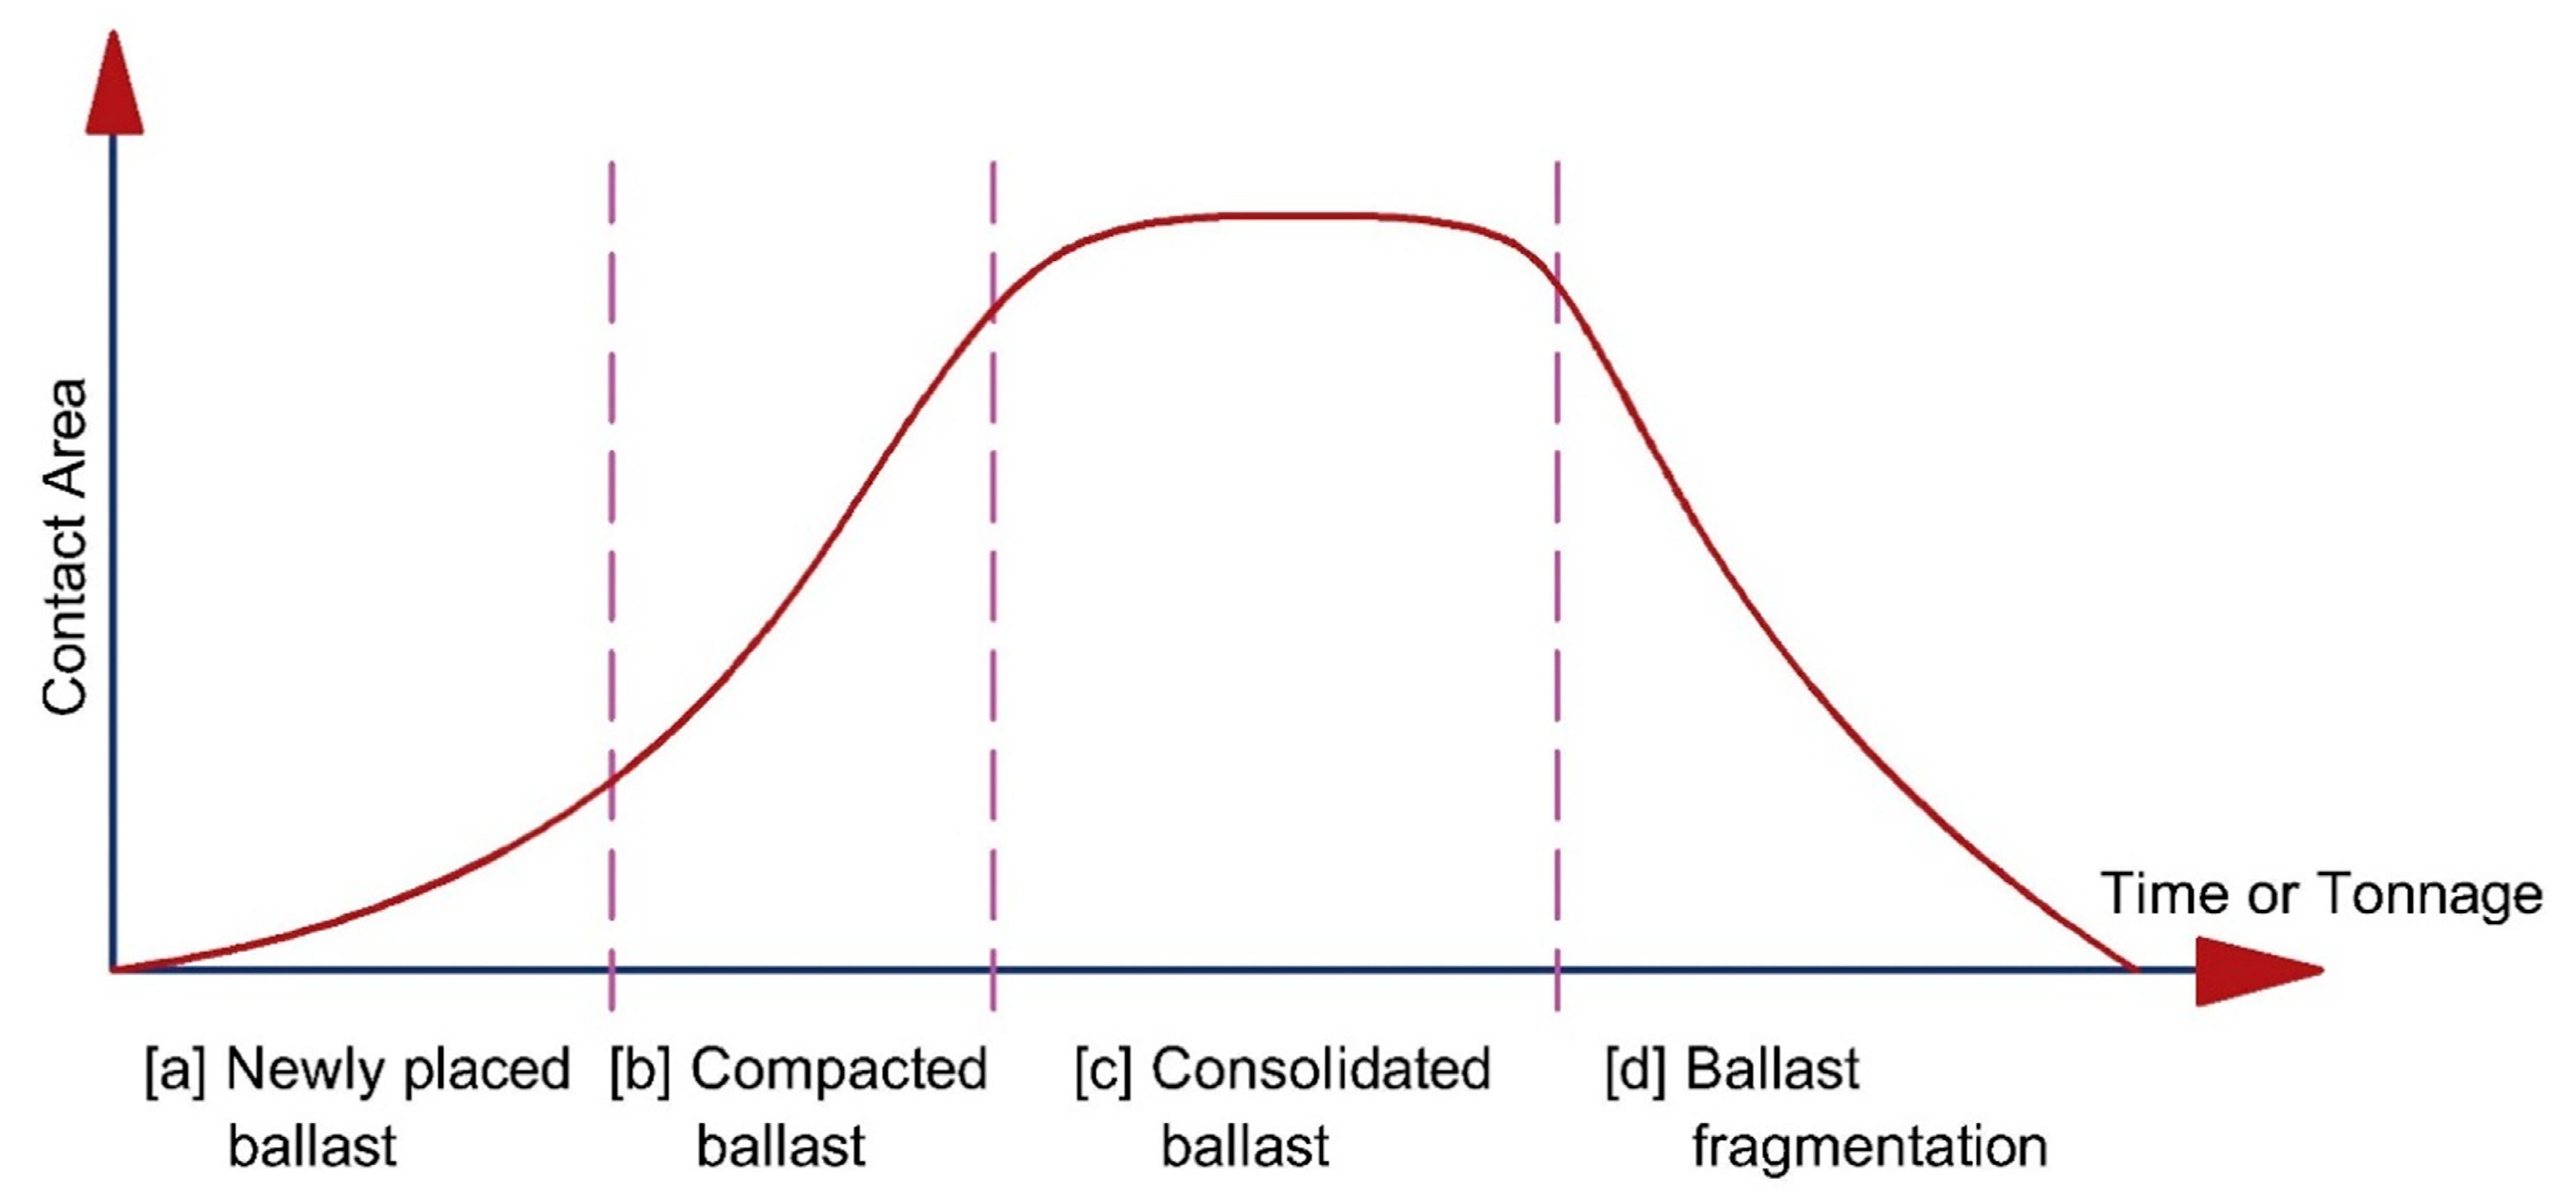
2.3. Ballast Contamination via Compaction and Consolidation

Compaction and consolidation are the processes that occur after the placement of new ballasts or the replacement of existing ballasts to densify the ballast layers [5]. The traditional method of densification involves successive passages of traffic trains at reduced speeds, thereby applying minimal recurrent vertical loads. This method is called natural densification and is often simulated with the use of the dynamic uniaxial loading laboratory test on ballast samples [42]. Another commonly adopted approach is the adoption of the dynamic densification method in which rails are agitated with vibrators while being concurrently loaded vertically with a piece of specified equipment. Furthermore, a relatively modern method is the crib compaction method, which involves the direct packing of ballast between sleepers with the aid of a set of plates of varying sizes, placed at different points, and rapidly vibrating vertically while inducing impact loads [42]. Initial densification of ballasts often requires the natural densification approach to avoid the possibility of buckling while the transverse resistance of the track is at its minimum level [43]. In the transversal stability analysis of tracks, the variation in ballast transversal strength over time and with train loading during compaction is defined as consolidation; it refers to the time-bound growth in overall track strength [5]. Nonetheless, theoretically, this is a process of ballast compaction. The higher density leads to improved forces of interparticle contact, keeping the ballast in place and offering better track transversal strength [44].
As illustrated in Figure 4a, the compaction process of ballasts begins with newly placed loose ballast contacting particles adjacent to each other at discrete points; then, as the train loading or dynamic densification commences, the ballast aggregates are compressed and packed tightly (Figure 4b), thereby increasing the ballast particle contact areas. Any extra loading further tightly packs the aggregates, resulting in the interlocking of particle asperities, leading to a stronger response to loadings. On subsequent loadings, depending on the magnitude of the impact load and the strength capacity of the ballast, further compaction can occur. With high-strength ballasts, the densification course proceeds with minor abrasions and attrition at the angular edges, thereby providing a tightly packed ballast matrix, as is the case with strong and consolidated rail tracks (Figure 4c). However, if the loading applied surpasses the strength capacity of the particles, fragmentation occurs (Figure 4d) [5].
Considering the contact area of ballasts, the aggregate-to-aggregate contact area remains an essential factor in assessing discrepancies in their structural stability. As shown in Figure 5, the contact area changes across the four phases described in Figure 4. The ballast aggregate-to-aggregate contact area changes from the period of initial ballast placement of loose aggregates to the period of increased aggregate contact with the reorientation of particles into a tighter pack under the compactive effort. The preferred condition is that of the highly consolidated ballast; in this phase, the ballast can retain stability over extended periods and loading cycles. Beyond this phase, the ballast deteriorates, and the voids are filled. Consequently, the ballast loses its mechanical performance, At this point, maintenance measures may not significantly improve the condition, because tamping will only lead to a totally loosened matrix of ballast; as such, ballast replacement will be necessary [5,18,19].

3. Granulometry and Shape Properties of Ballast

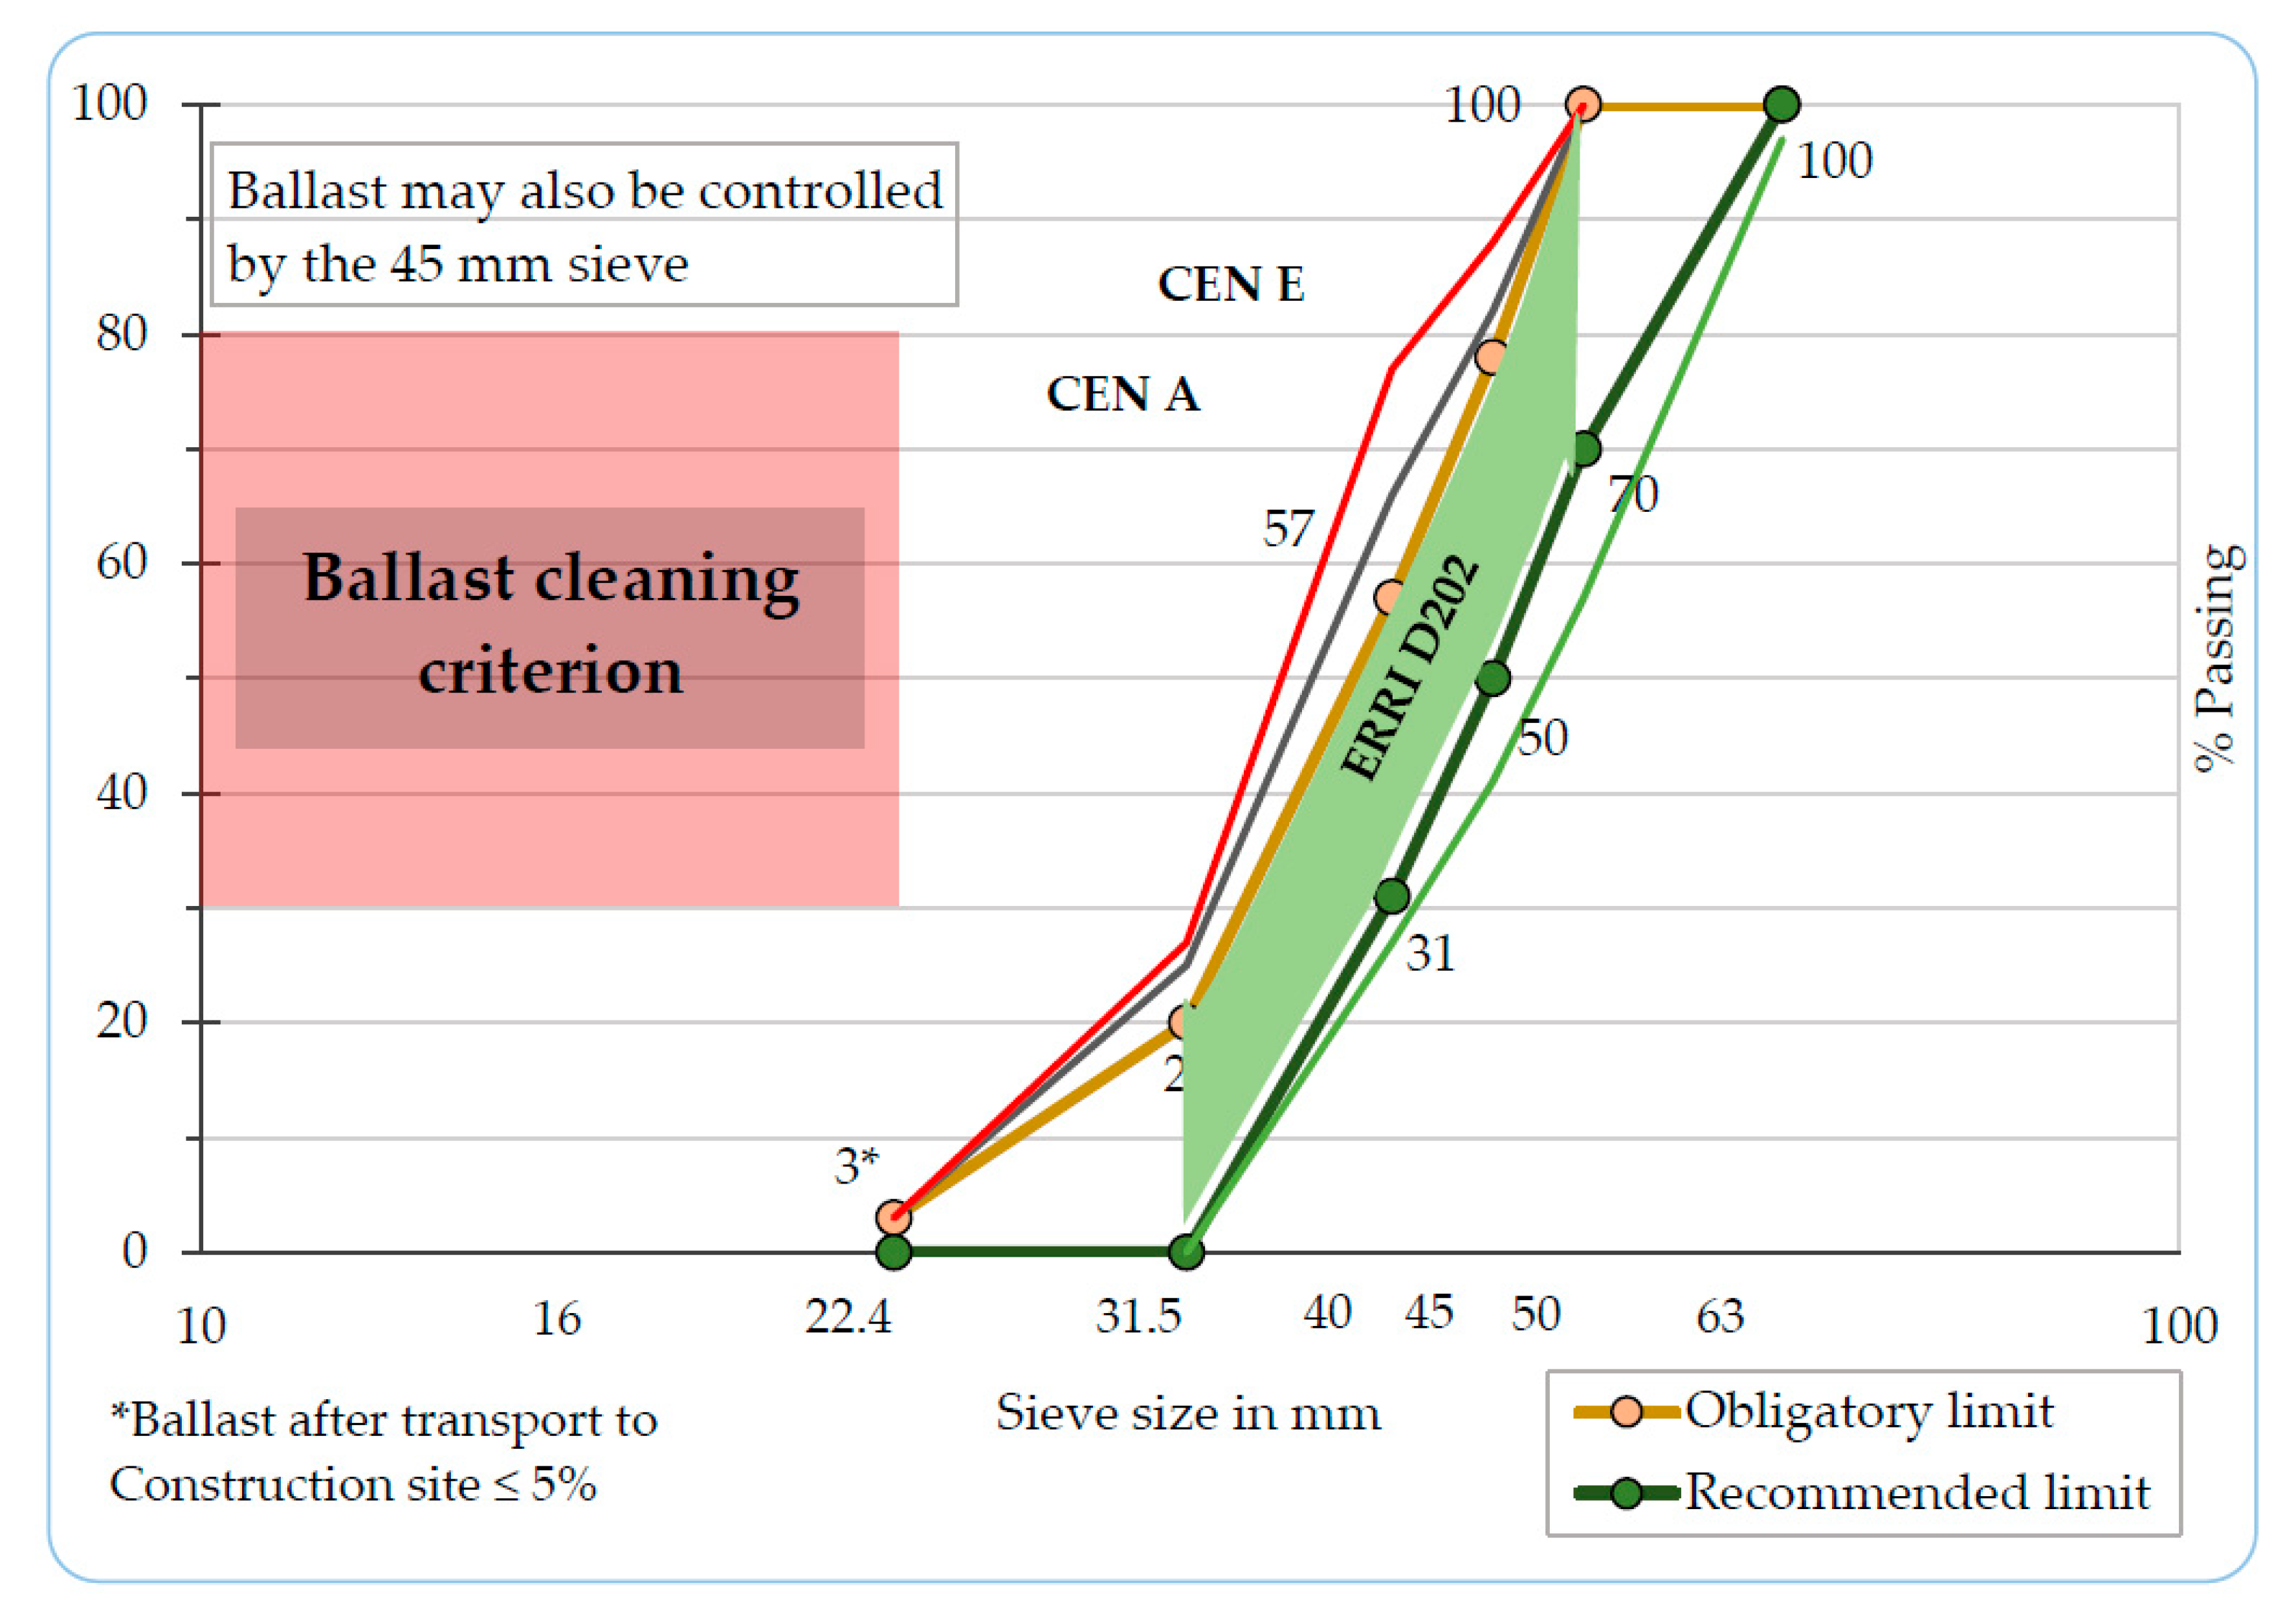
3.1. Granulometry (Gradation)

Ballast aggregate size distribution significantly influences the deformation characteristics of tracks. A higher level of uniformity of ballast aggregates leads to a higher elastic stiffness. However, the density and angle of internal friction decline with higher levels of particle uniformity [31]. Ballasts with broad gradation contain fewer voids, thereby offering higher strength than uniformly graded ballasts [45]. Nonetheless, Indraratna et al. [46] concluded that the optimum gradation for a ballast must be balanced between broadly and uniformly graded. This gradation was observed to provide adequate density, elastic modulus, shear resistance, and drainage for railway tracks [46]. The commonly adopted gradation specification is that of AREMA No. 24 [12]. Wnek et al. [21] assessed ballast gradation across 13 ballast-supplying quarries in Illinois, USA and reported that most ballast producers were not meeting recommended specifications, especially in terms of gradation [21].
The Canadian National Railways Specification [10] studied the variations in ballast gradation over time with their fragmentation and developed the gradation curve presented in Figure 6.
Figure 6 highlights a green region for suitable ballast performance; this standard is suitable for fresh ballasts, minorly worn ballasts, and ballasts that have been subjected to up to 500 million tonnes of train loading. On the other hand, the red region covers the range of size distributions for fouled ballasts. From Figure 6, it can be observed that the specification for ballast weakening is set between 25% and 35%, being finer than the 19 mm sieve, because the evolution of ballast deterioration becomes faster as the voids get filled, and drainability is reduced [47]. This criterion is comparable to the FI specifications established by Selig and Waters [28] presented in Table 1. Results of granulometry tests conducted by Paiva et al. [31] on soil-fouled ballasts with varying proportions of clayey soils are further shown in Figure 7. Here, the ballast was fouled with 10%, 15%, 20%, 25%, and 40% of clayey soil by mass. The 10%- and 15% soiled ballast samples were classified as moderately clean ballast; this is why their gradation curves fell at the bottom region. On the other hand, the 20% and 25% soiled samples were classified as contaminated, whereas the 40% soiled sample was classified as highly contaminated, implying that, in this state, ballast cleaning is compulsory. Paiva et al. observed that, with increasing percentages of the contaminants, the aggregate size distribution curve moved upward toward the red region described in Figure 6.

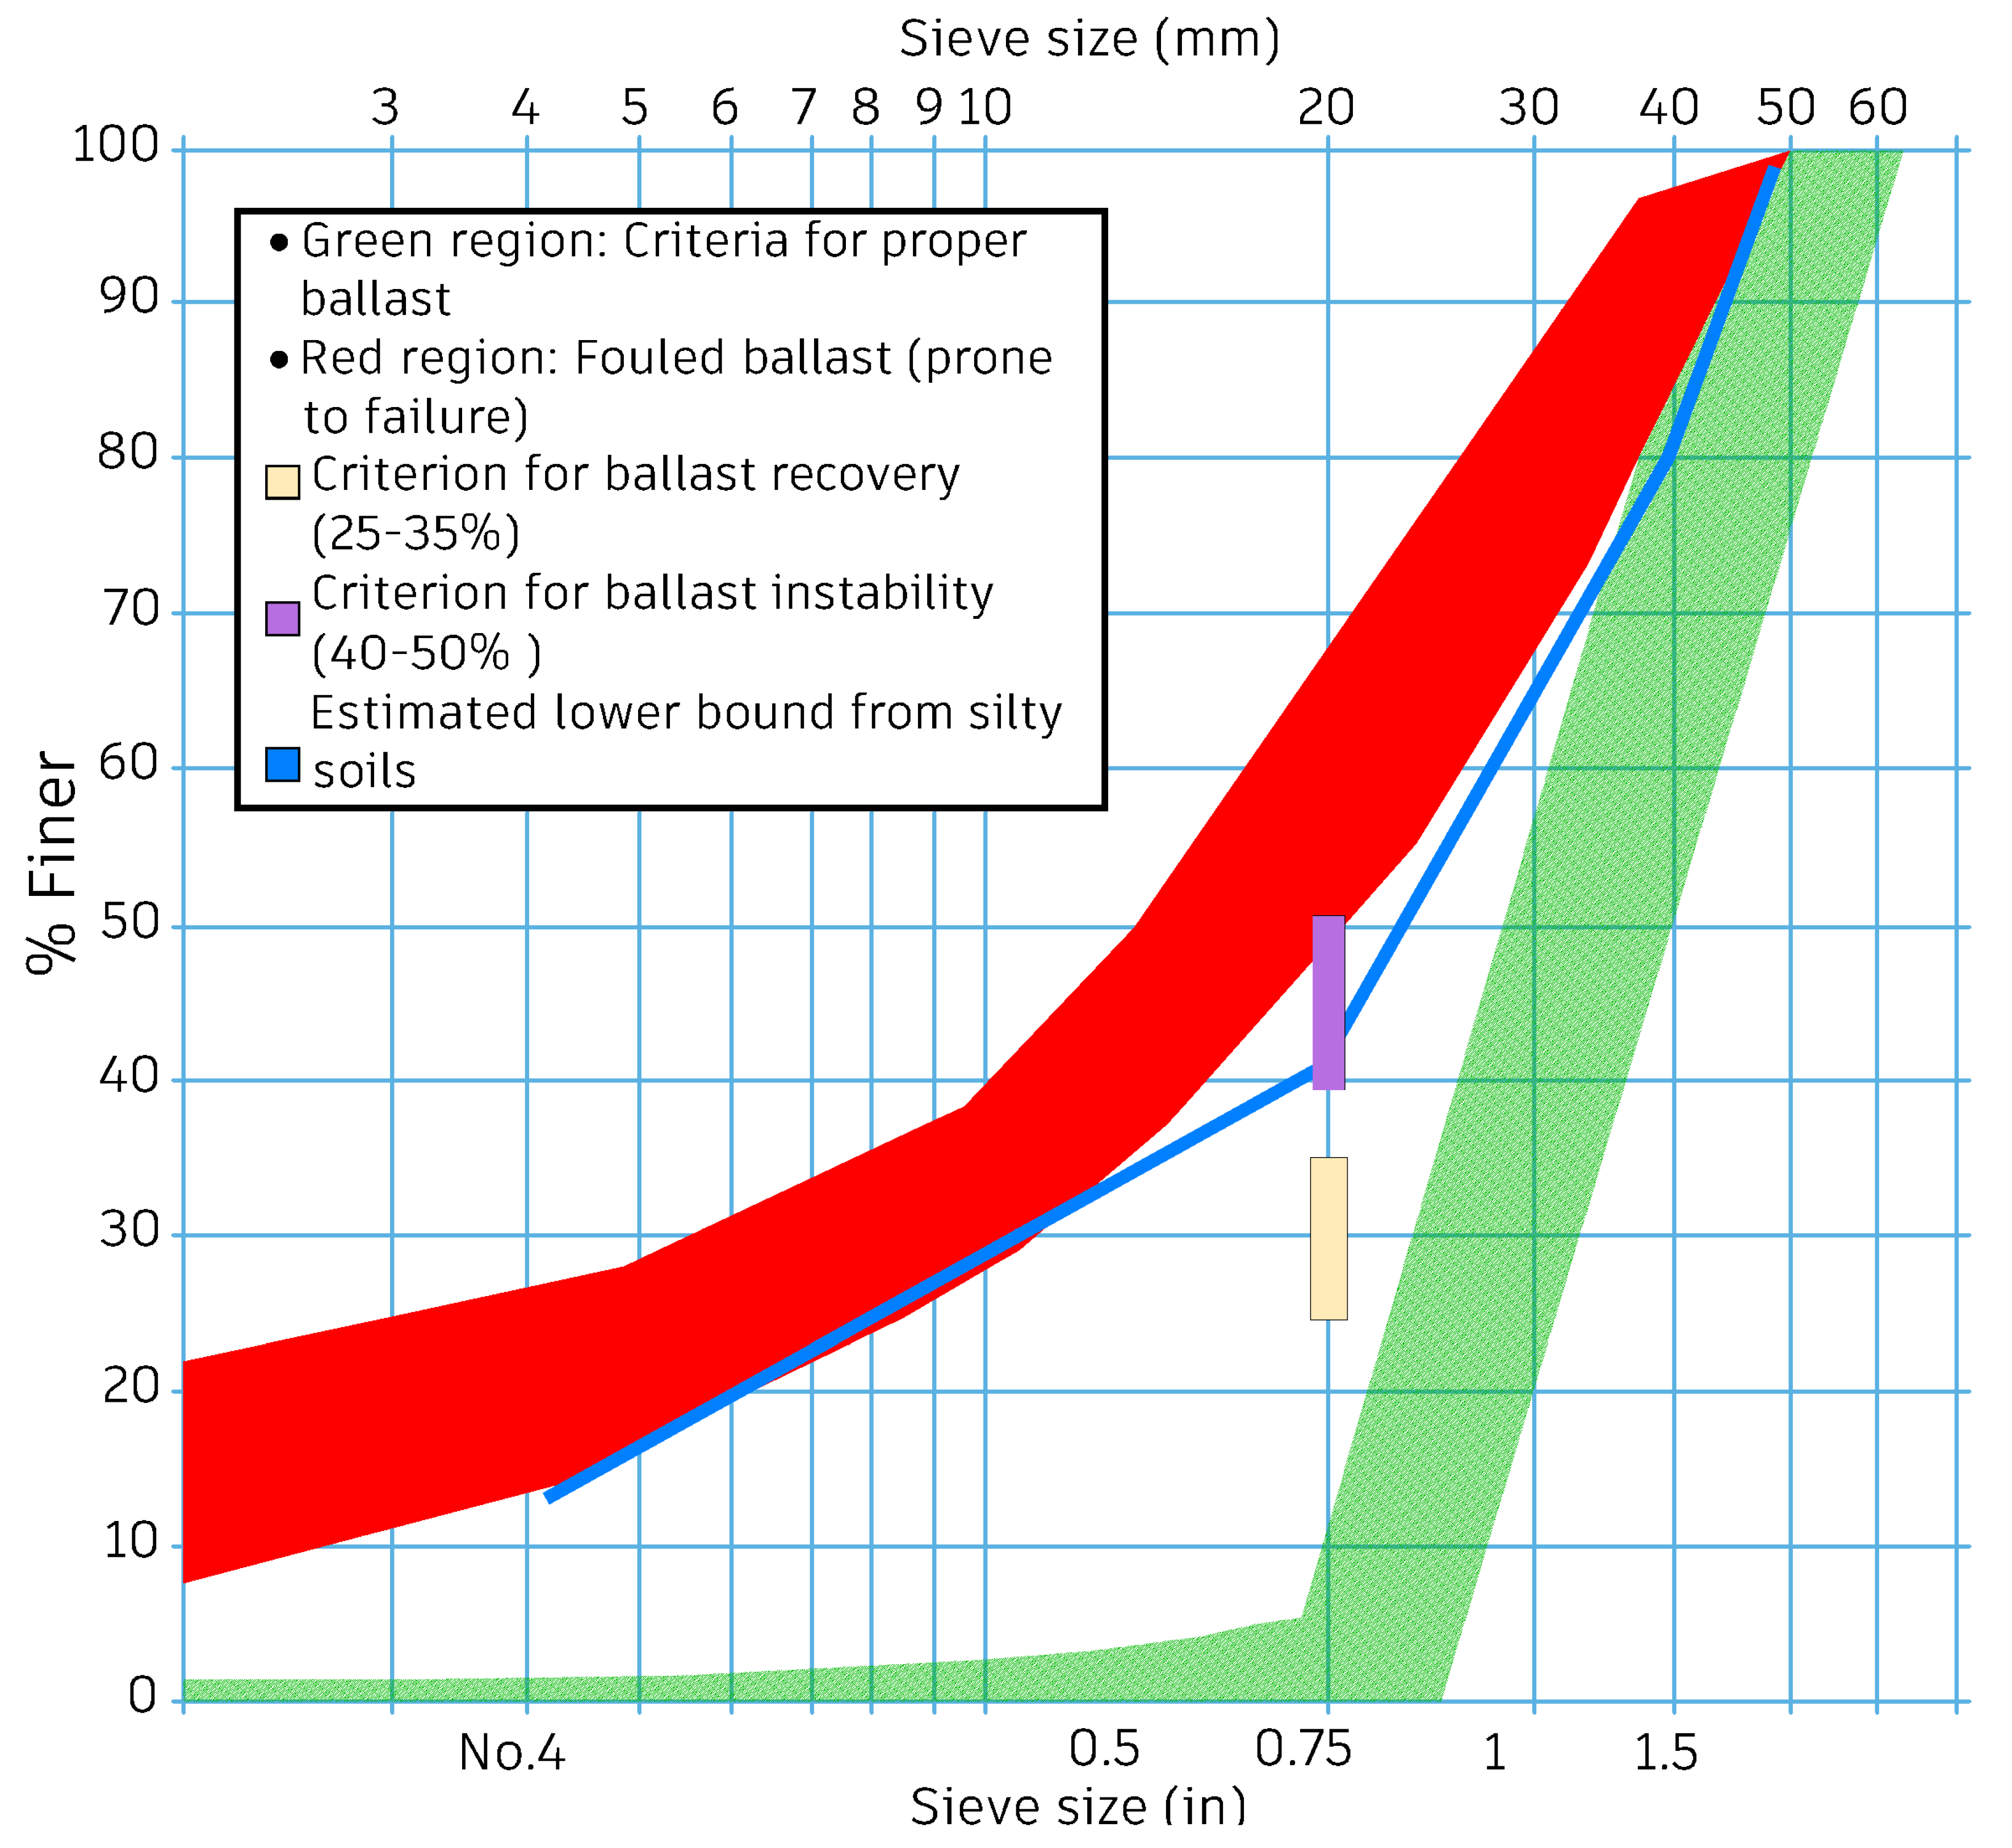
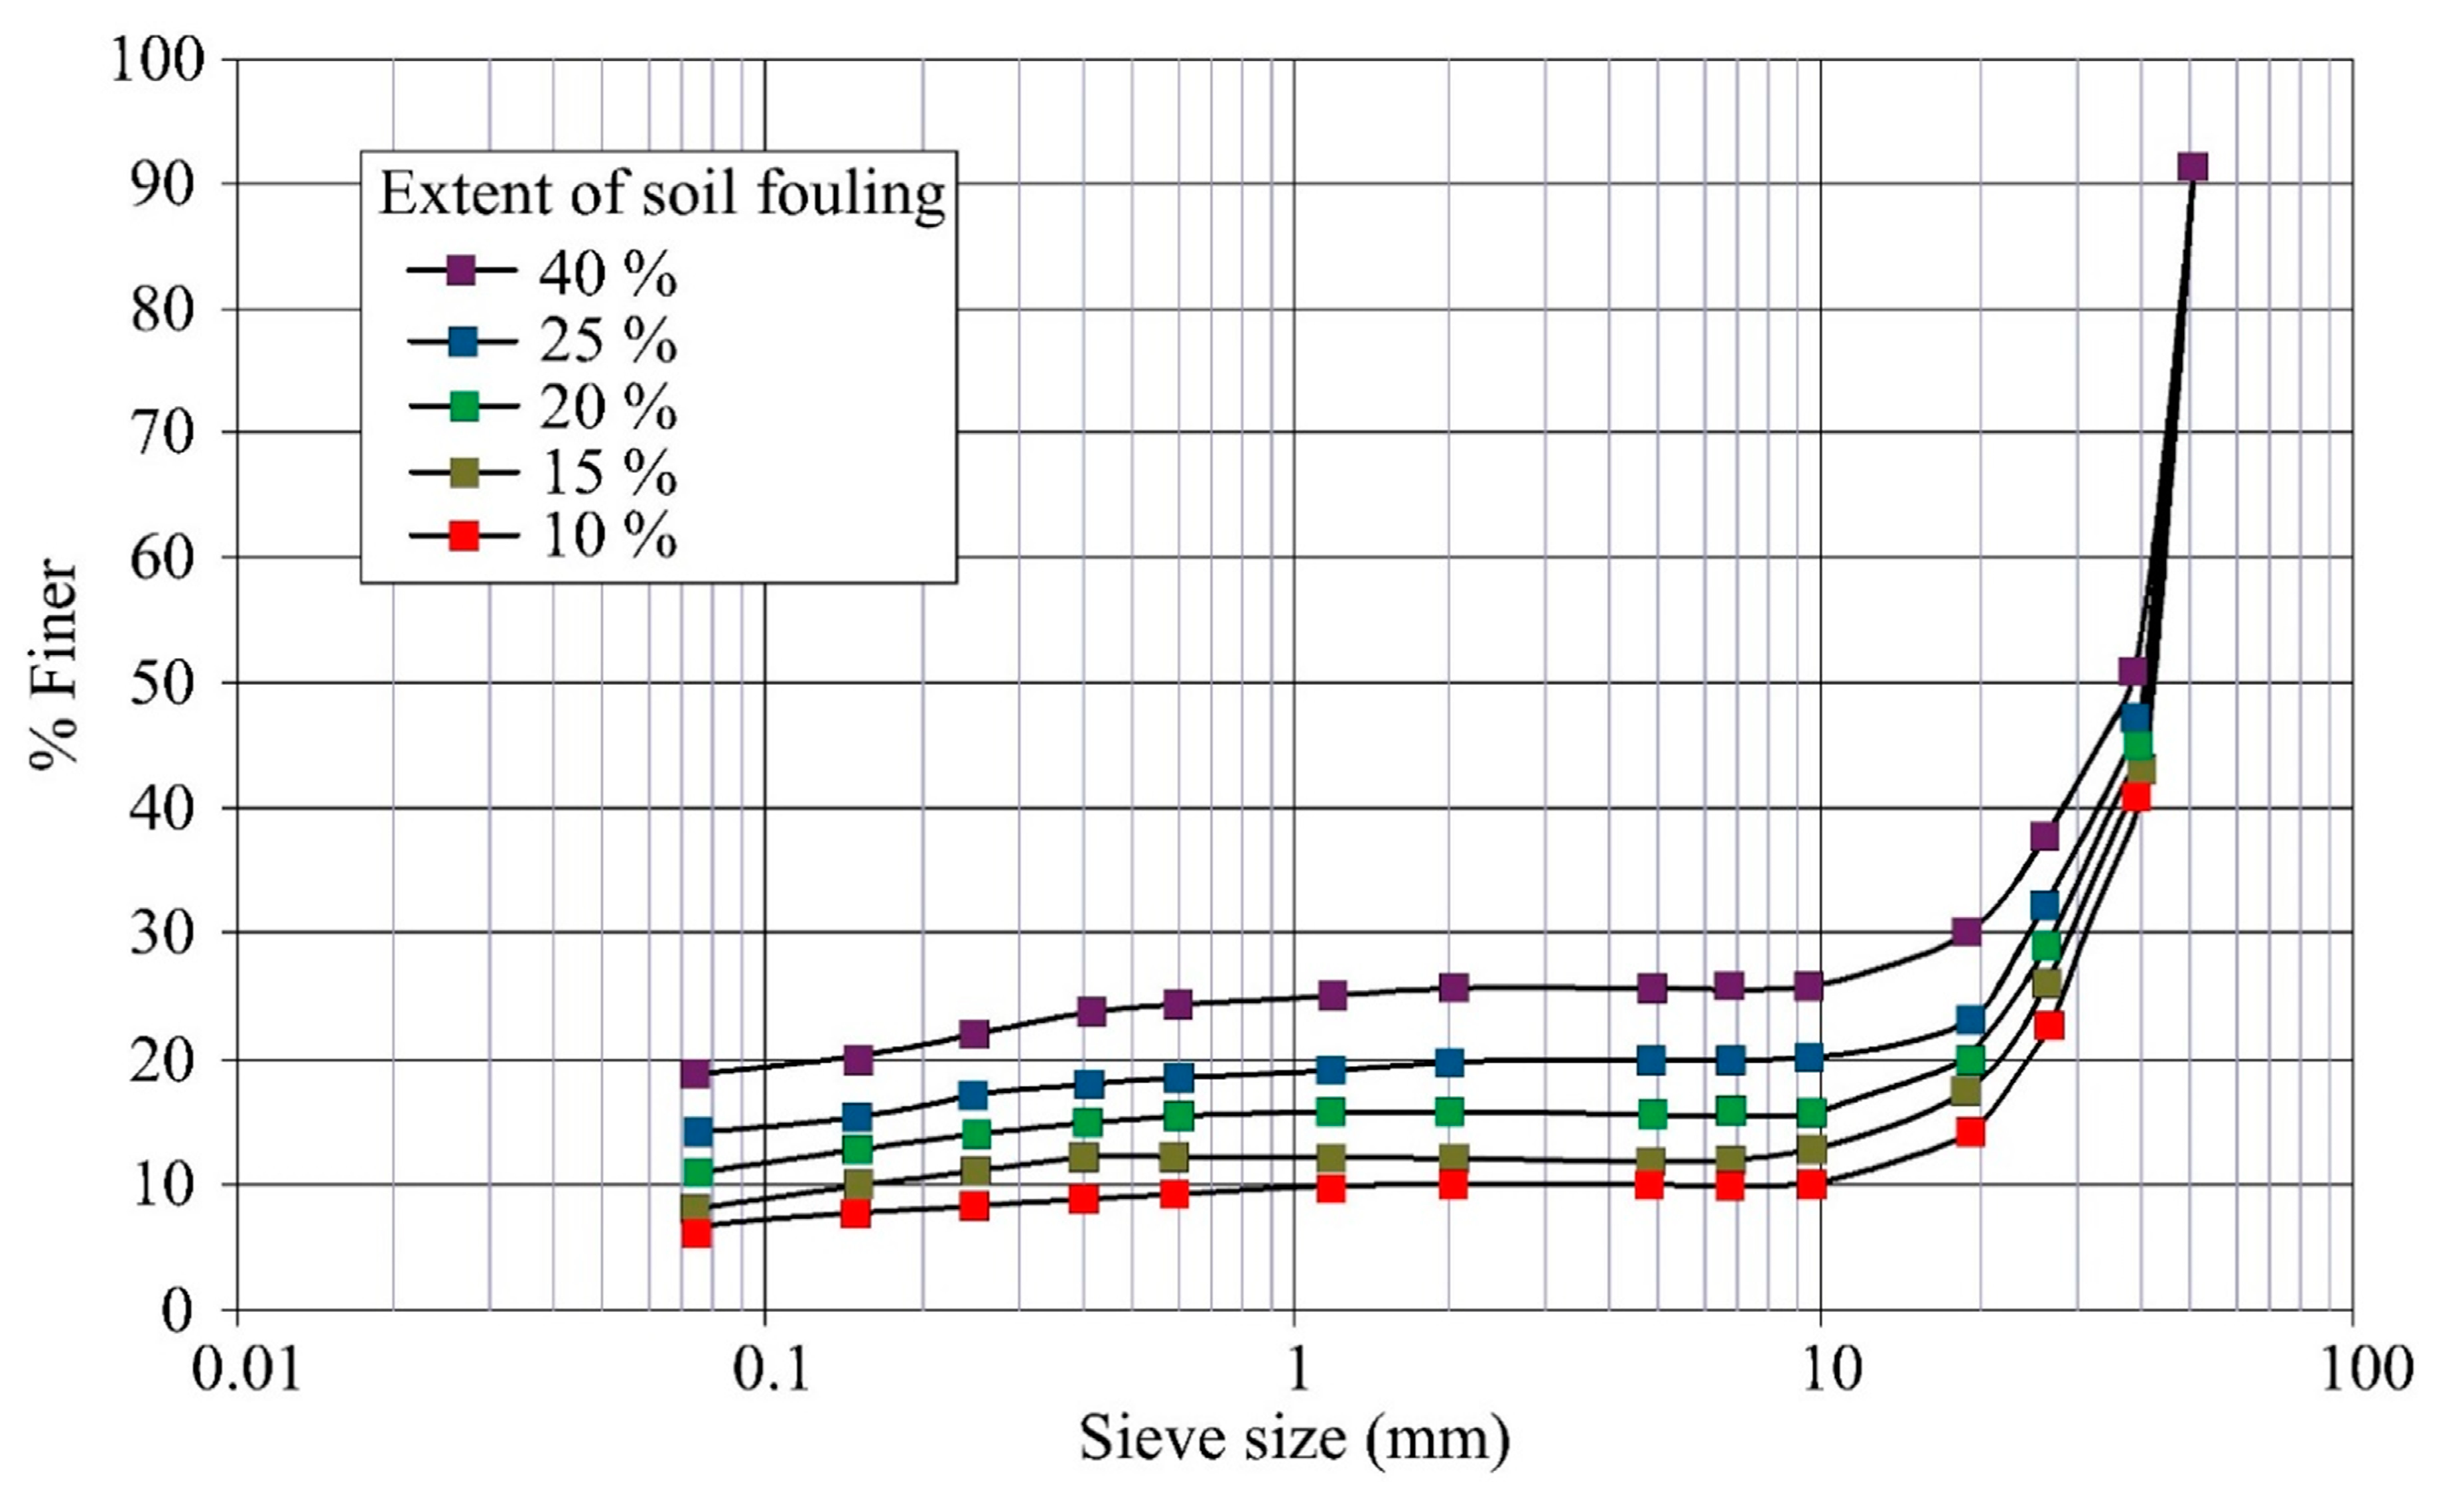
3.2. Granulometric Evaluation of Fouled Ballast

Ballast contamination occurs progressively and is in many cases influenced by several factors. Considering situations without any debris from the environment or operational activities contaminating the ballast, it is safe to anticipate ballast fragmentation. This can initially improve track stability via the in-place retention of ballast fragments. Nevertheless, this only occurs temporarily as potential damages resulting from either the reduced drainage capacity or the sustained deterioration of the ballast remain apparent and can alter the ballast stability [5]. In situations where materials are weathered, released, migrated upward, or a combination of these in the contamination of the ballast, it is essential to recognise the impact and establish parameters to evaluate the impact such as the CN 20 mm or the FI sieve-based criteria [10]. The term “ballast fragmentation” primarily refers to all deformations away from the originally recommended gradation of the ballast. These deformations may occur during placement, haulage, or maintenance. The key thing to be noted is that the fragments produced from the ballast fragmentation process are still of high relative strength, with the capacity to distribute imposed loads [48]. To better track ballast fragmentation, Indraratna and Salim [49] established the breakage index. The breakage index was obtained as the summation of the extra mass retained on each sieve during the deterioration and fragmentation of the ballast. The index is of high importance since larger particles will break, thereby producing finer fragments, and the extra mass induced by these smaller fragments on the sieves with tinier apertures directly indicates the performance of the ballast. Equally, the breakage index can be obtained as the sum of the mass losses from the larger-aperture sieves since the mass loss under fragmentation must be equal to the mass gained on the tinier sieves [49]. The benefits of this variation lie in the fact that cleaning and sieving of utilised ballasts is complicated, and larger ballast particles retained on the larger-aperture sieves offer reduced difficulties during cleaning and sieving operations.
Practically, the original ballast gradation may be unavailable and locally obtainable variations can be considerable, making the basis of comparison with the original condition impracticable. Furthermore, the principal concept would have been useful if a standardised sieve set were adopted for permissibility verification and in situ assessments throughout the life of the ballast. By observing the mass variation for each sieve, underlying failures from particular ballast units can be recognised and characterised. During particle split or fracture, the sieves that retain these fragments are not the same as those if the ballast was deteriorating under abrasion. This notion can be crucial when evaluating the stability of ballasts. For instance, Indraratna and Salim [49] performed a laboratory-based comparison of fresh and recycled ballasts in assessing the variations in stability. The fresh ballast met the standard gradation requirement, while the recycled ballast suffered wearing under track loadings. The outcome indicated that fresh ballast offered higher levels of aggregate interlock under low confining pressure in tracks, which resulted in increased strength at failure. On the other hand, the recycled ballast offered very poor interlocking; this was ascribed to the fact that the particle asperities were mostly worn-out. As such, a ballast that undergoes crushing under impact will likely sustain the required asperities for particle interlock, even if the ballast particles are of smaller sizes, while abraded ballast particles will not. Evaluation of ballast breakage can significantly track variations in track performance. However, the variability of samples and challenges during evaluations may hinder the practicability of this evaluation concept.

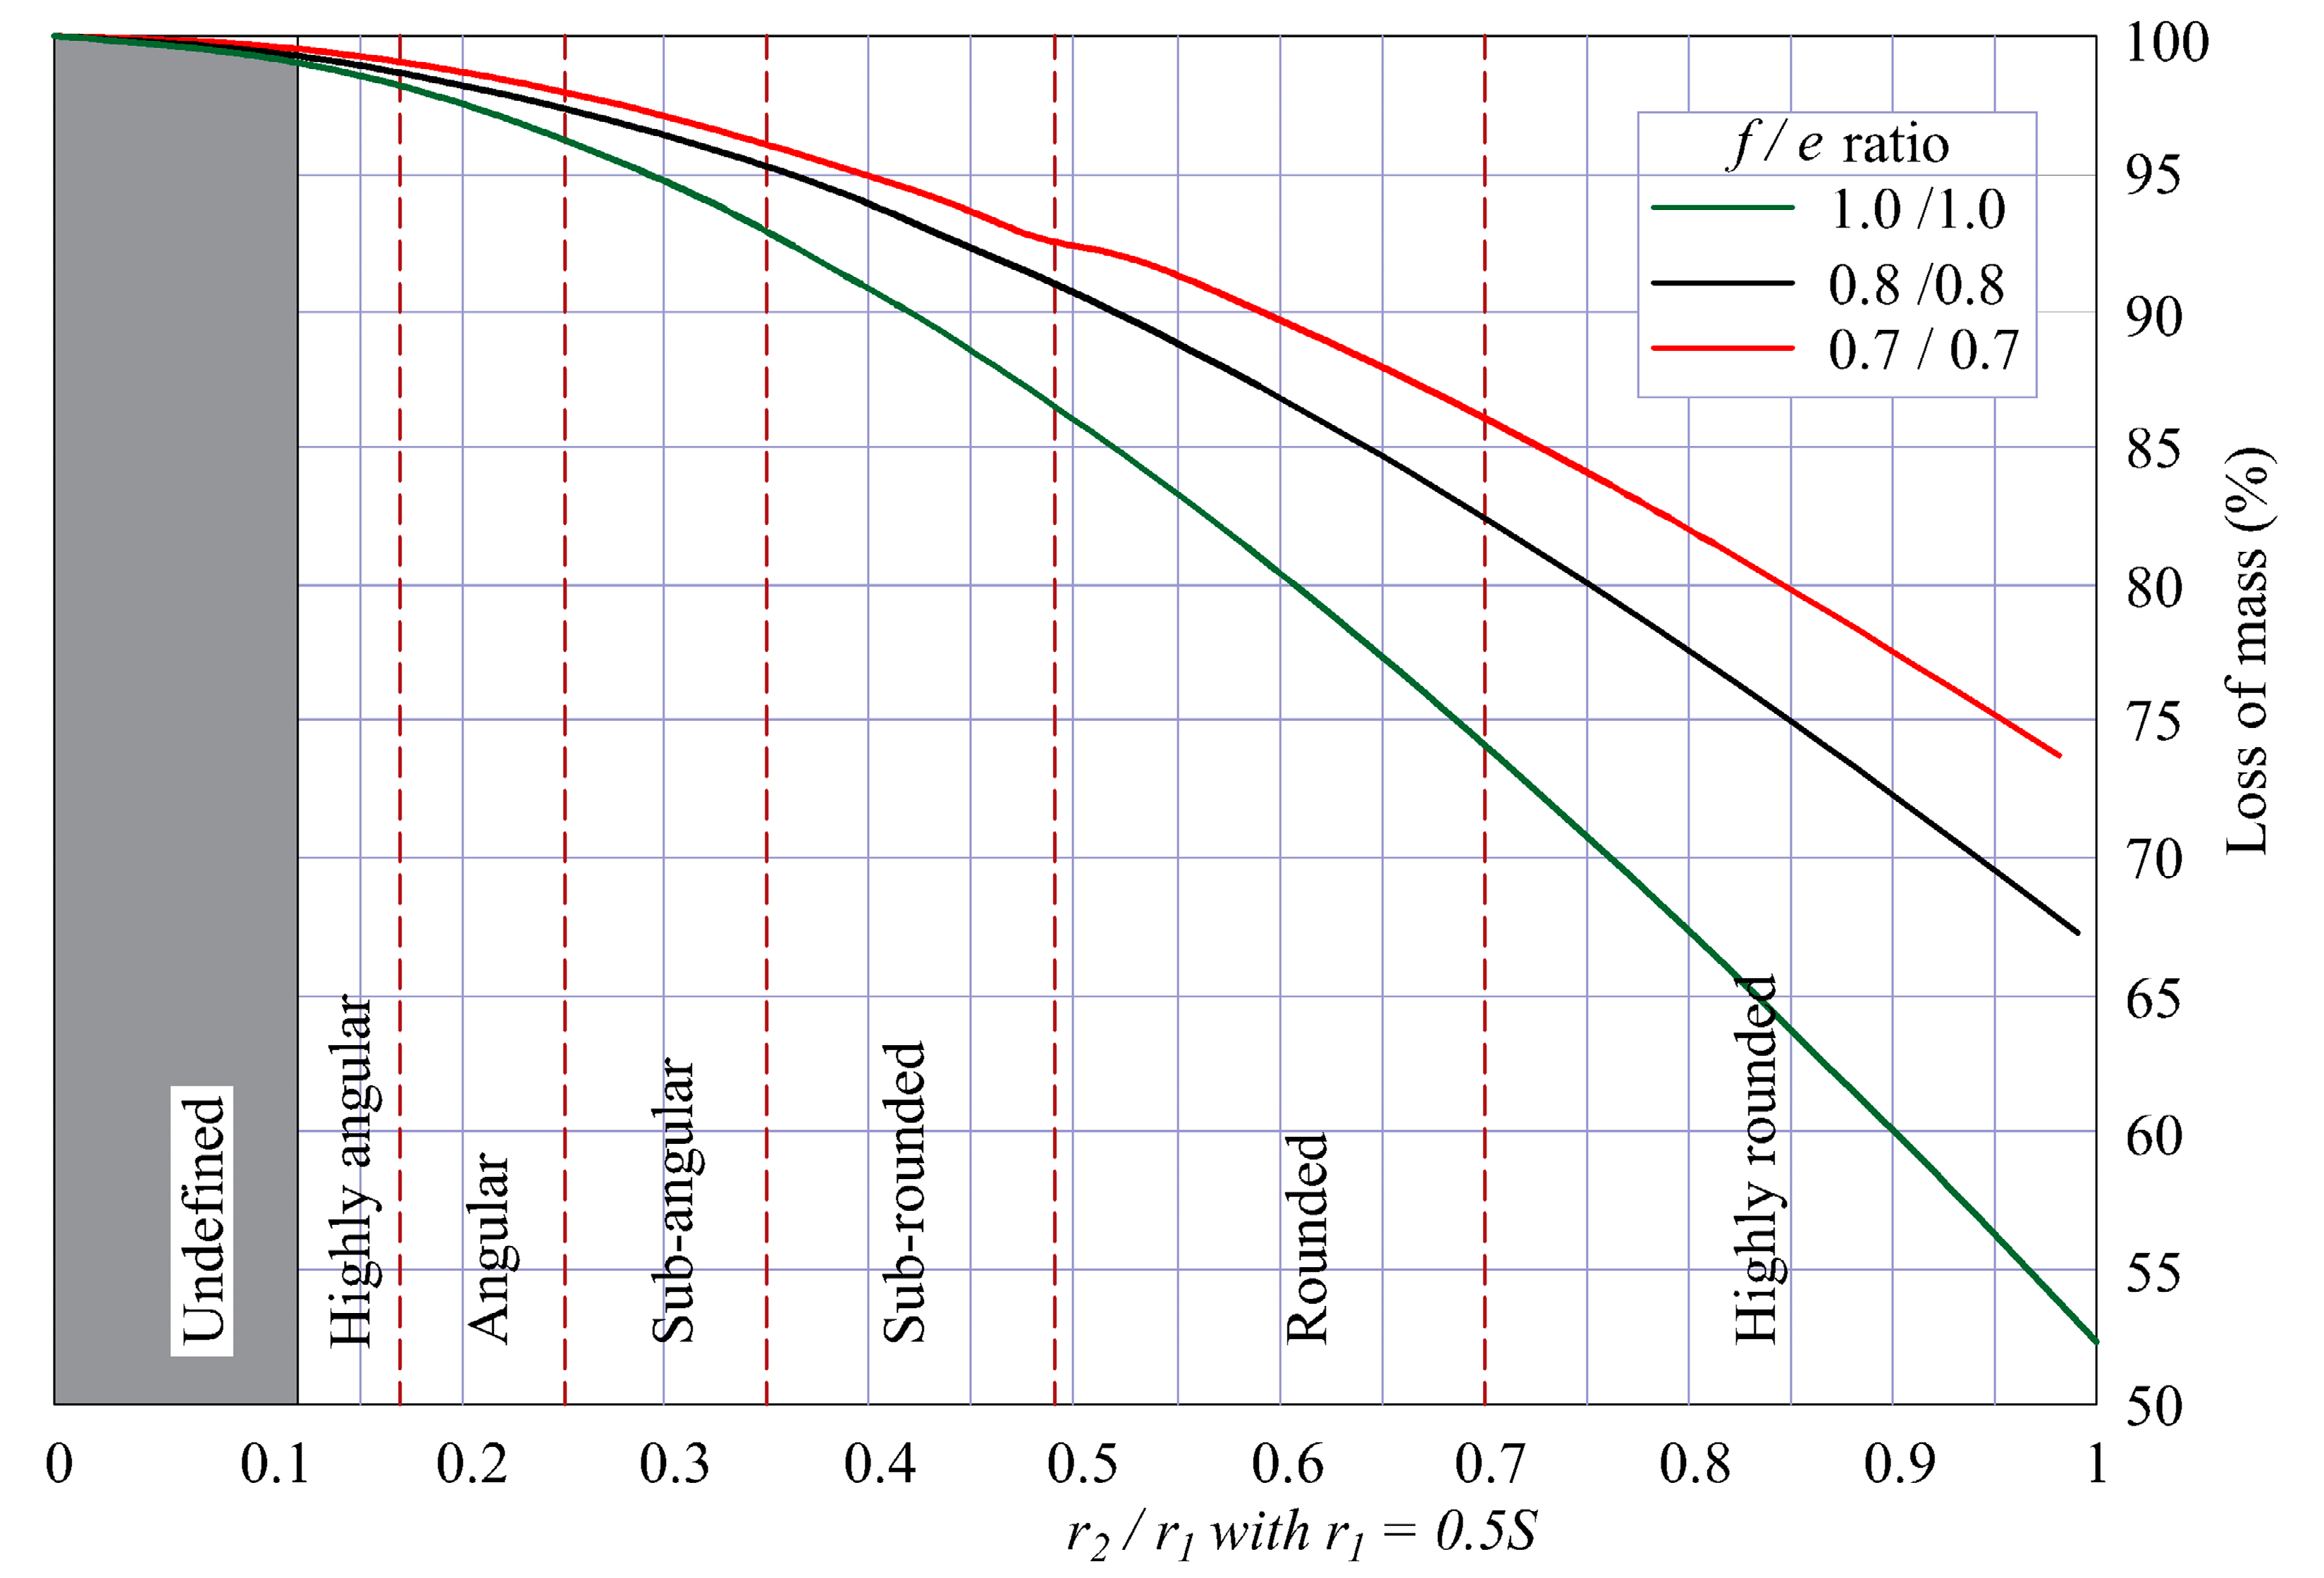
3.3. Particle Shape Properties

The shape of ballast aggregates has since been identified as one of the key parameters that influence the ballast performance. However, only a handful of studies focused on this parameter [50,51]. Suhr et al. [52] analysed two kinds of ballast materials: Kieselkalk and calcite; both materials possessed rounded surfaces, as well as sharp edges. The nonconvexity of ballast, which is a key shape requirement, can be assessed via the convexity index [52]. Generally, ballast particle shape is analysed on the basis of form, roundness/angularity, and texture [53]. The forms of ballast particles are commonly defined using one-dimensional factors which are computed from the particle’s longest (L), intermediate (I), and shortest (S) axes; extensive detail on ballast form factors can be seen in [54]. In terms of particle roundness, the convex surfaces alone are taken into consideration, whereas angularity takes into account all edges and corners of a particle. Two-dimensional data are often used in assessing the roundness and angularity of ballasts [54,55]; however, modern three-dimensional techniques have also been adopted [56,57,58]. Traditionally, ballast texture is analysed from two-dimensional grayscale images [59], yet Yang et al. [56] developed a three-dimensional mesh approach for analysis. The characterisation of aggregate shape generally remains a challenge. In most cases, it relies on available grain shape data. However, sphericity and convexity are the more broadly recognized shape properties since they are influenced by the particle’s form, angularity/roundness, and surface texture.
Ballast particle shape properties are assessed with the use of aggregate image analysers. This device captures three images of the ballast particle from three dimensions. The elongated (e = I/L) and flat (f = S/I) ratio, the angularity index, and the surface texture index are assessed [21]. The angularity index defines the extent to which the ballast particles deviate from being a proper sphere. Hypothetically, the angularity index of a sphere is zero; as such, higher angularity index values signify more angular ballast particles, and lower angularity index values imply a more rounded ballast particle [50]. Angularity index is computed by assuming the particle to be shaped as a 24-faced polygon, determining the angles at all vertices, and then calculating the angular deviations at each vertex. Afterward, the spread of angular variations is determined. The estimated angle and the mean of the probability of individual angles for all ranges are calculated to compute the angularity of each of the three captured images. Lastly, the ballast angularity index is the area-weighted mean of the three captured views [60].
The elongated and flat ratios further describe the proportion of the lengthiest dimension of a ballast particle to its shortest dimension. The three captured images are used to determine the lengthiest and shortest dimensions of each ballast particle being assessed [61]. Lastly, the surface texture index describes the surface roughness or texture of ballast particles [62]. For each captured image, the particle image is enlarged to a specified extent and then eroded to the equivalent extent [63]. The sequence produces a much smoother form of the ballast image. The variation in areas between the initial and the eroded enlarged area as a fraction of the initial area determines the surface texture of each image. The surface texture index of the ballast particle is computed as the area-weighted mean using the initial area of the three captured views [21,64].
The scaled tetrakaidekahedron Aschenbrenner’s ballast sphericity coefficient (Ψ) presented in Equation (9) was established for estimating ballast shape forms [65]. This model is said to yield higher precision than other methods such as the triaxial ellipsoid [66]. Ψ values range between 0 and 1. For values near 1.0, the ballast particle is said to be angular, whereas values near 0 are estimated as rounded.
Ψ = 12.8 3 f 2 e 1 + f ( 1 + e ) + 6 1 + f 2 ( 1 + e 2 ) .
When measuring the shape properties of voluminous samples of ballasts under high precisions, an automated method is required. A hopper device, which feeds ballast particles directly to a driven belt with an orientor aligning each particle, makes use of a twin orthogonal camera capable of obtaining dual three-dimensional measurements of the particle shapes. The software then evaluates the gradation (sieve size) of each sample set and the corresponding e and f ratios, via digitized image analyses. However, the software does not calculate particle angularity [66]. Other automated devices used in assessing ballast shape properties taking into account the gradation include the three-dimensional laser scanner with a 10 µm resolution and 20 µm accuracy [67], the shadowgraph device which extracts silhouettes of particles between a camera and a light source [68], and the Petroscope 4D which is based on machine vision [66].
Depending on ballast particle shape, the loss in specific mass of samples may differ subject to particle roundness/angularity. Adopting the Powers roundness criteria, a greater mass loss is experienced with cuboidal particles, compared to elongated or flat particles, as shown in Figure 8. However, this criterion does not indicate a linear relationship with mass loss. Since increases in measured volume loss are a factor of convex features only, the Powers approach does not evaluate concavities. As such, evaluating mass loss directly seems to be the more preferred approach [66].

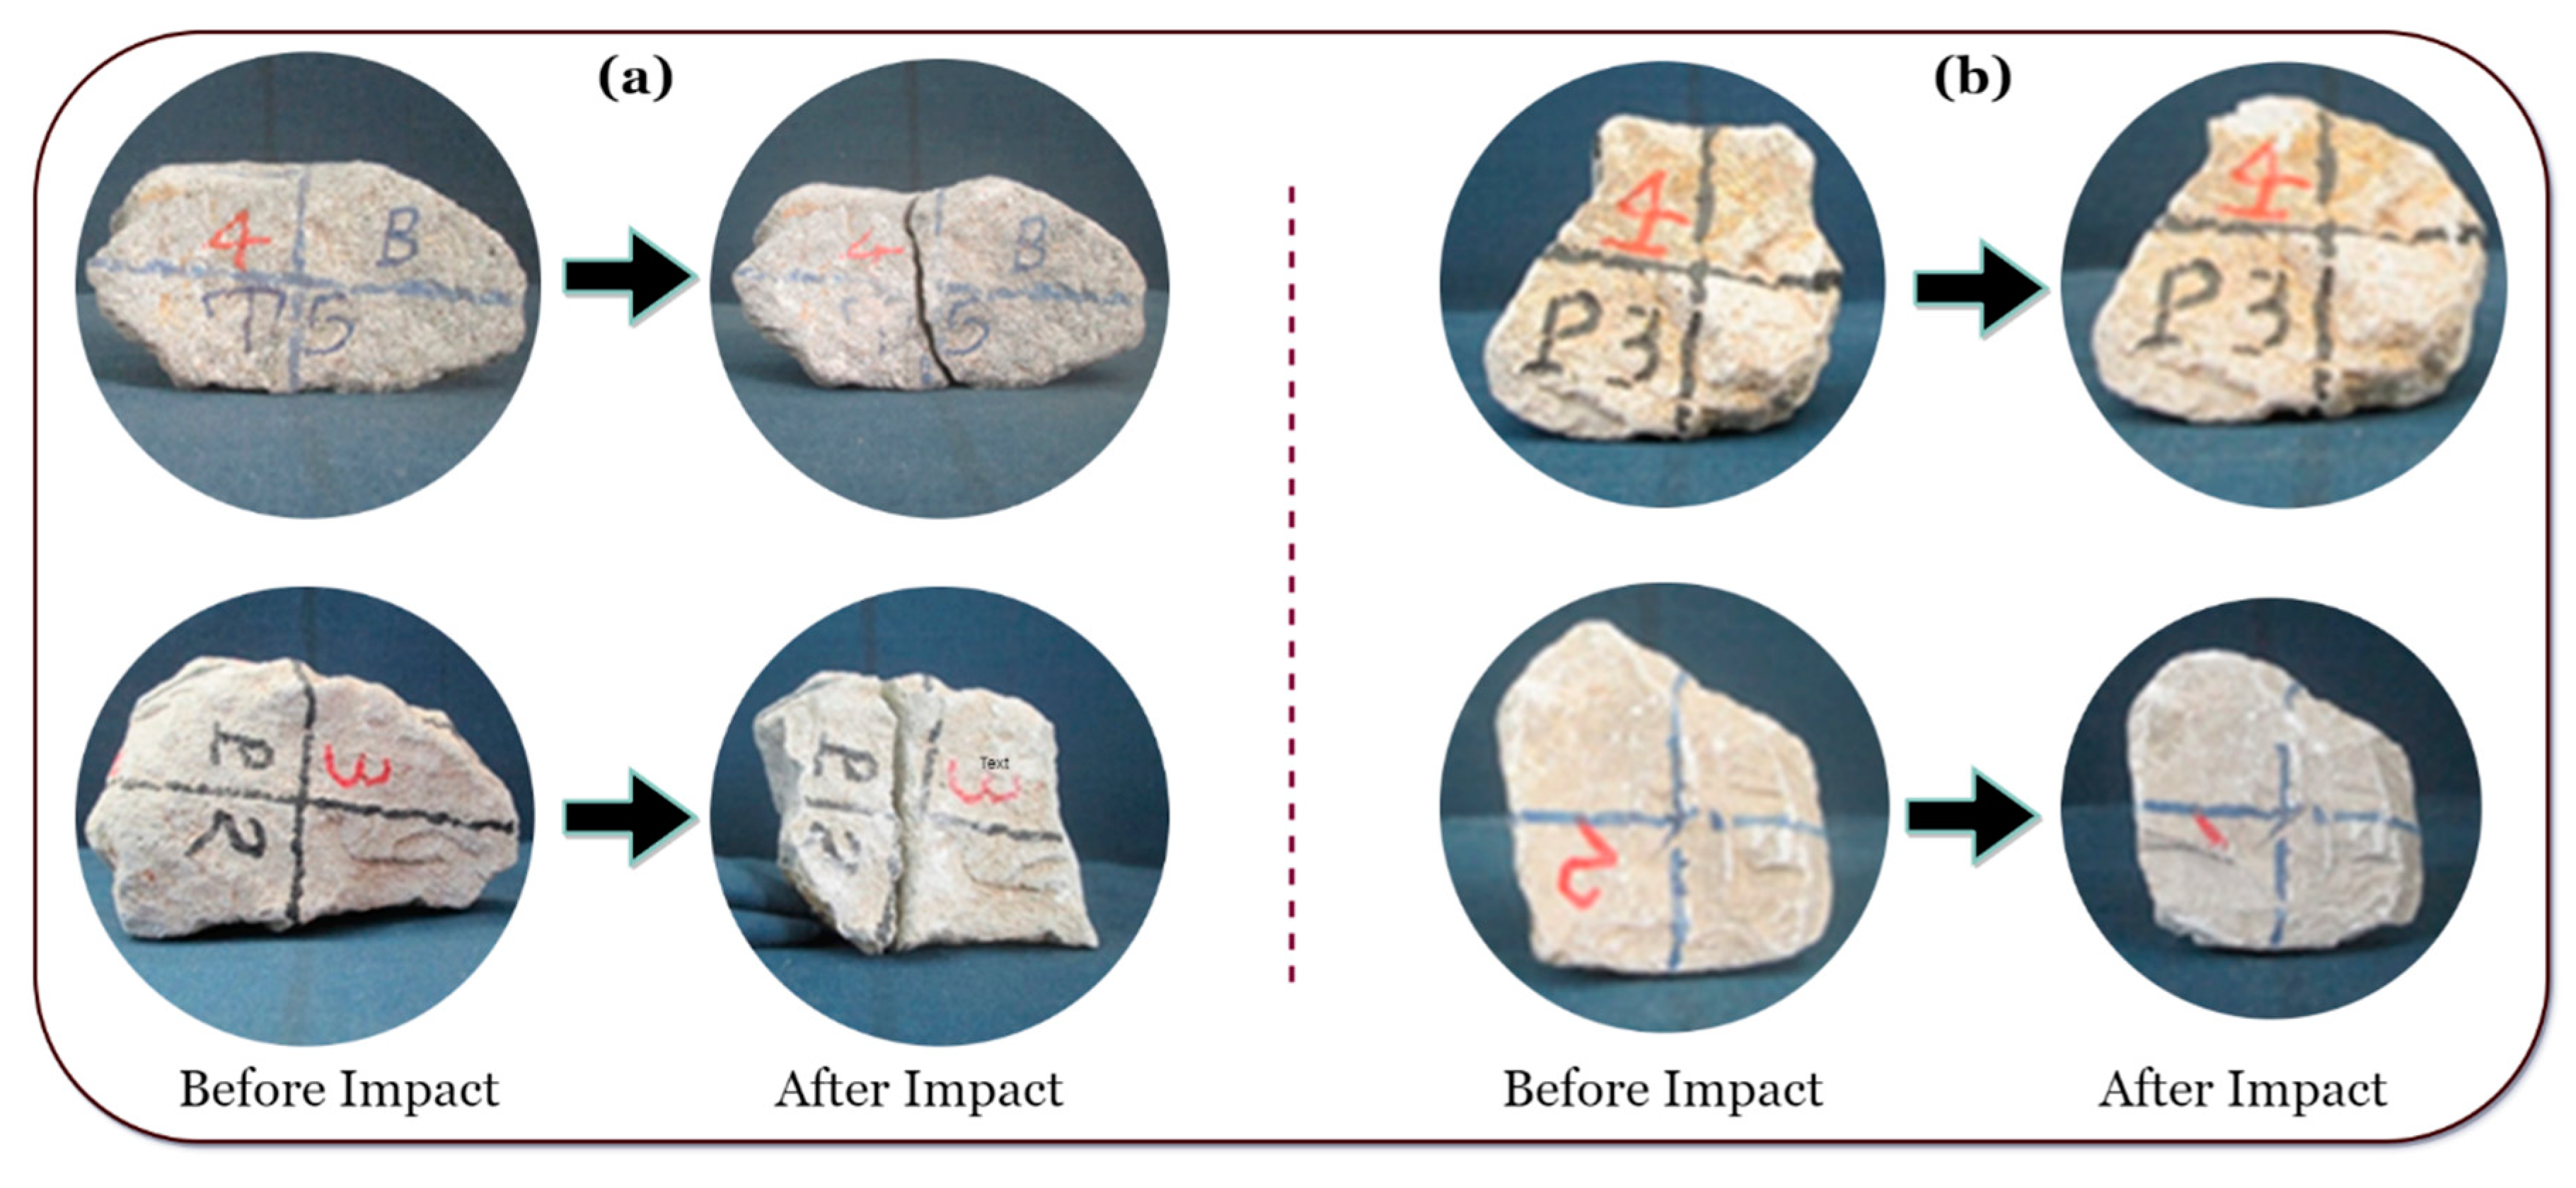
4. Ballast Degradation and Durability

Ballast durability is, in many cases, influenced by edge abrasion and fragmentation under loading cycles. Makarov, Ermakov, and Ekimov [69] reported the degradation of ballast aggregates with the use of a combined Los Angeles Abrasion (LAA) test and 3D laser method. Wnek et al. [21] assessed ballast durability and contamination by performing LAA tests at 400 and 1000 revolutions. Qian et al. [70] further appraised ballast degradation by analysing the aggregate images before and after LAA tests. Okonta [71] correlated and established relationships between the shape characteristics and abrasion index of abraded ballast aggregates via LAA experimentation. Additionally, Sun et al. [72] found different vices for assessing ballast performance under recurrent train loadings and a wide range of speeds. It was noticed that degradation increased at higher speeds [72]. Nevertheless, Indraratna et al. [73] made a comparison of the performance of dissimilar ballast aggregate gradations under a cyclic drained triaxial test. Furthermore, Koohmishi and Palassi [18] evaluated the impacts of dissimilar gradation and subgrade situations on the degradation and durability of ballasts under impact loadings.
Tracks are often subjected to impact loads as a result of the inconsistencies in component geometry resulting from sudden changes in formation rigidity at transition points between ballasted and non-ballasted track structures, as well as rail/wheel-associated anomalies or corrugation of rails [74]. These continuous loadings are consequential in the rapid deterioration of ballast particles and development of mineral contaminants. In response to this issue, Kaewunruen and Remennikov [4] studied the projection of dynamic cracks from prestressed concrete tie beams to underlying ballast layers under impact loadings. Nimbalkar et al. [75] discussed the prospects of utilising shock mats in improving ballast durability performance. This was achieved by developing and performing extensive impact tests on ballast aggregates. Likewise, Aikawa [76] identified the role of ballast particles in the reduction of the criticality of induced impact loadings via in situ experimentations of the ballast layer’s dynamic reactions under moving traffic loads. Furthermore, Nimbalkar and Indraratna [77] conducted field investigations to assess the impacts of rubber shock mats and geosynthetics on the degradation and durability of ballast aggregates. It was observed that, at transition points, the insertion of shock mats between the concrete slab and the ballast layer results in a substantial decrease in the degradation of the ballast. Figure 9 shows ballast degradation by fragmentation and attrition after impact loading.
From the preceding summary of past ballast degradation studies, it is clear that the influence of ballast characterisation, loading situation, rock geological history, and operating climatic conditions (especially in tropical regions) on the durability and degradation of ballasts subjected to impact loading is yet to be well understood. As such, there is a need for further research focused on evaluating the durability of ballast materials in the tropical climates of Africa.

Ballast Degradation Determination Indices

A few indices have been utilised in past studies to evaluate ballast degradation; the FI proposed by Selig and Waters [28] is a commonly used index and forms the basis for further evaluations. Other indices adopted include the breakage index, which is the difference in the areas between the original and final gradation curves after the test with fractal gradation curve [78] (Equation (11)), and the relative breakage index, which is the difference in areas between the original gradation and the final gradation curves [18] (Equation (12)). The fractal gradation is defined in Equation (10) and illustrated in Figure 9.
F P S D =   ( d n d m i n n d m a x n d m i n n ) × 100 ,
B b a l =   ( A A + C ) × 100 ,
B b a l r =   ( A A + C + D ) × 100 ,
where F P S D is the fractal gradation, n is the fractal dimension (usually assumed as 0.4), d m i n is the tiniest particle size, d m a x is the largest particle size, B b a l is the breakage index, B b a l r is the relative breakage index, and A ,   C ,   D are gradation areas determined from the gradation chart, as shown in Figure 10 [18,73].

5. Drainability of Ballast

One of the key functions of railway ballasts is the rapid facilitation of surface water drainage [28]. However, this function is often impaired with the presence of fouling agents within the void spaces [21]. The problem of low drainability has been prevalent in several segments of railways across the world constructed before 1990 [79,80]. The low drainability of a fouled ballast is depicted in Figure 11, showing the volume of water retained at the ballast layer and the condition of the ballast after the slow infiltration of water. As reported by Paiva et al. [31], the photo in Figure 11a was taken one day after heavy downpour, while Figure 11b was taken three days after the downpour.
Selig and Waters [28], on the basis of laboratory experiments, established the chart presented in Figure 12 to aid the determination of critical rates of rainfall that can amount to track saturation as precipitation seeps across the track to the side drains. These data illustrate the impact of contaminants on the reduced drainability of the ballast. With increased quantities of contaminants in the void spaces, the permeability is highly limited, thereby retaining water in the ballast layer, possibly resulting in track saturation. On the basis of these data, the point at which ballast drainability becomes significantly impeded by fouling agents is an FI of 30 [5,16,23,28].
Cole [81] developed a flow net of the transversal section of a railway track’s substructure and identified variation in the total head per unit length (commonly termed hydraulic gradients) in situ from 0.10 to 1.00 [81]. Parsons [82] performed a falling head permeability experiment using a 20 cm diameter vertically erect pipe at hydraulic gradients between 1.50 and 7.00 and observed that the hydraulic conductivity values of 7.5 cm maximum diameter clean limestone ballast fell between 2.50 and 5.00 cm/s [82]; these drainability results were later reported by Selig and Waters [28]. Tennakoon et al. [83] further performed a constant head permeability experiment with a vertically erect 50 cm diameter pipe on both fresh and deteriorated ballast at a hydraulic gradient of 3.0 [83,84]. They observed that the hydraulic conductivity of fresh ballast was 30 cm/s. Rahman [85] also performed a constant head permeability test, adopting a 99 cm × 66 cm × 56 cm cuboid, by sending water vertically upward through deteriorated ballast specimens at indefinite hydraulic gradients; nonetheless, from the test set-up photographs, the tests seemed to have been performed at hydraulic gradient values less than 1.0 and were uncontrollable [85]. Tests were not performed on fresh ballasts; however, at 20% by mass (finer than the 9.5 mm sieve size), a maximum hydraulic conductivity value of 2.3 cm/s was determined.
Comparable to Tennakoon et al. [83], Danquah et al. [86] performed a constant head permeability experiment by employing a vertical pipe of 50 cm diameter on fresh and deteriorated ballasts, at indefinite hydraulic gradients; the hydraulic conductivity values for fresh ballasts was reported as 31 cm/s [86]. Moreover, Paiva et al. [31] performed a constant head permeability experiment adopting a 15.2 cm diameter vertical pipe on fouled ballasts at indeterminate hydraulic gradients between 0.81 and 1.34 [31]. As a result of the fact that fresh ballasts were not assessed, the 10% fouled ballast achieved the highest hydraulic conductivity with a value of 0.025 cm/s. With the developed relationship between fouling percentage and hydraulic conductivity, the hydraulic conductivity of 0% fouled ballast was estimated at 0.032 cm/s [31]. Su et al. [34] also performed a constant head permeability experiment on granite ballasts with the use of a 68 cm × 50.5 cm cuboid at indefinite hydraulic gradients (termed low and high water head). Fresh ballast was not assessed; however, the 10% fouled ballast obtained a hydraulic conductivity value of 0.3 cm/s, the highest permeability compared to higher percentages of fouling [34,87].
The key discovery from existing literature on the drainability of ballasts is that only Parsons investigated the influence of constantly rising hydraulic gradients; this is because the experimental set-up adopted in his study could control for hydraulic gradient variation [88,89]. As such, after making a scatter plot of the velocity of discharge against the hydraulic gradient, a linear relationship was observed, similar to the findings of Darcy who studied sand permeability [89]. Figure 13 presents a scatter plot of the hydraulic gradient ( i H ) against velocity of discharge ( V q ) , derived as the total discharge divided be the area of the specimen’s cross-section ( V q = Q / A ) . Set 1 consists of experiments with varying depths of sand for each test sequence, with the pressure downstream equal to the atmospheric pressure; Set 2 was obtained from a single test where the pressure downstream was equivalent to or more than the atmospheric pressure. Hence, these values are actually single-dimensional macroscopic velocities of water along the line of the flow channel and not the real velocity of flow through the voids of the specimen [48,90]. The variations in the series trends illustrate the dissimilarities in hydraulic gradients across the experiments.
Taylor [91] further studied the hydraulic conductivity of rockfills and observed that nonlaminar flows yield polynomial relationships between the velocity of discharge and hydraulic gradient, and that laminar flows hypothetically occur up to a particle size of around 0.5 mm [91,92]. Wilkins performed constant head permeability experiments on fouled dolerite of 76 mm maximum diameter, employing a 203 mm diameter vertical pipe at hydraulic gradients ranging from 0 to 1.0 [93,94]. The study showed an exponential relationship between the velocity of discharge and hydraulic gradient with a form C i n = V , where V is the velocity of discharge, C is an empirical constant dependent on the viscosity and average hydraulic radius of particles, specified by Taylor [91], i is the hydraulic gradient, and n is the empirical exponent, characteristically obtained as 0.54 [89]. Wilkins [94] further observed that the shape and texture of particles did not significantly affect the permeability [94]. Similarly, Parkin et al. [95] performed constant head experiments and established an exponential relationship; the study further stated that, in cases of free surface flow, hydraulic gradients would most likely not exceed 1.0, and, in cases of rockfill structures, hydraulic gradients range between 0.1 and 1.0 [95].
Dudgeon [96] performed constant head permeability experiments on river gravel using a 572 mm diameter upstand pipe. From the logarithmic scatter plot of the velocity of discharge against the hydraulic gradient, it was seen that 76 mm maximum-sized river gravel endured a postlinear regime and, as such, did not indicate hydraulic conductivity [96,97]. Dudgeon [98] further assessed the influence of permeameter side-walls on the resultant discharge values. This was done by varying ratios of grain to permeameter diameter between 1:5 and 1:250; it was observed that the discharge velocity was up to 15% greater for particles with a median diameter of up to 112 mm [98].
Recent studies by Siddiqua et al. [99] and Ferdos et al. [100] performed tests on 50 mm and 100–254 mm ballast aggregates, respectively, and observed nonlinear relationships governing discharge through both ballast materials. Additionally, rocks started dislodging from the specimens at hydraulic gradient values of 1.0 [99,100]. Clearly, it can be concluded that a non-Darcy variation exists for more coarse particles, as reported in past studies on rockfills utilised in water-retaining structures. However, in railway track ballast studies, some ballasts seem to conflict this phenomenon [89]. As such, the assessment of the drainability of ballast aggregates is commonly done via the constant head permeability test. With a laminar flow assumed, Darcy’s model presented in Equation (13) is adopted in computing the drainability (hydraulic conductivity) of ballasts. The relationship between the velocity of discharge and the hydraulic gradient applied is given in Equation (14) [7,31]. Generally, the allowable range of permeability of the ballast layer is within 10−6 and 10−5 m/s [101,102]. Nonetheless, Li et al. [103] recommended 2 × 10⁻³ m/s as the hydraulic coefficient value to differentiate between a satisfactory and inappropriate permeability condition of ballast.
k = Q · L A · ( Δ H ) · t ,
V = Δ H L · k = i H · k ,
where k is the coefficient of drainability (m/s), Q is the volume of water that penetrates through the specimen during the test period (m3), L is the length of the ballast sample in the direction of flow (m), A is the permeameter’s cross-sectional area (m2), Δ H is the observed change in the head (m), t is the duration of the test (s), V is the velocity of discharge, and i H is the hydraulic gradient applied.

6. Ballast Microstructure

Most studies on coarse aggregate and rock microscopy or microstructural assessment across the globe over the years focused on practicality in concrete [104,105,106]. As such, there is insufficient existing literature describing the microstructural properties and requirements of ballasts. Microstructural analysis incorporates quantitative and qualitative evaluations often with the use of energy-dispersive X-ray (EDX) and scanning electron microscopic (SEM) analyses, respectively [107]. Chen, Qi, Wang, and Cui [108] conducted experimental assessments on the microscopy and hydraulic characteristics of coarse aggregates utilised in high-speed railway substructures at varying degrees of compaction. In this study, a mercury intrusion porosimeter and a scanning electron microscope (SEM) were adopted. The outcomes revealed the presence of two variations of typical pores: micropores with diameters less than 12.1 µm and macropores greater than or equal to 12.1 µm. The micropores were further observed to considerably influence the hydraulic properties of the aggregates [108].

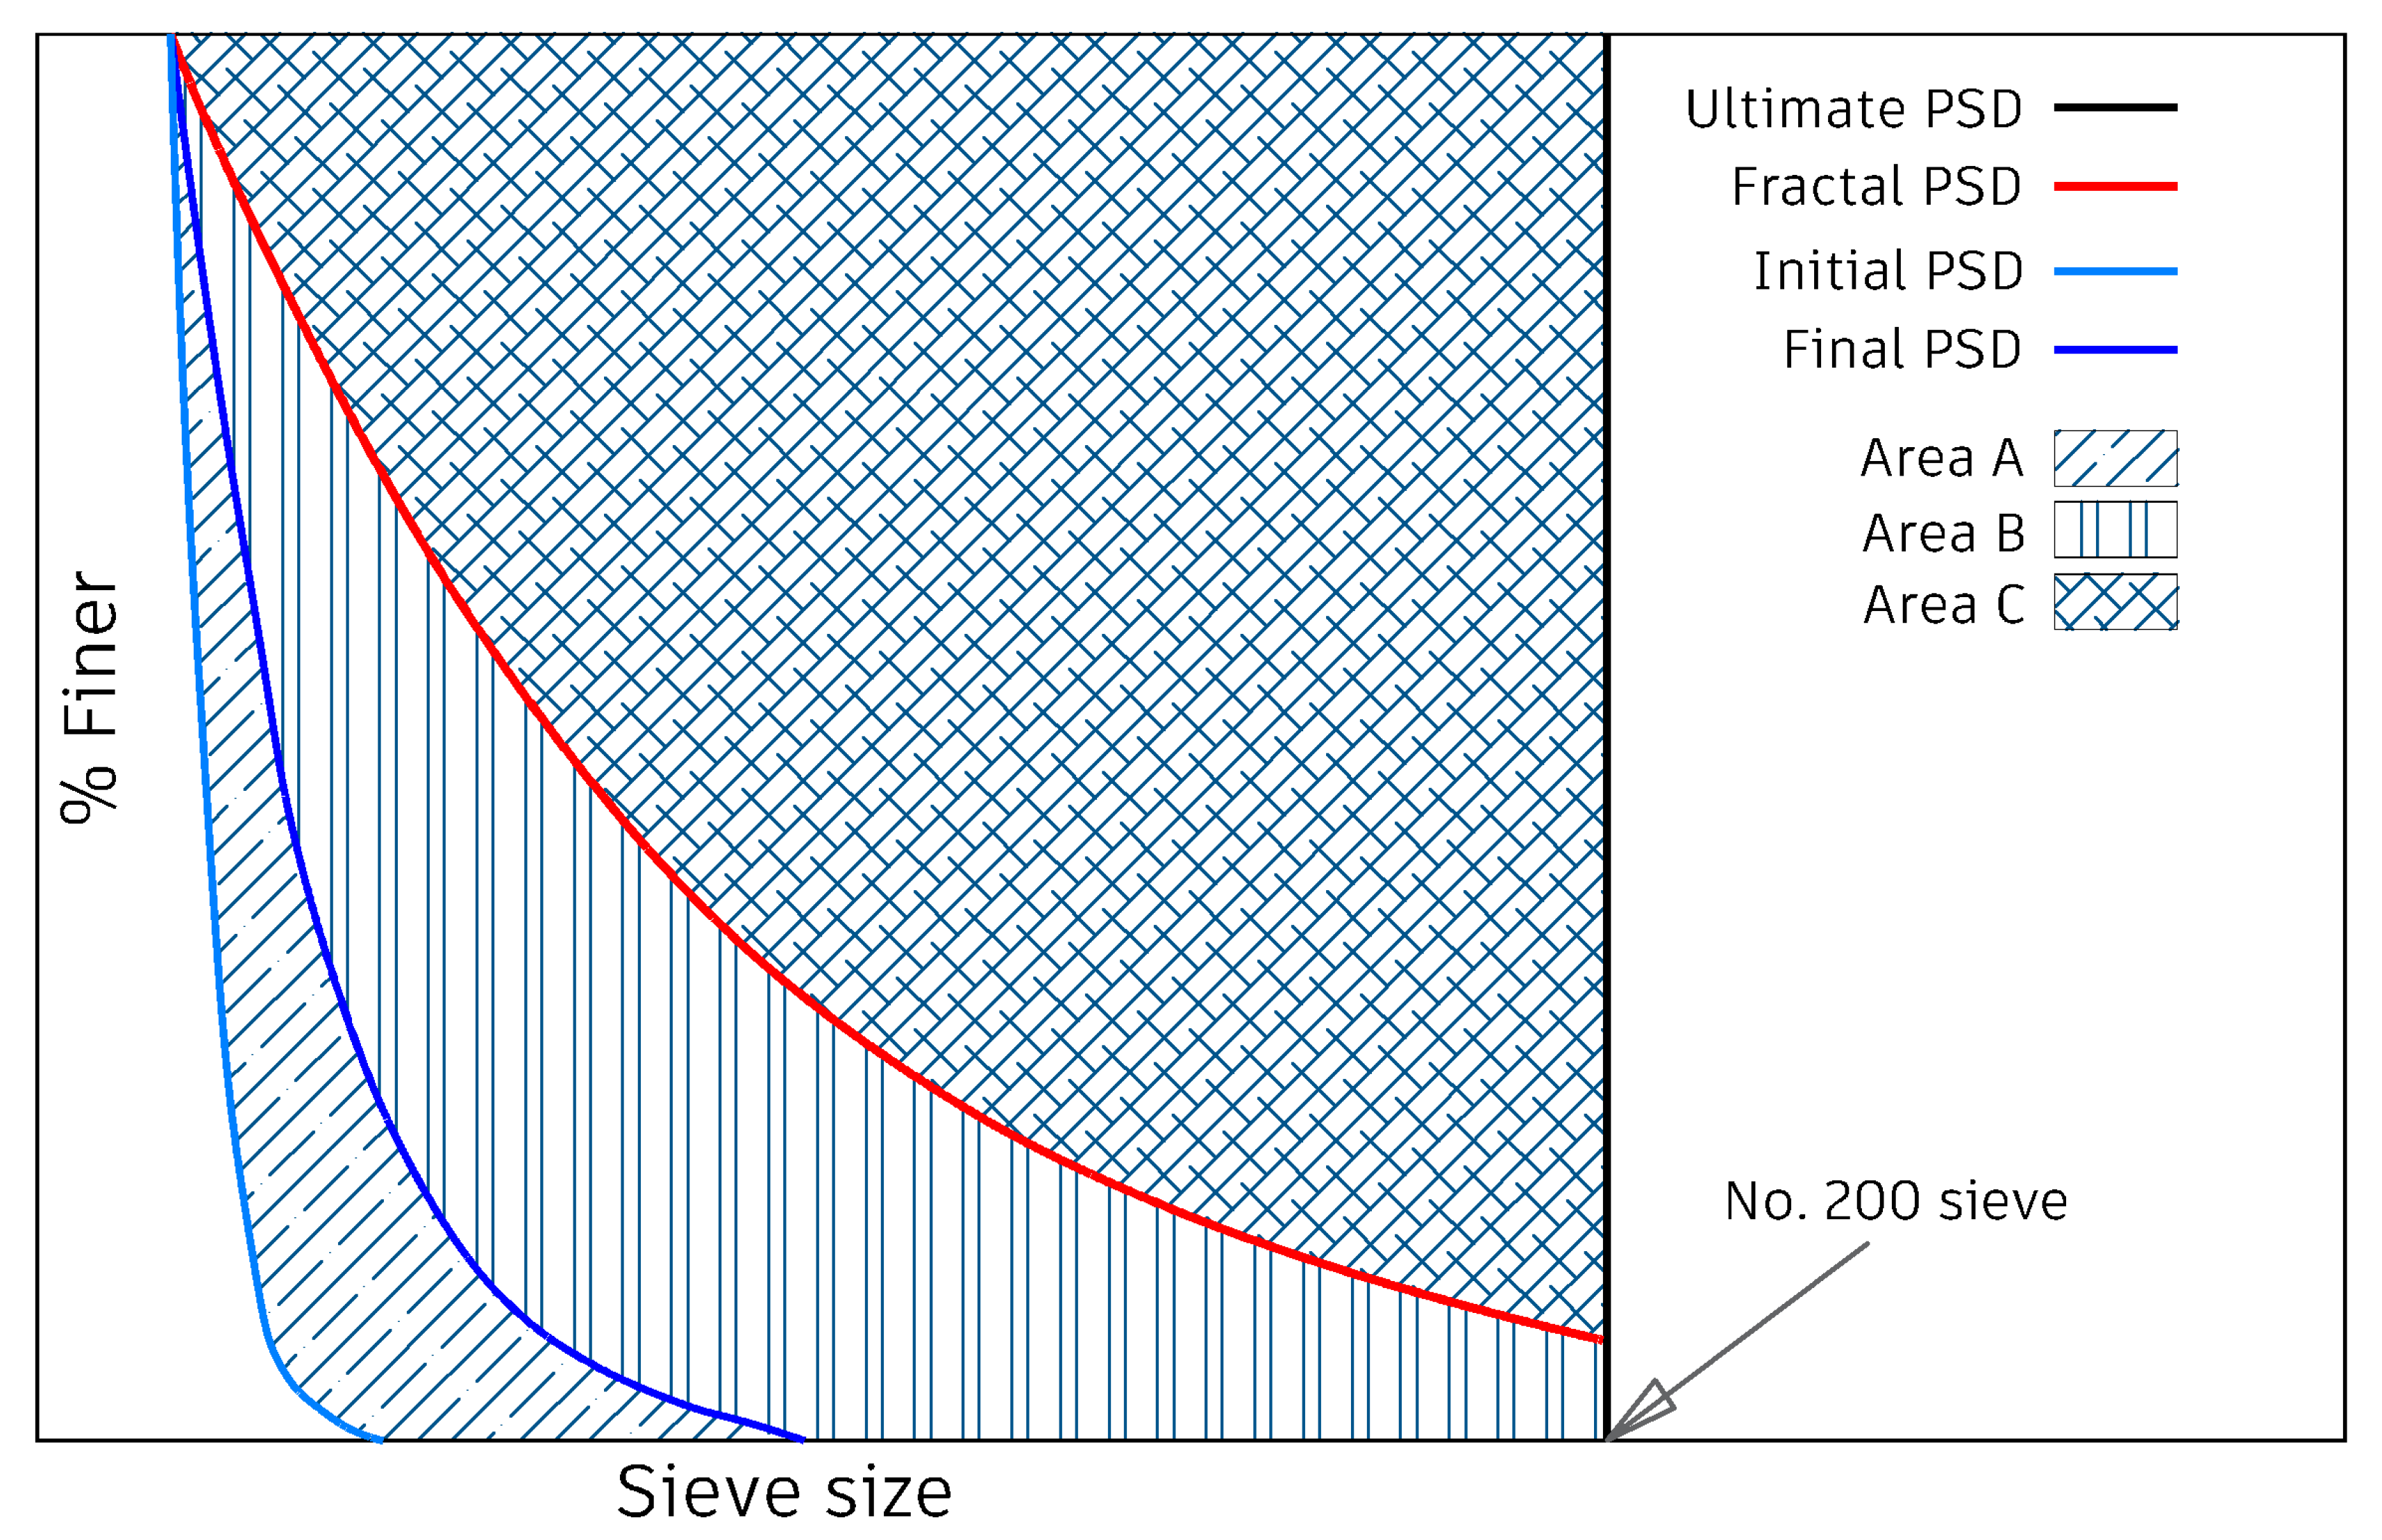
7. In Situ Sampling and Fractal Assessment of Ballast

In order to conduct railway track ballast assessment, ballast aggregates must first be collected and sampled. The conventional techniques adopted in sampling and assessing the condition of rail track ballasts include the visual inspection technique, the selective drill approach, and and the dig-at-interval method [32]. The visual inspection technique has been reported as being flawed because it does not comprehensively disclose the faults in ballast and sub-ballast layers. The drilling approach is time-intensive and also often fails to provide adequate information about the substructure of the track [32]. As considerable variations in substructure condition may exist along the span of railway tracks, even at short intervals, faster and integrated assessment techniques are required.
Two modern techniques currently attempt to meet these requirements: ground-penetrating radar (GPR) and vertical track deflectometer (VTD) [5]. The vertical deflection technique assesses track substructure conditions on the basis of track deflection, which has been studied by various transportation research institutes including the US University of Nebraska and the Transportation Technology Centre [109]. Measuring vertical deflections along tracks provides a suitable technique for identifying potential risks related to a track’s excessive deflections and inadequate substructure support. Large depths of track deflection along the span of a track signify the possibilities of fouled ballasts [109]. However, it is essential to understand that rail track vertical deflection is the top indicator of the condition of a track and, as such, should be utilised in concurrence with a specified ballast appraisal measurement [5].
Presently, the GPR is the leading technique for the assessment of ballast condition; it establishes a harmonising dataset to the measurements of track deflection, thereby providing a more robust appraisal of the condition of the track [103]. GPR inspection employs an electromagnetic technology, whereby a throb of electromagnetic energy is transduced into the rail track’s substructure and the resultant reflections are logged and interpreted with respect to track substructure layers and materials [110]. The absence of an automated interpretation of track data obtained alongside the cost of equipment set-up is a major limitation to the more extensive adoption of the method [5]. However, in assessing fairly shallow stratums such as the ballast, there are higher chances of the development of automatic inspection algorithms that aid in interpreting data, thereby making the technique cost-effective [111,112]. In these data interpretation systems, the GPR wave signals sent back from the ballast layer are traced, and the boundary between the contaminated and fresh ballast becomes a vital measurement symbolic of the performance of the track. Typically, contaminated ballast depths influence sleeper support and, as such, the performance and lateral and vertical stability of tracks deteriorate. Ideally, fresh ballast minimum thicknesses of about 254 mm beyond the bottom of the sleepers are required to provide sufficient track support [5,77].
Fractal approaches have been employed in analysing rail track geometry data in understanding track geometric conditions, planning maintenance operations, and causes of substructure-related hitches [113]. It is highly efficient in the characterization of irregularities in track geometry and in the quantification of seemingly random and chaotic patterns along tracks [114]. Fractal assessments can be conducted on vertical profile mid-chord offset data collected in situ using inertial-based high-speed rail vehicles with in-built geometry recorders [113]. With the introduction of fractal analyses, the demand for predictive track maintenance has rapidly increased as it maximises system up-time and considerably reduces maintenance costs. However, the adoption of this technique requires readily available systems for track condition monitoring with the capacity to prognose future ballast degradation processes, which is not the case in many developing countries.
The divider technique of fractal analysis has been used in several past studies to assess track geometry conditions, especially along curves and rail crossings [113,114,115,116]. This empirical method was adopted in quantifying curves with fractal dimensions higher than 1.0. As reported by Hyslip et al. [113] and presented in Equation (15), the divider method expresses the span of a rough line by
L ( ξ ) = n ξ 1 D f
where ξ is the length of unit measurement, L ( ξ ) is the rough line’s length according to unit measurements of ξ , n is the number of ξ -length steps, and D f is the rough line’s fractal dimension.
In a nutshell, the fractal analysis technique provides a more integral approach for track assessment in situ. Asadzadeh and Galeazzi [114], in a study using data from high-speed trains of about 140 km/h, obtained over 92% correlation between the model-derived degradation estimates and the actual ballast degradation values. Their study assessed and proposed the adoption of fractal techniques in establishing mappings of ballast suitability from train-induced rail accelerations using statistical prognosis and signal processing. Here, a second-order fractal value was obtained from the longitudinal track level to provide a highly precise and consistent time-bound indicator of ballast degradation, as well as the effects of tamping on the quality of ballast. Partial least squares regression was further adopted in establishing a robust model that codifies the connection between fractal values and the spectral features of vertical track acceleration [114].

8. Conclusions

This paper focused on highlighting the fundamental parameters that guided the characterisation and performance evaluation of railway ballast aggregates in the past few years. It presented a concise but comprehensive review of existing literature on the sampling, contamination, granulometry and shape properties, durability, and drainability requirements for modern railway ballasts. The study recognised the fact that ballast stability is crucial in the performance efficiency of railway tracks. The following deductions were established:
  • Ballast fouling may occur as a result of one or the combination of five different mechanisms, namely, fragmentation of ballast particles (76%), migration of underlying sub-ballast materials (13%), surface infiltration of weathered particles and coal droplets (7%), upward migration of fines from subgrade formations (3%), and sleeper wearing (1%).
  • The fouling index (FI) and ballast breakage index are the most adopted criteria for evaluating ballast contamination.
  • Ballast fragmentation is unavoidable under massive cyclic loadings. Nonetheless, when the ballast is free from contaminants and meets the drainability requirements, the ballast fragments produced can improve track stability momentarily by aiding the interlockability of adjacent fragments. However, the fragmentation will imminently fill up voids, thereby limiting drainability and ballast serviceable life.
  • When other contaminating materials accompany ballast fragmentation, it results in the regular murky contaminated ballast issue because of the presence of clay and fines that can be blown or washed into the track or that can be pumped or blended from underlayers.
  • Although fouling by clay and fines accounts for a small fraction of ballast contaminations compared to ballast fragmentation, they significantly influence ballast performance by acting as lubricating agents, thereby reducing particle interlocking.
  • The presence of coal can further aggravate the fouling problems due to its low specific gravity compared to other ballast contaminants. This could result in false estimations of the extent of ballast contamination.
  • By continuous monitoring of ballast fragmentation and contamination, a better characterisation of ballast performance can be achieved. Practically, field evaluations such as the CNs 20 mm sieve 25–35% retention-by-mass criteria provide a quick quantitative approach to assess multiple track segments.
  • The use of VTD and GPR remains the most reliable and direct approach for ballast sampling and assessment, as they provide a continuous assessment of ballast conditions along the rail track.
  • The implementation of readily available systems for nonstop prognosis of ballast quality in between campaigns on railway track geometry would permit practitioners to develop enhanced models for ballast degradation, which can, in turn, improve the capacity of track condition monitoring systems in prognosing and detecting developments of ballast degradation processes well in advance.

Author Contributions

Conceptualisation, B.N. and D.B.; methodology and software, D.B.; resources and data curation, V.A.; writing—original draft preparation, D.B.; writing—review and editing, B.N., I.A. and G.B. All authors have read and agreed to the published version of the manuscript.

Funding

This research received no external funding.

Acknowledgments

The authors most gratefully acknowledge the Management of Covenant University, prominently led by David O. Oyedepo, for the provision of the enabling environment and the sponsorship of this research.

Conflicts of Interest

The authors declare no conflict of interest.

References

  1. Indraratna, B. 1st Proctor Lecture of ISSMGE: Railroad performance with special reference to ballast and substructure characteristics. Transp. Geotech. 2016, 7, 74–114. [Google Scholar] [CrossRef]
  2. Indraratna, B.; Nimbalkar, S.; Neville, T. Performance assessment of reinforced ballasted rail track. Proc. Inst. Civ. Eng.-Ground Improv. 2014, 167, 24–34. [Google Scholar] [CrossRef] [Green Version]
  3. Gleisbau-Welt Infrastructure/Superstructure/Types of Superstructure. Available online: https://www.gleisbau-welt.de/encyclopedia/infrastructure/superstructure/types-of-superstructure/ (accessed on 21 September 2020).
  4. Kaewunruen, S.; Remennikov, A.M. Dynamic crack propagations in prestressed concrete sleepers in railway track systems subjected to severe impact loads. J. Struct. Eng. 2010, 136, 749–754. [Google Scholar] [CrossRef]
  5. Sussmann, T.R.; Ruel, M.; Chrismer, S.M. Source of Ballast Fouling and Influence Considerations for Condition Assessment Criteria. Transp. Res. Rec. J. Transp. Res. Board 2012, 87–94. [Google Scholar] [CrossRef]
  6. Agarana, M.C.; Ede, A.N. Application of differential transform method to vibration analysis of damped railway bridge on pasternak foundation under moving train. In Proceedings of the World Congress on Engineering 2016, London, UK, 29 June–1 July 2016; Volume 2, pp. 1177–1179. [Google Scholar]
  7. Koohmishi, M.; Azarhoosh, A. Assessment of Drainage and Filtration of Sub-ballast Course Considering Effect of Aggregate Gradation and Subgrade Condition. Transp. Geotech. 2020, 24, 100378. [Google Scholar] [CrossRef]
  8. Esveld, C. Modern Railway Track, 2nd ed.; Nieuwenhuizen, D.Z., Ed.; MRT-Productions: Zaltbommel, The Netherlands, 2001; ISBN 9080032433. [Google Scholar]
  9. Geological Society London Railway track ballast. Eng. Geol. Spec. Publ. 2001, 17, 285–289.
  10. Canadian National Railways Specification. CN 12-20C: Crushed Rock Ballast; CN: Montreal, QC, Canada, 2003. [Google Scholar]
  11. British Standards Institution (BSI). BS EN 13450: Aggregate for Railway Ballast; BSI: London, UK, 2003. [Google Scholar]
  12. AREMA. AREMA: Manual for Railway Engineering, Vol. 1: Track, Ch. 1: Roadway and Ballast; AREMA: Washington, DC, USA, 2010. [Google Scholar]
  13. Research Designs and Standards Organization. RDSO: Specification for Track Ballast; RDSO: Lucknow, Uttar Pradesh, India, 2016. [Google Scholar]
  14. Standards Australia. AS 2758.7: Aggregates and Rock for Engineering Purposes: Railway Ballast; Standards Australia: Sydney, Australia, 2015; Volume 7. [Google Scholar]
  15. Cement Concrete & Aggregates Australia. Aggregate for Railway Ballast: The Requirements of AS 2758.7-2009; Cement Concrete & Aggregates Australia: Mascot, NSW, Australia, 2009; pp. 1–8. [Google Scholar]
  16. Singh, R.P.; Nimbalkar, S.; Singh, S.; Choudhury, D. Field assessment of railway ballast degradation and mitigation using geotextile. Geotext. Geomembr. 2020, 48, 275–283. [Google Scholar] [CrossRef]
  17. Benedetto, A.; Tosti, F.; Bianchini Ciampoli, L.; Calvi, A.; Brancadoro, M.G.; Alani, A.M. Railway ballast condition assessment using ground-penetrating radar—An experimental, numerical simulation and modelling development. Constr. Build. Mater. 2017, 140, 508–520. [Google Scholar] [CrossRef]
  18. Koohmishi, M.; Palassi, M. Effect of particle size distribution and subgrade condition on degradation of railway ballast under impact loads. Granul. Matter 2017, 19, 63. [Google Scholar] [CrossRef]
  19. Ebrahimi, A.; Tinjum, J.M.; Edil, T.B. Deformational behavior of fouled railway ballast. Can. Geotech. J. 2015, 52, 344–355. [Google Scholar] [CrossRef]
  20. Indraratna, B.; Sun, Q.D.; Nimbalkar, S. Observed and predicted behaviour of rail ballast under monotonic loading capturing particle breakage. Can. Geotech. J. 2015, 52, 73–86. [Google Scholar] [CrossRef] [Green Version]
  21. Wnek, M.; Tutumluer, E.; Moaveni, M.; Gehringer, E. Investigation of aggregate properties influencing railroad ballast performance. Transp. Res. Rec. 2013, 2374, 180–189. [Google Scholar] [CrossRef]
  22. Sadeghi, J.; Motieyan-Najar, M.E.; Zakeri, J.A.; Yousefi, B.; Mollazadeh, M. Improvement of railway ballast maintenance approach, incorporating ballast geometry and fouling conditions. J. Appl. Geophys. 2018, 151, 263–273. [Google Scholar] [CrossRef]
  23. Rampersad, A.; George, T.B.; Mokoena, R.; Mgangira, M.B.; Gräbe, P.J. The Influence of Ballast Fouling on Track Settlememt. In Proceedings of the 2018 37th Southern African Transport Conference, Pretoria, South Africa, 9–12 July 2018. [Google Scholar]
  24. Tutumluer, E.; Ahuja, N.; Hart, J.M.; Moaveni, M.; Huang, H.; Zhao, Z.; Shah, S. Field Evaluation of Ballast Fouling Conditions Using Machine Vision; Safaty IDEA Program Project Final Report; Transportation Research Board: Washington, DC, USA, 2017. [Google Scholar]
  25. De Paiva, C.E.L.; Pereira, M.L.; Pimentel, L.L. Study of Railway Ballast Fouling by Abrasion-Originated Particles. Railw. Eng. 2017. [Google Scholar] [CrossRef]
  26. Huang, H.; Liu, S.; Qiu, T. Identification of railroad ballast fouling through particle movements. J. Geotech. Geoenvironmental Eng. 2018, 144, 6016001. [Google Scholar] [CrossRef]
  27. U.S. Department of Transportation. Ballast Fouling Measurement Tool: Phase 1; U.S. Department of Transportation: Washington, DC, USA, 2018.
  28. Selig, E.; Waters, J. Track Geotechnology and Substructure Management; Thomas Telford Services Ltd.: London, UK, 1994; ISBN 0727720139. [Google Scholar]
  29. Ebrahimi, A.; Tinjum, J.M.; Edil, T.B. Protocol for testing fouled railway ballast in large-scale cyclic triaxial equipment. Geotech. Test. J. 2012, 35. [Google Scholar] [CrossRef]
  30. Al-Qadi, I.L.; Xie, W.; Roberts, R. Scattering analysis of ground-penetrating radar data to quantify railroad ballast contamination. NDT E Int. 2008, 41, 441–447. [Google Scholar] [CrossRef]
  31. Paiva, C.; Ferreira, M.; Ferreira, A. Ballast drainage in Brazilian railway infrastructures. Constr. Build. Mater. 2015, 92, 58–63. [Google Scholar] [CrossRef]
  32. Al-qadi, I.L.; Asce, F.; Xie, W.; Roberts, R.; Leng, Z. Data Analysis Techniques for GPR Used for Assessing Railroad Ballast in High Radio-Frequency Environment. J. Transp. Eng. 2010, 136, 392–399. [Google Scholar] [CrossRef]
  33. Ebrahimi, A.; Tinjum, J.M.; Edil, T.B. Maintenance model for railway substructure. Geotech. Eng. J. SEAGS AGSSEA 2014, 45, 48–55. [Google Scholar]
  34. Su, Z.; Huang, H.; Jing, G. Experimental analysis permeability characteristics of fouling railway ballast. Metall. Min. Ind. 2015, 7, 992–997. [Google Scholar]
  35. Chappell, B.Y.B. Quantitative Analysis of Coal Fouling in the Stanwell Power Station Balloon Loop. Available online: http://ipweaq.intersearch.com.au/ipweaqjspui/bitstream/1/5448/1/Benjamin%20Chappell_IPWEA%20Conference%20Presentation.pdf (accessed on 23 August 2020).
  36. Esmaeili, M.; Aela, P.; Hosseini, A. Experimental assessment of cyclic behavior of sand-fouled ballast mixed with tire derived aggregates. Soil Dyn. Earthq. Eng. 2017, 98, 1–11. [Google Scholar] [CrossRef]
  37. Anbazhagan, P.; Bharatha, T.P.; Amarajeevi, G. Study of Ballast Fouling in Railway Track Formations. Indian Geotech. J. 2012, 42, 87–99. [Google Scholar] [CrossRef]
  38. Feldman, F.; Nissen, D. Alternative testing method for the measurement of ballast fouling: Percentage void contamination. In Proceedings of the Cost efficient railways through engineering: Conference on Railway Engineering (CORE 2002), Wollongong, NSW, Australia, 10–13 November 2002. [Google Scholar]
  39. Indraratna, B.; Ngo, N.T.; Rujikiatkamjorn, C. Behavior of geogrid-reinforced ballast under various levels of fouling. Geotext. Geomembr. 2011, 29, 313–322. [Google Scholar] [CrossRef]
  40. Mishra, D.; Qian, Y.; Huang, H.; Tutumluer, E. An integrated approach to dynamic analysis of railroad track transitions behavior. Transp. Geotech. 2014, 1, 188–200. [Google Scholar] [CrossRef]
  41. Polito, C.P.; Martin, J.R., II. Effects of Nonplastic Fines on the Liquefaction Resistance of Sands. J. Geotech. Geoenvironmental Eng. 2001, 127, 408–415. [Google Scholar] [CrossRef]
  42. Ferellec, J.F.; Perales, R.; Nhu, V.H.; Wone, M.; Saussine, G. Analysis of compaction of railway ballast by different maintenance methods using DEM. EPJ Web Conf. 2017, 140, 15032. [Google Scholar] [CrossRef] [Green Version]
  43. Pucillo, G.P.; Penta, F.; Catena, M.; Lisi, S. On the lateral stability of the sleeper-ballast system. Procedia Struct. Integr. 2018, 12, 553–560. [Google Scholar] [CrossRef]
  44. Suiker, A.S.J.; de Borst, R. A numerical model for the cyclic deterioration of railway tracks. Int. J. Numer. Methods Eng. 2003, 57, 441–470. [Google Scholar] [CrossRef]
  45. Guerrieri, M.; Parla, G.; Celauro, C. Digital image analysis technique for measuring railway track defects and ballast gradation. Meas. J. Int. Meas. Confed. 2018, 113, 137–147. [Google Scholar] [CrossRef]
  46. Indraratna, B.; Salim, W.; Rujikiatkamjorn, C. Advanced Rail Geotechnology: Ballasted Track, 1st ed.; CRC Press: Boca Raton, FL, USA; Taylor & Francis Group: Abingdon, UK, 2011; ISBN 9781138072893. [Google Scholar]
  47. Qian, Y.; Boler, H.; Moaveni, M.; Tutumluer, E.; Hashash, Y.M.A.; Ghaboussi, J. Degradation-Related Changes in Ballast Gradation and Aggregate Particle Morphology. J. Geotech. Geoenvironmental Eng. 2017, 143, 04017032. [Google Scholar] [CrossRef]
  48. Koohmishi, M. Drainage potential of degraded railway ballast considering initial gradation and intrusion of external fine materials. Soils Found. 2019, 59, 2265–2278. [Google Scholar] [CrossRef]
  49. Indraratna, B.; Salim, W. Mechanics of Ballasted Rail Tracks: A Geotechnical Perspective; Taylor & Francis: Abingdon, UK, 2005; ISBN 0415383293. [Google Scholar]
  50. Le Pen, L.M.; Powrie, W.; Zervos, A.; Ahmed, S.; Aingaran, S. Dependence of shape on particle size for a crushed rock railway ballast. Granul. Matter 2013, 15, 849–861. [Google Scholar] [CrossRef] [Green Version]
  51. Moaveni, M.; Mahmoud, E.; Ortiz, E.M.; Tutumluer, E.; Beshears, S. Use of Advanced Aggregate Imaging Systems to Evaluate Aggregate Resistance to Breakage, Abrasion, and Polishing. Transp. Res. Rec. J. Transp. Res. Board 2014, 2401, 1–10. [Google Scholar] [CrossRef]
  52. Suhr, B.; Skipper, W.A.; Lewis, R.; Six, K. Shape analysis of railway ballast stones: Curvature-based calculation of particle angularity. Sci. Rep. 2020, 10, 1–14. [Google Scholar] [CrossRef] [PubMed] [Green Version]
  53. Suhr, B.; Six, K. Simple particle shapes for DEM simulations of railway ballast: Influence of shape descriptors on packing behaviour. Granul. Matter 2020, 22, 43. [Google Scholar] [CrossRef] [PubMed] [Green Version]
  54. Blott, S.J.; Pye, K. Particle shape: A review and new methods of characterization and classification. Sedimentology 2008, 55, 31–63. [Google Scholar] [CrossRef]
  55. Xiao, J.; Zhang, D.; Wei, K.; Luo, Z. Shakedown behaviors of railway ballast under cyclic loading. Constr. Build. Mater. 2017, 155, 1206–1214. [Google Scholar] [CrossRef]
  56. Yang, X.; Chen, S.; You, Z. 3D Voxel-Based Approach to Quantify Aggregate Angularity and Surface Texture. J. Mater. Civ. Eng. 2017, 29, 04017031. [Google Scholar] [CrossRef]
  57. Zhou, B.; Wang, J.; Wang, H. Three-dimensional sphericity, roundness and fractal dimension of sand particles. Géotechnique 2018, 68, 18–30. [Google Scholar] [CrossRef]
  58. Zhao, B.; Wang, J. 3D quantitative shape analysis on form, roundness, and compactness with μCT. Powder Technol. 2016, 291, 262–275. [Google Scholar] [CrossRef] [Green Version]
  59. Al-Rousan, T.; Masad, E.; Tutumluer, E.; Pan, T. Evaluation of image analysis techniques for quantifying aggregate shape characteristics. Constr. Build. Mater. 2007, 21, 978–990. [Google Scholar] [CrossRef]
  60. Huang, H.; Tutumluer, E. Image-Aided Element Shape Generation Method in Discrete-Element Modeling for Railroad Ballast. J. Mater. Civ. Eng. 2014, 26, 527–535. [Google Scholar] [CrossRef]
  61. Lu, M.; McDowell, G.R. The importance of modelling ballast particle shape in the discrete element method. Granul. Matter 2007, 9, 69–80. [Google Scholar] [CrossRef]
  62. Pan, T.; Tutumluer, E. Quantification of Coarse Aggregate Surface Texture Using Image Analysis. J. Test. Eval. 2007, 35, 100181. [Google Scholar] [CrossRef]
  63. Sun, Y.; Indraratna, B.; Nimbalkar, S. Three-dimensional characterisation of particle size and shape for ballast. Géotech. Lett. 2014, 4, 197–202. [Google Scholar] [CrossRef] [Green Version]
  64. Miao, C.X.; Zheng, J.J.; Zhang, R.J.; Cui, L. DEM modeling of pullout behavior of geogrid reinforced ballast: The effect of particle shape. Comput. Geotech. 2017, 81, 249–261. [Google Scholar] [CrossRef]
  65. Aschenbrenner, B.C. A New Method of Expressing Particle Sphericity. SEPM J. Sediment. Res. 1956, 26, 15–31. [Google Scholar] [CrossRef]
  66. Bach, H. Evaluation of Attrition Tests for Railway Ballast; Graz University of Technology: Graz, Styria, Austria, 2013. [Google Scholar]
  67. Tolppanen, P.; Stephansson, O.; Stenlid, L. 3-D degradation analysis of railroad ballast. Bull. Eng. Geol. Environ. 2002, 61, 35–42. [Google Scholar] [CrossRef]
  68. Descantes, Y.; Fosse, Y.; Milcent, F. Automated Measurement of Railway Ballast Angularity. J. Mater. Civ. Eng. 2006, 18, 612–618. [Google Scholar] [CrossRef]
  69. Makarov, A.I.; Ermakov, V.A.; Ekimov, D.A. Application of Textural Features in the Analysis of Breakstone Grading. J. Min. Sci. 2019, 55, 40–44. [Google Scholar] [CrossRef]
  70. Qian, Y.; Boler, H.; Moaveni, M.; Tutumluer, E.; Hashash, Y.M.A.; Ghaboussi, J. Characterizing Ballast Degradation through Los Angeles Abrasion Test and Image Analysis. Transp. Res. Rec. J. Transp. Res. Board 2014, 2448, 142–151. [Google Scholar] [CrossRef] [Green Version]
  71. Okonta, F.N. Relationships between abrasion index and shape properties of progressively abraded dolerite railway ballasts. Rock Mech. Rock Eng. 2014, 47, 1335–1344. [Google Scholar] [CrossRef]
  72. Sun, Q.D.; Indraratna, B.; Nimbalkar, S. Deformation and Degradation Mechanisms of Railway Ballast under High Frequency Cyclic Loading. J. Geotech. Geoenvironmental Eng. 2016, 142, 04015056. [Google Scholar] [CrossRef]
  73. Indraratna, B.; Sun, Y.; Nimbalkar, S. Laboratory Assessment of the Role of Particle Size Distribution on the Deformation and Degradation of Ballast under Cyclic Loading. J. Geotech. Geoenvironmental Eng. 2016, 142, 04016016. [Google Scholar] [CrossRef]
  74. Sañudo, R.; Miranda, M.; Markine, V.; Delĺolio, L. The Influence of Train Running Direction and Track Supports Position on the Behaviour of Transition Zones. Transp. Res. Procedia 2016, 18, 281–288. [Google Scholar] [CrossRef]
  75. Nimbalkar, S.; Indraratna, B.; Dash, S.K.; Christie, D. Improved Performance of Railway Ballast under Impact Loads Using Shock Mats. J. Geotech. Geoenvironmental Eng. 2012, 138, 281–294. [Google Scholar] [CrossRef]
  76. Aikawa, A. Dynamic characterisation of a ballast layer subject to traffic impact loads using three-dimensional sensing stones and a special sensing sleeper. Constr. Build. Mater. 2015, 92, 23–30. [Google Scholar] [CrossRef]
  77. Nimbalkar, S.; Indraratna, B. Improved Performance of Ballasted Rail Track Using Geosynthetics and Rubber Shockmat. J. Geotech. Geoenvironmental Eng. 2016, 142, 04016031. [Google Scholar] [CrossRef] [Green Version]
  78. Einav, I. Breakage mechanics-Part I: Theory. J. Mech. Phys. Solids 2007, 55, 1274–1297. [Google Scholar] [CrossRef]
  79. Ayoola, T.A. Establishment of the Nigerian Railway Corporation. J. Retracing Afr. 2016, 3, 21–42. [Google Scholar]
  80. Oyefuga, B.; Egbetokun, A. Rebuilding Rail Infrastructure in Nigeria—Policy, Problems and Prospects. In Proceedings of the Autumn Conference and Annual Meeting of the Korean Society for Railway, Gyeongju, Gyeongsangbukdo, South Korea, 18–20 October 2007; pp. 1–13. [Google Scholar]
  81. Cole, B. Analysis of Railroad Track Substructure Drainage; University of Massachusetts: Amherst, MA, USA, 1989. [Google Scholar]
  82. Parsons, B. Hydraulic Conductivity of Railroad Ballast and Track Substructure Drainage; University of Massachusetts: Amherst, MA, USA, 1990. [Google Scholar]
  83. Tennakoon, N.; Indraratna, B.; Rujikiatkamjorn, C.; Nimbalkar, S.; Neville, T. The Role of Ballast-Fouling Characteristics on the Drainage Capacity of Rail Substructure. Geotech. Test. J. 2012, 35, 104107. [Google Scholar] [CrossRef] [Green Version]
  84. Tennakoon, N.; Indraratna, B.; Nimbalkar, S.; Sloan, S.W. Application of bounding surface plasticity concept for clay-fouled ballast under drained loading. Comput. Geotech. 2015, 70, 96–105. [Google Scholar] [CrossRef]
  85. Rahman, A.J. Permeability, Resistivity, and Strength of Fouled Railroad Ballast; University of Kansas: Lawrence, KS, USA, 2013. [Google Scholar]
  86. Danquah, W.; Ghataora, G.; Burrow, M.P. The effect of ballast fouling on the hydraulic conductivity of the rail track substructure. In Proceedings of the XV Danube-European Conference on Geotechnical Engineering (DECGE), Austrian Society for Soil Mechanics and Geotechnical Engineering, Vienna, Austria, 9–11 September 2014. [Google Scholar]
  87. Huang, H.; Moaveni, M.; Schmidt, S.; Tutumluer, E.; Hart, J.M. Evaluation of Railway Ballast Permeability Using Machine Vision–Based Degradation Analysis. Transp. Res. Rec. J. Transp. Res. Board 2018, 2672, 62–73. [Google Scholar] [CrossRef]
  88. Darcy, H. The Public Fountains of the City of Dijon. Available online: https://pdfs.semanticscholar.org/c8af/1b8b5675d4199b9294e47a7ef7a16eb2b988.pdf (accessed on 19 August 2020).
  89. Schmidt, S.; Shah, S.; Moaveni, M.; Landry, B.J.; Tutumluer, E.; Basye, C.; Li, D. Railway Ballast Permeability and Cleaning Considerations. Transp. Res. Rec. J. Transp. Res. Board 2017, 2607, 24–32. [Google Scholar] [CrossRef]
  90. Brown, G.O. Henry Darcy and the making of a law. Water Resour. Res. 2002, 38. [Google Scholar] [CrossRef] [Green Version]
  91. Taylor, D. Permeability. In Fundamentals of Soil Mechanics; John Wiley & Sons, Ltd.: New York, NY, USA, 1948; pp. 97–123. [Google Scholar]
  92. Christian, J.T.; Baecher, G.B. D. W. Taylor and the Foundations of Modern Soil Mechanics. J. Geotech. Geoenvironmental Eng. 2015, 141, 02514001. [Google Scholar] [CrossRef]
  93. Wilkins, J.K. Flow Through Rockfill. In Developments in Geotechnical Engineering; Elsevier: Amsterdam, The Netherlands, 1979; Volume 27, pp. 19–37. [Google Scholar]
  94. Wilkins, J.K. Flow of water through rock fill and its application to the design of dams. N. Z. Eng. 1955, 10, 382–387. [Google Scholar]
  95. Parkin, A.; Trollope, D.; Lawson, J. Rockfill Structures Subject to Water Flow. J. Soil Mech. Found. Div. 1966, 92, 135–151. [Google Scholar]
  96. Dudgeon, C. An Experimental Study of the Flow of Water Media, Coarse Granular. La Houille Blanche 1966, 7, 785–801. [Google Scholar] [CrossRef] [Green Version]
  97. Wang, X.W.; Yang, Z.M.; Sun, Y.P.; Liu, X.W. Experimental and theoretical investigation of nonlinear flow in low permeability reservoir. Procedia Environ. Sci. 2011, 11, 1392–1399. [Google Scholar]
  98. Dudgeon, C. Wall Effects in Permeameters. J. Hydraul. Div. 1967, 93, 137–148. [Google Scholar]
  99. Siddiqua, S.; Blatz, J.A.; Privat, N.C. Evaluating turbulent flow in large rockfill. J. Hydraul. Eng. 2011, 137, 1462–1469. [Google Scholar] [CrossRef]
  100. Ferdos, F.; Wörman, A.; Ekström, I. Hydraulic Conductivity of Coarse Rockfill used in Hydraulic Structures. Transp. Porous Media 2015, 108, 367–391. [Google Scholar] [CrossRef]
  101. Trani, L.D.O.; Indraratna, B. Assessment of subballast filtration under cyclic loading. J. Geotech. Geoenvironmental Eng. 2010, 136, 1519–1528. [Google Scholar] [CrossRef]
  102. Jing, G.; Wang, Z.; Huang, H.; Wang, Y. Permeability and Direct Shear Tests Characteristics of Railway Subballast. Open Civ. Eng. J. 2015, 9, 388–393. [Google Scholar] [CrossRef] [Green Version]
  103. Li, D.; Hyslip, J.; Sussmann, T.; Chrismer, S. Railway Geotechnics; CRC Press: Boca Raton, FL, USA; Taylor & Francis Group: Abingdon, UK, 2015. [Google Scholar]
  104. Lojda, V.; Zikmund, T.; Sojka, K.; Kaiser, J.; Prošek, Z.; Lidmila, M. Microstructural analysis of fly ash-based stabilizer for track bed. Key Eng. Mater. 2017, 731, 66–73. [Google Scholar] [CrossRef]
  105. Busari, A.; Dahunsi, B.; Akinmusuru, J. Sustainable concrete for rigid pavement construction using de-hydroxylated Kaolinitic clay: Mechanical and microstructural properties. Constr. Build. Mater. 2019, 211, 408–415. [Google Scholar] [CrossRef]
  106. Awoyera, P.; Akinmusuru, J.; Ede, A.; Jolayemi, J. Novel concrete mixture using silica rich aggregates: Workability, strength and microstructural properties. In Proceedings of the International Structural Engineering and Construction, Chicago, IL, USA, 20–25 May 2019; ISEC Press: Fargo, ND, USA, 2019; Volume 6. [Google Scholar]
  107. Goldstein, J.I.; Newbury, D.E.; Michael, J.R.; Ritchie, N.W.M.; Scott, J.H.J.; Joy, D.C. Scanning Electron Microscopy and X-ray Microanalysis, 4th ed.; Springer: Berlin/Heidelberg, Germany, 2018; ISBN 9781493966745. [Google Scholar]
  108. Chen, R.P.; Qi, S.; Wang, H.L.; Cui, Y.J. Microstructure and Hydraulic Properties of Coarse-Grained Subgrade Soil Used in High-Speed Railway at Various Compaction Degrees. J. Mater. Civ. Eng. 2019, 31, 04019301. [Google Scholar] [CrossRef]
  109. Li, D.; Thompson, R.; Marquez, P.; Kalay, S. Development and implementation of a continuous vertical track-support testing technique. Transp. Res. Rec. 2004, 1863, 68–73. [Google Scholar] [CrossRef]
  110. Fontul, S.; Paixão, A.; Solla, M.; Pajewski, L. Railway Track Condition Assessment at Network Level by Frequency Domain Analysis of GPR Data. Remote Sens. 2018, 10, 559. [Google Scholar] [CrossRef] [Green Version]
  111. Fontul, S.; Fortunato, E.; De Chiara, F.; Burrinha, R.; Baldeiras, M. Railways Track Characterization Using Ground Penetrating Radar. Procedia Eng. 2016, 143, 1193–1200. [Google Scholar] [CrossRef] [Green Version]
  112. Shangguan, P.; Al-Qadi, I.L.; Leng, Z. Ground-Penetrating Radar Data to Develop Wavelet Technique for Quantifying Railroad Ballast–Fouling Conditions. Transp. Res. Rec. J. Transp. Res. Board 2012, 2289, 95–102. [Google Scholar] [CrossRef]
  113. Hyslip, J.P.; Trosino, M.J.; Selig, E.T. Fractal Analysis of Track Geometry Data. Transp. Res. Rec. J. Transp. Res. Board 2002, 1785, 50–57. [Google Scholar] [CrossRef] [Green Version]
  114. Asadzadeh, S.M.; Galeazzi, R. The predictive power of track dynamic response for monitoring ballast degradation in turnouts. J. Rail Rapid Transit 2020, 234, 976–991. [Google Scholar] [CrossRef]
  115. Landgraf, M.; Hansmann, F. Smart track geometry analyses as key to sustainability. In Proceedings of the International Heavy Haul Conference, Cape Town, South Africa, 2–6 September 2017. [Google Scholar]
  116. Mandelbrot, B.B.; Pignoni, R. The Fractal Geometry of Nature; W.H Freeman: New York, NY, USA, 1983; Volume 173. [Google Scholar]
Figure 1. Ballast fouling mechanisms.
Infrastructures 05 00094 g001
Figure 2. European Rail Research Institute (ERRI) ballast specification [8].
Infrastructures 05 00094 g002
Figure 3. Ballast fouling stages: (a) clean ballast contact point; (b) minor fouling, contact point unaffected; (c) contact point contaminated, causing instability [19].
Infrastructures 05 00094 g003
Figure 4. Compaction stages and possible breakdown: (a) initial placement; (b) initial compaction; (c) well-consolidated ballast; (d) breakdown with subsequent compaction [5].
Infrastructures 05 00094 g004
Figure 5. Time- and load-bound variation in ballast aggregate–aggregate contact area.
Infrastructures 05 00094 g005
Figure 6. Ballast gradation chart [5].
Infrastructures 05 00094 g006
Figure 7. Ballast particle size gradation results with varied levels of clay fouling [31].
Infrastructures 05 00094 g007
Figure 8. Relationship between mass loss and r2/r1 of brick-shaped particles due to roundness for three ballast shape categories [66].
Infrastructures 05 00094 g008
Figure 9. Comparison of ballast degradation patterns: (a) fragmentation; (b) abrasion [18].
Infrastructures 05 00094 g009
Figure 10. Criteria for calculation of B b a l and B b a l r [18].
Infrastructures 05 00094 g010
Figure 11. Low drainability of ballast after rainfall: condition after (a) one day and (b) three days [31].
Infrastructures 05 00094 g011
Figure 12. Surface water drainage rate and FI relationship (Mod. = moderately) [28].
Infrastructures 05 00094 g012
Figure 13. Darcy’s novel finding of a linear relationship between the velocity of flow and hydraulic gradient [89,90].
Infrastructures 05 00094 g013
Table 1. Description of commonly utilised ballast bed materials [8,9].
MaterialGeologyGradationRemarks
Crushed stoneSedimentary rocks: basalt, porphyry, gneiss, granite, sandstone, limestone, etc.30–60 mm for main lines, 20–40 mm for switch and crossingsHighly favourable in terms of strength and toughness; however, can be susceptible to weathering and fouling. Basalt offers higher resistance to fragmentation compared to limestone
GravelCollected from rivers20–50 mm Usually hard, but possesses rounded particles offering less internal friction
Crushed gravelObtained by crushing larger masses of gravel20–40 mmOffers greater shearing resistance compared to normal gravel
MoorumDecomposed lateritic rocksRequires the presence of laterite stones; can be used as underlying layers for ballast
Table 2. Extent of ballast fouling as a function of computed FI values [5,31].
% Finer Than 0.075 mmFouling Index (FI)Adjudged Fouling Extent
<1Clean
1–9.99Reasonably clean
25–3510–19.99Moderately contaminated
40–5020–39.99Contaminated
>50>40Highly contaminated
Publisher’s Note: MDPI stays neutral with regard to jurisdictional claims in published maps and institutional affiliations.

