1. Introduction
Unmanned Aerial Systems (UASs) have rapidly entered the practice of Architecture, Engineering, Construction, and Operations (AECO) in recent years, and forecasts indicate that their use in these areas will continue to increase in the foreseeable future [
1,
2]. Especially for infrastructure objects, their large number opens up a wide range of potential applications [
3].
Currently, however, the main direction of development in the AECO industry is moving towards Building Information Model (BIM) technology and data management, as BIM enables efficient data management and data analysis compared to more traditional methods [
4,
5]. However, BIM has even greater potential and can be further enriched with advanced tools that could integrate all the components already present in the construction sector and, thus, further improve the productivity and quality of construction projects [
6,
7].
A significant window of opportunity for such improvement lies in the area of project management [
8,
9]. Currently, BIM is mainly used within project management to manage resources, while other essential aspects such as monitoring progress and quality during the execution phase using real-time data are given less priority. The same is true for UASs, which play a significant role in safety-related applications for infrastructures, but less in the area of project management [
10].
However, since the primary goal of a construction project manager should always be to complete the project on time, to specification, and within budget, on-site data management and analysis is very important.
The main objective of this paper is to show how UASs enable tracking the progress and quality of a construction project against a baseline by collecting, analyzing, and evaluating real-time data during the execution phase of a commercial building. The case study building is currently under construction in Zurich, Switzerland, and was provided by research partner Implenia Schweiz AG.
In addition, the case study also compares costs with traditional project management methods, while trying to identify limitations, benefits, risks, and a practical application framework that can be implemented in the construction industry within the existing platforms.
The rest of this paper is structured as follows: First, a literature review summarizes the current state of research and positions this work within it, including information on the legal situation of UAS operation and case studies in the construction industry on this topic. The case study itself is illuminated from two sides: First, the general method of the case study is presented, which is divided into three phases: data collection, data processing, and data analysis. Then, the section on the case study presents the specifics and the setup of the hardware and software, the results obtained, as well as an assessment of the time and cost reduction. Finally, conclusions and further recommendations are presented.
3. Method
In this section, the methods that enable construction managers to improve upon their current situation using UAS-based automated progress and quality tracking are presented. The goal of this section is to describe the methods used through process charts.
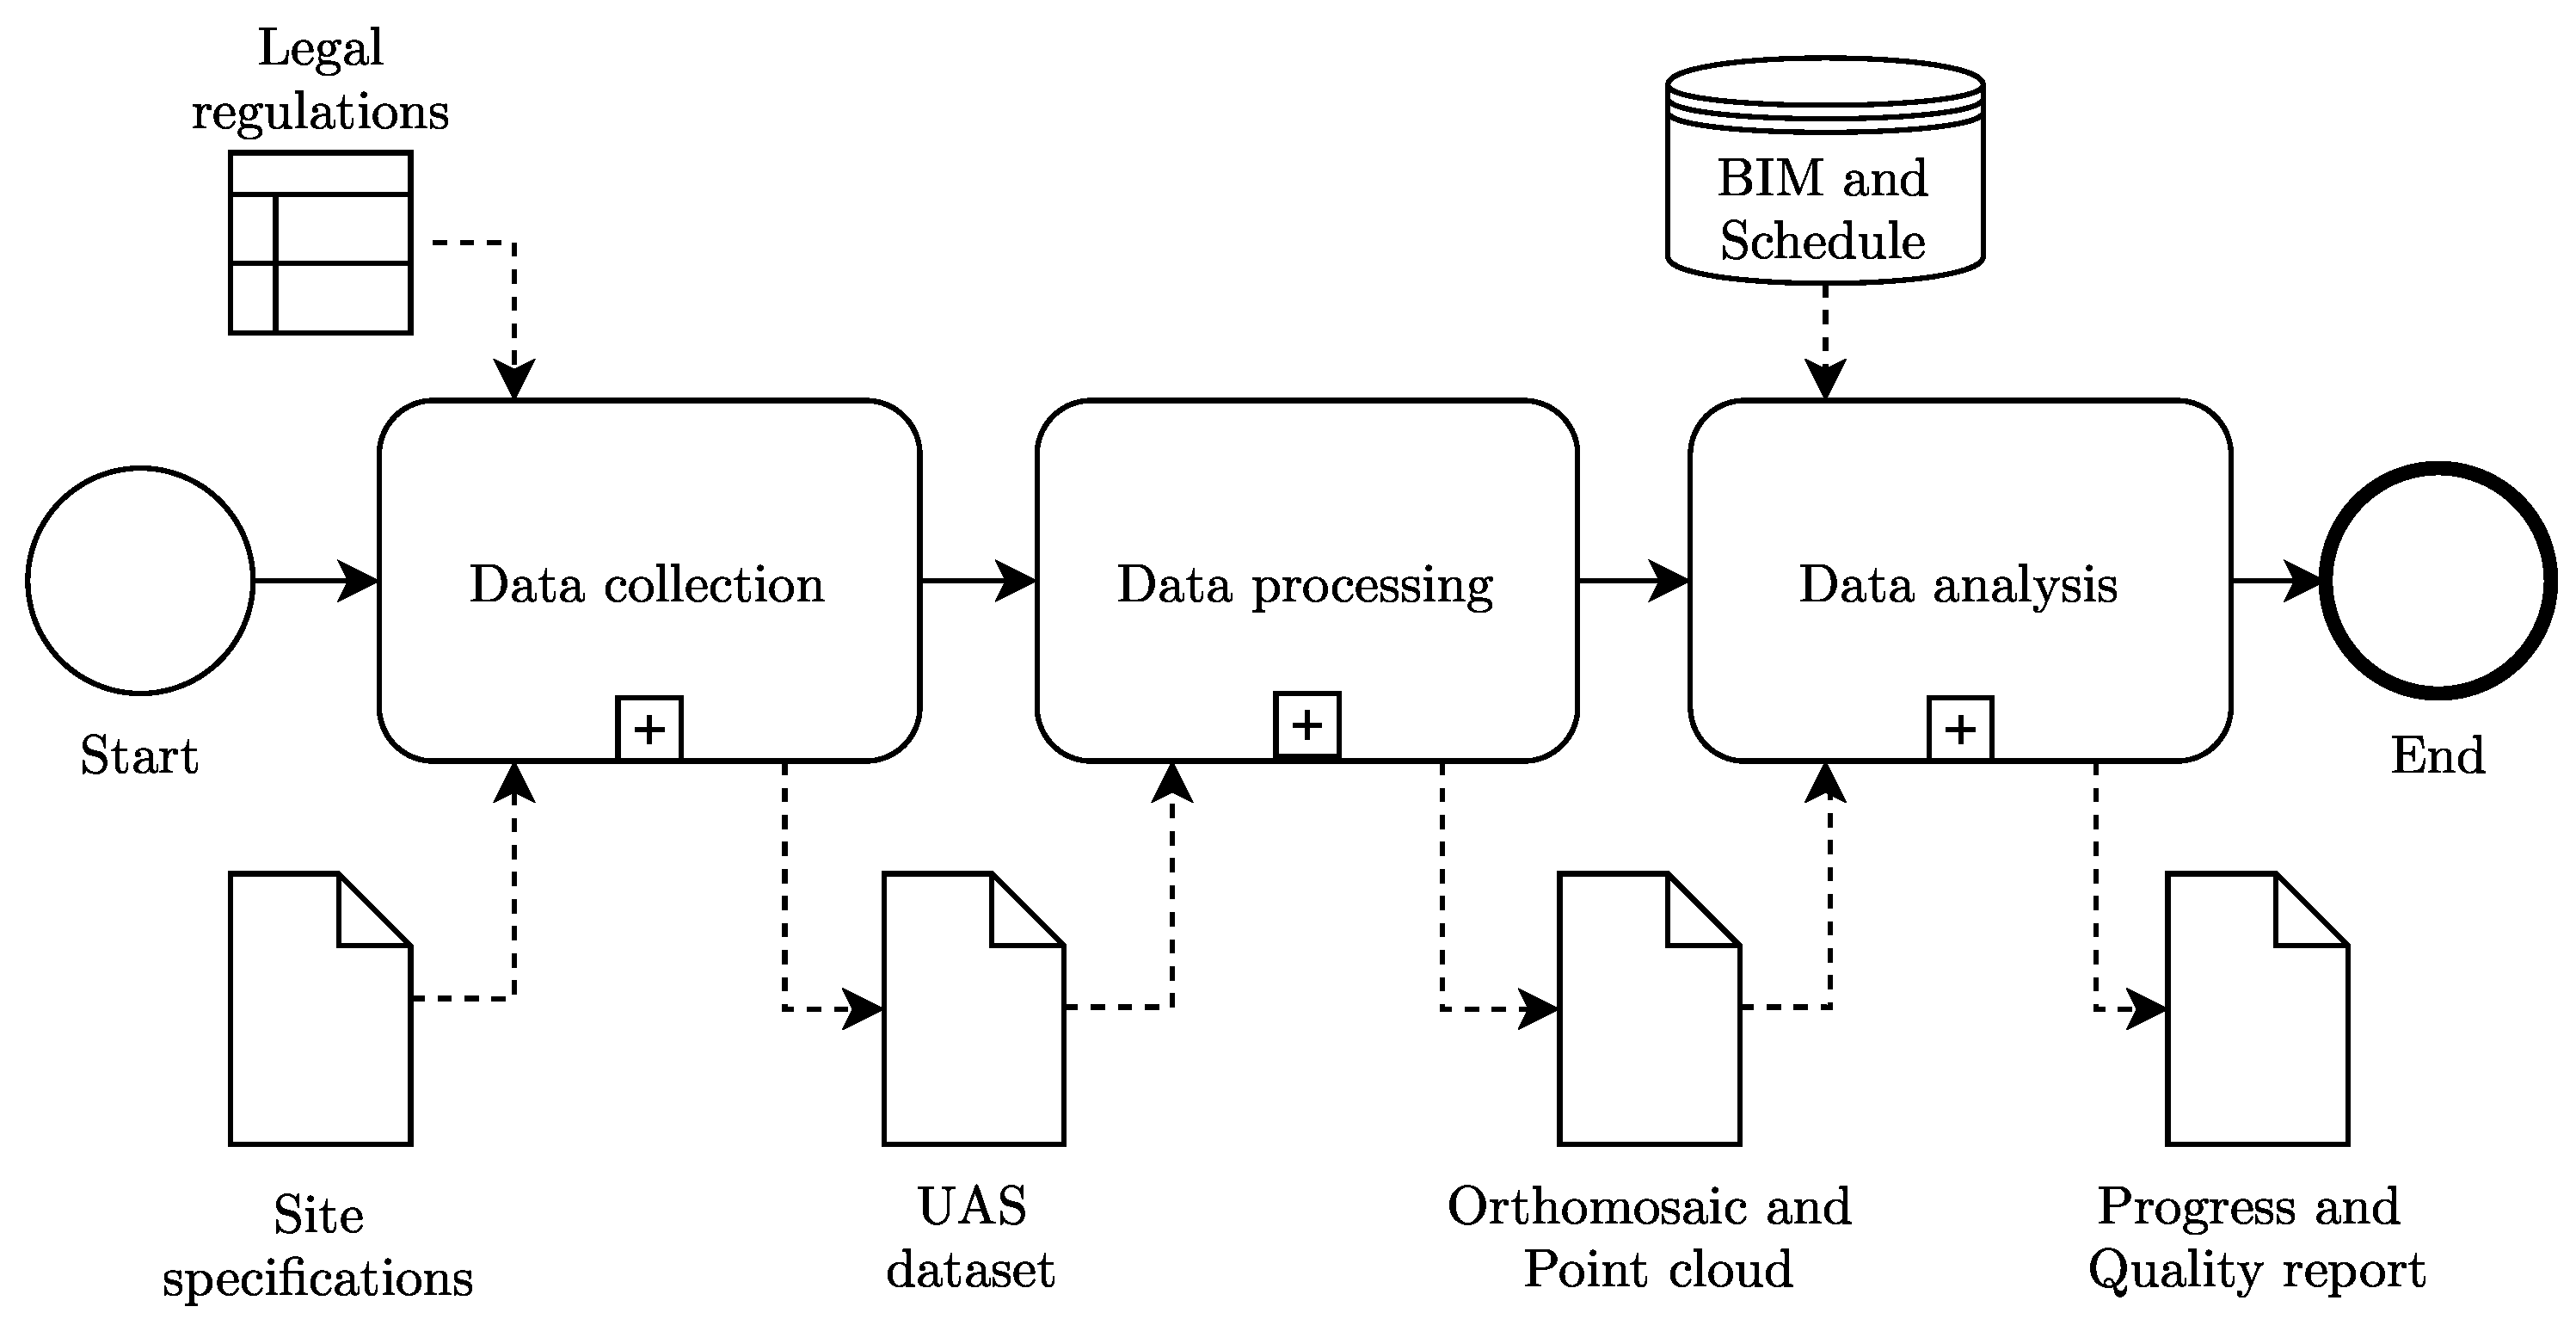
Figure 1 shows the general process of the method. The process is drawn using BPMN 2.0, a standardized graphical language for processes [
21].
Figure 1 also shows the corresponding inputs and outputs for each subprocess. The data collection subprocess uses the site specifications and the legal regulations as the input, as both set boundaries for the UAS flight, which is the core part of the data collection. The result of the data collection is the UAS dataset, which is handed over to the data processing subprocess, where an orthomosaic and a point cloud are generated, which are needed as an input for the final subprocess, the data analysis. With additional input from the BIM and the schedule, a progress and quality report can be created.
The remainder of this section is divided into three parts, corresponding to the three subprocesses of the method as shown in
Figure 1: (1) the data collection, (2) the data processing, and (3) the data analysis.
3.1. Data collection
The subprocess of data collection defines how the data collection procedure is executed and serves as a bridge between the need for data, the legal regulations, and the specifics of the construction site.
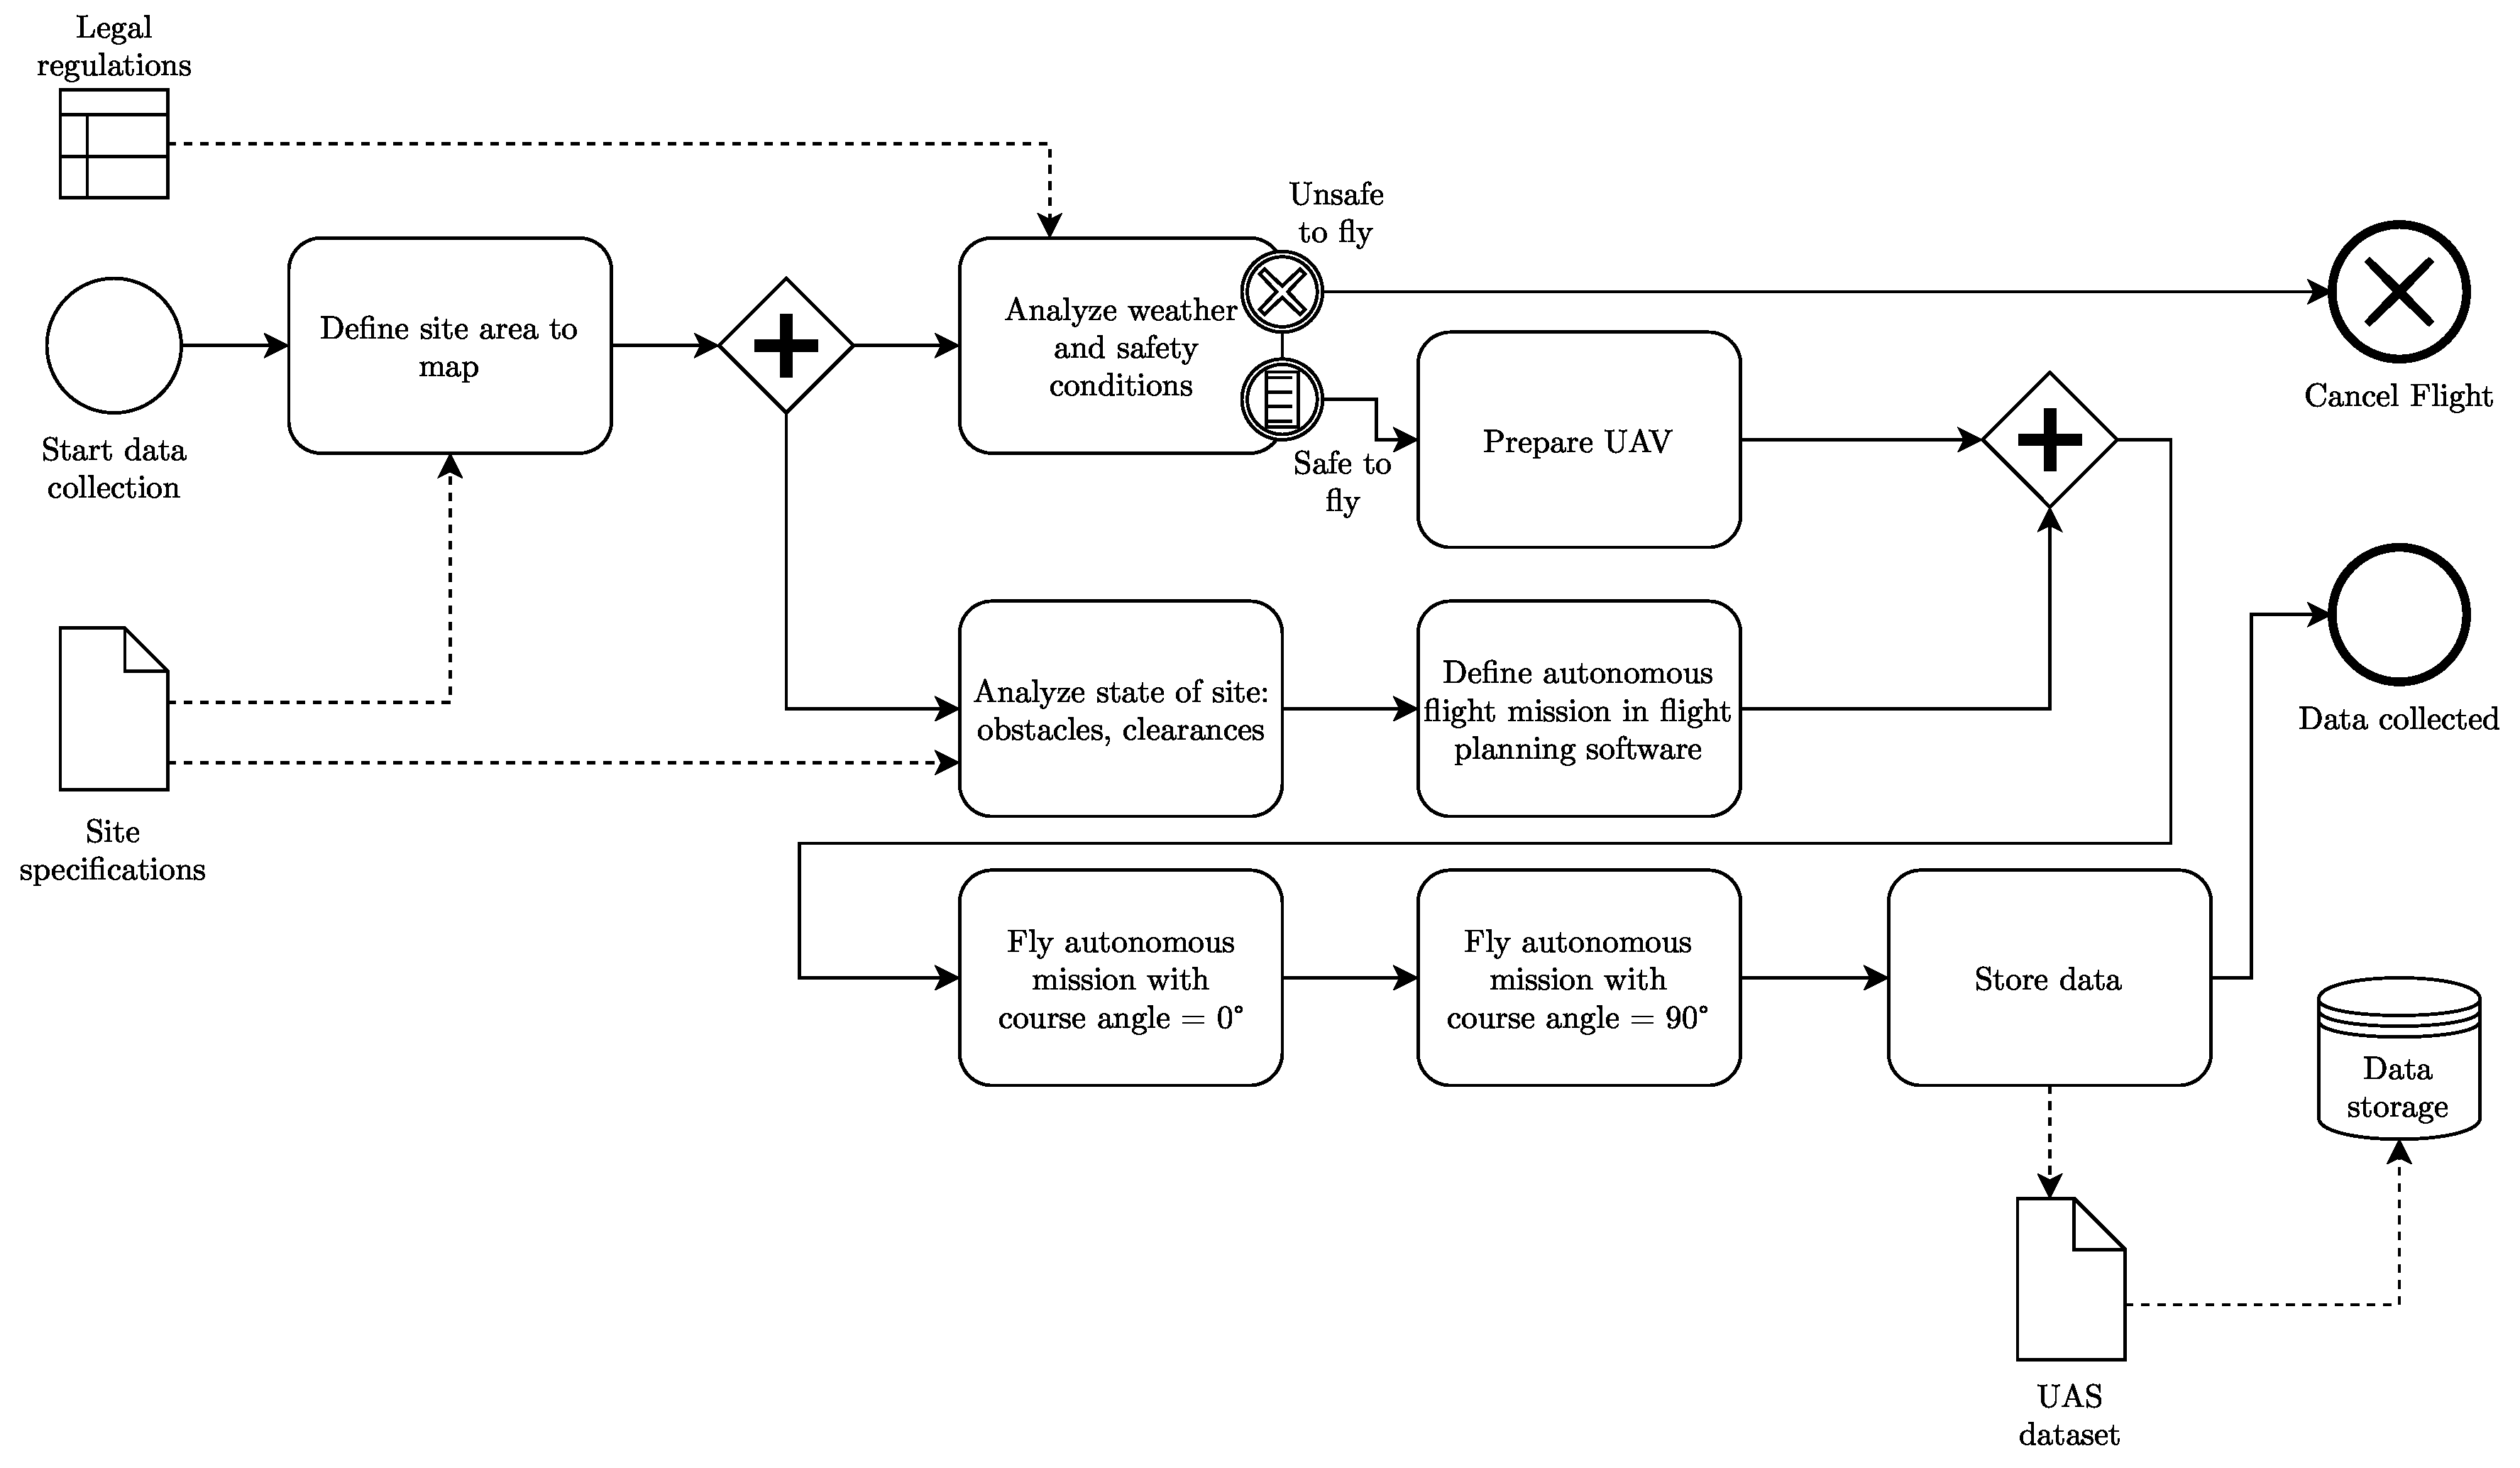
Figure 2 shows the process in detail.
First, the area of the site from which data should be collected has to be defined. The area might change due to different phases in the construction plan (e.g., if there is no work performed in a certain area, it can be excluded from the mapping or, on the contrary, if there is non-postponable work that might interfere with the UAS flight, such as pouring concrete with a concrete pump). By defining the data collection area, the UAS software is able to create a flight plan that covers the area to be investigated, taking into account the characteristics of the optical system (e.g., camera angle, field of view, etc.).
Then, the next step is to analyze the weather and safety conditions, taking into account the legal regulations (e.g., maximum allowable wind speed for UAS flight, temporary flight restrictions), with a final decision about whether it is safe to fly. If not, the data collection has to be postponed or canceled. If the conditions are safe, the UAS can be prepared for flight using the appropriate checklists and procedures.
In parallel, the present state (i.e., shortly before take-off) of the construction site has to be analyzed and verified for obstacle clearances that might have gone unnoticed during the site area definition, as construction sites can be fast-changing environments.
Next, the autonomous flight mission can be created (in most situations, this will encompass only slight modifications to the general “standard” flight plan) and uploaded to the prepared UAS.
Then, the UAS will automatically fly two missions: first, a flight mission with a course angle (the angle between the primary direction of movement and the centerline of the UAS’s optical system) of 0
and, then, a course angle of 90
, as shown in
Figure 3. This ensures that the images overlap on the long side (0
), respectively on the short side (90
). Simply put, with a course angle of 0
, the UAS primarily moves “forward and back”, and with a course angle of 90
, the UAS primarily moves “left and right”.
Finally, the collected data from the UAS are downloaded and stored in an appropriate data storage.
In summary, in the subprocess of data collection, the area from which data should be collected is defined, the necessary safety and obstacle checks are performed, the automated UAS flight is planned and executed, and the collected data are stored for further use.
3.2. Data Processing
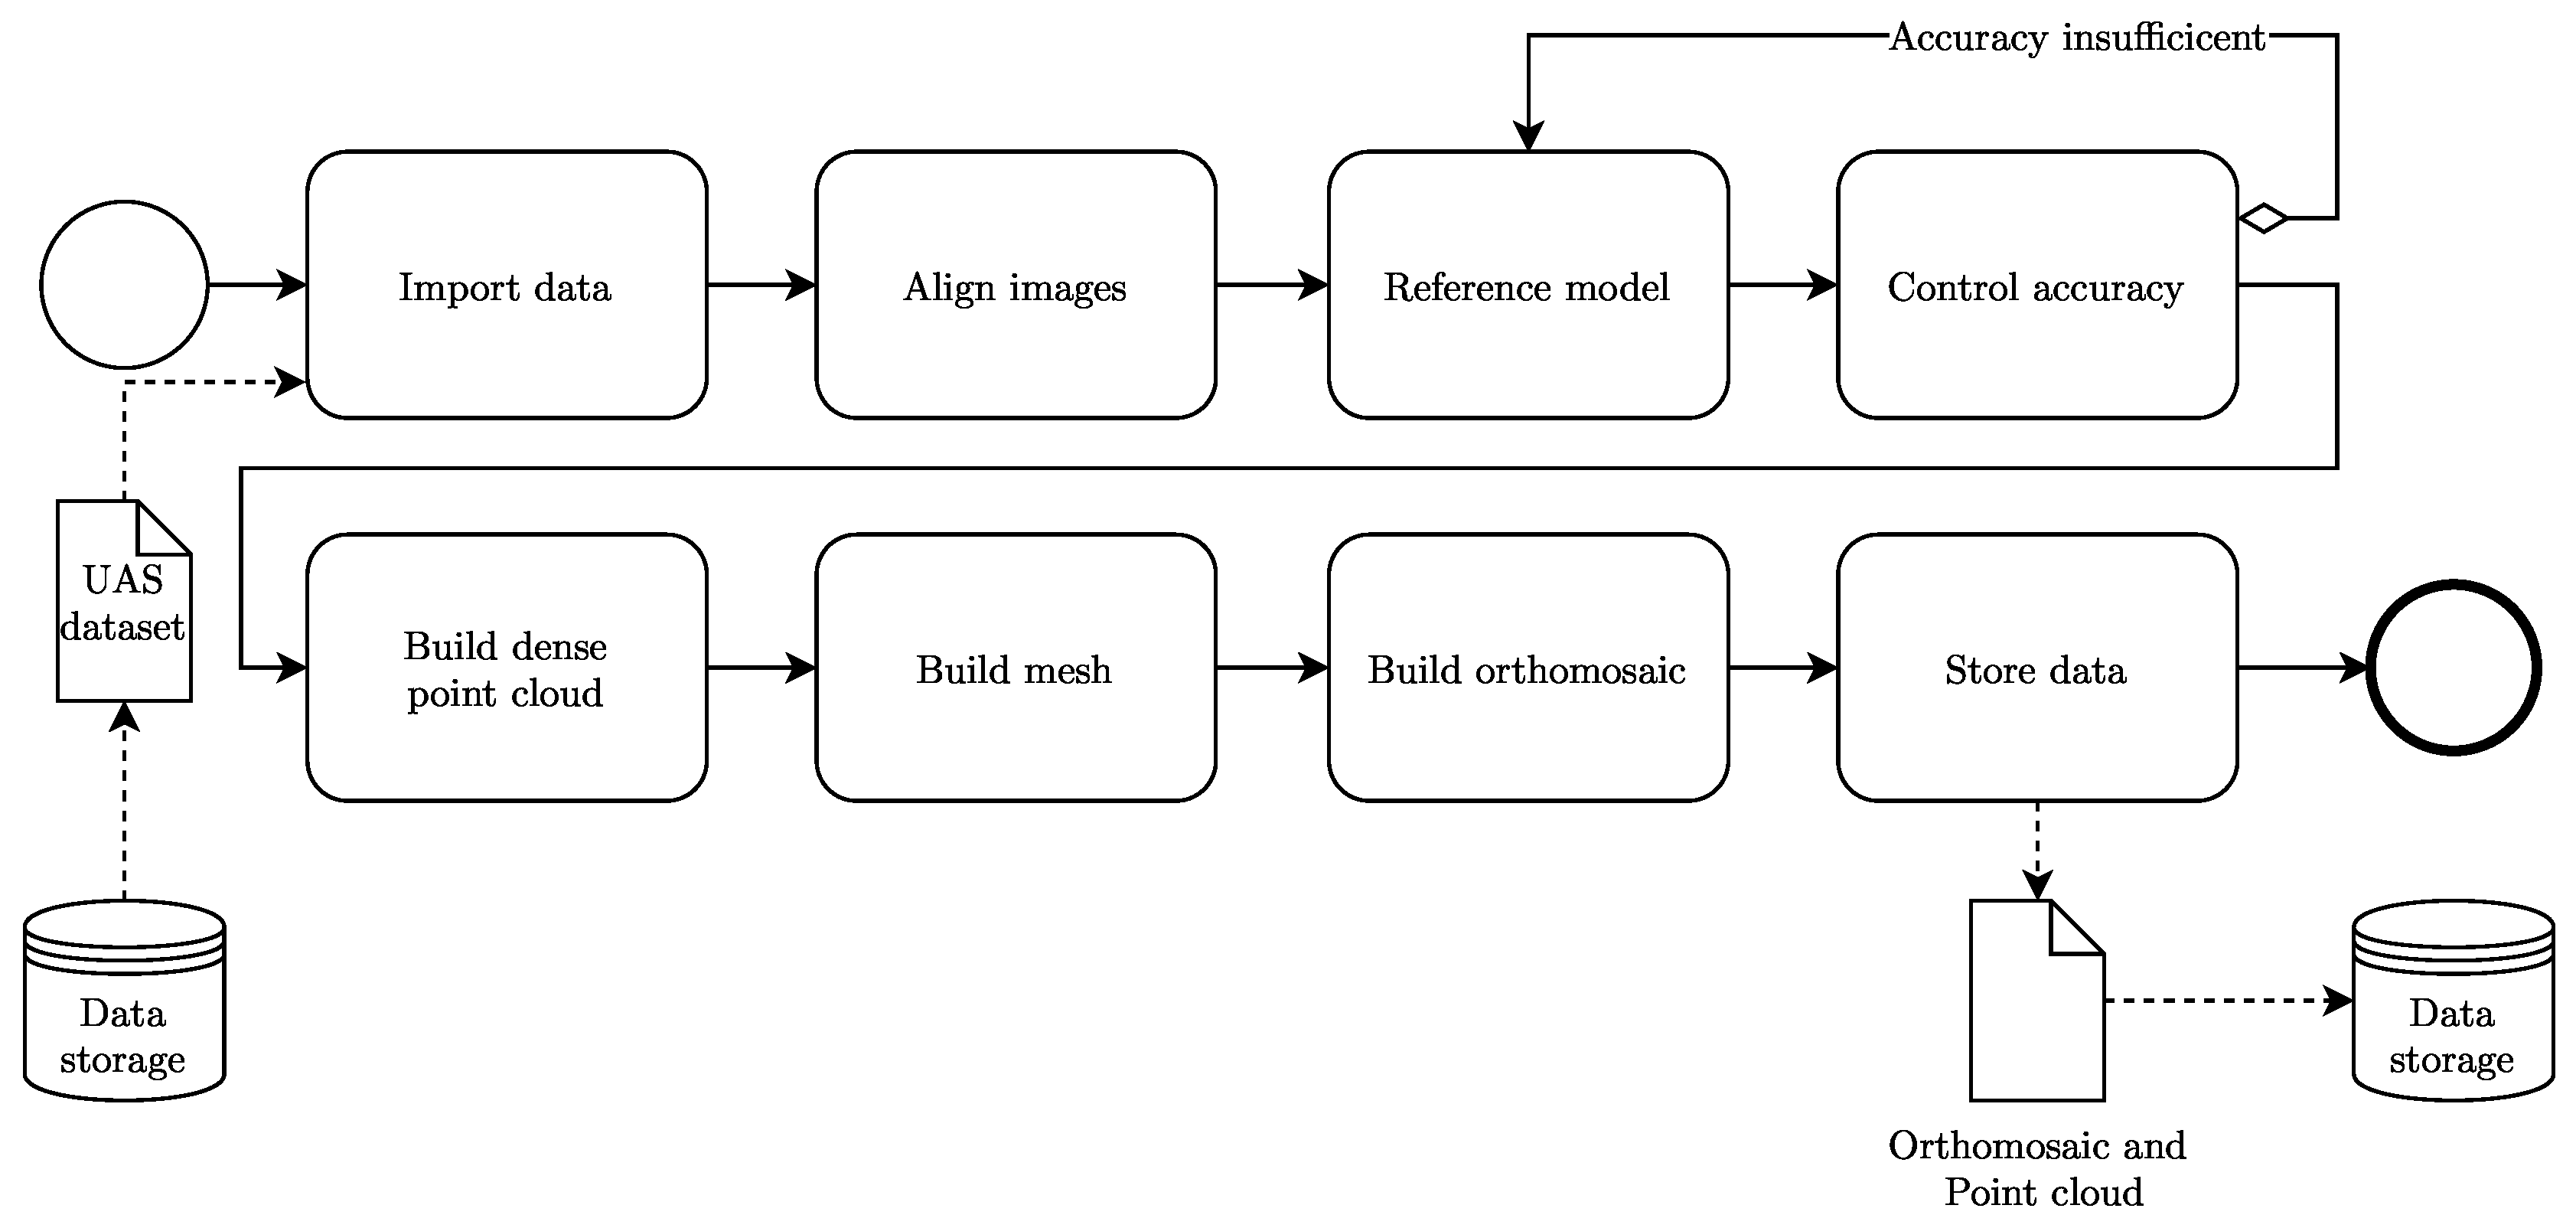
The subprocess of data processing prepares and transforms the data for later analysis. The process follows a standard photogrammetry workflow and is depicted in
Figure 4.
First, the UAS dataset (i.e., georeferenced images) is imported from the data storage. Then, the images are aligned, i.e., points that occur in multiple images are marked as being the same point. With this, the relative location of all images can be determined, and all individual images can be joined into a puzzle-like big picture, using standard photogrammetry procedures. The expected relative accuracy (i.e., the dimensions and distances within aligned images) is about 0.3 to 0.5 times the ground pixel size (i.e., the size that a pixel on the image sensor will have on the observed area, if back-projected through the optical system).
The aligned images, which contain the GPS coordinates from the UAS, are then referenced to a subset of reference points (i.e., to points whose coordinates are known precisely from surveying), in order to place the aligned images accurately in space, as in contrast to the relative accuracy of the images, the absolute accuracy of placement in space without referencing is reduced to the accuracy of the GPS, which strongly varies depending on the location and available satellites and can be in the order of 0.3 to 5 m (1 to 16 ft). The remaining reference points are then used for accuracy control, i.e., the known coordinates are compared to the coordinates calculated from the UAS dataset. If the accuracy is insufficient, the referencing procedure should be repeated until an acceptable accuracy is reached.
Then, a dense point cloud is calculated, using the referenced images and information about the optical system of the UAS, such as sensor size, focal length, angular resolution, and lens distortion. The individual points from the dense point cloud are then connected to form a mesh (i.e., a surface). From the mesh, an orthomosaic (i.e., a geometrically corrected photo that is used to measure true distances and angles, having been adjusted for topographic relief, lens distortion, and camera tilt) is created.
Finally, the data are sent back to the data storage. The point cloud is saved as an .XYZ file, i.e., a list of each point with its X, Y, and Z-coordinates and other properties of the point. The orthomosaic is stored as an uncompressed .TIFF file in order to preserve all details.
In summary, the subprocess of data processing uses the collected images from the UAS to create a digital three-dimensional representation of the construction site at the time of data collection.
3.3. Data Analysis
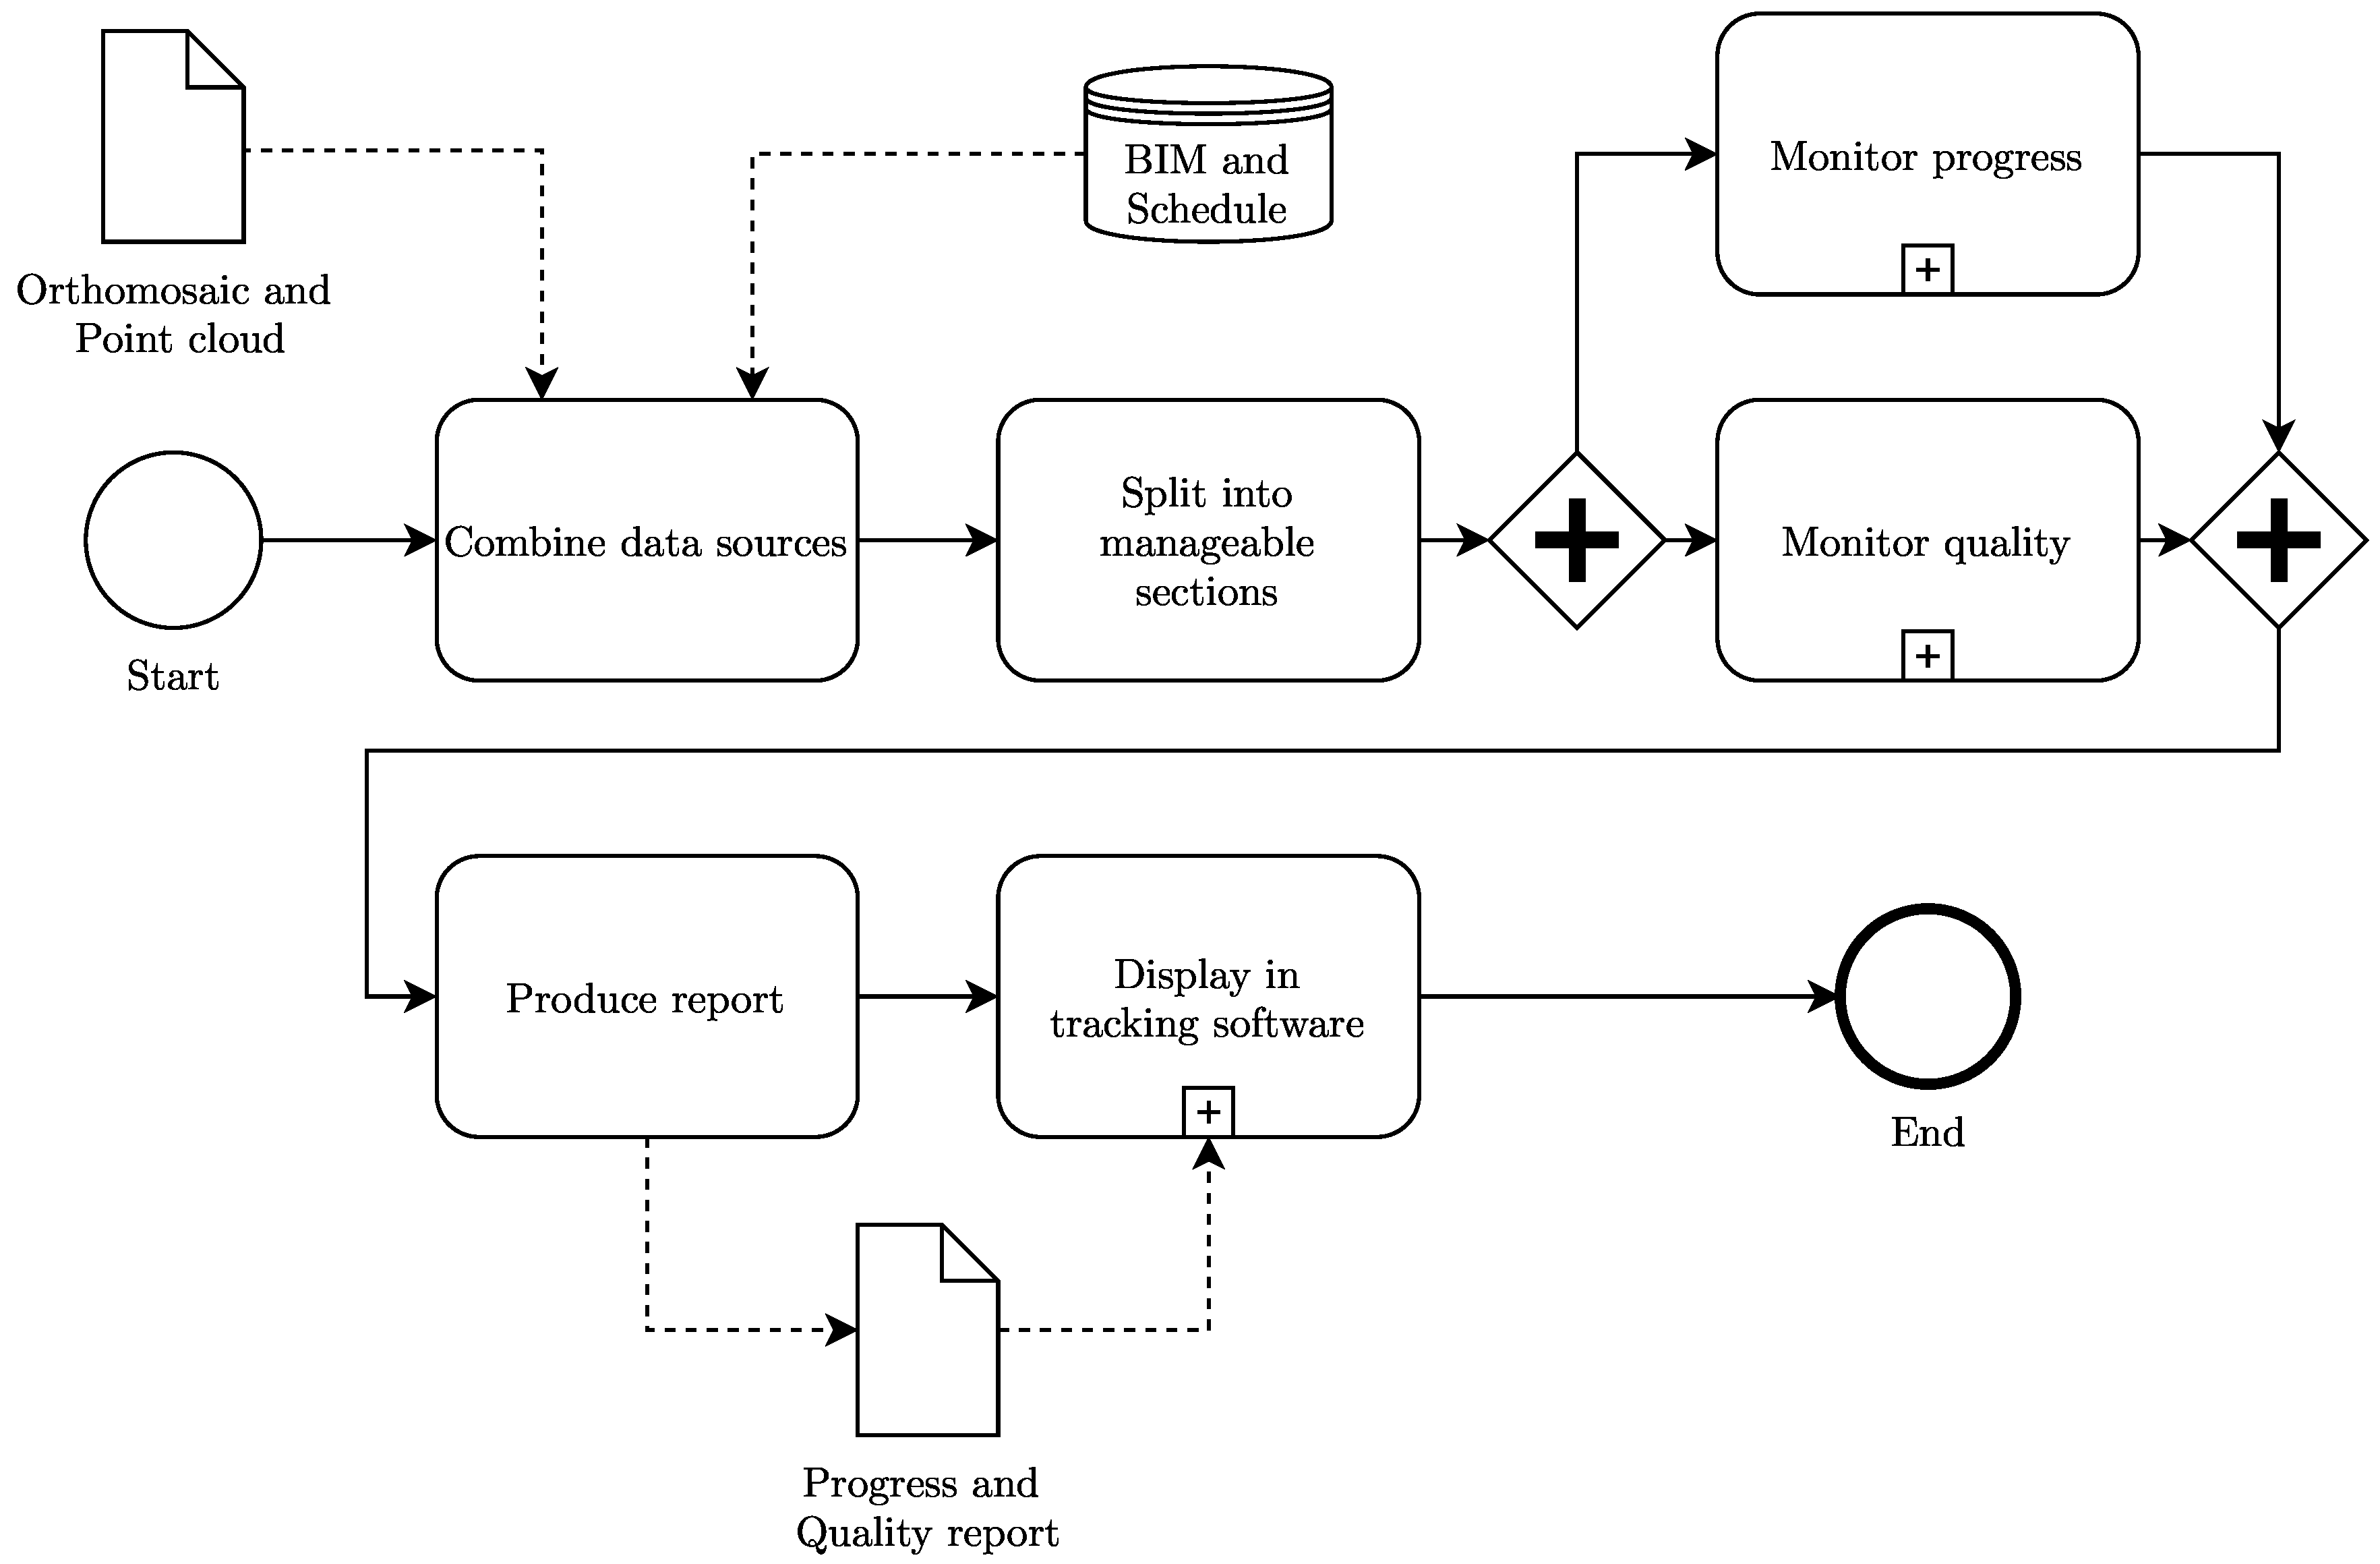
The data analysis process, which combines all data sources and produces the progress and quality report, is shown in
Figure 5.
First, all different data sources (i.e., the orthomosaic, the point cloud, and BIM and schedule information) are retrieved from the data store. Then, the whole dataset is split into manageable sections to enable efficient processing. This is especially advantageous if multi-processor parallel computing is available. Then, within two subprocesses, progress and quality are monitored. These two subprocesses are explained in more detail below. With the data from the progress and quality monitoring, the BIM, and schedule information, a report is produced that is then displayed in a prototype tracking software that was created to facilitate the tracking of the whole construction process. Details of the tracking software are explained in more detail in the case study section.
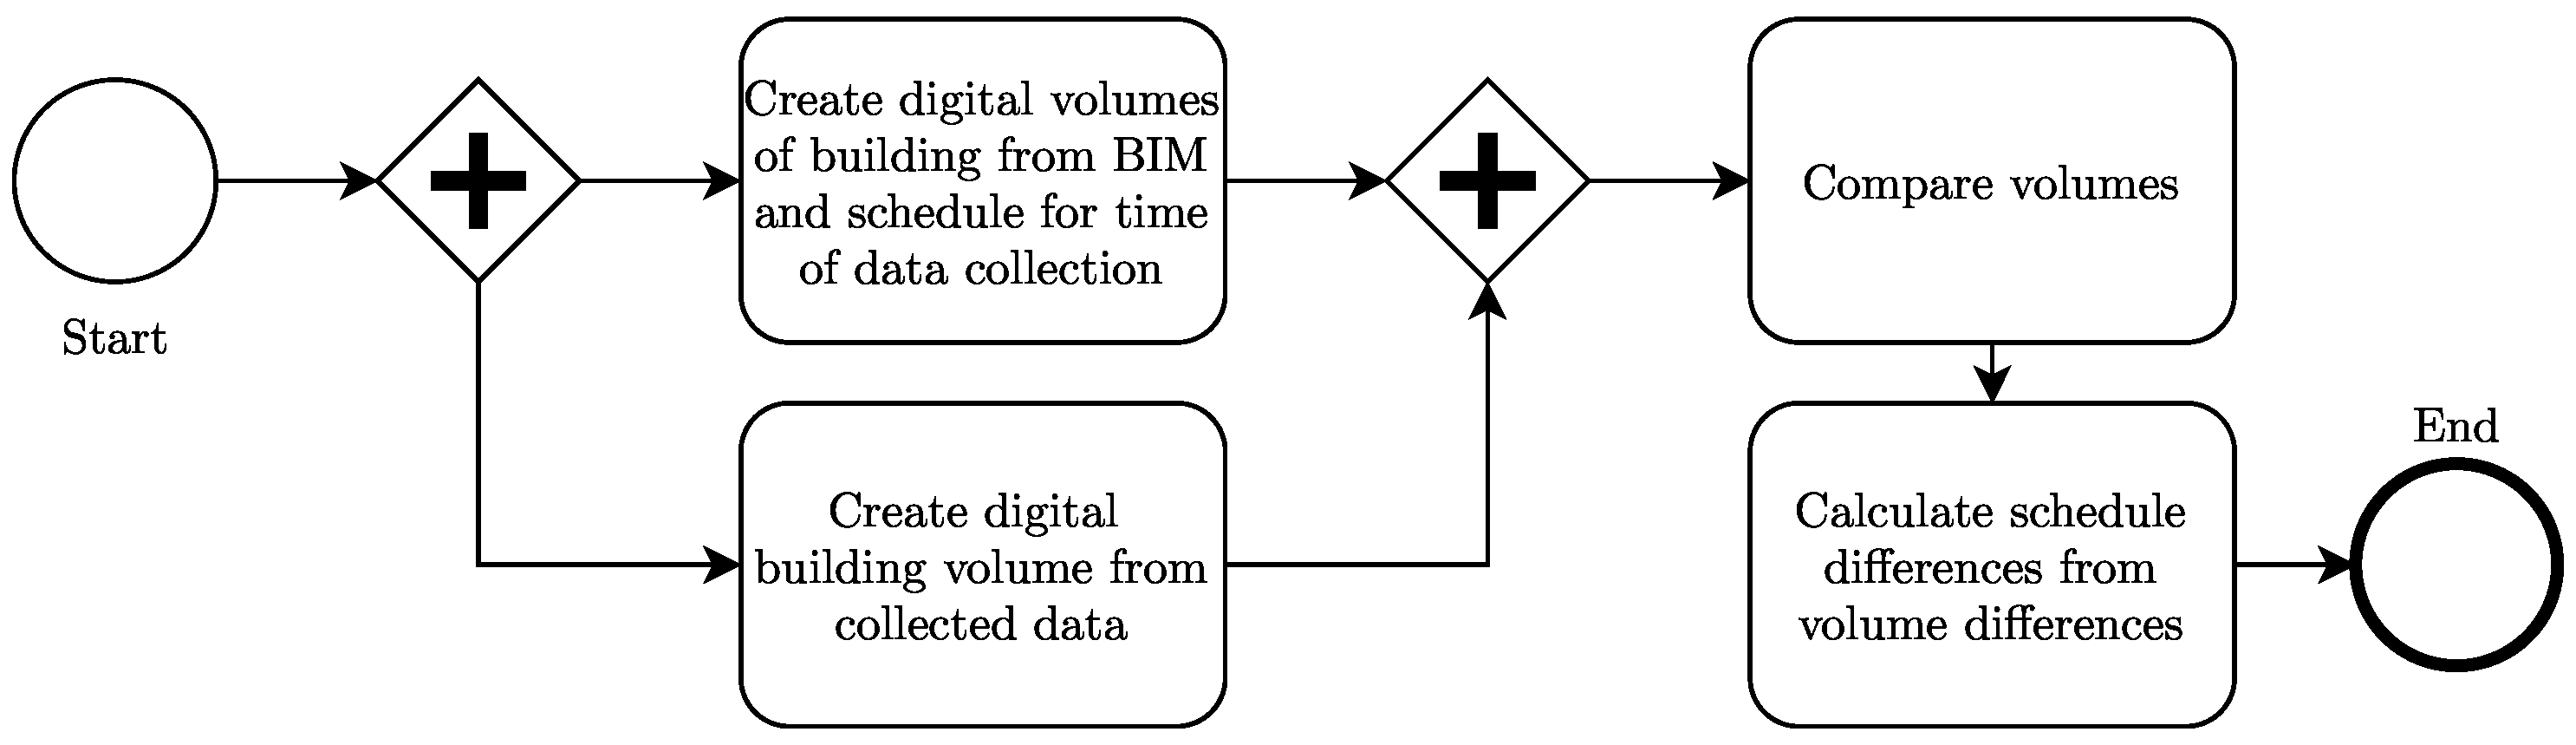
3.3.1. Progress Monitoring
The process of progress monitoring calculates the difference between the scheduled progress and the actual progress as recorded by the UAS.
Figure 6 shows the process.
First, a digital volume of the building at the time of data collection is created, which reflects the state of construction that the site would be in, according to the BIM and the schedule. At the same time, a digital volume of the building is created from the collected data, i.e., the “as-is” state of the construction. Both volumes are then compared, and the difference in volume is then transformed into a difference in schedule. A small example is shown in
Table 1.
In the first line, the task “Section A” has a total concrete volume of 30 m and should be 100% complete according to the schedule, i.e., 30 m of concrete should be present. The UAS-based digital volume is 27 m, i.e., only 27 mm complete. Therefore, the in time is (90%–100%), meaning that this task is half a day late. Section B should be at 6 m or 20% according to the schedule, but is in reality at 21 m, i.e., already 21 m m complete. Therefore, the difference in time is (70%–20%), meaning that this task is two and a half days ahead of time.
In summary, the process of progress monitoring compares the as-planned volume of the construction task to the as-is volume of the construction tasks and calculates the difference in time for each task from the schedule. Negative numbers signify late tasks, and positive numbers signify tasks ahead of time.
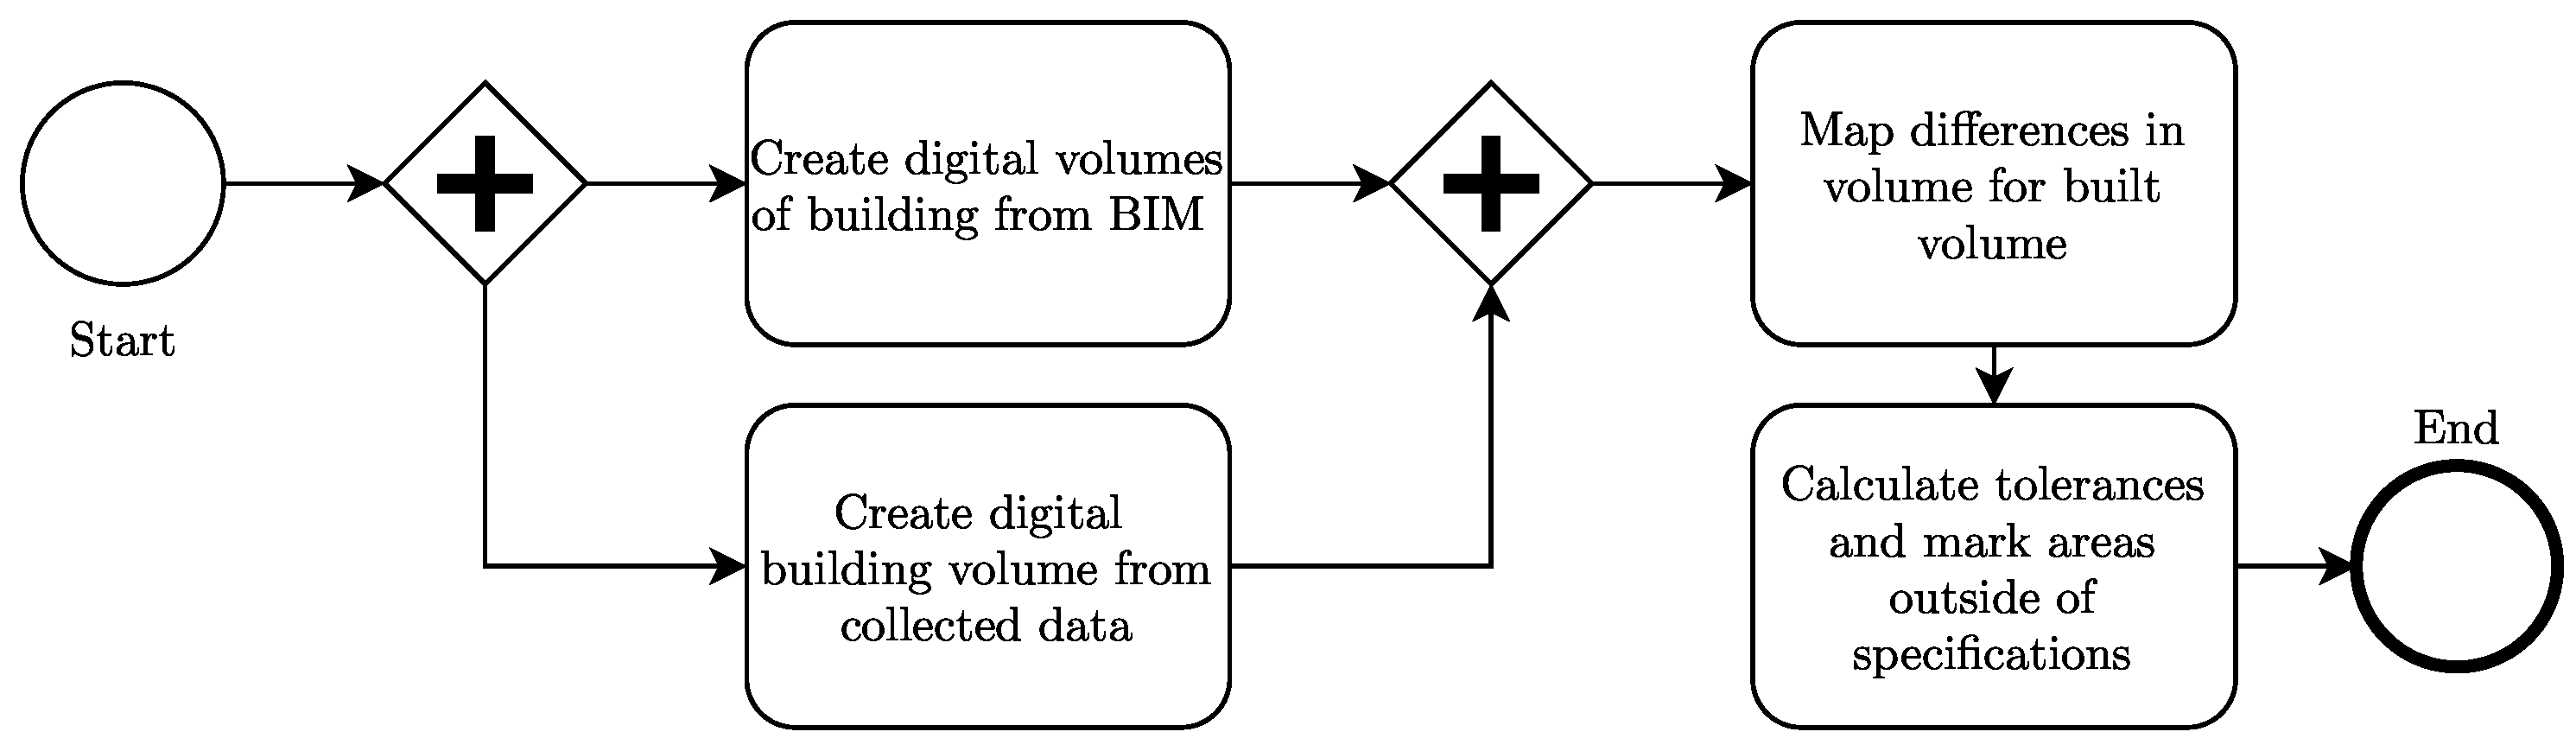
3.3.2. Quality Monitoring
The process of quality monitoring calculates the difference between the planned building dimensions and the actual dimensions as recorded by the UAS.
Figure 7 shows the process.
First, a digital volume of the building at the time of data collection is created, which reflects the state of construction that the site would be in, according to the BIM and the schedule. At the same time, a digital volume of the building is created from the collected data, i.e., the “as-is” state of the construction. Both volumes are then overlaid, and the areas where the volumes differ are then marked and listed. A small example is shown in
Table 2. Note that while differences can be listed, the reason for the difference has to be confirmed by hand, as the reasoning for why a quality deviation is present is outside the capability of automated processing.
Table 2 shows two lines: In the first line, the issue shown is a vertical deviation in Section C. In the second line, a volume location issue for Section D is shown. It is important to note that this step can only show that discrepancies between the BIM (i.e., “as-planned”) and the “as-is” exist, but cannot give an interpretation of why the difference exists.
A vertical deviation signifies that in the specified section, the top height of the as-is deviates from the top height as-planned. A volume location issue for Section D signifies that the as-planned volume is equal to the as-is volume in Section D, but it is at different locations. Although it is not possible to automatically give reasons for why both these quality issues occurred, a vertical deviation could hint at a measurement error or the wrong amount of concrete poured, and a volume location error could hint at a construction element placed wrongly, e.g., a window opening at the wrong location.
In summary, the process of quality monitoring compares the as-planned volume to the as-is volume of the construction tasks and marks deviations from each other. Although the reasons for why the quality issues exist cannot be determined automatically, the types of issues may hint at certain quality issues nonetheless.
3.4. Method Summary
A method is presented that formalizes the process of data collection, data processing, and data analysis for UAS-based automated progress and quality tracking on construction sites. The process makes use of the existing schedule and BIM information and merges this with UAS-captured on-site data in order to provide a real-time situational overview to assist the construction project manager to complete the project on time, to specification, and within budget.
4. Implementation
In this section, the case study construction site is presented. The section is structured as follows: First, the construction project, the construction site and its surroundings, as well as the local regulations, that influence the operation of UASs are described. Then, the hardware and software setup is described. Next, the results are presented, followed by a cost analysis of the use of UASs in this particular setup. The section on “Key Operational Findings” presents valuable information on the operation of UASs that has been gained during the practical execution phase of the UAS flights. Finally, the case study is summarized. Conclusions drawn from the results of the case study are discussed in the Conclusion (
Section 6).
4.1. Case Study Description
The construction project used for this case study was the Preola-Areal Logistics Builidng in Zurich, Switzerland. The 25,000 m (270,000) building will be mainly used as the new headquarters of a electrical industry wholesaler and will contain a warehouse, offices (some of which will also be rented out to other companies), showrooms, and a shop. The authors were given access to the construction site for a period of four weeks to perform the on-site data collection.
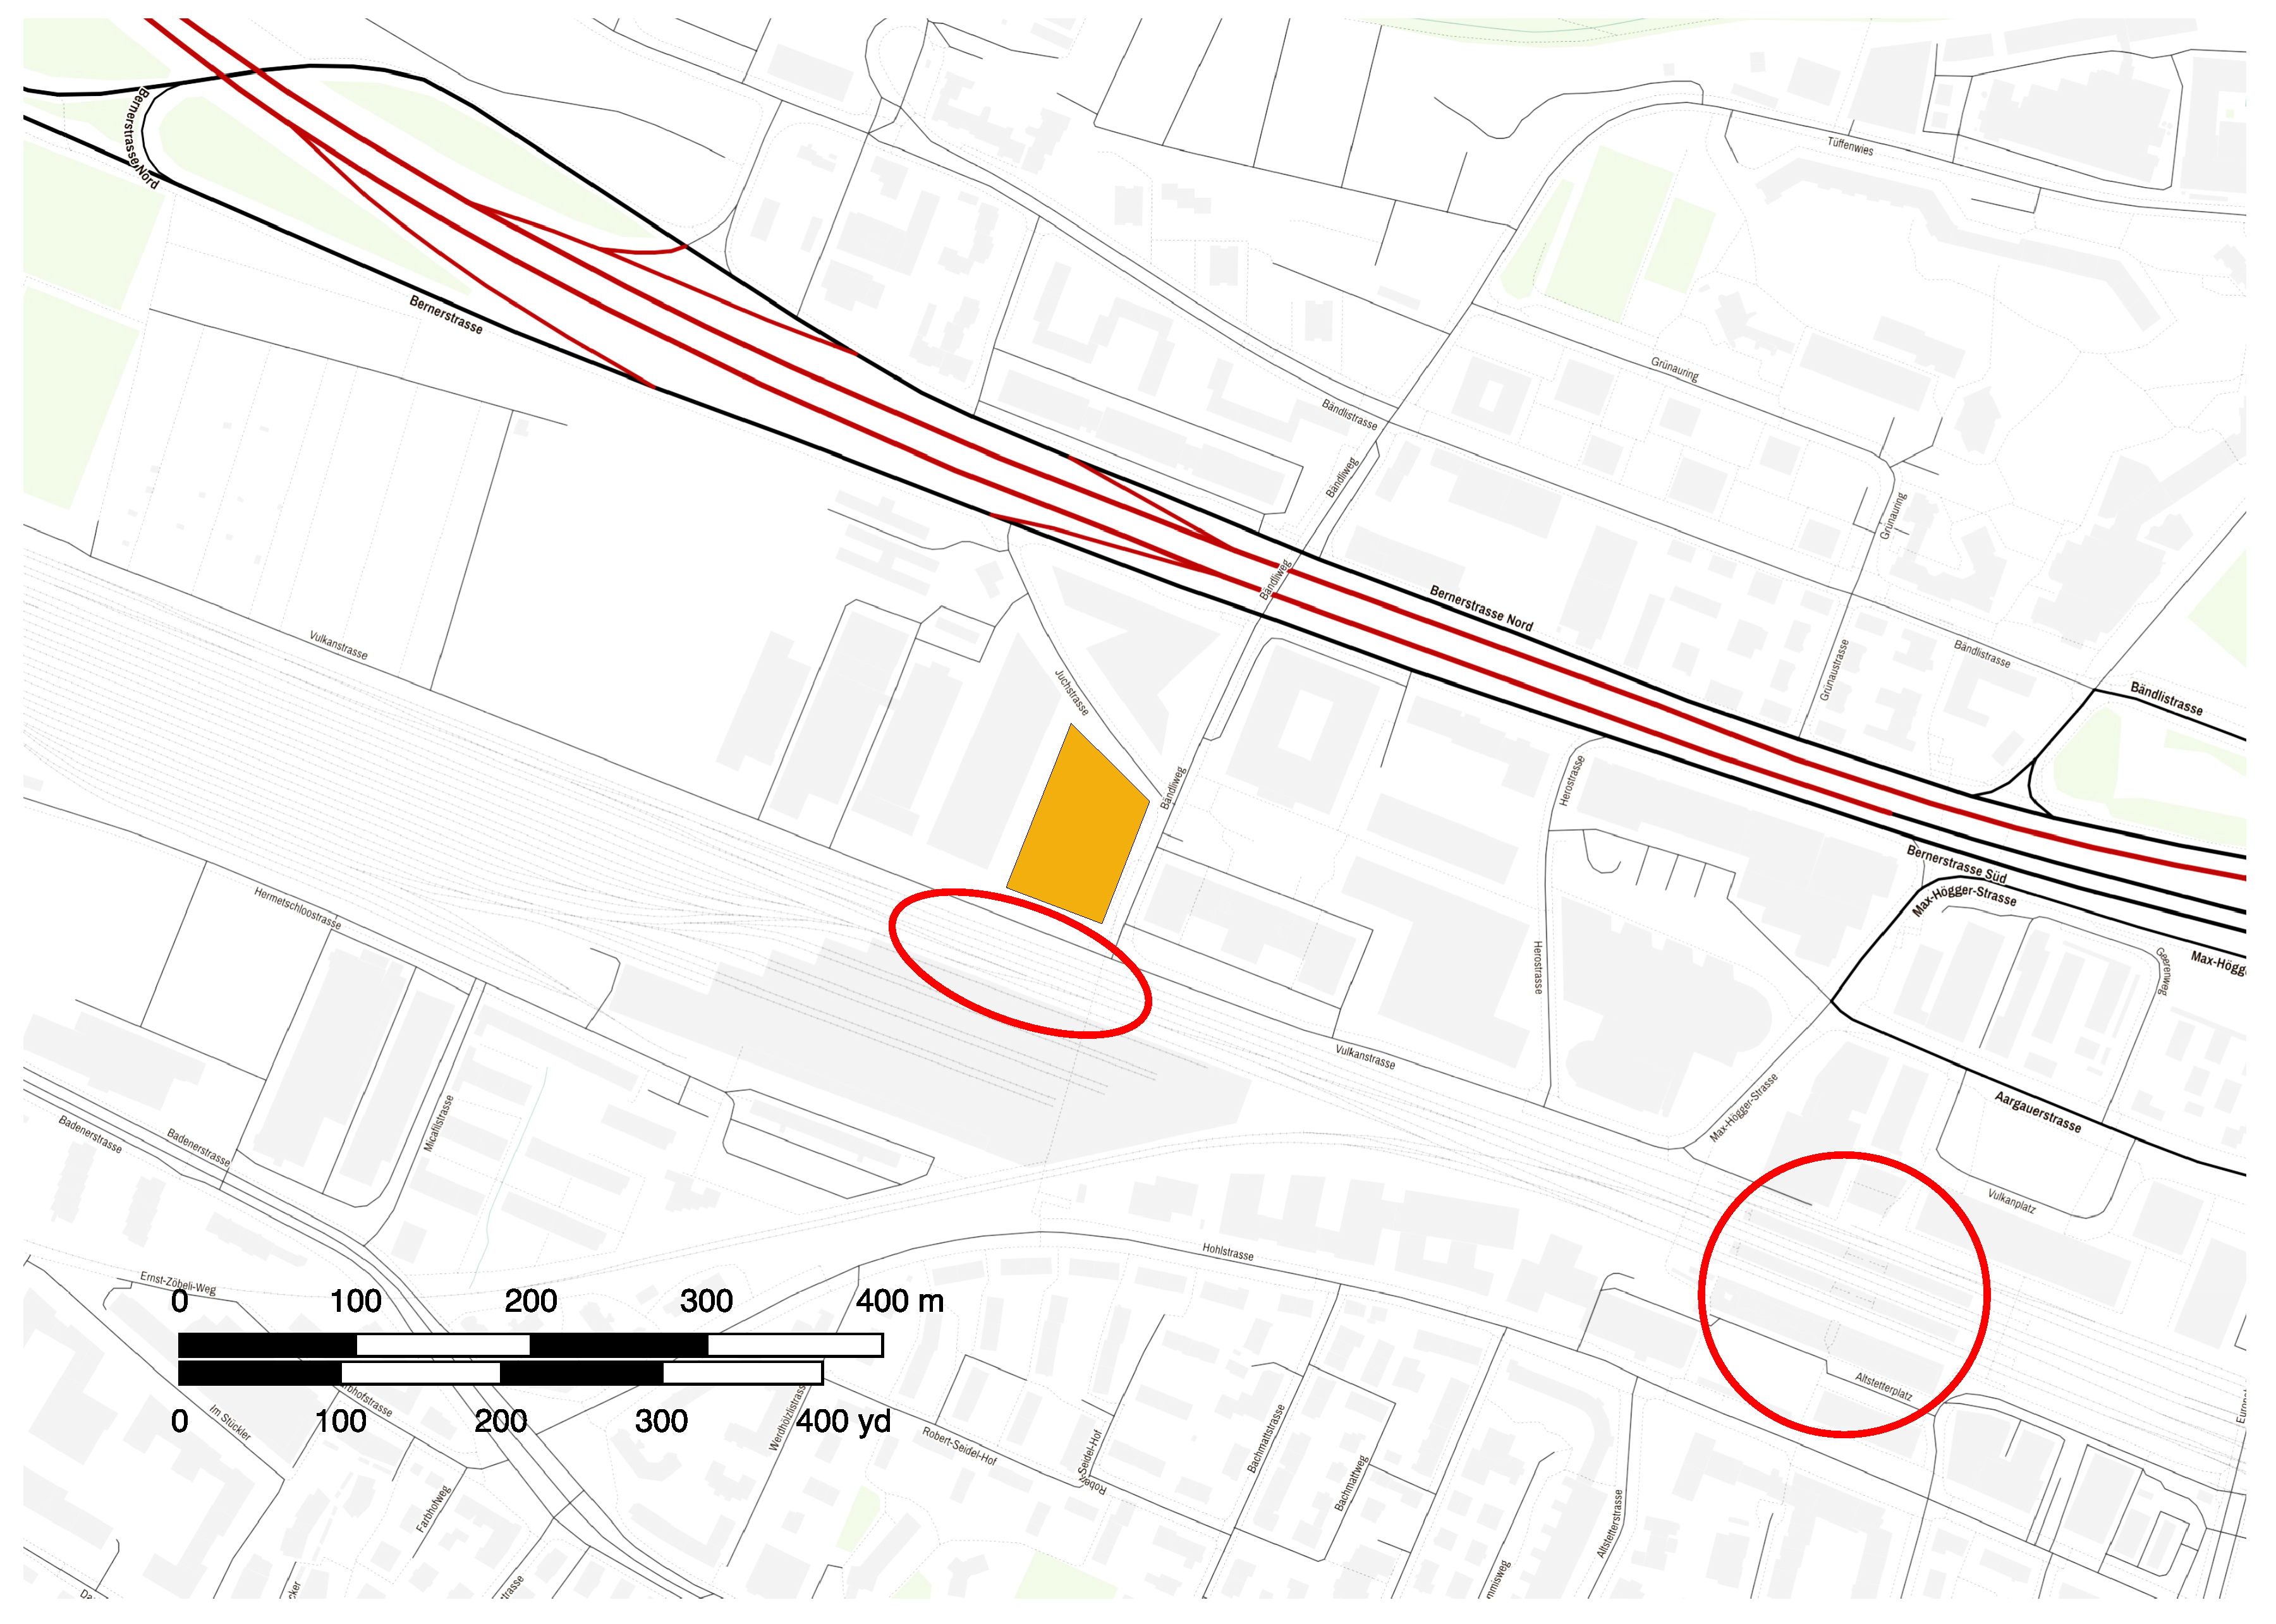
The construction site was located in the City of Zurich, next to a railway line, a railway station, and the highway.
Figure 8 shows a map of the surroundings.
It can be seen that the construction site (orange) is situated directly next to a six-track electrified railway line (red ellipse) and a railway station (red circle), as well as a highway (red lines). Additionally, the area is in a Controlled Traffic Region (CTR)) zone from Zurich International Airport. The CTR stretches across the whole map image.
This has the following implications for the operation:
Due to the CTR, the maximum allowable altitude Above the Ground Level (AGL) for UAS operation is 150 m (492 ft).
The catenary from the railway line might cause electromagnetic fields that interfere with remote control.
Although legally permitted, the closeness to the highway, railway line, and railway station might cause concerns for the citizens that will cause interruptions to the UAS operation.
The concerns were addressed by the following measures:
The maximum AGL was properly set in the UAS software.
Special attention was given to the pre-flight phase and during flight on the stability of the radio link quality between the UAS and remote control.
The spokesperson and the foremen of the construction site were informed about the UAS operation and were given appropriate information on addressing citizens’ concerns.
In summary, the construction project was a standard commercial building of medium size, with the surroundings being suitable for UAS operation, although with some restrictions and some concerns that needed to be addressed.
4.2. Hardware and Software Setup
In this section, the hardware and software setup is described that was used in the case study. No endorsement of a particular hardware or software is intended.
4.2.1. UAS
The UAS used in the case study was a DJI Inspire 1. Technical details of the UAS are listed in
Table 3.
4.2.2. Software Flowchart
Figure 9 shows a flowchart of the software used in the case study that describes the data and information flow between the proprietary software used in the implementation. It can be seen as a combination of
Figure 1,
Figure 2, and
Figure 4 applied to the available software.
First, in the step of flight planning, DJI GS Pro was used in order to set the flight plan, the flight restrictions, and the adaptations necessary for the local obstacles, as explained in
Section 3.1 and in
Figure 2. Then, the flight plan was uploaded to the UAS, and the flight was performed. After the flight, the data processing, as explained in
Section 3.2 and in
Figure 4, was performed using AgiSoft Metashape Pro, a photogrammetry and image processing software. The iterative referencing procedure according to
Section 3.2 was halted when an average accuracy of 0.8 cm was reached. The software also created the .XYZ file and the orthomosaic necessary for the next steps. For data analysis, the data were merged from different sources, as the available data were delivered in several different data formats. The .XYZ file from the data collection was processed with Autodesk Recap 3D; the CAD model of the building was processed in Rhino 3D. Both software generated output that was finally merged with the BIM in Autodesk Navisworks, where the data join and the measurements were performed.
Both quality and progress measurements were then transformed into Microsoft Excel, in order to perform the schedule calculations. Finally, the results were transferred to the custom-made software Track to go, which linked the output of the schedule and quality calculation to the orthomosaic, and thus presented the results in a user-friendly way on mobile devices and tablets.
4.3. Results
In this section, the results of the method are presented, based on a four-week period of progress and quality monitoring on the construction site.
4.3.1. Progress Monitoring
Progress monitoring in the case study was performed during Weeks 13 to 16 of the baseline schedule provided by the research partner, Implenia. In
Table 4, a comparison between the planned concrete volume according to schedule and the concrete volume detected by the UAS is shown.
The table shows the tasks (the construction of Wall Sections 2 and 3 and Slab Sections 2 and 3) that were planned within the four weeks on the left. The columns to the right show for each Week (W13, W14, W15, W16) (a) the percentage completion planned for the respective week, (b) the progress captured by the UAS in percent, and (c) the difference
in days, according to
Section 3.3.1 and
Table 1. For Wall Section 2, it can be seen that the task was behind schedule (negative
) in Weeks 13 and 14, but it could be completed in time in Week 15. For Wall Section 3, the task was ahead of time in Weeks 13, 14, and 15, but could not be completed in time in Week 16. Slab Section 2 was also ahead of time in Weeks 13–15 and was almost complete in Week 16, with a delay of only 0.1 day. Slab Section 3 was, following the schedule, not started until Week 16. It was, however, ahead of time with a
of 3.8 days at the end of Week 16.
4.3.2. Quality Monitoring
As mentioned in
Section 3.3.2, the process of correctly identifying quality errors had to be made manually.
Table 5 shows an example of such a quality monitoring report.
It can be seen that three quality issues were identified. The first issue was a vertical deviation of Interior Walls 9 and 10. Most likely, this stemmed either from a miscalculation or a mismeasurement of the poured concrete level. The second issue was a column placement deviation of 1422 mm (56 in). After a deeper investigation, the source for the quality issue was the failure to update the BIM data that were provided. The repositioning of the column was marked in the plans for the contractor, but not updated in the BIM data used to determine the correct location of the column. The third quality issue was based on the same issue as before; the new window opening was not inserted in the baseline document, only in the contractor plans.
4.3.3. Cost Analysis
In this section, three different scenarios are evaluated to see whether the use of the UAS was financially feasible compared to the traditional method. The cost analysis considered all steps shown in
Section 3. The costs were calculated using the local currency (Swiss Francs (CHF)) and local prices. First, the total cost per data collection flight was calculated for each scenario. Then, the total cost of using drones for the whole construction of the Preola Building was calculated in order to compare the financial feasibility of UAS-based progress and quality measurement.
The first scenario was the in-house operation of the UAS by the construction company.
Table 6 shows all the elements required and the total investment cost, as for the setup used in this case study. The total cost per data collection flight is shown in
Table 7, assuming a conservative UAV lifetime of 80 flights (one flight per week, 40 weeks with appropriate weather conditions, 2 year UAS lifetime) and the hourly costs of a construction worker with specialized training. The estimates for the time required in
Table 7 stem from the authors’ own experience. The hourly costs for the data processing were reduced by 50%, as some of the processing could be performed unattended (e.g., over night).
The second scenario is outsourced operation of the UAS. The investment costs remained the same, but the costs per flight were slightly modified, as shown in
Table 8. For the planning, data processing, and data analysis stage, the same hourly estimates as in Scenario 1 were used. For the data collection process, a higher hourly cost was assumed, based on the assumption that a UAS operating company will have the highest license for UAS pilots (which is not needed for pure construction site flights, but for other UAS operations) and, therefore, charge higher hourly rates for their pilots. However, the depreciation was calculated with the assumption that the UAS operating company would have more flights in the lifetime of the UAS, estimated as 80 days with both suitable weather and pending assignments per year.
The third scenario was using traditional methods to measure progress and quality. A summary is shown in
Table 9. For the hourly cost, a certified quality control person was assumed. The investment depreciation was estimated using the internal rental costs for the equipment necessary for the manual data collection (measurement equipment, total station).
In summary, it can be noted that the traditional progress and quality measurement was the least expensive, under the assumption that there are no additional benefits of the UAS data collection. Compared to the outsourced data collection, the in-house data collection was approximately 15% less expensive.
5. Discussion
5.1. Key Operational Findings
In this section, key operational findings are provided that were deemed important lessons learned by the authors. They are intended to help the reader to learn from the challenging situations that occurred and were overcome during this case study.
5.1.1. Magnetic Fields
During the execution of one automated flight, the UAS was started to record a new area, in which the rebaring was in progress. Shortly after the UAS took off, it started an emergency landing procedure. In this phase, the pilot had no control over the UAS and was not able to abort the landing. Finally, the UAS landed in a freshly concreted area. From there, it could be manually flown back to the take-off point. After looking into the flight data recorder, a fluctuation of the magnetic field (black line in
Figure 10) was discovered.
Investigation of the zone where the incident happened revealed that the rebar in the concrete was magnetized, leading to a distortion of the local natural magnetic field. This in turn caused a sensor disagreement (i.e., the inertial measurement sensor and the magnetic orientation sensor suddenly showed different directions as “upwards”). With the flight control software being unable to determine which input was the correct one, an emergency automated landing was initiated. After investigating the local area with a magnetometer, which confirmed this situation and also showed that the distortion was only present close above the surface of the take-off spot, it was decided to use two tables stacked on top of each other as a takeoff spot to successfully address the problem.
5.1.2. Construction Site Tidiness, Uncluttering
The second valuable lesson learned during the case study was that clutter and other objects dispersed around the construction site were impacting the automatic image recognition capabilities of the image processing software. For example, objects lying around the construction site, such as tools, tarps, unused auxiliary material (e.g., lumber for makeshift construction) obscured the surface, or in the case of tarps, might move in the wind. This led to the areas underneath said objects not being able to be processed automatically. Manual correction had to be used in such areas, but could have been avoided if the construction site were tidy and uncluttered.
5.2. Case Study Summary
In general, the case study showed that it is feasible to measure progress and quality with UASs. Delay times could be calculated, and quality issues could be detected. However, some of the quality issues stem from non-updated data sources, and some delay times might be caused by non-recorded changes in the schedule. The cost analysis showed that at the moment, the traditional method is more cost-effective than the UAS-based method. This will be discussed in the Conclusion section. Valuable lessons were also learned in the case study that could prove helpful for further research or practical applications.
In general, the overall method presented in this paper is feasible to measure progress and quality with UASs, but also very time consuming, and thus less cost-effective than the traditional method. The data collection process discussed in this paper leads, aside from the data necessary for the quality and progress measurement, to useful images about the actual state of the construction site at the time of data collection. This additional benefit has not been considered in the comparison of the different scenarios, but might sway the decision in the direction of using UASs, as the cost difference between in-house UAS operation (1232 CHF/flight) and the traditional method (1135 CHF/flight) was only 8.5%.
The data processing step was the most time-consuming part, requiring 22 h for the processing (see
Table 7. This, however, can be improved by using parallel computing and GPU-based calculation, which will make the process faster.
The data analysis step in this method is feasible, but time consuming and not automatized. Developing a programmed code that would automate the proposed processes in a commercial building for measuring quality and time seems enormously difficult, as the construction site changes very fast. To fully automate the proposed processes to measure progress and quality, an artificial intelligence solution would likely need to be employed. Knowing the maximum inaccuracies (vertical and horizontal) of the point cloud model is especially useful for knowing which elements’ quality measures are reasonable. If, for example, the target height of a wall deviates from the actual height (looking at the the point cloud) by only a few millimeters, this may be within the error range of the point cloud model, and it remains therefore unknown whether it is an inaccuracy of the model or a wall actually built inaccurately in height. For the calculation of progress, the error in the order of the magnitude of the inaccuracy of the point cloud model plays a minor role, since the cumulative volumes of the stages would only change slightly.
There is a considerable potential for optimization and development based on this research and its results. The process requires improvement, especially in image processing. This process is the most crucial aspect of the entire method since the data analysis and its results are strongly dependent on the data input. A better understanding of the software would enable gaining a more profound knowledge of the reconstruction of the 3D model and its individual process steps to achieve the best possible results. The computing time of image processing is a tedious process; thus, a more efficient process is desired.
Furthermore, the efficiency and automatization of data analysis have still more potential. The better implementation of BIM would be an enormous benefit by enabling the benchmarking of measured and target values, as at the time, a dedicated schedule was used, which was not included in the BIM. If the measured model in the BIM can be automatically overlapped and compared with the designed construction site, deviations could be identified and displayed immediately.


