Article

Maturity Improvements in Flood Protection Asset Management across the North Sea Region

1
ResilienServices, 120, 2613 PN Delft, The Netherlands
2
Rijkswaterstaat, 3526 LA Utrecht, The Netherlands
3
EcoFutures Ltd., Honley, Holmfirth HD9 6JW, UK
4
Sustainable River Management Group, HAN University of Applied Sciences, Ruitenberglaan 26, 6826 CC Arnhem, The Netherlands
5
Deltares, 2629 HV Delft, The Netherlands
6
Wasserbau, Hamburg University of Technology, 21073 Hamburg, Germany
7
Sayers and Partners, Watlington OX49 5PY, UK
8
UNDP, Boduthakurufaanu Magu, Malé 20026, Maldives
*
Author to whom correspondence should be addressed.
Submission received: 27 October 2020 / Revised: 26 November 2020 / Accepted: 2 December 2020 / Published: 10 December 2020
(This article belongs to the Special Issue Water Infrastructure Asset Management)

Abstract

:
North Sea Region countries depend heavily on flood protection infrastructure, such as dikes, dams, sluices and flood gates. Knowledge on where, when and how much to invest to ensure functioning is of crucial importance for asset owners and operators. This requires asset management approaches that are adaptable, respond to feedback and function within various contexts. The FAIR (Flood defense infrastructure Asset management & Investment in Renovation, adaptation, optimisation and maintenance) project has developed a unique framework to ensure that asset management processes are adaptive, comprehensive and make effective connections across strategic, tactical and operational contexts. The framework has for the first time informed an assessment of maturity of five flood protection asset management organisations in the North Sea Region, using a seven-factor maturity assessment model. This paper describes the self-assessment process and the self-reported maturity changes during the project. Maturity assessments were undertaken on two occasions, at the start of the project, and again toward the end. This has revealed how the baseline level of maturity for each organisation developed over the course of the three-year project. The observed maturity changes indicate that adopting the FAIR framework has added value in improving current approaches to asset management.

1. Introduction

North Sea Region (NSR) countries depend heavily on flood protection infrastructure assets, such as dikes, dams and hydraulic structures (e.g., sluices and flood gates). Most of these hydraulic structures were built in the early 1900s and after World War II (1939–1945) with a notional design life of 80–100 years. Hence, many are ageing and will increasingly require significant renovation or replacement. Deciding on the best means of replacement or improvement is a daunting task for asset owners and operators. For example, the flood protection assets managed by the Dutch government have a replacement value of EUR 19 billion. Across the NSR, policies aim to maintain, renovate and adapt the existing flood protection infrastructure. This has led to large-scale investment programmes, such as the UK flood and coastal erosion risk management investment programme [1] and the Dutch flood protection programme [2]. Knowledge on where, when and how much to invest is of crucial importance for asset owners. They need to make best use of (shrinking) budgets for flood protection. This requires a systematic and systemic use of Asset Management (AM) strategies, using life-cycle approaches to inform choices between abandonment, maintenance, renovation and adaptation. It also requires looking for and using opportunities to connect investments in flood protection infrastructure with other complementary investments [3], including transportation, telecommunications, recreation and ecosystem restoration. Co-creation approaches [4] enable asset owners to move out of the organizational silo’s and stimulate cross-sectoral and cross-departmental collaborations. The principles for improved AM strategies for flood protection infrastructure include [5]:
  • Priorities: AM should be focused on priority areas in terms of flood risk reduction.
  • Options: Flood risk addressed from a range of options can be assessed, so that best value AM (that is, not necessarily cheaper) can be selected.
  • Best value: Innovative methods and tools can help to justify maintenance, renovation and adaptation actions in terms of flood risk reduction and other requirements, such as ecosystem restoration.
  • Evidence: Assets will be managed based on evidence of their location, condition and contribution to reducing flood risk.
  • Information: An AM system will steer the collection of relevant data and develop improved risk information for investment decision making.
  • Consistency: There will be a consistent approach to flood risk management at the national or regional level, providing more consistent protection across the country or region, and bringing efficiencies and opportunities in terms of capacity development.
In the context of these principles, the objective of this paper is to analyse improvements in the maturity of AM approaches for flood protection infrastructure within the partner organisations of the Interreg NSR project FAIR (Flood defense infrastructure Asset management & Investment in Renovation, adaptation, optimisation and maintenance) [6]. FAIR brings together flood protection asset owners, operating authorities and researchers from across the NSR to share the policy, practice and emerging science. It aims to reduce flood risk across the NSR by developing and implementing improved approaches for AM for flood protection. Maturity is a measurement of the ability of an organization for continuous improvement in a particular discipline. Two main aspects determine the maturity of AM organisations: (i) effective and efficient technical planning and operation of assets, and (ii) the organisational arrangements in place to deliver these. These aspects have been reviewed by the FAIR partner organisations using a maturity assessment model. As a baseline, the AM approaches in use and those emerging across NSR countries were reviewed at the start of the project. Subsequently, the maturity changes throughout the FAIR project were evaluated by the partner organizations, taking into account the new insights and experiences from adopting the FAIR framework. This framework defines three ‘planning and decision contexts’ to consider the comprehensiveness of approaches to AM (as outlined below, Figure 1).

2. A Maturity Assessment Model for Asset Management of Flood Protection Infrastructure

2.1. Maturity Assessment Models

Maturity assessment models provide a structured approach to help to assess the effectiveness by which asset owners have and are implementing AM approaches [7]. In the FAIR project, the maturity assessment has helped asset owners consider best practices and competencies for AM and to understand the need for and effectiveness of the AM processes they use. A maturity assessment model has been used based on a set of structured guidelines as to how different dimensions and/or processes of, and in, an organisation are able to contribute to a set of predetermined organisational outcomes. Volker et al. [8] reviewed the use of maturity models in the context of AM. They concluded that there are various types of models, but most were optimised for other domains and therefore unsuitable for public infrastructure management. Nevertheless, the maturity assessment concept has evolved from an appraisal method for software processes [9] to being widely used across a range of areas, including for infrastructure AM [7,10,11,12].
The purpose of using a maturity model is to assess the capability, strengths and weaknesses of an organisation in relation to their intended goals [13]. This also allows the organisation to understand the potential for improvements in existing processes. A key assumption behind the original maturity model as developed by Paulk et al. [9] is that organisations’ processes need to be predictable, effective and in control, in order to develop into a mature organisation. The model utilises a theoretical continuum along which maturity can be considered incrementally over five levels, defined by Williams et al. [14]:
  • Optimised: The organisation is “best practice,” capable of learning and adapting itself. It not only uses experience to correct any problems, but also uses experience to change its operation procedures.
  • Well managed: The organisation has control over its internal processes, specifies requirements and ensures that these are met through feedback.
  • Standardised: The organisation can say what it does and how it goes about it.
  • Repeatable: The organisation can repeat what it has done before but not necessarily define what it does.
  • Ad hoc: The organisation has limited experience and is at a learning and development stage.
While almost all maturity assessments use the five levels defined above, various maturity models vary considerably in the dimensions and processes considered. However, here, a modified form of these has been used to rank the various dimensions and/or process attributes relevant to flood asset management of the organisations involved in FAIR.

2.2. The Infrastructure Management Maturity Matrix (IM3)

A comparative study by Mahmood et al. [15] has shown that most of the maturity models for infrastructure assets display a weakness of tending to focus on the operational and technical context, while neglecting the strategic context in terms of governance, policy, and strategy. Moreover, the models lack association with the processes related to human and social issues, such as communication, trust building and team-enabling activities. The maturity model Infrastructure Management Maturity Matrix (IM3) was developed by Volker et al. [7] to fill these gaps, and has been modified for use in the FAIR project—though alternative models have been developed (e.g., Chemweno et al. [16]; Laue et al. [11]). IM3 was originally developed for Rijkswaterstaat, which is the Netherlands public infrastructure provider and the lead organisation for the project. This model was chosen because it has been specifically developed for the organisational aspects of managing public (highway) infrastructure. Compared with alternative maturity models, IM3 has a stronger focus on the inclusion of stakeholders and communication issues. Outsourcing activities have also been added as a dimension, because of the importance of procurement and contracting for the delivery of public infrastructure.
The IM3 is a two-dimensional matrix consisting of seven dimensions which are ranked using the five (high-level) maturity levels outlined in Section 2.1. An overview of all seven dimensions is shown in the first column in Table 1. More detailed descriptions of the criteria used to assess the maturity on all dimensions are given by Volker et al. [7]. For example, at the lowest level of the Internal Co-ordination dimension (3), there is a distinguishable ‘horizontal coordination’ within one regional division for the planning and execution of operational activities in one regional area. Contrastingly, effective horizontal co-ordination between the national agency and regional divisions in system planning and budget allocation is scored highly.

2.3. A Maturity Matrix Including AM Processes and Strategies

The FAIR project has uniquely defined three ‘planning and decision contexts’ to consider the comprehensiveness of the approaches to AM, including the processes for AM and AM planning (Figure 1): 1. Strategic (corporate and long-term view); 2. Tactical (ensuring effective interconnections between strategic and operational); 3. Operational (a focus on day-to-day asset operation and maintenance). The need to consider the strategic and operational contexts for AM has been a recurrent theme in various national programmes and projects in this Century. These have been used variously in flood-integrated AM (e.g., Defra/EA, 2004; EA, 2009, and Sayers et al. [17]) and in water and wastewater AM (e.g., Marlow and Burn [18]; Ward, 2015 [19]). The TRUST (Transition to Sustainable Urban Water Services of Tomorrow) project (Alegre and Covas, [20]) developed a framework that covers a three-dimensional matrix, including the three FAIR planning and decision contexts, together with three dimensions of analysis: cost, risk and performance, and three competencies: information, engineering and management, creating a 27 factor matrix. Each factor can be assessed for individual assets, or for a system/network for both present conditions and for future scenarios. In the context of FAIR, these need to be included in all three contexts (strategic, operational and tactical), alongside the competences of the owner/operator: information, engineering and management, Table 1 (illustrated by Alegre et al. [21]).
The linkages between the AM processes in the strategic, tactical and operational context are illustrated as a framework in Figure 1. This shows the essential processes of AM, as defined by the FAIR partners (building upon Sayers et al. [17]; Sharp et al. [22]; Klerk and den Heijer [23]). The framework shows the strategic components: (1) assessing the performance of the network as passed on from the operational context; (2) identifying threats and opportunities; (3) setting objectives and requirements; (4) identifying and analysing measures for the AM system; (5) developing an adaptive plan. These components inform the operational processes, which are: (A) identifying and analysing measures for individual assets and groups; (B) designing and constructing; (C) monitoring and maintaining; (D) assessing the performance of individual assets and groups. In turn, feedback from the operational context informs the strategic processes, initially from the network performance assessment. This creates a continuous process through the ongoing interconnection between (mainly) short-term operations and (mainly) long-term strategy via a ‘tactical handshake’. This process is explained below:
  • Strategic loop—the why and what? It establishes the strategy and consequential long-term planning processes using an overall integrated system perspective from understanding threats, asset operational effectiveness, responsive policy, standards and processes for interactions within flood protection asset systems and beyond the flood risk domain. It develops investment priorities to balance cost, risk and performance from an understanding of the flood risks, the opportunities associated with alternative strategies, objectives and functional requirements, and from the performance of alternative adaptation measures necessary to achieve these.
  • Tactical handshake—the when, where and what order? It aims to sustain the interconnectivity between the strategic and operational contexts, providing a means for two-way information and knowledge transfer, especially about individual asset performance in the context of overall system performance, and how best to create or modify assets so that these provide the expected service by being adaptable and reliable. It ensures that the developed strategic objectives inform the adaptive prioritisation and planning for individual and asset systems.
  • Operational loop—the how? Its aim is to operate the assets and maintain service in compliance with strategy, by ensuring functioning through the assessment of the performance (reliability) from monitoring, based on the knowledge gained from the information collected. Where and when necessary, modify, design and construct adaptations to existing and new assets in conformity with, and as informed from, the overall strategic planning context.
The FAIR project has identified that there are often gaps between the strategic and operational contexts in AM for flood protection (as has Alegre et al. [21]., for water assets). The strategic and operational contexts often function largely independently of one another, with separate players, agencies or departments overlooking (or not properly accounting for) their interdependency and interconnectedness. The tactical ‘handshake’ has therefore been defined in FAIR to ensure that appropriate connections are in place. The original IM3 by Volker et al. [7] did not sufficiently encompass the processes/strategies of AM for the operational, tactical and strategic contexts in FAIR and has therefore been uniquely interpreted for use in FAIR to include these planning and decision contexts (with the seven dimensions shown in Table 1).
More details on the way in which the 5-point scale in Section 2.1 links to the seven maturity dimensions in Table 1 and also to the 3-fold decision contexts in Figure 1 of the FAIR framework are provided in the Supplementary Materials.

3. Data Collection and Analysis

The FAIR project brought together the major flood risk asset owners in the NSR, including: Rijkswaterstaat, under the Ministry of Infrastructure and Water Management (NL), the Regional Water Authority Schieland and the Krimpenerwaard (NL), the County Administrative Board of Skane (SE), Danish Coastal Authority (DK), the Agency of Roads, Bridges and Waters, under the Ministry of Economy, Traffic and Innovation of the City of Hamburg (DE), and the Agency for Maritime and Coastal Services, under the Flemish Ministry of Mobility and Public Works (BE) (FAIR, 2020). These organisations own or operate assets, plan investments and/or set policies. They brought pilot cases into the FAIR project, including from the respective national or regional investment programmes as well as specific assets for renovation or adaptation. The asset owners collaborated with the FAIR scientific team who brought expertise on AM and recent innovative approaches.
The baseline information on AM maturity was collated through a self-assessment by each of the asset owners. The self-assessment was carried out using the updated IM3 structure, which includes maturity matrices for both the organisational dimensions and the processes/strategies of asset management (Table 1). Prior to the self-assessment, the descriptions for the maturity levels in the matrices were reviewed by the asset owners in a technical workshop. This review had a dual purpose. It helped to uncover the difficulties that the asset owners experienced in using the matrices and interpreting the maturity levels. It also served to improve the descriptions for the maturity levels, based on the (evolved) understanding of the meaning behind the levels. For example, regarding the dimension ‘outsourcing activities’, the description of the highest level was updated from “execution is wholly outsourced to private parties” to “a combination of internal expertise … with some activities and assets outsourced where necessary”. This was seen as a better fit with the current best practice.
Two maturity self-assessments were carried out to track whether or not there had been any changes in the maturity of each of the organisations during the FAIR project: the first, a baseline, in Summer 2017, and a second in September 2019, in the last year of the project. The self-assessments were carried out by each organization in an interactive session with 3 to 5 employees in various mid to higher management roles, such as strategic advisors, programme managers and/or operational managers. The sessions lasted 1 to 1.5 h. The participation of employees from various roles was important from the perspective of shared responsibility for AM.
The self-assessment for the ‘planning and decision contexts’ was performed by all the asset owners involved from each of the NSR countries together. This focus was adopted to reflect the shared responsibility for the implementation of AM between different asset owners. In the Netherlands, for example, the Regional Water Authorities are mostly involved with AM at the tactical and operational context, and less with strategic AM.
The results of the interactive session were reported (using Google Forms) as the consensus maturity levels, along with practical examples to support the judgement of maturity. This information was collated by the scientific team and translated into illustrations, including spider diagrams. In a further technical workshop, the results of the self-assessment of maturity were analysed and compared by the asset owners and scientific team. This served as a validation step to ensure consistency in the interpretation of the maturity levels and in the judgements on maturity. This led to some minor adjustments in maturity levels for some asset owners. This validation step also highlighted the pitfall around asset owners ‘not knowing that they did not know’, i.e., exposing knowledge needs that were essential for effective AM. To avoid this pitfall, it was agreed to keep the option open for asset owners to adjust their own baseline in the years to come (that is, in hindsight).
In the second round of the maturity analysis, the asset owners had the option to adjust the original baseline level assessments where they had a better view of the maturity they had in the beginning of the project, i.e., hindsight adjustments. Two asset owners retrospectively modified their baseline maturity at this stage, and the revisions are used in this paper.

4. Results of The Maturity Analysis

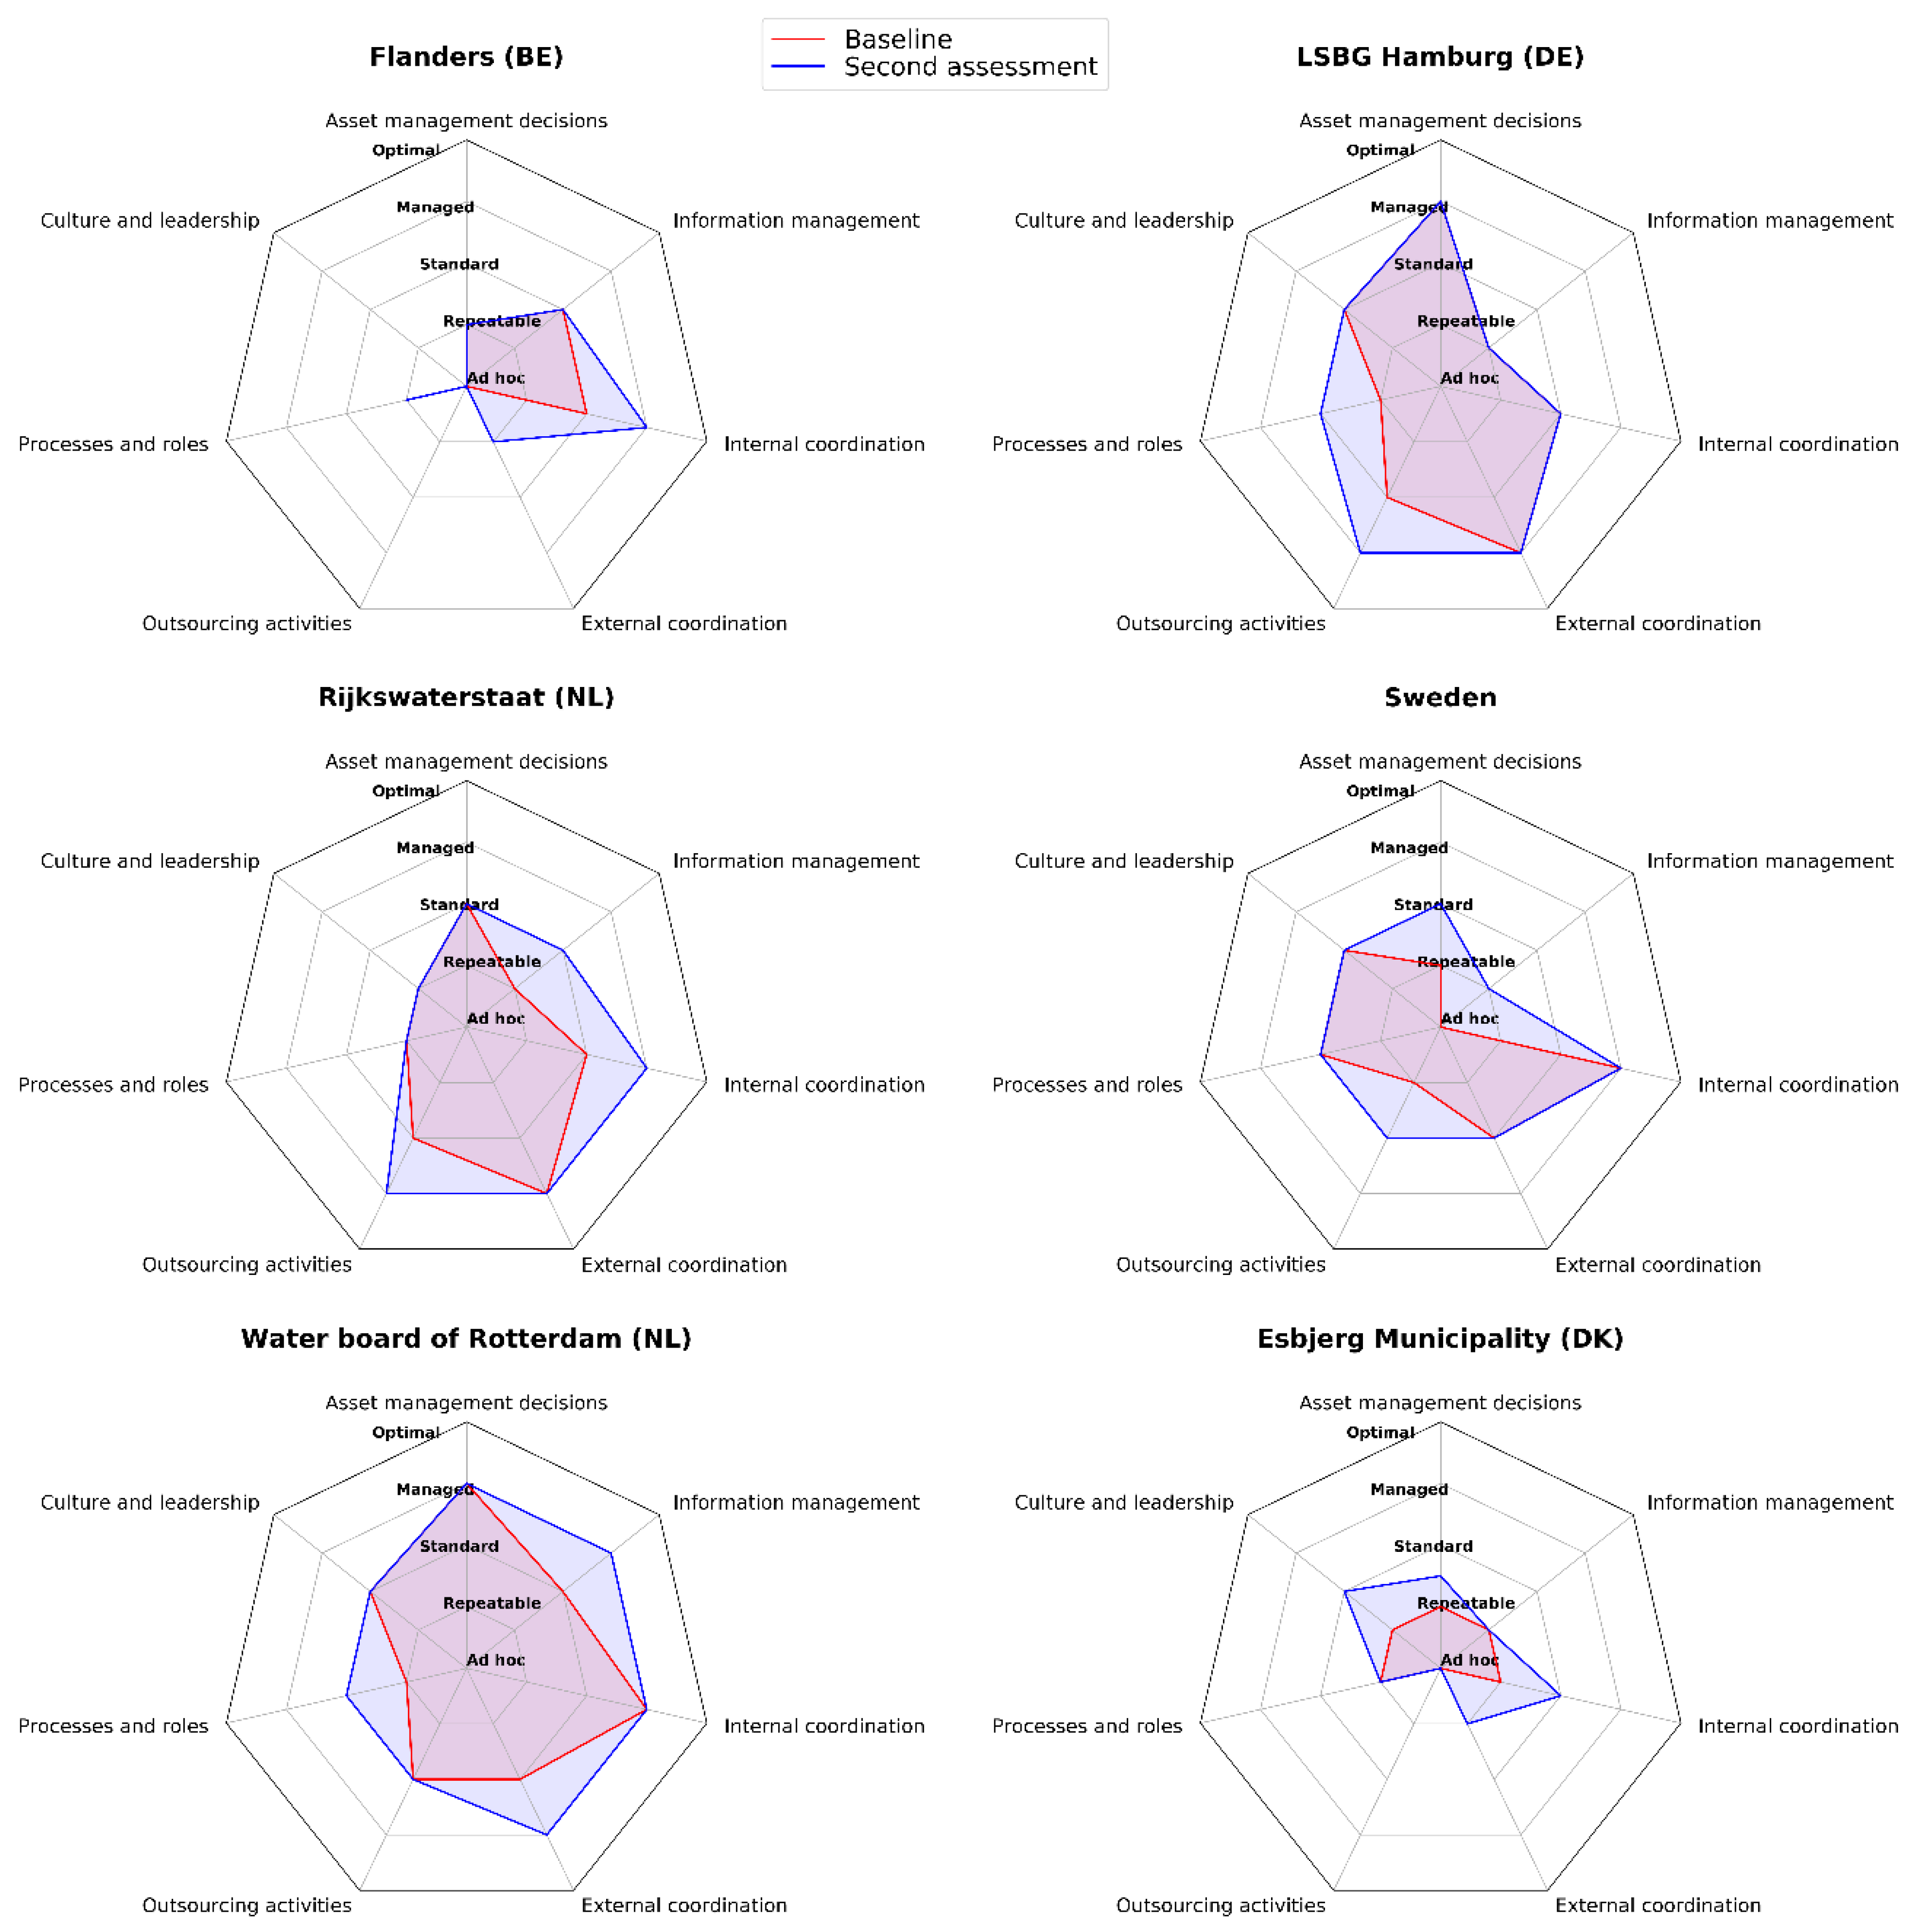
4.1. Organizational Maturity

Figure 2 shows the results of the organisational part of the self-assessment in spider diagrams, for Esbjerg Municipality (DK), LSBG Hamburg (DE), Rijkswaterstaat (NL), Regional Water Authority of Schieland en de Krimpenerwaard (NL), Agency for Maritime and Coastal Services (BE) and Helsingborg Municipality (SE). The self-assessment used seven dimensions, as explained in Section 2.2 (Table 1), and shows the maturity improvements for each dimension from the initial to the final assessment at the end of the FAIR project. The size of the colored areas indicates the overall maturity of an organization, with increasing maturity levels shown by lines emanating further from the centre of the spider charts.
At the end of the project, none of the partner organisations believed that they were fully mature in their AM processes, although each of them improved their overall maturity for at least three of the seven dimensions during FAIR. The organisations indicated that new insights from FAIR were central to some of the improvements, but that other factors (other projects, general development) also contributed to progress towards more mature AM.
Overall, the self-assessment results highlight clear differences in the overall perceived maturity of the different organisations. Esbjerg Municipality (DK) and the Agency for Maritime and Coastal Services (BE) assessed the lowest overall maturity, both at the start and towards the end of the FAIR project. Esbjerg Municipality (DK) perceived themselves less than standard on all dimensions at the start of the project, but improved to standard on ‘internal communication’, ‘culture and leadership’ and ‘external coordination’ during the project. LSBG Hamburg (DE) and Regional Water Authority of Schieland en de Krimpenerwaard (NL) have the highest overall perceived maturity levels. They ranked themselves as managed on three and four dimensions, respectively, at the end of the project. Only Helsingborg Municipality (SE) and Esbjerg Municipality (DK) perceived an increasing level in how asset management decisions were developing.
The maturity improvements for the Dutch partners (Rijkswaterstaat and HHSK) were reportedly the result of innovative FAIR insights, specifically on ‘information management’ and ‘external coordination’. The shift to a system-wide and strategic perspective, from a mono-perspective during FAIR, is illustrated by the changes to the planned investments in dike reinforcement by the Water Board, and investments in the approach to the Flood Protection Hollandse IJssel storm surge barrier by Rijkswaterstaat (see FAIR, [6] for more details). This shift to a system perspective gave a higher rating for external co-ordination by the HHSK between the start and end of the project.
Other improvements in self-assessments were due to a number of factors, examples are:
  • Belgium (Flanders)—Implementation of ISO (International Organization for Standardization) standards for AM; more co-ordination due to management change (leadership); investment management system implemented (government wide);
  • Sweden—More clarity of the indicators delivered, and a clearer view of the problems; the analytical report on the Helsingborg case example has helped understand the details and costs; greater openness to innovation on the part of the organisation to the ideas of the specialist consultants.

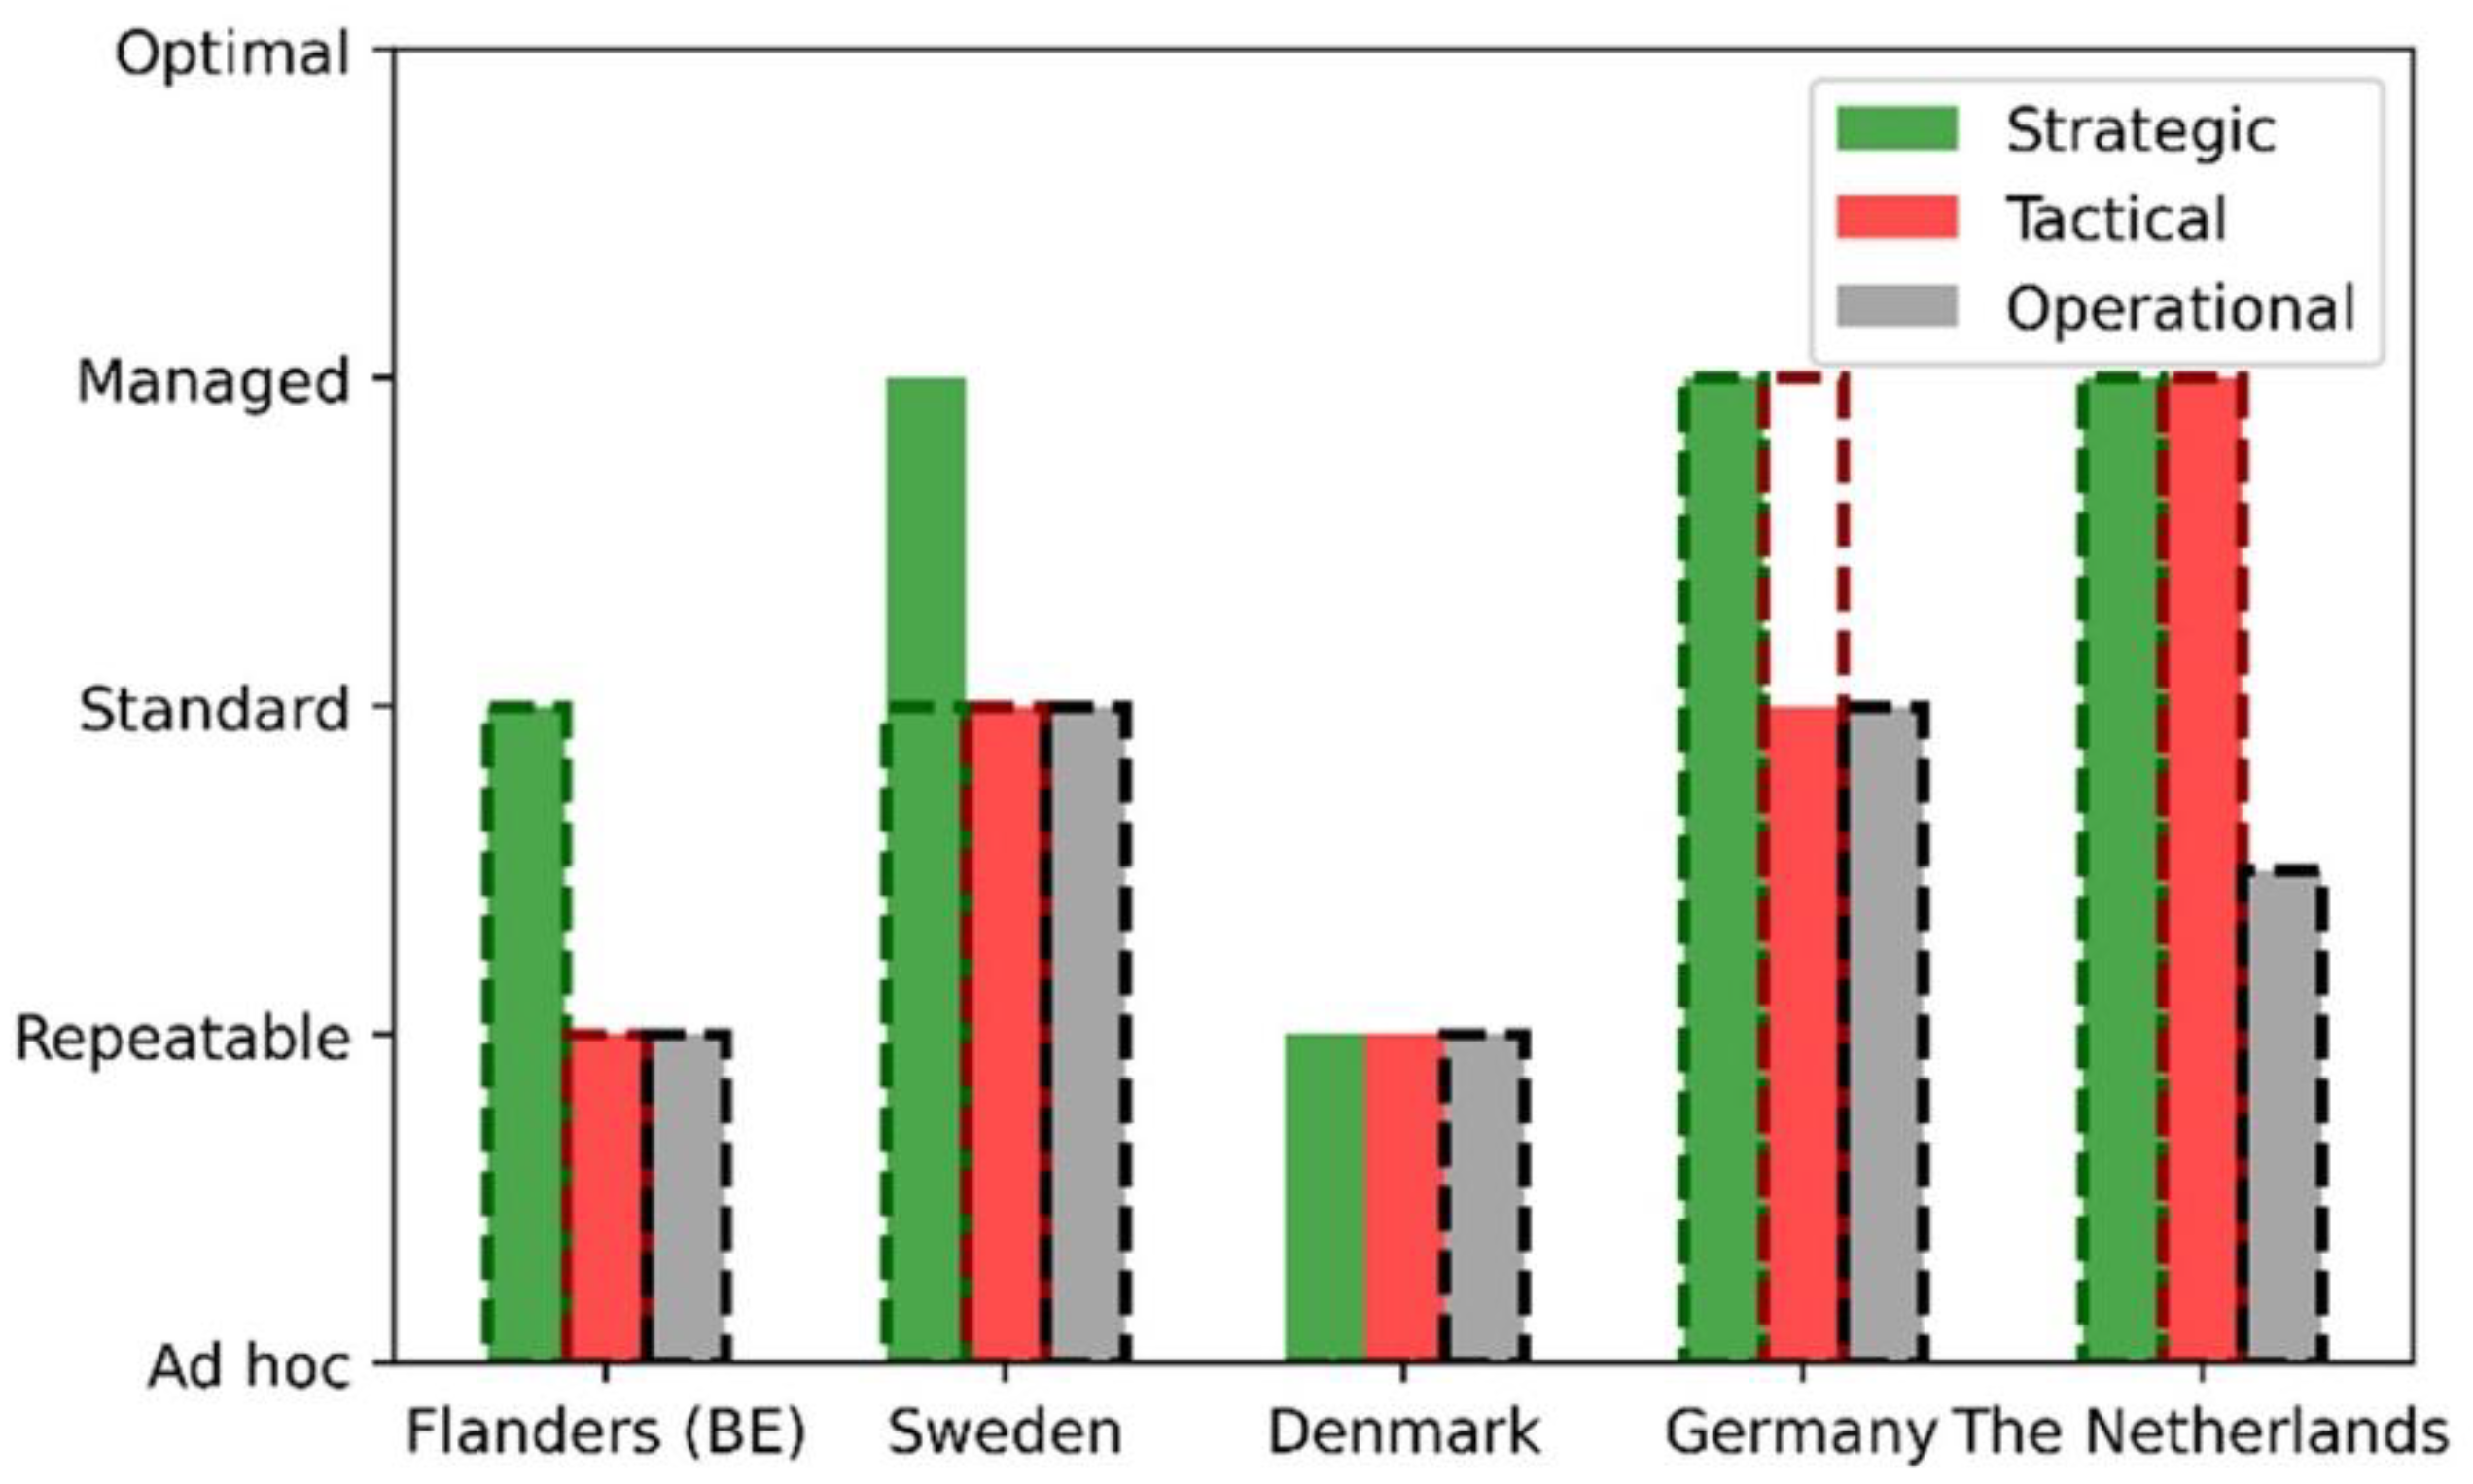
4.2. Planning and Decision Contexts

In Figure 3, the results of the self-assessment are shown for the three ‘planning and decision contexts’, as explained in Section 2.3. Moreover, the approach to flood AM differs between the partners, with the exception of Esbjerg Municipality, showing a higher perceived maturity for the strategic than for the operational context. Overall, only two of the five organisations indicated an improvement of maturity from the start (dashed lines) to the end (solid bars) of the project. Nevertheless, all improvements were made to the strategic (Helsingborg and Esbjerg) or tactical (Esbjerg) contexts. Furthermore, a decline in perceived maturity was observed for Hamburg for the tactical context. However, Hamburg and Rijskswaterstaat still have the highest maturity for the strategic and tactical contexts. This can explain their high scores for the asset management decisions as seen from Figure 2.
In the self-assessment, two of the FAIR partners distinguished the maturity levels between contexts. These assessed the operational context as being at a lower level than the strategic and tactical contexts. Rijkswaterstaat and Hamburg scored themselves as more mature for the strategic and tactical contexts than did the other partners. For the organisational dimensions, the asset owners from Rijkswaterstaat and Hamburg have the same perspective on decision making and external co-ordination.
For Hamburg, the high scores in the self-assessment can be interpreted in relation to the experience with the capital strategic programme of the City of Hamburg on heightening and enforcing the dike line along the river Elbe (in total 103 km). This programme has been systematically implemented at the flood protection assets since 1962, when the City of Hamburg experienced the major storm surge event, which caused a substantial rethinking of the existing flood management practices and triggered the development of long-term flood protection strategies. The existing dike line contains an array of automated flood protection gates, which requires a high level of co-ordination of the operational activities, which are clearly defined and implemented.
Within the FAIR Project, Hamburg aimed at bridging the gap between the strategic and operational contexts and therefore reports the improved maturity in the tactical context by the end of the project (Figure 3). In order to bridge this gap, the FAIR partner and the asset owner has concluded a specific agreement between planning, construction and maintenance units. This agreement regulates the co-operation between affected parties and describes a way in which all sides benefit—in a form that is standardised for all flood protection facilities.

5. Discussion on Improvement Potential

The results of the maturity analysis are based on a self-assessment. This has strengths and weaknesses in determining how best to improve organisational AM processes within an organisation and between those organisations with responsibility for flood risk management. The self-assessment, by definition, reflects the perception of maturity—a perception that may or may not reflect reality. In fact, the well-known “The Dunning-Kruger Effect” informs that sometimes self-assessments, particularly at the early stages of maturity, can make individuals overestimate their abilities and skills (Schlösser et al. [24]). While the focus of the current self-assessment were organizations as opposed to individuals, still similar shortcomings come into play as the assessments are done by individuals. In fact, there were several occasions where the respondents adjusted their baseline assessments at the second round, illustrating this point. This also indicates a strength of the self-assessment approach: apart from being a metric, the assessment process also acts as a learning event, providing an opportunity for the respondents to reflect and learn about the maturity of their own organizations. This is further enhanced by (a) opportunities to brainstorm across organizations as the sessions were organized in the same physical space with plenary discussions, and (b) sessions were also facilitated by the knowledge partners, who interacted with the respondents. The key strength of the maturity analysis is in the potential to drive improvements to AM in an organisation or across the various institutions engaged in flood risk management within a given jurisdiction. Therefore, the results shown here should not be interpreted as a comparison between organizations or countries (assuming the FAIR partner is representative); although this may be useful in highlighting differences in AM practice, it is not an assessment of who is better than whom. The maturity assessment enables organizations to highlight areas of potential complacency when shared across the organization (where the self-assessment may overstate maturity), as well as highlighting those areas of AM that are perceived to be less developed and therefore a focus for improvement. This includes how effective various parts of one organisation are in working together, or how effective the processes are across the various organisations with some responsibilities for flood AM. The best use of maturity self-assessment is as a longitudinal assessment tool for a specific organization.
The maturity assessment has exposed several common challenges that may need to be improved within an organisation for effective and adaptive AM. The need to: (i) better link strategic and operational planning; (ii) more effectively share asset information; and (iii) better co-ordinate with other internal or external organisations to deliver multi-functional assets and multi-beneficial AM activities.
Various methods and tools have emerged to help address these challenges (e.g., Environment Agency [25]; Klerk and Den Heijer [23]). These recognize the need to prioritise limited resources and take account of present and future uncertainties, but, to provide meaningful support to AM, any methods and tools used must be (adapted from Sayers et al. [17]):
  • Systems-based—Recognise that flood defence assets behave as a system, as it is the performance of the asset system as a whole (and not necessarily the performance of an individual asset) as the system responds under a wide range of loading;
  • Evidence-based—Recognise the need for transparent and auditable/challengeable evidence. Central to this is formally acknowledging uncertainty in the asset data and the associated analysis (in credible and meaningful terms);
  • Hierarchical—Decisions can never be based on perfect/complete information and the FAIR framework (Figure 1) includes different decision contexts. Allowing for progressive refinement of the data and analysis to reflect the demands of the decision at hand (being just sufficient to ensure a robust choice and one that further refinement would not alter) is central to developing an efficient AM process and ensuring an effective ‘handshake’ between strategy and operation;
  • Wide ranging—Effective flood risk management needs to be set in the context of the portfolio of measures required to deliver multi-layers of safety (Gersonius et al. [26]). Fixed and operational flood protection assets must be seen as only one, albeit important, component of a wider flood risk management strategy (where structural and non-structural measures act in concert to manage flood risk, meaning that the response of one asset can compensate for another where the response is inadequate).

6. Conclusions

Maturity assessment models can provide a structured approach to help to assess the effectiveness by which asset owners have and are implementing AM approaches. This paper has introduced the use of a modified asset management (AM) maturity assessment (IM3), uniquely interpreted for use by flood protection infrastructure owners and operators. The matrix has been used by the six asset operating partners to self-assess the maturity changes in their organisational approach to adaptive asset management at the start and again at the end of the Interreg IV North Sea Region FAIR project. Maturity levels were determined for the six organizations in the context of the FAIR framework using a five-fold scoring system and seven dimensions: (1) asset management decisions; (2) information management; (3) internal co-ordination; (4) external co-ordination; (5) outsourcing activities; (6) processes and roles; and (7) culture and leadership. The maturity assessment process encouraged self-reflection within the organizations, as shown by some of the organizations retrospectively adjusting their baseline maturities after two years of progress (e.g., the Regional Water Authority of Schieland en de Krimpenerwaard).
The unique maturity assessment showed that there were clear differences in the approaches being used for flood AM between each of the FAIR organisations from the baseline maturity assessment at the start of the project. FAIR created a unique opportunity for co-learning and knowledge exchange between the partner organisations, helping to collectively identify the challenges and also the key components of adaptive AM for optimising the details of, and AM process for, flood protection infrastructure. Between the baseline assessment and the second assessment, all six asset owner organisations perceived an overall improvement in maturity for at least two of the seven dimensions. These improvements were, in part, attributable to the development and utilisation of the FAIR framework (Figure 1) by the partner organisations. The framework connects the strategic, tactical and operational contexts of AM and, therefore, ensures that decisions are made using a long-term and whole system perspective. For example, the collaboration between the Regional Water Authority of Schieland en de Krimpenerwaard and Rijkswaterstaat on the Hollandsche IJssel storm surge barrier (adopting a whole system perspective) resulted in maturity improvements for both organisations.

Supplementary Materials

The following are available online at https://www.mdpi.com/2412-3811/5/12/112/s1, Table S1: The 5-point scale and the 7 maturity indicators of Volker et al. (2013) as used in FAIR, Table S2: The 5-point maturity levels and definitions linked to the 3 decision contexts in the FAIR framework.

Author Contributions

Conceptualization, B.G., P.S. and J.R.; methodology, B.G., F.d.H. and W.J.K.; writing—original draft preparation, B.G.; writing—review and editing, A.P., N.M. and R.M.A.; visualization, B.G. and W.J.K.; project lead, B.V.; funding acquisition, B.V. All authors have read and agreed to the published version of the manuscript.

Funding

This research was funded by North Sea Region Programme 2014–2020, through the FAIR Project.

Conflicts of Interest

The authors declare no conflict of interest

References

  1. National Flood and Coastal Erosion Risk Management Strategy for England. Available online: https://www.gov.uk/government/publications/national-flood-and-coastal-erosion-risk-management-strategy-for-england--2?utm_source=b4eee61e-0967-4dba-8ee4-5b15f40e6bc8&utm_medium=email&utm_campaign=govuk-notifications&utm_content=immediate (accessed on 8 December 2020).
  2. Jorissen, R.; Kraaij, E.; Tromp, E. Dutch flood protection policy and measures based on risk assessment. E3S Web Conf. 2016, 7, 20016. [Google Scholar] [CrossRef] [Green Version]
  3. Rijke, J.; Ashley, R.; Gersonius, B.; Sakic, R. Adaptation Mainstreaming for Achieving Flood Resilience in Cities; Cooperative Research Centre for Water Sensitive Cities: Melbourne, Australia, 2016. [Google Scholar]
  4. Alves, H. Co-creation and innovation in public services. Serv. Ind. J. 2013, 33, 671–682. [Google Scholar] [CrossRef]
  5. Sayers, P.B.; Simm, J.D.; Wallis, M.; Buijs, F.; Flikweert, J.; Hamer, B. Developing a performance—based management system for flood and coastal defence assets. In Proceedings of the 41st Defra Flood and Coastal Management Conference, York, UK, 4–6 July 2006. [Google Scholar]
  6. FAIR. 2020. Available online: https://northsearegion.eu/fair/ (accessed on 8 December 2020).
  7. Volker, L.; Ligtvoet, A.; Van Den Boomen, M.; Wessels, L.P.; Van Der Velde, J.; Van Der Lei, T.E.; Herder, P.M. Asset management maturity in public infrastructure: The case of Rijkswaterstaat. Int. J. Strateg. Eng. Asset Manag. 2013, 1, 439–453. [Google Scholar] [CrossRef]
  8. Volker, L.; Van Der Lei, T.; Ligtvoet, A. Developing a maturity model for infrastructural asset management systems. In Proceedings of the Conference on Applied Infrastructure Research, Berlin, Germany, 7–8 October 2011; pp. 7–8. [Google Scholar]
  9. Paulk, M. Capability Maturity Model for Software. Encyclopedia of Software Engineering; Software Engineering Institute, Carnegie Mellon University: Pittsburgh, PA, USA, 1993. [Google Scholar]
  10. Feunekes, U.; Palmer, S.; Feunekes, A.; Macnaughton, J.; Cunningham, J.; Mathisen, K. Taking the politics out of paving: Achieving transportation asset management excellence through OR. Interfaces 2011, 41, 51–65. [Google Scholar] [CrossRef]
  11. Laue, M.; Brown, K.; Scherrer, P.; Keast, R. Integrated strategic asset management: Frameworks and dimensions. In Infranomics; Springer: Cham, Switzerland, 2014. [Google Scholar]
  12. Winter, C.-P.; Fabry, C. Closing the implementation gap for SMEs-tools for enabling asset management in small and medium enterprises. In Asset Management; Springer: Heidelberg, Germany, 2012. [Google Scholar]
  13. Hillson, D. Assessing organisational project management capability. J. Facil. Manag. 2003, 2, 298–311. [Google Scholar] [CrossRef]
  14. Williams, K.; Robertson, N.; Haritonov, R.C.; Strutt, J. Reliability capability evaluation and improvement strategies for subsea equipment suppliers. Underw. Technol. 2003, 25, 165–173. [Google Scholar] [CrossRef]
  15. Mahmood, M.N.; Dhakal, S.P.; Wiewiora, A.; Keast, R.; Brown, K. Towards an integrated maturity model of asset management capabilities. In Proceedings of the 7th World Congress on Engineering Asset Management (WCEAM 2012), Daejeon City, Korea, 8–9 October 2012; Springer: Heidelberg, Germany, 2015; pp. 431–441. [Google Scholar]
  16. Chemweno, P.; Pintelon, L.; Horenbeek, A.V.; Muchiri, P.N. Asset maintenance maturity model: Structured guide to maintenance process maturity. Int. J. Strateg. Eng. Asset Manag. 2015, 2, 119–135. [Google Scholar] [CrossRef]
  17. Sayers, P.B.; Wallis, M.; Simm, J.D.; Baxter, G.; Andryszewski, T. Towards the Next Generation of Risk-Based Asset Management Tools; Pender, G., Flaukner, H., Eds.; Blackwell Publishing Ltd.: Oxford, UK, 2011. [Google Scholar]
  18. Marlow, D.R.; Burn, S. Effective use of condition assessment within asset management. J. Am. Water Works Assoc. 2008, 100, 54–63. [Google Scholar] [CrossRef]
  19. Ward, B. Integrated Asset Management Systems for Water Infrastructure. Doctor Thesis, University of Exeter, Exeter, UK, 2015. [Google Scholar]
  20. Alegre, H.; Covas, D. Integrated Planning of Urban Water Services: A Global Approach. TRUST Manual of Best Practice. 2015. Available online: https://riunet.upv.es/handle/10251/53758 (accessed on 2 December 2020).
  21. Alegre, H.; Coelho, S.T.; Vitorino, D.; Covas, D. Infrastructure asset management—The TRUST approach and professional tools. Water Sci. Technol. Supply 2016, 16, 1122–1131. [Google Scholar] [CrossRef]
  22. Sharp, M.; Wallis, M.; Deniaud, F.; Hersch-Burdick, R.; Tourment, R.; Matheu, E.; Seda-Sanabria, Y.; Wersching, S.; Veylon, G.; Durand, E. The International Levee Handbook; CIRIA: London, UK, 2013. [Google Scholar]
  23. Klerk, W.; Den Heijer, F. A framework for life-cycle management of public infrastructure. Life-Cycle of Engineering Systems: Emphasis on Sustainable Civil Infrastructure. In Proceedings of the Fifth International Symposium on LifeCycle Civil Engineering (IALCCE 2016), Delft, The Netherlands, 16–19 October 2016; CRC Press: Boca Raton, FL, USA, 2016; p. 101. [Google Scholar]
  24. Schlösser, T.; Dunning, D.; Johnson, K.L.; Kruger, J. How unaware are the unskilled? Empirical tests of the “signal extraction” counterexplanation for the Dunning–Kruger effect in self-evaluation of performance. J. Econ. Psychol. 2013, 39, 85–100. [Google Scholar] [CrossRef]
  25. Environment Agency. PAMS (Performance-Based Asset Management System)—Phase2, Outcome Summary Report. Flood and Coastal Defence R&D Programme Science Report SC040018/SR1; Environment Agency: Bristol, UK, 2010; In Press.
  26. Gersonius, B.; Van Buuren, A.; Zethof, M.; Kelder, E. Resilient flood risk strategies: Institutional preconditions for implementation. Ecol. Soc. 2016, 21, 28. [Google Scholar] [CrossRef] [Green Version]
Figure 1. FAIR framework, linking strategic and operational asset management through a tactical handshake.
Infrastructures 05 00112 g001
Figure 2. Results of the self-assessment of maturity across seven organizational dimensions during the FAIR project.
Infrastructures 05 00112 g002
Figure 3. Results of the asset owners perceived maturity for the strategic, tactical and operational context at the start of the project (dashed lines) and towards the end (solid bars).
Infrastructures 05 00112 g003
Table 1. Organisational dimensions used in the FAIR maturity assessment.
Maturity Dimensions
(Interpreted for FAIR Application from Volker et al., 2013)
Correspondence with Organisational Competencies (Alegre et al., 2016)
DescriptionInformationEngineeringManagement
1. Asset management decisionsThe use of risk management methods and life-cycle (LC) approaches in decisions at strategic and operational AM contexts.
2. Information managementThe availability and use of (standardised) static and dynamic data-bases for decision-making
3. Internal co-ordinationCo-ordination and problem solving between the different departments of the organization
4. External co-ordinationCo-ordination and problem solving between the different stakeholders of a project, including communication with users
5. Outsourcing activitiesStrategy about and implementation of integrated and performance-based contracting and innovative procurement methods
6. Processes and rolesClarity, definition and implementation of job responsibilities and roles within the organisation
7. Culture and leadershipLevel of knowledge, implementation and support of AM related issues
Publisher’s Note: MDPI stays neutral with regard to jurisdictional claims in published maps and institutional affiliations.

