Article

Design Corrections in Spanish Office Buildings to Improve Energy Efficiency in the Face of Climate Change

by
José A. Orosa
1,*,
Diego Vergara
2,
Feliciano Fraguela
1 and
Pablo Fernández-Arias
2
1
Department of N. S. and Marine Engineering, Universidade da Coruña, Paseo de Ronda, 51, 15011 A Coruña, Spain
2
Department of Mechanical Engineering, Catholic University of Ávila, C/Canteros, s/n, 05005 Avila, Spain
*
Author to whom correspondence should be addressed.
Submission received: 19 November 2020 / Revised: 10 December 2020 / Accepted: 11 December 2020 / Published: 13 December 2020

Abstract

:
The majority of buildings in Europe are at present naturally ventilated and do not use heating or cooling equipment throughout the summer. However, this idea is changing and as a result heating ventilation air conditioning (HVAC) related energy consumption has been rising in the recent years. On the other hand, predictions published by the intergovernmental Panel on Climate Change (IPCC) indicate an annual warming rate ranging between 0.1 and 0.4 °C. In the present study, the ISO 13790:2011 standard has been employed to analyze the effect of building design corrections over the energy saving of a real building during its mean life and under climatic change predictions. In this sense, the effect of climate change, ventilation rate and its energetic and carbon dioxide emissions implications are obtained for the next 15 years. The results obtained indicate that an increment in the air changes by natural ventilation will be more effective than changing the wall structure and, in consequence, the thermal inertia. In particular, it was obtained that an increase of natural ventilation will always reduce the energy consumption and that this consumption will be lower with time due to an increment of an average outdoor air temperature. This modification will allow reduced cooling energy peak demands during the summer season and improve indoor ambiences in mild regions and the energy efficiency.

Graphical Abstract

1. Introduction

Most buildings in Europe are currently naturally ventilated and do not use heating or cooling equipment throughout the summer months [1]. However, this pattern is gradually changing. The global contribution of buildings towards energy consumption, both residential and commercial, has steadily increased reaching figures between 20% and 40% in developed countries, and has also exceeded the energy consumption of the other major sectors: industrial and transportation [2].
In this sense, heating, ventilation, and air conditioning (HVAC) related energy consumption has been rising in the recent years throughout Europe, principally for air conditioning during the summer months in Southern Europe. This is related to the growth in population, the increasing demand for building services, and the requirement for good comfort levels owing to the increase in the time spent in such buildings [2]. In view of this rise, one incentive of the Energy Performance Building Directive (EPBD) has been to prioritize those strategies that enhance the thermal performance of buildings during the summer period and to encourage further development of passive cooling techniques, primarily those that improve indoor climatic conditions and the microclimate around buildings [3].
At the same time, the evolution of CO2 emissions in Spain has moved away from the goal established by European Directive 2002/358/EC, 2002 [4], which ratified the Kyoto Protocol and limited the increase in greenhouse for the years 2008–2012 with respect to that of 1990. In 2006, the Spanish emissions of the six gases considered by the protocol were 48.05% higher than they were in 1990 [5]. Only in the case of SO2 have these changes been sufficient to counteract the effect of economic growth [6].
On the other hand, predictions published by the Intergovernmental Panel on Climate Change (IPCC) indicate an increase in the global average surface temperature in different scenario ranges of 1.1–2.9 °C to 2.4–6.4 °C from 1990s baseline towards the end of the 21st century [7,8]. In particular, an annual warming rate ranging between 0.1 and 0.4 °C per decade has been estimated for Southern Europe [9]. In consequence, the summers are expected to become dryer and the winters wetter [10,11]. Furthermore, an increase of the levels of summer overheating is expected inside naturally ventilated buildings, whereas additional cooling energy will be required in the case of air-conditioned buildings [12].
To analyze the effect of all these parameters on the energy consumption of buildings, the European Committee for Standardization (CEN) in collaboration with the International Organization for Standardization (ISO) developed a study which deals with the calculation methodology of energy use for space heating and cooling [13,14,15,16]. There are at least three types of building energetic analysis: (i) monthly quasi-steady state, (ii) hourly calculation method and, finally, (iii) the more complex detailed simulation procedure.
In this sense, the ISO 13790:2011 shows a calculation procedure to define the annual energy use in HVAC of buildings. In particular, this calculation considers the building heat transfer, ventilation, heat gains and the annual energy needs in accordance with the defined set point temperature.
On the other hand, the method is applicable to existing buildings and to buildings at the design stage, providing common rules for the boundary conditions and physical input data. Despite this, more procedures must be provided for more detailed simulation and, in consequence, to ensure compatibility and consistency between the application and results of the different types of methods. To achieve this objective, the EPBD has stated that the energy efficiency of buildings must be calculated in the member states considering local climate [17,18] and improving new and old calculation software resources [19]. Simulation packages must be made available in the planning process for predicting building performance in terms of energy and comfort.
However, the current industry standard weather files for building simulation are not suitable for the assessment of the potential impacts of a changing climate—in particular, summer overheating risks inside naturally ventilated buildings [10]. It is evident that a changing climate and its implications will need to be reflected in future building designs and refurbishments in form, material choice, thermal mass, and building services. To prevent a such situation, many decisions concerning long life investments need to take into account the climate change.
Nevertheless, this is not an easy task since the new infrastructure will have to be able to cope with a large range of changing climate conditions, which will make the design more difficult and the construction more expensive. Furthermore, uncertainty regarding future climate makes it impossible to directly use the output of a single climate model as the input for infrastructure design and therefore, future infrastructure should be made more robust to the possible change in climate conditions.
To solve this problem, some authors like Hallegatte [20] have proposed five methods such as selecting strategies that yield benefits even in the absence of climate change, favoring reversible and flexible options, buying safety margins in new investments, promoting soft adaptation strategies, and reducing decision time horizons.
To select the most adequate strategy among these solutions for energy saving, recent research works have focused on looking for new methodologies while taking the actual standards and case studies as reference, such as the case studies based on weather data [21,22,23], the net energy plus houses case studies [24] and the software design builder [25]. In particular, more recent research works were centered on nearly zero energy buildings (NZEB) [26], showing practical solutions at the time of decision making in energy saving in buildings based on energy rating software resources, which are based on these previous standards.
The problem is that the energetic optimization of a building design based on an iterative combination of all possibilities introduced in so complex energy rating software resources like Energy Plus makes it really difficult to define the optimal building design. At the same time, natural ventilation was requested by scientists and building engineers because of sick building syndrome and, with time, this request is becoming increasingly more important due to its health implications [27].
In accordance with previous research works, in the present study results are presented about climate change [11,22], building wall dimensions [24], internal coverings [23] natural ventilation [27], NZEB design [26], and analysis about the effect of climate change over future energy consumption and building design options to reduce it. Similar to previous works [23], particular climate change weather conditions expected for the Galician region have been employed based on previous climate change studies [10,28].
After initial works that validate the calculation procedure of the ISO 13790 standard [27], and based on previous research works about climate change prediction in the Galicia region [8], different simulations were done in accordance with different thermal inertia in wall construction and different natural ventilation rates for both summer and winter seasons in the next years. The results will show which is the better option at the time to improve indoor ambiences and energy consumption in near future weather conditions.
Finally, it is interesting to highlight that the present paper aims to show an average tendency of energy consumption for this particular geographical region. In this sense, a dynamic simulation may be more accurate but, as previous research works have shown, dynamic simulations can consider the effect of thermal inertia based on highly complex calculation procedures. At the same time, there are no previous research works about this specific region, so it can be considered of interest, and enough for an initial study, to define the average expected energy consumption for the Galicia region.

2. Materials and Methods

In accordance with previous indications, the objective of this research work is to define the expected future energy consumption and its related carbon dioxide emissions in the air conditioning of indoor ambiences. In particular, these buildings are placed in the Galicia region (northwest of Spain) and in a very humid and mild climate so, the expected increment or decrement of average temperatures and the consequences in building energy consumption must be defined to identify the expected building design corrections that may compensate accordingly. To do this, the simplified calculation procedure of the ISO 13790 standard was employed, as it is reflected in Figure 1. More in-depth detail about the employed methodology is explained in the next sections.

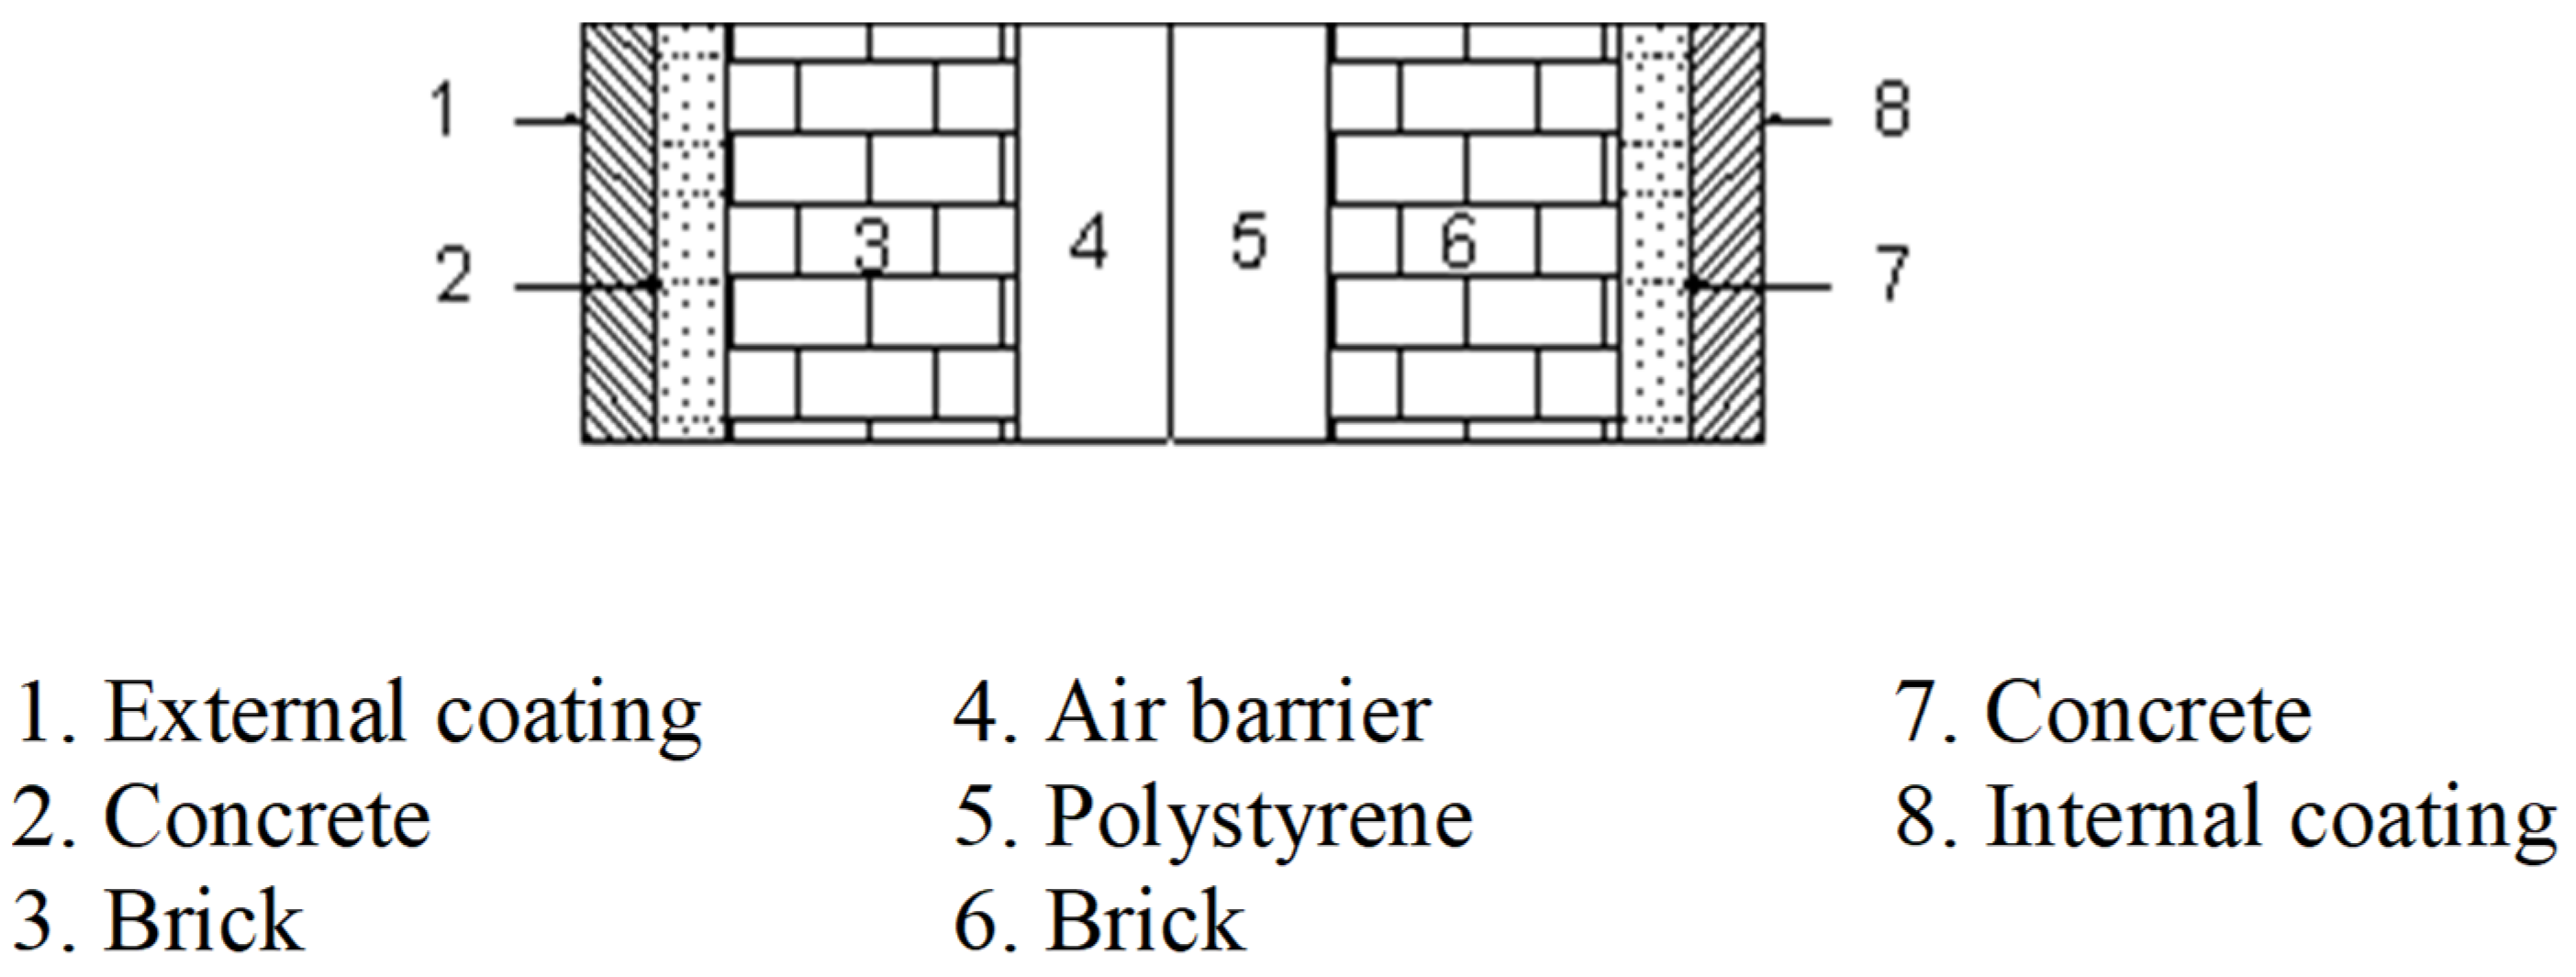
2.1. Sample and the Bulding

Temperature and humidity were measured using Tinytag Plus 2 dual channel dataloggers. The thermistor and capacitive sensors were installed to record the temperature and relative humidity values with accuracies ±0.2 °C and ±3% RH, respectively. The ventilation rate was calculated through the concentration decay method, measuring SF6 as tracer gas with a Brüel&Kjaer multi-sampler. The apparatus was equipped with a transducer to measure the temperature of the air at the point of sampling and an SF6 filter U0988 with accuracy ±0.01 ppm and single point calibration with certified calibration gas of concentration 10 ppm.
The building objective of this study is 120 m2 office building placed in the northwest of Spain, specifically in Galicia. What is more, the case study is centered in a basement oriented to the west, as it can be observed in Figure 2. The interior distribution is divided into two zones; the employee’s zone and the clients’ zone.
For simulation purposes, it is necessary to define the wall construction materials and distribution with an internal heat capacity of 150 kJ/m2 K. This distribution is reflected in Figure 3. Finally, the U value of solar protection windows is 1.8 W/m2K in accordance with the minimum requirement of the building code for windows of 1.4 W/m2 K.

2.2. Method

2.2.1. EN ISO 13790

In the present study, the general equation of energy certification of buildings has been employed, in accordance with EN ISO 13790, to define the principal design corrections to prevent future climatic change effects on energy consumption. Owing to the difficulty of repeating several instantaneous simulations, the simplified monthly method has been employed in which the heat demand of the building is defined for each calculation period, as in Equation (1):
Q H = Q L η Q G
where, Q L is the heat loss of the building, η is the utilization factor of heat gains, and Q G is the total heat gain. The ISO 13790 standard specifies similar expressions to determine the gain utilization factor for heating and cooling, as shown in Equations (2) and (3):
η G , H = 1 γ H a H 1 + γ H a H
η L , C = 1 γ C a C 1 + γ C a C
where, the heat gains and loss ratios are as shown in Equations (4) and (5).
γ H = Q G , H Q L , H
λ H = Q L , C Q G , C
At the same time, the utilization factor, defined by the Equation (6), is a function of a 0 and time constant.
a = a 0 + τ τ 0
Coefficients a H and a C are related with the time constant τ , as it can be observed in Equation (6), where, a 0 is a numerical parameter and τ 0 is a reference time constant that depends on the building category, with default values defined by the ISO 13790 standard. For example, Equation (7) has been proposed for office buildings, both for heating and cooling.
a = a 0 + τ τ 0

2.2.2. Climatic Change Predictions

The value of the outdoor conditions was obtained from weather stations close to the city, to avoid the effect of buildings on the measured values of the outer conditions. Climatic data was obtained from the Environment Information system of Galicia [18] and from the Forest and Environmental Research Center of Lourizán.
In this case study, climatic change models were obtained from the previous research works [11] where a curve fit was employed for each season, in accordance with Equations (8)–(11), with an adequate correlation factor. Furthermore, an adequate accuracy is expected since this same methodology was employed for predicting future climate change in Mediterranean areas in previous research works [9].
Δ t winter = 0.05 τ
Δ t spring = 0.07 τ
Δ t summer = 0.05 τ
Δ t autumn = 0.03 τ
where, Δ t is the mean seasonal temperature increment (°C) and τ is the time (years).

2.2.3. Building Energetic Simulation

Based on real sampled data of the indoor conditions of temperature and humidity and in setpoint temperatures, the energy consumption was defined [12,28,29,30,31,32,33]. At the same time, the ventilation rate was sampled by the tracer gas concentration decay method with SF6. As a reference value, the Ashrae Standard 62 [34] proposes for office spaces an air change of 10 l/s which represents about 1 ach for a maximum of ten persons in this ambience.
To define the coefficients of the certification model, the sampled energy consumption data and the standard recommendations were employed. In this sense, a constant of 70 and an a 0 value was defined with real energy consumption.
Thus, the principal input data for the certification model were obtained for the building and simulated and compared with real sampled data; subsequently, new design corrections for future climatic change in accordance with Hallegatte [20] were proposed.
As it was explained before, the office was identified as a single thermal zone in the basement due to that there is a lower difference of temperature of 4 K between both indoor zones, as it is defined by standards. Adiabatic floor and ceiling and set point temperatures of 18 and 23 °C for winter and summer seasons were defined.

3. Results and Discussion

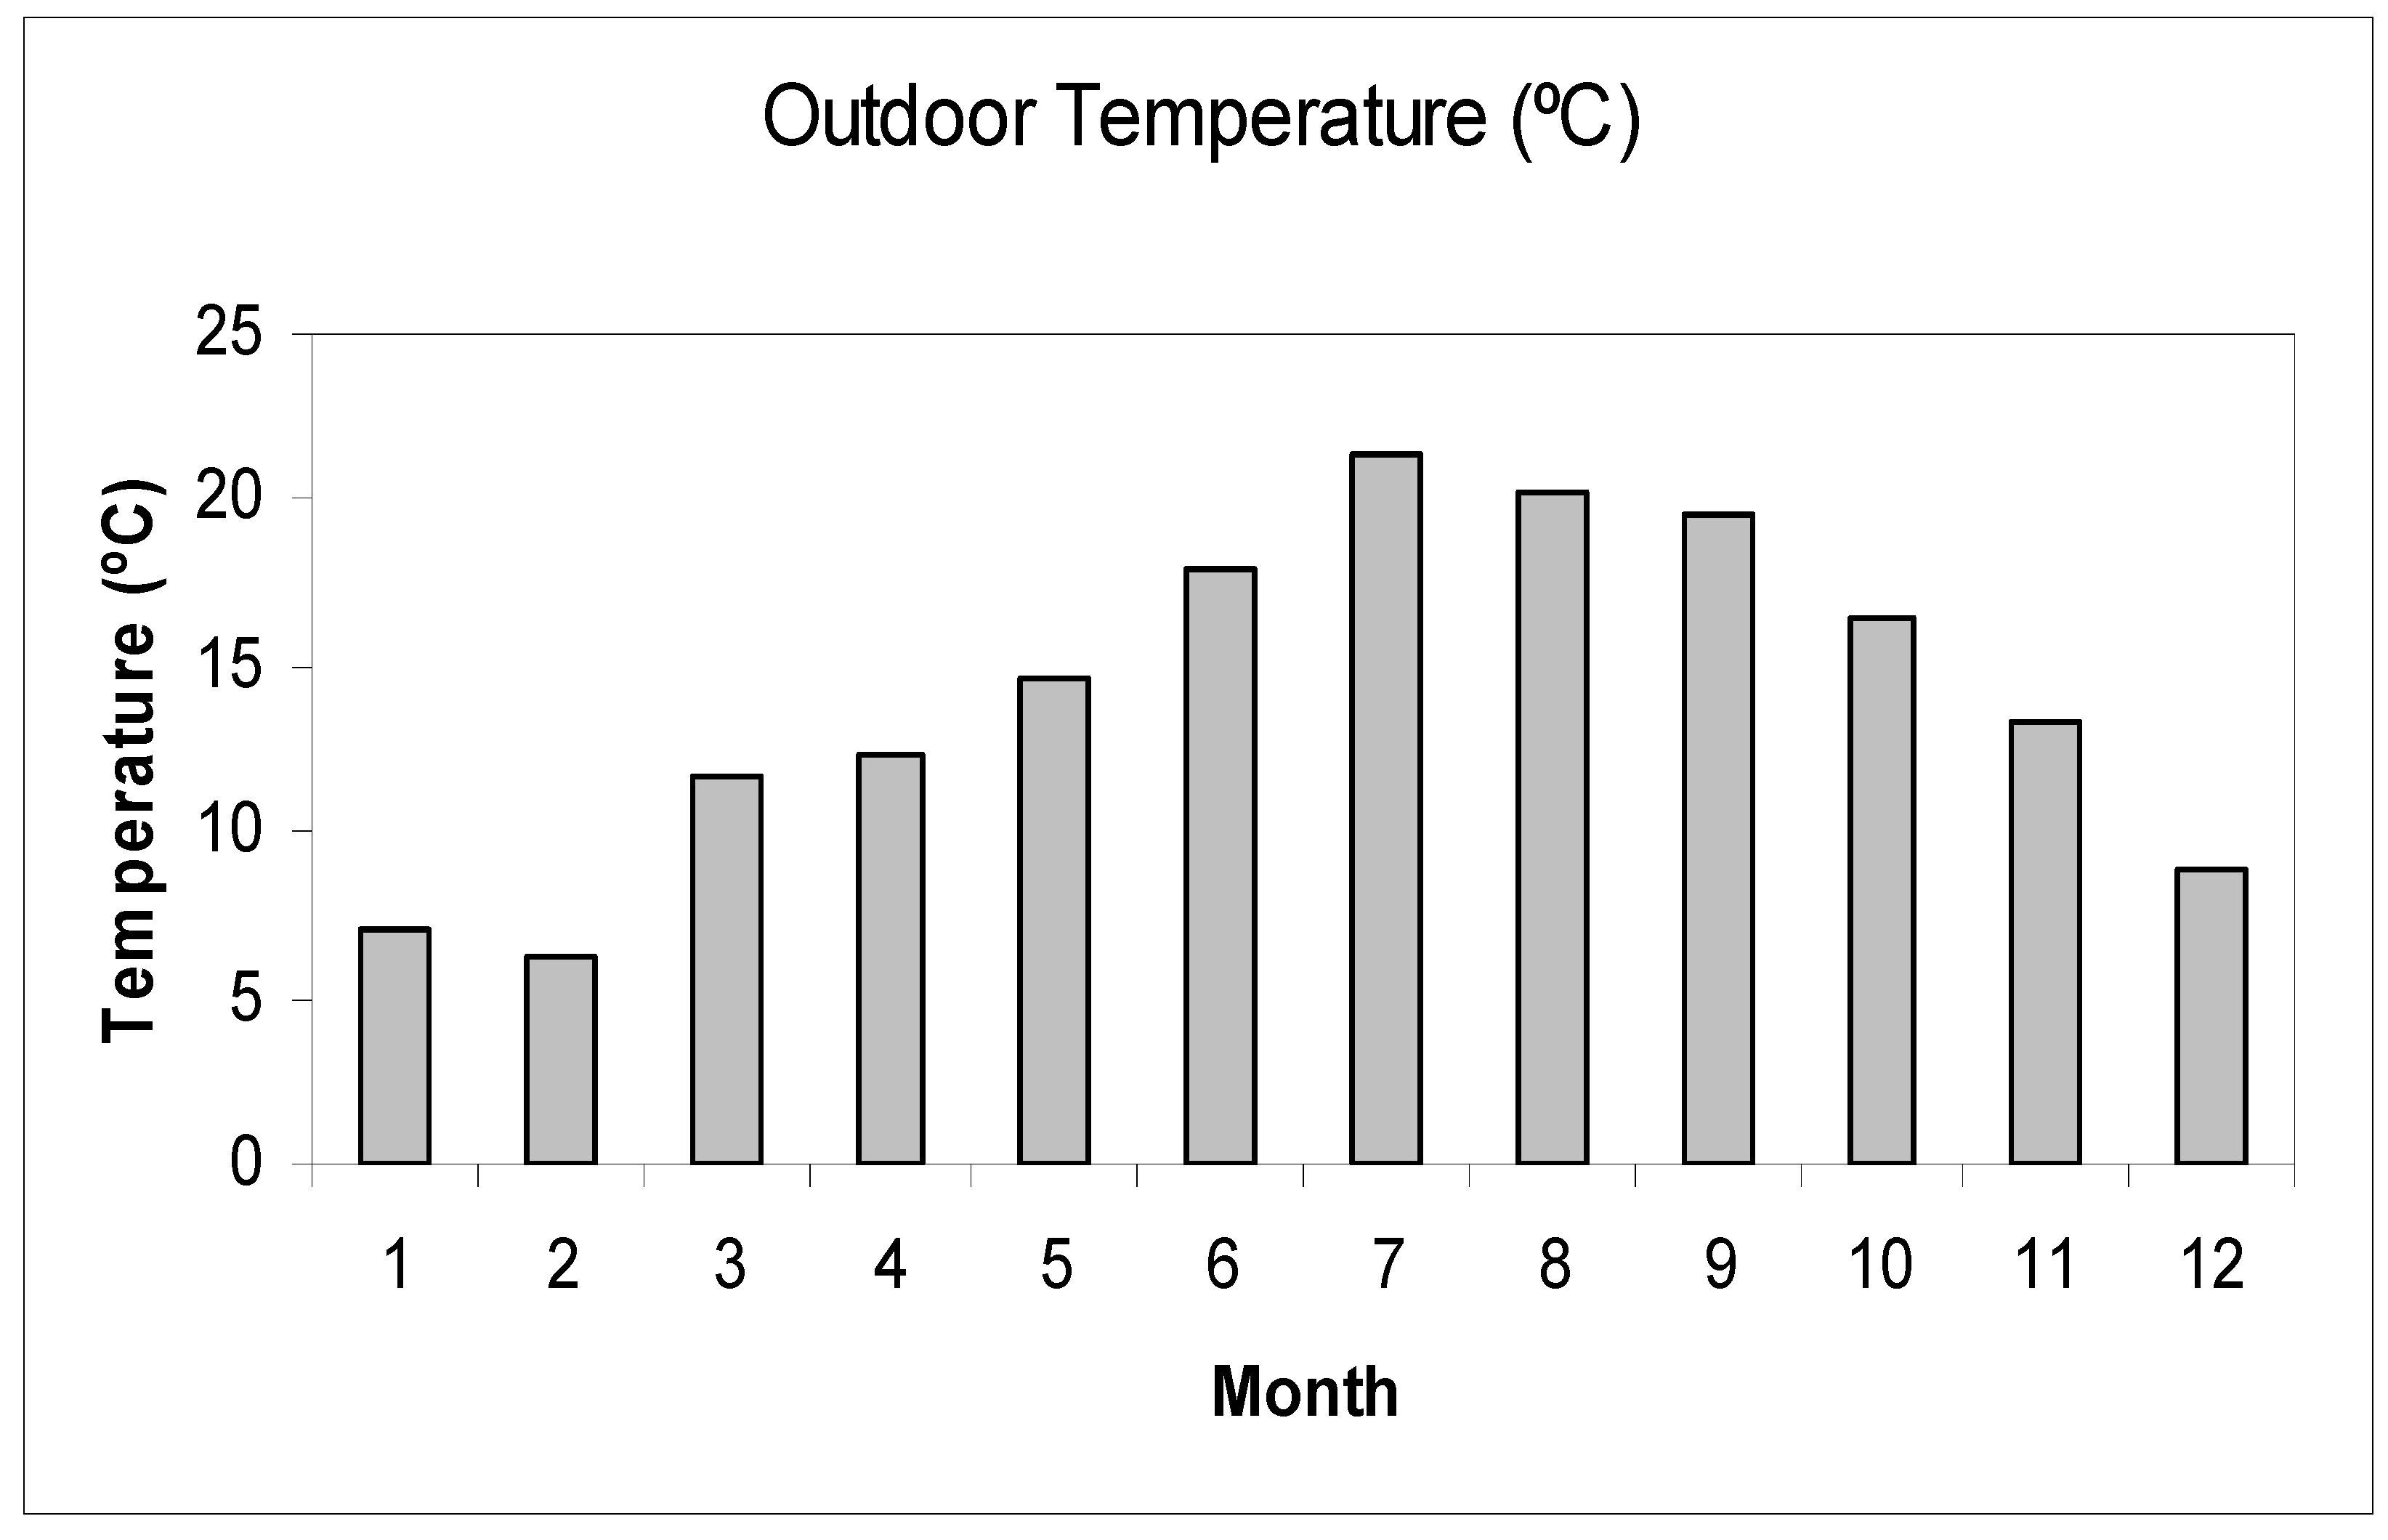
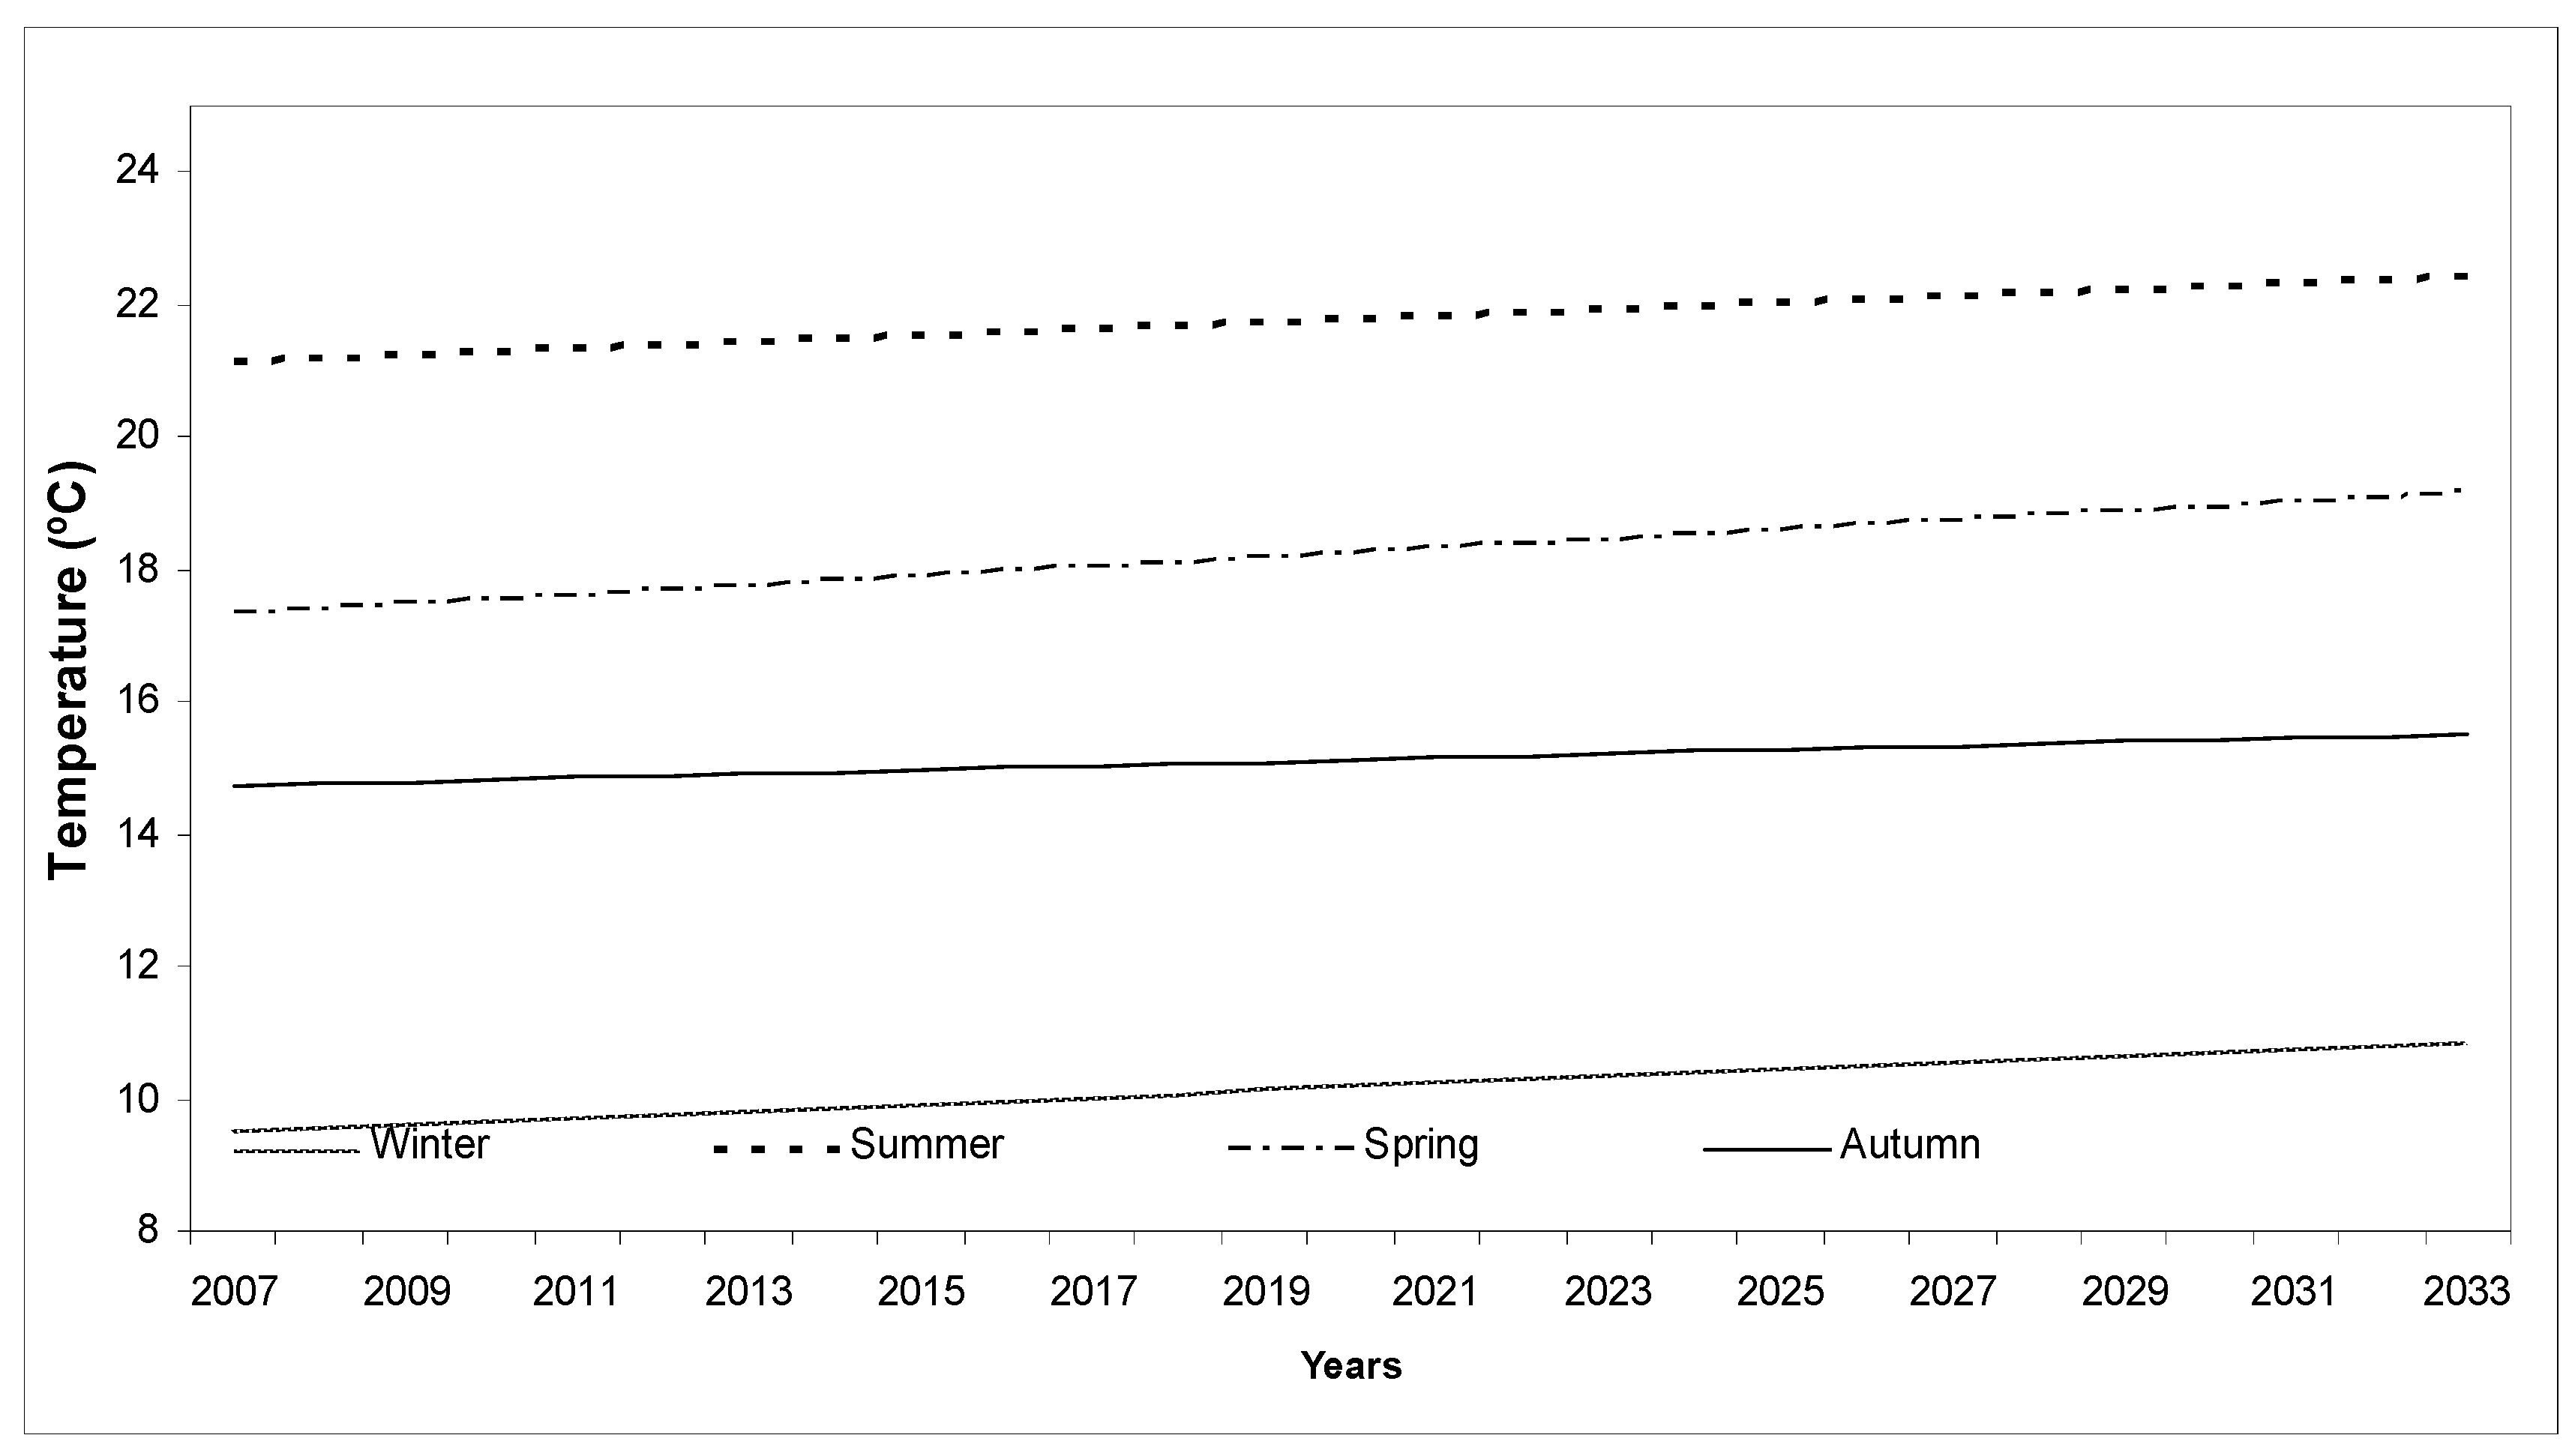
3.1. Future Weather Conditions

The results indicate that the Northwest of Spain presents a mild climate and a high relative humidity all through the year as a consequence of Atlantic winds, as shown in Figure 4 and Figure 5. This relative humidity will reach a mean value of 85% all through the year and the outdoor temperature presents a mean value of 20.5 and 9.3 °C in the summer and winter seasons, respectively.
On the other hand, recent research works and the Intergovernmental Panel on Climate Change (IPCC) show an annual warming rate ranging between 0.1 and 0.4 °C per decade in Southern Europe. Regional studies were employed to predict seasonal temperature increment in the northwest of Spain; as shown in Figure 6, it has been predicted that the winter season will experience an increment from 9.3 to 10.7 °C and the summer will reach the maximum temperature of 22.1 °C in the next twenty years. Consequently, an increment of temperatures of 1 °C in the summer and winter seasons was obtained.
This result is in accordance with that obtained by other authors indicating that climatic conditions will become more extreme and, in consequence, spring and autumn seasons will trend to summer and winter conditions, respectively [11]. For example, in the northwest of Spain the spring season will present a high temperature increment from 17 to 19 °C in the next twenty years, while the autumn will present the lowest temperature increment for the next twenty years with a mean value of 14.5 °C.

3.2. ISO 13790 Standard

As a consequence of this imminent outdoor mean temperature increment, the EPBD has led incentives to avoid energy intensive building service equipment and to promote energy efficient building design throughout Europe [35,36].
Furthermore, urbanization plans will influence city structures over long time scales and will be vulnerable to changes in climate conditions and sea level rise. As an actuation guide, the recent research work of Hallegatte [20] indicates the list of sectors in which decisions should already take into account climate change with respect to a time scale. This research indicates a time scaling of 30 to 150 for buildings, for example, insulation design and windows selection. In consequence, actual building designs will be exposed to future climatic change and thus adequate building design corrections must be done at this point.
After analyzing the future climate effect over outdoor temperature and to present possible solutions for reducing energy consumption in each extreme season, the ISO 13790:2011 monthly procedure was employed to predict the energy consumption, the utilization factor, and the CO2 production in the near future for north of Spain. This simple monthly method was selected because it is as accurate as more sophisticated methods, and is not very sensitive to input errors in relation to the other sophisticated simulation models [37,38].

3.3. Validation of the Energy Ratio Calculation Procedure

To adjust the certification model to the building in this study the indoor temperature and relative humidity were sampled during a year and the real energy consumption for each season was calculated. An iterative calculation of the certification model process was done to define the coefficients of Equation (6) for this building, in accordance with its energy consumption. In this calculation process, the values proposed by the standard for this kind of building and activity were employed as reference. The ventilation flow rate was set in accordance with sampled data, to 1 h−1 from 9:00 to 14:00 and to 0.5 h−1 during weekends and night periods.
It should be noted that once the building simulation is adjusted to this particular case study, it can be simulated under the predicted temperatures for the following years, in accordance with the climatic change predictions. Thus, the energy consumption for winter and summer seasons, the utilization factor, and the CO2 production were obtained and are represented in Figure 7, Figure 8 and Figure 9, respectively. It can be seen in Figure 7 that under the actual building design, a reduction in energy consumption will occur during winter and a clear increment will occur during the summer season. In consequence, the net energy consumption will reach a constant value of 4.3 kW/m2 year.

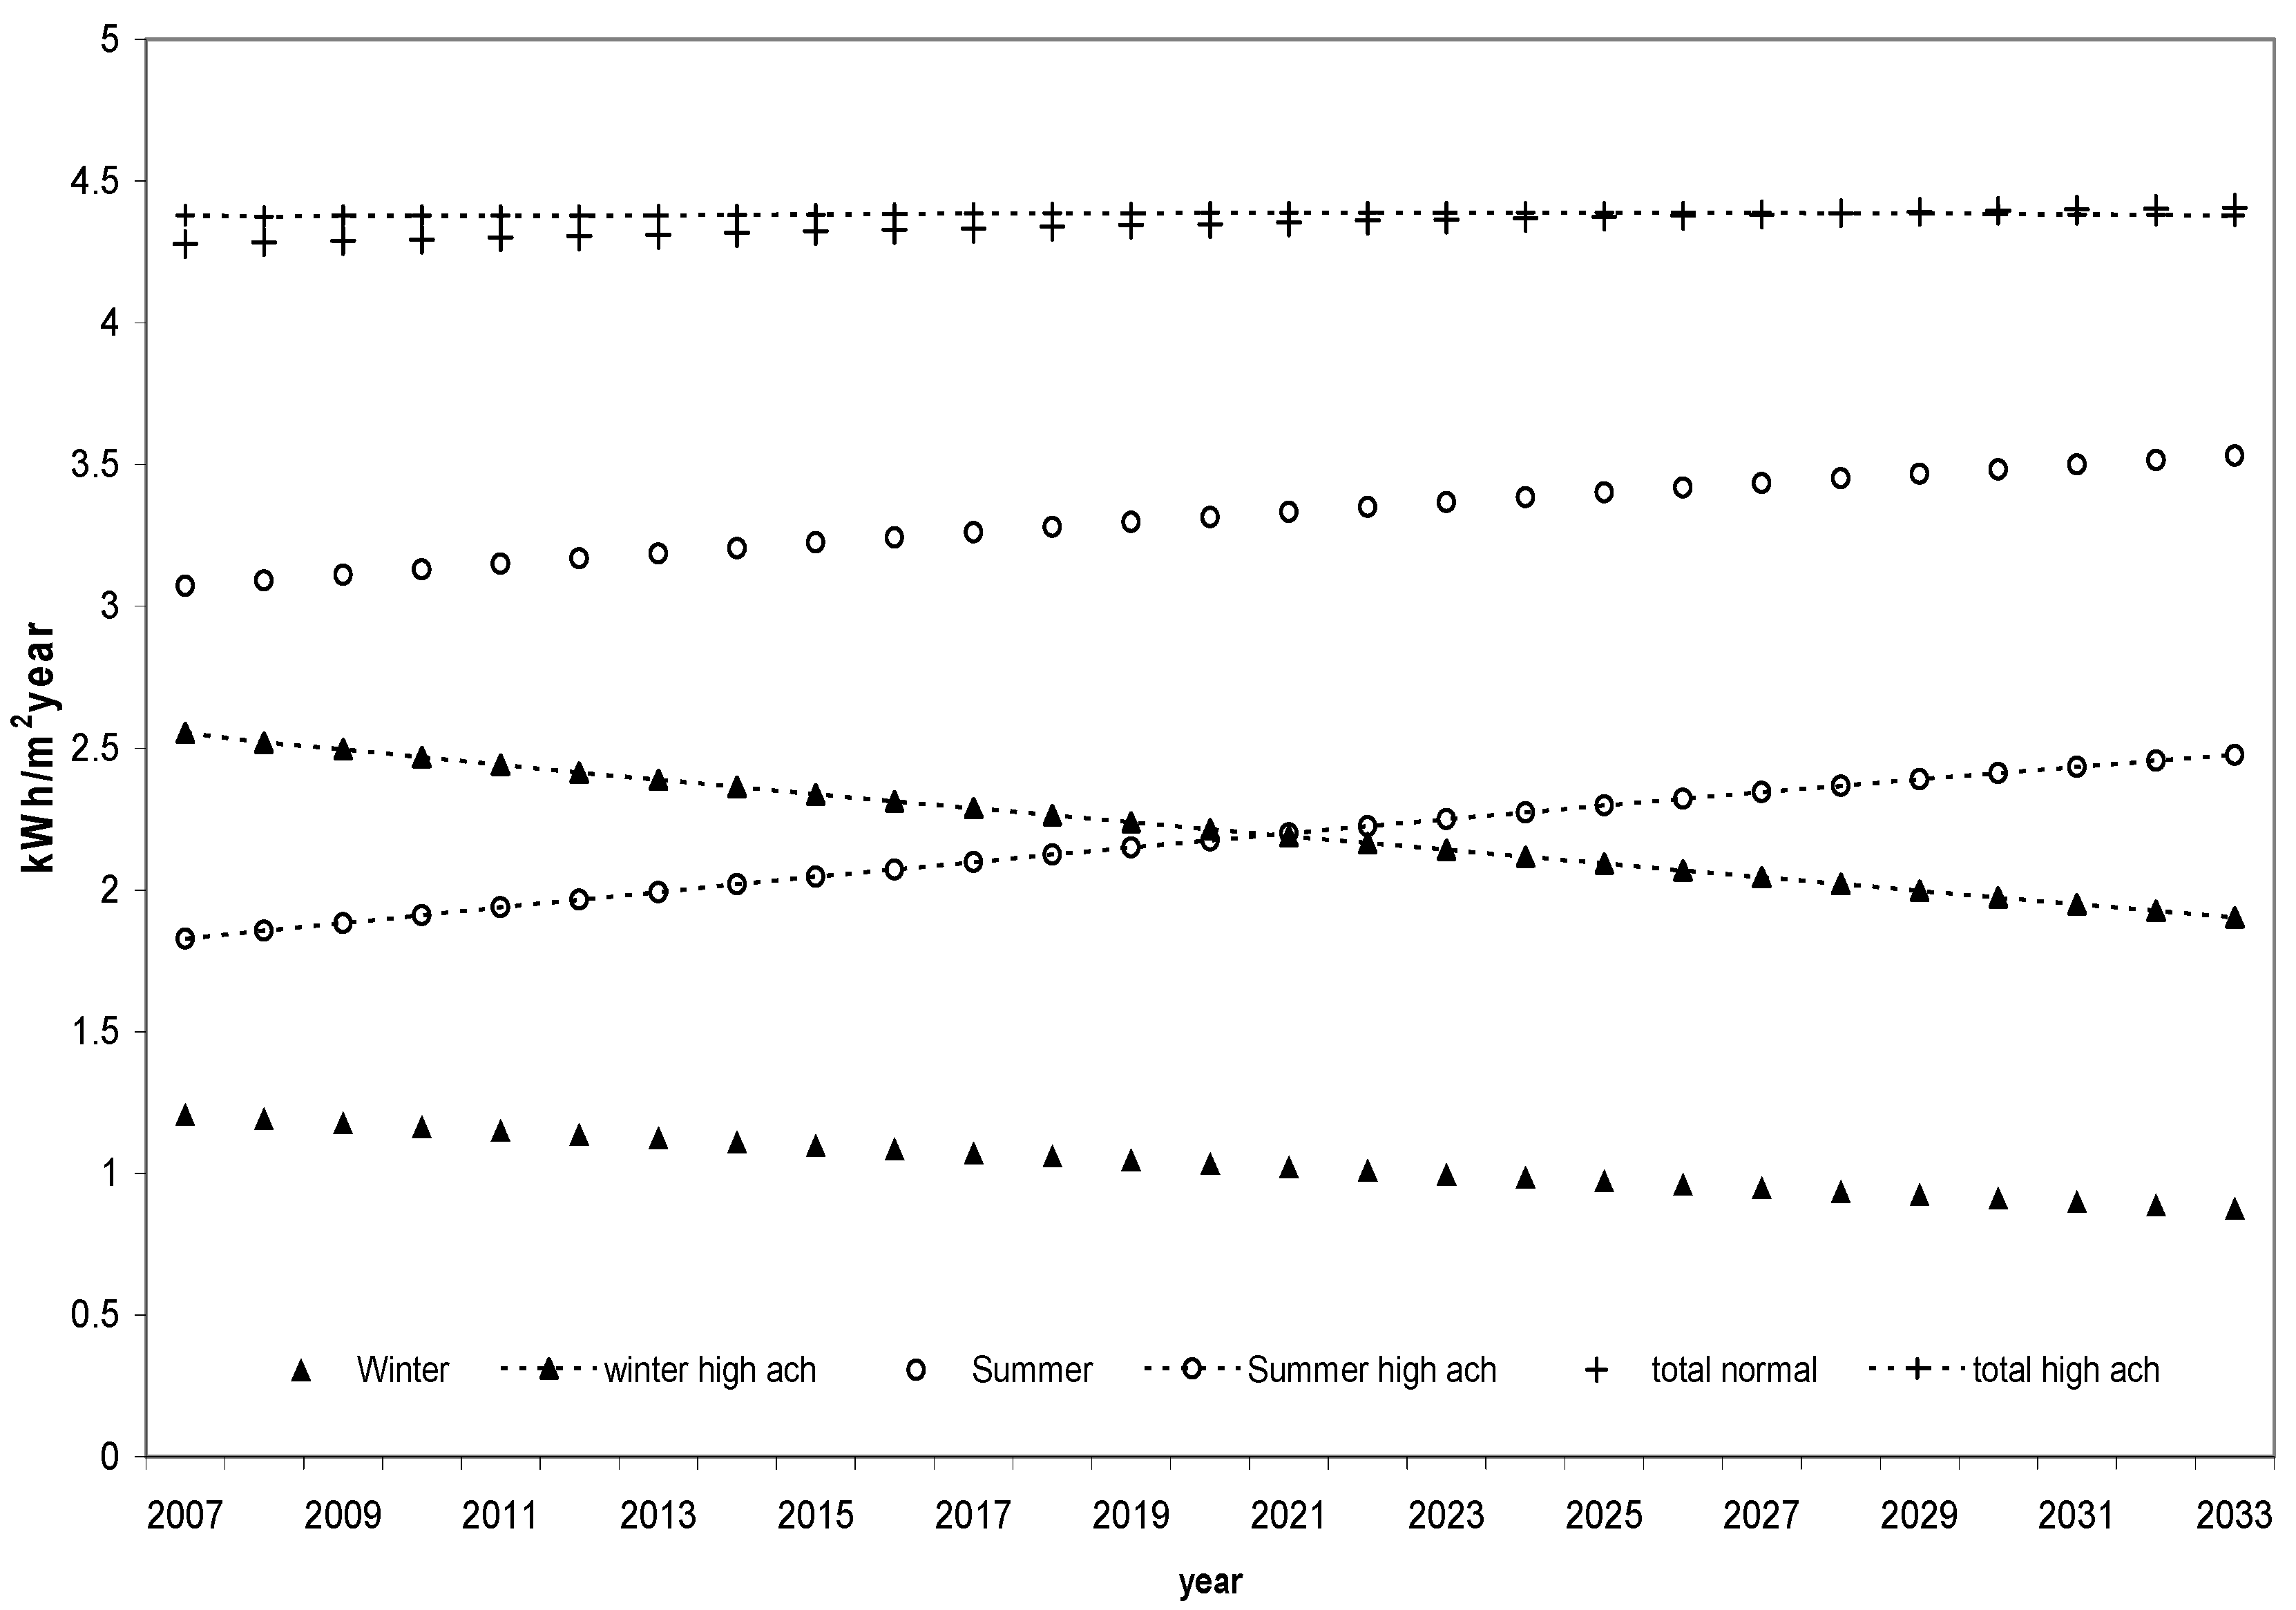
3.4. Building Design Corrections

One typically proposed solution for this problematic situation is to change the design insulation thickness. This energy saving is related to the conservation of heat energy, and the corresponding cost savings and thermal comfort are achieved by minimizing heat losses to outside from the walls and ceiling by improved insulation. The more energy that there is to be conserved, the more expensive it is for adding extra layers of insulation. However, beyond a certain thickness of insulation, the potential energy saving does not justify the extra cost. This is because adding more insulation by increasing thickness gives diminishing returns on the energy saved, whereas the cost of installation continues to increase linearly. The variation in the results of different cities for a given climate zone indicates that the insulation calculations should be done separately for each city and not for a climate zone [39]. Similar to the earlier research, the energy effect of the thermal inertia over the energy consumption was analyzed in the present study. This thermal inertia, identified with the time constant, shows the tendency of a building not to vary its internal temperature as a consequence of an internal dynamic solicitation and calculated in accordance with Equation (12):
τ = C H
where, C is the internal heat capacity of the building and H is the total heat loss coefficient of the building caused by transmission and ventilation heat losses.
In consequence, when the effect of climate change was simulated over the same building with higher thermal inertia (400 kJ/m2 K), it was found that there was no effect on the energy consumption and, in consequence, on CO2 production and the utilization factor in the winter and summer seasons.
Another option to prevent and adjust the indoor ambience to future climatic change effect is to modify the air changes per hour [35]. In this sense, for non-domestic buildings, natural ventilation regimes and advanced natural ventilation concepts are an increasingly attractive option [36,40].
Similarly, an increment of air changes from 1 to 1.6 h−1 was proposed and simulated for future climatic change effects in accordance with ISO 13790:2011 building certification standard. In consequence, a new distribution of the building energy consumption was obtained in the following years, as shown in Figure 7. It can be seen in the figure that lower energy consumption was obtained during the summer season than with the present conditions for the entire simulation period. At the same time, higher energy consumption during winter can be observed. Furthermore, this change will originate nearly constant energy consumption of 2 kWh/m2 year during the whole year. This value is equal to that obtained for the present conditions under the same climatic change; however, despite this, the new energy distribution for the following years will help to reduce the energy peak loads in the summer season.
By analyzing the evolution of the utilization factor in the following years for the present and the proposed designs, it can be concluded that the utilization factor will experience an increment when the air changes are incremented, as shown in Figure 8. Consequently, an increment of the mean summer utilization factor (h) from 0.56 to 0.66 was observed when the air changes were incremented and an increment during the winter season from 0.67 to 0.79.
To understand this result it must be considered that the utilization factor represents the portion of gains (during the heating season) or of losses (during the cooling season) that contribute to the reduction in the heating demand (during the heating season) or in the cooling demand (during the cooling season) [32]. In consequence, this increment of the utilization factor implies that an increment of air changes improves the dynamic mismatch that exist in the balance of heat losses and gains.
Finally, a drastic increment in CO2 production was observed with the increment of air changes during the winter season, as shown in Figure 9. This effect is related to the low efficiency of actual heating systems. Thus, it can be seen that air renovation is a feasible factor that will aid in improving energy consumption in the following years. This increment of air changes during summer can be obtained by a mechanical system or by use of passive methods like windows or night ventilation. Furthermore, optimal energy saving can be achieved with a variable air renovation with values of 1 h−1 during winter and 1.6 h−1 during the summer season.

4. Conclusions

In the present study, new information about the effect of climate change over energy consumption in Galician office buildings was introduced based on the ISO 13790:2011. This simulation was adjusted to particular Spanish office buildings, and then the future climate change effect over energy saving was analyzed. It can be concluded that sampled data is an adequate way to adjust the model of certification with the particular parameters of each building. Furthermore, the ISO 13790:2011 standard monthly method indicated the feasibility of an iterative calculation with adequate accuracy to be employed for predicting future climatic change effect over energy consumption and for evaluating new building design corrections. The results obtained indicated that an increment of building thermal inertia will not exert a clear influence over the energy consumption. On the other hand, when the air changes were proposed to reach a value of 1.6, a clear improvement was observed. To conclude, for the office buildings of this region, there is a need to increment the number of air changes during the summer season and to maintain the present air renovation during winter.
Finally, there are some limitations of this research work due to that it is centered in a particular region under mild climatic conditions. Consequently, more detailed studies must be done in this and other regions, under more extreme weather conditions.

Author Contributions

Conceptualization and methodology, J.A.O.; formal analysis, F.F.; data curation, D.V. and P.F.-A.; validation, J.A.O., D.V., F.F. and P.F.-A.; writing—original draft preparation, J.A.O.; writing—review and editing, J.A.O., D.V. and P.F.-A. All authors have read and agreed to the published version of the manuscript.

Funding

This research received no external funding.

Acknowledgments

The author would like to thank the University of A Coruña for their sponsorship of the project 5230252906.541A.64902.

Conflicts of Interest

The authors declare no conflict of interest.

References

  1. Nicol, F.; Humphreys, M. Maximum temperatures in European office buildings to avoid heat discomfort. J. Sol. Energy 2007, 81, 295–304. [Google Scholar] [CrossRef]
  2. Pérez-Lombard, L.; Ortiz, J.; Pout, C. A review on buildings energy consumption information. Energy Build. 2008, 40, 394–398. [Google Scholar] [CrossRef]
  3. Energy Performance Building Directive. Available online: https://ec.europa.eu/energy/topics/energy-efficiency/energy-efficient-buildings/energy-performance-buildings-directive_en (accessed on 3 December 2020).
  4. European Commission. Council Decision 2002/358/EC Concerning the Approval, on Behalf of the European Community, of the Kyoto Protocol to the United Nations Framework Convention on Climate Change and the Joint Fulfillment of Commitments Thereunder; European Commission: Brussels, Belgium, 2002. [Google Scholar]
  5. Alcántara, V.; Padilla, V. Input–output subsystems and pollution: An application to the service sector and CO2 emissions in Spain. Ecol. Econ. 2009, 68, 905–914. [Google Scholar] [CrossRef]
  6. Roca, J.; Serrano, M. Income growth and atmospheric pollution in Spain: An input–output approach. Ecol. Econ. 2007, 63, 230–242. [Google Scholar] [CrossRef] [Green Version]
  7. United Nations. Kyoto Protocol to the United Nations Framework Convention on Climate Change; United Nations: New York, NY, USA, 1998. [Google Scholar]
  8. The Intergovernmental Panel on Climate Change (IPCC). The Physcial Science Basis, Contribution of Working Group I to the Fourth Assessment Report of the Intergovernmental Panel on Climate Change; Cambridge University Press: Cambridge, UK; New York, NY, USA, 2007. [Google Scholar]
  9. Hertig, E.; Jacobeit, J. Downscaling future climate change: Temperature scenarios for the Mediterranean area. Glob. Planet. Chang. 2008, 63, 127–131. [Google Scholar] [CrossRef]
  10. Jentsch, M.F.; Bahaj, A.S.; James, P.A.B. Climate change future proofing of buildings-Generation and assessment of building simulation weather files. Energy Build. 2008, 40, 2148–2168. [Google Scholar] [CrossRef]
  11. Naranjo, L.; Vicente, P.M. A Variabilidade Natural Do Clima en Galicia; MeteoGalicia; Xunta de Galicia e fundación Caixa Galicia, Ed.; Consellería de Medio Ambiente e Desenvolvemento Sostible: Santiago de Compostela, Spain, 2006; pp. 1–292. [Google Scholar]
  12. CIBSE. Climate Change and the Indoor Environment: Impacts and Adaptation; CIBSE TM36; The Chartered Institution of Buildings Services Engineers: London, UK, 2005. [Google Scholar]
  13. ASHRAE. Energy Estimating and Modelling Methods. In ASHRAE Handbook, Fundamentals; American Society of Heating Refrigerating and Air-Conditioning Engineers: Atlanta, GA, USA, 2009. [Google Scholar]
  14. International Organization for Standardization. Thermal Performance of Buildings-Calculation of Energy Use for Space Heating and Cooling; ISO/DIS 13790:2005; ISO: Geneva, Switzerland, 2005. [Google Scholar]
  15. Standard SFS-EN 832. Thermal Performance of Buildings. Calculation of Energy Use for Heating. Residential Buildings; SFS-EN 832; BIS: London, UK, 1998. [Google Scholar]
  16. Standard SFS-EN ISO 13370. Thermal Performance of Buildings, Heat Transfer via the Ground, Calculation Methods; BIS: London, UK, 1998. [Google Scholar]
  17. RITE. Reglamento de Instalaciones Térmicas en los Edificios; Ceysa. Cano Pina: Murcia, Spain, 2007. [Google Scholar]
  18. MeteoGalicia. Available online: https://www.meteogalicia.gal/web/inicio.action (accessed on 11 November 2020).
  19. ATECYR. Entrada de Datos a los Programas LIDER y CALENER VyP; ATECY: Madrid, Spain, 2008. [Google Scholar]
  20. Hallegatte, S. Strategies to adapt to an uncertain climate change. Glob. Environ. Chang. 2009, 19, 240–247. [Google Scholar] [CrossRef]
  21. Gratia, E.; De Herde, A. Design of low energy office buildings. Energy Build. 2003, 35, 473–491. [Google Scholar] [CrossRef]
  22. Cui, Y.; Yan, D.; Hong, T.; Xiao, C.; Luo, X.; Zhang, Q. Comparison of typical year and multiyear building simulations using a 55-year actual weather data set from China. Appl. Energy 2017, 197, 890–904. [Google Scholar] [CrossRef] [Green Version]
  23. Costanzo, V.; Evola, G.; Infantone, M.F.; Marletta, L. Updated typical weather years for the energy simulation of buildings in Mediterranean climate. A case study for Sicily. Energies 2020, 13, 4115. [Google Scholar] [CrossRef]
  24. Ubinas, R.E.; Montero, C.; Porteros, M.; Vega, S.; Navarro, I.; Castillo Cagigal, M.; Gutiérrez, A. Passive design strategies and performance of net energy plus houses. Energy Build. 2014, 83, 10–22. [Google Scholar] [CrossRef] [Green Version]
  25. Fernandez-Antolin, M.; Del Rio, J.M.; Costanzo, V.; Nocera, F.; Gonzalez-Lezcano, R.A. Passive design strategies for residential buildings in different Spanish climate zones. Sustainability 2019, 11, 4816. [Google Scholar] [CrossRef] [Green Version]
  26. Masdías-Bonome, E.; Orosa, J.A.; Vergara, D. A new methodology for decision-making in buildings energy optimization. Appl. Sci. 2020, 10, 4558. [Google Scholar] [CrossRef]
  27. Orosa, J.A.; Nematchoua, M.K.; Reiter, S. Air changes for healthy indoor ambiences under pandemic conditions and its energetic implications: A Galician case study. Appl. Sci. 2020, 10, 7169. [Google Scholar] [CrossRef]
  28. Orosa, J.A.; Costa, Á.M.; Rodríguez-Fernández, A.; Roshan, G. Effect of climate change on outdoor thermal comfort in humid climates. J. Environ. Health Sci. Eng. 2014, 12, 46. [Google Scholar] [CrossRef] [Green Version]
  29. Nematchoua, M.K.; Tchinda, R.; Orosa, J.A.; Andreasi, W.A. Effect of wall construction materials over indoor air quality in humid and hot climate. J. Build. Eng. 2015, 3, 16–23. [Google Scholar] [CrossRef] [Green Version]
  30. Orosa, J.A.; García-Bustelo, E.J. Permeable coverings as a sustainable solution for indoor air thermal comfort and energy saving. Energy Ed. Sci. Technol. Part A Energy Sci. Res. 2012, 29, 583–596. [Google Scholar]
  31. Jokisalo, J.; Kurnitski, J. Performance of EN ISO 13790 utilisation factor heat demand calculation method in a cold climate. Energy Build. 2007, 39, 236–247. [Google Scholar] [CrossRef]
  32. Corrado, V.; Mechri, H.E.; Fabrizio, E. Building energy performance assessment through simplified models: Application of the ISO 13790 quasi-steady state method. In Proceedings of the building simulation, Beijing, China, 3–6 September 2007; pp. 79–86. [Google Scholar]
  33. Orosa, J.A.; Vergara, D.; Costa, Á.M.; Bouzón, R. A novel method for nZEB internal coverings design based on neural networks. Coatings 2019, 9, 288. [Google Scholar] [CrossRef] [Green Version]
  34. ASHRAE Standard 62-2004. Ventilation for Acceptable Indoor Air Quality; American Society of Heating, Refrigerating and Air-Conditioning Engineers: Atlanta, GA, USA, 2004. [Google Scholar]
  35. Holmes, M.J.; Hacker, J.N. Climate change, thermal comfort and energy: Meeting the design challenges of the 21ts century. Energy Build. 2007, 39, 802–814. [Google Scholar] [CrossRef]
  36. Lomas, K.J. Architectural design of an advanced naturally ventilated building form. Energy Build. 2006, 39, 166–181. [Google Scholar] [CrossRef]
  37. Van der Veken, J.; Saelens, D.; Verbeeck, G.; Hens, H. Comparison of Steady State and Dynamic Building Environment Simulation Programs. In Proceedings of the International Buildings IX ASHRAE Conference on the Performance of Exterior Envelopes of Whole Buildings, Clearwater, FL, USA, 5–10 December 2004. [Google Scholar]
  38. De Meulenaer, V.; Van der Veken, J.; Verbeeck, G.; Hens, H. Comparison of measurements and simulations of a passive house. In Proceedings of the 9th International IBPSA conference, Montréal, QC, Canada, 15–18 August 2005; pp. 769–776. [Google Scholar]
  39. Bolattürk, A. Determination of optimum insulation thickness for building walls with respect top various fuels and climate zones in Turkey. Appl. Therm. Eng. 2006, 26, 1301–1309. [Google Scholar] [CrossRef]
  40. Eicker, U.; Huber, M.; Seeberger, P.; Vorschulze, C. Limits and potentials of office buildings climatisation with ambient air. Energy Build. 2006, 38, 574–581. [Google Scholar] [CrossRef]
Figure 1. Methodology employed.
Infrastructures 05 00114 g001
Figure 2. Office building distribution used in this study.
Infrastructures 05 00114 g002
Figure 3. The concrete office building section.
Infrastructures 05 00114 g003
Figure 4. Outdoor relative humidity (%).
Infrastructures 05 00114 g004
Figure 5. Outdoor temperature (°C).
Infrastructures 05 00114 g005
Figure 6. Predicted seasonal temperature increment in the northwest of Spain (°C).
Infrastructures 05 00114 g006
Figure 7. Reduction in energy consumption peer year and different ach values (kWh/m2 year).
Infrastructures 05 00114 g007
Figure 8. Utilization factor (h) for different air changes value.
Infrastructures 05 00114 g008
Figure 9. Predicted seasonal carbon dioxide emissions respect temperature and ach increment in the next years in the northwest of Spain.
Infrastructures 05 00114 g009
Publisher’s Note: MDPI stays neutral with regard to jurisdictional claims in published maps and institutional affiliations.

