Detecting Embankment Instability Using Measurable Track Geometry Data

Asset Research Consultancy Department, AECOM, Nottingham NG9 6RZ, UK
*
Author to whom correspondence should be addressed.
Infrastructures 2020, 5(3), 29; https://0-doi-org.brum.beds.ac.uk/10.3390/infrastructures5030029
Submission received: 15 February 2020
/
Revised: 9 March 2020
/
Accepted: 9 March 2020
/
Published: 12 March 2020
(This article belongs to the Special Issue SMARTI - Sustainable Multi-functional Automated Resilient Transport Infrastructure)
Abstract
:The British railway system is the oldest in the world. Most railway embankments are aged around 150 years old and the percentage of disruption reports that feature them is frequently higher than other types of railway infrastructure. Remarkable works have been done to understand embankment deterioration and develop asset modelling. Nevertheless, they do not represent a sufficient way of managing assets in detail. As a result, reactive approaches combined with proactive ones would improve the whole asset management scenario. To guarantee good system performance, geotechnical asset management (GAM) aims to reduce uncertainty through informed, data driven decisions and optimisation of resources. GAM approaches are cost sensitive. Thus, data driven approaches that utilize existing resources are highly prized. Track geometry data has been routinely collected by Network Rail, over many years, to identify track defects and subsequently plan track maintenance interventions. Additionally, in 2018 Network Rail commissioned AECOM to undertake a study, described in this paper, to investigate the use of track geometry data in the detection of embankment instabilities. In this study, track geometry data for over 1800 embankments were processed and parameters offering the best correlation with embankment movements were identified and used by an algorithm to generate an embankment instability metric. The study successfully demonstrated that the instability of railway embankments is clearly visible in track geometry data and the metric gives an indication of the worsening of track geometry, that is likely due to embankment instability.
1. Introduction
The railway network in the United Kingdom is a national asset, with a vast physical presence on the territory with almost 16,000 kms of route. According to the Office of Rail and Road, every year around 1.7 billion passenger journeys are made on the network and 17 billion net tonne kilometres of freight is transported. For parties responsible for the network, it is crucial and challenging to attain the relevant quality standards. The main objectives to be achieved are: safety for passenger, workforce and the public, in terms of number of fatalities per train disruption; resilience of the system considering that, due to the intense use of the lines, in the UK around 70% of delays are caused by congestion rather than from a separate primary cause [1]; profit, and so appropriate allocation of funds resulting from effective investment plans (repairing/maintaining actions have relevant weight on companies’ financial income).
To achieve optimum performance of the system, it is necessary to understand how each part of the track structure works in relation to earthworks deterioration. The British railway system is one of the oldest in the world. In most cases, the age of a railway earthwork will date back to the original construction date of the line, as earthwork reconstruction is extremely rare [2]. Approximately 75% of earthwork assets are assessed to be over 150 years old and offer vastly reduced levels of capability and resilience in comparison to modern engineered slopes. Railway embankments consist of fill material placed to maintain the vertical alignment of rail by raising the level above that of the surrounding natural ground. They are distinct from cuttings, which reduce the ground level by excavating in situ soil and rock.
There are more geotechnical hazards across the network than can be detected from the tools available with the current prioritisation of risk [3]. Instability is a significant cause of traffic disruption, speed restrictions and, in the worst cases, derailment. If acted upon at an early stage, problems can be addressed before they impact the operation of the line, even if it is difficult to judge whether a minor fault is a result of an earthwork problem or results from another failure mechanism that could escalate into an actionable fault. Specific performance requirements are strictly related to track geometry quality. Track irregularities are periodically measured and registered with a frequency that depends on factors like line speed and tonnage [4].
The project presented in this paper refines and tests the concept of using track geometry data, providing a source of data for monitoring the development of earthwork instability, to analyse embankment instability on a large sample of assets with known issues inside the Network Rail (NR) network. NR is the owner, operator and asset manager of the majority of the rail network of Great Britain. Failures within the portfolio of nearly 200,000 earthwork assets are relatively common, particularly in periods of adverse or extreme weather [3].
Thanks to the development of an algorithm, the level of instability was quantified. The output of the algorithm has been used in a parametric study to establish whether there is enough confidence to consider wider use of this technique as a risk marker for the prioritisation of asset vulnerability to failure, driving further inspection or prioritisation of other remedial actions.
Through the investigation and analysis of track geometry data for over 34,000 miles (54,700 km), the parameters offering the best correlation with earthwork movement were used by an algorithm, which generates a new specialist metric. The metric, named embankment instability metric, indicates the worsening of the track geometry, which is likely due to instability in the embankment. By taking an overview of the whole range of earthwork movements observed in the data, a classification of the severity of earthwork movements was also proposed.
2. British Embankment Building History and Common Causes of Instability
The British railway system is one of the oldest in the world. The railway infrastructure was born at the end of the 16th century with the purpose of carrying coal and goods; the first public railway line for passenger transportation was introduced only in 1830 and it ran from Manchester to Liverpool. Between 1835 and 1841, nine main lines of railway were built in the United Kingdom, totalling around 1000 km, and this included tunnels, bridges and stations. Building the railway involved the excavation, in cuttings, of around 54 million m3 of material, most of which was used in making embankments. Construction on this scale had no precedent; the earthwork quantities, in particular, are remarkable [5].
Modern geotechnical structures are designed and built following comprehensive information on all the variables that should normally be considered, provided in the Eurocode (CEN, 1990). For example, the first step of designing embankment structures for transportation projects generally is the exclusive use of adequate soils, with specific natural features previously defined through laboratory procedures. The second step is the preparation of the surface between the embankment and the underlying original ground surface with vegetation being removed. The construction of the embankment itself establishes the materials chosen in layers, of which the thickness is previously designed according to the quality of the materials. After compaction, the soils used need to guarantee adequate value of density and compressibility and the incline is chosen, in order to guarantee the global stability of the embankment. The surface between the embankment and the railway sub-structure must show high stiffness (low deformity under cyclic loading) and needs to be sufficiently flat. Material for this surface should show better mechanic characteristic than the material used for the underlying part of the embankment and should be compacted to a greater extent.
Early railway embankments, though, were built empirically and were not designed in the context of modern soil mechanics [2]. As a general rule, embankments were built placing soil or rock materials, excavated to form cuttings elsewhere, on natural ground. The most widespread method on the railway by the mid-1830s was to use horse-drawn wagons, transporting the material excavated from soil cuttings to fill areas, where the soil or rock was just tipped to form poorly compacted embankments [6].
The best way to build an embankment, especially in clay, would have been to form the slope in shallow layers (between 0.6 and 1.2 meters of thickness) for the full length, and give each layer and foundation sufficient time to compact before placing a new layer. Despite its reliability, this method was hardly ever used to construct the whole embankment, as it was too slow. Nevertheless, it was quite usual to compact some critical portions of embankments in layers. Thus, generally the embankments were constructed to full height by end-tipping from the advancing head of the slope.
Nearly all railway embankments were constructed of relatively non-compacted material; before the 1930s, little or no compaction was possible, as the construction plant had not been developed and the process of compaction was poorly understood. Besides, the embankment slope angle was based on short-term angles of repose, attained during construction, as this minimised the amount of soil needed per metre length of embankment. These would be considered over-steep in modern practice [7].
The consequence of these construction methods led to large settlements commonly occurring during or soon after construction. Slope failures sometimes occurred during and after construction and some remain a major hazard [8]. Loss of vertical alignment due to failure and settlement were typically repaired by filling and raising the track to its required level. However, settlements, and occasionally failures, have continued to the present day. Moreover, like other engineering structures, cuttings and embankments age under the effects of load, weather, animal burrowing, vegetation, etc. [2] This can lead to earthwork instability, affecting the trafficked surface, with immediate safety implications for users and costs for owners. Hence, earthworks require maintenance, and the need to undertake it has become increasingly apparent as the material within these structures ages. The legacy of the construction is reflected in the performance of earthworks and hence in the degree of current maintenance.
3. Geotechnical Asset Management (GAM)
Asset management is a strategic process to systematically control all the phases of physical assets throughout their life cycle, meeting the required level of service in the most cost-effective manner. Efficient and effective management of infrastructure assets is essential if performance requirements are to be met. Infrastructure earthworks have typical performance requirements and ensuring that the safety of those using the structure is the main one [9].
Geotechnical asset management (GAM) is a sector of transportation asset management (TAM) [10]. Due to the importance of geotechnical assets in the support and performance of the transportation infrastructure, several agencies have begun to sharpen their focus on geotechnical elements. A key factor in the success of railway GAM is careful consideration of monitoring, to clearly define why it is needed and which measurements are required. Monitoring of embankments, and earthworks in general, is difficult and data is commonly used to assess risk of failure and the need for interventions [11]. Setting or choosing appropriate thresholds against which to assess monitoring data may often be complicated, as infrastructure slopes are unique in construction history, geometry and geological conditions [12]. Geotechnical assets can be variable in terms of geometry and material properties, often containing local defects, and are often covered with vegetation, which makes assessment and condition monitoring difficult [13,14]. Moreover, the variety and complexity of modes of failure sometimes make their mechanisms difficult to evaluate [12]. For the choice of the most suitable monitoring system, or combination of systems, the engineer needs to consider the different limitations of each system. For instance, visual inspections have limited usefulness in determining the condition of a slope or the objective measurement of instability, as they provide little information on sub-surface processes [15]. Slopes will not always show signs of distress and can fail with limited, if at all any, indication of deterioration prior to rapid failure [16]. Predicting the transition from slow acceptable movement to rapid catastrophic movement is one of the most difficult aspects.
It is also not clear how parameters such as surface displacement should be used as an indication of incipient failure. Track geometry data provides millimetre precision in the recording of rail positions. The frequency of collection is dependent on route criticality and the availability of data in some parts of the network may be insufficient for trend analysis [17].
The interpretation of the exact geological/geotechnical significance of millimetre to centimetre (per year) displacements can be very challenging because very slow ground surface deformation may arise from a wide variety of causes and, therefore, their presence on slopes may not always reflect shear movements or occurrence of landslides [18]. Thus, it seems that the ability to monitor more slopes at greater spatial and temporal resolution requires the handling, processing and analysis of significantly more data than tools at the state of art are able to [3].
One of the major aims of the project presented in this paper is to automate the process of data interpretation, to improve the potential scalability of application through the creation of an algorithm (Section 5.2).
4. Project Background
4.1. Background to Track Geometry
Specific performance requirements are strictly related to track geometry quality. The European Standard EN 13848-1 “Railway applications/Track-Track geometry quality” [19] defines track geometry quality as an “assessment of excursions from the mean or designed geometrical characteristics of specified parameters in the vertical and lateral planes which give rise to safety concerns or have a correlation with ride quality”. It also defines the minimum requirements for the quality levels of track geometry and specifies the safety related limits for each track geometry parameter. The importance of knowing the track geometric quality arose in the middle of 20th century, when European infrastructure managers developed their own track recording vehicles, allowing a continuous measurement of track geometry and based on this, their own track geometry quality evaluation standards [19]. As railway line speeds have risen, the quality of track geometry has become increasingly important: a small irregularity will hardly be noticed in a slow-moving train, whereas passenger comfort in a high speed train might be significantly compromised and the dynamic load applied to the track might be damaging to both track and train.
4.1.1. Track Recording Vehicles (TRV)
The track position tends to move from the designed one with the continuous passage of vehicles. Defects in the geometry are caused by track support settlement and local irregularities associated with dipped joints, wetspots, wheel burn, rail corrugation, etc. Monitoring track geometry is important for maintaining safe train operation by identifying geometric irregularities that need to be corrected. Dedicated track recording vehicles (TRVs) accurately measure track geometry and provide the magnitude and locations of exceedances according to the local line speed to inform track maintenance [20]. Observing track geometry from a TRV allows for continual track monitoring, so that both sudden and longer-term changes in track geometry can be detected. This provides the possibility of timely maintenance intervention, avoiding the need for more extensive maintenance at a later date, and allows degradation to be tracked so future track maintenance can be planned more effectively.
The use of TRV, wherever practicable, is planned on the following:
- passenger running lines, goods running lines, carriage lines and loops;
- high speed (60mph and above) crossover routes;
- long crossovers with more than five sleepers between the through timbers on the crossover road;
- crossovers between lines with different cant.
According to the European track geometry quality standard [19], longitudinal level is measured for individual rails and defined as the deviation of consecutive vertical alignment of rail levels from the mean vertical position.
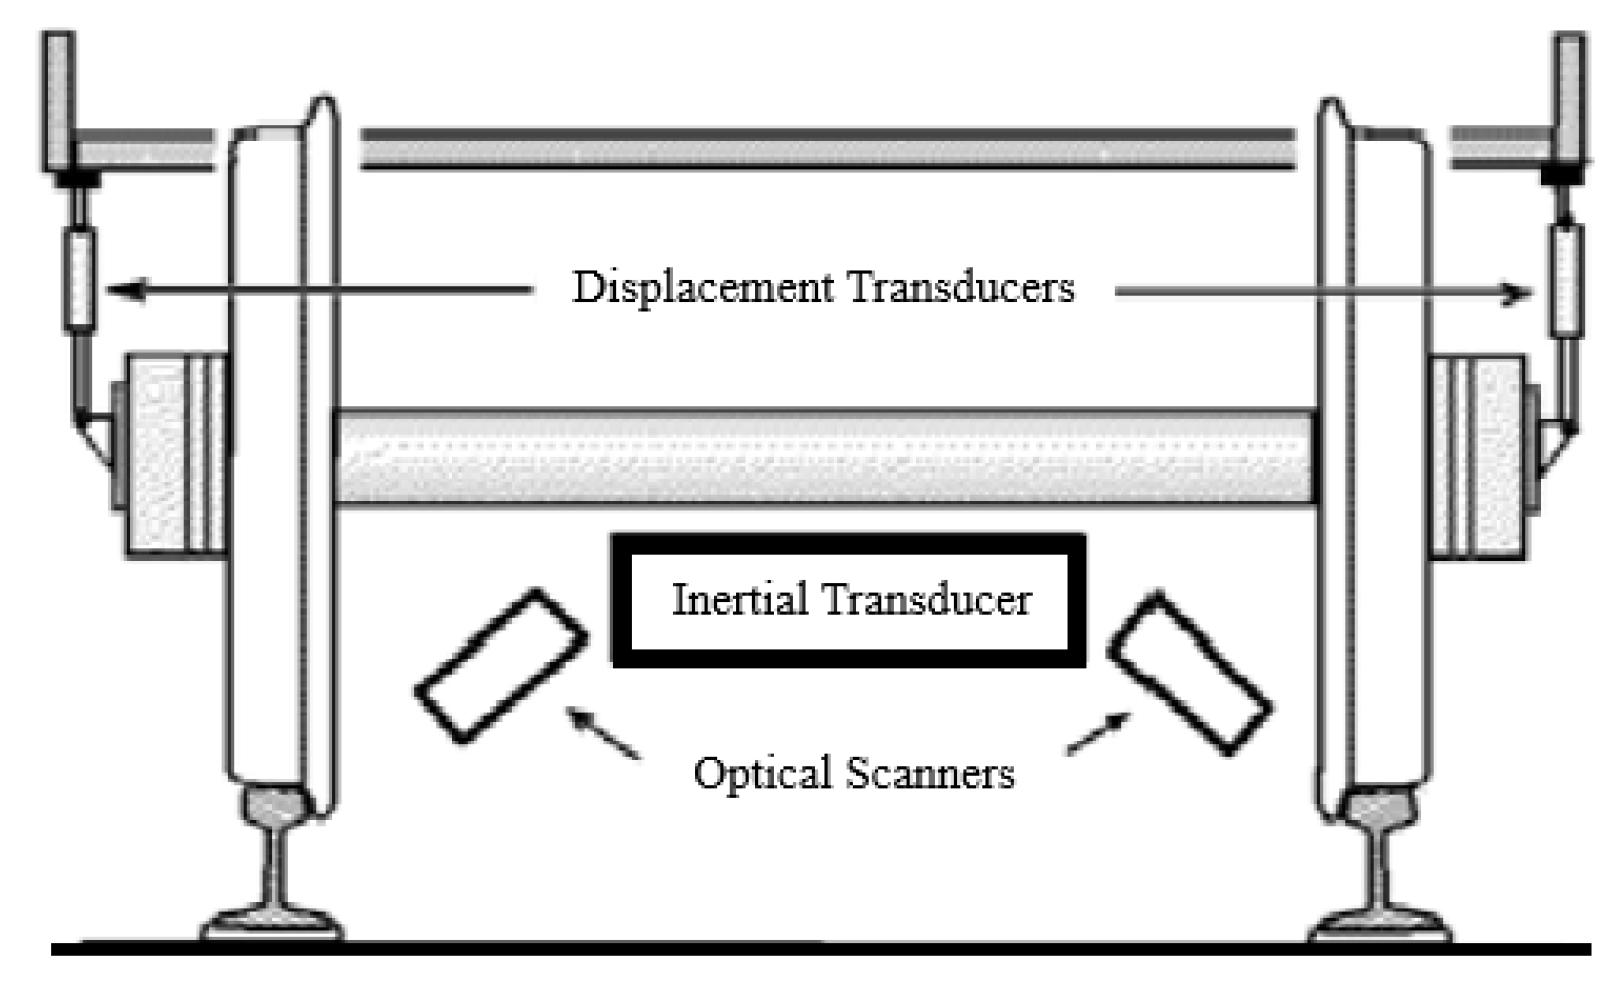
The vehicles use a variety of sensors, lasers, measuring systems (Figure 1) [21] mounted on a bogie to detect, measure and translate characteristics of track geometry into quantities that can be used for further data processing measurements. The mean vertical position is calculated using consecutive measurements taken at maximum 0.5 m intervals over a distance that is twice the higher wavelength in the band of interest.
In the past decade, various studies [20,22,23] have been carried out on developing techniques to determine the individual elements of track geometry using inertial sensors fixed to in-service trains. Measured vehicle vibration signals are influenced by track features such as rail irregularities, corrugation, vertical alignment, track stiffness, changes in rail bending properties due to the presence of welds, and cracks.
Various techniques are used to monitor the track for these defects. Most of those employ a frequency-based analysis so that short and long-wave defects can be differentiated [24].
Before starting a run, track features such as track identification and mileage are input either manually or automatically into the TRV. As well as track geometry parameters, other parameters are recorded, such as the distance ran by the TRV, in order to aid geo-referencing of recorded measurements. Location is either obtained automatically by use of a satellite positioning system, or manually using mile posts. Twist, curvature, horizontal alignment and vertical alignment (Section 4.1.2) are either directly measured or calculated by the TRV.
Data are often processed on board the TRV: graphs are produced, track quality indicators are calculated, and line parameters are drawn up. The data processing involves calculation of standard deviation for track segments.
Outputs from TRVs are used to plan maintenance, track quality monitoring and safety assurance, as related to track geometry. In order to measure the parameters under track loaded conditions, the sensors, placed under the vehicle’s frame, are positioned as close as possible to one of the vehicle’s loaded axles to respect measurement conditions as indicated in EN 13848. Different track recording vehicles should give comparable results when measuring the same track under the same conditions. To do this, it is necessary to ensure that the measurement results are equivalent, and the output formats are compatible.
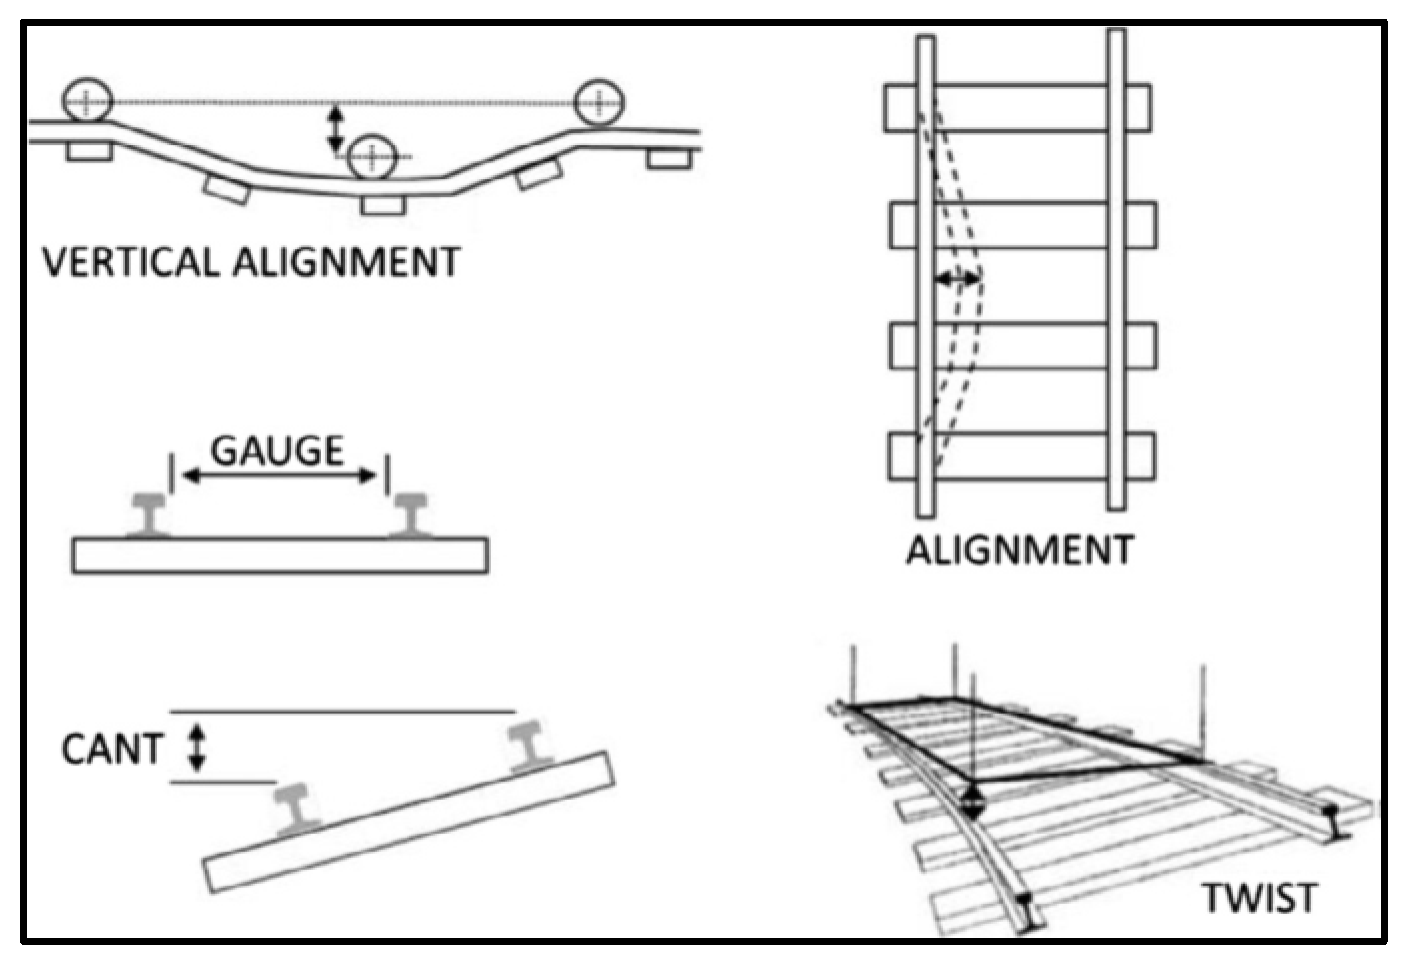
4.1.2. Measurable Track Geometry Parameters
There are five measurable track parameters (Figure 2); vertical alignment (top), horizontal alignment (line), cant, gauge and twist. Standards describe each parameter and prescribe minimum and maximum allowable values for these parameters based on the type of railway line [4]. The alignments are evaluated along a space domain called wavelength λ. Two cut-off frequencies are regularly used by Network Rail: 35m for general track geometry irregularities, and 70m if longer wavelengths are important, typically for higher speed running.
Each track geometry recording run provides a measure of current track geometrical condition, but gives little indication of the rate at which the track geometry changes with time. To provide this information, it is necessary to use an index that quantifies track roughness. For this purpose, rail authorities and practitioners often use the statistical measure of standard deviation (SD). For Network Rail modus operandi, each route is divided into eighth mile (220 yard) sections, and the value of each parameter is presented as an SD value (in mm) of the filtered data for the whole eighth mile section. In this way, the rate at which parameter changes with time can be monitored. While eighth mile SD data gives a good basis on which to plan track maintenance, it is not suitable for looking at localised track geometry faults which render the track unsafe. However, the track geometry data also provide the positions of localised problems, which require different courses of action depending on their nature and severity. The frequency for undertaking geometry measurements depends on the polity of the infrastructure owner and on factors like type of traffic and line speed. The British standard suggests frequency depending on track category; nominally the recording frequencies are 4,8,12,16 and 24 weeks for Track Category 1a, 1, 2, 3 and 4/5 respectively [19].
4.2. Background to the Analysis of Embankment Instability
4.2.1. Sharpe and Hutchinson’s Study
In 2014, Network Rail commissioned AECOM to undertake a study, where the objective was to review TRV records on selected sites on the Midland Main Line, to assess whether geometry data could be used to detect early stages of embankment failure. The sites were identified by the Geotechnical Route Asset Management team, as earthwork sites susceptible to failure. Failures had occurred during the heavy rainfall of Winter 2013/14 in that area. The study was completed by Dr Phil Sharpe (AECOM), who worked closely with Dave Hutchinson (Geotechnical Route Asset Manager, Network Rail), and later published a joint paper on the methodology [25].
Track geometry records, on a monthly basis, were processed, allowing accurate trending of the data collected for the period between November 2010 and May 2014. As an attempt to use track geometry data to observe ground movements, the most fundamental parameters appeared to be vertical alignment (Top) and lateral alignment as these are directly affected by earthwork movements. It was also found that a combination of two parameters could be used to indicate whether deterioration in track geometry was due to earthwork movement: lateral alignment (Align) SD and the difference between Left (rail) Top SD and Right (rail) Top SD (referred to as differential Top or dTop), indicating the rotation of the track.
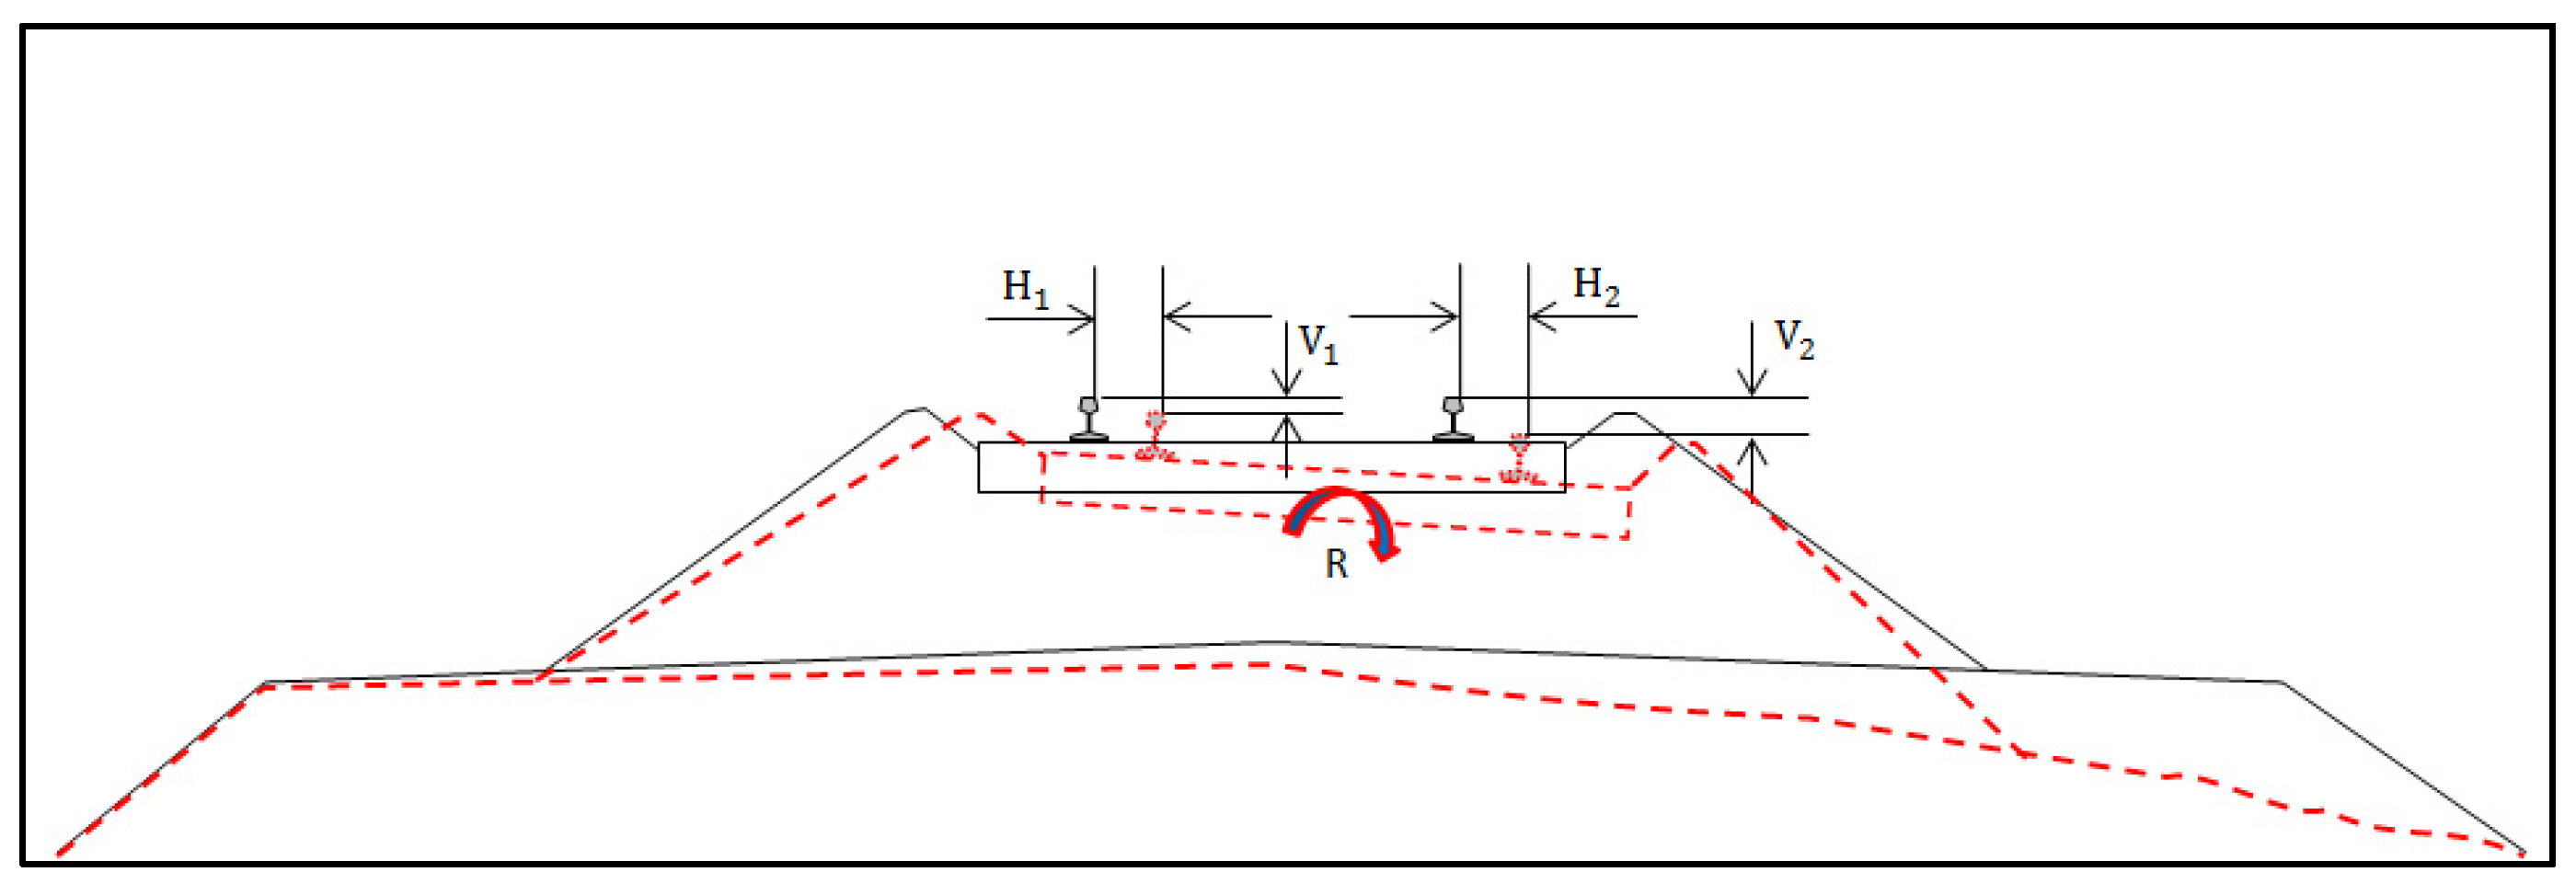
As shown in Figure 3, when the embankment instability starts developing, the track follows the movement of the earthworks.
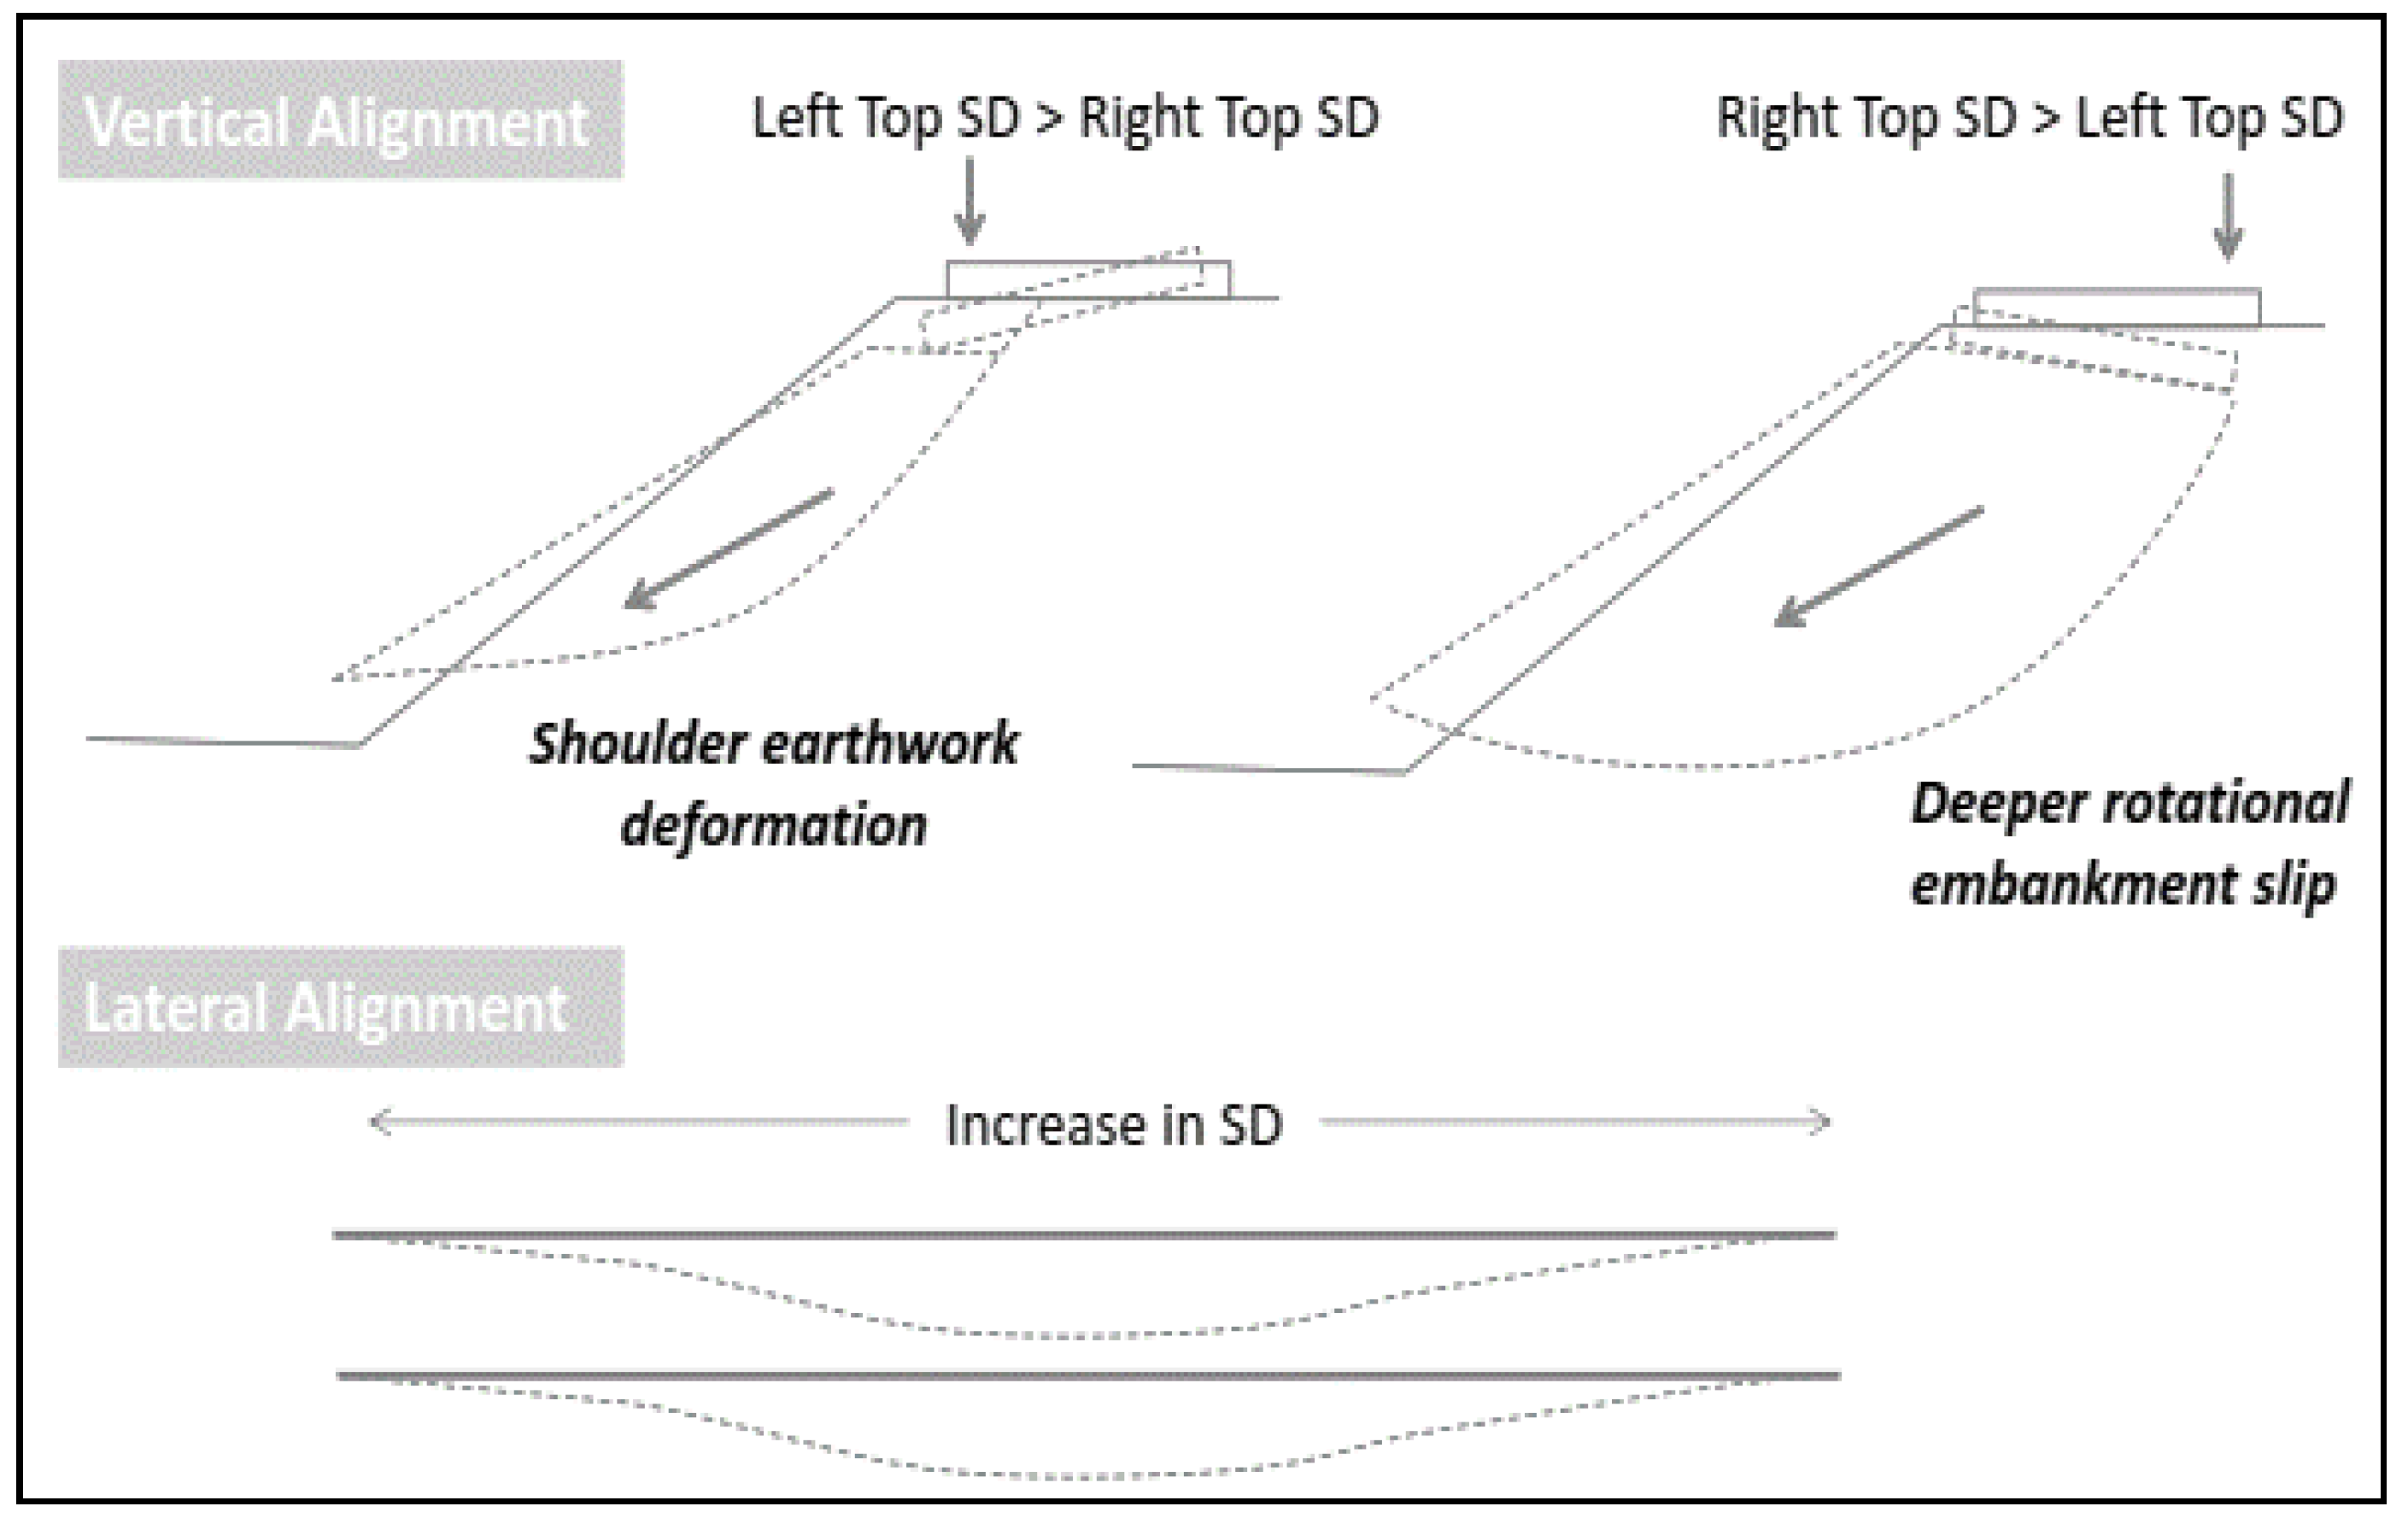
Earthwork movements appear to be characterised by excessive deterioration in both lateral alignment and difference in vertical alignment. Looking at the train direction of travel (on the UK network trains typically travel on the left hand tracks), a shallow rotational slip is indicated when the Left Top SD is greater than the Right Top SD; in this case the dTop will be a positive value.
A deeper rotational slip, however, is indicated when the Right Top SD is greater than the Left Top SD, thus the dTop will be a negative value (Figure 4).
As a result, the study suggested that the track geometry measurements contain strong indicators of where earthwork movements are occurring and, for those items deemed to have failed in 2013/14, there was evidence of earthworks instability in the track geometry data at least three years before the point of failure. A change in vertical alignment on one or both rails is shown, accompanied by differential settlement between the two rails and lateral track movement associated with movement along the slip plane. Major areas of earthwork movement were known in advance, but there were many areas which displayed indicators of minor earthwork movement, which were not previously identified as experiencing earthworks movement [25]. By taking an overview of the whole range of earthwork movements observed in the data, Sharpe and Hutchinson proposed a classification of the severity of earthwork movements from “Negligible” (any track roughness would be addressed during the course of routine maintenance and would not therefore be identified as an earthwork problem) to “Failure” (the point at which it is obvious that there is a serious earthwork issue that requires regular maintenance):
- Negligible <1 mm deterioration in SD per year
- Minor 1 to 2 mm deterioration in SD per year
- Moderate 2 to 4 mm deterioration in SD per year
- Failure >4 mm deterioration in SD per year
No defined parameter was mentioned in the proposed classification, but a reasonable interpretation of the study outcomes was that if a site was presenting both dTop and alignment deterioration, the greater of either of these parameters should be used to classify failure.
5. Embankment Instability Modelling Project
In 2017, Network Rail released a challenge statement titled “Detection of Geotechnical Asset Failure by Means Other than Train Drivers or Lineside Staff” [3]. The challenge statement set out the research needs related to improved use of analysable datasets to assist with the monitoring of geotechnical assets, particularly embankments. Furthermore, the challenge statement also suggested the use and integration of datasets from different disciplines, with geotechnical datasets and referenced track geometry data as a potential data source.
In 2018, the project presented in this paper was instructed by Network Rail. The aim was to refine and test the concept of using track geometry data to perform an analysis of embankment instability on a large sample of assets presenting known issues and so develop an algorithm to quantify the level of instability. The output of the algorithm has been used in a parametric study to establish whether there is enough confidence to consider wider use of this technique as a risk marker for the prioritisation of asset vulnerability to failure, driving further inspection or prioritisation of other remedial actions.
AECOM were provided with the locations of the embankment assets identified for either renewal or refurbishment during Control Period 6 (CP6). The assets per category, identified along nine routes, in total are: 274 “renewal”, 783 “refurbishment”, 577 “maintain” and 38 “mitigation only”. The analysis, though, could not be completed for some sections of track, with the main limitations being the quality and frequency of the track geometry data recorded by the TRVs.
5.1. Gathering Data
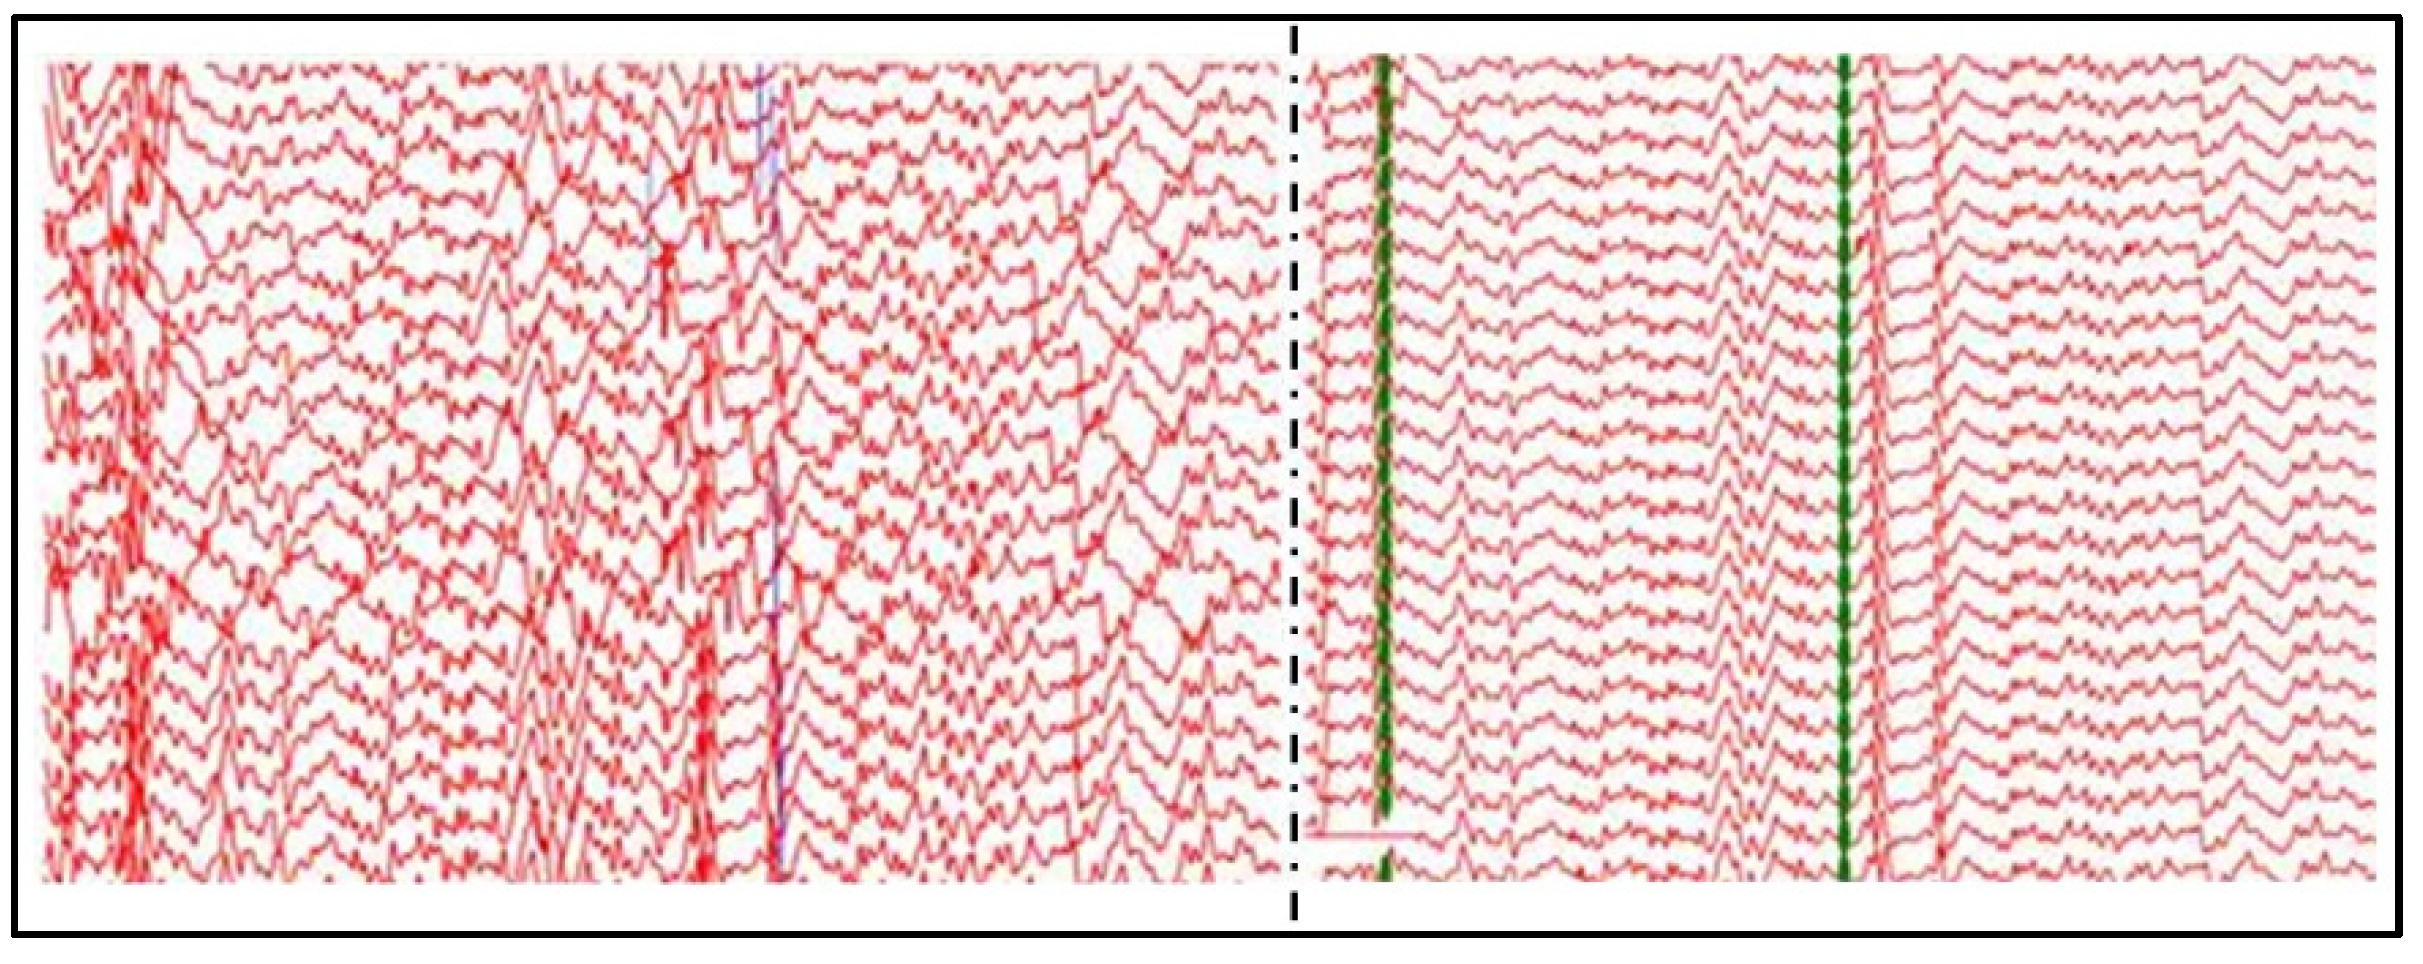
Approximately 60,000 track geometry runs, provided by Network Rail, were analysed for this project. However, the positional element of the individual track geometry runs were not accurate enough to carry out long-term trending in their original state. Hence, to allow trending to be undertaken, each of the track geometry runs require aligning through a semi-automatic web-based tool built by AECOM. The semi-automatic tool displays all the available geometry runs for a given section of track in a web browser. Next, a user identifies and selects the location of a rail weld that can be seen in each of the individual geometry runs—rail welds show up on the geometry trace with a recognisable signature. Finally, once the user has selected the same weld throughout all the geometry traces, the alignment tool stretches and compresses the data so that all the welds now line up.
Figure 5 shows the difference between the track geometry runs prior to and following the alignment procedure. Once the raw track geometry data has been aligned, the data is processed (at 10-yard intervals) and transferred to AECOM’s linear asset management tool TAMP [26], so that it can be visualised and analysed.
For the initial study (Sharpe, 2014), a base-length of 36.6 m (equivalent to two rail lengths) was used for the computation of SD (i.e., the total length over which points are used for the SD calculation). In the embankment instability modelling project, a base-length of 18.3 m (equivalent to one rail length) was used for the SD base-length. Figure 6 shows how, despite the fact that the development of key indicators of earthwork movement is evident for both base-lengths, SD data processed using the 18.3 m base-length give more localised detail, while the 36.6 m base-length data show a smoothed profile.
The following parameters are used for embankment analysis. Two of these parameters are composite parameters, produced using a combination of parameters available as output of the runs.
- Align = Alignment 18 m SD
- Top = Minimum of (Right Rail Top SD) or (Left Rail Top 18 m SD)
- dTop = (Right Rail Top 18 m SD)–(Left Rail Top 18 m SD)
5.2. Methodology
This paragraph describes the conceptual development of the methodology and discusses assumptions and limitations of the methodology itself.
An algorithm, coded in SQL, was developed to calculate the new metric. The algorithm was underwritten by the main assumption that track geometry cannot improve without a maintenance intervention. In addition, the algorithm was developed for the 35 m wavelength alignment (Align) and the differential top (dTop) parameters only, which is based on the previous findings [25]. Top is not a direct input for any iterations of the algorithm; as a result, this study only considers the deterioration of Align and dTop as indicative of embankment instability. Calculating the deterioration of the Align SD is a logical process: increases in Align SD values between measurement runs is considered deterioration, while decreases in Align SD values between measurement runs infers improvement, assumed to be due to track maintenance activity (although this can in some cases be due to seasonal effects). For the purpose of calculating an embankment instability metric, periods of deterioration and improvement are based upon the behaviour of the Align parameter only, as it is not possible to infer deterioration from dTop alone. Thus, dTop is assumed to deteriorate only when Align SD deteriorates, and improve only when the Align SD improves.
The algorithm uses the understanding of a temporal variation in the deterioration of track geometry through breaking down the track geometry data into year-long periods. The year-long deterioration periods used do not follow a calendar year. Through the analysis of track geometry data, it has been noted that embankment behaviour sometimes shows seasonal variability. Hence, to encompass one full dry season and one full wet season for each period analysed, it was decided to run the annual period of analysis from 01-May to 30-April named “deterioration year” (DetYr).
5.2.1. Algorithm and Development of Two New Metrics
As said in the previous paragraph, the algorithm only considers deterioration in the dTop and Align parameters. It combines the deterioration rates found in the 18 m dTop SD and 18 m Align SD parameters by averaging them, and outputs two metrics initially referred to as AvGrad18 and MaxGrad18. MaxGrad18 is the maximum combined deterioration rate found between two sequential recording runs during a given deterioration year, and AvGrad18 is the average combined deterioration rate over the whole deterioration year. Both metrics are calculated on a 10-yard basis.
5.2.2. Numerical Simulation
Track geometry must be inspected frequently to determine track condition, to ensure safety and suitable ride quality. Hence, due to the discrete nature of the TRV runs, the behaviour of the track is unknown between inspection runs. Therefore, to better understand the performance of track geometry and the measurement frequencies, a numerical simulation of the deterioration-maintenance cycle of an idealised section of track was carried out. The primary purpose of the simulation is to understand the relationship between sampling frequency and apparent rate of deterioration for a given actual rate of deterioration. Random number generation was used to introduce some variability into the maintenance regime, in order to represent realistic conditions.
The Top SD parameter is used to simulate the geometry deterioration and track maintenance events, since the track maintenance and inspection thresholds are predominantly determined based on the Top SD values. The first stage in the development of the numerical model was to set out five assumptions:
Deterioration rate.
To simplify the problem in the first instance, the rate of deterioration was assumed to be constant for each simulation. To complete the deterioration-maintenance cycle. the only other values required are the SD value at which maintenance is triggered and the SD value achieved after maintenance.
Maintenance trigger level.
As a guide to maintenance trigger levels, reference is made to the relevant Network Rail Standard (NR/L2/TRK/001/mod11). The alert levels give values for the Top SD of 2 mm, 3 mm, 4 mm, 5 mm and 6 mm, corresponding to 125 mph, 100 mph, 75 mph, 50 mph and 25 mph, respectively. The Standard states that no immediate action is required at these alert levels, but that the fault should be corrected during the next period of planned maintenance.
The Top SD value achieved following maintenance.
The primary method of maintenance is assumed to be tamping. While the trigger levels for maintaining the track are set by Network Rail and are dependent solely on speed, the standard of geometry achieved by maintenance should be independent of line speed. Observation of maintenance cycles recorded during the study suggests that Top SD value is reduced to a post maintenance value of between 0.5 mm and 1.5 mm by tamping, further bolstered by the work of Audley and Andrews [27], which concluded similar post maintenance Top SD values. This is incorporated into the simulation assuming “Top SD post maintenance” equals to 0.5 + rnd, where rnd is a random number between 0 and 1.
Planned maintenance frequency.
The planned maintenance frequency is based on a simple calculation of the difference between the maintenance alert level and the average SD after maintenance, which is assumed to be 1 mm. This is likely to represent a maintenance frequency slightly higher than is necessary, to ensure adequate opportunity to maintain.
Simulation of recorded SD time history.
The simulation proceeds by calculating the planned maintenance periods. The true Top SD time-history is computed according to the criteria described. However, if the Top SD at a given planned maintenance event does not reach the alert level, it is assumed that no maintenance is undertaken until the next planned date.
5.2.3. Numerical Simulation—Results
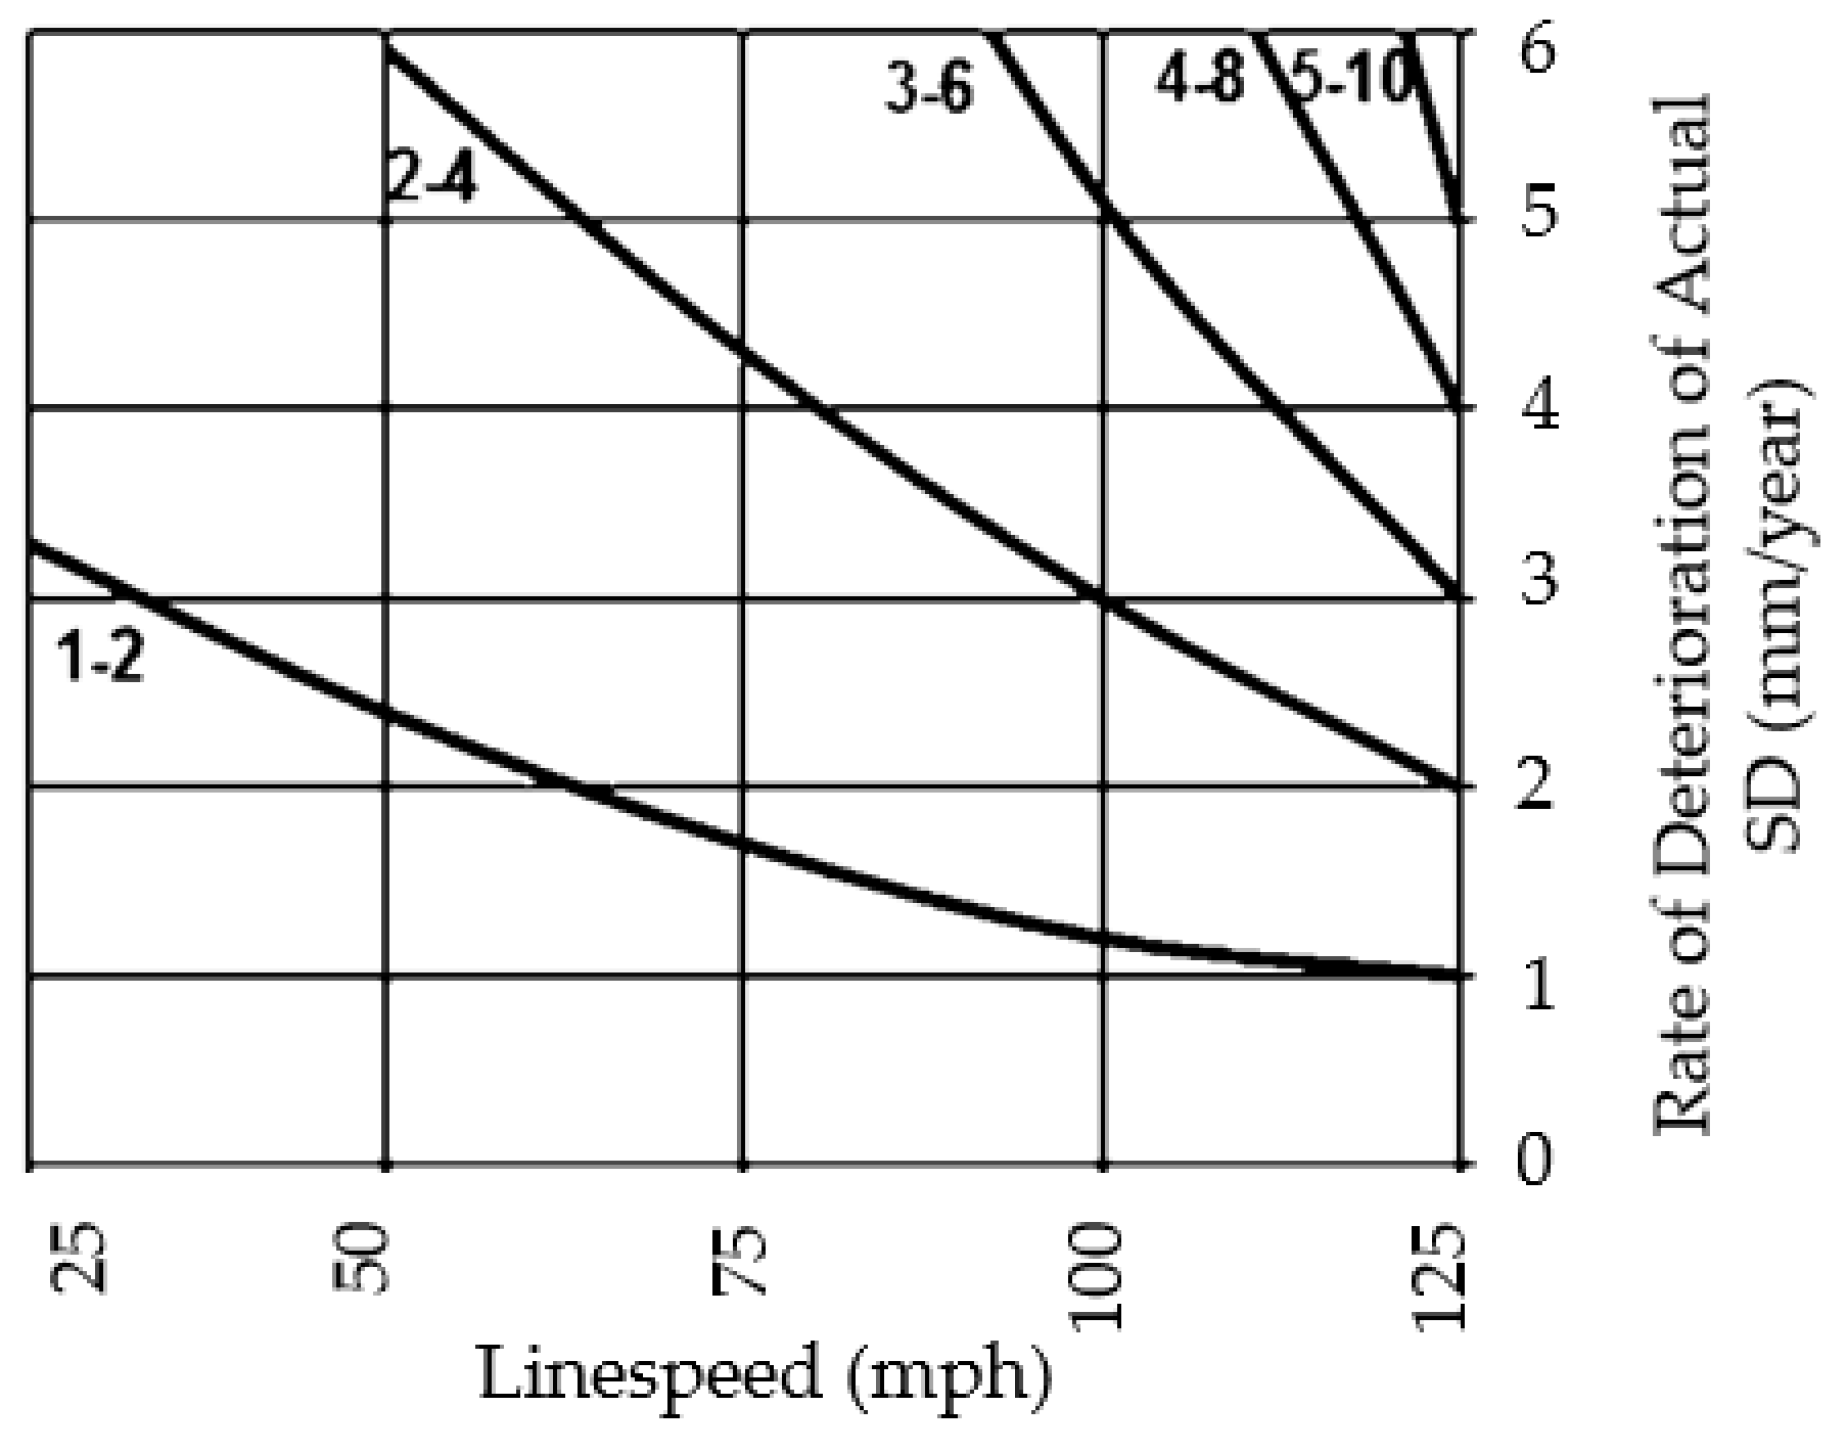
The numerical simulation model was run for line speeds ranging from 25 to 125 mph and for deterioration rates ranging from 0 mm to 6 mm SD per year. The output of the simulation is a set of minimum and recommended threshold values for the track geometry recording frequency. The minimum threshold is the theoretical recording frequency pertaining to a given combination of rate of deterioration and line speed, below which it will not be possible for any two successive recordings to fall within two successive planned maintenance interventions. The recommended threshold is the minimum frequency in order to have a reasonable chance of observing the actual deterioration rate.
The indicative threshold values from the simulation are shown in Figure 7, which plots the minimum annual track geometry recording frequency thresholds against the line speed and true deterioration rate. The chart shows that as the line speed and deterioration rate increase, the minimum number of annual geometry recording runs required to accurately calculate deterioration rate increases.
The numerical solution outlined demonstrates the theoretical impact of the track geometry recording run frequency on the observed rate of deterioration of track geometry parameters. In addition, it outlines the minimum recording frequencies required to compute a reliable deterioration rate.
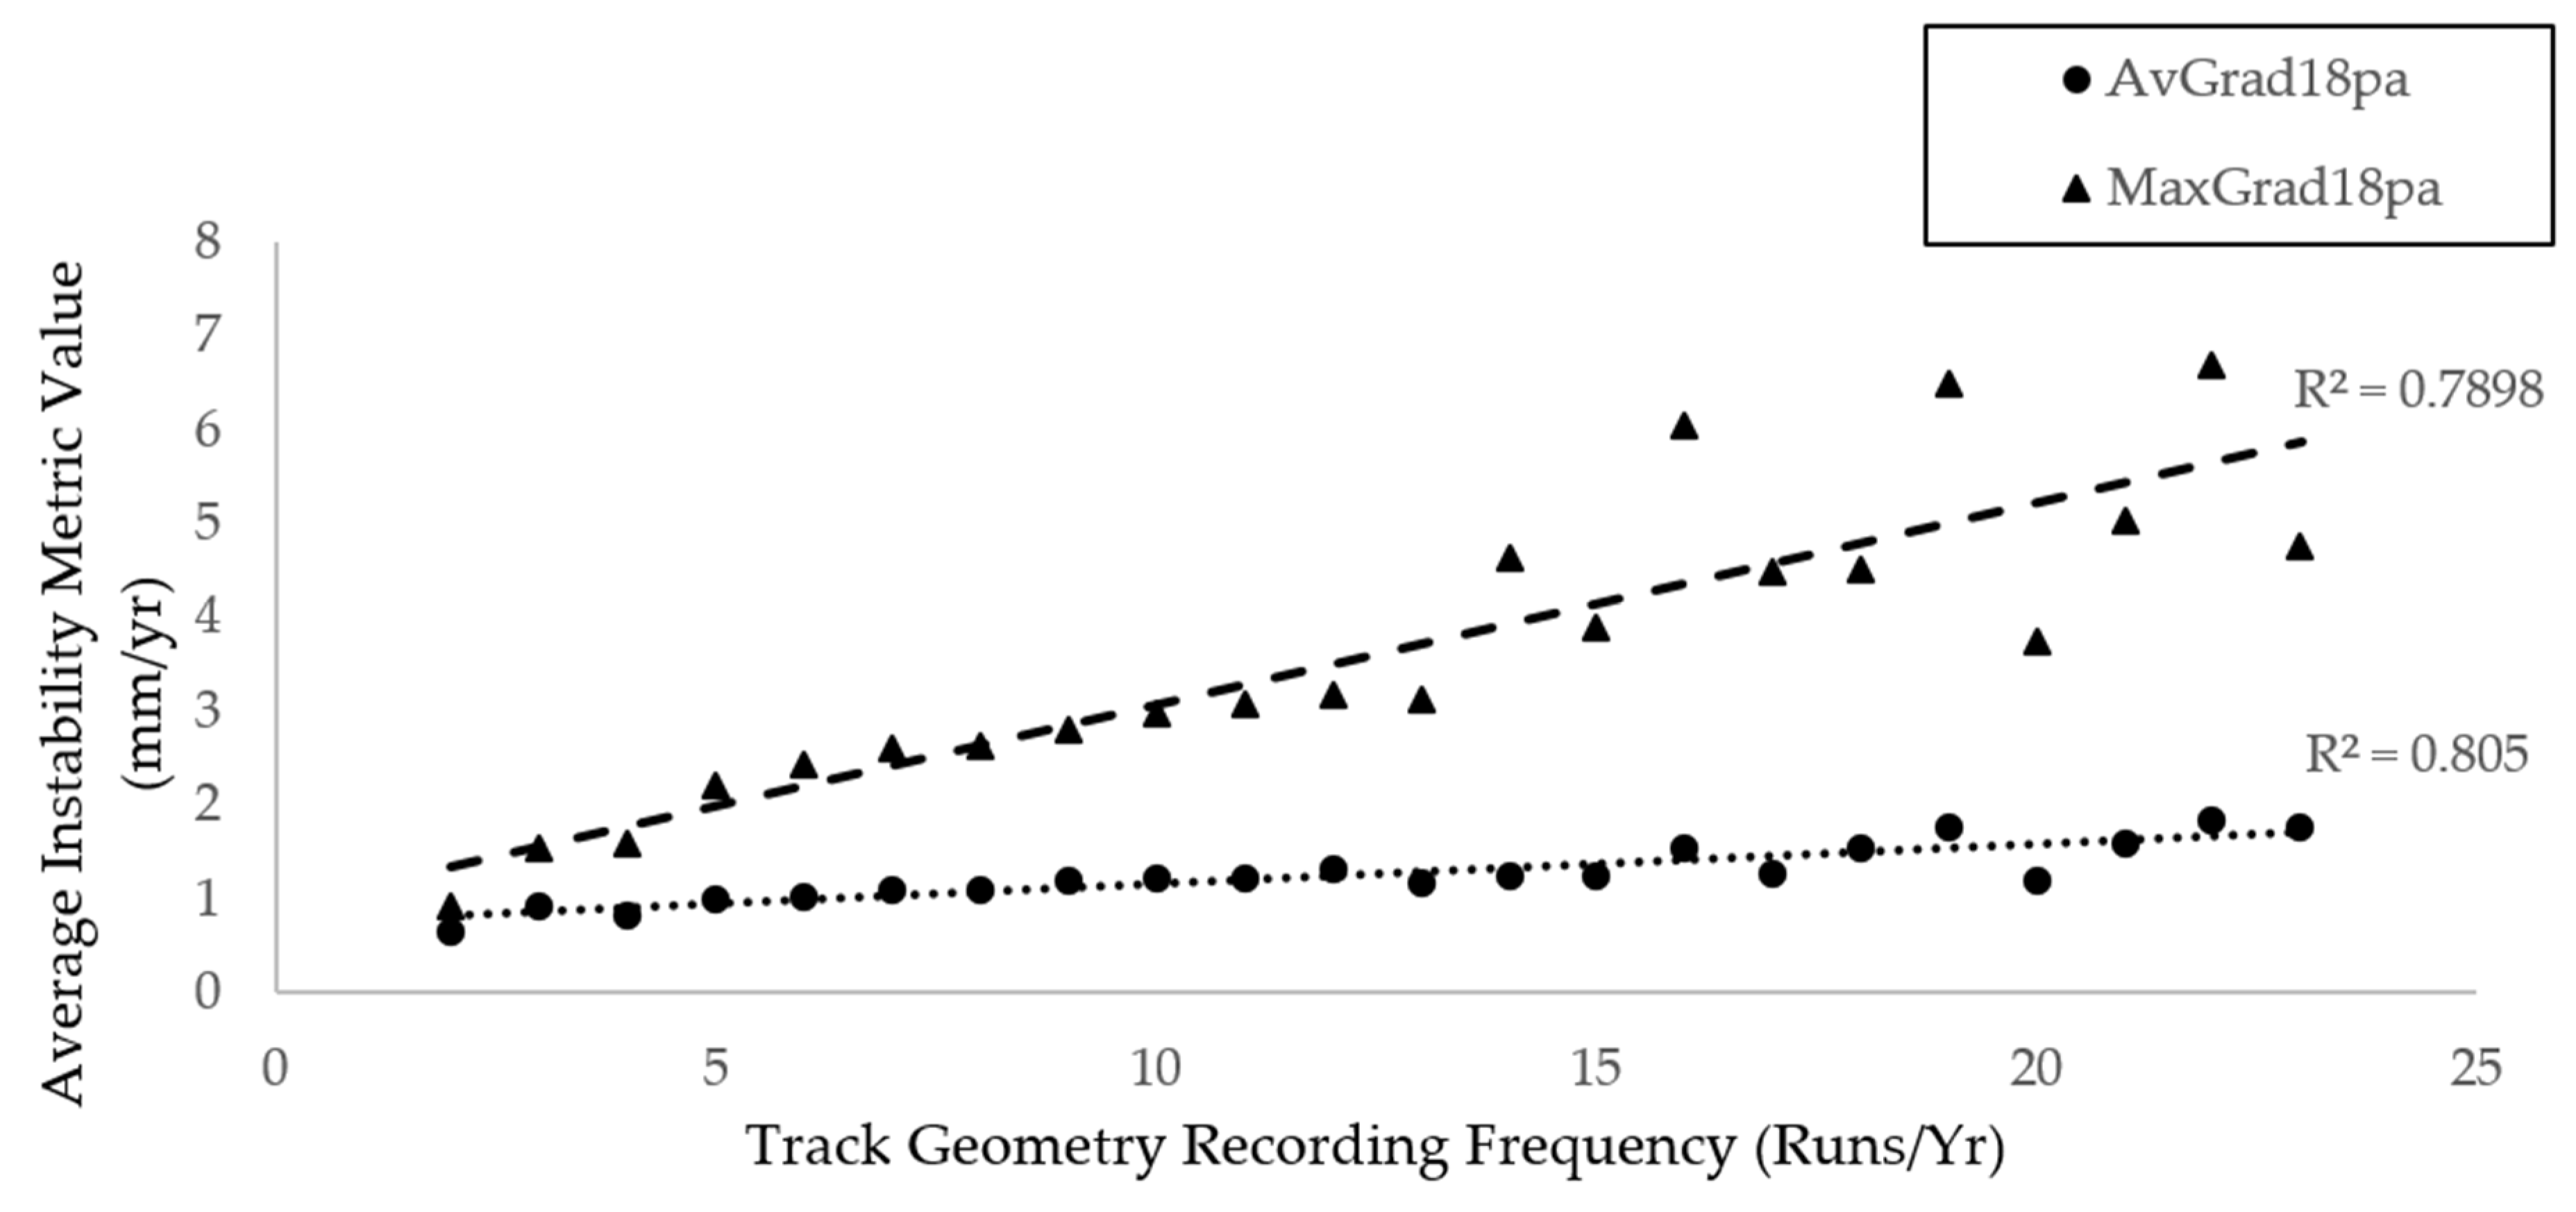
Figure 8 shows the average MaxGrad18 and average AvGrad18 values for track geometry recording run frequencies between 4 and 23 records per year. All the results for each DetYr for each 10-yard section have been used to calculate these average metric values. Figure 8 clearly shows the strong positive correlation between the frequency of the recorded track geometry data and the calculated AvGrad18 and MaxGrad18 metrics, confirmed by the high R2 values. Thus, the higher the run frequency, the higher the observed deterioration rate.
The graph also shows that the influence of the recording run frequency is less significant for AvGrad18 than for MaxGrad18. Therefore, although the MaxGrad18 metric was calculated in an attempt to measure the maximum rate of deterioration occurring during a year, with the assumption that it was this maximum rate which would indicate the level of risk related to failure, it can be seen that the value is highly sensitive to the recording run frequency. This level of sensitivity to the recording frequency is seen as too high to assert its validity, or to reliably correct the measured value based on the frequency. Based, therefore on this consideration, the AvGrad18 metric has been chosen as the better measure to assess earthworks instability using the track geometry data, due to its reduced sensitivity to recording frequency. It is referred to as the “embankment instability metric” (EIM) from this point onwards in this paper.
5.3. Limitation and Exclusion in Data Processing
The EIM was calculated for 10-yard sections of track throughout each asset for all of the years in which there was available and sufficient data (at least two track geometry recordings per deterioration year). However, some exclusions were made in this calculation of the EIM. EIM results have been discounted for specific DetYr in specific 10-yard sections in cases where:
- The track geometry data is older than 2010, as this data is not reliable enough to be analysed. Therefore, the first deterioration year for which results are given starts on 01-May-2010;
- The track geometry data is more recent than 01-May-2018 (since at the time of the analysis there was not a complete year of data yet);
- Tracks are listed as bi-directional, as left and right rail labelling couldn’t be verified and this consistently affects the calculation of differential Top;
- No data exists during the deterioration year (this is the case in a reasonably large number of cases, mostly in pre-2010 data, but some more recent ones, likely to be due to TSRs or even line closures);
- Fewer than two track geometry runs are recorded during the deterioration year.
5.4. Embankment Instability Metric Values
The following table (Table 1) presents the values generated for the embankment instability metric for all of the processed assets, following the exclusions indicated in Section 5.3.
6. Results
6.1. Embankment Instability Metric Thresholds
As suggested, in previous work to establish this technique (Sharpe and Hutchinson, 2015) [25], thresholds of geometry deterioration have been suggested based on observations from failure sites. The study presented in this paper examined a further 51 known failure sites; of these, there are 28 sites which have sufficient data in the reported time period of failure, and examination of the track geometry data suggests clear signs of failure in 19 of these cases. For these 19 sites, the maximum embankment instability metric values range between 4.2 mm/yr. and 12.8 mm/yr. for all years examined over all 10-yard sections of the failure sites.
This assessment of the rate of deterioration for these earthwork failures, combined with an understanding of the likely rates of deterioration due to trackbed failure and the effect of maintenance, confirm the assertion of the following suggested risk level thresholds below in Table 2. In this project, “risk” is defined as the effect of embankment problem on track system performance, with the purpose of highlighting the appropriate maintenance action to be undertaken. These thresholds apply to the calculated embankment instability metric and are the same values as shown in Sharpe’s study.
It should be noted that these risk thresholds are only intended as guidance. Presently, there has been limited calibration of these values and they are based on limited observations from known failure sites. Although an average metric value for an embankment asset has been considered as a measure in this study, it is recommended that the risk classification thresholds apply to the in-year 10-yard metric values, rather than an averaged metric value.
The thresholds above have been used to show the split of observed embankment instability metric values for the population of all embankment assets analysed in this study. Considering the max metric value generated (for all years and 10-yard sections) of each embankment asset, the thresholds showed 4% negligible, 23% minor, 41% moderate and 32% high risk.
6.2. Recommended Track Geometry Recording Frequency Threshold
For the results presented along with this project, a minimum of two track geometry recordings are required in any one deterioration year, to calculate an embankment instability metric value for that year in that section. However, the study has suggested that a higher frequency of recording is recommended to calculate metric values.
The numerical simulation used to model changes to track geometry recording frequency suggests minimum and recommended thresholds for the recording frequency in order to reliably calculate the embankment instability metric. The thresholds are shown in Figure 7, and it is suggested that the recommended thresholds are applied. These thresholds should be calculated by assuming a deterioration rate of 4 mm/yr. (as this is the high-risk level), for example a line speed of 110 mph would require a frequency of six records per year.
6.3. Sensitivity Analysis
A sensitivity analysis has been conducted to consider the effect of other variables on the metric (such as track curvature, tonnage of rail traffic, etc.) and the metric has been shown to be independent to these other variables.
Influence of track curvature: since the embankment instability metric considers the deterioration rate of alignment and differential Top in the calculation, it is worth considering whether the curvature of the track, directly related to the track cant, has significant influence on the deterioration of the alignment. The chart below (Figure 9) shows the variation of the embankment instability metric in comparison to the change in track cant. As can be seen, there is no evidence to suggest any correlation between the alignment deterioration rate or embankment instability metric with track curvature.
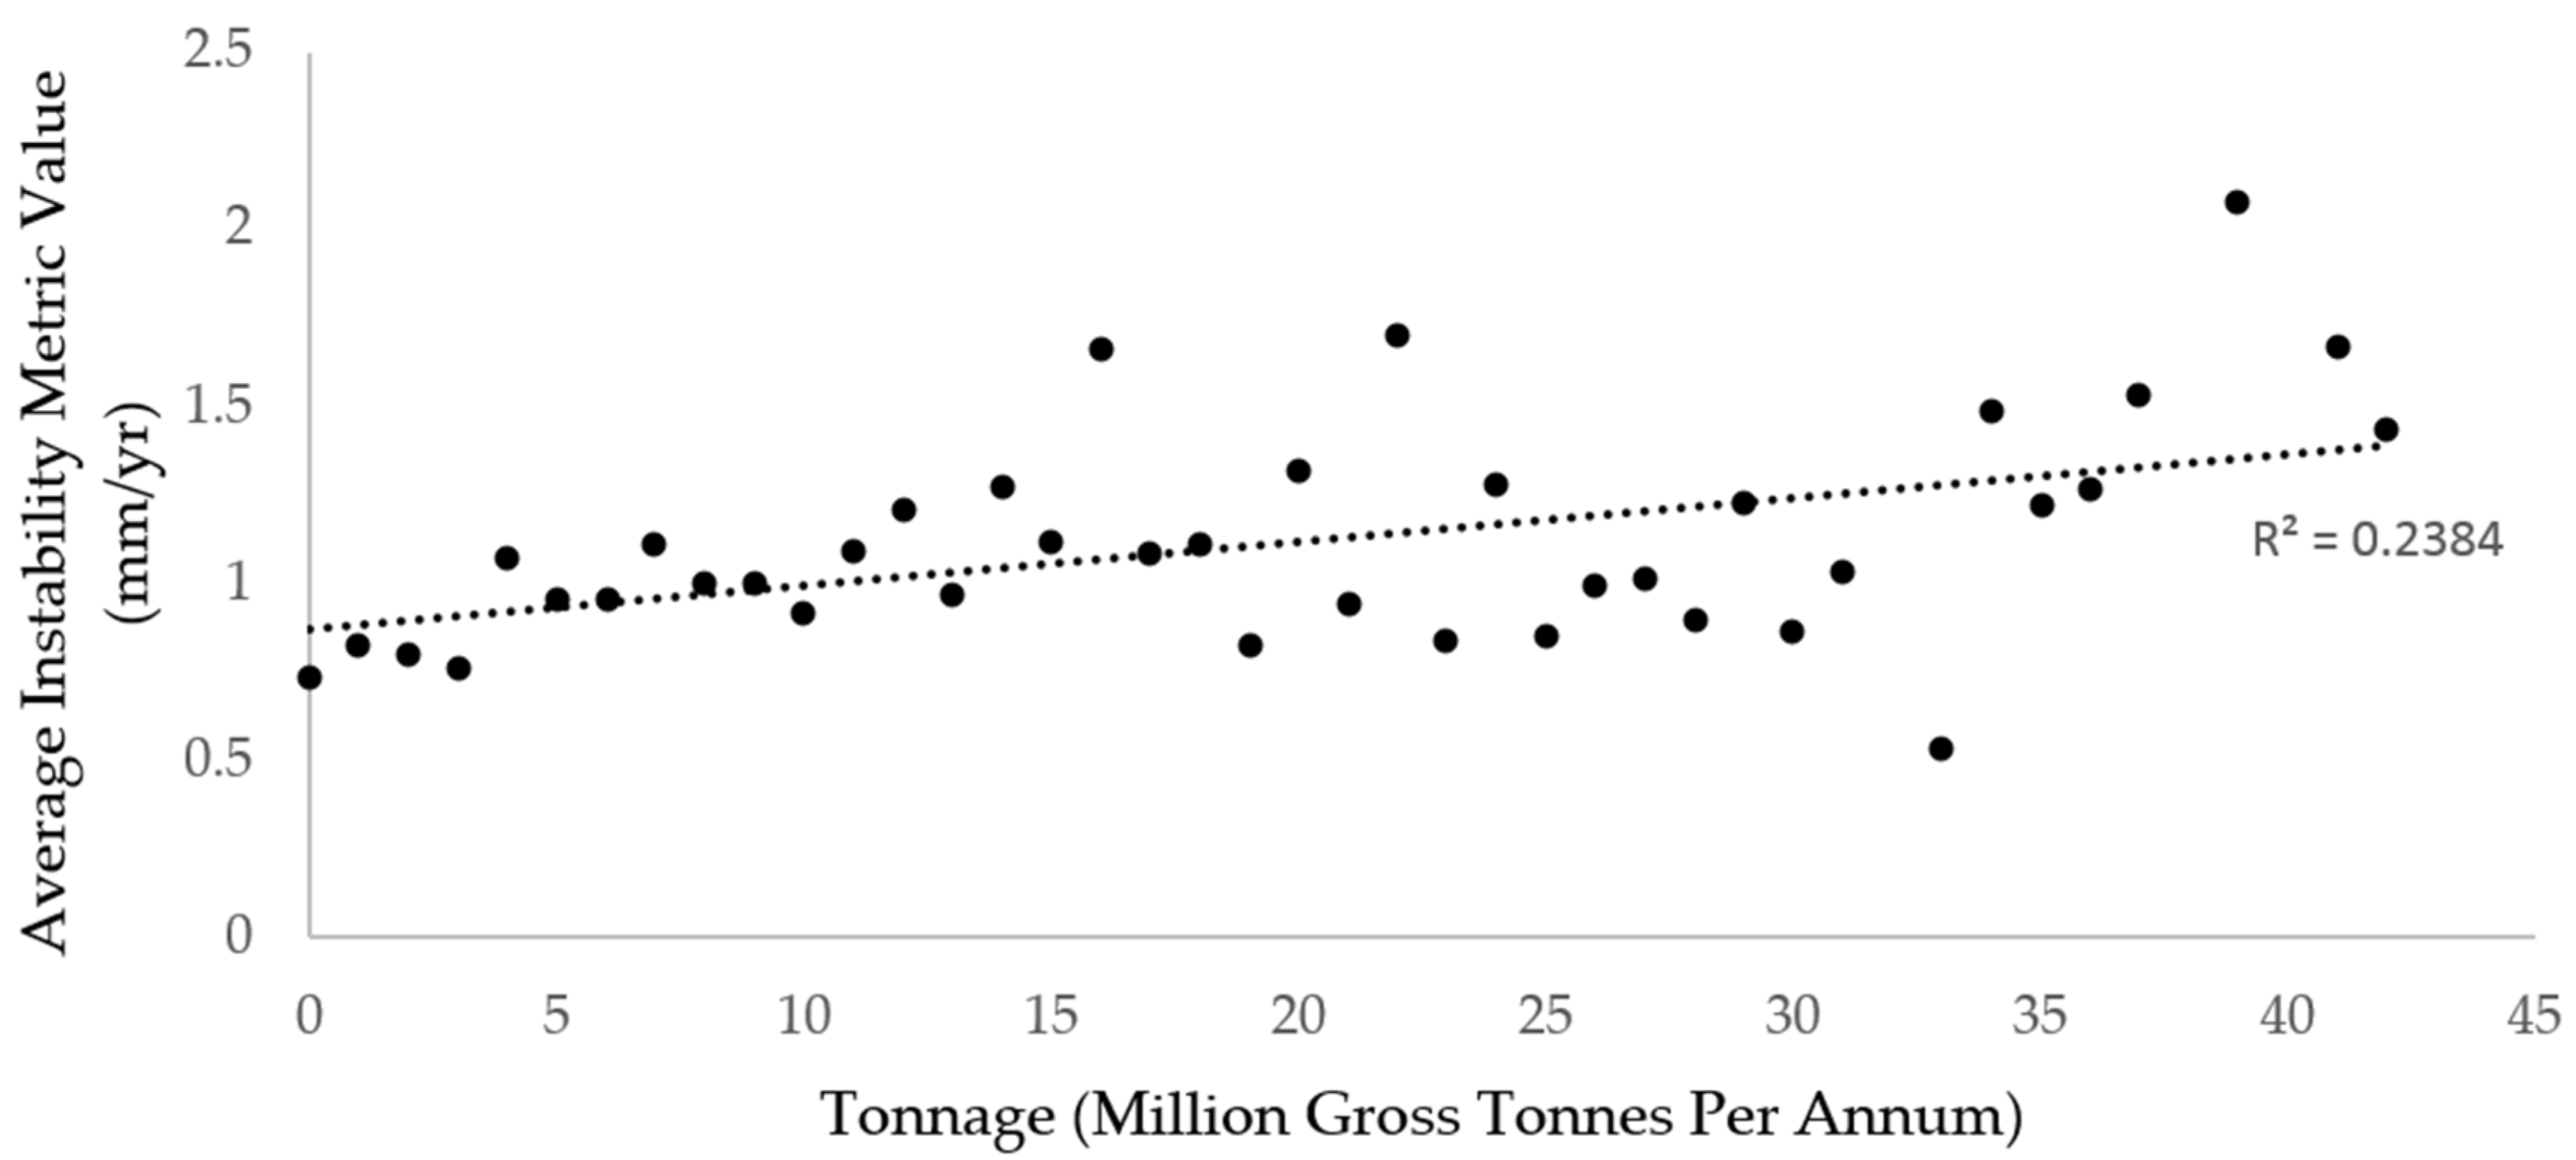
Influence of tonnage: it has been suggested that the parameters being measured which form the embankment instability metric are mainly influenced by movements in the supporting embankments, rather than being affected by deterioration of the track and trackbed. The predominant factor influencing track and trackbed deterioration is the tonnage of the rail traffic. Therefore, it follows to consider any potential correlation between the tonnage and the embankment instability metric values. Figure 10 presents the values of the average embankment instability metric for increasing tonnage values (known as MGTPA, million gross tonnes per annum). It can be seen that there is some weak correlation of the tonnage with the embankment instability metric, suggesting that either (1) there is some effect which an increased tonnage has on instability of the embankments, possibly that increased tonnage may be exacerbating the rate at which the instability develops; or (2) that the embankment instability metric is influenced to a small extent by the general deterioration of the track and trackbed. It is not thought that this relationship is significant enough to consider that the embankment instability metric is invalidated or that tonnage needs to be taken into account.
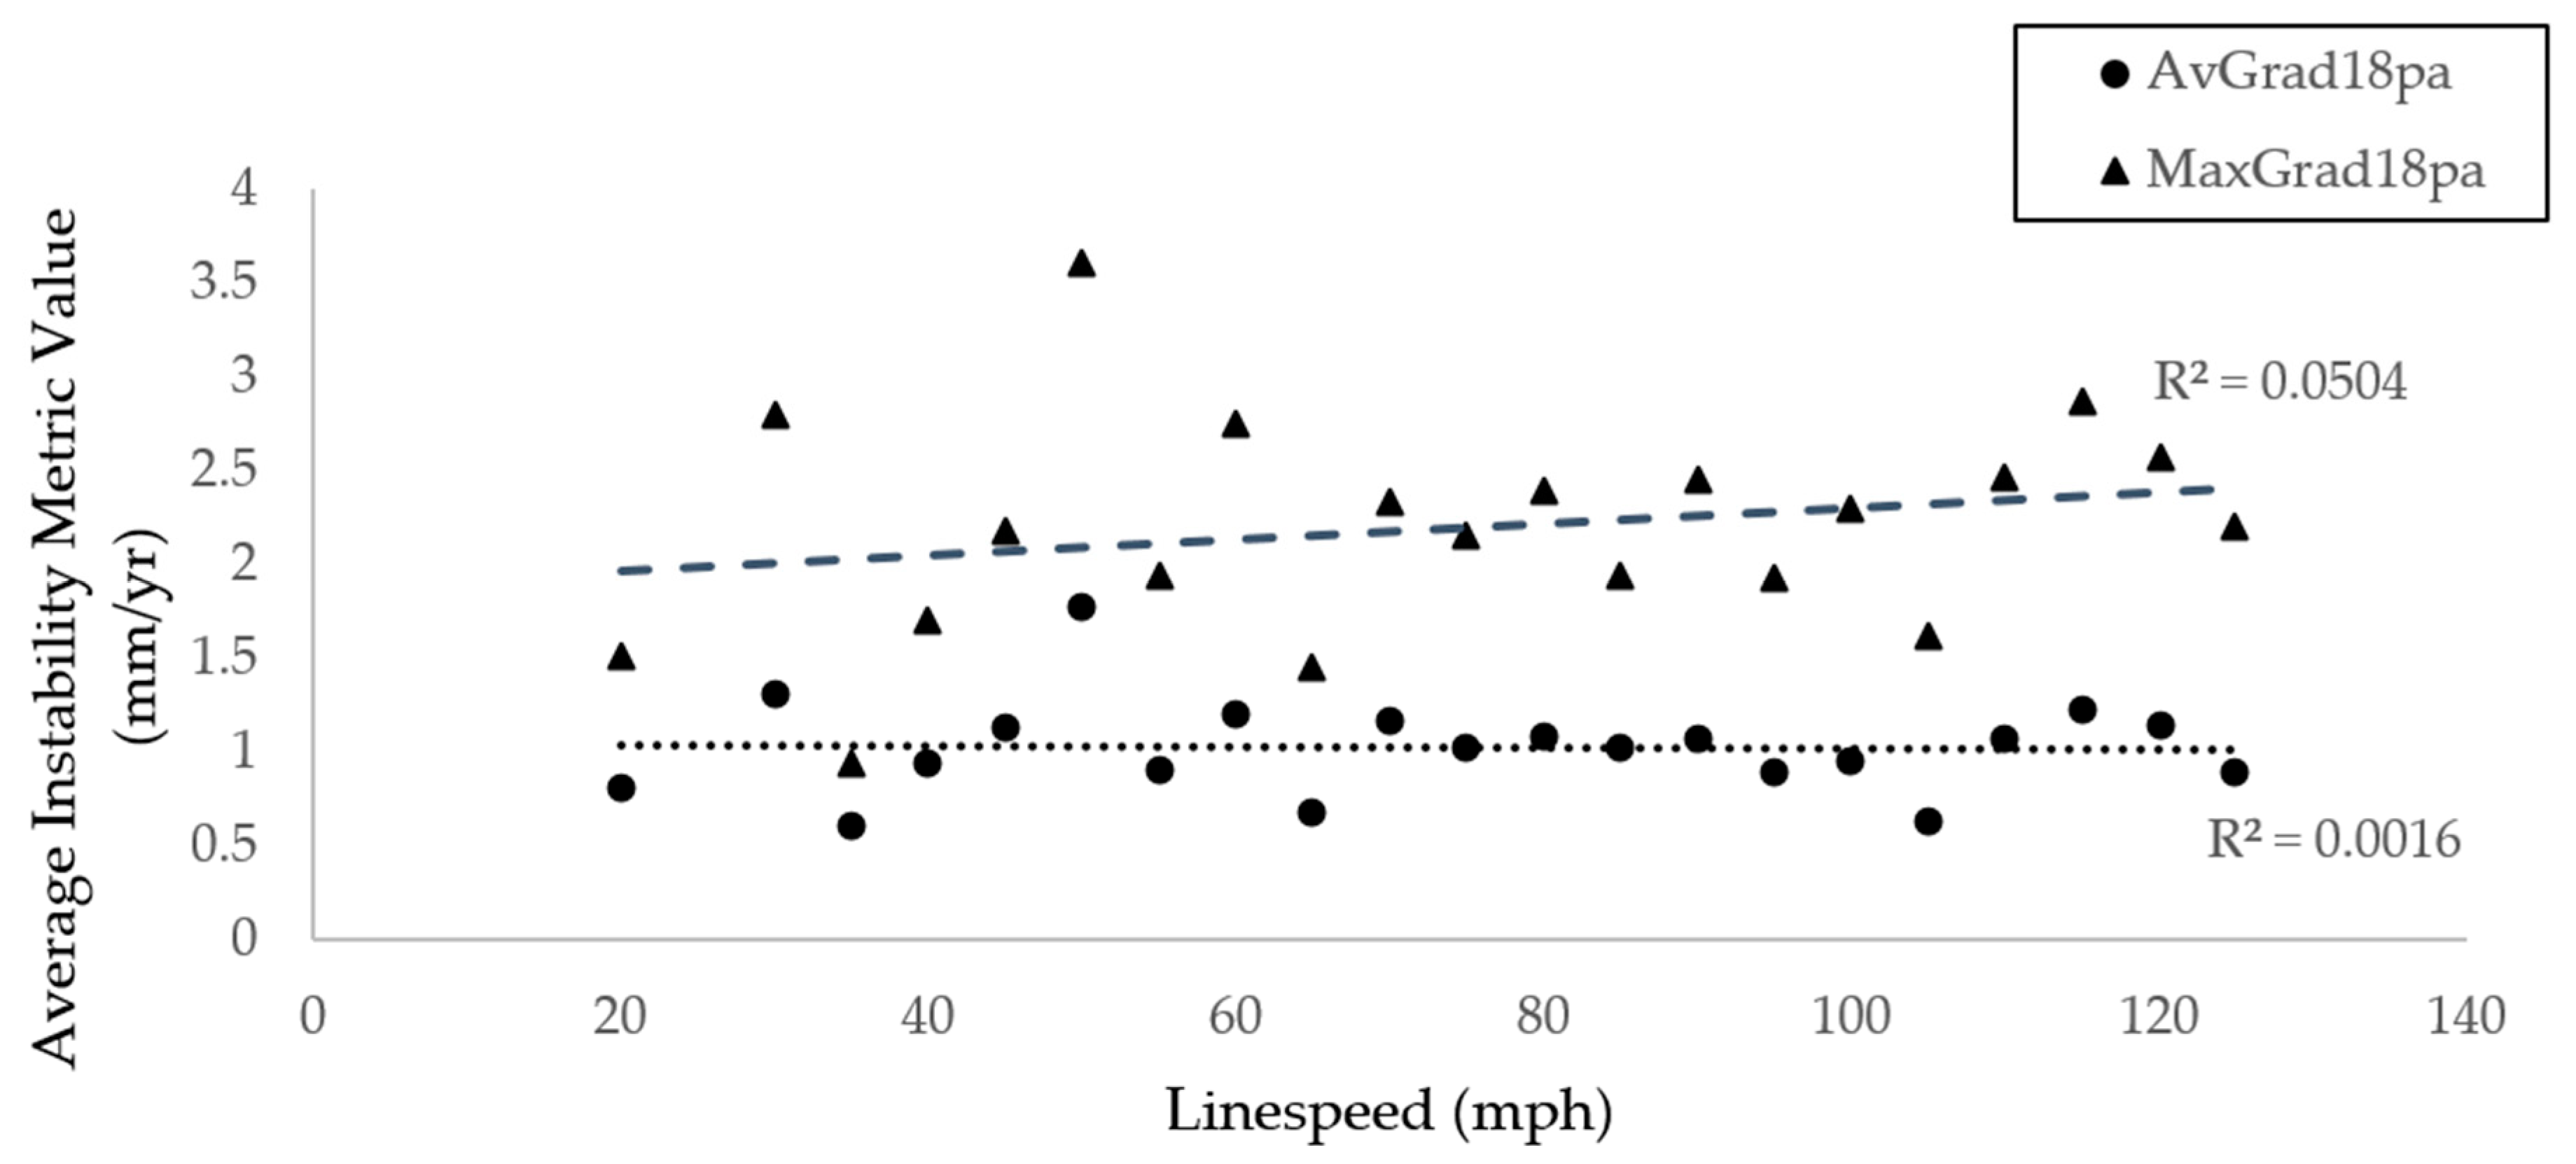
Influence of line speed: consideration should be given to the effect of line speed on the embankment instability metric, which is displayed in Figure 11. As can be seen, there is negligible correlation between the line speed and the embankment instability metric value.
7. Discussion
The earthworks that Network Rail manage pose a challenge on asset managers: aging infrastructure.
The majority of the British rail network was constructed largely before the development of modern geotechnical practice, and the modern network still runs on a foundation of the earthworks constructed before 1900. Moreover, the age of the NR earthwork assets also pre-dates detailed record keeping of stability interventions, undertaken on the earthworks in a form that is readily accessible today [3].
Regulated industries, such as NR, are constantly challenged to demonstrate continuous improvement to their management processes. Today, the biggest aspiration is for a safe, reliable, efficient and sustainable infrastructure that is continually improving. This requires a well developed capability in asset management, with an appropriate and proportionate management of risk, whilst recognising there is a degree of risk that is tolerable.
Stopping trains from finding failed earthworks that have rapidly lost the ability to perform is one of the top geotechnical challenges. The majority of the potential earthwork instability sites identified to date are located on embankments [17].
The previous study [25,26], demonstrated that the deterioration of the trackbed performance can be measured through the observation of relevant track geometry parameters (vertical alignment (Top) and lateral alignment). Understanding these deterioration rates, their relationship to other trackbed data and the effect of track maintenance, can facilitate modelling of trackbed performance. In general, earthwork movements appear to be characterised by excessive deterioration in both lateral alignment and difference in top. Both parameters were evident in known areas of earthwork failure.
We have to continually develop better technology at reducing cost and steadily evolve more efficient methods for moderating risks.
This study establishes an improved methodology to understand how earthwork movements will appear in the processed data, both in the time-history charts and the embankment instability metric which is derived from them. Failures often show movements for many years before becoming critical (i.e., before the earthwork movement starts to cause track geometry problems that cannot be rectified within a practicable planned maintenance cycle). The early signs of imminent failure are therefore evident in the track geometry data, although prediction of failure is difficult as an increase in rate of movement may simply be a symptom of erratic behaviour. The data can be affected by both the seasonal variation of earthwork movements and the effects of earthwork problems on the track geometry recording process.
Deterioration of the track geometry related to earthwork movements can be captured by the track geometry data, provided that the recording frequency exceeds the recommended threshold, and the rate of deterioration is not substantially above 4 mm/yr. It is important to note, that if the actual rate of deterioration is substantially above 4 mm/yr. and the track geometry recording frequency is not high enough, the track geometry data may appear as erratic and the reliability of estimating the rate of deterioration is reduced. The deterioration rate and recording frequencies at which the data may become erratic will vary with the line speed. The recommended thresholds in Figure 7 should be used as a guide to understand the required recording frequencies to give reliable estimates of the actual rate of deterioration, and hence embankment instability metric values. Further work is required to determine the reliability of the metric when the deterioration rates and recording frequencies do not meet the recommended thresholds.
As suggested in previous work [25] to establish this technique, and explained in Section 4.2.1, thresholds of geometry deterioration have been suggested based on observations from failure sites. This study has examined a further 51 known failure sites; of these, there are 28 sites which have enough data in the reported time period of failure and examination of the raw data suggests clear signs of failure in 19 of these cases. For these 19 sites, the maximum embankment instability metric values range between 4.2 mm/yr. and 12.8 mm/yr., for all years examined over all 10-yard sections of the failure sites.
This assessment of the rate of deterioration for these earthworks’ failures, combined with an understanding of the likely rates of deterioration due to trackbed failure and the effect of maintenance, confirms the assertion of the suggested risk level thresholds in Table 1. These thresholds apply to the calculated embankment instability metric and are the same values as shown in Section 4.2.1.
It should be noted that more calibration of these values is needed, as future work and a wider study to understand the variance of the embankment instability metric for embankment assets with no known history of instability would help, giving a context to the proportion of risk threshold breaches.
8. Conclusions
The project presented in this paper demonstrates that track geometry data are a viable source to consider for detection of railway embankment instability.
Thanks to the development of an algorithm, a value of EIM, and so a measure of the asset vulnerability to failure, was assigned for each 10-yards (almost 10 meters) of track for embankment assets. Analysing a sample of 51 known failure sites, the EIM clearly showed evidence of high track geometry deterioration, consistent with failure.
The frequency of track geometry data recoding is an important consideration and data availability is a prerequisite for reliable analysis. Data coverage is one major limitation of this technique; typically only a quarter of the network has sufficient data to analyse the past three sequential years of earthwork performance.
A sensitive analysis was conducted to consider the effect of other variables on the metric and the metric was shown to be independent to those other variables.
As a logical extension to this project and algorithm developed during the study, further works are suggested. The current alignment process (shifting and rubber-banding) of the track geometry data would be extremely improved with the introduction of an automatic process. This will reduce the time and cost required to process and trend data to calculate the EIM and visualize the data for interpretation.
User input is also required to identify erroneous track geometry data. Automated detection and purging erroneous data would be a logical extension to this project, although should be solved within Network Rail systems, possibly making use of machine learning to improve the efficiency of the task.
The work completed in this study has been focussed on the analysis of embankment assets identified as in need of remedial work. Therefore, there is no global reference distribution from this analysis to demonstrate how the embankment instability metric performs for other embankment assets with no known history of instability. Such a study will assist with understanding what level of false positives may be generated through scaling up this analysis, and help to quantify other factors which may be influencing the metric.
Author Contributions
Writing—original draft preparation, G.S.; writing—review and editing, D.K., M.A. All authors have read and agreed to the published version of the manuscript.
Funding
The research presented in this paper was carried out as part of the H2020-MSCA-ETN-2016. This project has received funding from the European Union’s H2020 Programme for research, technological development and demonstration, under grant agreement number 721493.
Conflicts of Interest
“The authors declare no conflict of interest. The funders had no role in the design of the study; in the collection, analyses, or interpretation of data; in the writing of the manuscript, or in the decision to publish the results.
References
- Williams Rail Review. The Role of the Railway in Great Britain; Williams Rail Review: London, UK, 2019. [Google Scholar]
- Briggs, K.M.; Loveridge, F.A.; Glendinning, S. Failures in transport infrastructure embankments. Eng. Geol. 2017, 219, 107–117. [Google Scholar] [CrossRef] [Green Version]
- Power, C.; Mian, J.; Spink, T.; Abbott, S.; Edwards, M. Development of an evidence-based geotechnical asset management policy for network rail, great Britain. Procedia Eng. 2016, 143, 726–733. [Google Scholar] [CrossRef] [Green Version]
- D’Angelo, G.; Bressi, S.; Giunta, M.; Presti, D.L.; Thom, N. Novel performance-based technique for predicting maintenance strategy of bitumen stabilised ballast. Constr. Build. Mater. 2018, 161, 1–8. [Google Scholar] [CrossRef]
- Wolmar, C. Fire and Steam: A New History of the Railways in Britain; Atlantic Books: London, UK, 2008. [Google Scholar]
- Skempton, A.W. Embankments and cuttings on the early railway. Constr. Hist. 1996, 11, 33–49. [Google Scholar]
- Yorke, T. Britain’s Railway Architecture & Heritage; Countryside Books: Berkshire, UK, 2013. [Google Scholar]
- O’Brien, A.S.; Ellis, E.A.; Russell, D. Old railway embankment clay fill-laboratory experiments, numerical modelling and field behaviour. In Proceedings of the Advances in Geotechnical Engineering: The Skempton Conference, London, UK, 29–31 March 2004; pp. 911–921. [Google Scholar]
- Glendinning, S.; Hall, J. Asset-management strategies for infrastructure embankments. Proc. Inst. Civ. Eng.-Eng. Sustain. 2009, 162, 111–120. [Google Scholar] [CrossRef]
- Stanley, D.A.; Pierson, L.A. Geotechnical Asset Management of Slopes: Condition Indices and Performance Measures. In Geo-Congress 2013: Stability and Performance of Slopes and Embankments III 2013; Aashto: Washington, DC, USA, 2013; pp. 1651–1660. [Google Scholar]
- Mazzanti, P. Toward transportation asset management: What is the role of geotechnical monitoring? J. Civ. Struct. Health Monit. 2017, 7, 645–656. [Google Scholar] [CrossRef]
- Smethurst, J.A.; Smith, A.; Uhlemann, S.; Wooff, C.; Chambers, J.; Hughes, P.; Lenart, S.; Saroglou, H.; Springman, S.M.; Löfroth, H.; et al. Current and future role of instrumentation and monitoring in the performance of transport infrastructure slopes. Q. J. Eng. Geol. Hydrogeol. 2017, 50, 271–286. [Google Scholar] [CrossRef] [Green Version]
- Blight, G.E. The vadose zone soil-water balance and transpiration rates of vegetation. Géotechnique 2003, 53, 55–64. [Google Scholar] [CrossRef]
- Kovacevic, M.S.; Bacic, M.; Stipanovic, I.; Gavin, K. Categorization of the condition of railway embankments using a multi-attribute utility theory. Appl. Sci. 2019, 9, 5089. [Google Scholar] [CrossRef] [Green Version]
- Siebenmann, R.; Yu, H.T.; Bachus, R. UCIMS: Advances in geotechnical construction and performance monitoring. J. Rock Mech. Geotech. Eng. 2015, 7, 207–212. [Google Scholar] [CrossRef] [Green Version]
- O’Brien, A.S. The assessment of old railway embankments: Time for a change? In Partial Saturation in Compacted Soils: Géotechnique Symposium in Print 2011; ICE Publishing: London, UK, 2013; pp. 19–32. [Google Scholar]
- Nogy, L. Railway Earthworks Instability Diagnosis Using Track Geometry Measurement Data-CCQ and Top 35m; Permanent Way Institution: Warley, Brentwood, 2016. [Google Scholar]
- Greenwood, J.R.; Holt, A.; Herrick, G.W. Shallow slips in highway embankments constructed of overconsolidated clay. In Proceedings of the From Proceedings of the Symposium on Failures in Earthworks, organized by the Institution of Civil Engineers, London, UK, 6–7 March 1985. [Google Scholar]
- CEN. EN 13848-1: 2019 Railway Applications. Track. Track geometry Quality-Part 1: Characterization of Track Geometry; CEN: Brussels, Belgium, 2019. [Google Scholar]
- Weston, P.F.; Ling, C.S.; Roberts, C.; Goodman, C.J.Ã.; Li, P.; Goodall, R.M. Monitoring vertical track irregularity from in-service railway vehicles. Part F J. Rail Rapid Transit 2007, 221, 75–88. [Google Scholar] [CrossRef]
- Nielsen, J.; Berggren, E.G.; Lölgen, T.; Müller, R.; Stallaert, B.; Pesqueux, L. Overview of Methods for Measurement of Track Irregularities for Ground-Borne Vibration—Deliverable D2.5; RIVAS Railway Induced Vibration Abatement Solutions Collaborative Project: Brussels, Belgium, 2013; pp. 1–49. [Google Scholar]
- Tsai, Z.T.; Tsai, H.K.; Cheng, J.H.; Lin, C.H.; Tsai, Y.F.; Wang, D. Evolution of cis-regulatory elements in yeast de novo and duplicated new genes. BMC Genom. 2012, 13, 717. [Google Scholar] [CrossRef] [PubMed] [Green Version]
- Bocciolone, M.; Caprioli, A.; Cigada, A.; Collina, A. A measurement system for quick rail inspection and effective track maintenance strategy. Mech. Syst. Signal Process. 2007, 21, 1242–1254. [Google Scholar] [CrossRef]
- Ward, C.P.; Weston, P.F.; Stewart, E.J.; Li, H.; Goodall, R.M.; Roberts, C.; Mei, T.X.; Charles, G.; Dixon, R. Condition monitoring opportunities using vehicle-based sensors. Proc. Inst. Mech. Eng. Part F J. Rail Rapid Transit 2011, 225, 202–218. [Google Scholar] [CrossRef]
- Sharpe, P.; Hutchinson, D. Prediction of Earthwork Failures Using Track Recording Car Data. In Proceedings of the Railway Engineering Conference, Edinburgh, UK, 30 June–1 July 2015. [Google Scholar]
- Sharpe, P.; Middleton, S.; Kite, D.; Nelson, A. Tamp (trackbed analysis & modelling platform)—Incorporating a track deterioration model which combines trackbed condition and track performance. In Proceedings of the Railway Engineering 2015, Edinburgh, UK, 30 June–1 July 2015. [Google Scholar]
- Audley, M.; Andrews, J.D. The effects of tamping on railway track geometry degradation. Proc. Inst. Mech. Eng. Part F J. Rail Rapid Transit 2013, 227, 376–391. [Google Scholar] [CrossRef]
Figure 1.
Track recording vehicle measuring system (adapted from [21]).
Figure 1.
Track recording vehicle measuring system (adapted from [21]).

Figure 2.
Track quality parameters—adapted from [4].
Figure 2.
Track quality parameters—adapted from [4].

Figure 3.
Track movement on an unstable embankment—adapted from [17].
Figure 3.
Track movement on an unstable embankment—adapted from [17].

Figure 4.
Effect of typical rotational slip on track geometry—adapted from [25]
Figure 4.
Effect of typical rotational slip on track geometry—adapted from [25]

Figure 5.
Track geometry data, prior to (left) and following alignment (right).

Figure 6.
Visualised track geometry data comparing 36.6 m and 18.3 m SD base lengths.

Figure 7.
Indicative value of threshold recording frequency.

Figure 8.
Track geometry recording frequency vs. embankment instability metric.

Figure 9.
Graph of track curvature vs. embankment instability metric value.

Figure 10.
Graph showing variation in tonnage vs. embankment instability metric value.

Figure 11.
Graph showing variation in line speed vs. embankment instability metric value.


Table 1.
Summary of results of embankment instability metric from population of 10-yard segments.
| Measure | EIM | % |
|---|---|---|
| Average Value | 1.03 | - |
| SD of Value | 1.06 | - |
| Count of Total | 98,692 | - |
| <1 mm | 64,236 | 65% |
| 1–2 mm | 22,886 | 23% |
| 2–4 mm | 9354 | 9.5% |
| >4 mm | 2129 | 2.2% |
| >8mm | 218 | 0.2% |
Table 2.
Embankment instability metric threshold descriptions.
| Risk Level | Metric Value | Description |
|---|---|---|
| Negligible | <1 mm/yr. | Negligible infers that any track roughness would be addressed during the course of routine track maintenance and would not therefore be identified as an earthwork problem. |
| Minor | 1 to 2 mm/yr. | May or may not be identified as an earthworks issue, could be dealt with through track maintenance assuming rates of deterioration do not increase. |
| Moderate | 2 to 4 mm/yr. | Moderate movement which is more like to be identified and related to a potential earthwork issue. |
| High | >4 mm/yr. | High risk is judged to be the point at which it is obvious that there is a serious earthwork issue that requires regular track maintenance (very regular for high line speed) to maintain track geometry and will require a long-term earthwork remedial solution. |
© 2020 by the authors. Licensee MDPI, Basel, Switzerland. This article is an open access article distributed under the terms and conditions of the Creative Commons Attribution (CC BY) license (http://creativecommons.org/licenses/by/4.0/).
Share and Cite
MDPI and ACS Style
Kite, D.; Siino, G.; Audley, M. Detecting Embankment Instability Using Measurable Track Geometry Data. Infrastructures 2020, 5, 29. https://0-doi-org.brum.beds.ac.uk/10.3390/infrastructures5030029
AMA Style
Kite D, Siino G, Audley M. Detecting Embankment Instability Using Measurable Track Geometry Data. Infrastructures. 2020; 5(3):29. https://0-doi-org.brum.beds.ac.uk/10.3390/infrastructures5030029
Chicago/Turabian StyleKite, David, Giulia Siino, and Matthew Audley. 2020. "Detecting Embankment Instability Using Measurable Track Geometry Data" Infrastructures 5, no. 3: 29. https://0-doi-org.brum.beds.ac.uk/10.3390/infrastructures5030029