Safety and Performance of Offshore Platforms Subjected to Repeated Earthquakes

 ,
,  and
and 
Abstract
:
1. Introduction
2. Elements of Offshore Engineering and Jacket Offshore Platforms (JOPs)
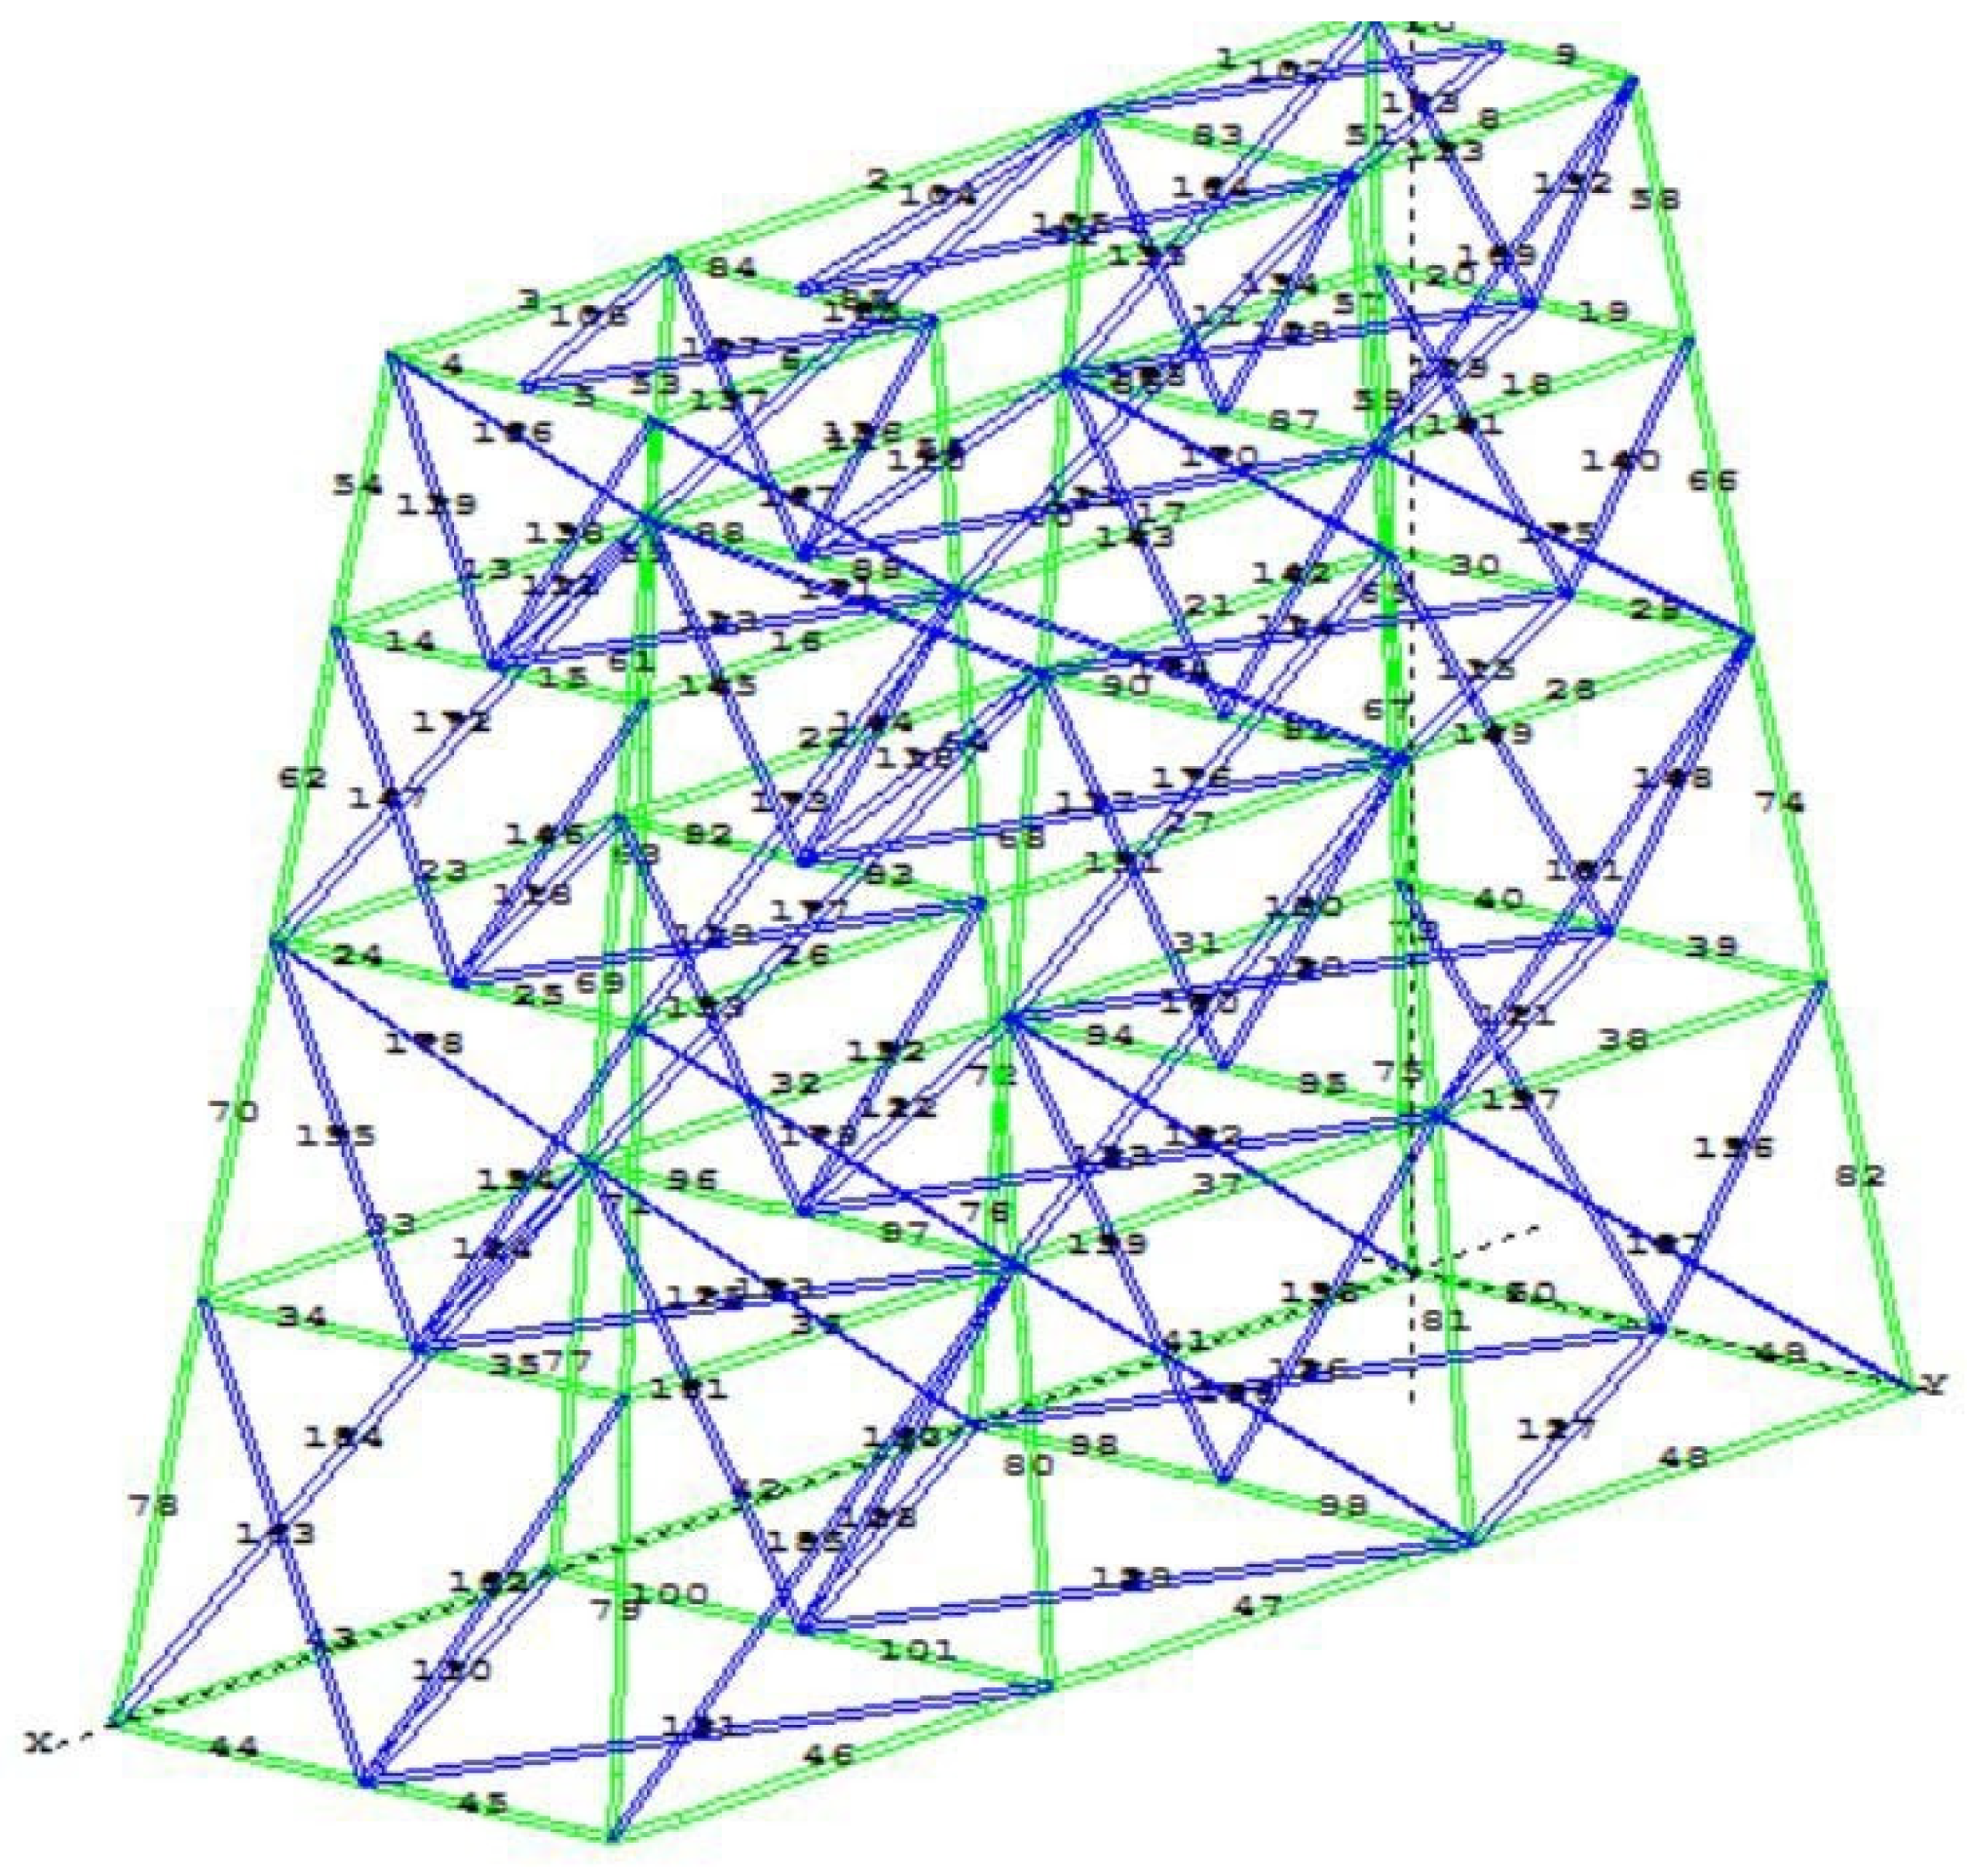
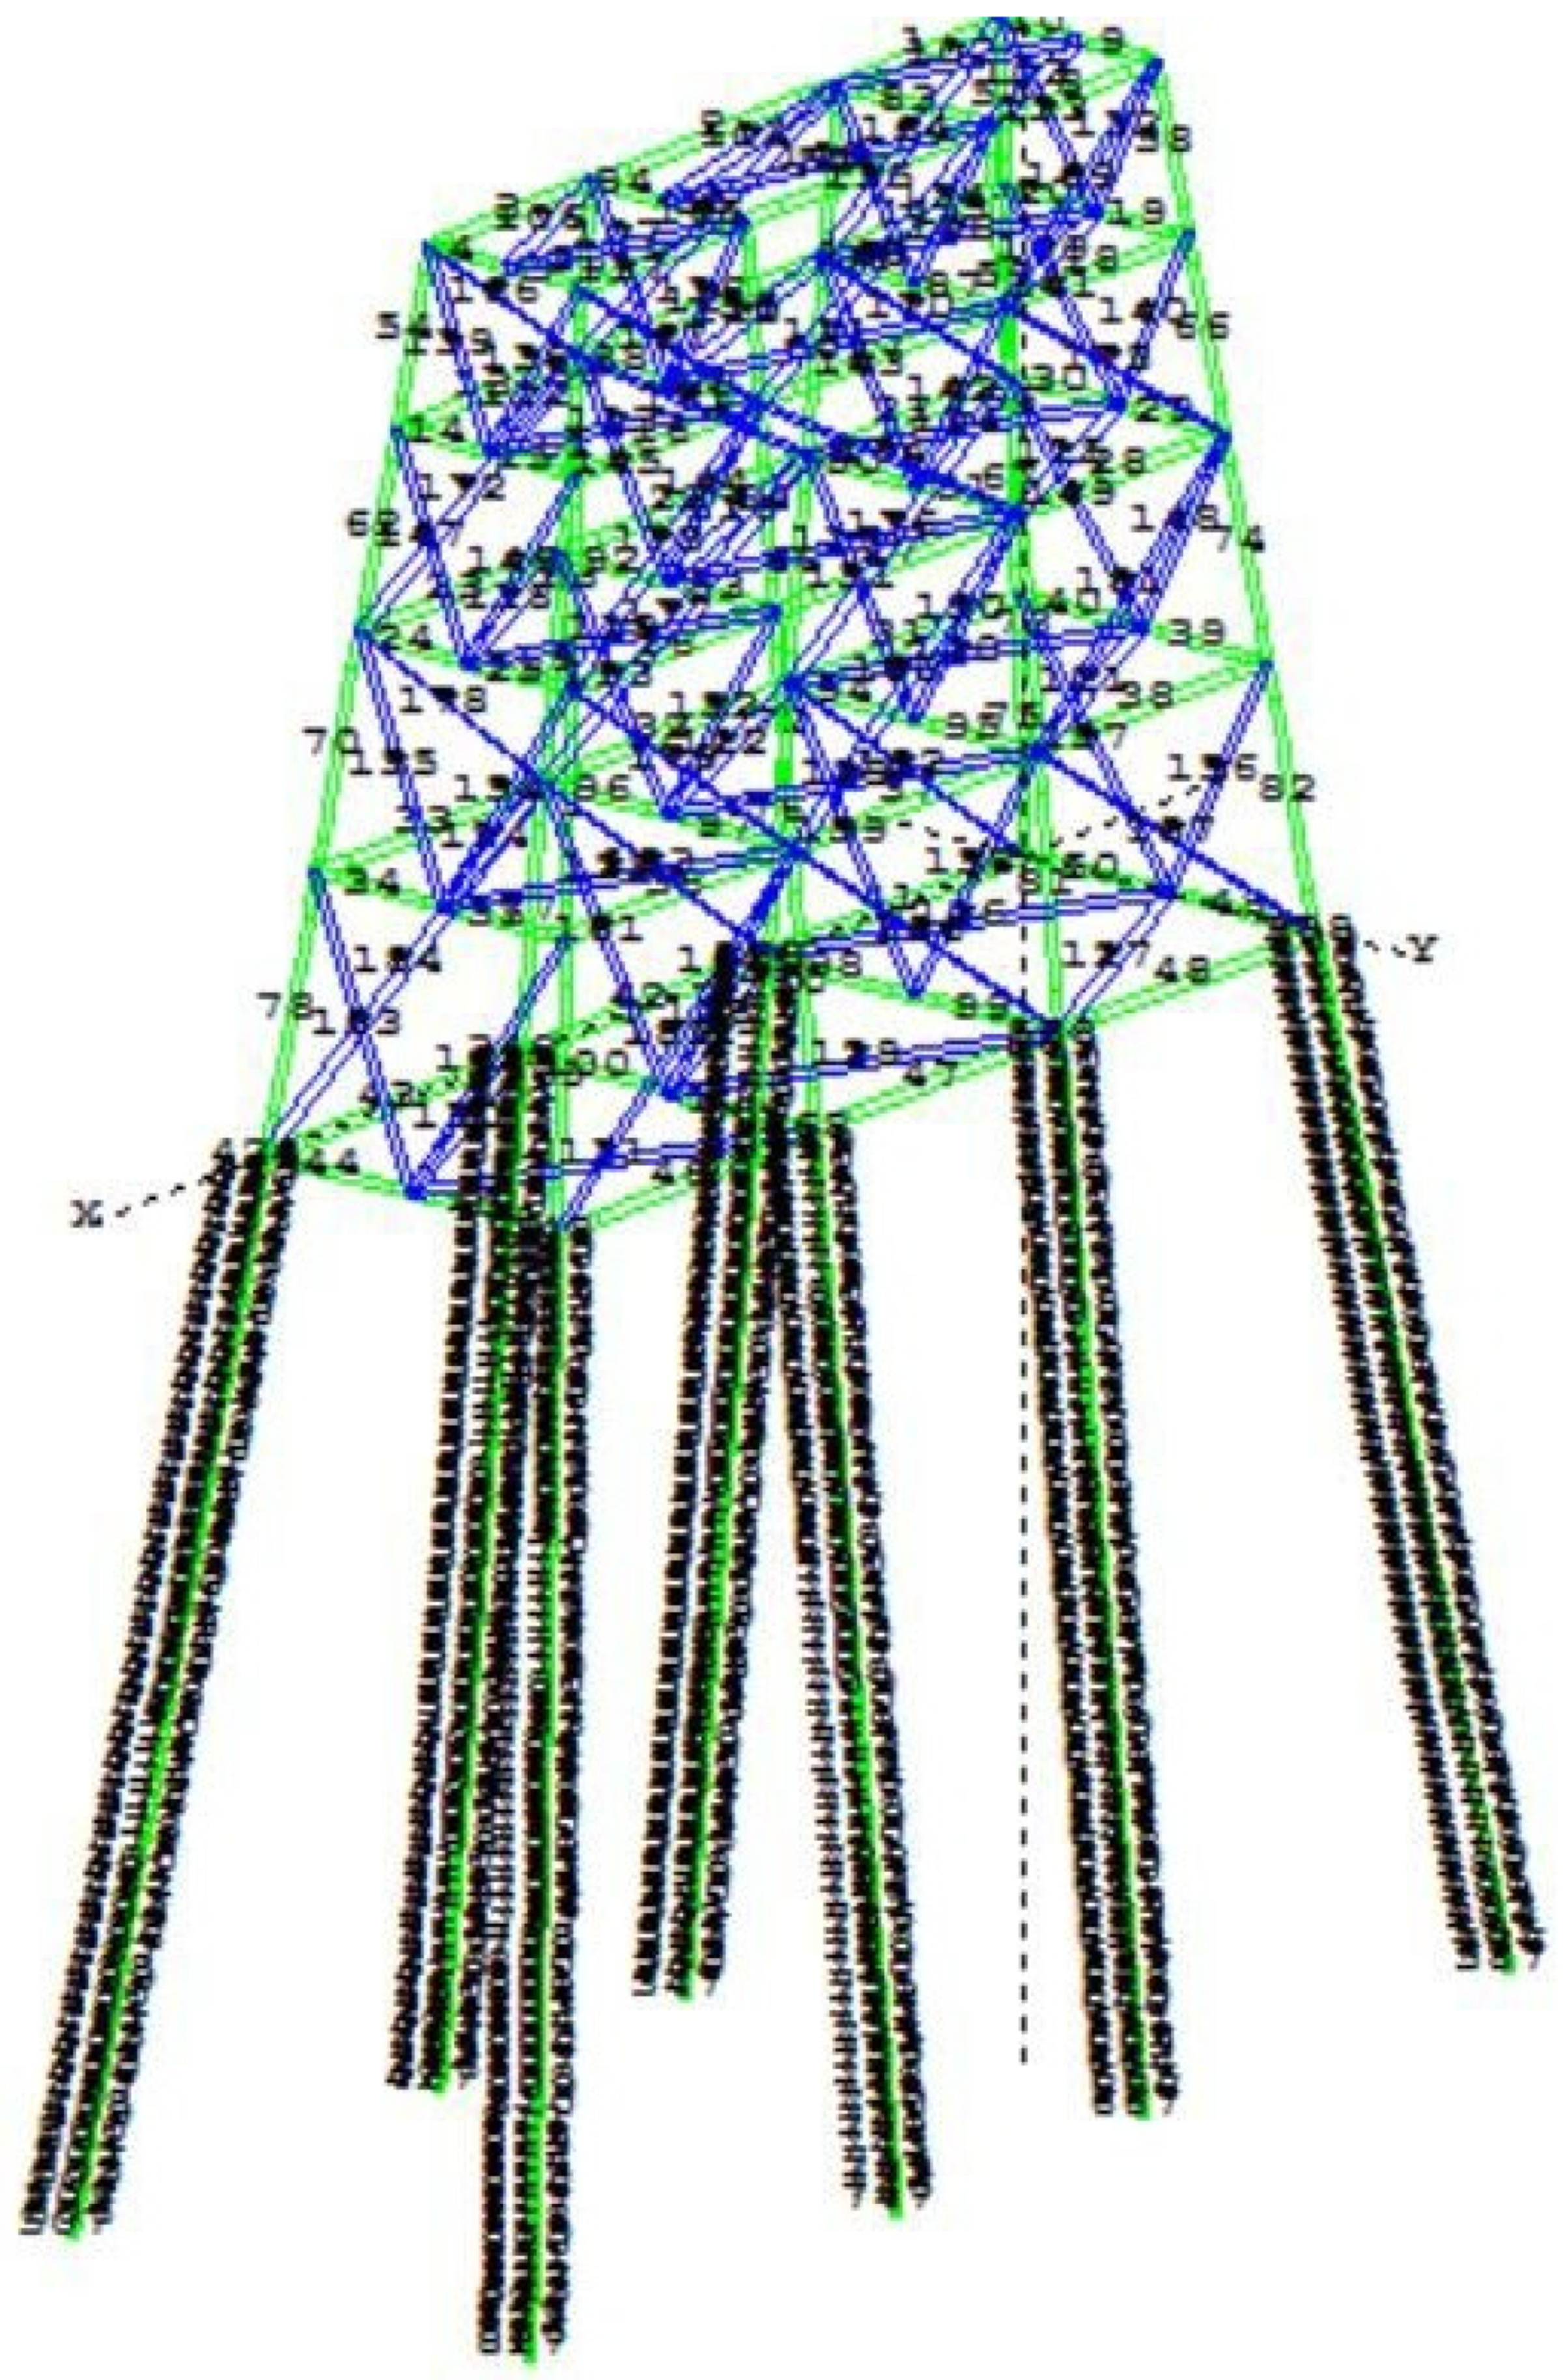
3. Jacket Offshore Platforms under Consideration
4. The Phenomenon of Multiple Earthquakes
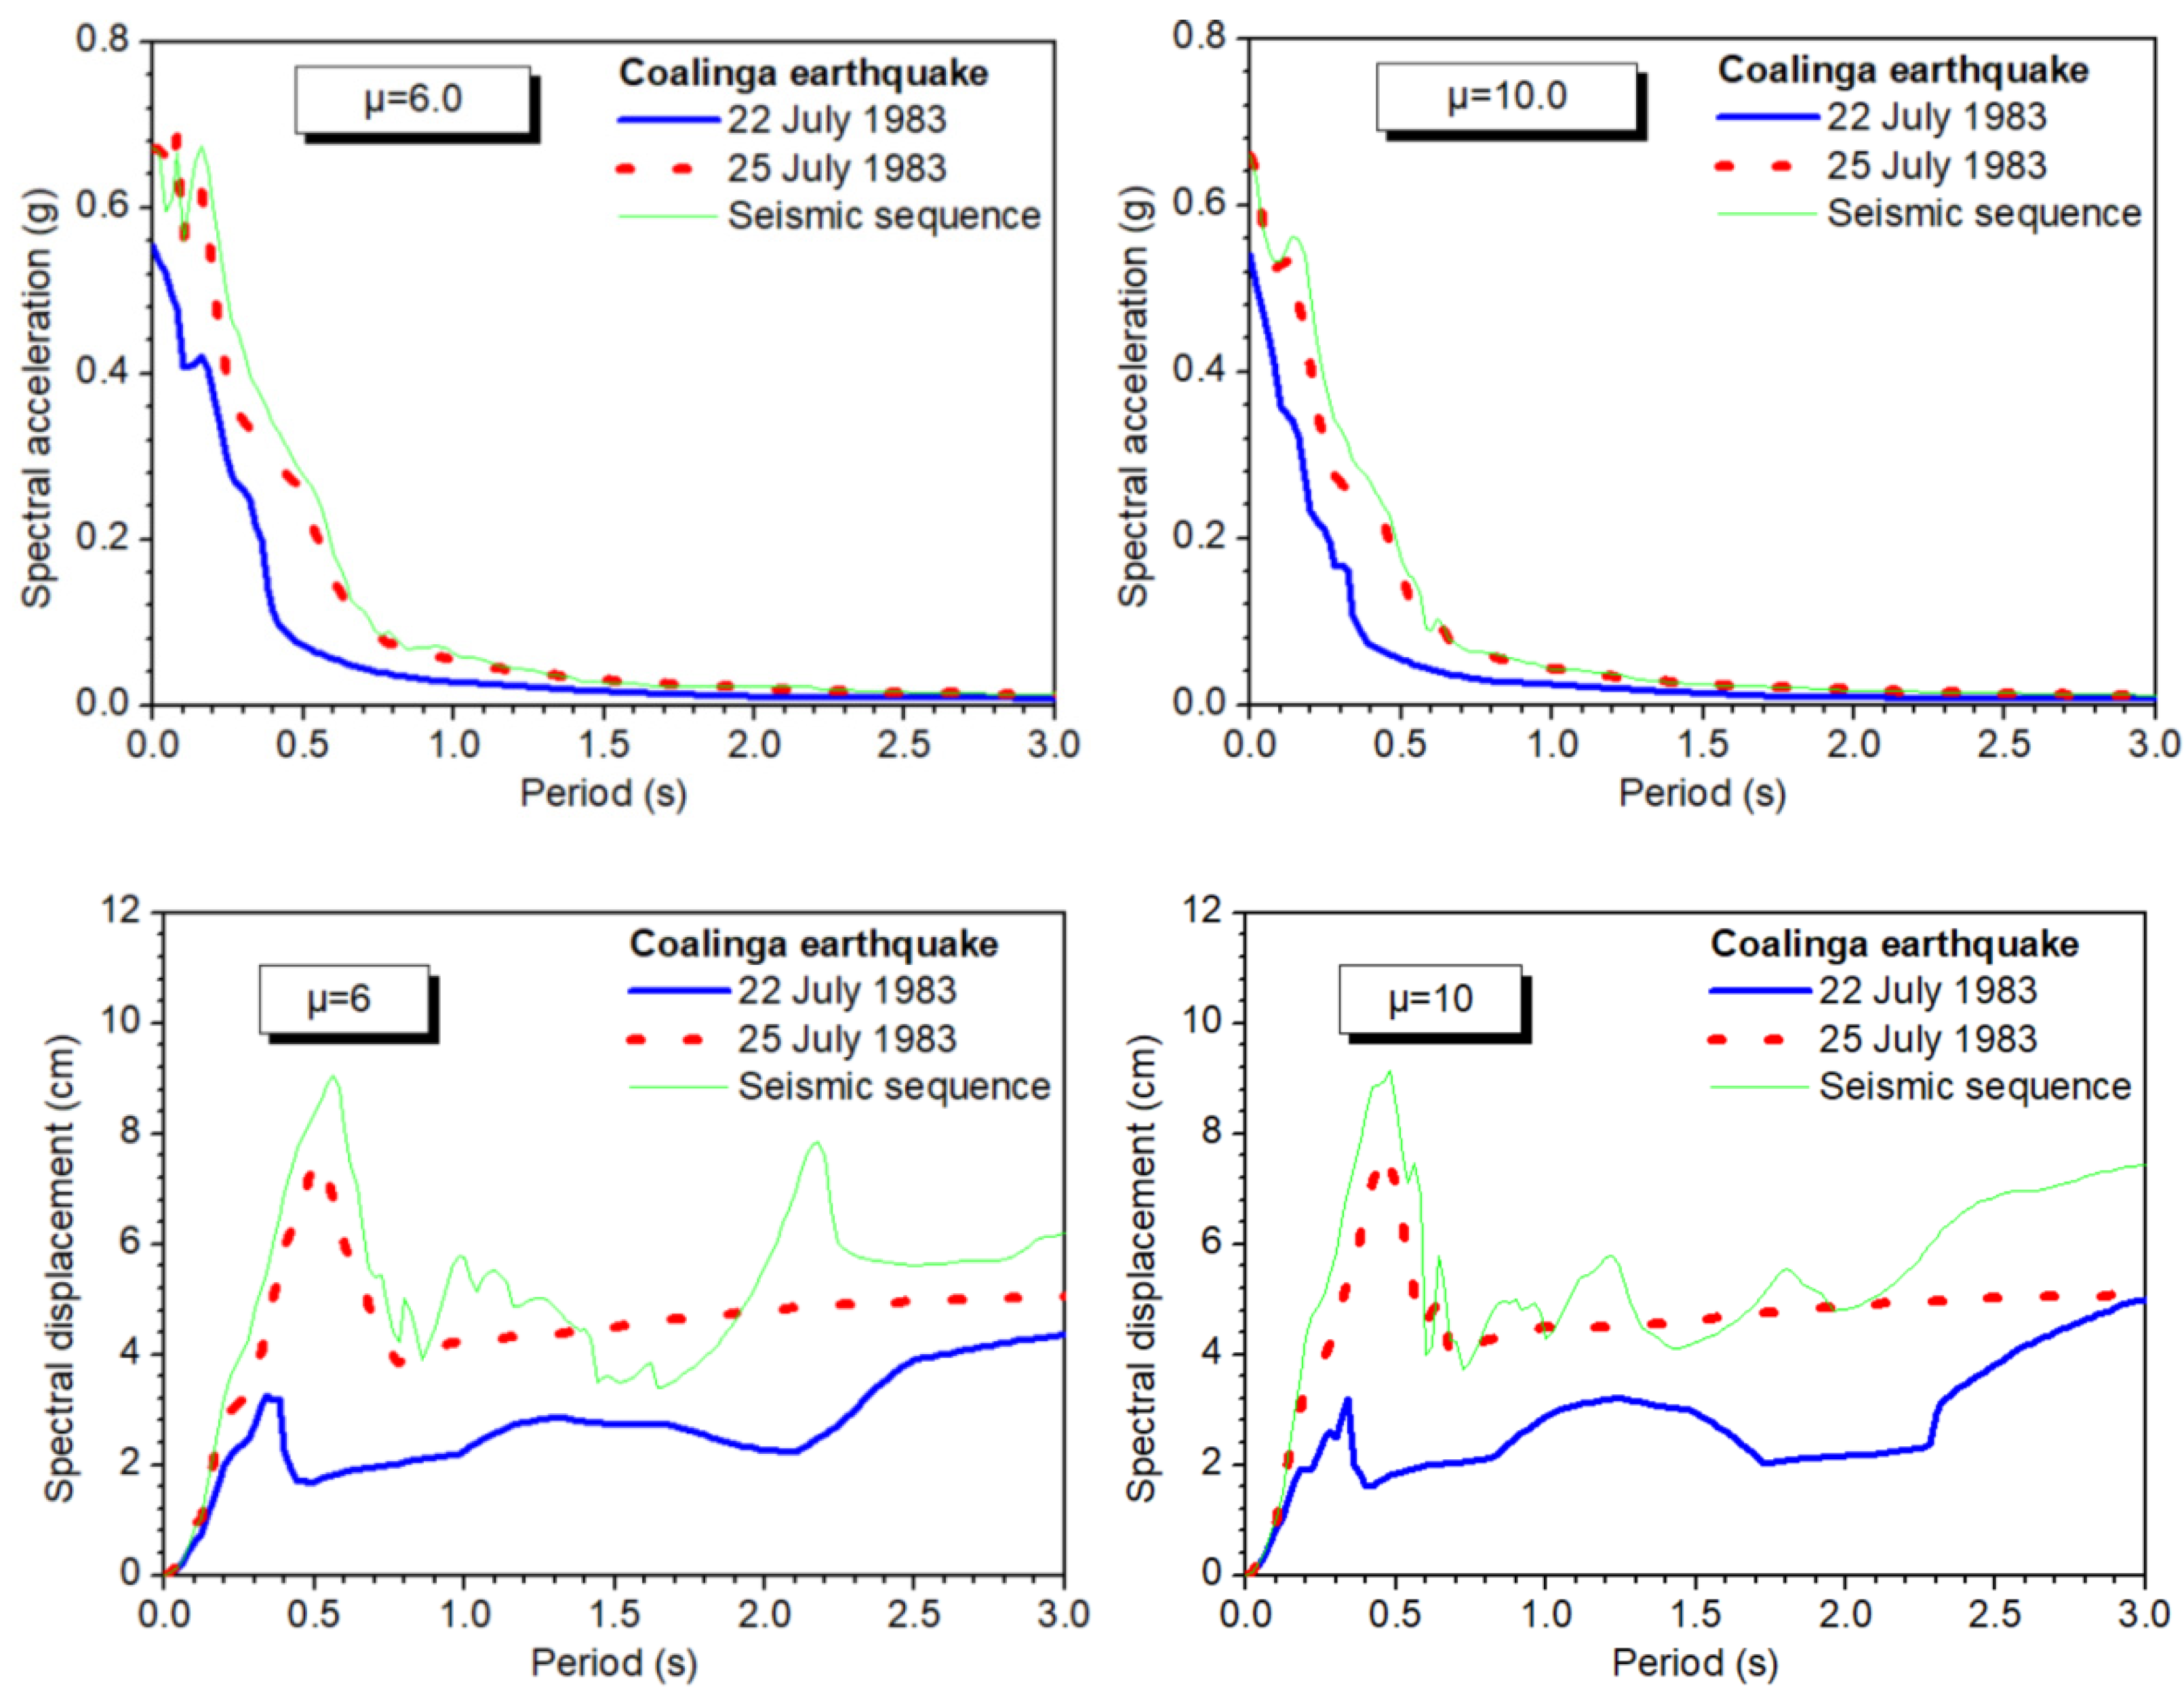
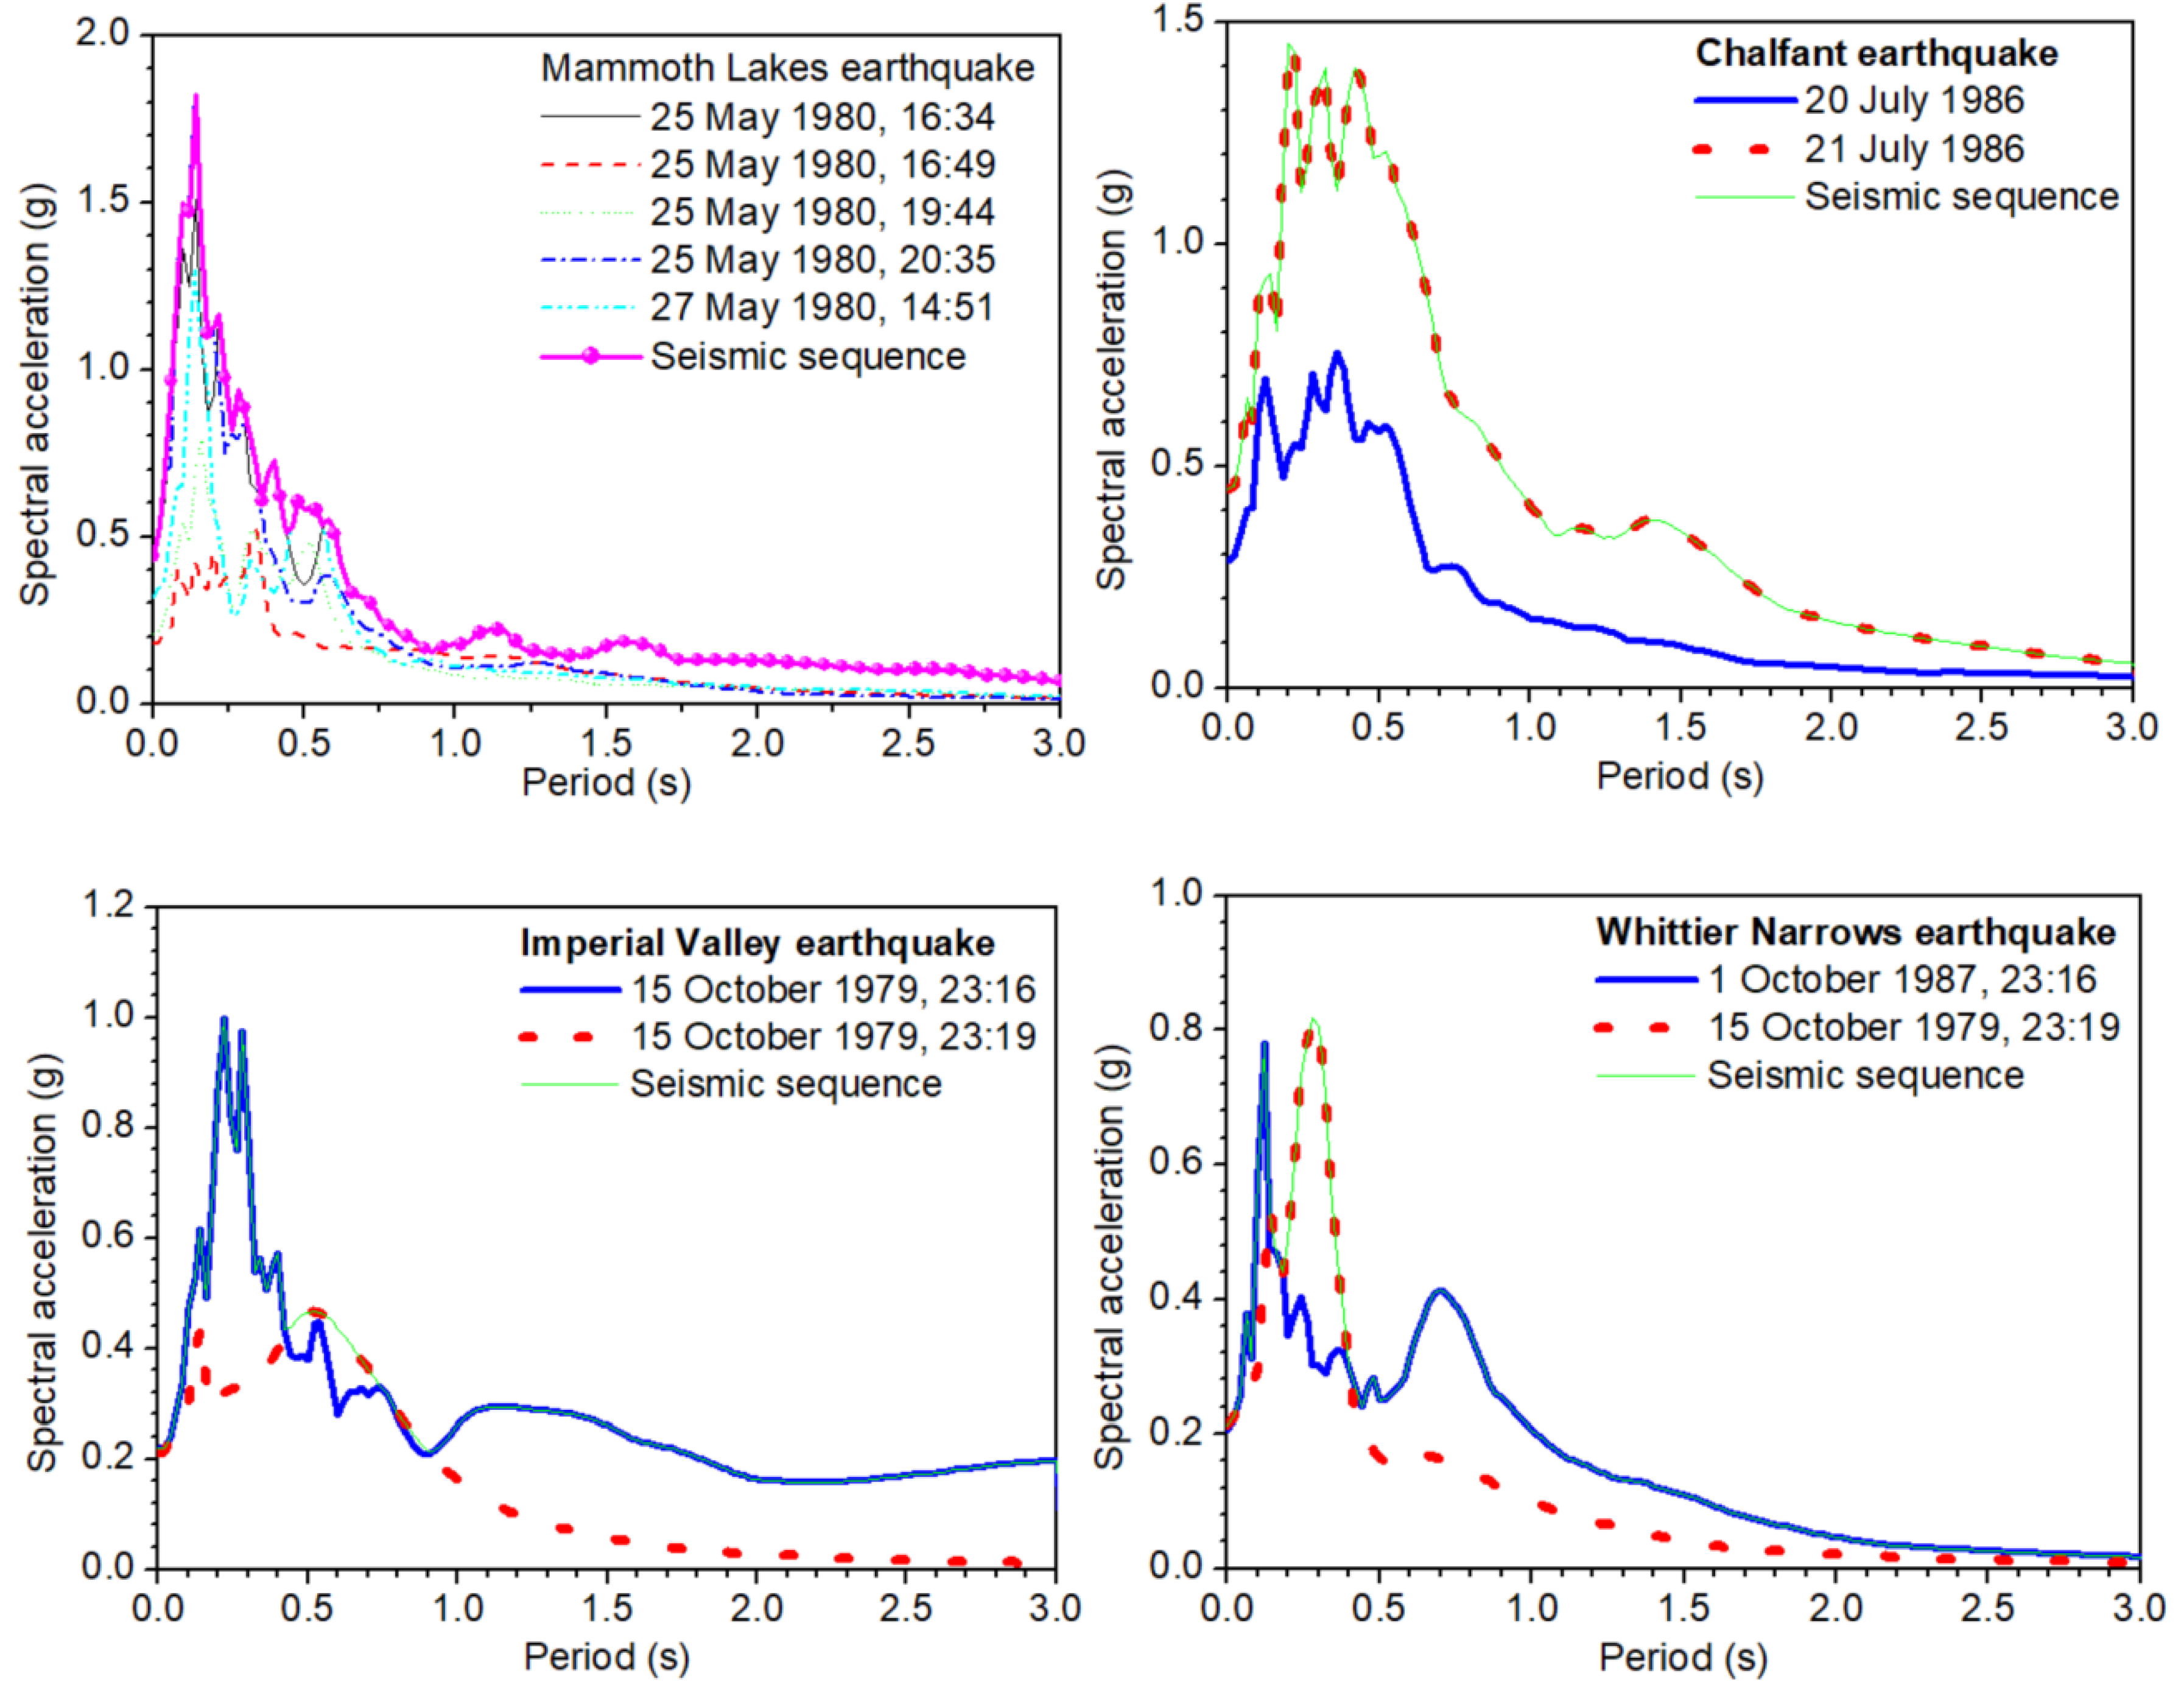
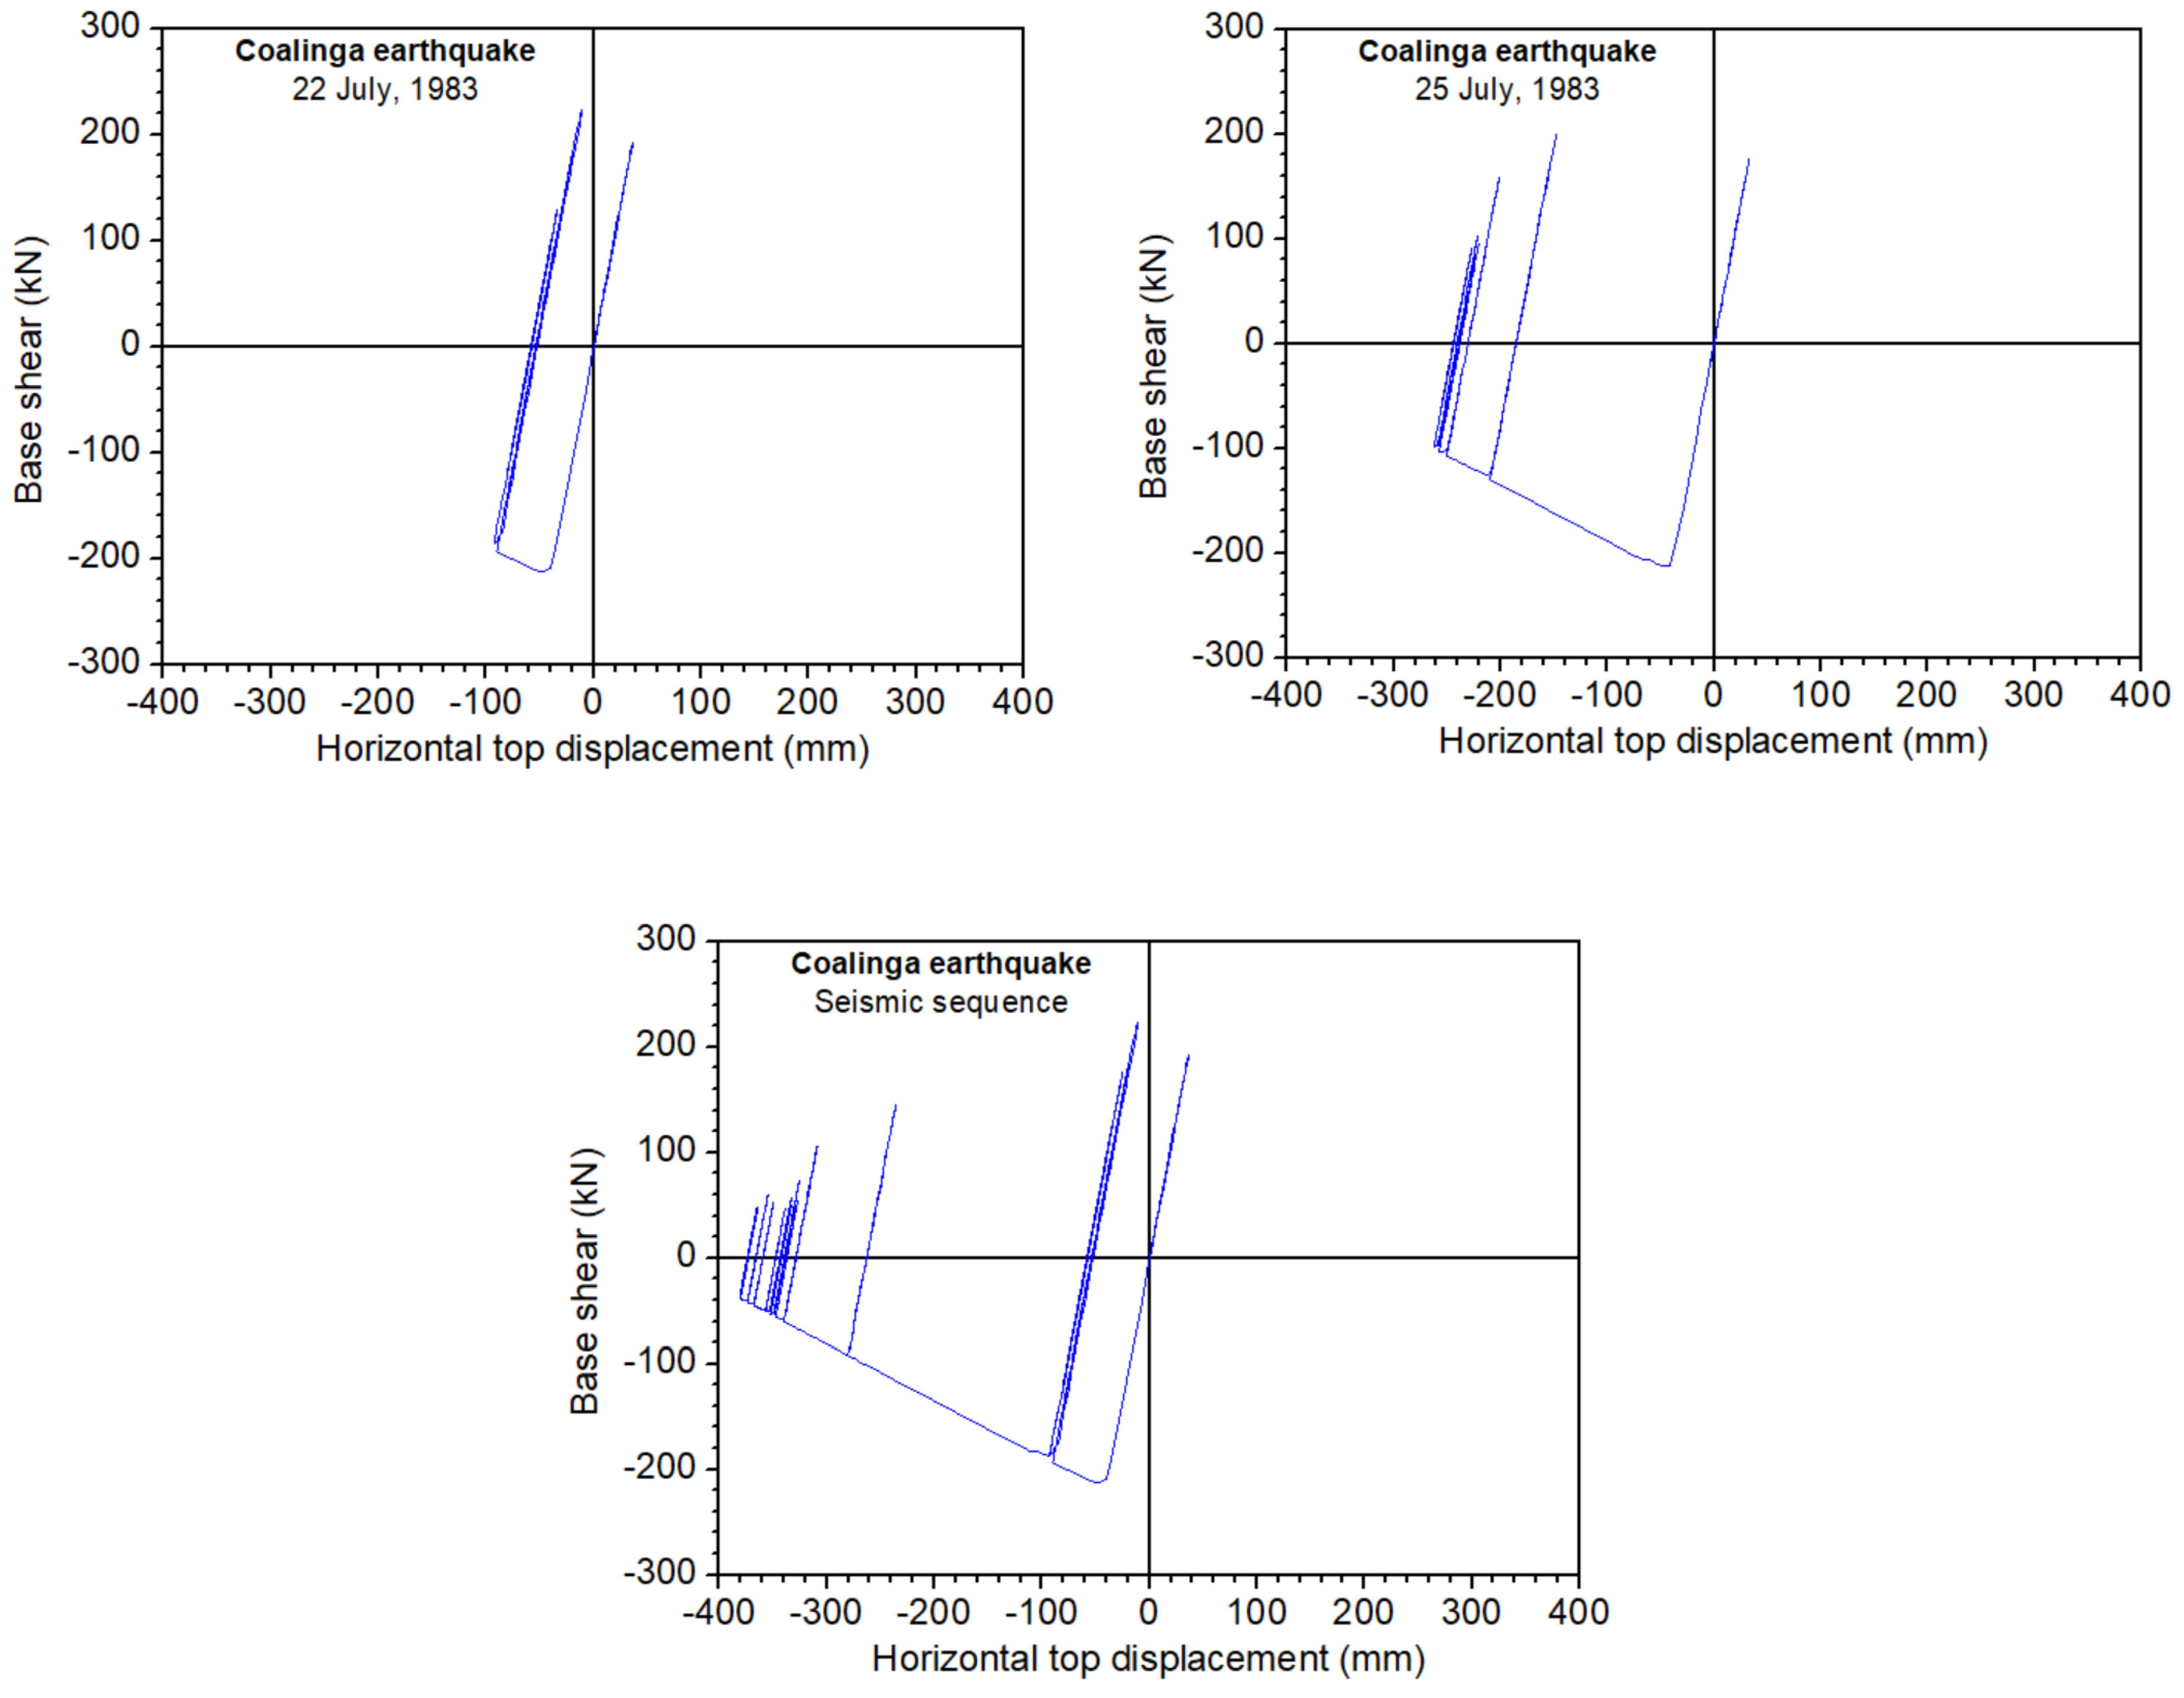
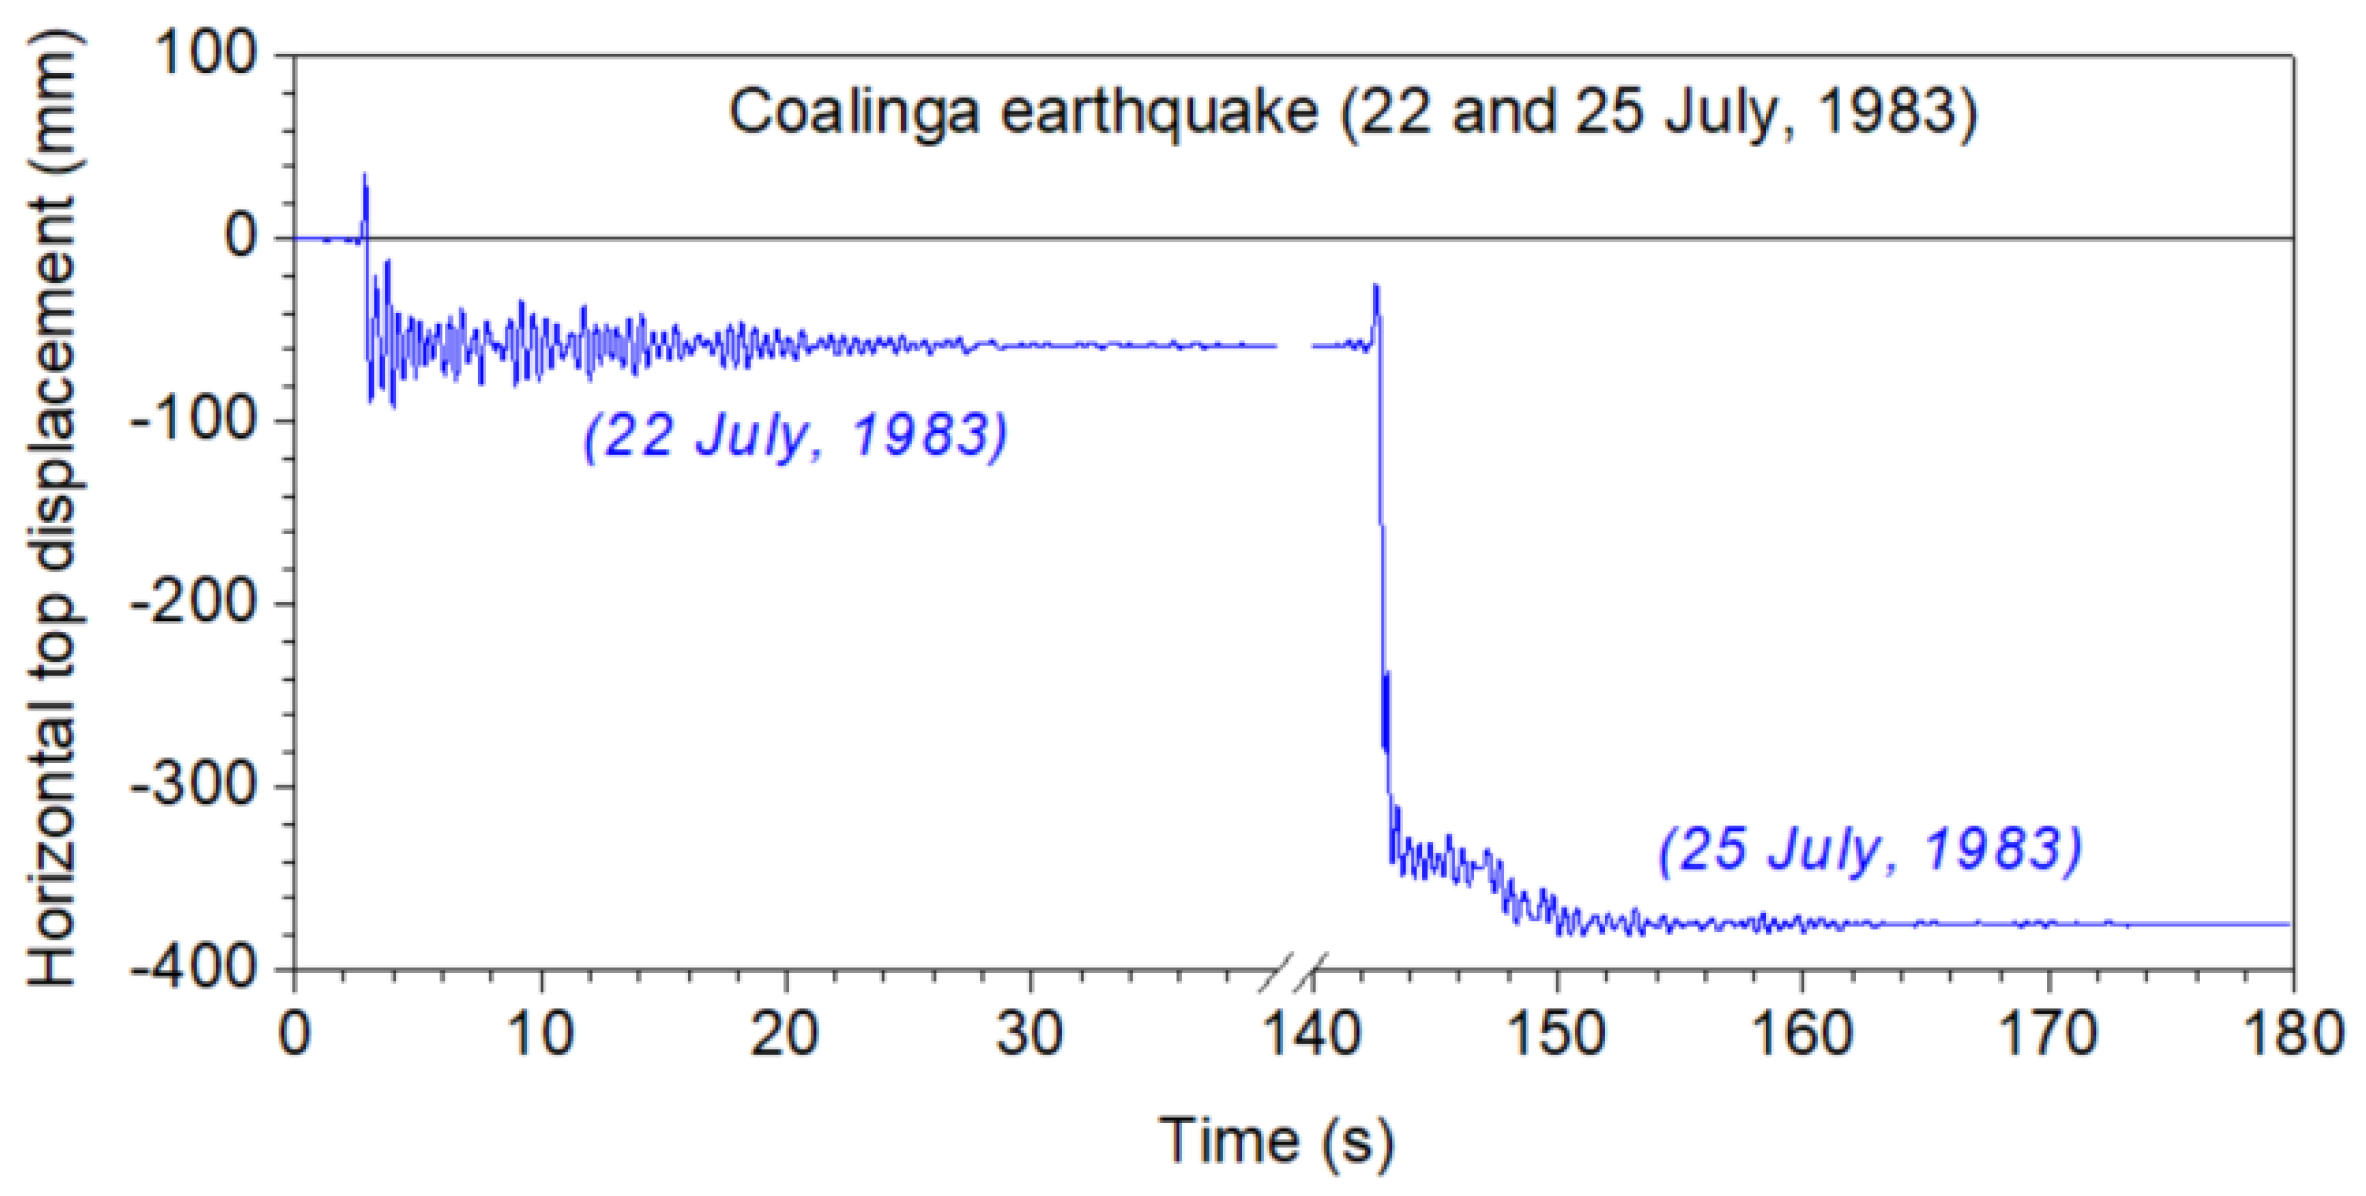
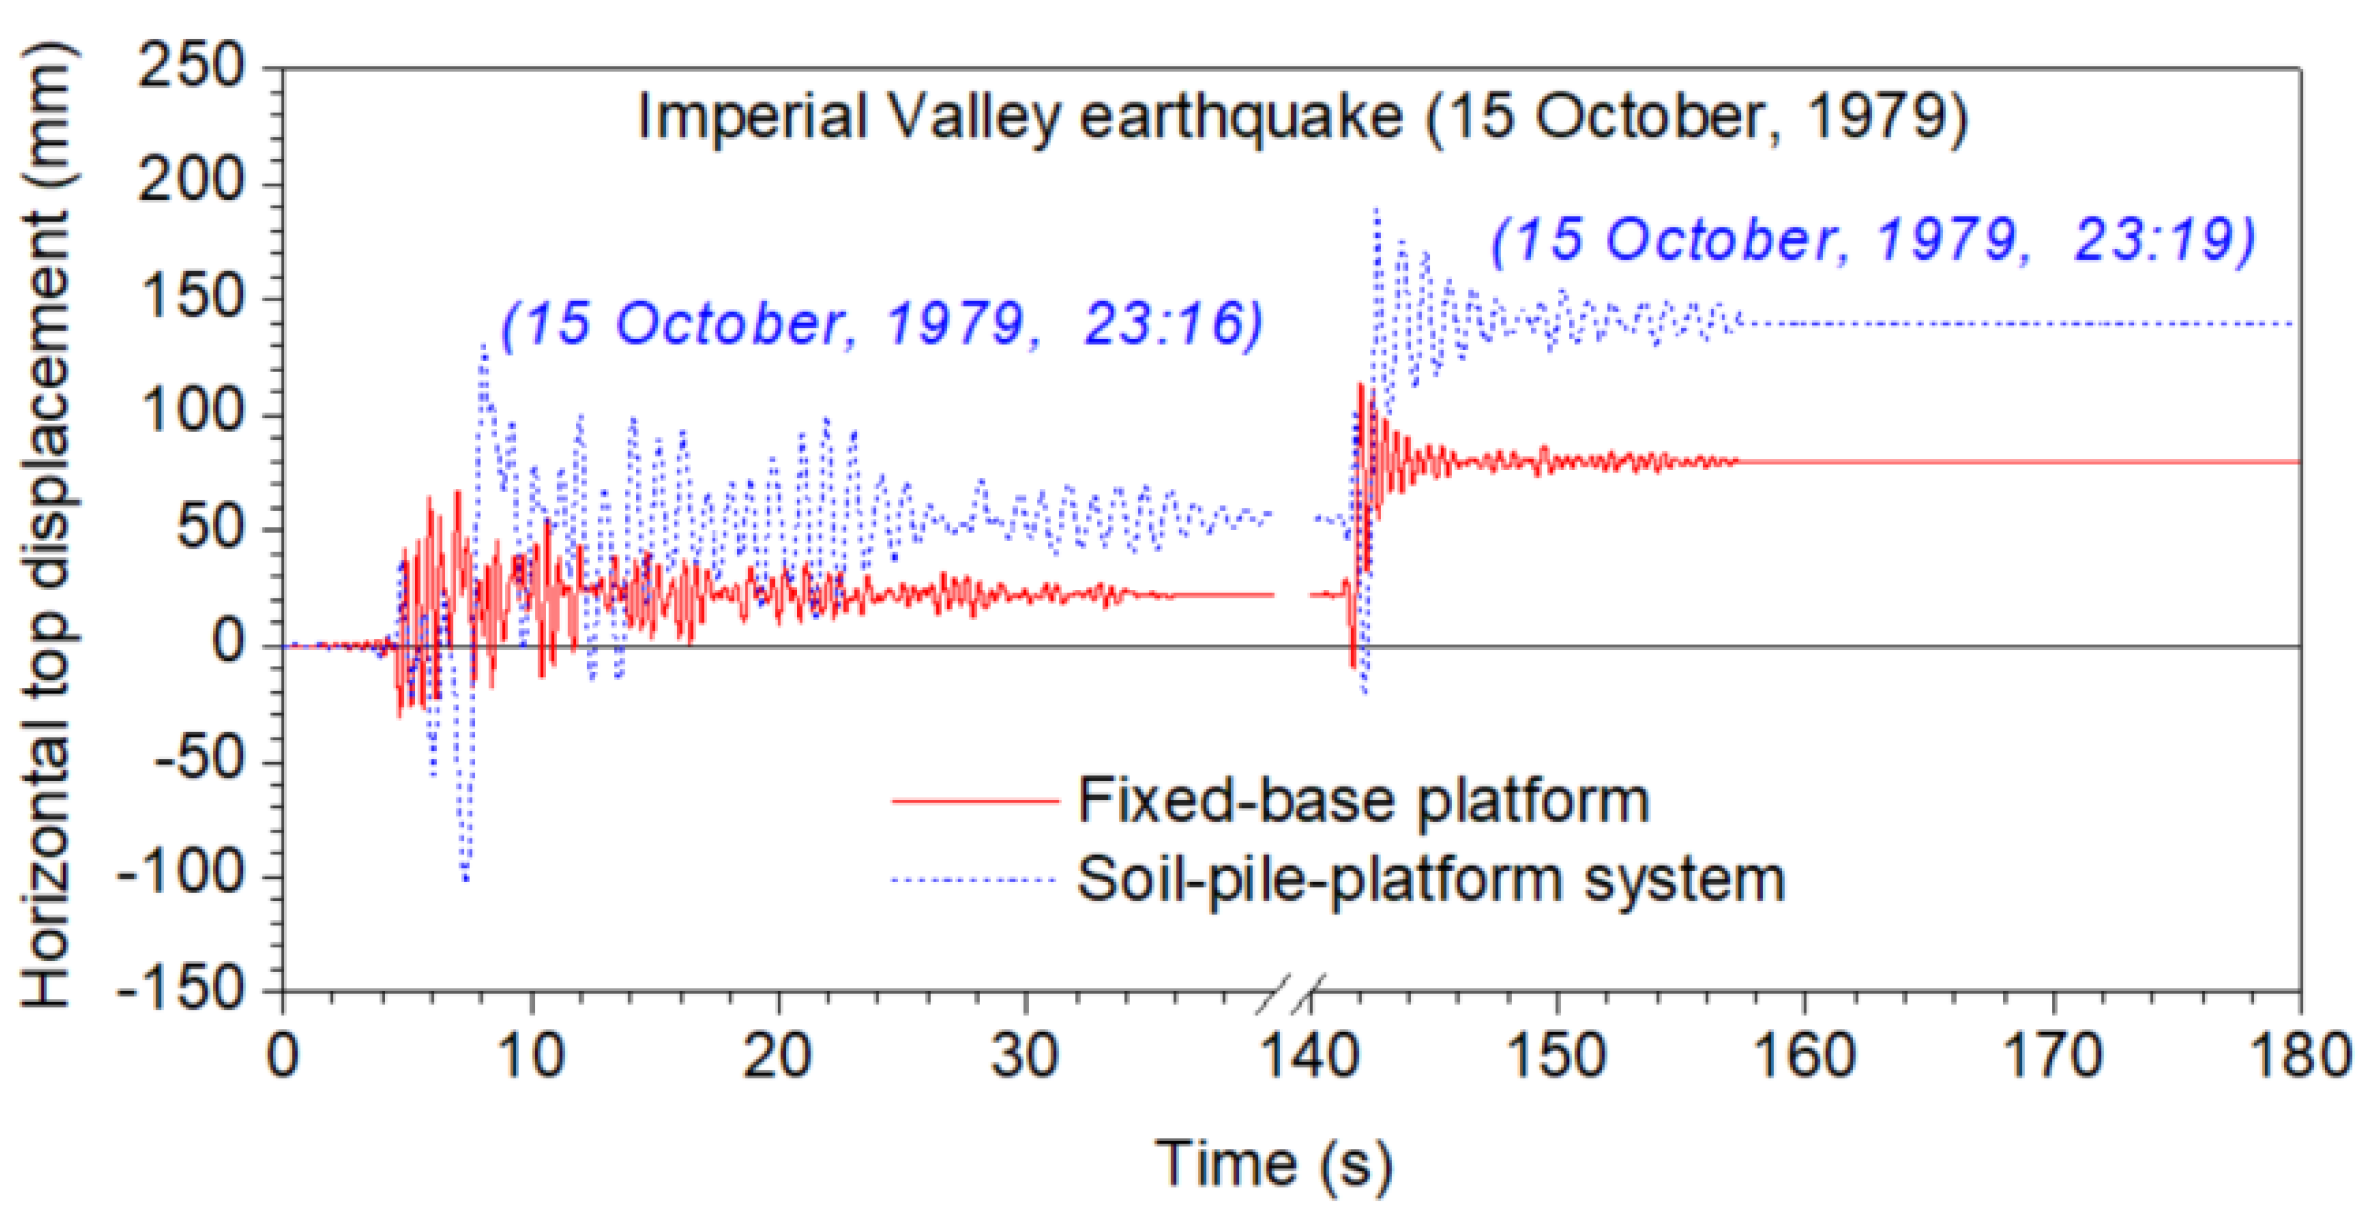
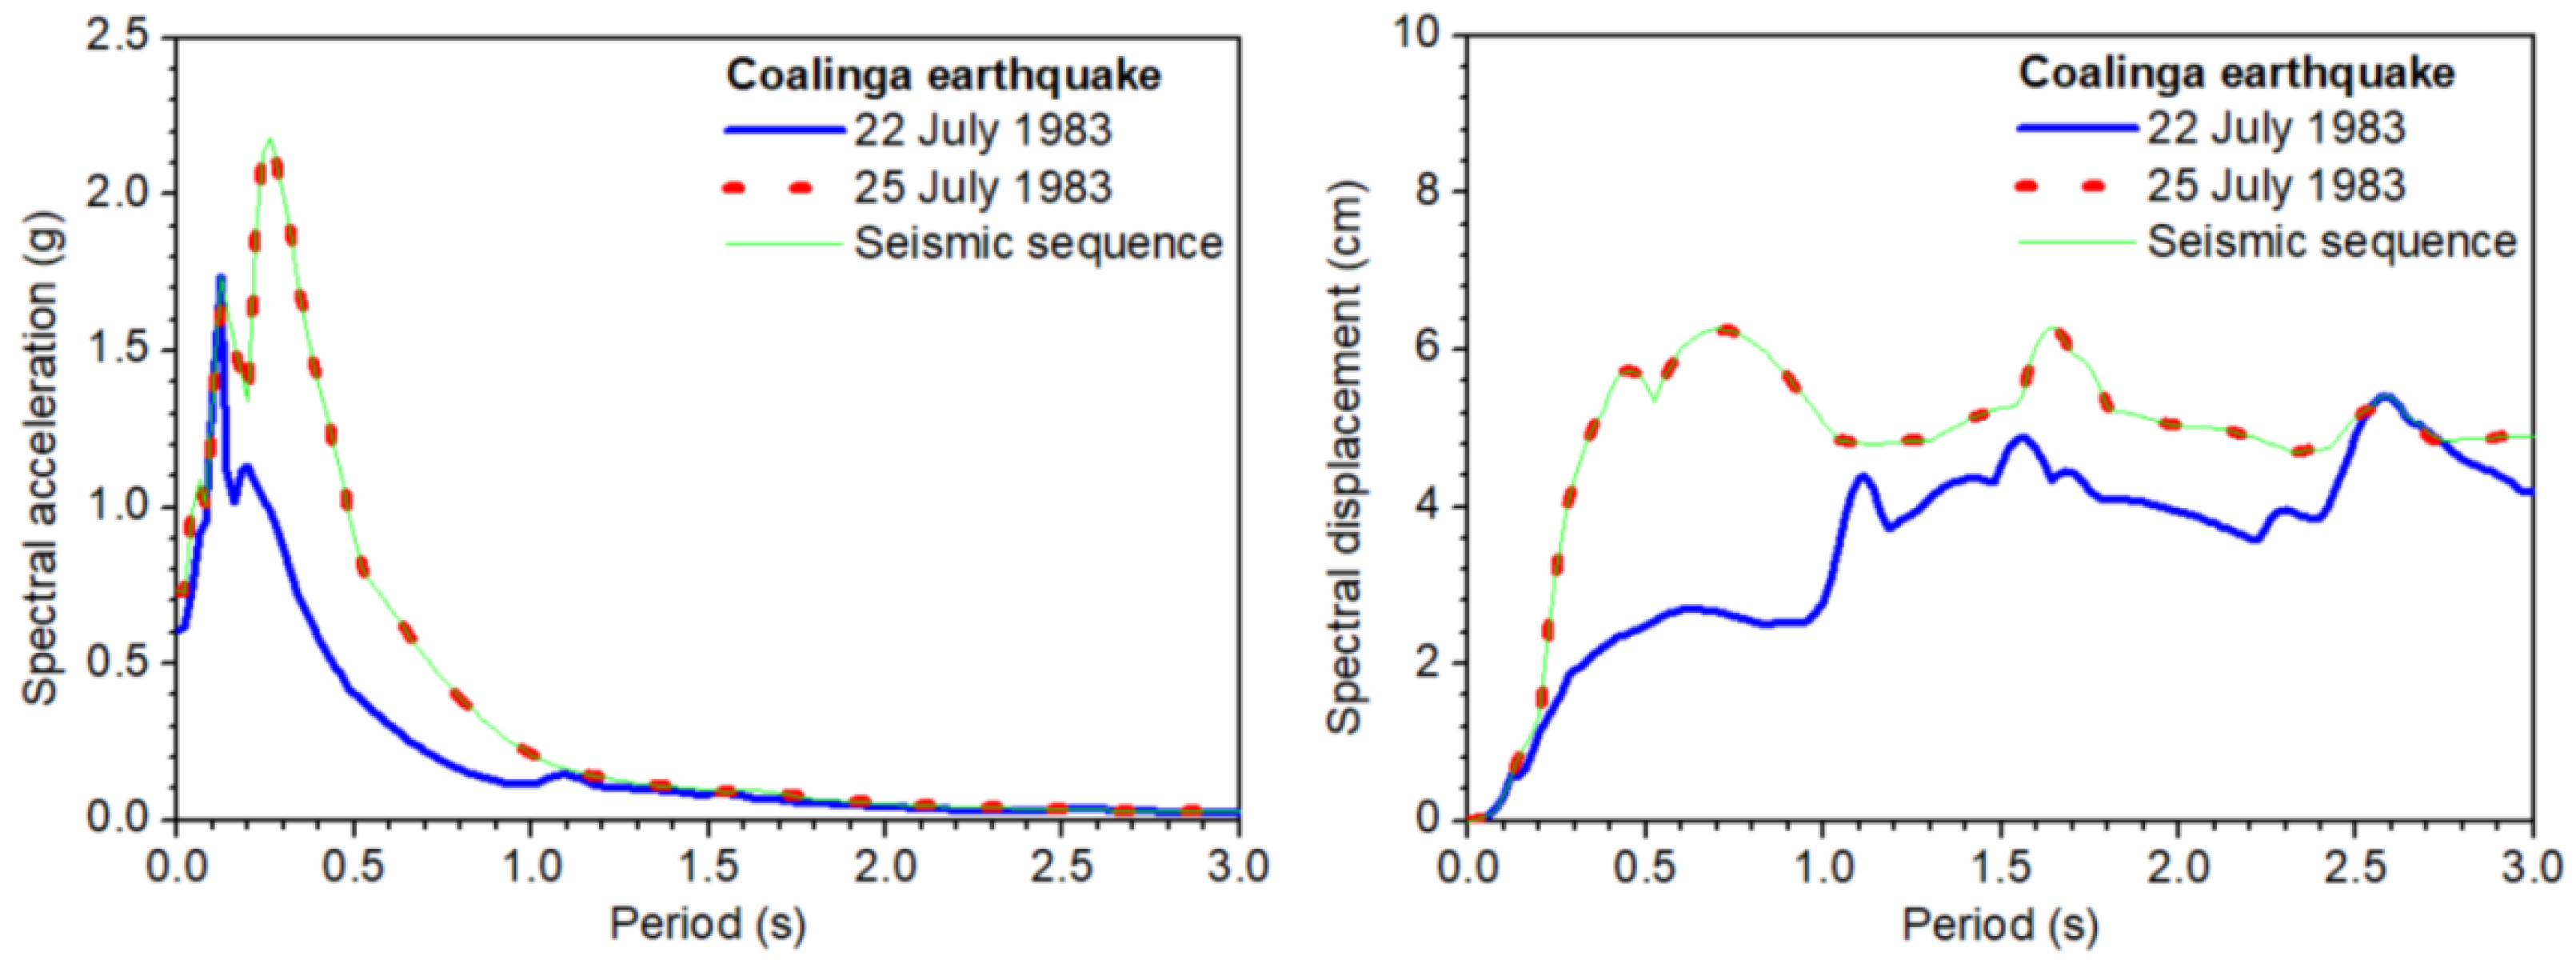
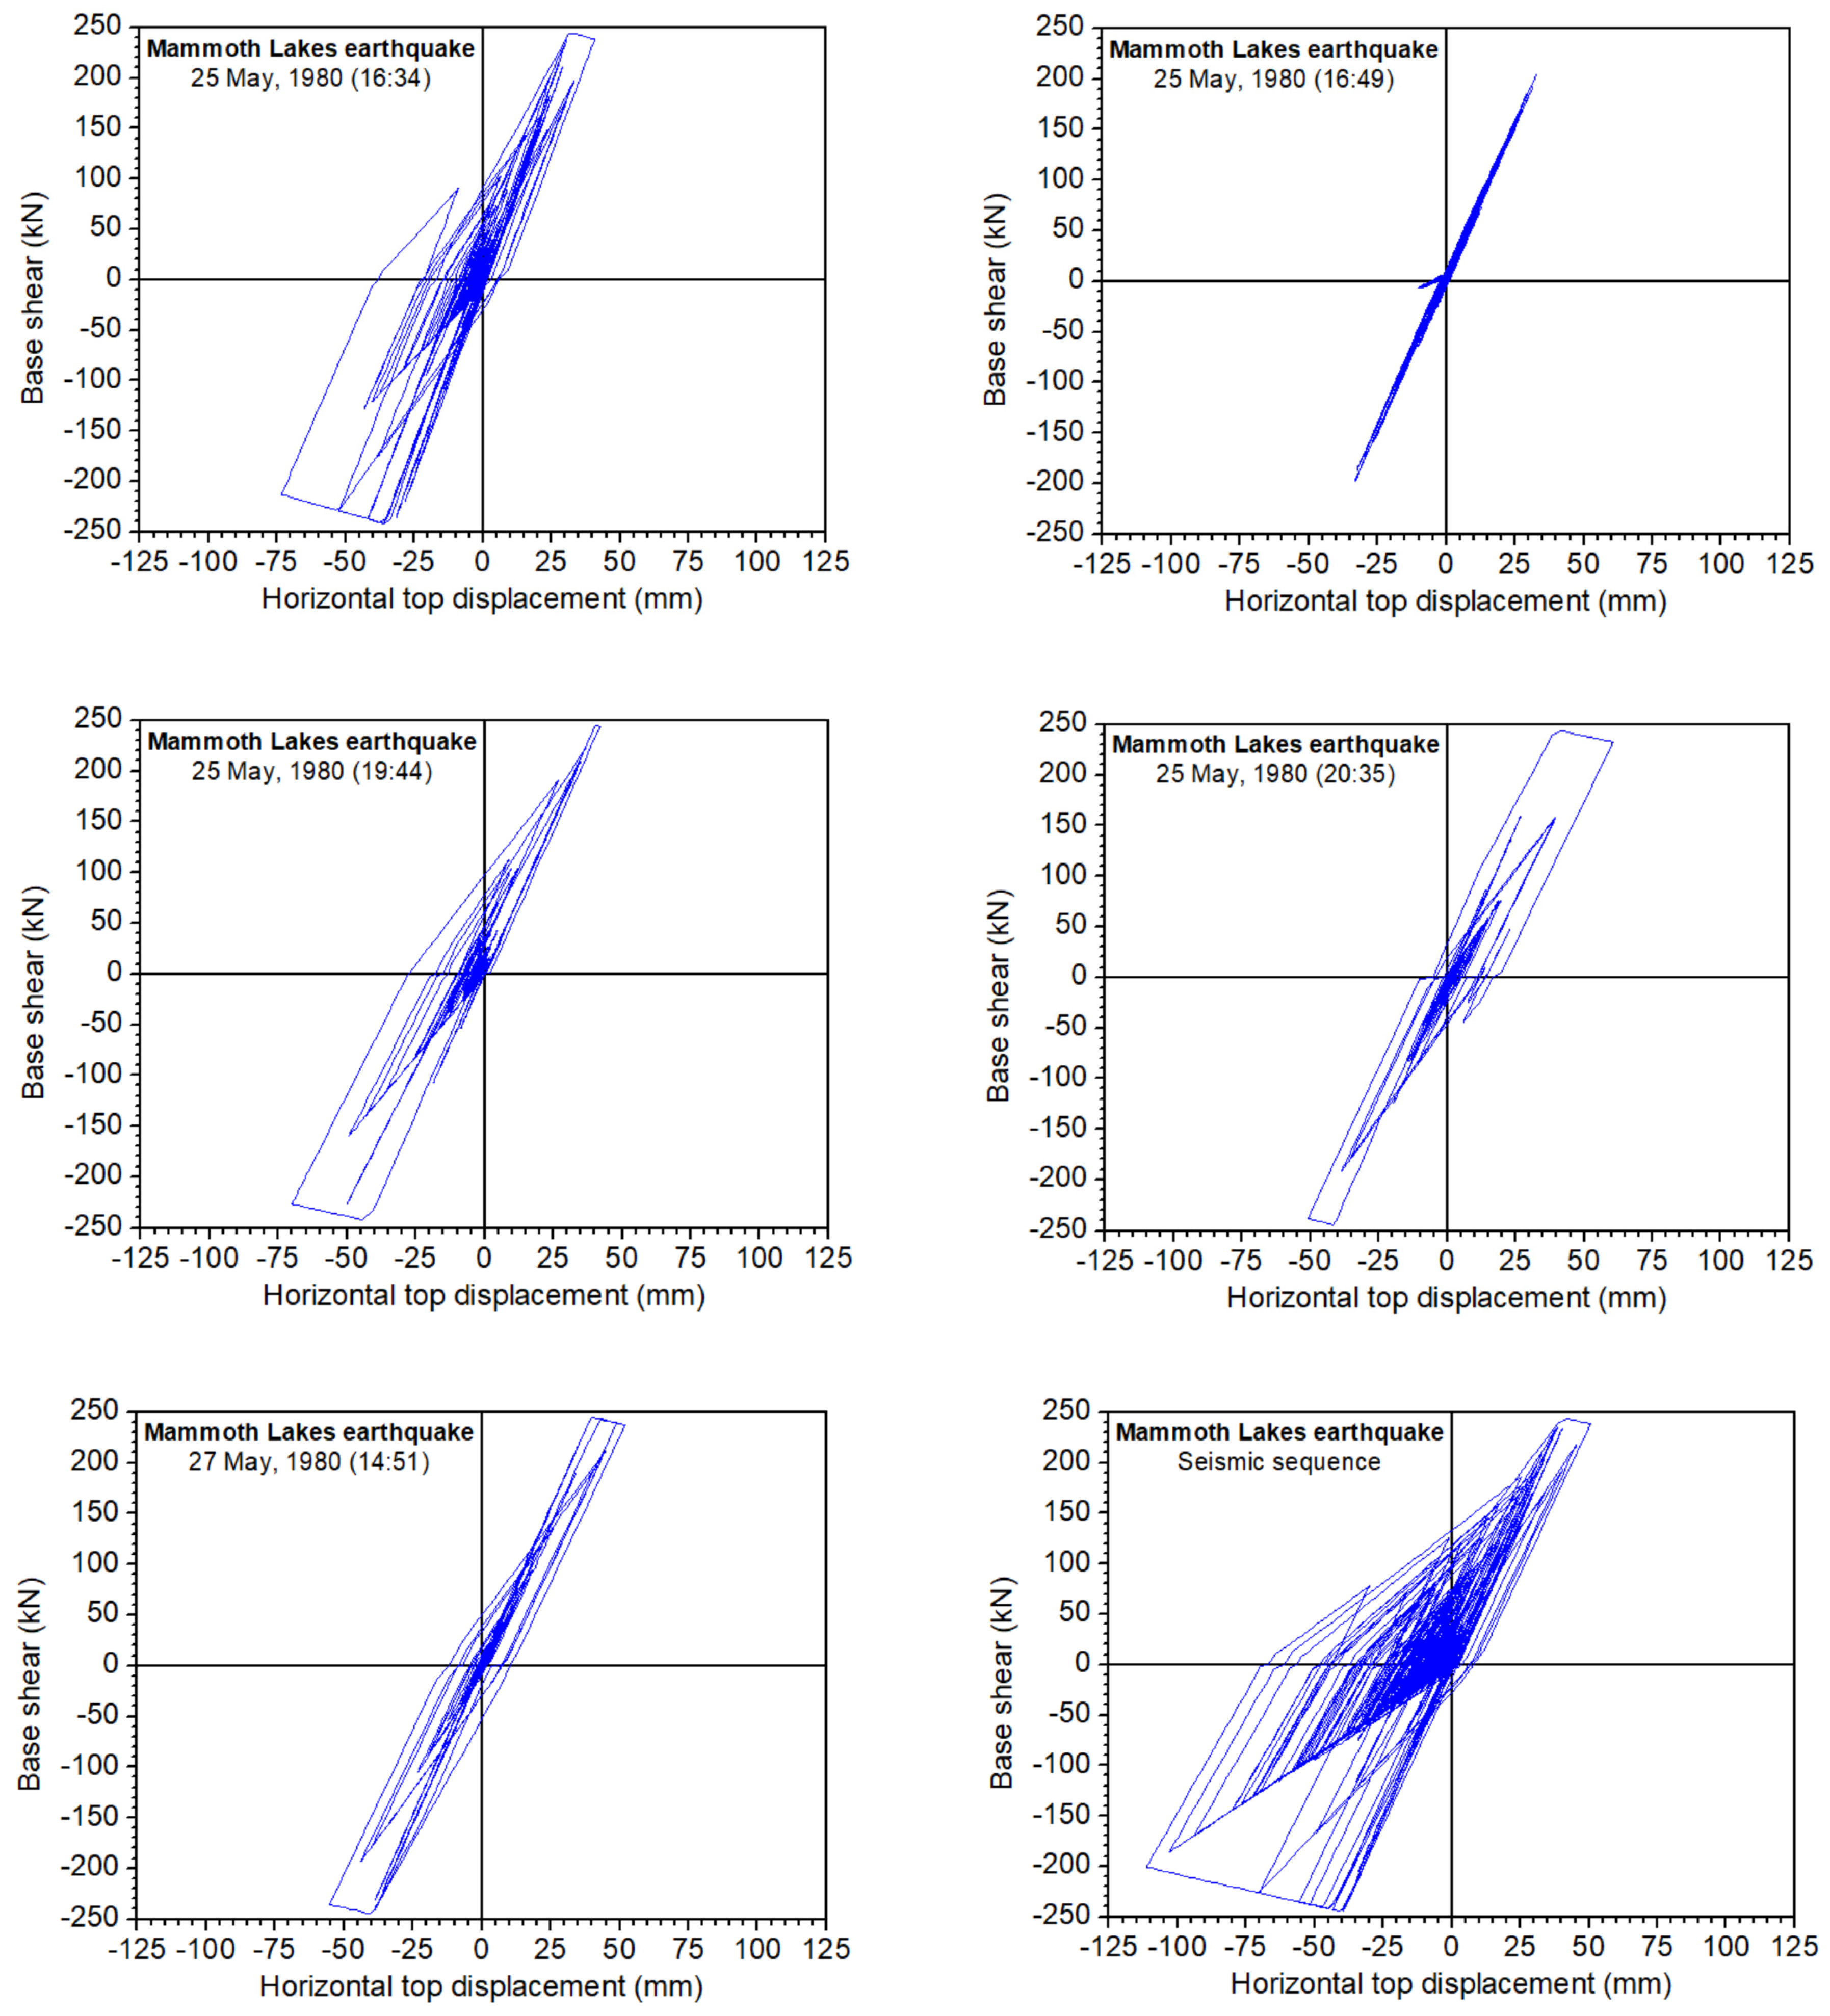
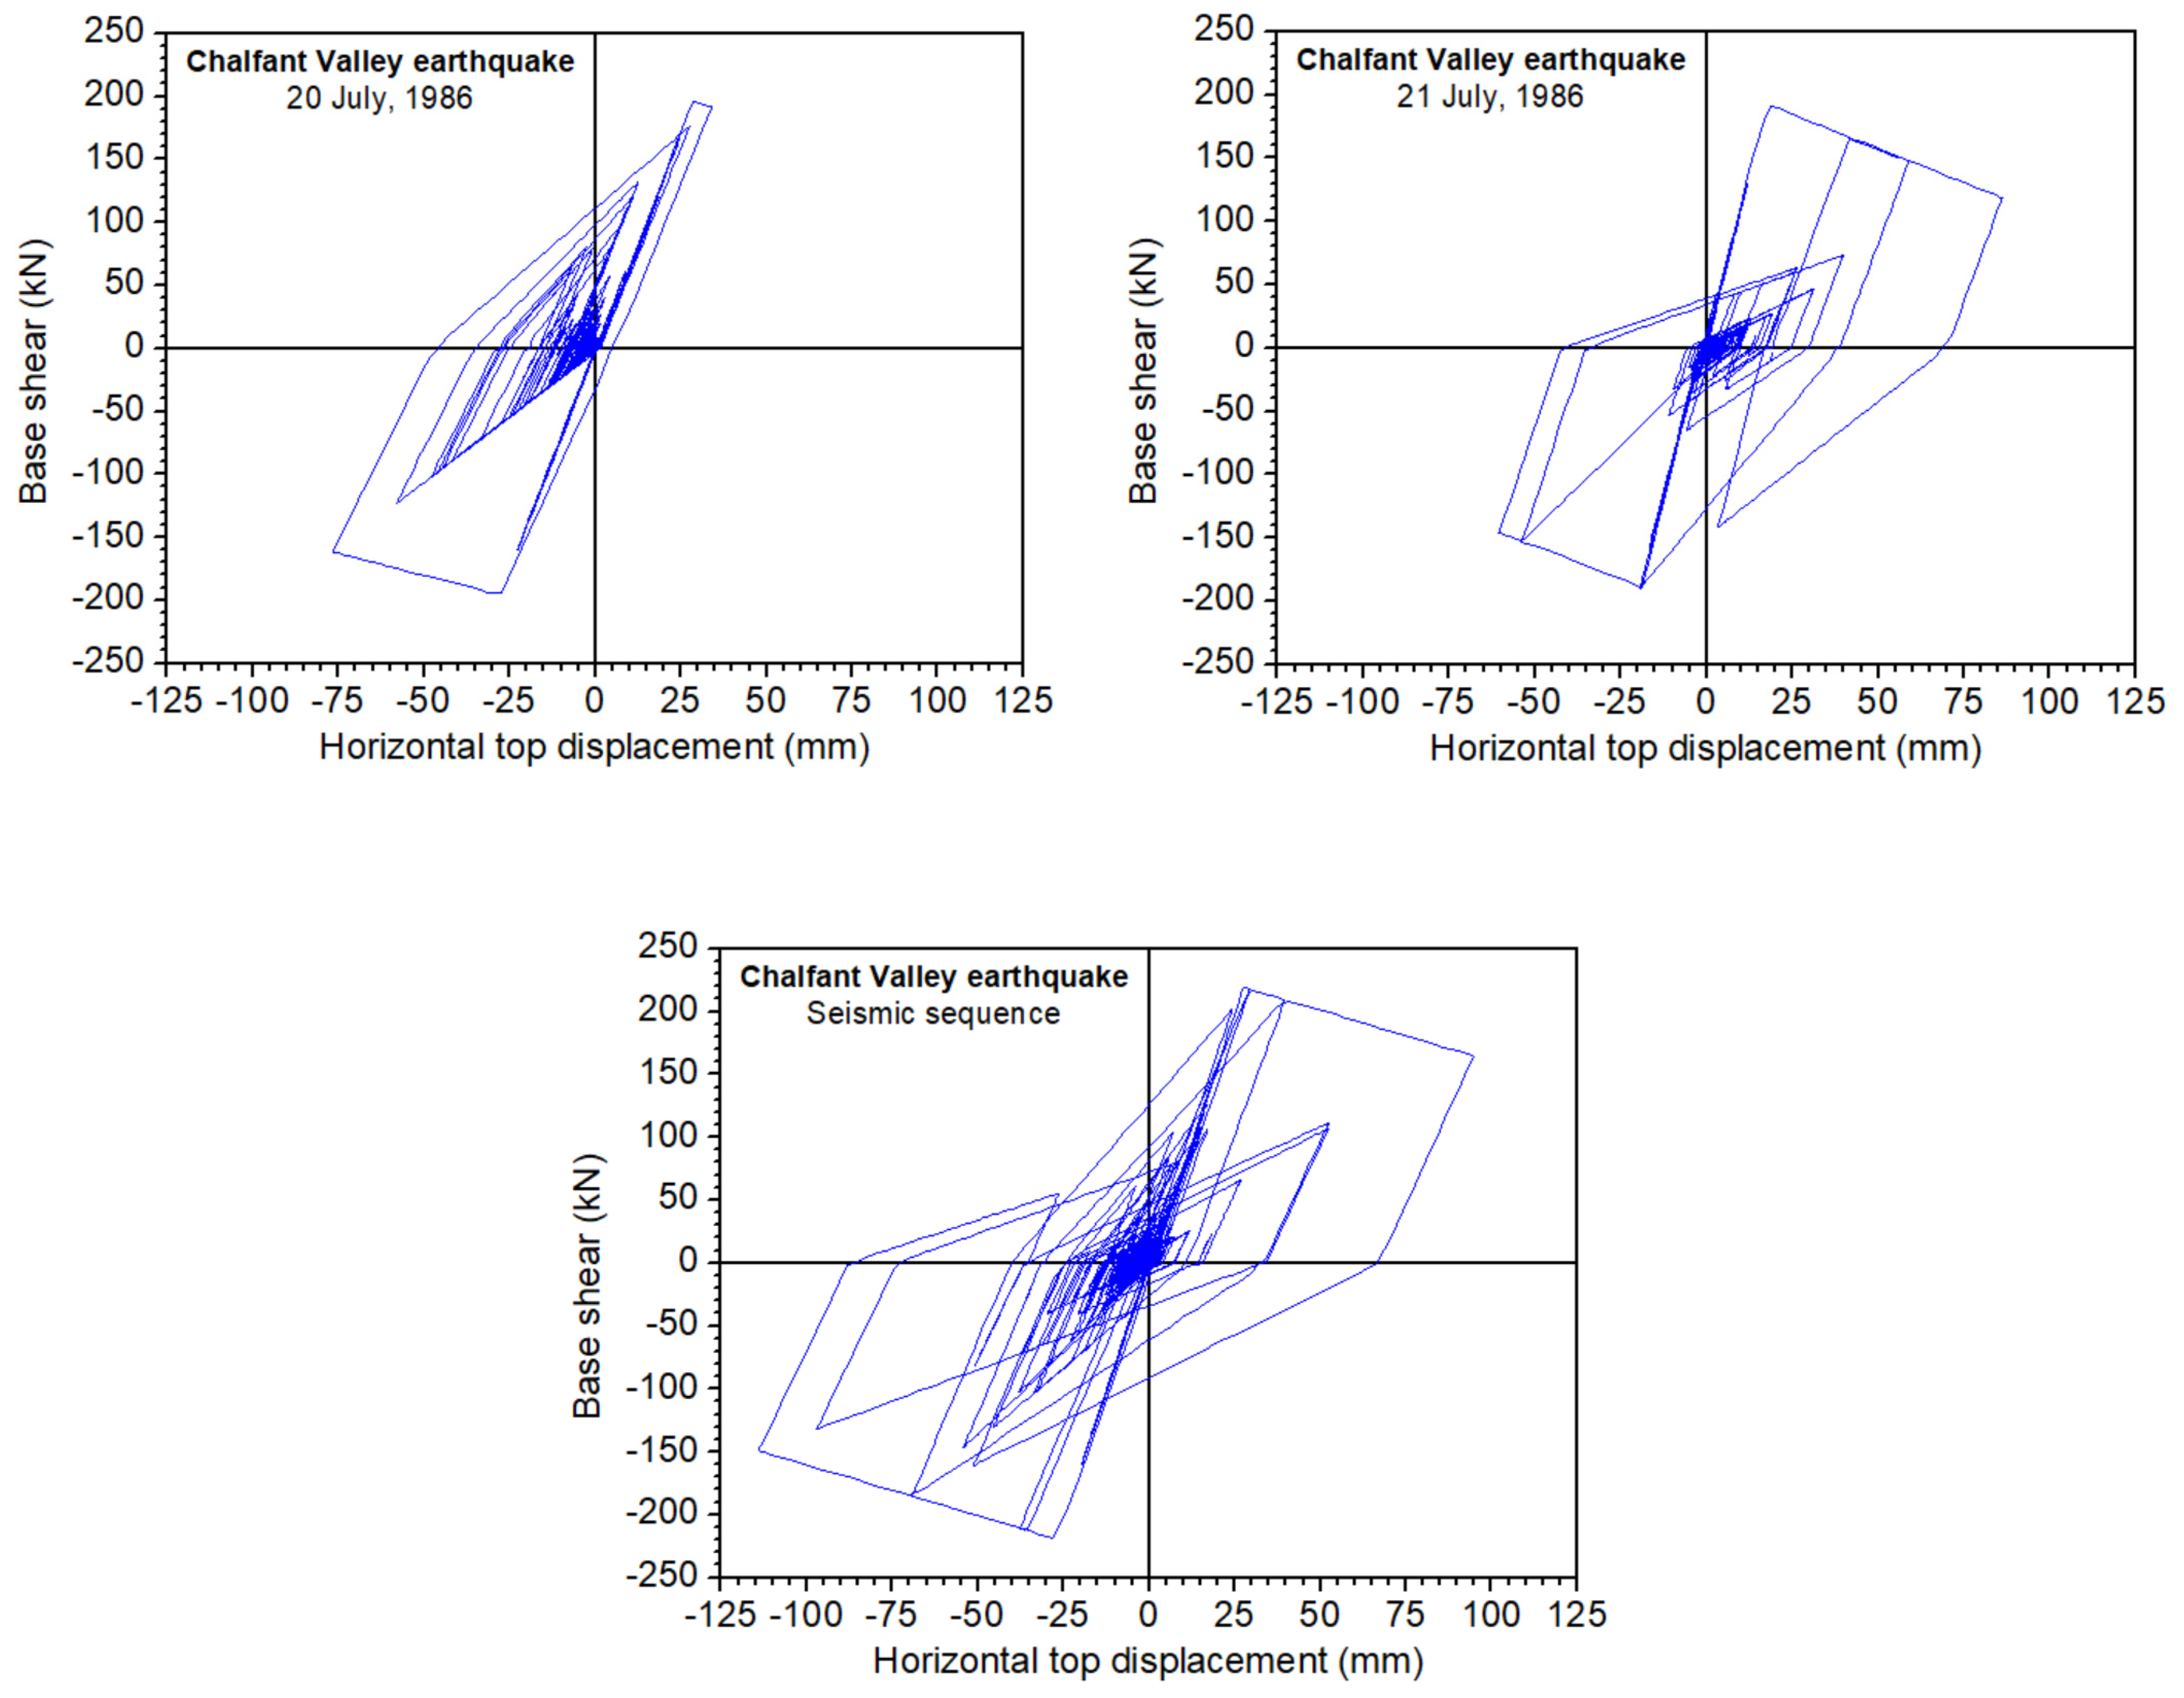
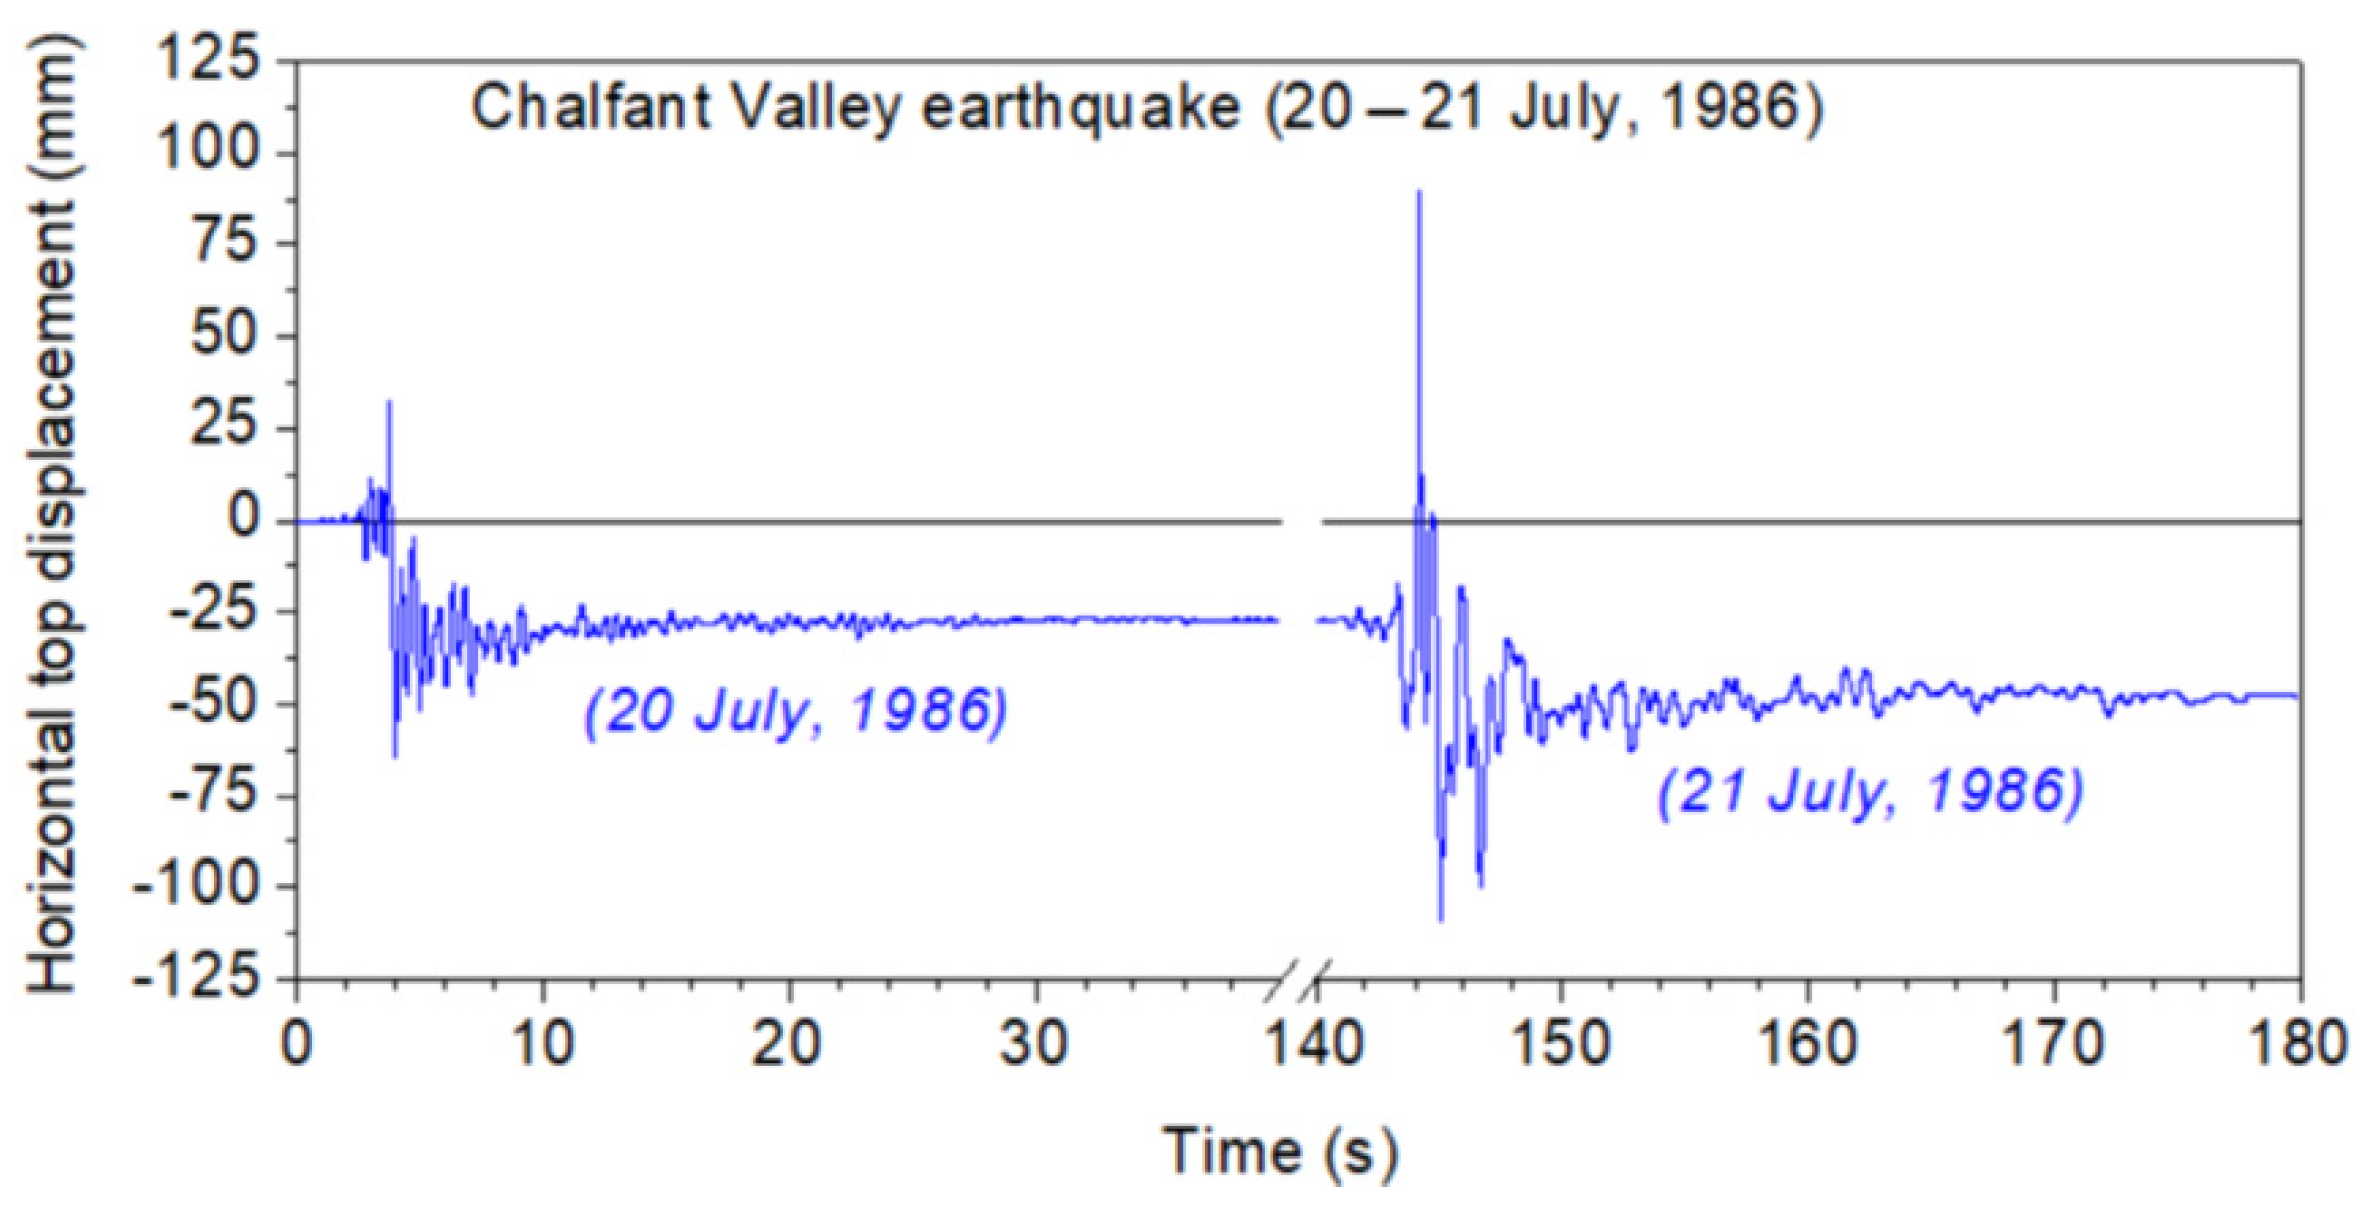
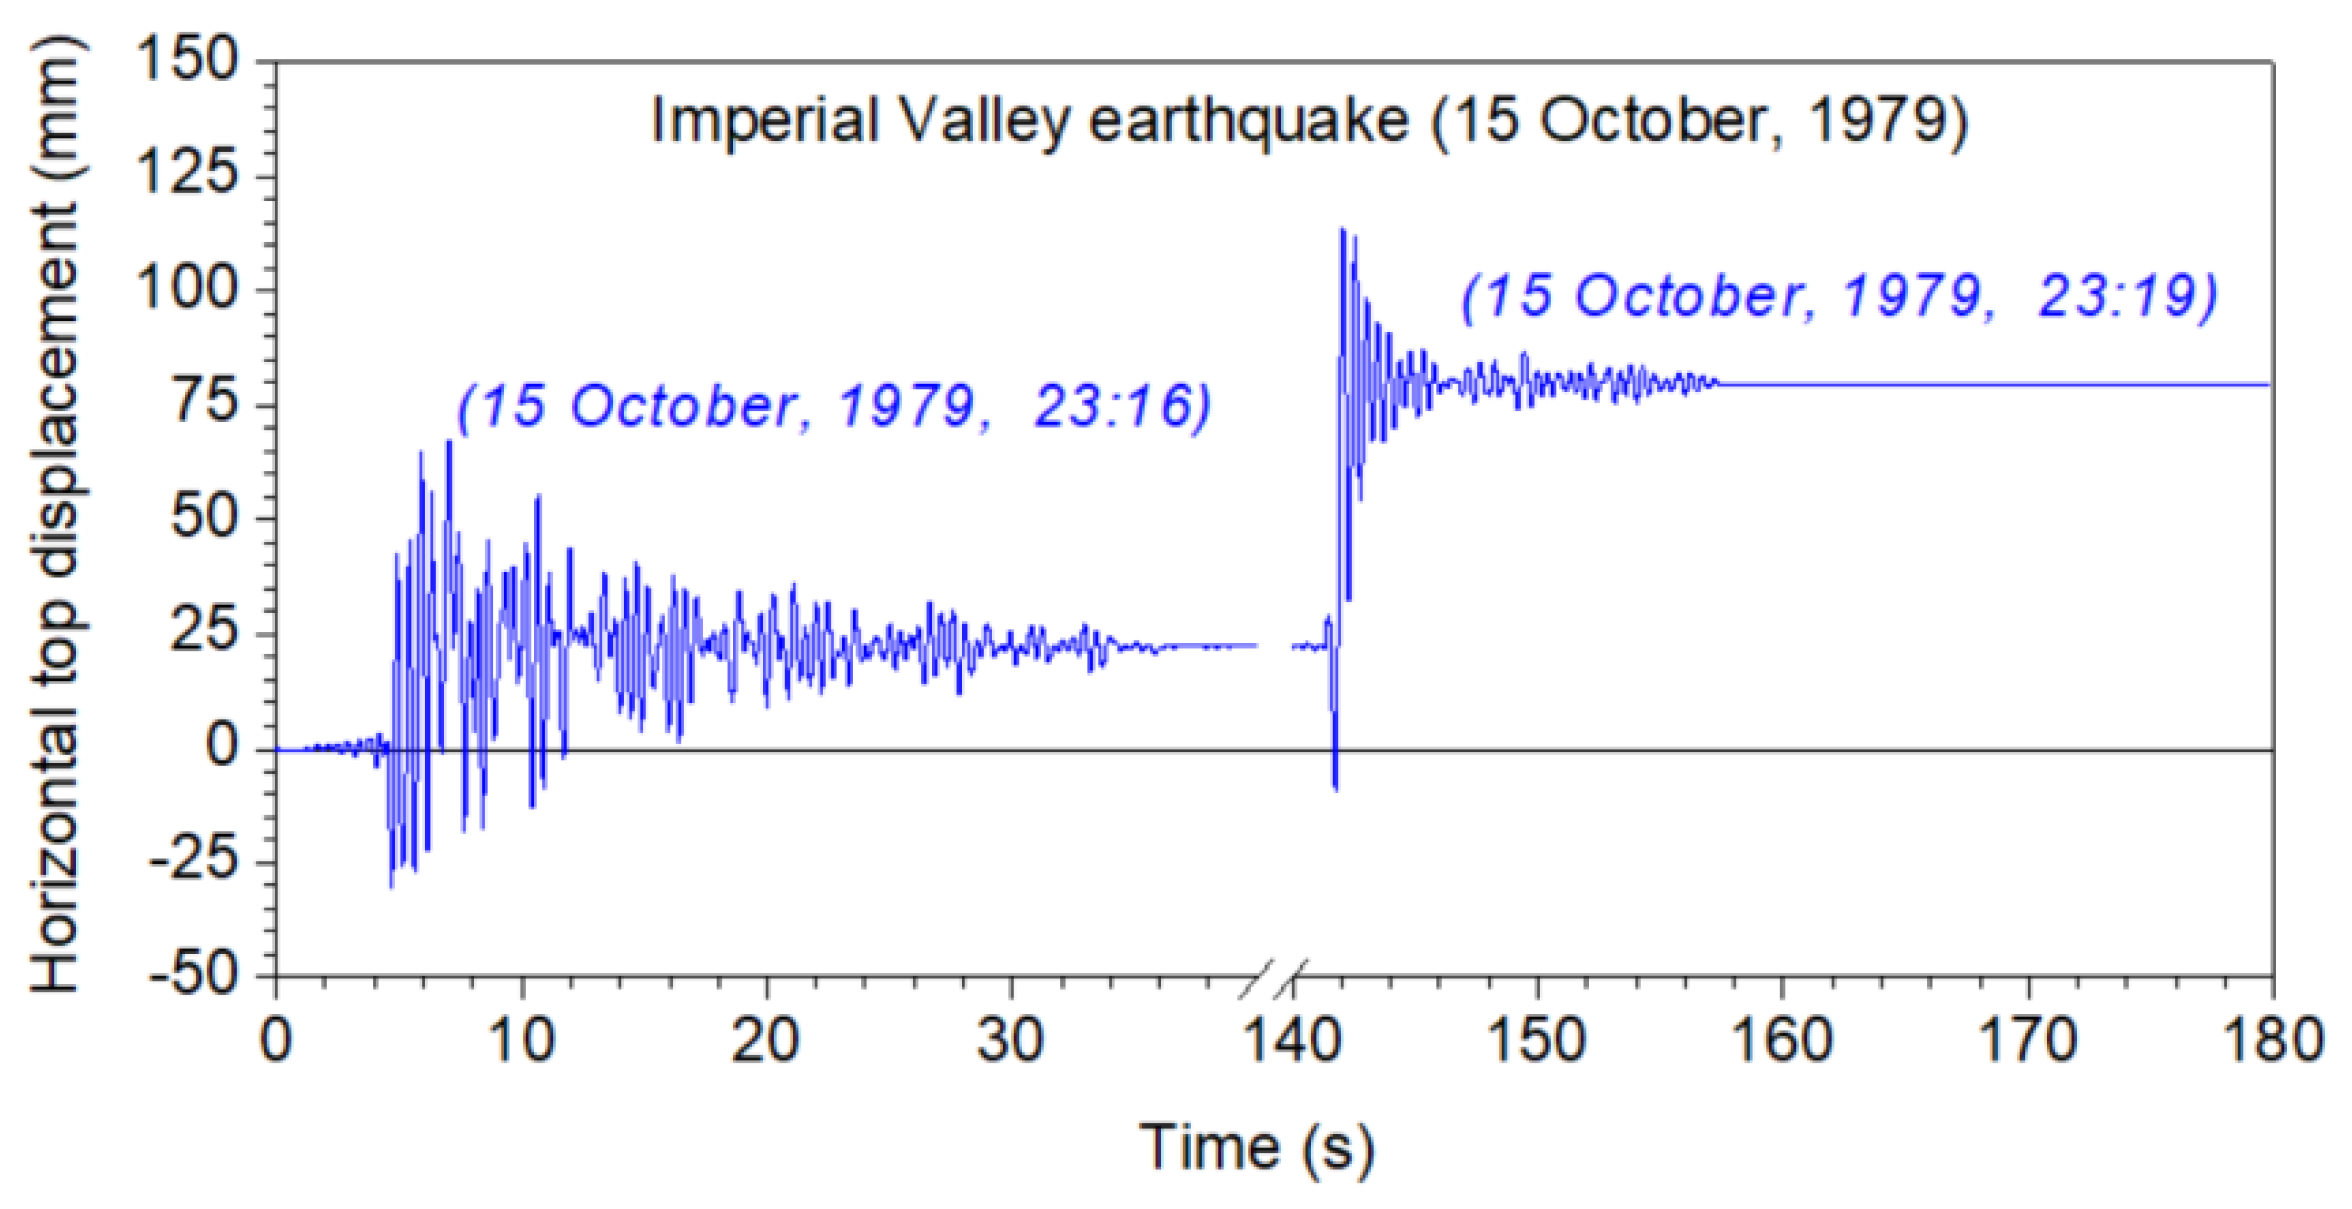
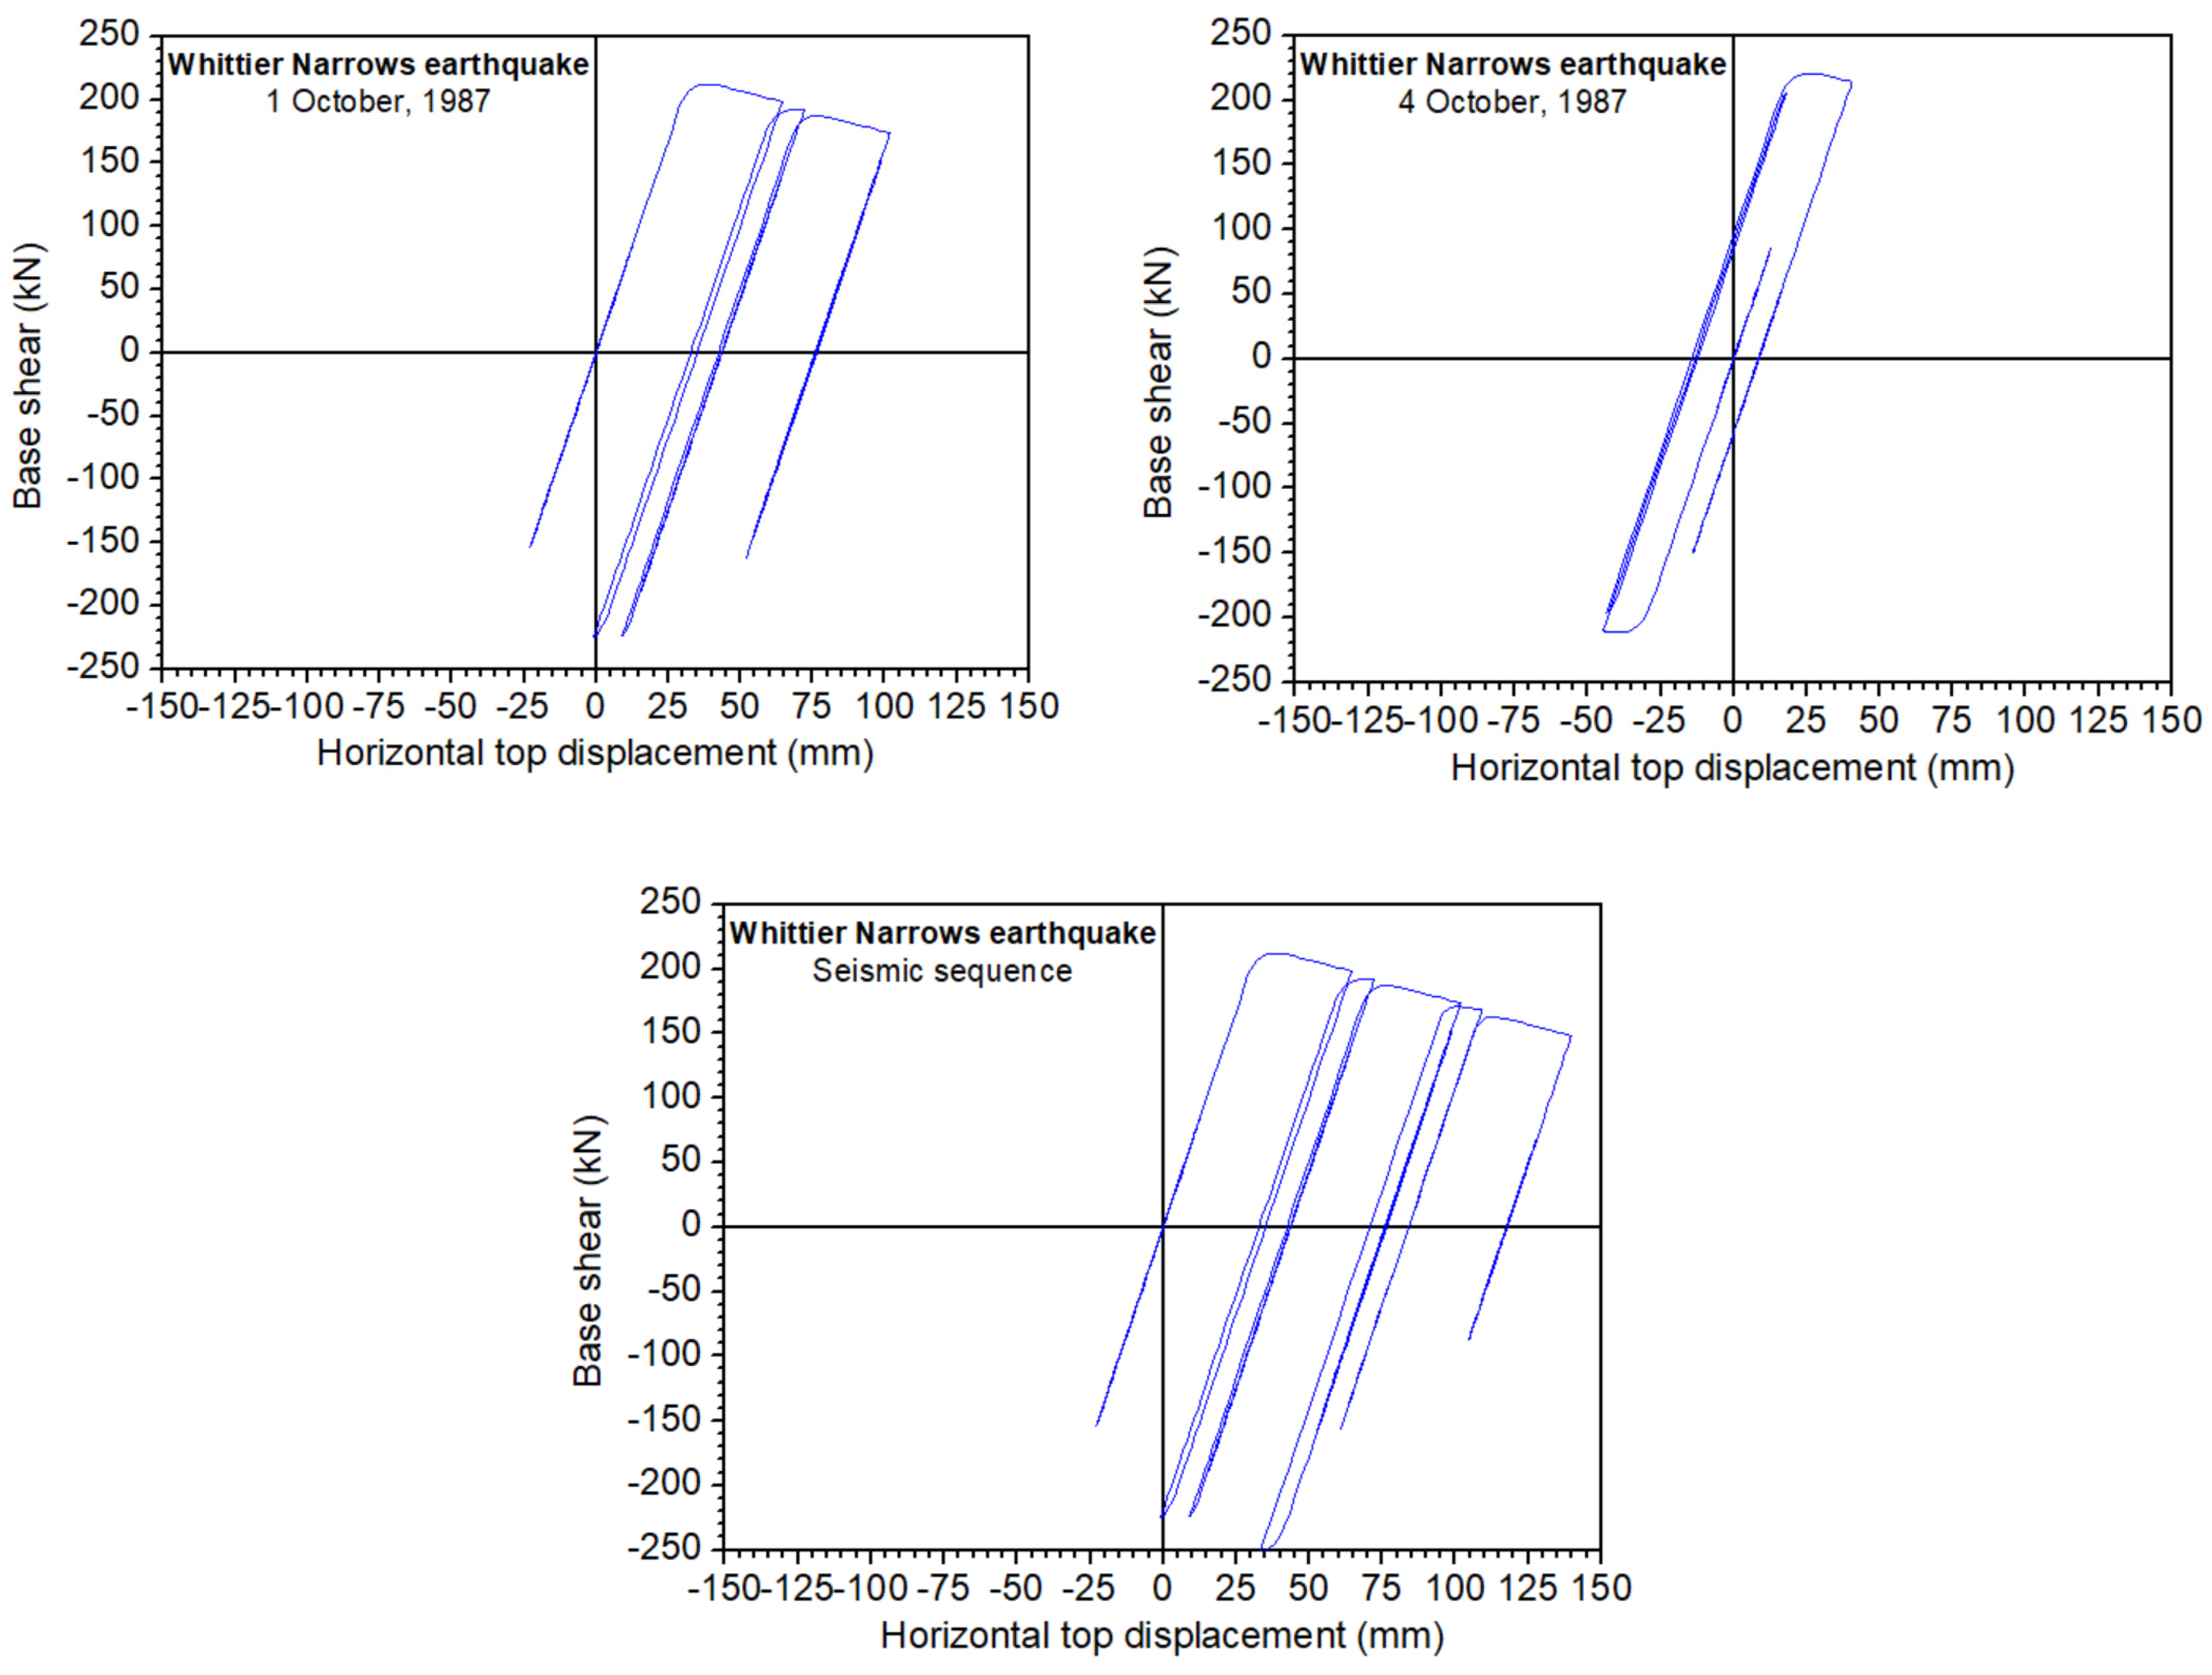
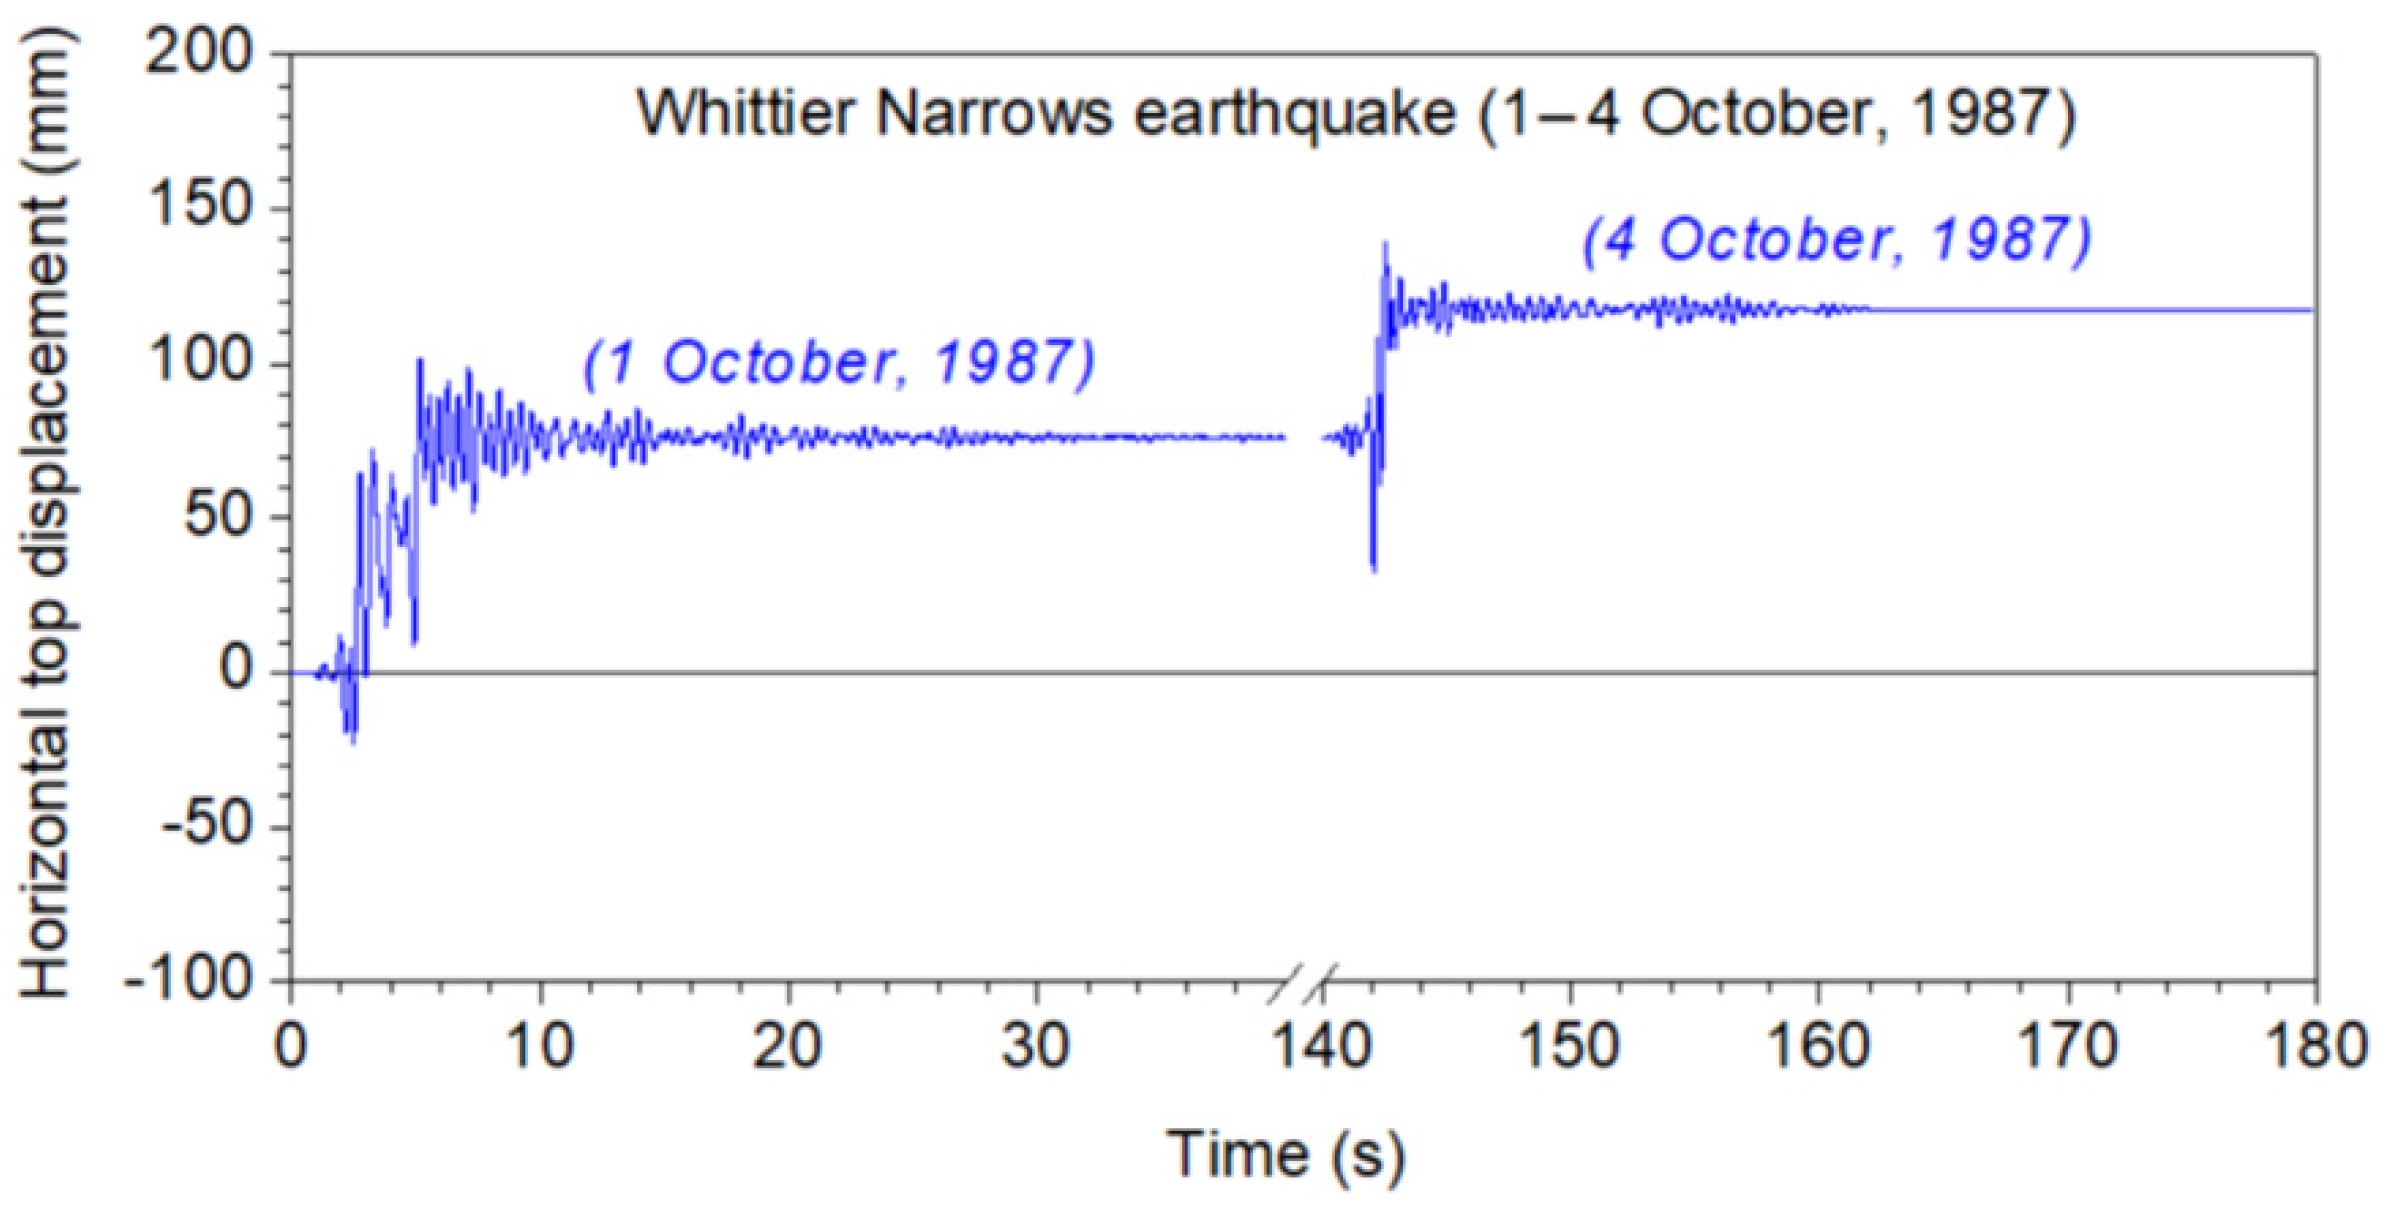
5. Selected Results
6. Conclusions
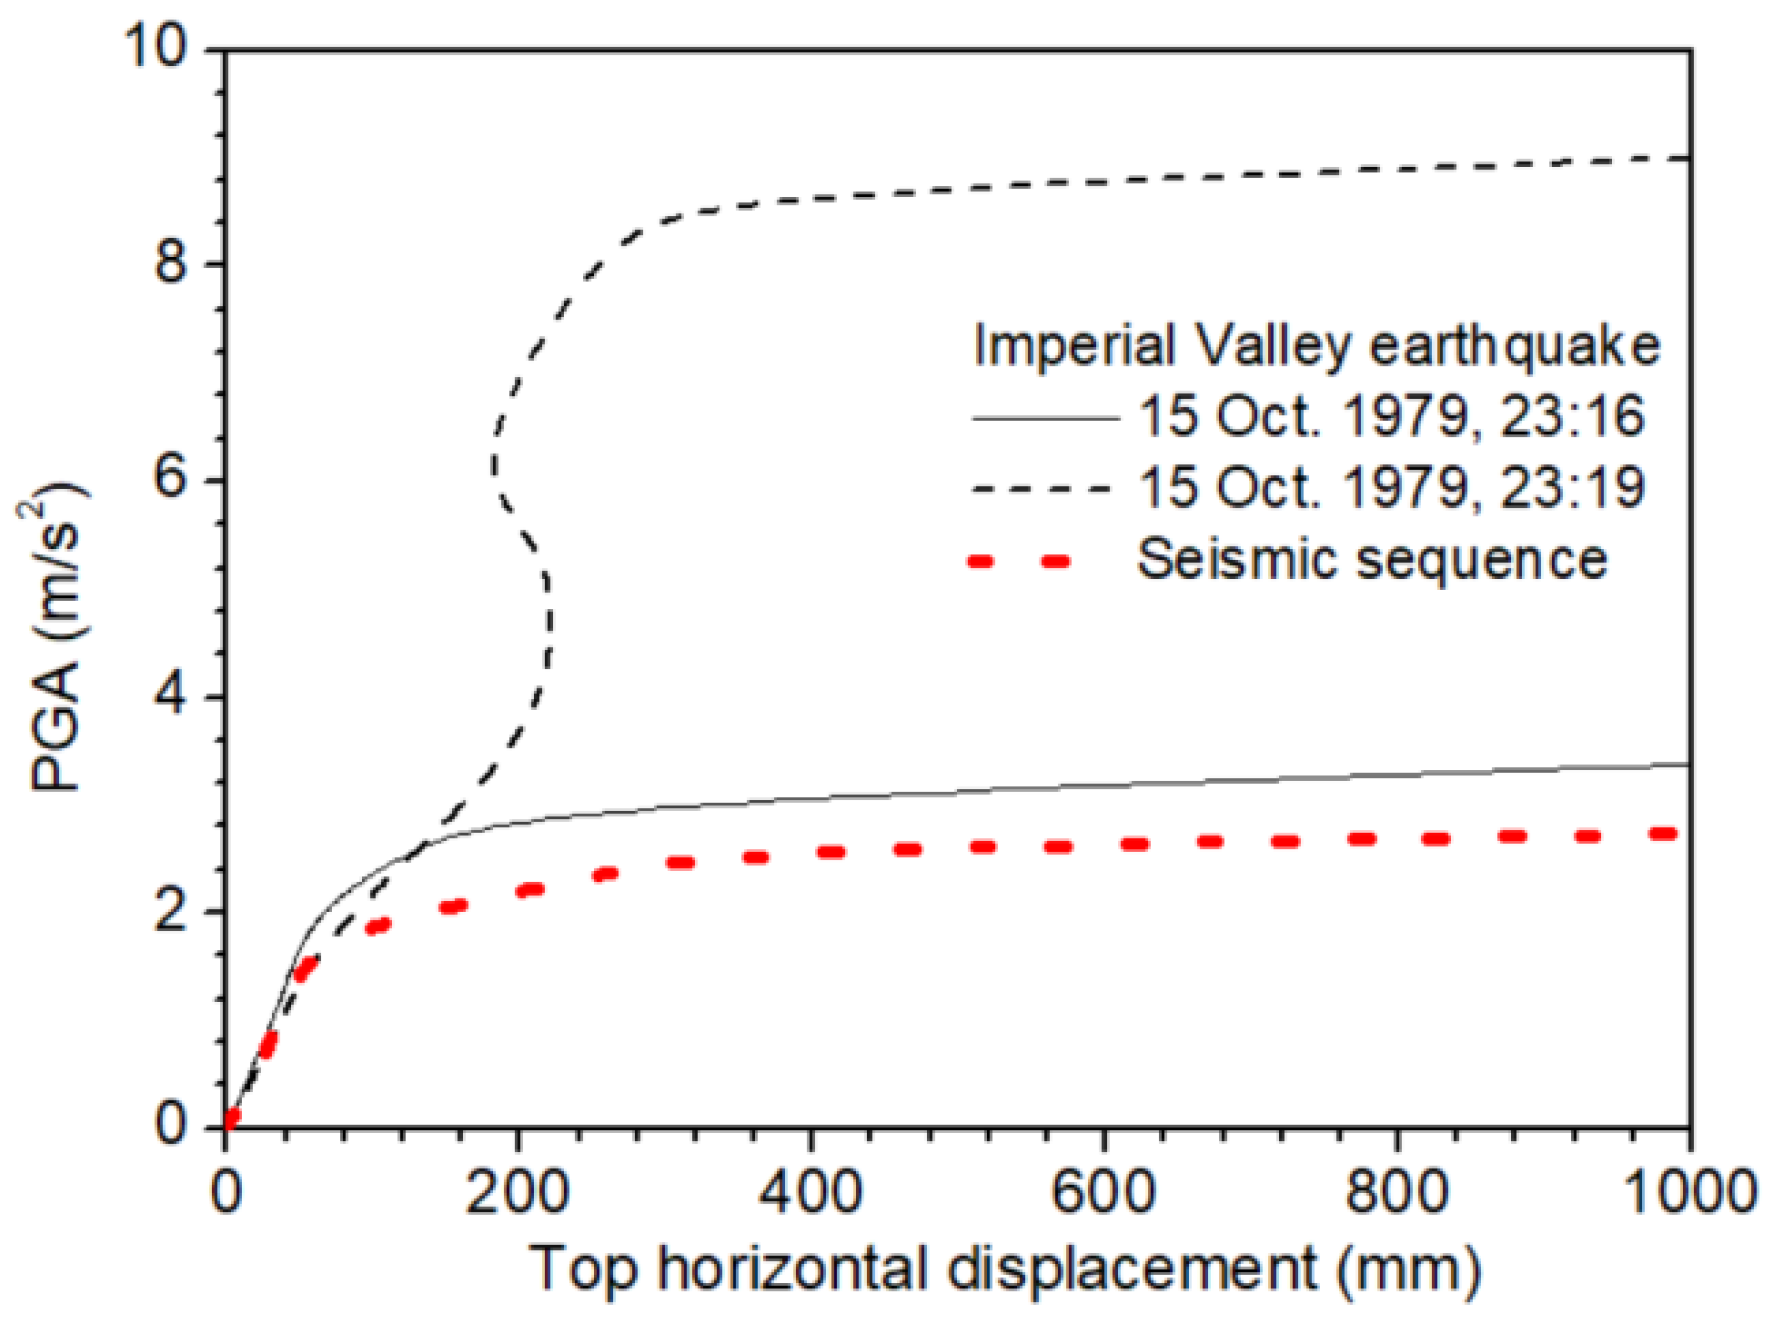
- Multiple earthquakes have increased deformation demands in comparison with separated earthquake records. The maximum top horizontal displacements and permanent deformation due to multiple strong ground motions appear to be increased in comparison with those due to single earthquakes. This behavior is noteworthy and should be considered during the seismic design of platforms either by traditional force-based design or by displacement-based design approaches, which necessitates a reliable evaluation of deformation demands.
- The base shear–deformation diagrams for repeated ground motions are different than their counterparts for single earthquakes.
- The dynamic soil–pile–structure interaction should be taken into account for both the analysis and design of offshore platforms, since their seismic behavior is strongly affected by the flexibility and inelasticity of the soil medium.
- The incremental dynamic analysis approach was applied in this study and showed that repeated earthquakes lead to higher deformation values than do the corresponding single earthquakes.
Author Contributions
Funding
Conflicts of Interest
References
- Hatzigeorgiou, G.D.; Beskos, D.E. Inelastic displacement ratios for SDOF structures subjected to repeated earthquakes. Eng. Struct. 2009, 31, 2744–2755. [Google Scholar] [CrossRef]
- Hatzigeorgiou, G.D. Ductility demand spectra for multiple near- and far-fault earthquakes. Soil Dyn. Earthq. Eng. 2010, 30, 170–183. [Google Scholar] [CrossRef]
- Hatzigeorgiou, G.D. Behaviour factors for nonlinear structures subjected to multiple near-fault earthquakes. Comp. Struct. 2010, 88, 309–321. [Google Scholar] [CrossRef]
- Hatzigeorgiou, G.D. Ductility demands control under repeated earthquakes using appropriate force reduction factors. J. Earthq. Tsunami. 2010, 4, 231–250. [Google Scholar] [CrossRef]
- Fragiacomo, M.; Amadio, C.; Macorini, L. Seismic response of steel frames under repeated earthquake ground motions. Eng. Struct. 2004, 26, 2021–2035. [Google Scholar] [CrossRef]
- Hatzigeorgiou, G.D.; Liolios, A.A. Nonlinear behaviour of RC frames under repeated strong ground motions. Soil Dyn. Earthq. Eng. 2010, 30, 1010–1025. [Google Scholar] [CrossRef]
- Efraimiadou, S.; Hatzigeorgiou, G.D.; Beskos, D.E. Structural pounding between adjacent buildings subjected to strong ground motions. Part II: The effect of multiple earthquakes. Earthq. Eng. Struct. Dyn. 2013, 42, 1529–1545. [Google Scholar] [CrossRef]
- Faisal, A.; Majid, T.A.; Hatzigeorgiou, G.D. Investigation of story ductility demands of inelastic concrete frames subjected to repeated earthquakes. Soil Dyn. Earthq. Eng. 2013, 44, 42–53. [Google Scholar] [CrossRef]
- Hatzivassiliou, M.; Hatzigeorgiou, G.D. Seismic sequence effects on three-dimensional reinforced concrete buildings. Soil Dyn. Earthq. Eng. 2015, 72, 77–88. [Google Scholar] [CrossRef]
- Zayas, V.A.; Popov, E.P.; Mahin, S.A. Cyclic Inelastic Behavior of Steel Offshore Structures: A Report to Sponsor American Petroleum Institute; University of California, Earthquake Engineering Research Center: Berkeley, CA, USA, 1980. [Google Scholar]
- El Naggar, M.H.; Novak, M. Effect of foundation nonlinearity on modal properties of offshore towers. J. Geotech. Eng. ASCE 1995, 121, 660–668. [Google Scholar] [CrossRef]
- Mostafa, Y.E.; El Naggar, M.H. Response of fixed offshore platforms to wave and current loading including soil–structure interaction. Soil Dyn. Earthq. Eng. 2004, 24, 357–368. [Google Scholar] [CrossRef]
- Kayvani, K.; Barzegar, F. Hysteretic modelling of tubular members and offshore platforms. Eng. Struct. 1996, 18, 93–101. [Google Scholar] [CrossRef]
- Fisher, M.A.; Normark, W.R.; Langenheim, V.E.; Calvert, A.J.; Sliter, R. The offshore Palos Verdes fault zone near San Pedro, Southern California. Bull. Seism. Soc. Am. 2004, 94, 506–530. [Google Scholar] [CrossRef]
- Peng, B.F.; Chang, B.; Leow, B.L.; Nandlal, S. Nonlinear dynamic soil-pile-structure-interaction analysis of offshore platform for ductility level earthquake under soil liquefaction conditions. In Proceedings of the 14th World Conference on Earthquake Engineering, Beijing, China, 12–17 October 2008. Paper (05-01, 0386). [Google Scholar]
- Asgarian, B.; Agheshlui, H. Reliability-based earthquake design of jacket-type offshore platforms considering pile-soil-structure interaction. Am. J. Appl. Sci. 2009, 6, 631. [Google Scholar] [CrossRef] [Green Version]
- Asgarian, B.; Lesani, M. Pile-soil-structure interaction in pushover analysis of jacket offshore platforms using fiber elements. J. Constr. Steel Res. 2009, 65, 209–218. [Google Scholar] [CrossRef]
- Asgarian, B.; Ajamy, A. Seismic performance of jacket type offshore platforms through incremental dynamic analysis. J. Offshore Mech. Arctic Eng 2010, 132, 1–14. [Google Scholar] [CrossRef]
- Asgarian, B.; Zarrin, M.; Sabzeghabaian, M. Effect of foundation behaviour on steel jacket offshore platform failure modes under wave loading. Ships Offshore Struct. 2018, 14, 1–12. [Google Scholar] [CrossRef]
- Bargi, K.; Hosseini, S.R.; Tadayon, M.H.; Sharifian, H. Seismic response of a typical fixed jacket-type offshore platform (SPD1) under sea waves. Open J. Marine Sci. 2011, 1, 36. [Google Scholar] [CrossRef] [Green Version]
- Golafshani, A.A.; Kia, M.; Alanjari, P. Local joint flexibility element for offshore platforms structures. Marine Struct. 2013, 33, 56–70. [Google Scholar] [CrossRef]
- El-Din, M.N.; Kim, J. Sensitivity analysis of pile-founded fixed steel jacket platforms subjected to seismic loads. Ocean Eng. 2014, 85, 1–11. [Google Scholar] [CrossRef]
- Sharifian, H.; Bargi, K.; Zarrin, M. Ultimate strength of fixed offshore platforms subjected to near-fault earthquake ground vibration. Shock Vibr. 2015, 2015, 1–19. [Google Scholar] [CrossRef]
- Konstandakopoulou, F.D.; Evangelinos, K.I.; Nikolaou, I.E.; Papagiannopoulos, G.A.; Pnevmatikos, N.G. Seismic analysis of offshore platforms subjected to pulse-type ground motions compatible with European Standards. Soil Dyn. Earthq. Eng. 2020, 105713. [Google Scholar] [CrossRef]
- Konstandakopoulou, F.D.; Papagiannopoulos, G.A.; Pnevmatikos, N.G.; Hatzigeorgiou, G.D. Seismic hazard assessment of offshore platforms. Int. J. Civil Envir. Eng. 2019, 13, 272–276. [Google Scholar]
- Wu, Q.; He, Z.; Jia, Z.; Zhang, X. Seismic Collapse Performance of Jacket Offshore Platforms with Time-Variant Zonal Corrosion Model. Appl. Ocean Res. 2019, 84, 268–278. [Google Scholar]
- Tabeshpour, M.R.; Fatemi, M. Optimum arrangement of braces in jacket platform based on strength and ductility. Marine Struct. 2020, 71, 102734. [Google Scholar] [CrossRef]
- Chakrabarti, S.K. Handbook of Offshore Engineering; Elsevier Ltd.: Oxford, UK, 2005. [Google Scholar]
- Carr, A.J. RUAUMOKO–Inelastic Dynamic Analysis Program; Department of Civil Engineering, University of Canterbury: Christchurch, New Zealand, 2008. [Google Scholar]
- Li, Z.; Hatzigeorgiou, G.D. Seismic damage analysis of RC structures using fiber beam-column elements. Soil Dyn. Earthq. Eng. 2012, 32, 103–110. [Google Scholar] [CrossRef]
- CEN. EN 1998-1, Eurocode 8: Design of Structures for Earthquake Resistance, Part 1; E.C.f. Standardisation: Brussels, Belgium, 2004. [Google Scholar]
- Al-Bermani, F.G.A.; Li, B.; Zhu, K.; Kitipornchai, S. Cyclic and seismic response of flexibly jointed frames. Eng. Struct. 1994, 16, 249–255. [Google Scholar] [CrossRef]
- Remennikov, A.; Walpole, W.R. Analytical prediction of seismic behaviour for concentrically-braced steel systems. Earthq. Eng. Struct. Dyn. 1997, 26, 859–874. [Google Scholar] [CrossRef]
- Amadio, C.; Fragiacomo, M.; Rajgelj, S. The effects of repeated earthquake ground motions on the non-linear response of SDOF systems. Earthq. Eng. Struct. Dyn. 2003, 32, 291–308. [Google Scholar] [CrossRef]
- Konstandakopoulou, F.D.; Hatzigeorgiou, G.D. Water and wastewater steel tanks under multiple earthquakes. Soil Dyn. Earthq. Eng. 2017, 100, 445–453. [Google Scholar] [CrossRef]
- Loulelis, D.; Hatzigeorgiou, G.D.; Beskos, D.E. Moment resisting steel frames under repeated earthquakes. Earthq. Struct. 2012, 3, 231–248. [Google Scholar] [CrossRef]
- Liolios, A.; Liolios, A.; Hatzigeorgiou, G.D. A numerical approach for estimating the effects of multiple earthquakes to seismic response of structures strengthened by cable-elements. J. Theor. Appl. Mech. 2013, 43, 21–32. [Google Scholar] [CrossRef] [Green Version]


| Type of Member | Level | Cross Section [Mm] |
|---|---|---|
| Braces | 0 | 55.0 × 2.5 |
| 1 | 55.0 × 2.5 | |
| 2 | 60.0 × 2.2 | |
| 3 | 50.0 × 2.6 | |
| 4 | 50.0 × 2.2 | |
| Columns | 0 | 110.0 × 5.0 |
| 1 | 110.0 × 5.0 | |
| 2 | 100.0 × 4.5 | |
| 3 | 90.0 × 4.0 | |
| 4 | 90.0 × 4.0 | |
| Beams | 0 | 75.0 × 4.5 |
| 1 | 75.0 × 4.5 | |
| 2 | 80.0 × 4.2 | |
| 3 | 75.0 × 4.0 | |
| 4 | 50.0 × 2.5 |
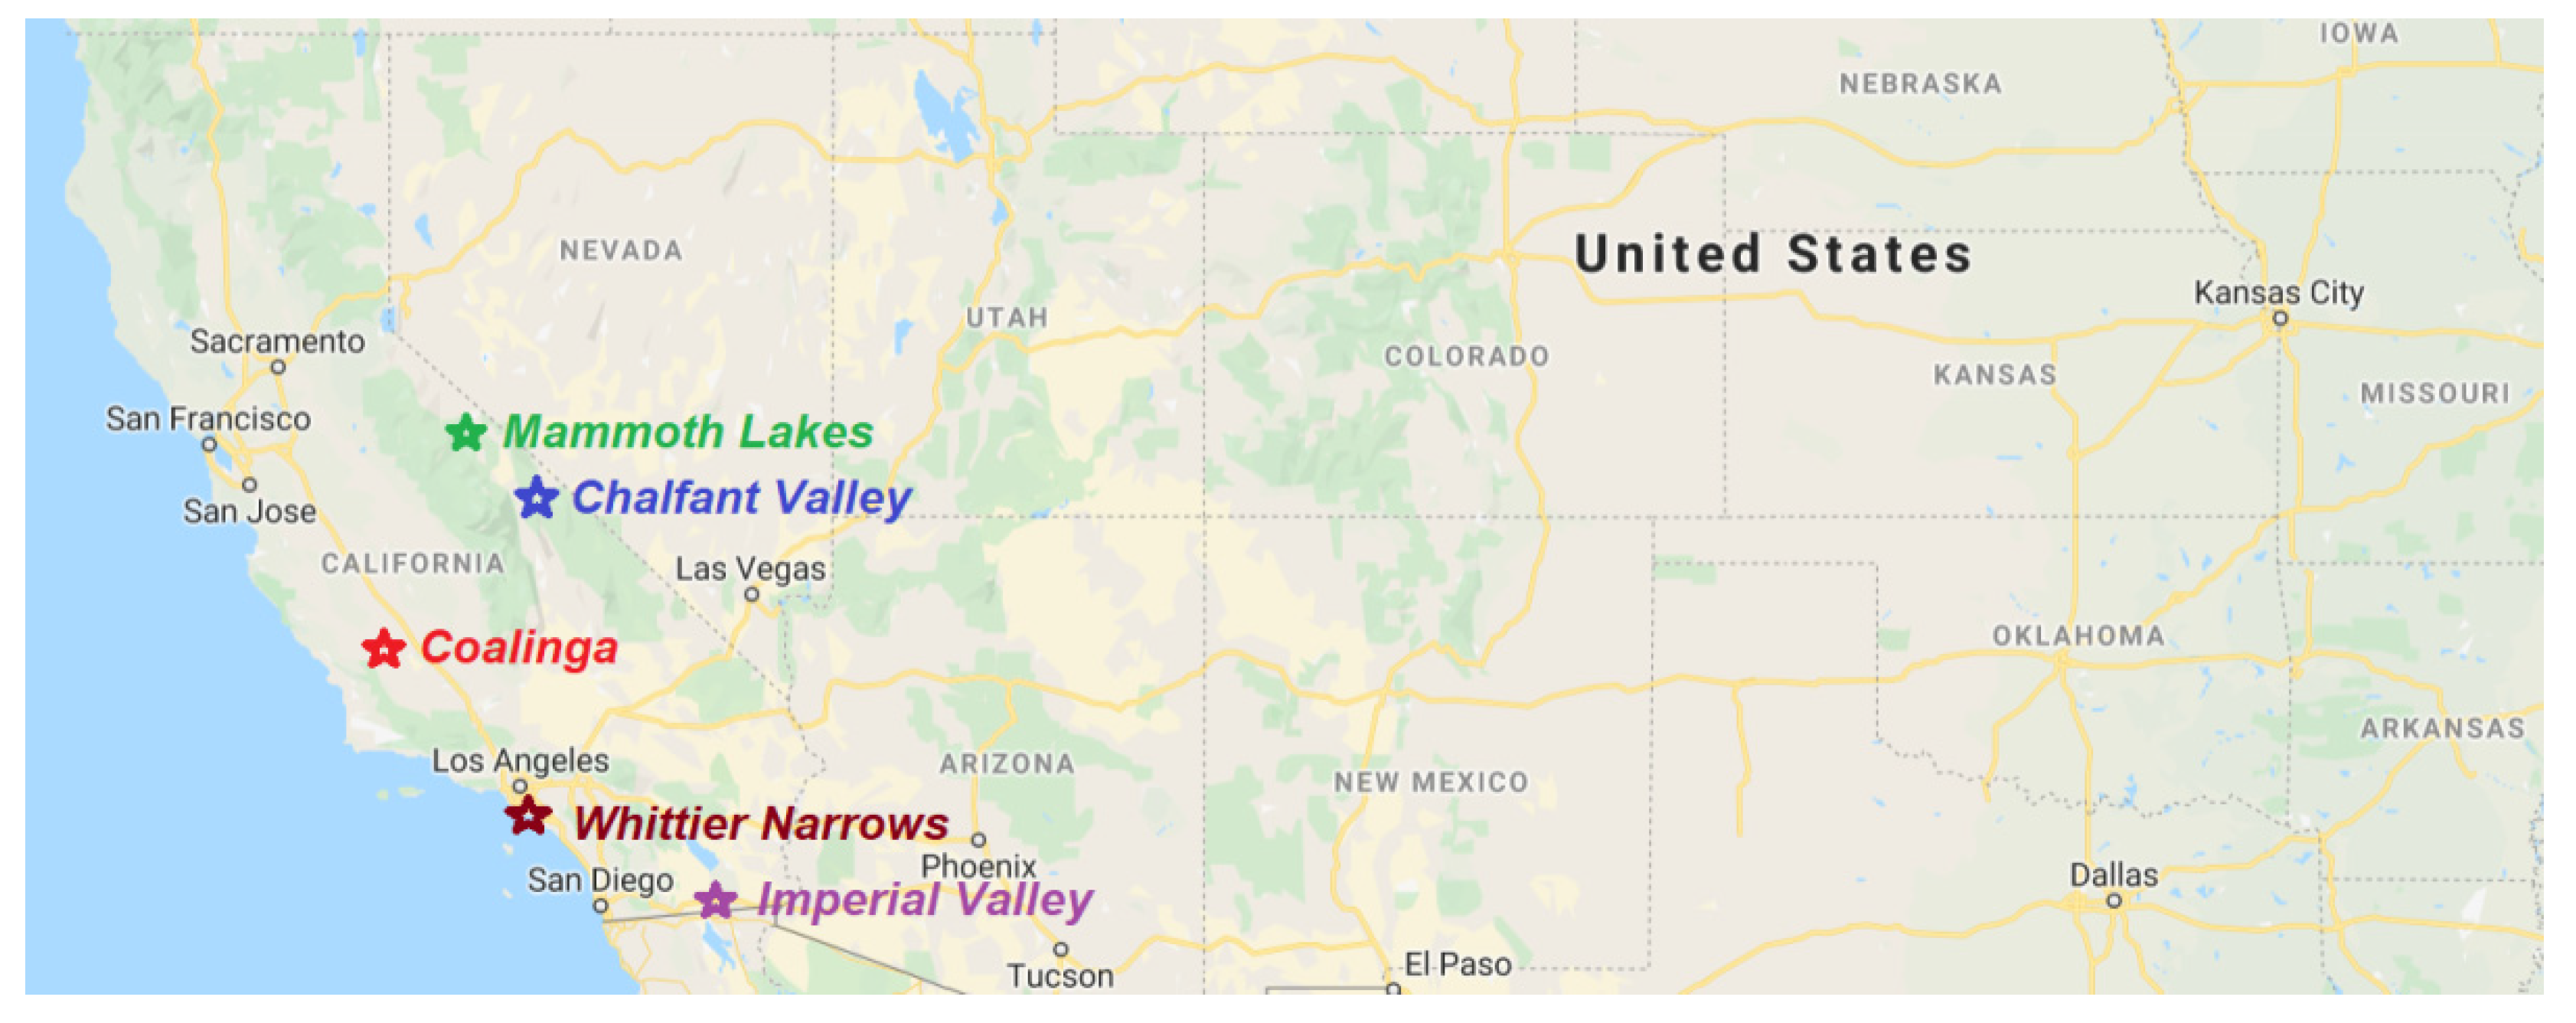
| No. | Seismic Sequence | Station | Date (Time) | Magnitude ML |
|---|---|---|---|---|
| 1 | Mammoth Lakes | Convict Creek | 1980/05/25 (16:34) | 6.1 |
| 1980/05/25 (16:49) | 6.0 | |||
| 1980/05/25 (19:44) | 6.1 | |||
| 1980/05/25 (20:35) | 5.7 | |||
| 1980/05/27 (14:51) | 6.2 | |||
| 2 | Chalfant Valley | Zack Brothers Ranch | 1986/07/20 (14:29) | 5.9 |
| 1986/07/21 (14:42) | 6.3 | |||
| 3 | Coalinga | 46T04 Station | 1983/07/22 (02:39) | 6.0 |
| 1983/07/25 (22:31) | 5.3 | |||
| 4 | Imperial Valley | Holtville Post Office | 1979/10/15 (23:16) | 6.6 |
| 1979/10/15 (23:19) | 5.2 | |||
| 5 | Whittier Narrows | San Marino | 1987/10/01 (14:42) | 5.9 |
| 1987/10/04 (10:59) | 5.3 |
© 2020 by the authors. Licensee MDPI, Basel, Switzerland. This article is an open access article distributed under the terms and conditions of the Creative Commons Attribution (CC BY) license (http://creativecommons.org/licenses/by/4.0/).
Share and Cite
Konstandakopoulou, F.; Konstantinidou, M.; Pnevmatikos, N.; Hatzigeorgiou, G.D. Safety and Performance of Offshore Platforms Subjected to Repeated Earthquakes. Infrastructures 2020, 5, 38. https://0-doi-org.brum.beds.ac.uk/10.3390/infrastructures5040038
Konstandakopoulou F, Konstantinidou M, Pnevmatikos N, Hatzigeorgiou GD. Safety and Performance of Offshore Platforms Subjected to Repeated Earthquakes. Infrastructures. 2020; 5(4):38. https://0-doi-org.brum.beds.ac.uk/10.3390/infrastructures5040038
Chicago/Turabian StyleKonstandakopoulou, Foteini, Maria Konstantinidou, Nikos Pnevmatikos, and George D. Hatzigeorgiou. 2020. "Safety and Performance of Offshore Platforms Subjected to Repeated Earthquakes" Infrastructures 5, no. 4: 38. https://0-doi-org.brum.beds.ac.uk/10.3390/infrastructures5040038