1. Introduction and Background
The sewer pipeline system is the basic underground infrastructure for public sanitation. In the U.S., there are 1,931,213 km (1.2 million miles) of water supply mains and nearly an equal number of sewer pipes—42 km (26 miles) of sewer pipes for every mile of interstate highway [
1,
2,
3]. Each of these conveyance systems is susceptible to structural failure, blockages, and overflows [
4]. The United States Environmental Protection Agency (USEPA) estimates that
$271 billion is needed for the renewal and replacement (R and R) of underground infrastructure over the next 25 years and is a major obstacle faced by municipalities [
4,
5,
6,
7].
In the United States and Canada, the pipelines are facing a crisis due to the rising population and lack of attention to its renewal and maintenance planning [
8]. Pipelines significantly impact the environment and carbon emissions due to several energy-related activities, which include pipe material manufacturing, transportation, construction equipment use during pipeline installation, and operation and maintenance (O&M) [
8,
9,
10,
11].
In the past, the open-cut (OC) pipeline method involving buried pipe excavation was the only solution for replacing and renewing pipes. This procedure requires the excavation to be performed very efficiently and accurately due to the existence of other utilities, including water pipes, cables, electrical power, gas pipes, and other obstacles adjacent to the wastewater pipe, which makes the work time-consuming and difficult [
7,
12]. This method, however, adversely adverse impacts on the day-to-day life and activities of people and businesses around the pipeline renewal project [
8,
13,
14]. These adverse impacts include the breaking of the road pavement, road closures, traffic delays, loss of access to businesses and homes, and unwanted noise and air pollution [
8,
14,
15,
16]. The resulting traffic delays can cause air pollution, and other environmental impacts involved in the OC procedure should be considered [
12,
17,
18].
Since the 1980s, various trenchless technology methods have been available that significantly reduce or eliminate the adverse problems. This involves the replacement or installation of a new pipe or the renewal of an existing failed pipe with minimal excavation and little or no surface and sub-surface disruption. Trenchless technology, such as cured-in-place pipe (CIPP), help minimize the social and environmental impacts, extend the service life of the pipe, decrease the O&M costs, increase the productivity and workers’ safety, and reduce the overall cost [
4,
12,
19,
20,
21].
The environmental impacts from the OC and CIPP methods have been evaluated and compared economically and logistically in past studies but have lacked environmental investigations [
8,
13,
14,
22,
23]. In fact, CIPP is more environmentally sustainable; however, this assertion is limited to certain environmental impacts, such as GHG emissions [
8,
24] and limited pipeline installation activities without a comprehensive environmental evaluation [
24,
25]. A review of the OC and CIPP methods, including previous models for the quantification of their environmental impacts, is presented in the following sections.
1.1. Open-Cut Pipeline Replacement
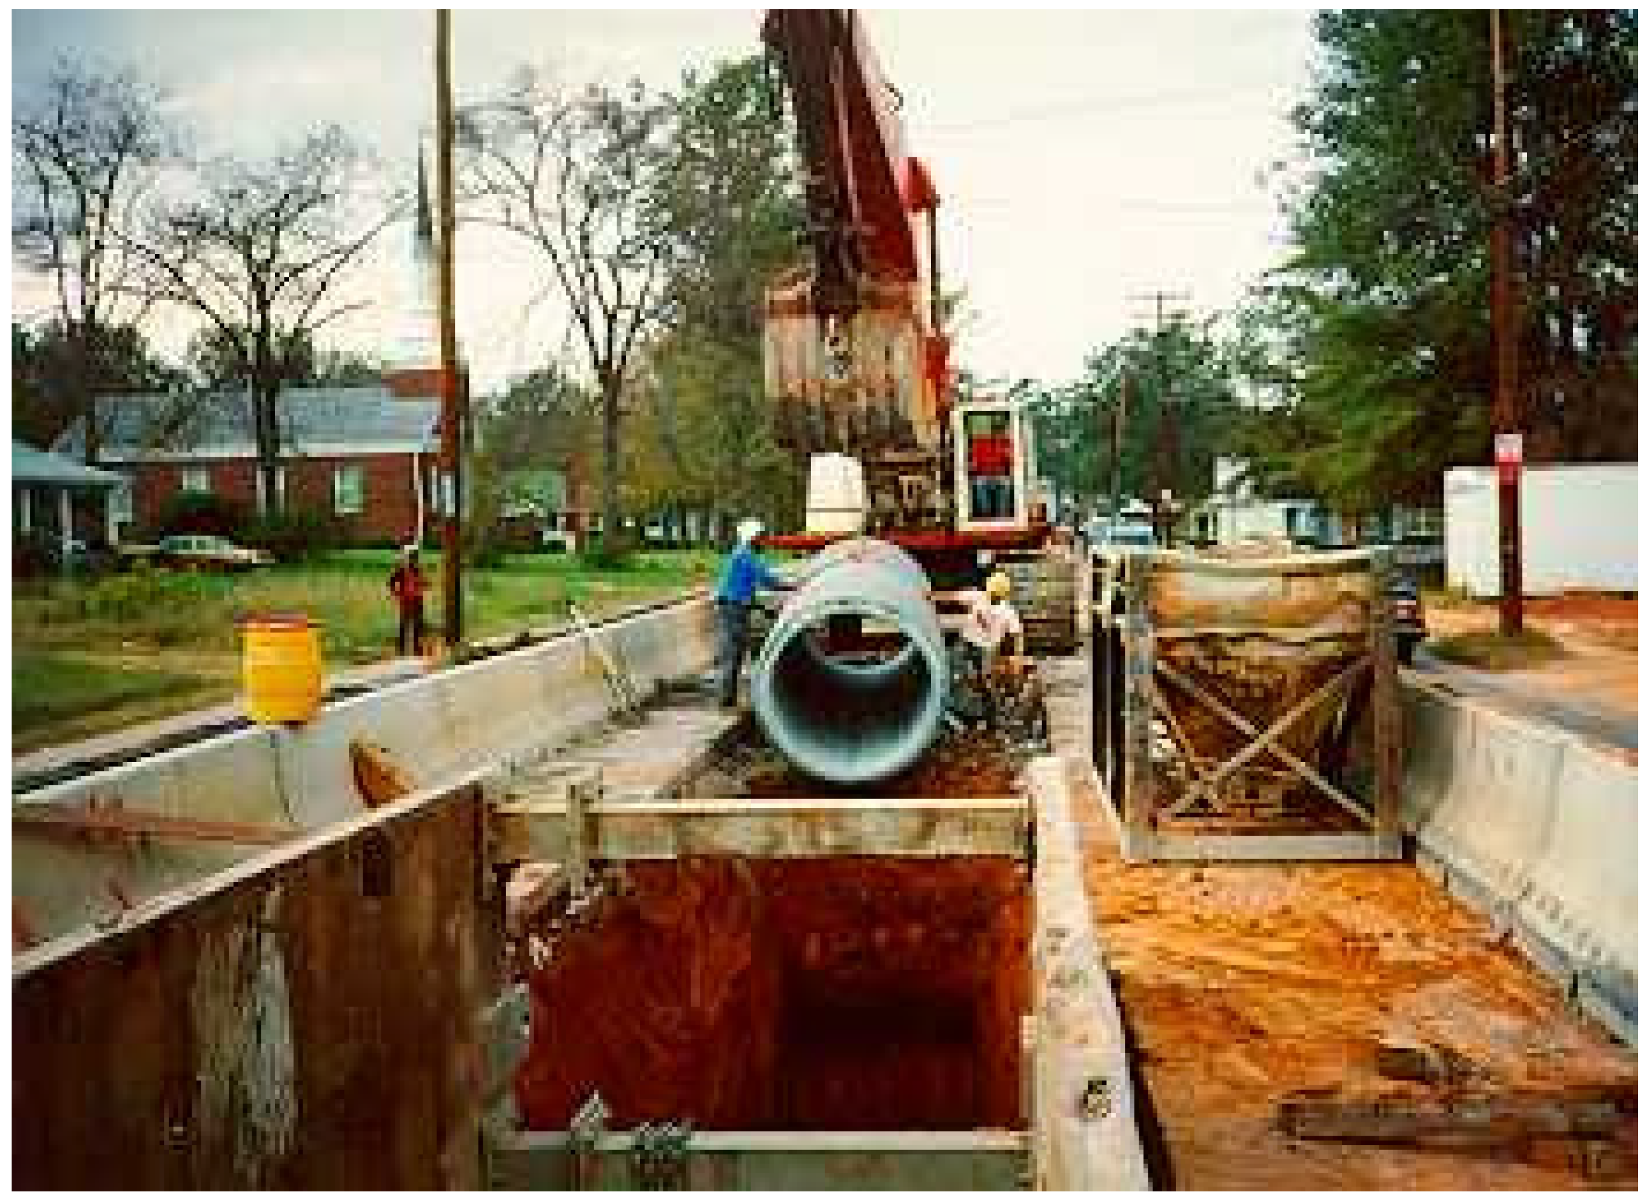
Open-cut (
Figure 1) is a traditional method for the replacement of pipelines. Based on the type of work, this method is also called dig-and-install, dig-and-repair, or dig-and-replace [
26,
27]. This method involves trenching the ground for either placing a new pipe or replacing an existing old pipe with a new pipe and then the reinstatement of the surface [
21]. This process includes the selection of a new route, a surface and sub-surface survey, engineering, planning and analysis, trench excavation, foundation and bedding, placing a new pipe, embedment and backfill with compaction with select soil, and the reinstatement of the ground surface [
4,
26,
28].
The OC method, however, adversely impacts the day-to-day life and activities of people and businesses around the pipeline renewal project [
8,
13,
14]. These adverse impacts include the breaking of the road pavement, road closures, traffic delays [
14,
15,
16] loss of access to businesses and homes, and unwanted noise and air pollution [
8,
14]. The resulting traffic delays can cause air pollution, and other EIs involved in the OC procedure should be considered [
12,
17,
18].
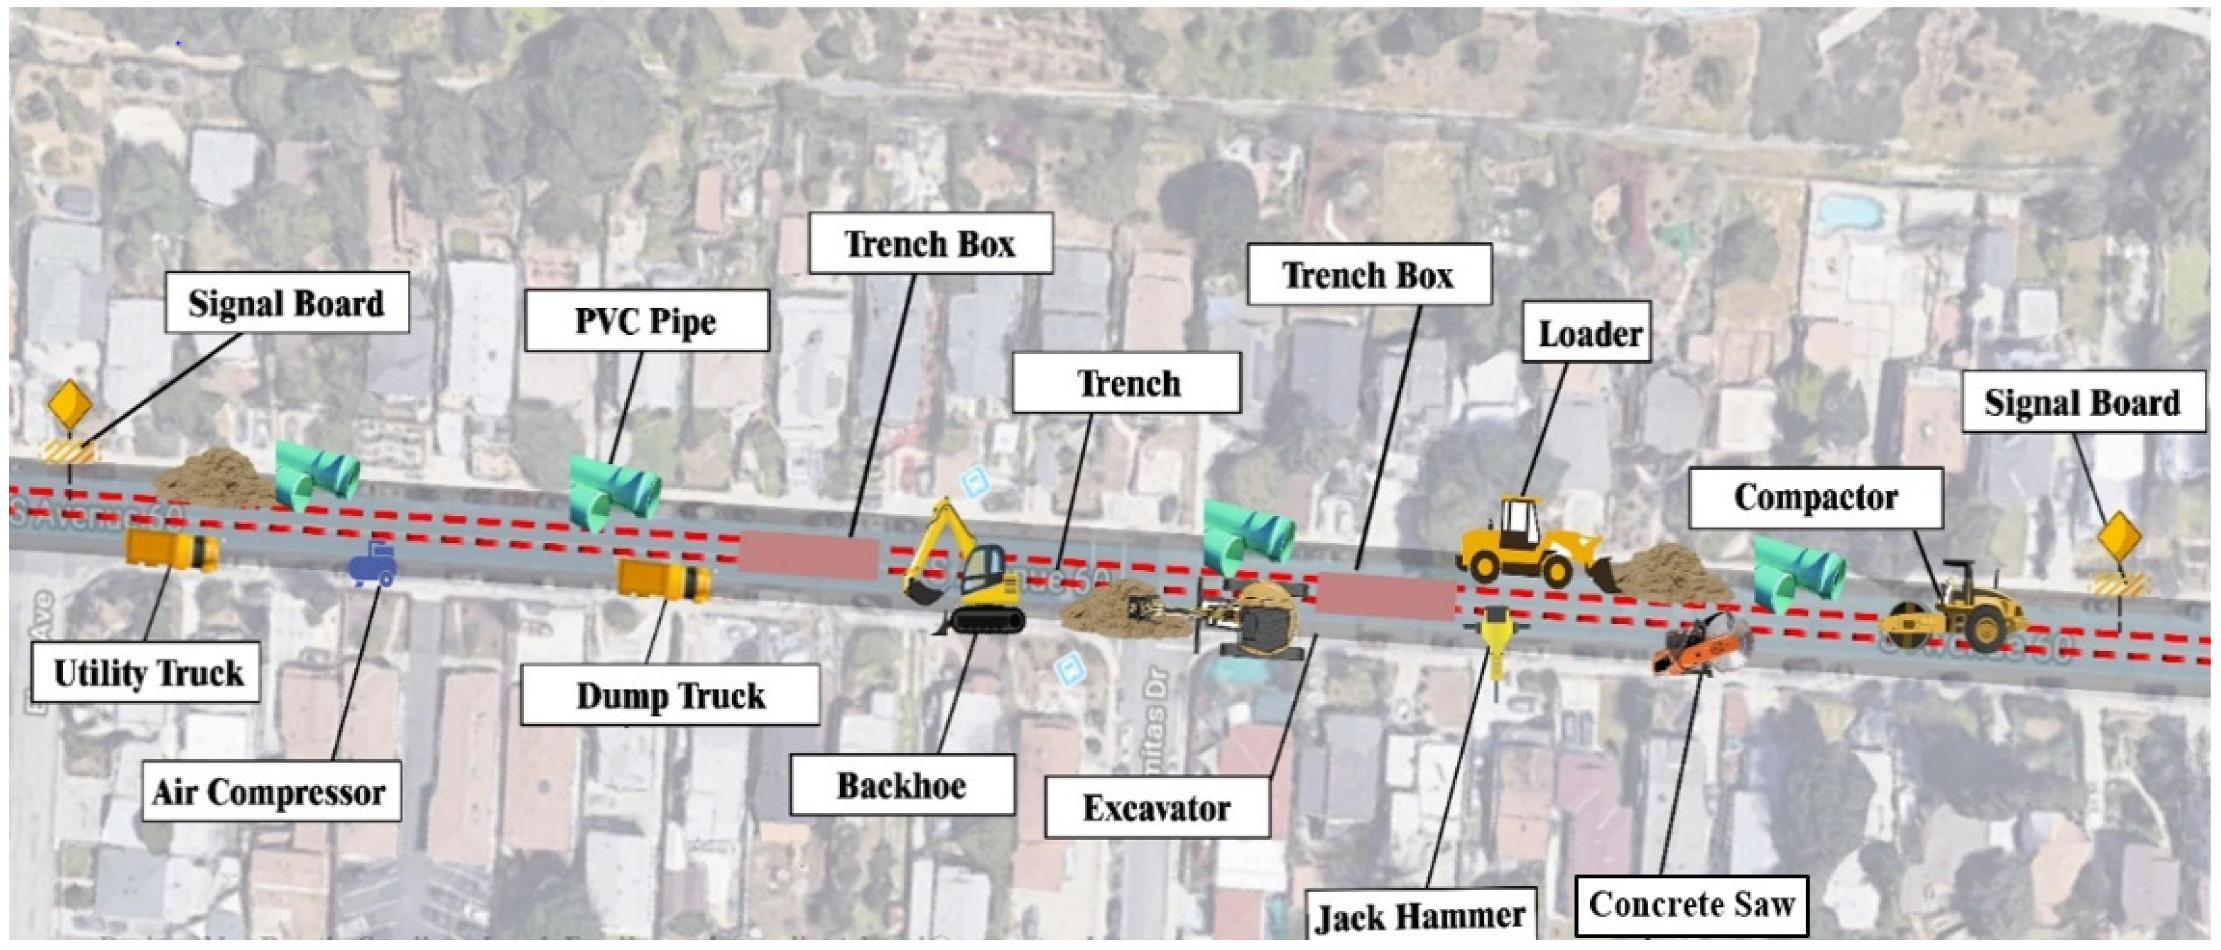
Figure 2 illustrates a typical layout of OC. It shows a section of pipe to be replaced by a new PVC pipe with the help of OC along with location of the equipment to be used, such as an air compressor, dump truck, utility truck, signal board, excavator, concrete saw, jack hammer, backhoe, and compactor.
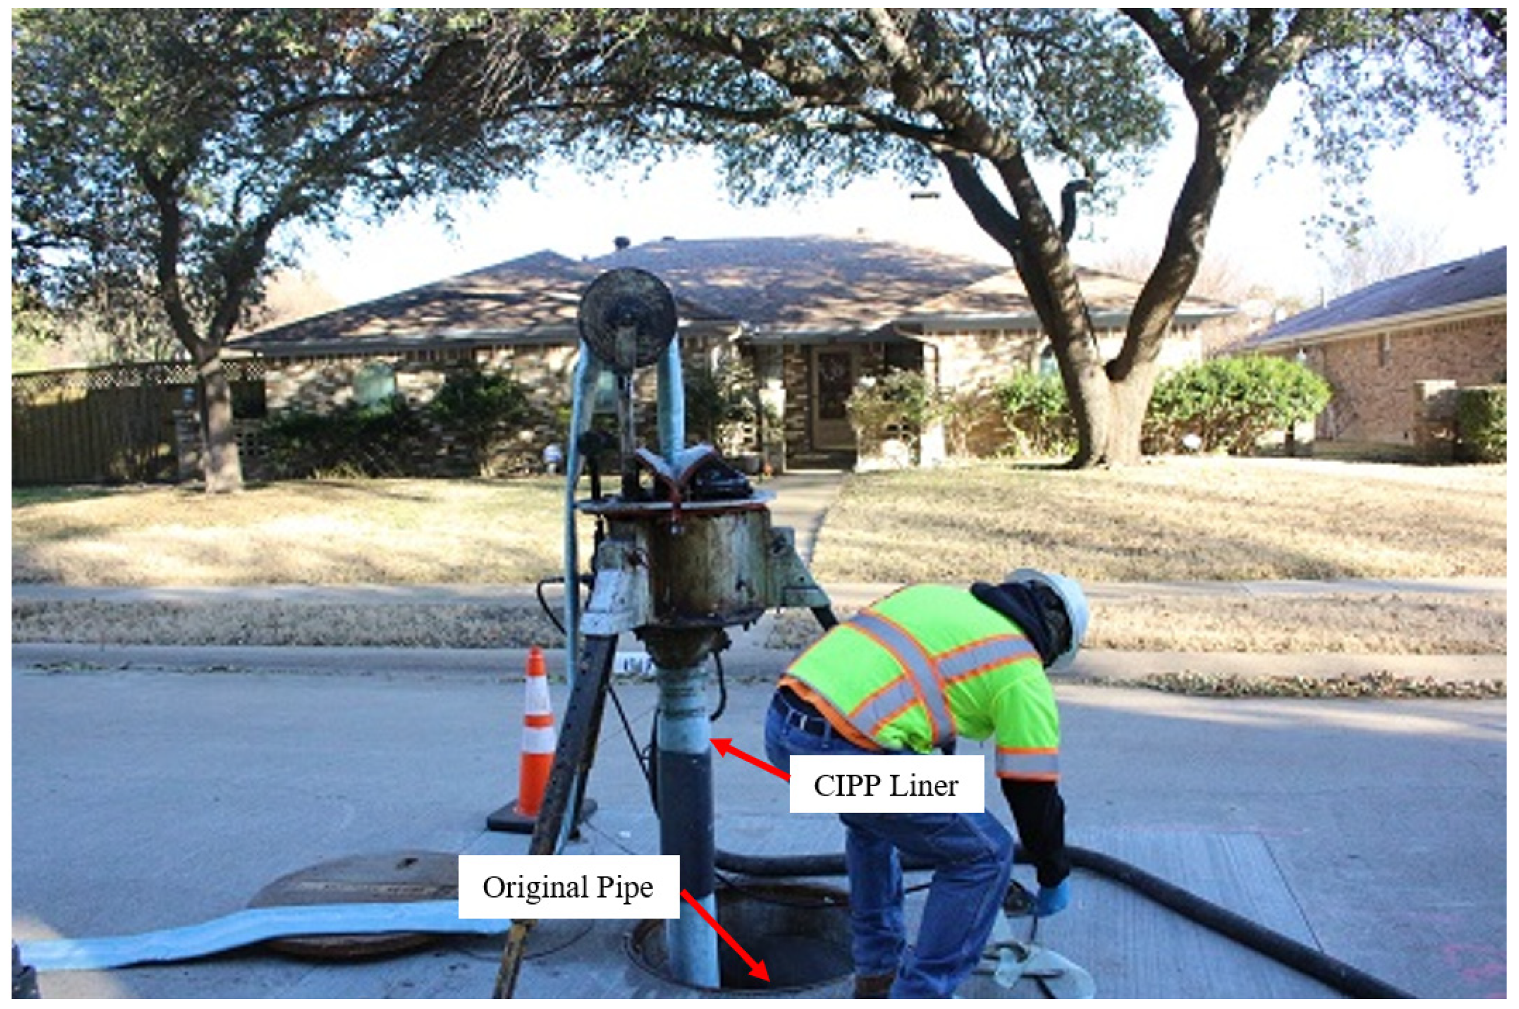
1.2. Cured-in-Place Pipe Renewal Method
CIPP is an alternate method to excavating and replacing sewers, and since the 1970s millions of feet of renewed pipelines have been installed around the world using this method [
25,
30,
31,
32]. At present, CIPP is among the most widely used trenchless pipeline renewal methods for both structural and nonstructural applications [
12,
25]. The CIPP process involves a liquid thermoset resin-saturated material that is inserted into the existing pipeline by hydrostatic or air inversion or by mechanically pulling-in and inflating by air or water [
33,
34]. The liner material is cured and placed using hot water, steam, or UV light, resulting in the CIPP product [
34,
35,
36] (
Figure 3).
Various factors are required to be assessed before selecting CIPP as pipeline renewal method. These factors include the availability of space, the chemical composition of the fluid carried by the pipeline, the number of service laterals and manholes, the installation distance, and the renewal objectives. In addition, the structural capabilities of vinyl ester and epoxy resin systems are typically used in industrial and pressure pipeline applications, where their tensile properties, special corrosion resistance, solvent resistance, and higher temperature performance are needed [
30,
31,
32,
33]. The use of these systems for sanitary sewers and house service laterals, however, will increase the costs [
3,
4,
12,
25,
37,
38].
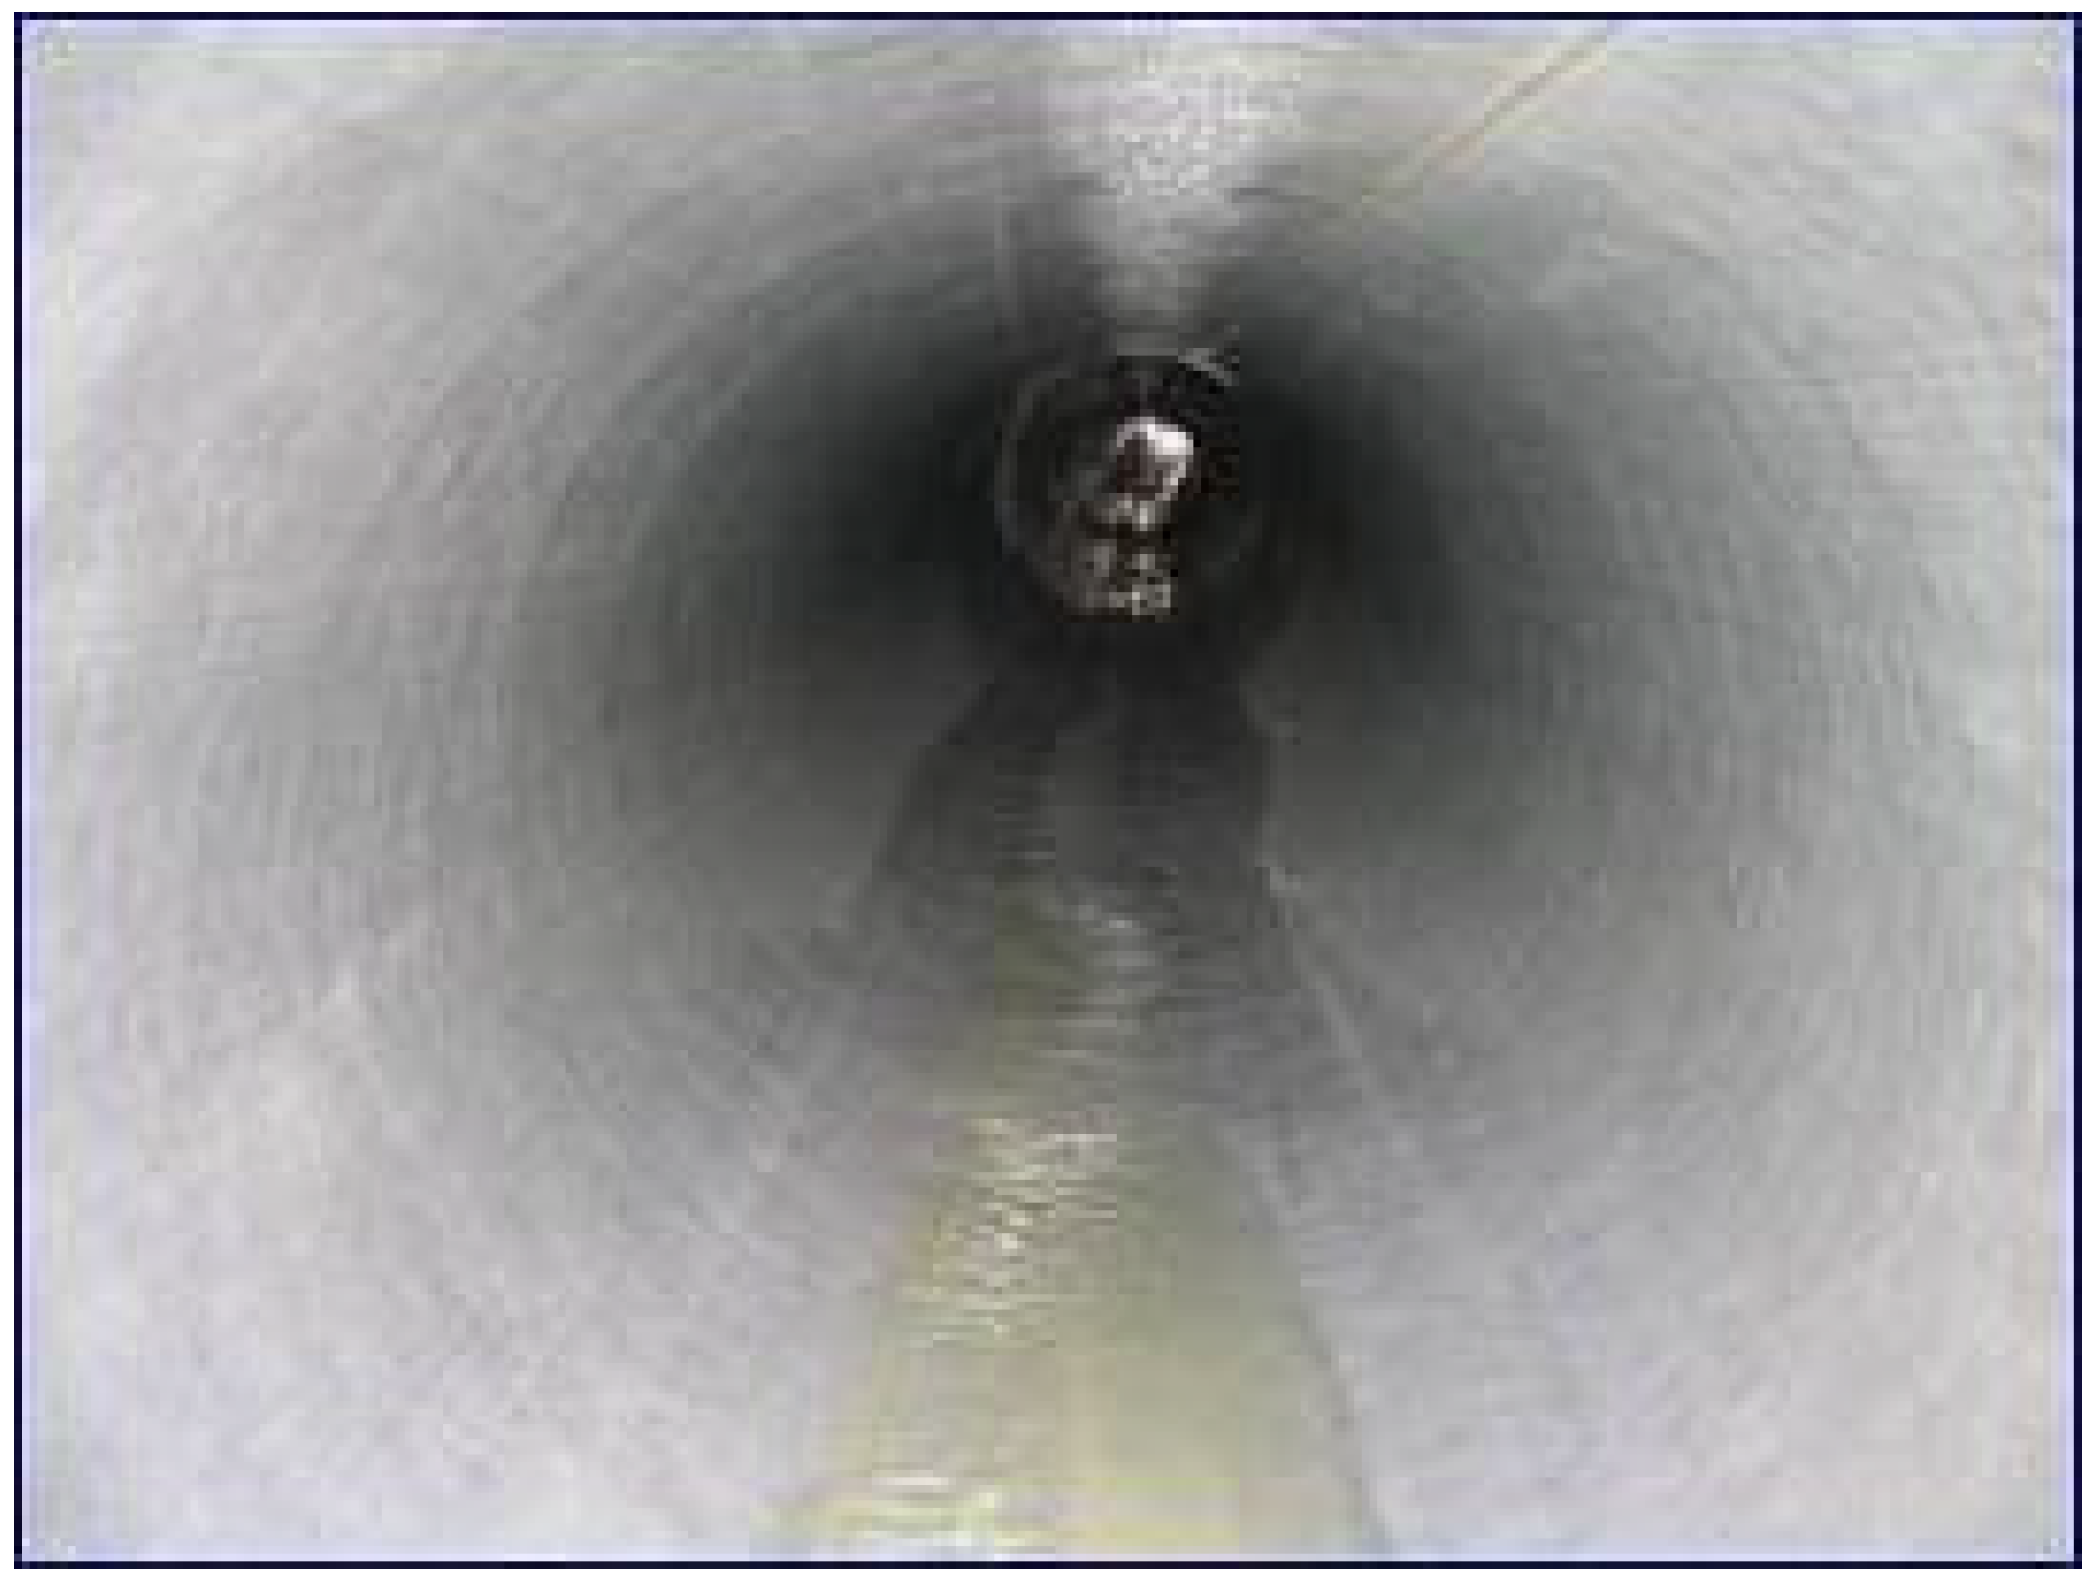
During this process, the main function of the fabric tube used in the CIPP is to carry and support the resins until it is installed and cured. This requires the fabric tube to withstand installation stresses with a controlled amount of stretch but enough flexibility to dimple at the side connections and expand to fit the existing pipeline irregularities (
Figure 4) [
7].
The fabric tube material can be woven or nonwoven, with the most common material being a nonwoven, needled felt. Polyethylene, polypropylene, and polyurethane coatings are commonly used on the exterior, interior, or both surfaces of the fabric tube to protect the resin during installation. The layers of the fabric tube can be seamless, as with some woven material, or longitudinally joined with stitching or heat bonding [
3,
4,
7,
12,
37].
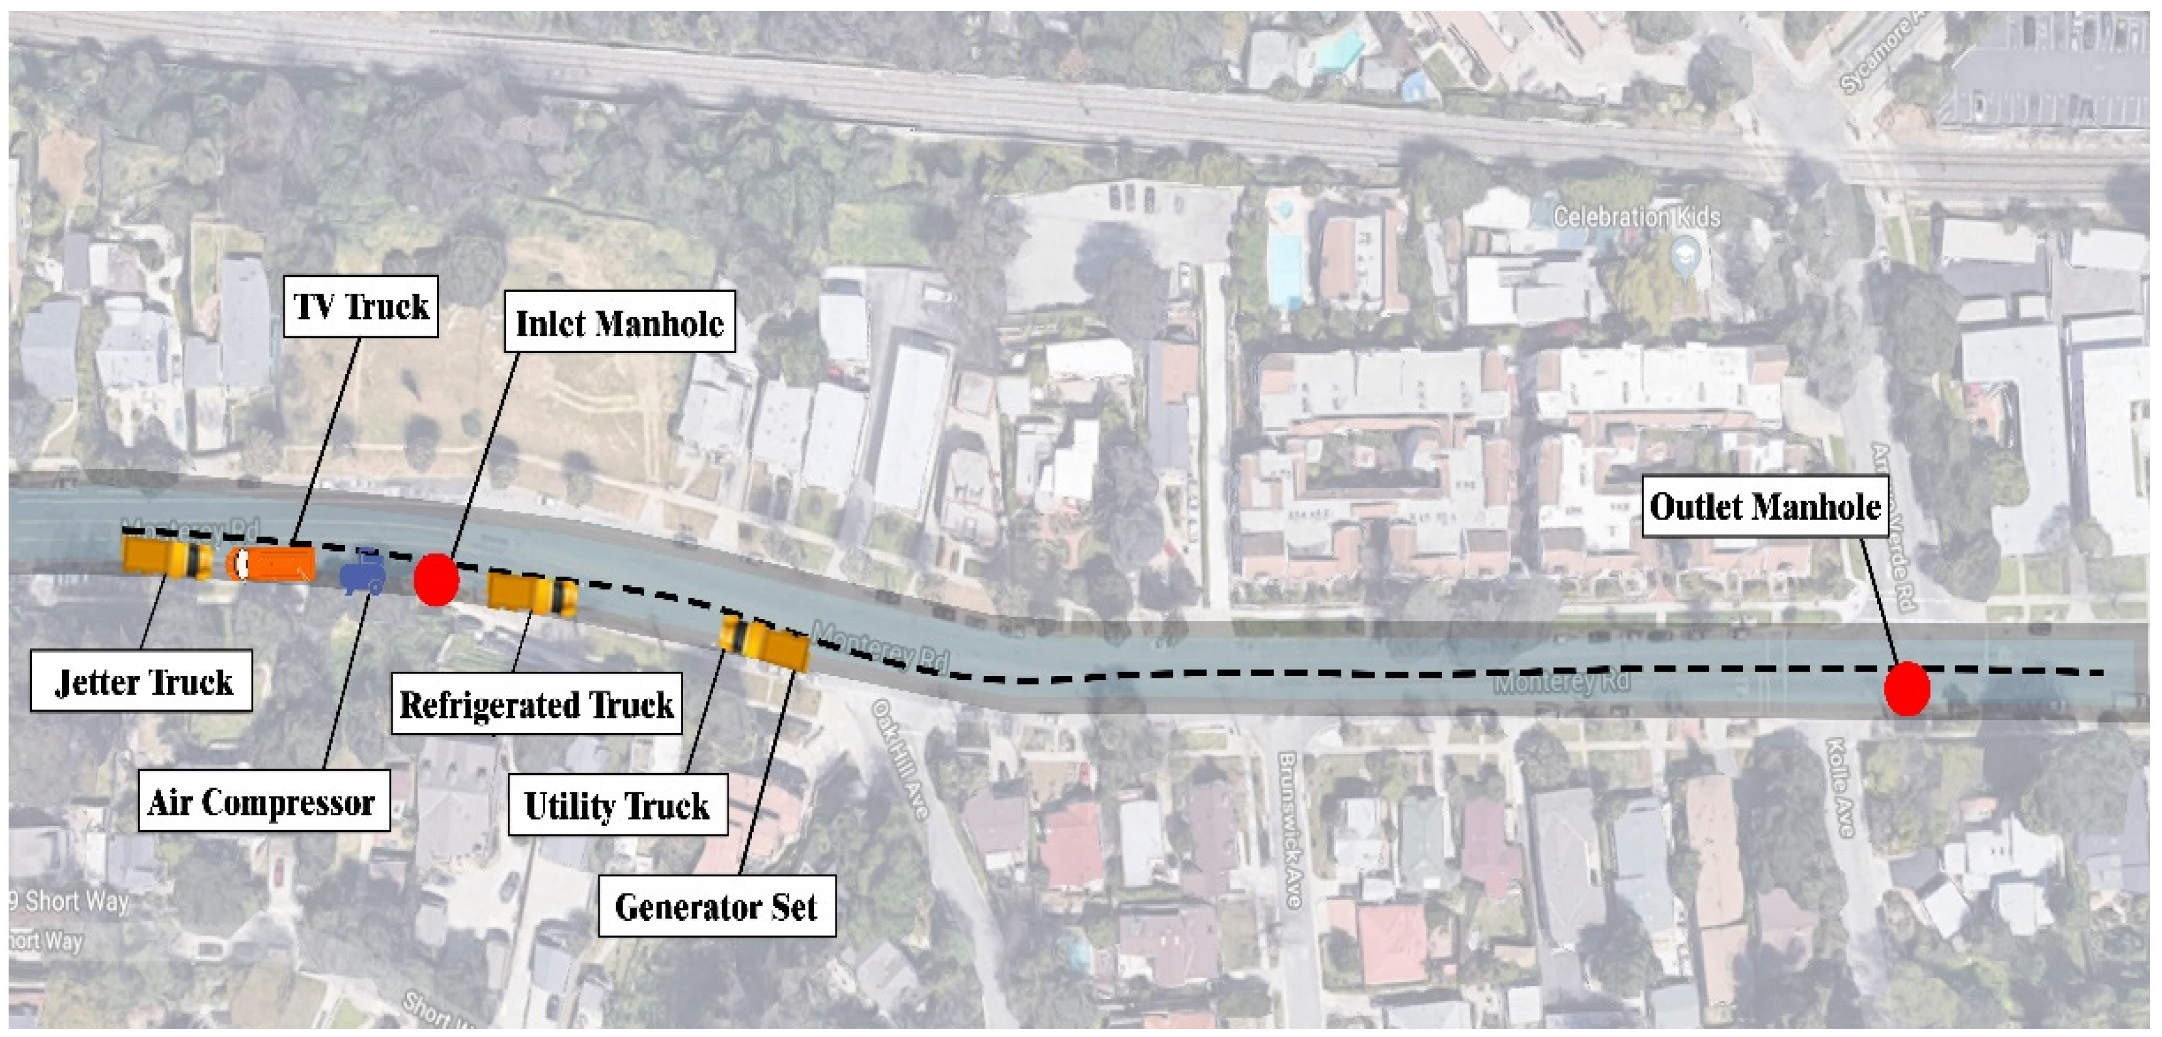
Figure 5 illustrates a typical layout of a CIPP. It shows a manhole to manhole section of the pipe to be renewed by CIPP along with the location of equipment to be used, such as a jetter truck, air compressor, refrigerated truck, utility truck, generator set, and TV truck.
1.3. Previous Models for Quantification of Environmental Emissions from Pipeline Renewal and Replacement
Emissions analyses from pipeline R and R are becoming popular, as it is critical to estimate the emissions for all pipeline projects. Quantifications of greenhouse gases (GHG) emissions have been conducted during previous studies [
8,
13,
14,
15,
22], and various efforts to estimate the emissions from pipeline construction operations can be found in the literature. Key models are the Environmental Protection Agency (EPA)’s Nonroad model [
39] and the California off-road model.
USEPA Nonroad model was applied in the previous studies to estimate the emissions generated by equipment and transportation in a trenchless utility installation project. The project emissions were calculated by an emissions calculator based on the USEPA model, and the site details and equipment usage hours that were collected onsite were used as inputs in the calculator to estimate the total number of emissions. The developed model could be used by policy makers to select the proper construction methods based on the estimated emissions [
24,
40].
The USEPA has developed an equation to calculate the amount of GHG emissions produced by construction equipment [
40], as shown in Equation (1).
where Emissions i is the emission amount generated by the equipment i (gallons), EFi is the emission factor for the impact i (g/hp-hr), i is the type of pollutant (COR
2R, SOR
2R, NOR
XR, CO, PM, HC), HRS is the hours of use, HP is the average rated horsepower of the equipment, and LF is the load factor (operating hp/maximum rated HP).
Table 1 shows the EF equations used for the construction equipment for HC, CO, NOR
XR, PM, COR
2R, and SOR
2R [
40].
The transportation footprint is calculated using Equation (2) [
24,
40]:
where EmissionsR
tiR is the transportation emission, EFi is the transportation EF from pollutant i (g/mi), n is the number of trips required to transport the materials and equipment, DR
OR is the one-way distance hauling to the site, and DR
RR is the return distance from the site.
The EF equations of transportation are presented in
Table 2 for different pollutants [
39].
2. Need Statement
Although there have been several preliminary studies regarding the comparison of the construction, social, and environmental impacts of OC pipeline and trenchless renewal methods [
6,
8,
11,
13,
14,
15,
19,
22,
28,
29,
37,
41,
42,
43,
44,
45,
46,
47], there is, however, no existing study which compares the environmental impacts from OC and CIPP and determines the factors that influence the environment.
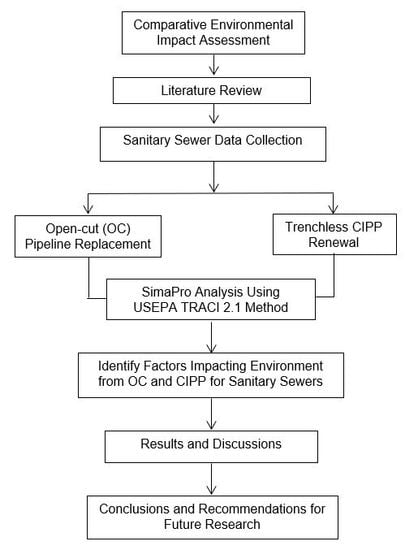
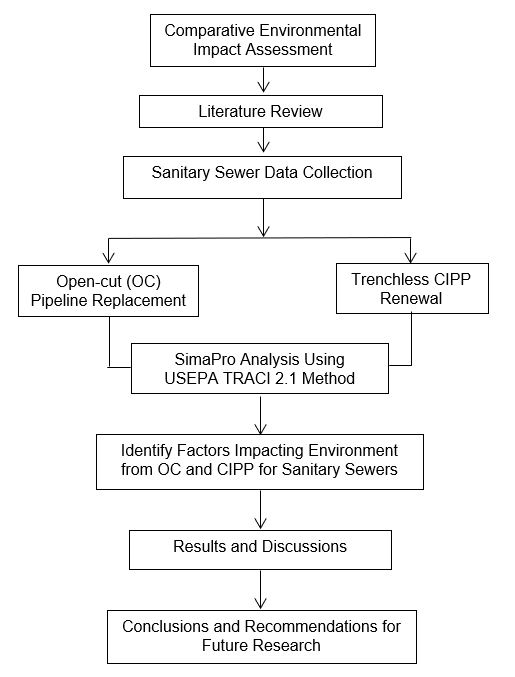
The objectives of this paper are: (1) to present a literature review on the progress acquired over the years in understanding the environmental impacts from the OC and CIPP methods, (2) to analyze and compare the environmental impacts for small diameter sanitary sewers (SDSS) using USEPA’s tool for the reduction and assessment of chemical and other environmental impacts (TRACI) methodology of the SimaPro software, and (3) to identify the factors that influence the environment for the CIPP and OC methods.
The published papers were identified from databases such as ProQuest, Engineering Village, ASCE, and Google Scholar that reported the environmental impacts from the OC pipeline and CIPP methods over a period from 1989 through to 2020. The following section explains the assessment method used for comparing the environmental impacts from the OC and CIPP methods.
3. Assessment Method Used
3.1. Environmental Impact Assessment
Environmental impact assessment (EIA) is a systematic tool used to identify and evaluate the environmental impacts associated with the energy and resources to create materials or services throughout the product’s entire lifespan [
48,
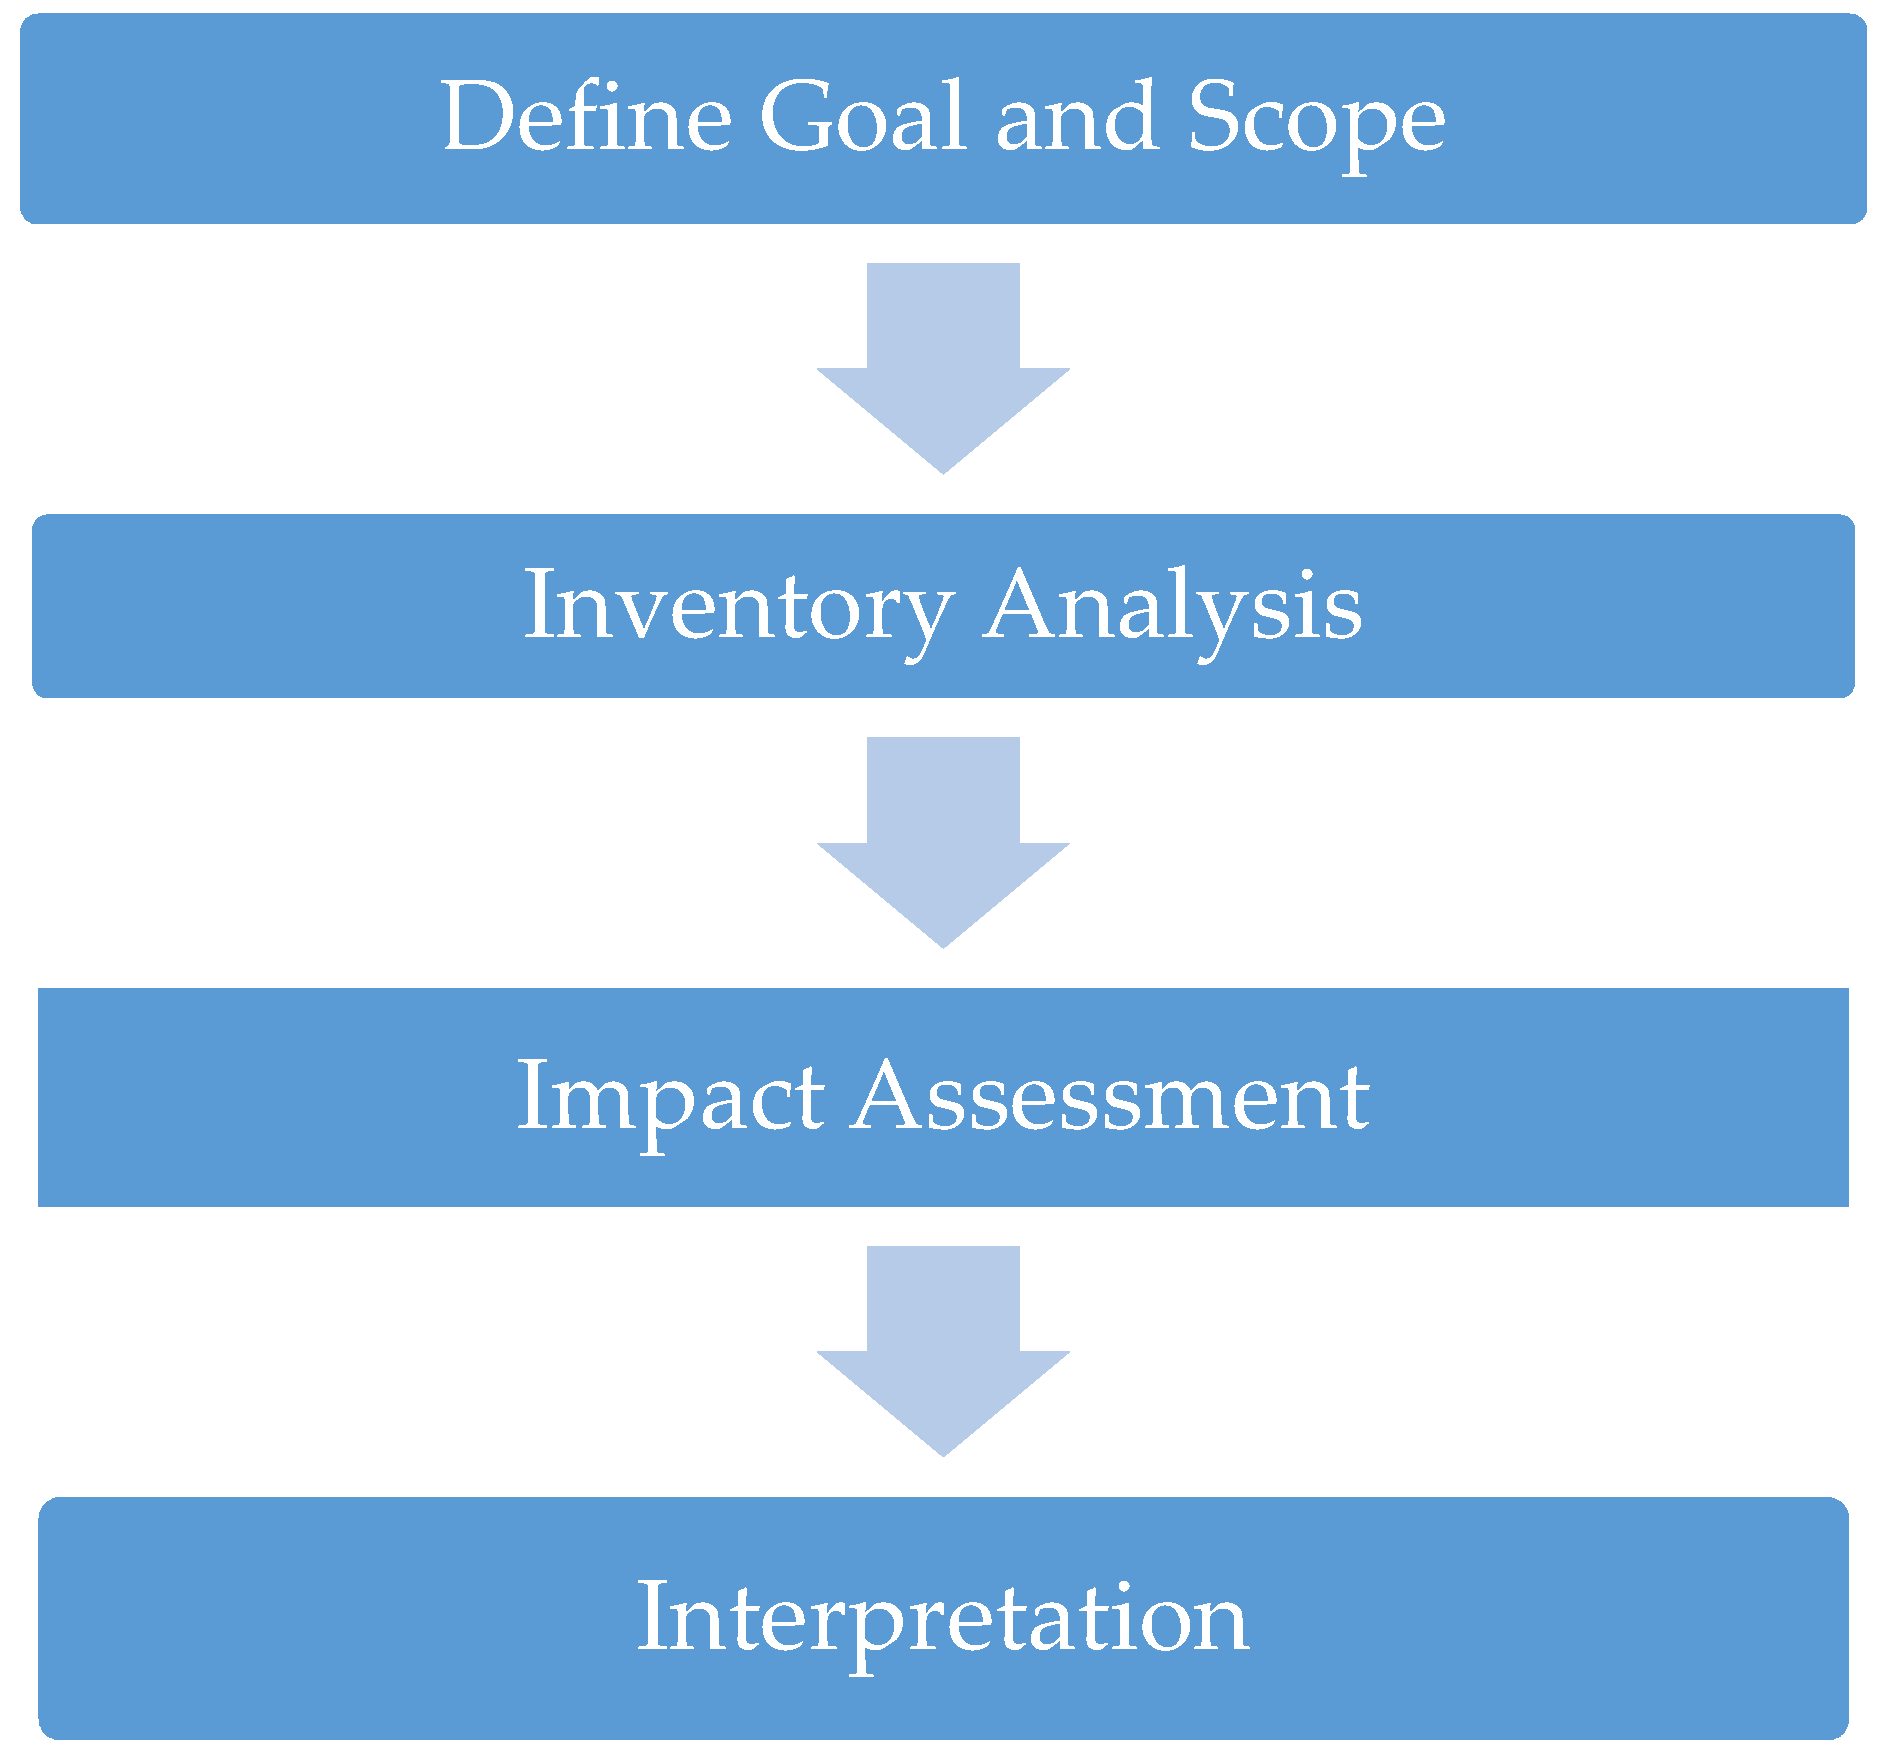
49]. An EIA was carried out according to the ISO 14040 and 14044 standards in four stages [
48]: (1) goal and scope definition; (2) inventory analysis: tabulating all the inputs and outputs of the system; (3) impact assessment: evaluating the potential environmental, health, and resource consumption impacts associated with the inputs and outputs; (4) interpretation: determining the significance of the potential impacts (
Figure 6).
3.2. SimaPro
SimaPro is a software containing inventory databases and impact assessment methodologies to perform LCA studies [
50,
51]. These installed databases contain the energy and material requirements and waste emissions for over 10,000 industrial and commercial processes [
50]. SimaPro models the end-of-life phase through waste scenarios and waste treatment processes. Waste treatments document the emissions and impacts that arise from the landfilling, burning, recycling, or composting of waste [
50]. The waste scenarios in SimaPro are based on material flow and do not observe the product characteristics [
50].
SimaPro uses previously defined boundaries and pulls inventory data from its database to perform the impact assessment. An indicator substance is used in each impact category, and all the emissions across the material and fuel inputs and waste are converted to equivalents of these indicator substances [
50]. For example, to measure the impacts of global warming, emissions from all the steps or system processes are converted to equivalent masses of CO
2 and totaled. This conversion and summation is performed for all the categories to allow a meaningful comparison between the products or processes [
50].
The outputs provided by SimaPro can then be displayed in an easy-to-read bar chart. For each impact category, the scenario with the largest impact will be scaled to 100 and the remaining processes will have their impact scaled off of the 100. For example, comparing two generic waste treatments 1 and 2 for impacts on global warming: if treatment 1 has 50 kg of CO
2 equivalent emissions and treatment 2 has 25 kg of CO
2 equivalents, treatment 1 will be represented by a bar with height 100 and treatment 2 with a bar height of 50. This is done for each impact category and all impact categories are shown on the same graph [
7].
3.3. Tool for Reduction and Assessment of Chemicals and Other Environmental Impacts
The Tool for Reduction and Assessment of Chemicals and Other Environmental Impacts (TRACI 2.1) is an EIA tool created by the US Environmental Protection Agency (EPA) [
50,
52]. TRACI calculates impact assessments based on ten impact categories: (1) ozone depletion (measured in kg CFC-11 (Freon-11) equivalents), (2) global warming (measured in kg CO
2 equivalents), (3) smog (measured in kg O
3 equivalents), (4) acidification (measured in kg SO
2 equivalents), (5) eutrophication (measured in kg N equivalents), (6) carcinogenics (measured in comparative toxic units (CTU) for morbidity (h)), (7) non-carcinogenics (measured in CTUh), (8) respiratory effects (measured in kg particulate matter (PM) 2.5 equivalents), (9) ecotoxicity (measured in CTU for aquatic ecotoxicity (CTUe)), and (10) fossil fuel depletion (measured in MJ) [
7].
TRACI has factors for normalization to allow for comparison between impact categories. The normalization divides the calculated outputs for the individual impact categories by the averaged impact values of a US or Canadian citizen for each impact category for a year [
50]. This division will mean that the relative bar height is scaled off to show how much more or less impact the scenario produces compared to the average citizen. A higher bar would mean more detrimental impacts than an average citizen, while lower bars mean relatively less detrimental impacts. This allows for a qualitative comparison between impact categories. All the environmental impacts listed in the impact category and their descriptions are provided in the following sections.
3.3.1. Ozone Depletion
Ozone depletion is a major environmental concern due to pipeline installation activities [
52]. “Ozone within the stratosphere provides protection from radiation, which can lead to increased frequency of skin cancers and cataracts in the human populations.” Substances which have been reported and linked to decreasing the stratospheric ozone level are chlorofluorocarbons (CFCs), which are used as refrigerants; foam blowing agents; solvents; and halons, which are used as a fire extinguishing agents [
52].
There is a global consensus on the use of ozone depletion potentials (ODPs), a metric proposed by the World Meteorological Organization (WMO) [
52,
53], for calculating the relative importance of substances expected to contribute significantly to the breakdown of the ozone layer. The USEPA maintains websites listing various options for ODPs [
52]. These options are consistent with the US and WMO documents used internationally [
52]. Within TRACI 2.1, the most recent sources of ODPs were used for each substance [
54].
3.3.2. Global Warming
“Global warming is an average increase in the temperature of the atmosphere near the Earth’s surface and in the troposphere, which can contribute to changes in global climate patterns. Global warming can occur from a variety of causes, both natural and human-induced. In common usage, global warming often refers to the warming that can occur because of increased environmental emissions of greenhouse gases from pipeline installation activities [
52,
53,
54].” TRACI 2.1 utilizes global warming potentials (GWPs) for the calculation of the potency of greenhouse gases relative to CO
2. Consistent with the guidance of the United Nations Framework Convention on Climate Change (UNFCCC), the USEPA uses GWPs with 100-year time horizons. TRACI 2.1 expands the list of substances found within the original version of TRACI and utilizes a hierarchy of data sources consistent with international acceptance [
52,
53,
54].
3.3.3. Smog
Smog is a combination of smoke and fog due to pipeline installation activities [
52]. “Ground-level ozone is created by various chemical reactions, which occur between nitrogen oxides (NOx) and volatile organic compounds (VOCs) in sunlight. Human health effects can result in a variety of respiratory issues including increasing symptoms of bronchitis, asthma, and emphysema. Permanent lung damage may result from prolonged exposure to ozone. Ecological impacts include damage to various ecosystems and crop damage. The primary sources of ozone precursors are motor vehicles, electric power utilities and industrial facilities [
52,
54].”
3.3.4. Acidification
Acidification is the increase in the concentration of hydrogen ions (H+) within a local environment due to pipeline installation activities. This can be the result of the addition of acids (e.g., nitric acid and sulfuric acid) into the environment, the addition of other substances (e.g., ammonia) which increase the acidity of the environment due to various chemical reactions and/or biological activity, or by natural circumstances such as the change in soil concentrations because of the growth of local plant species [
54].
“Acidifying substances are often air emissions, which may travel for hundreds of miles prior to wet deposition as acid rain, fog, or snow or dry deposition as dust or smoke particulate matter on the soil or water. Sulfur dioxide and nitrogen oxides from fossil fuel combustion have been the largest contributors to acid rain [
54].”
“Substances, which cause acidification, can cause damage to building materials, paints, and other human-built structures, lakes, streams, rivers, and various plants and animals. The sensitivity of various environments can depend on a number of factors including the local buffering capacity, the local plant and animal species, and the existing acidity within the environment [
52,
54].”
3.3.5. Eutrophication
Eutrophication is the “enrichment of an aquatic ecosystem with nutrients (nitrates, phosphates) that accelerate biological productivity (growth of algae and weeds) and an undesirable accumulation of algal biomass [
52].” Although nitrogen and phosphorus play an important role in the fertilization of agricultural lands and other vegetation, excessive releases of either of these substances may provide undesired effects on the waterways in which they travel and their ultimate destination.
While phosphorus usually has a more negative impact on freshwater lakes and streams, nitrogen is often more detrimental to coastal environments [
54]. “Some of the major substances which have a role in this impact category are difficult to characterize including emissions from wastewater treatment plants, decaying plant life pulp and paper mills, food processing plants, and fertilizers used in agricultural, commercial, and individual household locations. For example, the majority of fertilizer (when utilized correctly) provides the benefits for which it was purchased [
55].”
However, depending on the slope of the fields, the precipitation, and the volatilization of the fertilizer, some of this product may go beyond the originally intended boundaries and cause unintended consequences downstream. It is these unintended consequences that are considered to be the emission in this case; whereas, the portion of the application that achieved its goal of fertilizing fields was considered to be a useful product [
54].
“The original methodology utilized in TRACI allowed site-specific characterization, which is not supported, in the current version. Additional substances, which have the potential to cause eutrophication, have been added to TRACI 2.1 [
54].”
3.3.6. Carcinogenics and Non-Carcinogenics (Human Toxicity)
“During the development of the original TRACI, human health was represented by three impact categories based on the current structure of the USEPA regulations and the chemical and physical behaviors of the pollutants of concern. CalTOX was determined to be the best model for human health cancer and noncancer, and the input parameters were selected to be consistent with the EPA Risk Assessment Guidelines and the Exposure Factors Handbook. Research was conducted to determine the source of the major uncertainties and influence of site-specific parameters on the human toxicity potentials [
51,
52,
53,
54].”
“The probabilistic research showed that for the majority of the TRI substances, chemical data (e.g., toxicity and half-life) had the most significant impact on data variability/uncertainty and that site-specific parameters had little effect on the relative human toxicity potentials [
51,
52,
53,
54].”
3.3.7. Respiratory Effects
“This impact category as respiratory effects are caused by inorganic substances [
51,
52,
53,
54].” Although this category may be called the human health criteria pollutants category, it deals with a subset of the criteria pollutants, i.e., particulate matter and precursors to particulates. Particulate matter is a collection of small particles in ambient air which could cause negative human health effects including respiratory illness and death [
51,
52,
53,
54].
Numerous epidemiology studies show an increased mortality rate with elevated levels of ambient particulate matter. Particulate matter may be emitted as particulates or may be the product of chemical reactions in the air (secondary particulates). The most common precursors to secondary particulates are sulfur dioxide (SO
2) and nitrogen oxides (NOx). Common sources of primary and secondary particulates are fossil fuel combustion, wood combustion, and dust particles from roads and fields [
52,
54].
3.3.8. Ecotoxicity
“Over the course of a series of workshops and numerous communications, model results from the original models were compared to determine the most influential parameters and largest sources of differences between the models using 45 organic substances, which were selected for their diversity in environmental partitioning, exposure pathway, persistence, and air transport. The USEtox model adopted many of the best features of the above-named models and was used to develop human health cancer and noncancer toxicity potentials and freshwater ecotoxicity potentials for over 3000 substances including organic and inorganic substances [
54].” The USEtox model has been selected to replace the CalTOX model as the basis for the TRACI impact categories of human health cancer, noncancer, and ecotoxicity. It should be noted that some of the characterization factors included within the USEtox model are recommended while others are simply interim and should be used with caution [
54,
55,
56].
3.3.9. Fossil Fuel Depletion
“This impact category indicator is related to the use of fossil fuels. Fossil fuels provide a valuable source of energy and feedstock for materials such as plastics. Although there are alternatives, these are only able to replace a small proportion of the current usage. Fossil fuels are a finite resource and their continued consumption will make them unavailable for use by future generations [
51,
54].”
4. Case Study for Environmental Impact Assessment
An actual case study based on the City of Pasadena, California, river basin was used for this study for an EIA of CIPP with OC for SDSS.
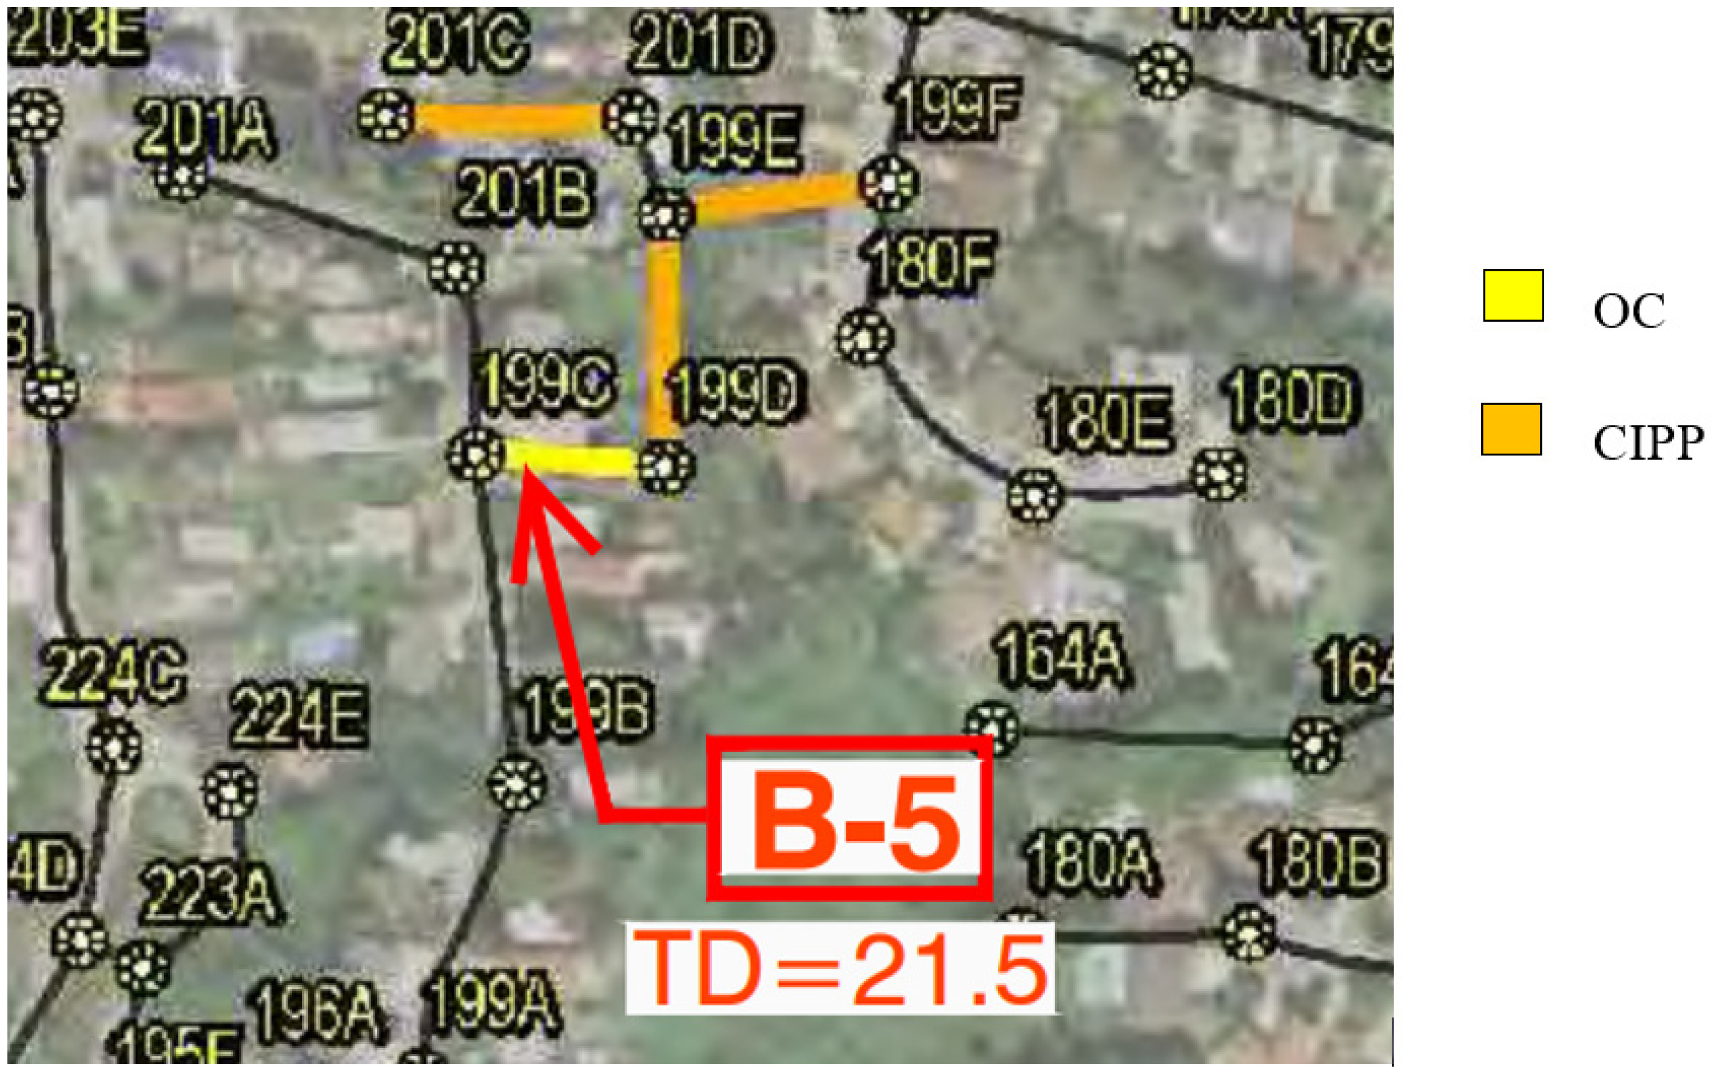
Figure 7 shows a manhole to manhole view of the river basin in the city of South Pasadena. A total of 390 sewer mains of 203–305 mm (8–12 in) diameters and 35,357 m (116,000 ft) in length were renewed by the CIPP method, whereas 1220 m (4000 ft) was replaced by the open-cut method. While the majority of the sewer lines were renewed with the CIPP lining, when the lines were in poor condition OC was used.
Information about 58 sanitary sewer pipes from this project was available from [
12]. Out of these 58 sanitary sewer pipes in the project, 22 were targeted for CIPP lining, 36 were targeted for OC, and 7 were to undergo both spot repair and CIPP lining. In total, the 58 pipes were 4120 m (13,516 ft) in length; 2000 m (6561 ft) of the pipes were targeted for CIPP renewal, and 2120 m (6955 ft) were targeted for OC.
The pipes were 203 mm (8 in.), 254 mm (10 in.), and 305 mm (12 in.) in diameter. The oldest and newest pipes were installed in 1908 and 1957, respectively. The sanitary sewer pipes were buried 2.1 m (7 ft) to 4.9 m (16 ft) below the ground surface. For carrying out the EIA, these sewer pipes were divided into CIPP and OC projects.
Assumptions
For CIPP, it was assumed that the steam-curing CIPP method was used and that it was completely cured. The findings presented in this paper are very specific to sewer lines and should therefore not be extrapolated to CIPP installations on pipes that convey surface water. Pickup trucks are needed; however, they were not considered because they will be same for both of the methods. For OC, the new pipe to be installed is assumed to be PVC because it is the most commonly used pipe in sanitary sewers. A doctoral study [
12] was used as a source for information about OC, equipment, operation hours, etc. The OC did not include soil transportation. The same material was used for backfill. Pickup trucks are needed; however, they were not considered because they will be same for both the methods.
Details of the pipeline material inputs, specifications, equipment-related factors, and SimaPro processes for the OC and CIPP methods are provided as
Supplementary Materials.
5. Results and Discussion
5.1. Environmental Impact Assessment Results
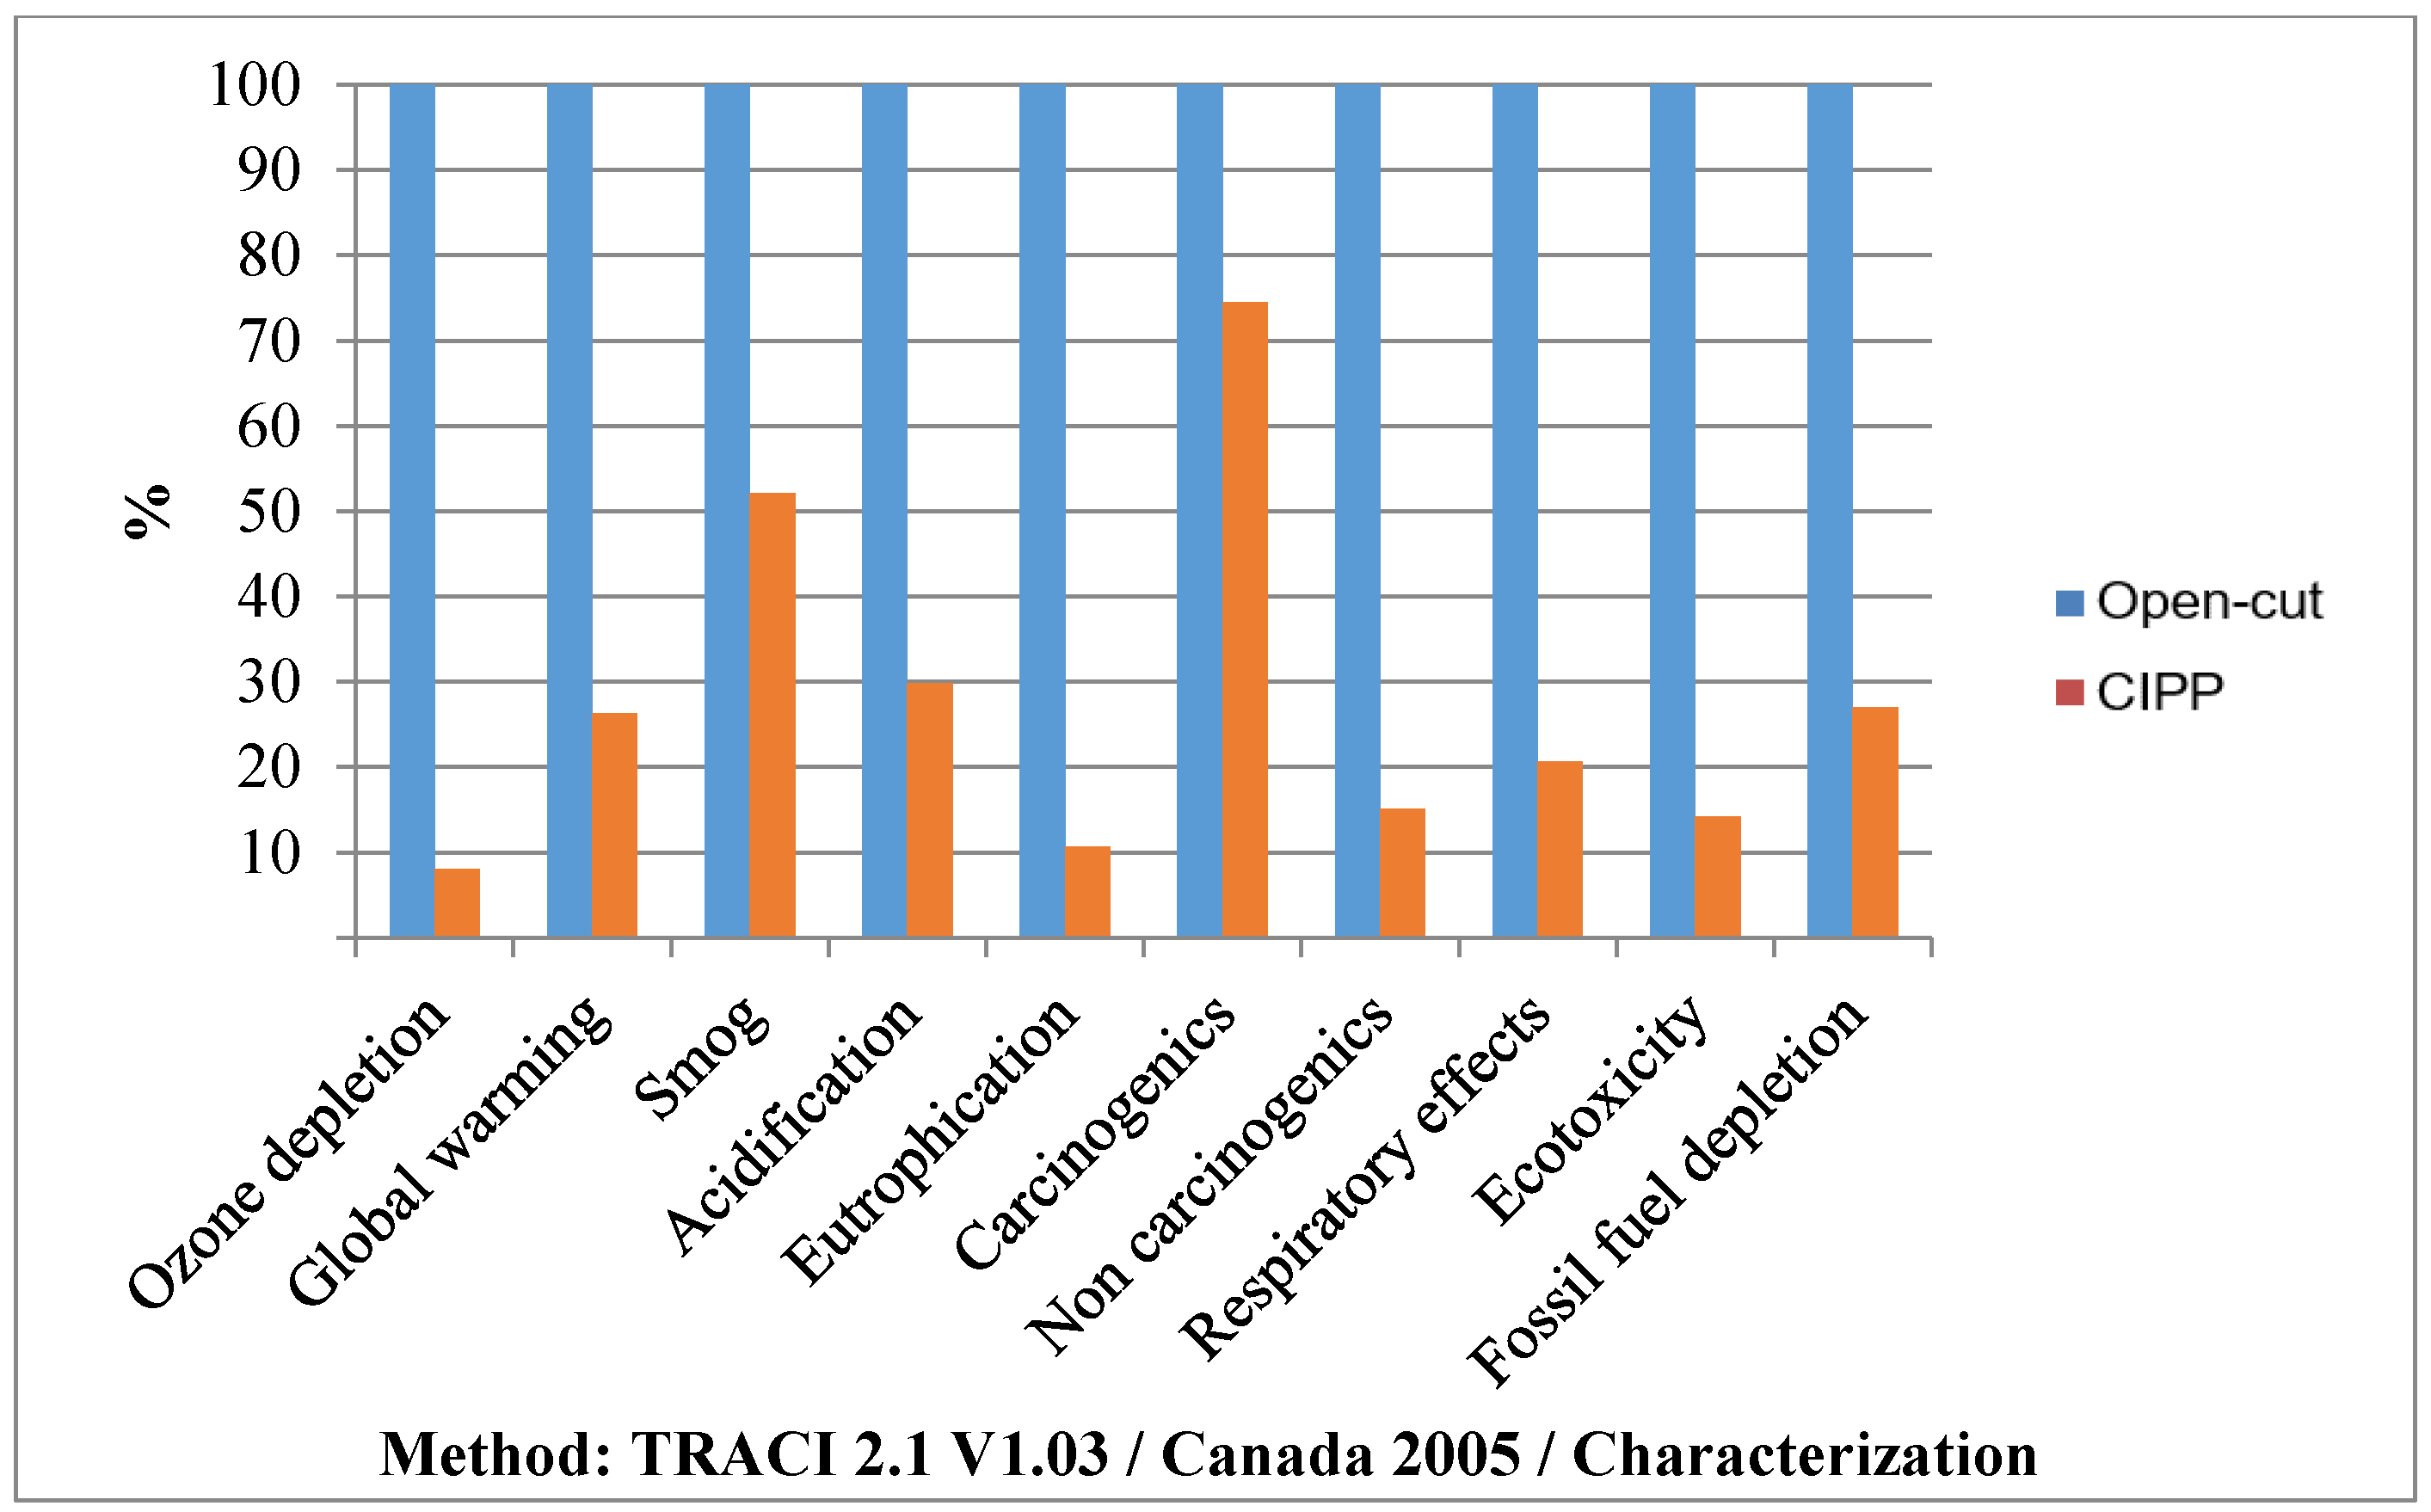
This section presents the EIA results for 203 mm (8 in.), 254 mm (10 in.), and 305 mm (12 in.) diameters OC and CIPP methods based on the USEPA’s TRACI methodology of the SimaPro software. It can be observed from
Figure 8 that the average amount of carcinogenics produced from CIPP is 25% less as compared to OC. The other impacts, such as ozone deletion, global warming, smog, acidification, eutrophication, non-carcinogenics, respiratory effects, ecotoxicity, and fossil fuel depletion are much less than 50% (
Figure 8).
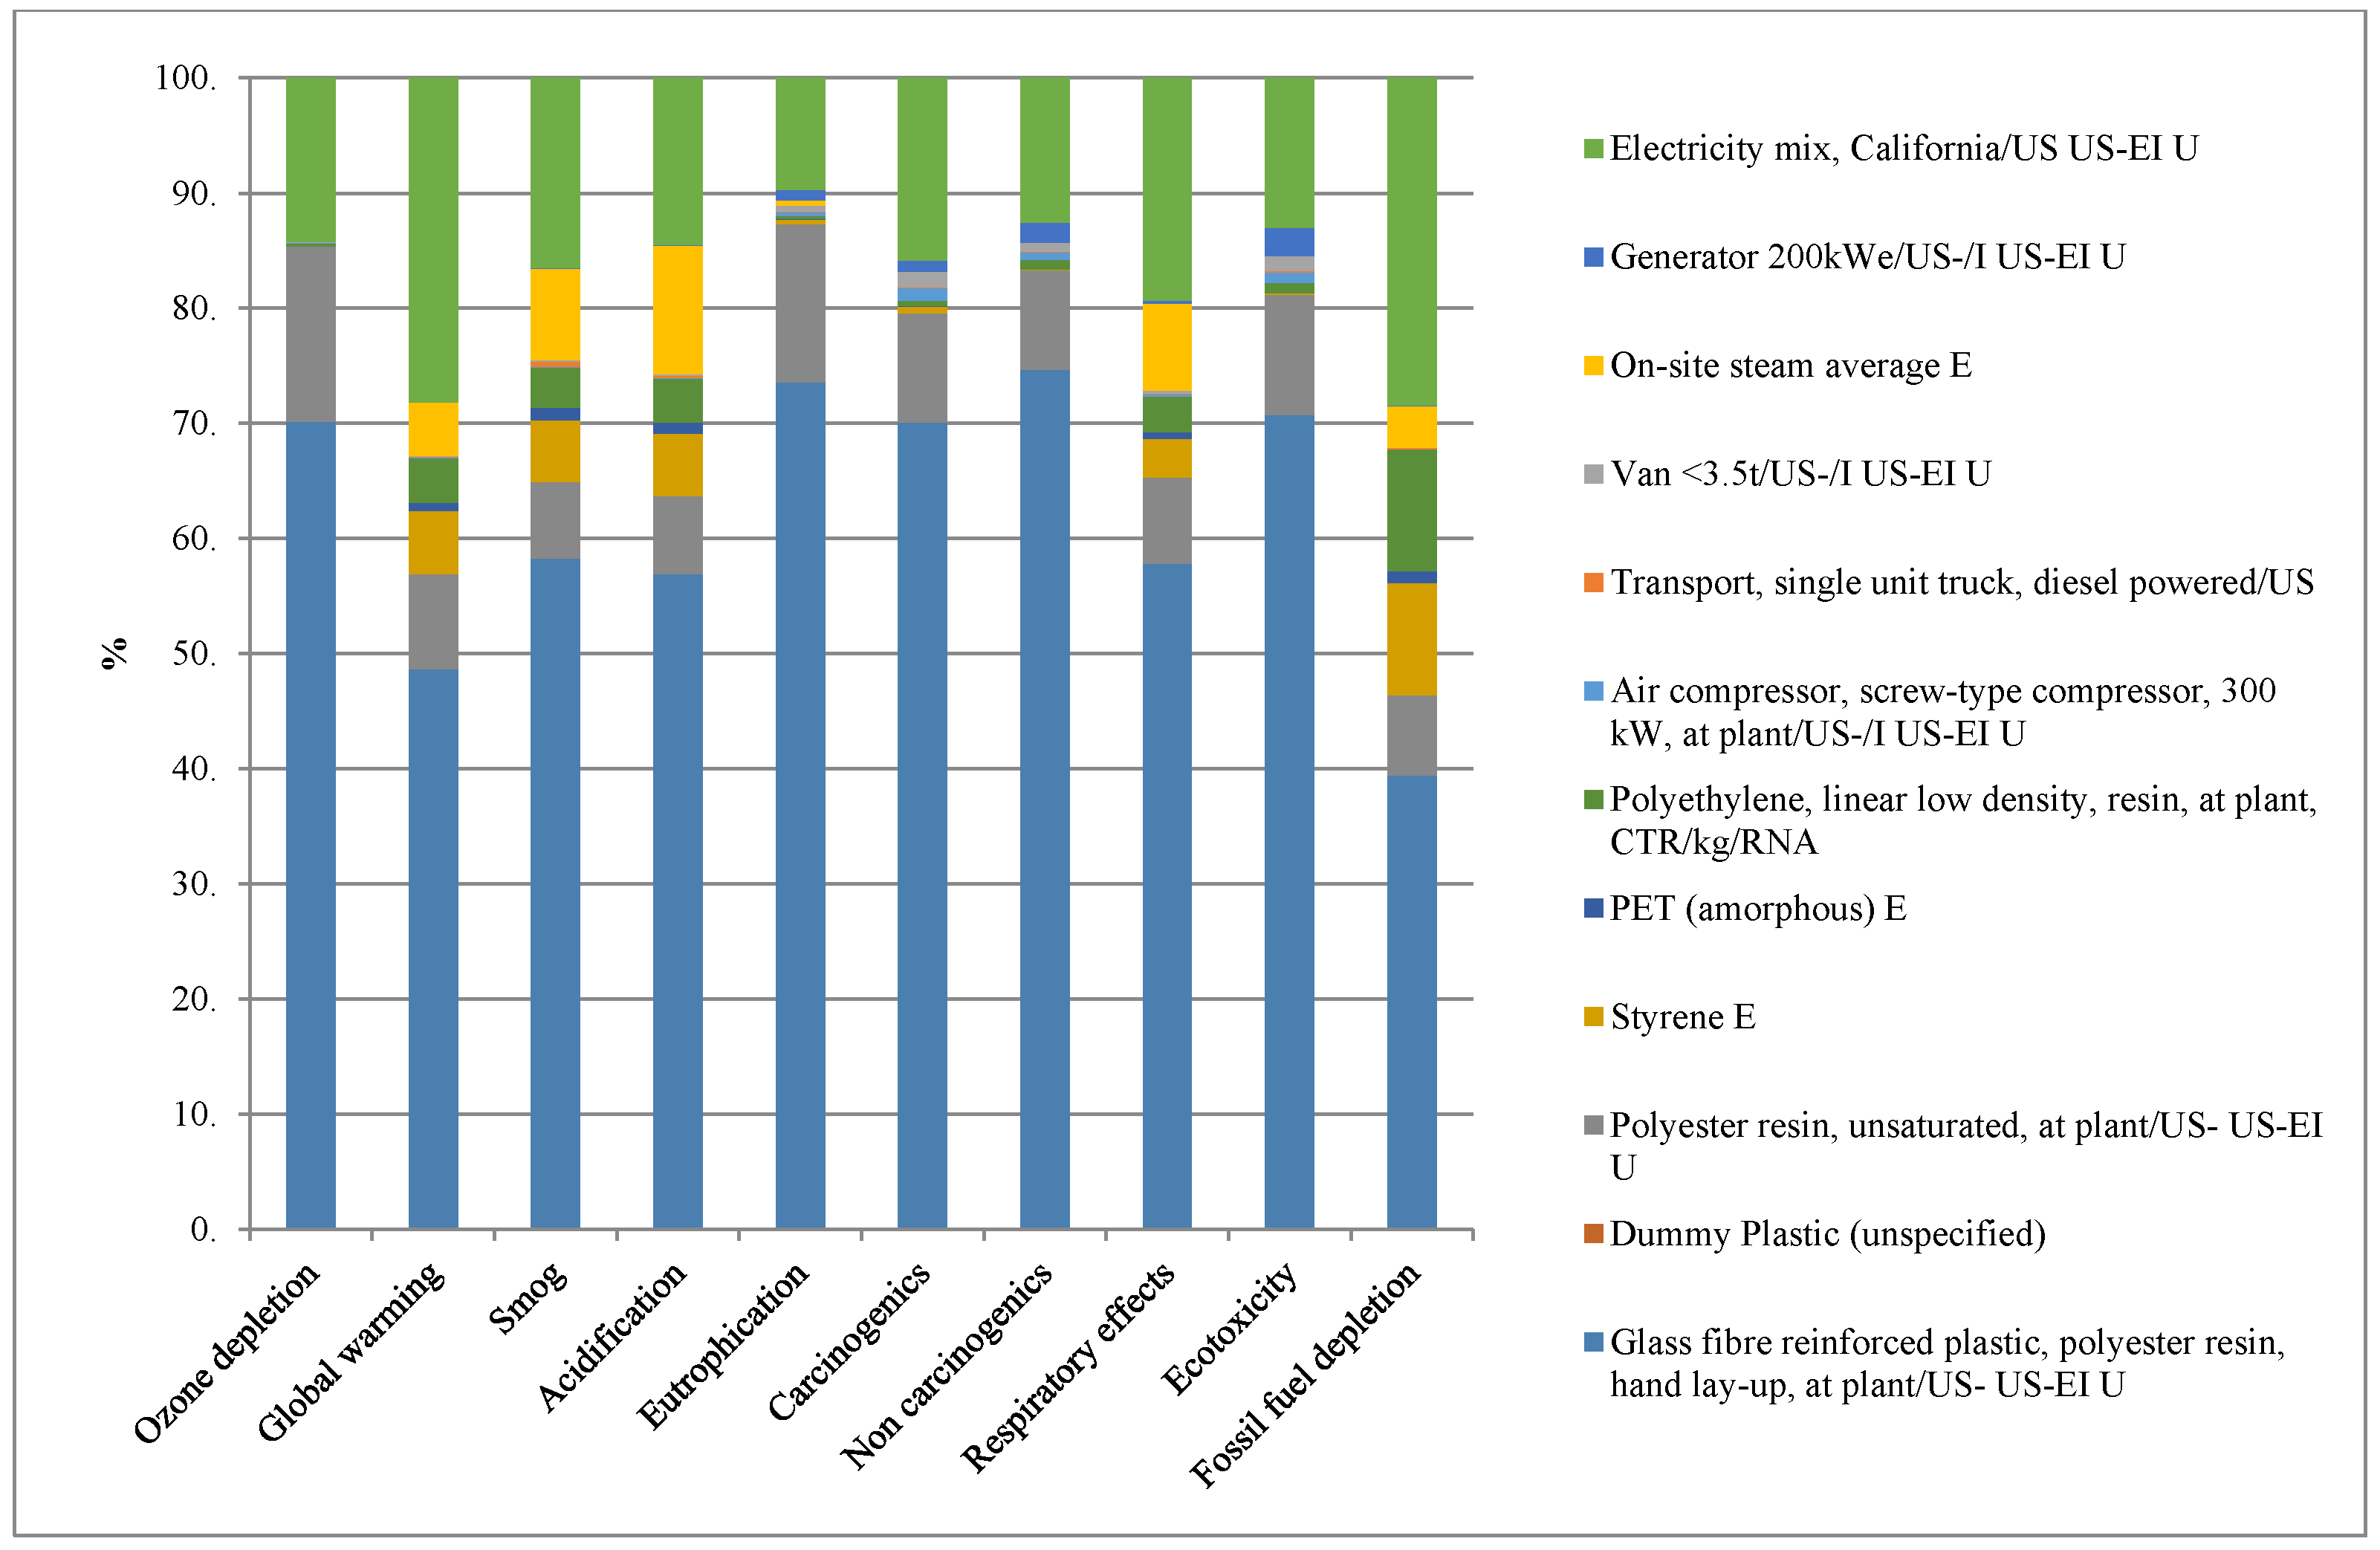
5.2. Environmental Impact Assessment Processes
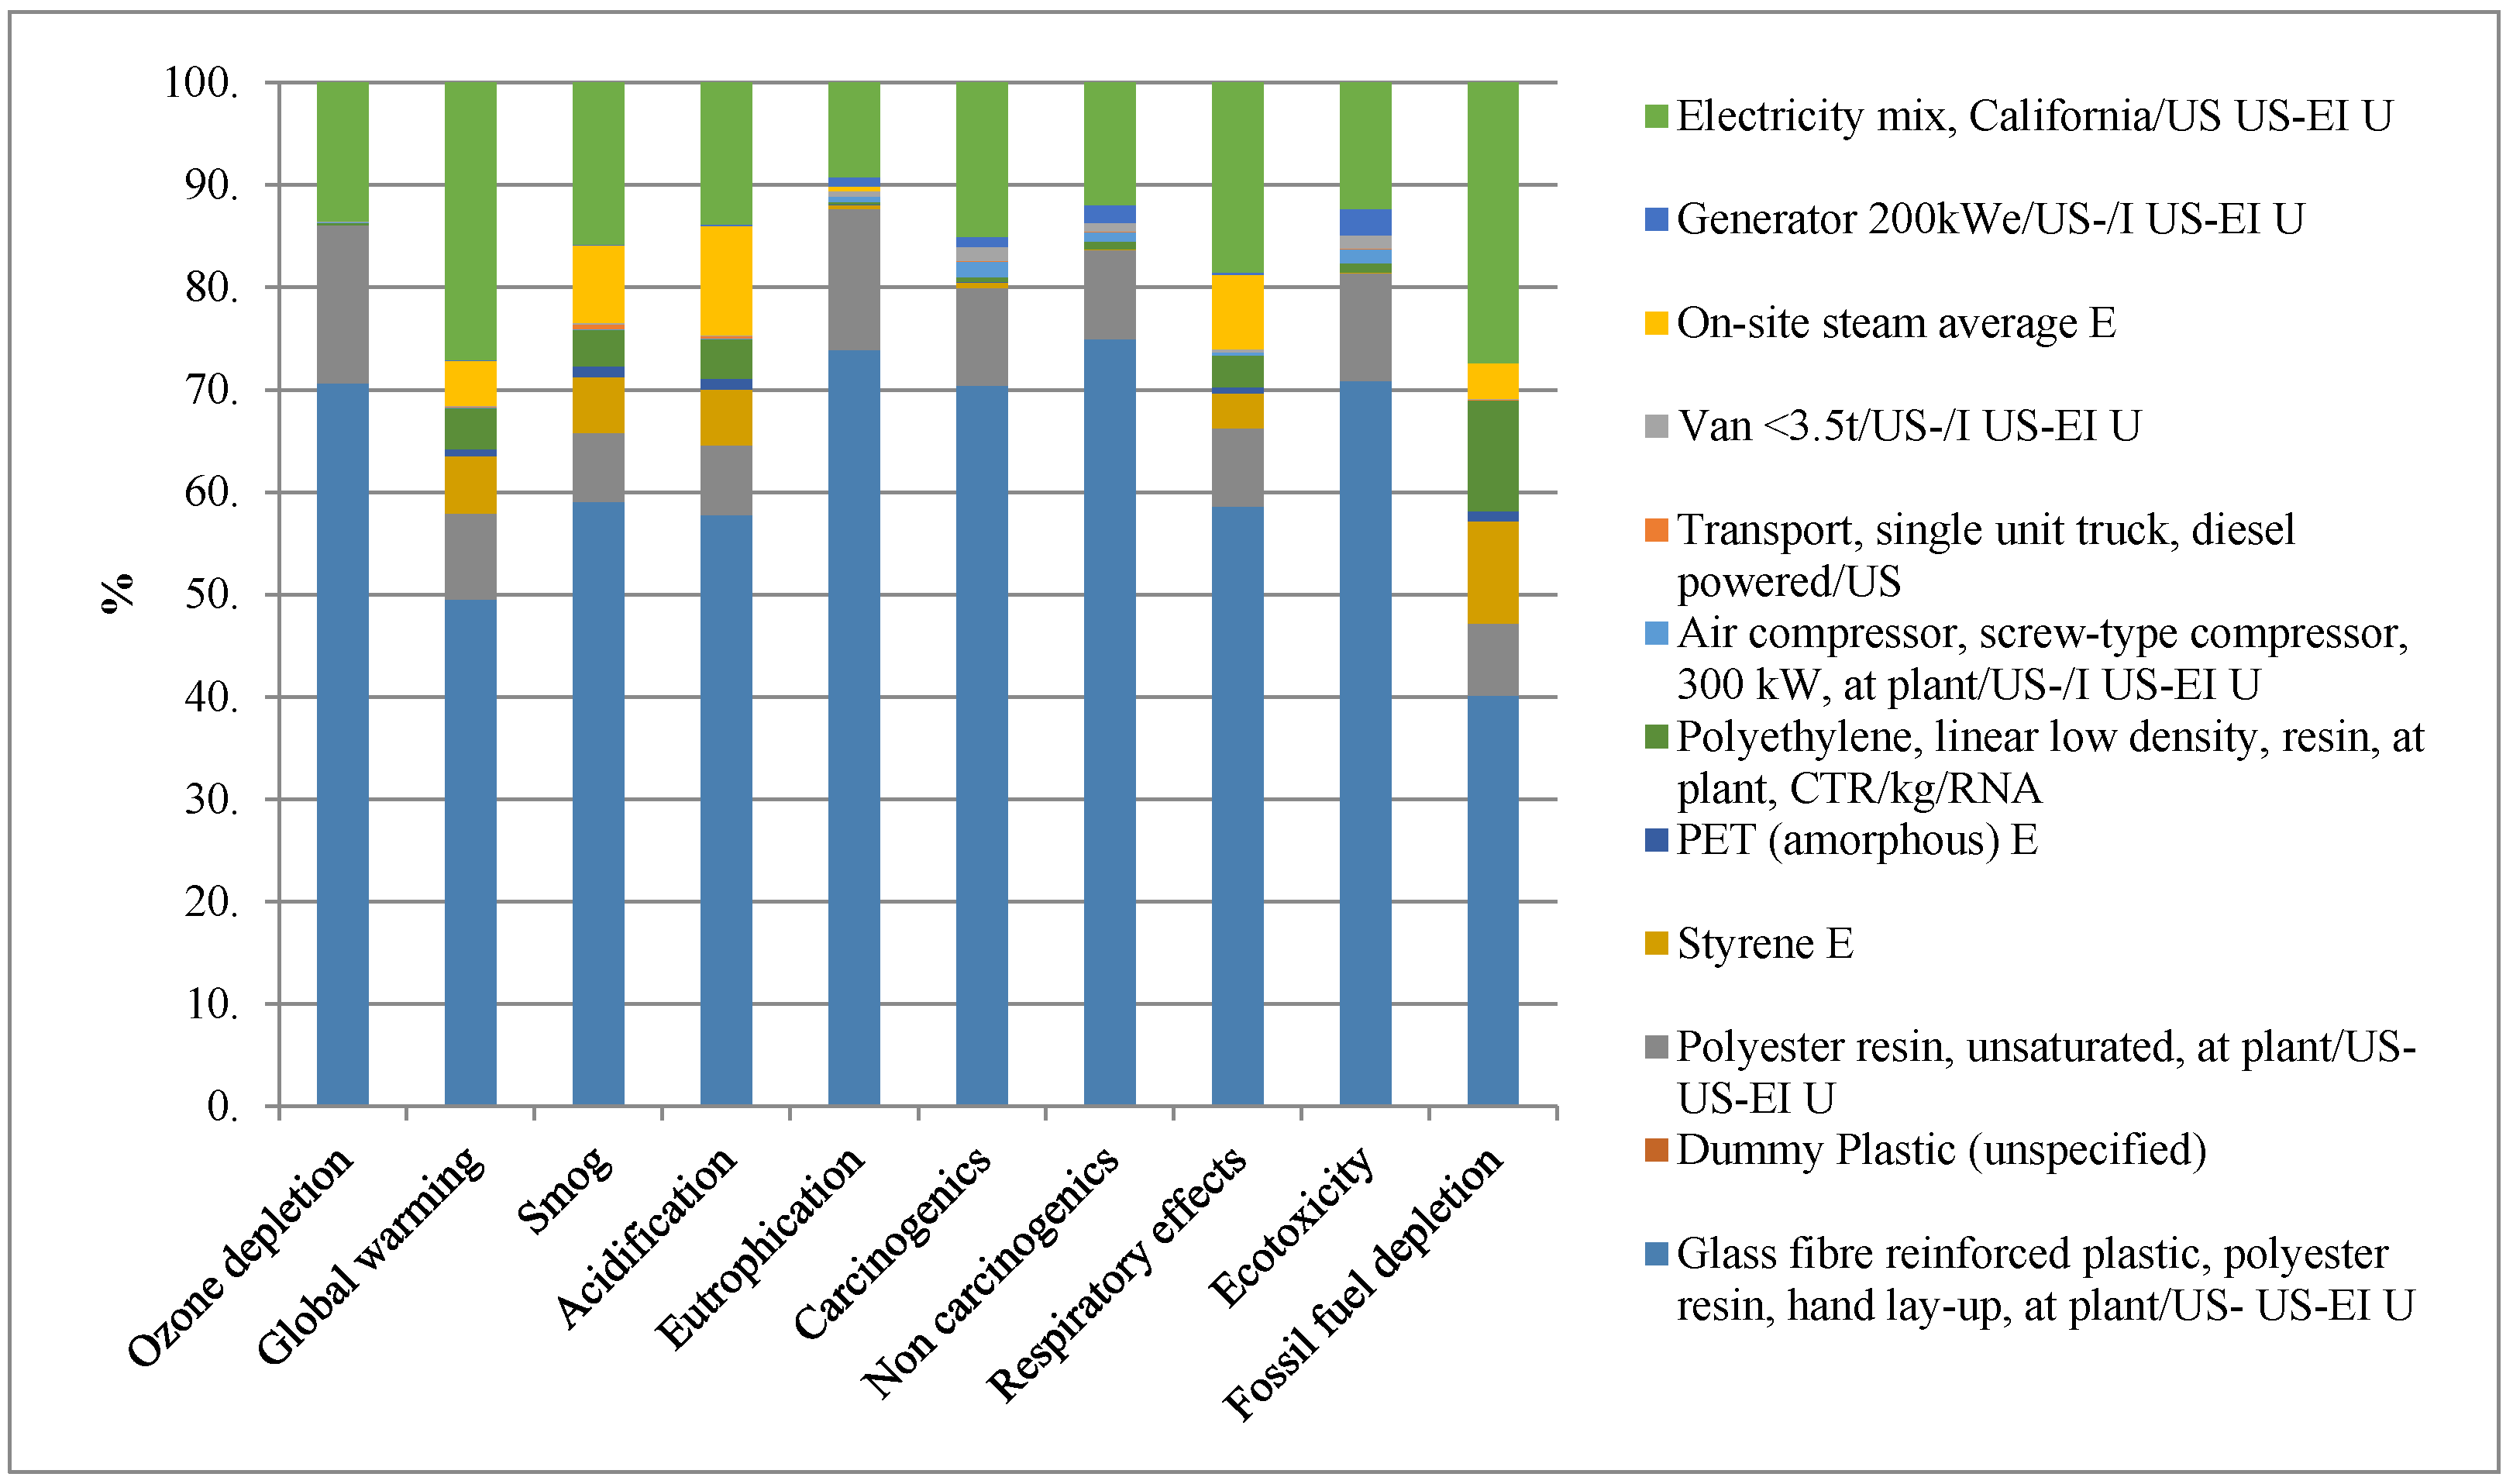
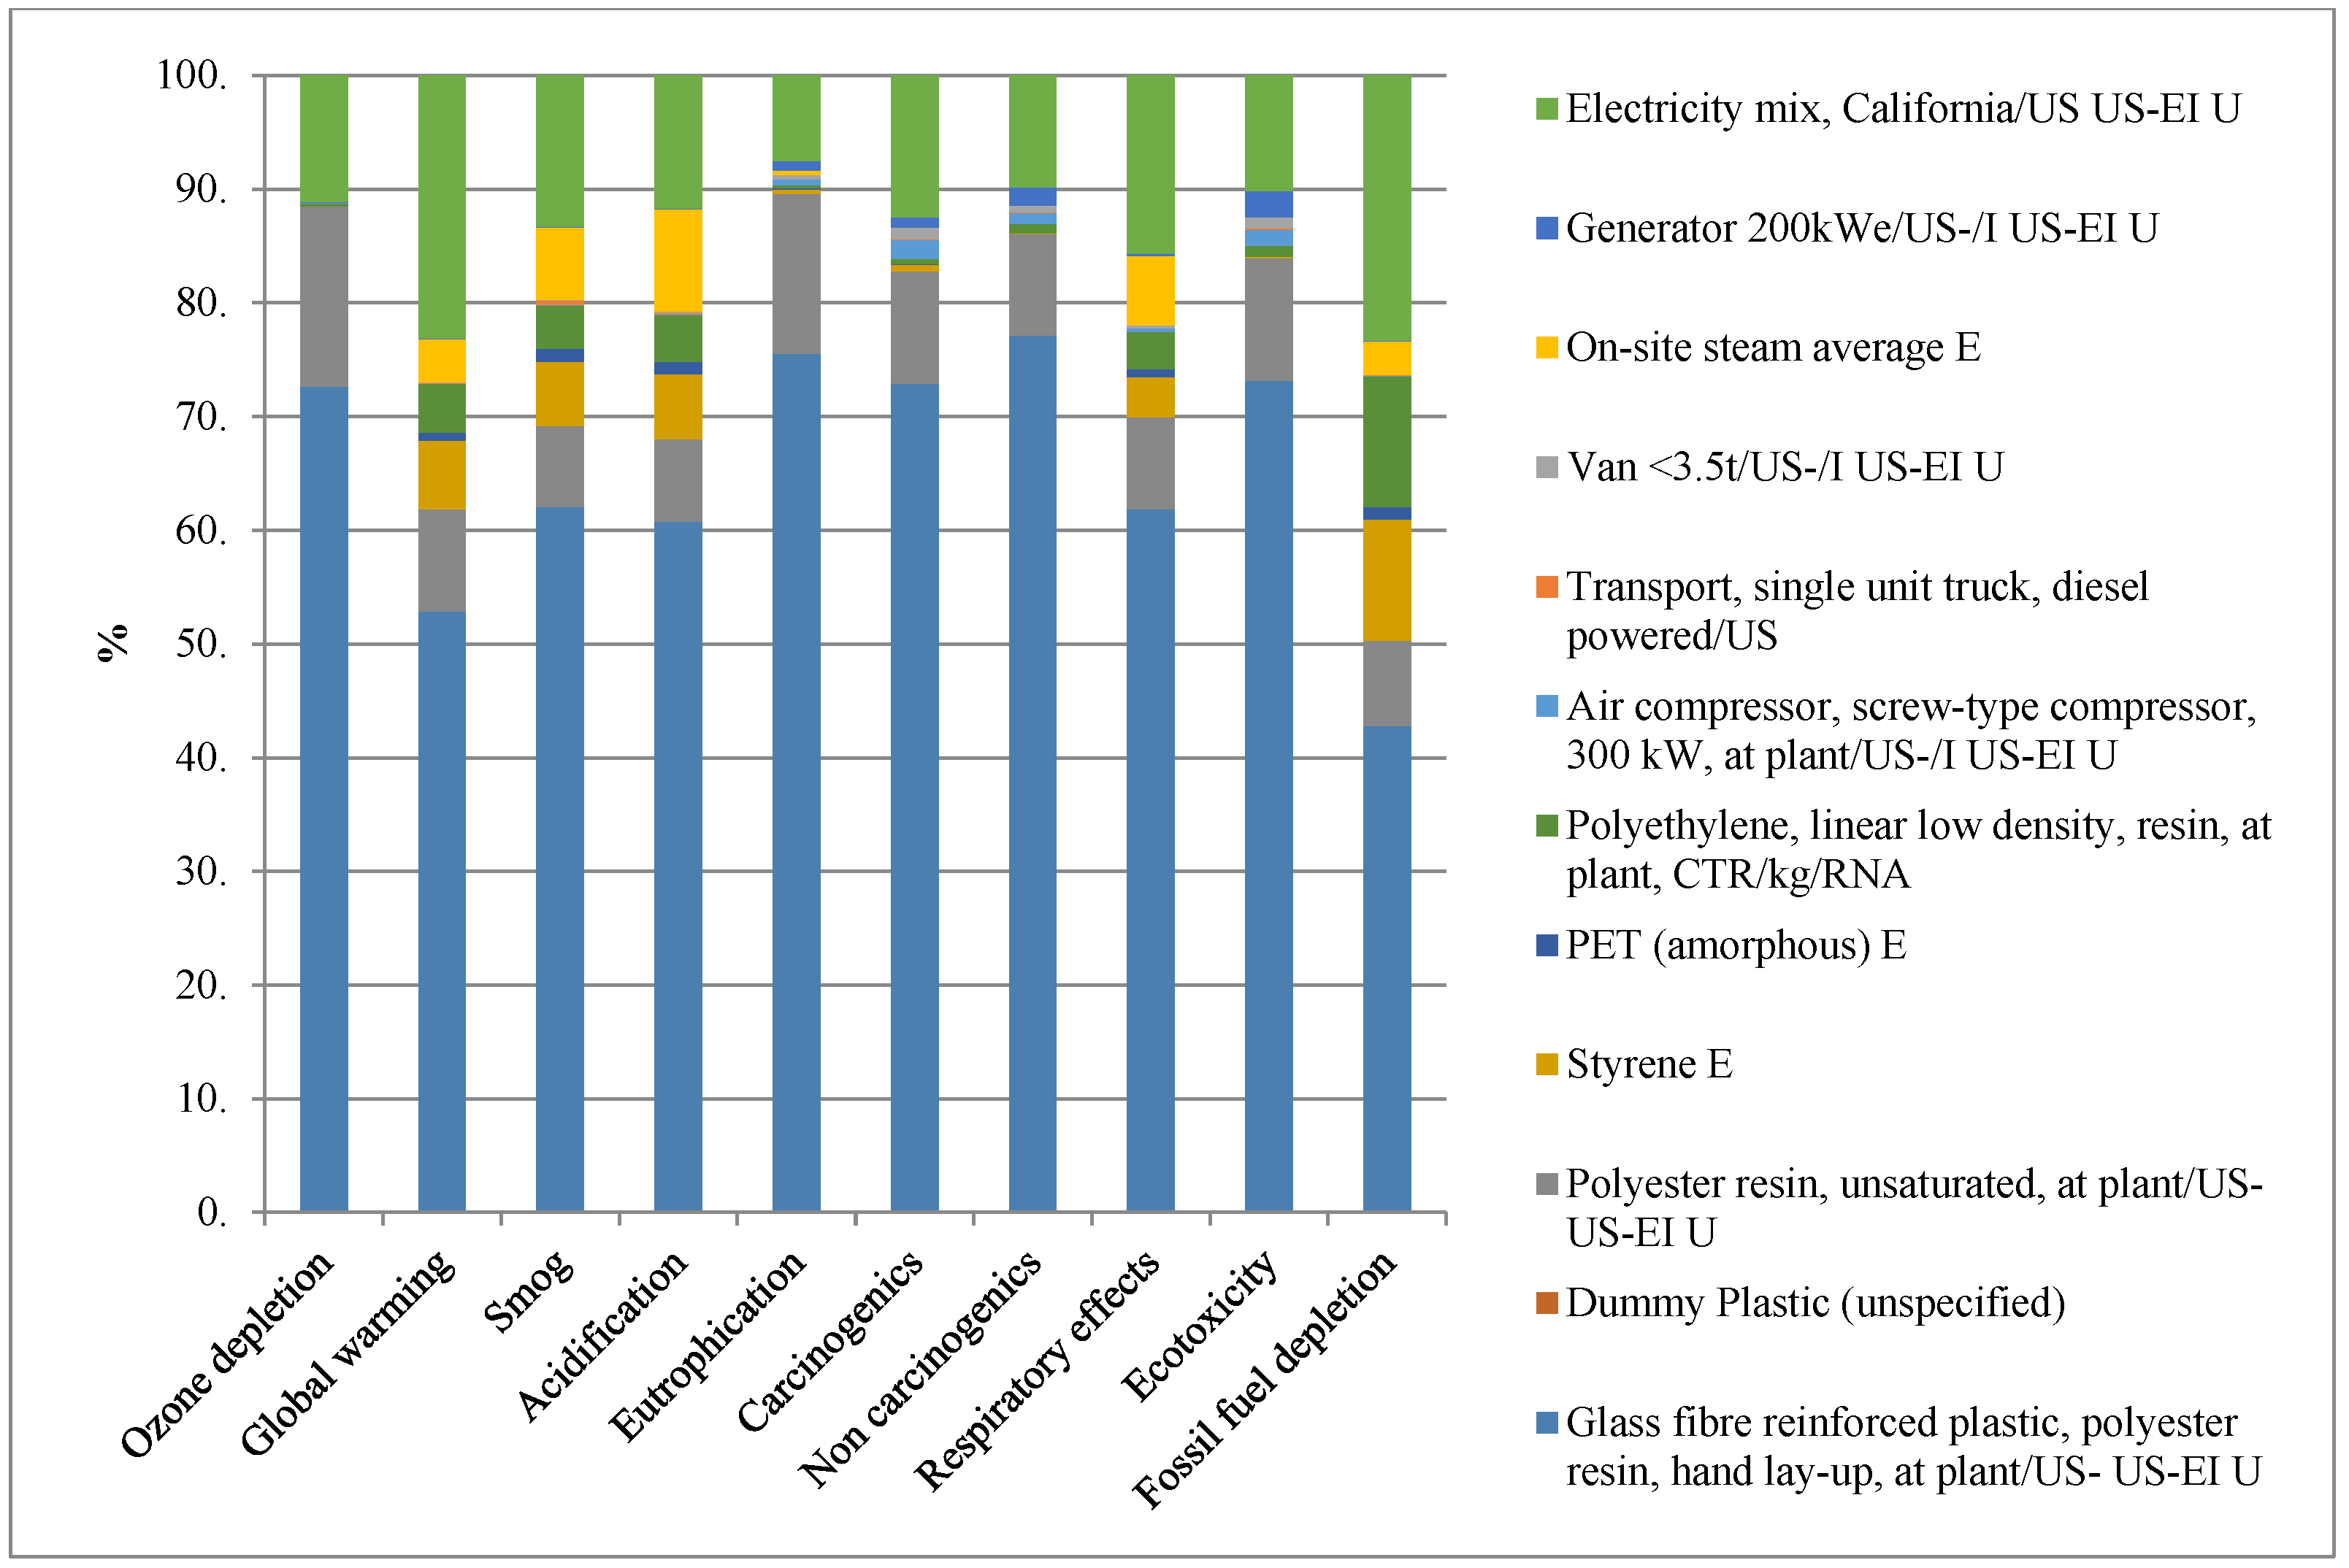
Figure 9,
Figure 10 and
Figure 11 show the EIA processes for 203 mm (8 in.), 254 mm (10 in.), and 305 mm (12 in.) diameter, respectively, for CIPP based on the USEPA’s tool for the reduction and assessment of chemicals and other environmental impacts (TRACI 2.1), as explained in
Section 3 of this paper.
Detailed results of the EIA processes for the 203 mm (8 in.), 254 mm (10 in.), and 305 mm (12 in.) diameter CIPP method are provided as
Supplementary Materials.
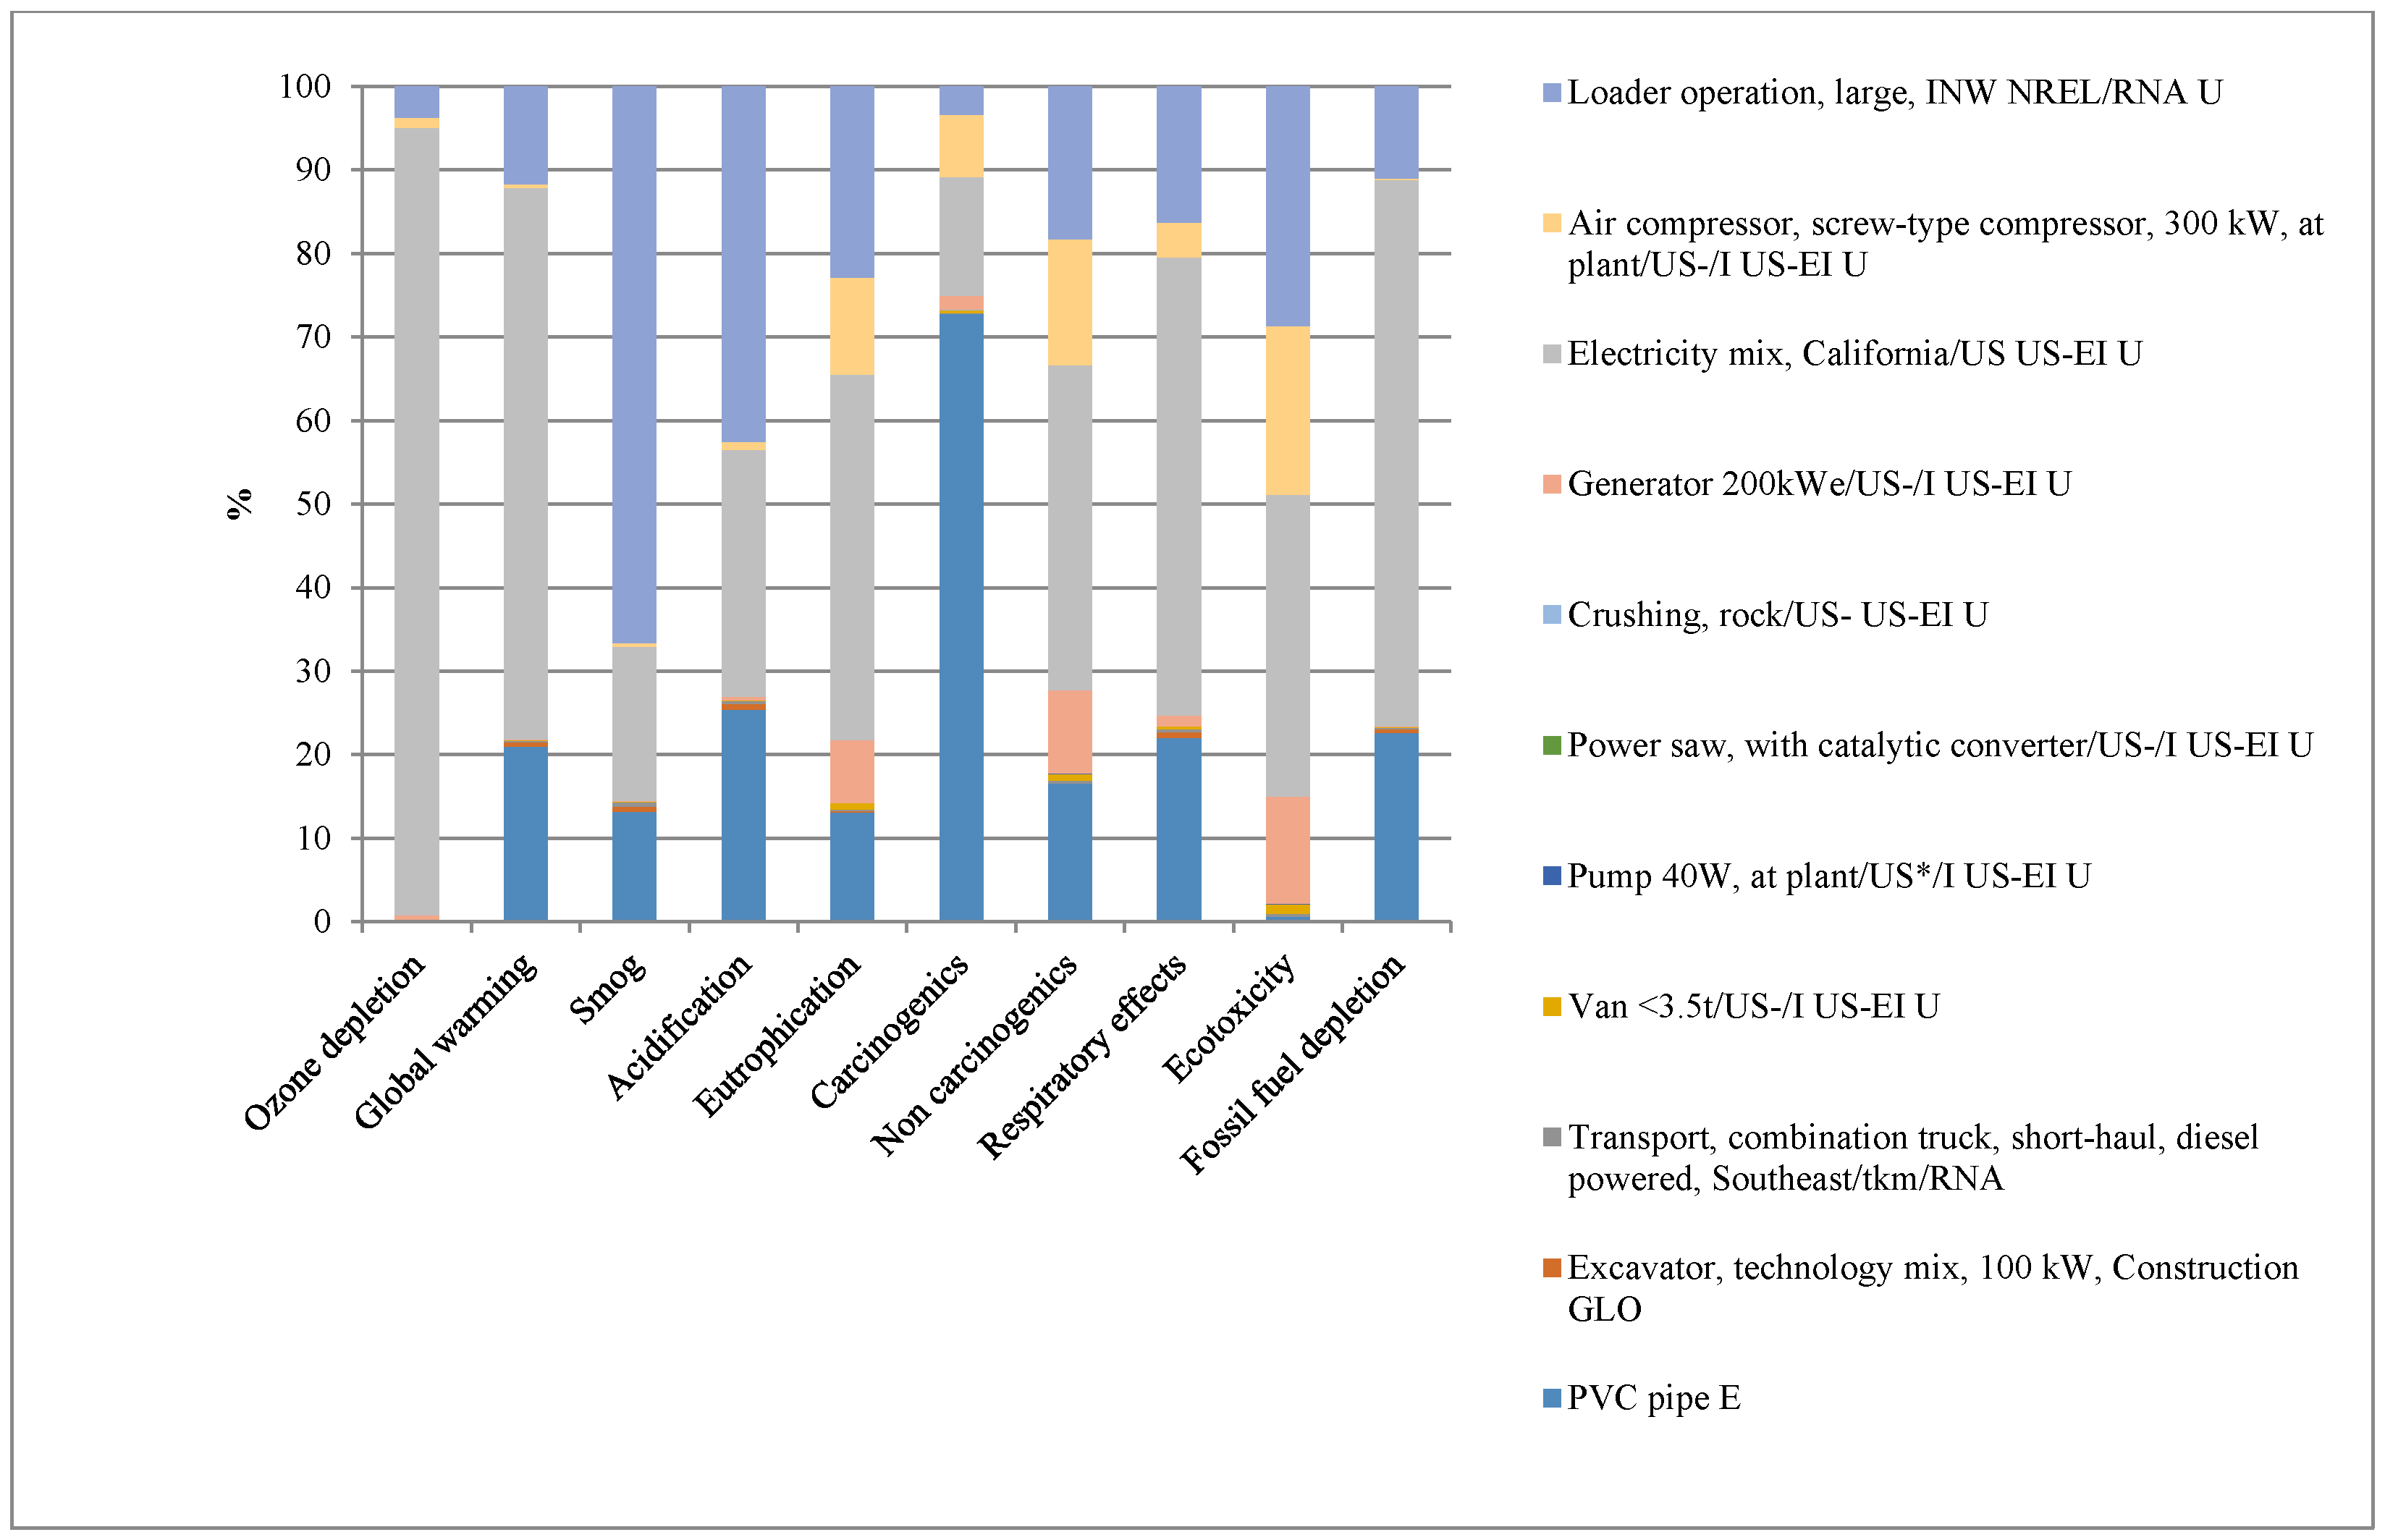
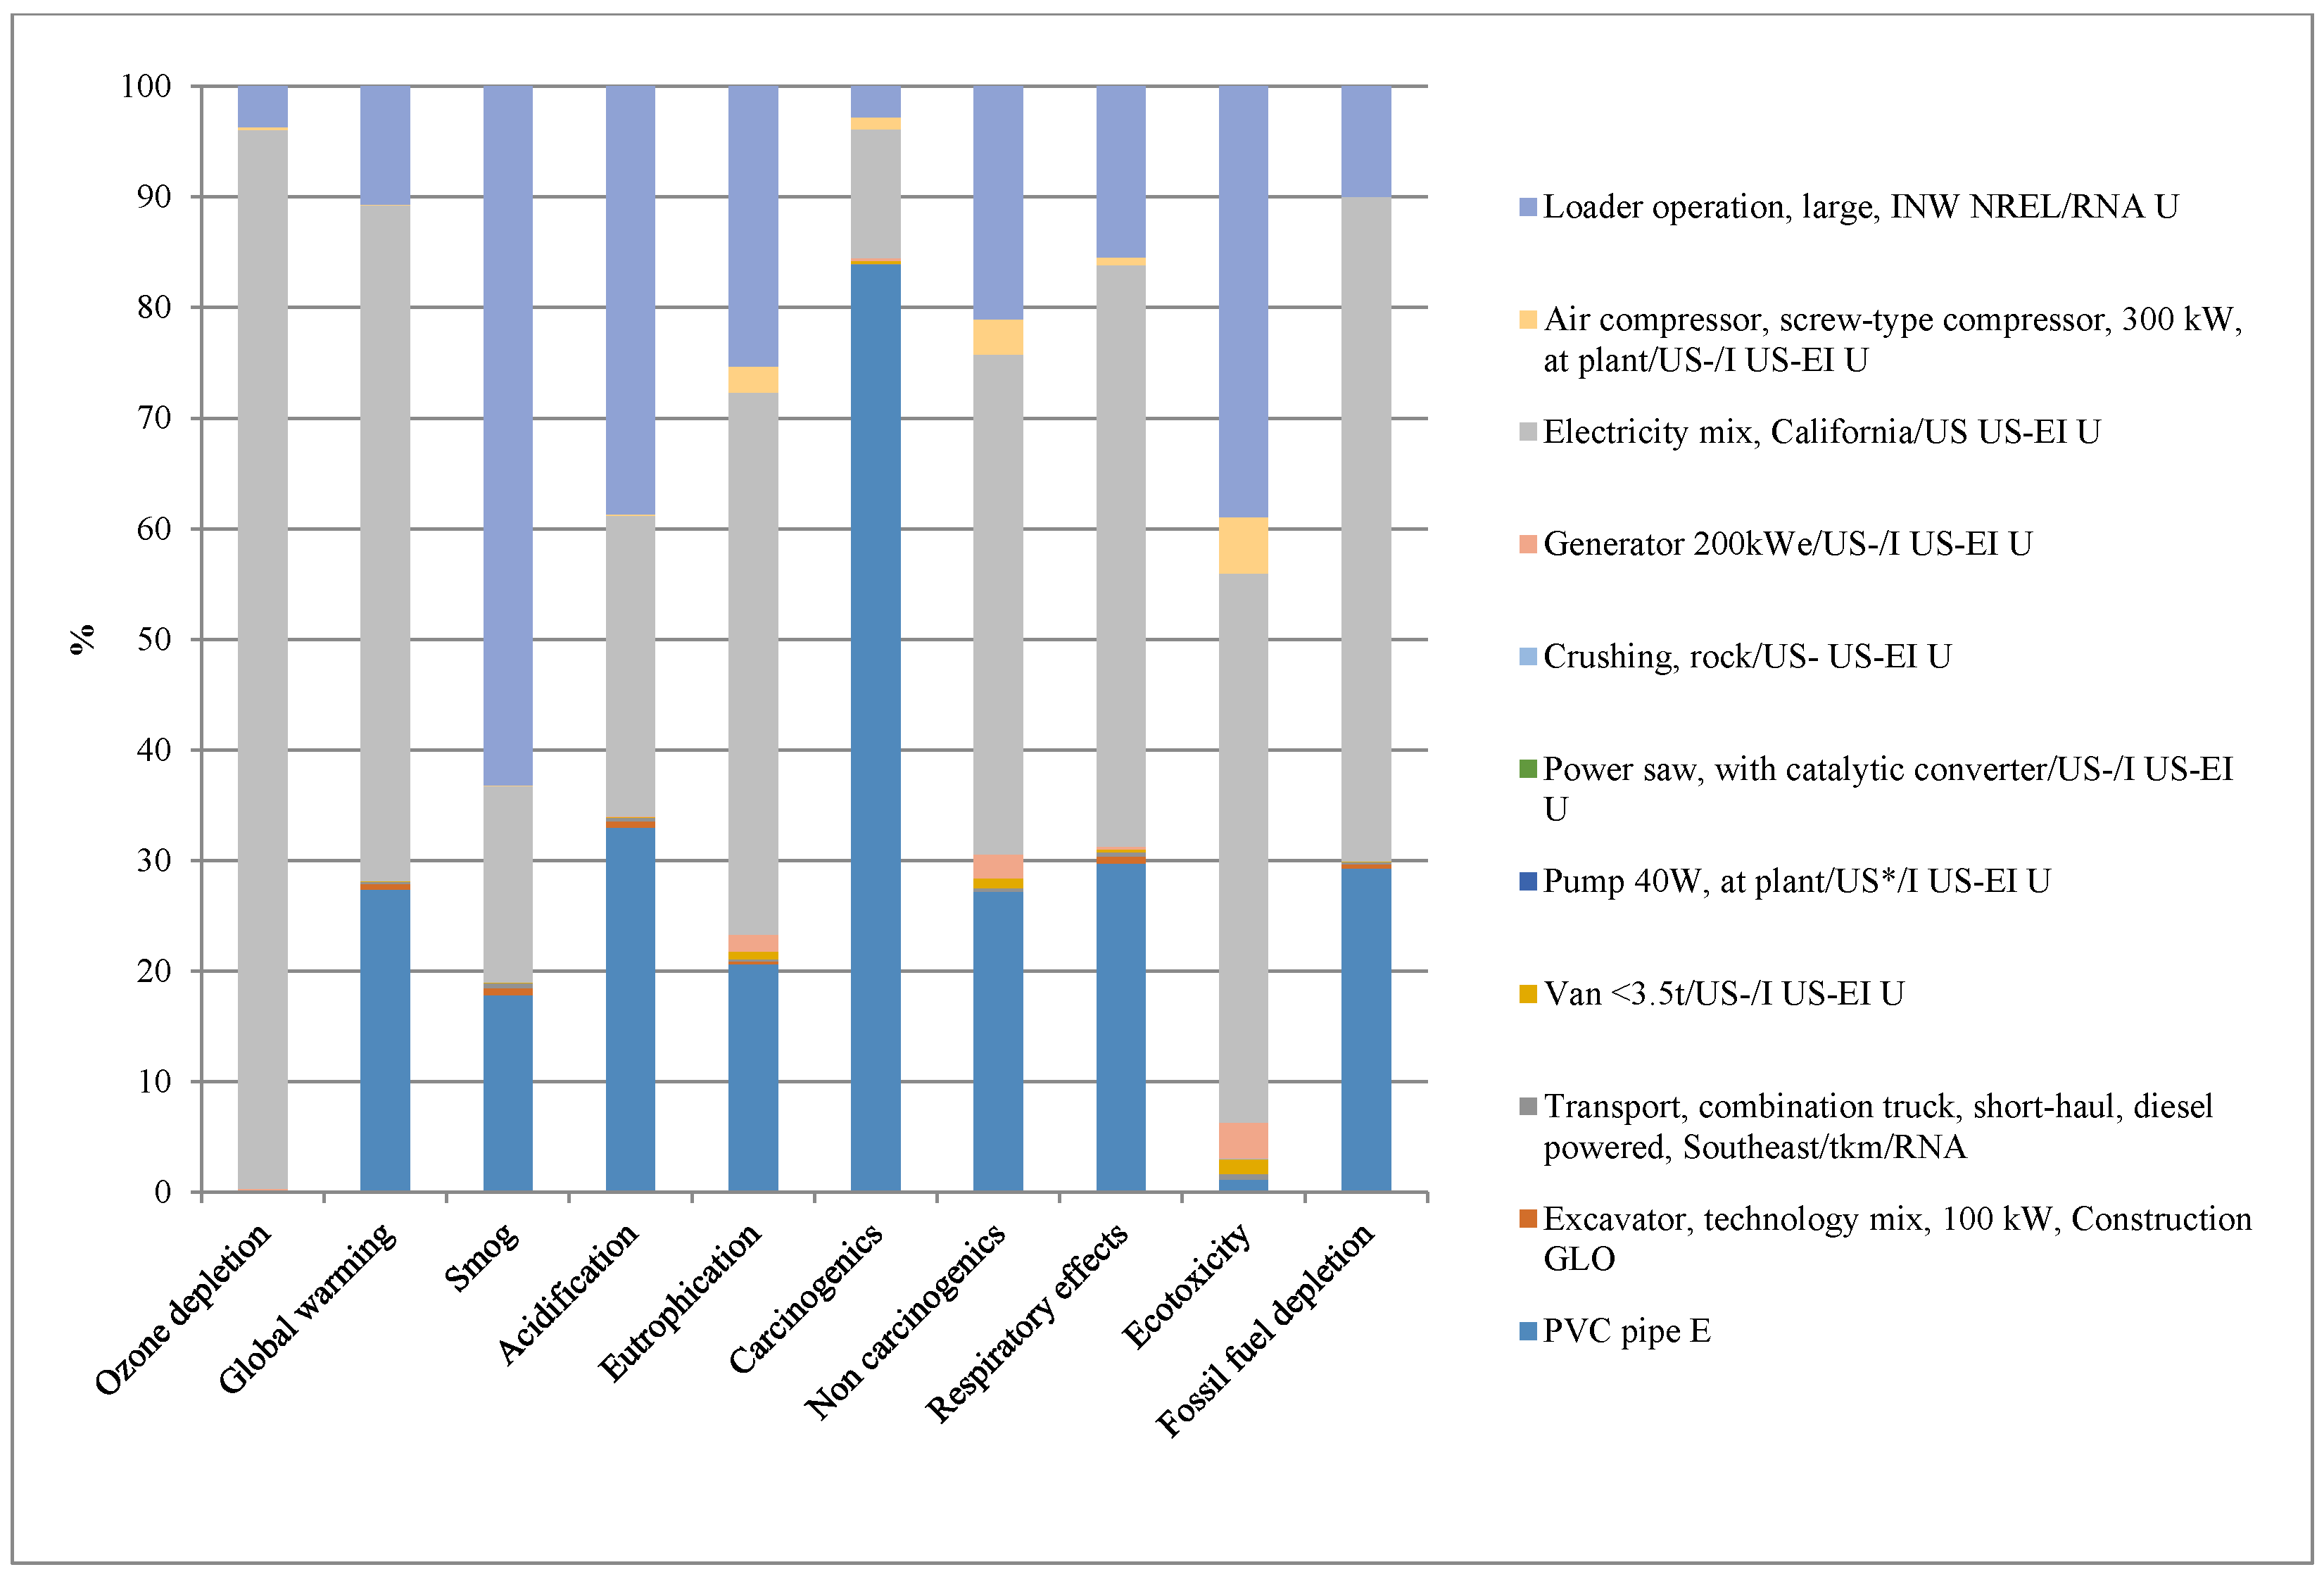
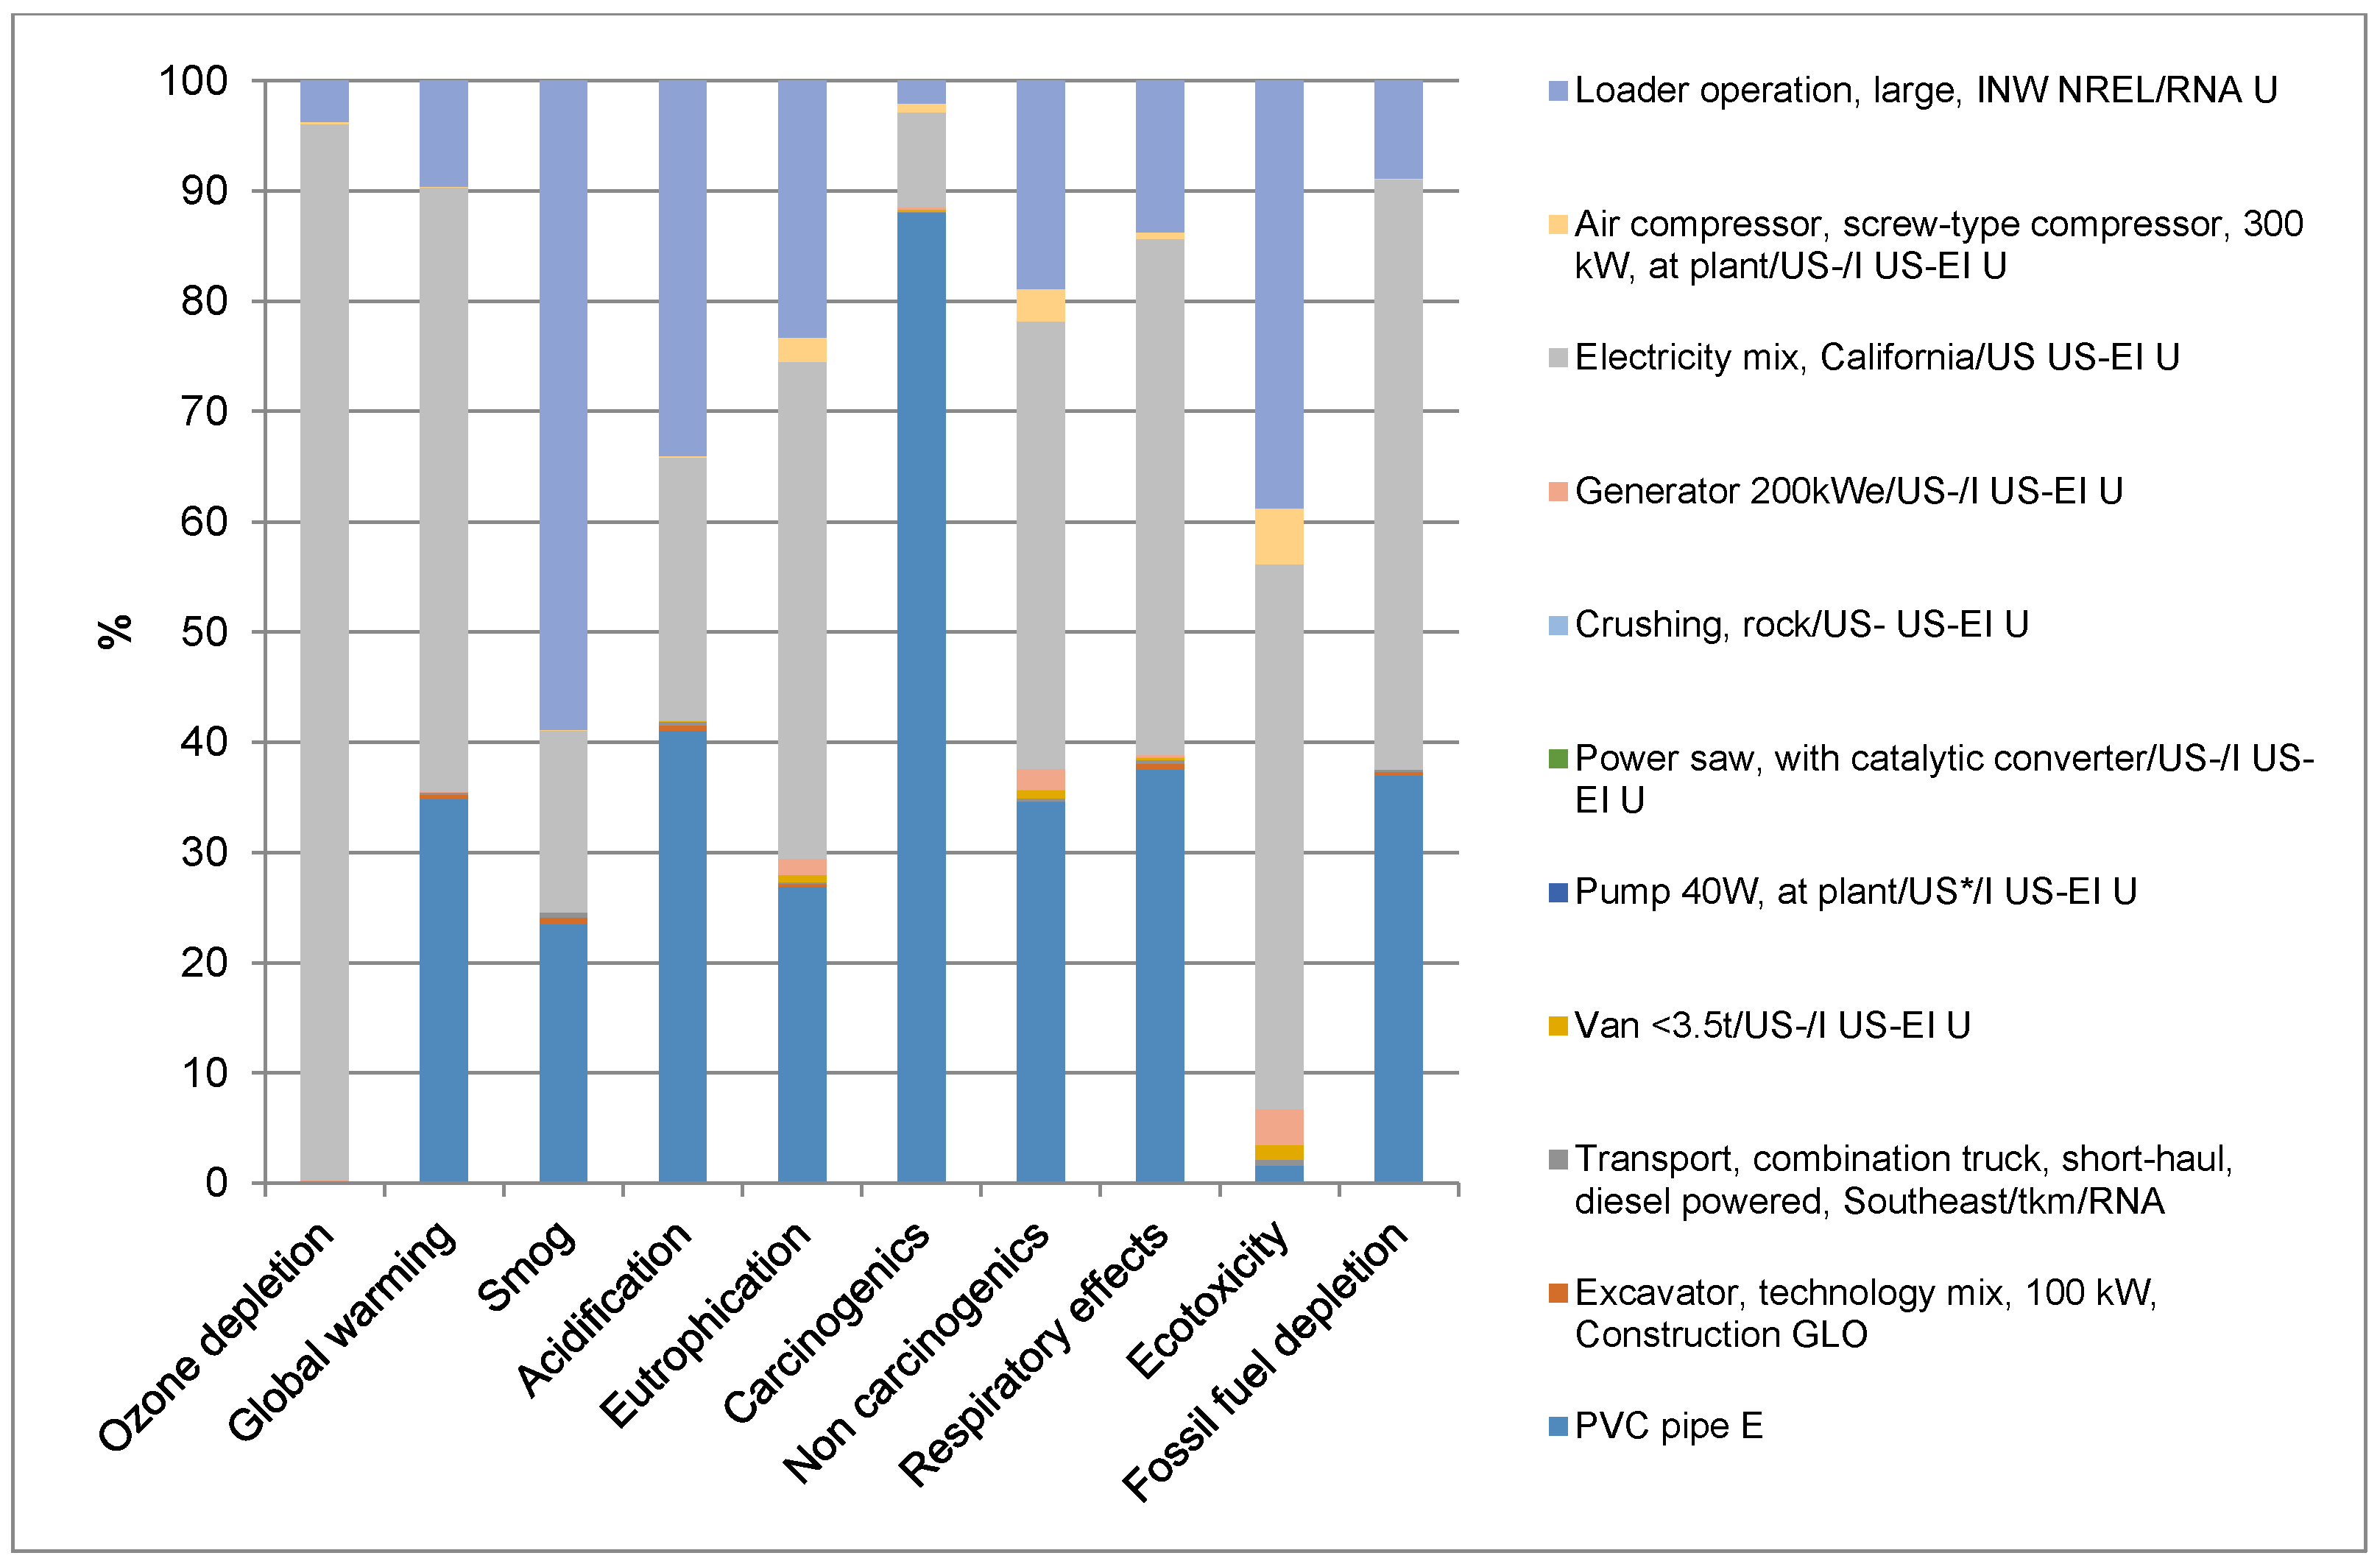
Figure 12,
Figure 13 and
Figure 14 show the EIA processes for 203 mm (8 in.), 254 mm (10 in.), and 305 mm (12 in.) diameters, respectively, for OC.
The above results are based on the USEPA’s tool for the reduction and assessment of chemicals and other environmental impacts (TRACI 2.1), as explained in the methodology section.
Detailed results of the EIA processes for the 203 mm (8 in.), 254 mm (10 in.), and 305 mm (12 in.) diameter OC method are provided as
Supplementary Materials.
5.3. Discussion of Results
Wastewater utilities contractors still use the conventional OC pipeline replacement methods to renew sanitary sewers in cities, which can be costly and disruptive to the surrounding environment, particularly in highly populated areas [
57]. There are almost no studies on CIPP and only a few studies on the OC pipeline and their comparisons. These studies included a qualitative investigation on the pipeline installation using the OC method and did not provide quantitative details regarding the construction of the trench, including the project duration, size, and location [
8,
58,
59,
60,
61].
Several studies focused on the construction phase in pipeline projects, including fuel consumption, the landfill disposal of the excavated materials, and the production of the backfill materials including the transportation [
8,
16,
60,
61,
62]. However, these studies only consider specific environmental impact categories and ignored various environmental aspects related to global warming, human toxicity, and particulate matter formation.
For the EIA, this paper compared and evaluated the environmental impacts of OC pipeline method with trenchless CIPP for 203 mm (8 in.), 254 mm (10 in.), and 305 mm (12 in.) diameters. The study also identified the factors influencing the environment from the CIPP and OC. The EIA results show that, on average, trenchless CIPP causes 68% less environmental impacts, 75% less impacts on human health, and 62% less resource depletion as compared to OC. These results are consistent with the previous studies [
28,
63,
64,
65,
66,
67,
68,
69,
70]. It was found that for SDSS, the liner, felt and resin from CIPP influenced the environment the most (i.e., 70%) as compared to the OC pipeline method, where the power consumption of all the equipment and usage and the pipe material had the greatest impacts (i.e., 68%). These results are consistent with the previous studies [
3,
12,
36,
68].
EIA of pipeline renewal and replacement methods is an essential element when considering sustainable pipeline development. This study provided an approach for the EIA and its application for different projects with different site conditions for SDSS. Project owners, decision makers, and contractors commonly take into consideration the construction aspect only and sometimes overlook the environmental implications while making a choice between trenchless renewal and open-cut pipeline replacement. Such a comparative assessment study will be helpful for project owners and contractors in the decision-making process to select a more sustainable pipeline installation method.
6. Conclusions
It can be concluded that an environmental impact assessment can be used as a quantification tool to measure the sustainability of pipeline installation. The higher environmental impacts in the OC pipeline method are a result of longer project durations and more equipment requirements compared to CIPP, where a smaller working area is used. The early phases of project planning should include appropriate ecological decisions consistent with the life-cycle assessment. The trenchless CIPP method increases productivity as it is typically feasible in most weather conditions, resulting in fewer delays and reduced equipment requirements. Therefore, the selection of pipeline materials should be based on the proper design requirements, site restrictions, existing infrastructure, above-ground structures, soil conditions, and required accuracy, as well as costs. Choosing a proper pipeline material and installation method will result in a significant reduction in environmental impacts.
While the conclusions are derived from a case study for particular conditions, the approach can be applied to similar projects. The results are expected to be valid for similar types and diameters of sanitary sewers; however, they might be location-specific and should not be extrapolated to CIPP installations on pipes that convey surface water. This study can be useful for analyzing the the environmental impacts and associated costs of CIPP and OC for sanitary sewers with different project and site conditions.
7. Recommendations for Future Research
There is a need to develop a prediction model that can analyze environmental impacts from the CIPP and OC methods based on different project conditions, locations, and diameters. A spreadsheet model can also be developed for CIPP and OC to determine environmental impacts based on different soils, sites, and project conditions; the equipment used; the problems encountered, etc. for each associated project. The testing of the hypothesis and other statistical analyses could be performed on different CIPP and OC pipeline data and with the addition of more case studies. For the EIA, the effect of different pipe sizes, types (gravity and pressure), and materials (resin, felt, etc. for CIPP) should be considered. The effect of different CIPP curing methods like water, steam, and UV should be studied and evaluated to see the change in the EIA. Additionally, the pipe material and outside diameter should be considered during the installation phase by the OC and CIPP methods to allow a detailed evaluation and comparison of their sustainability impacts.
Contributions to the body of knowledge: This paper presented a literature review to understand the environmental impacts from the OC and CIPP methods. Using USEPA’s tool for the reduction and assessment of chemical and other environmental impacts (TRACI) methodology of SimaPro software, this paper analyzed and compared the environmental impacts from the OC and CIPP methods and identified factors that influence the environment of sanitary sewers. A similar methodology can be used for analyzing the environmental impacts and associated costs of the OC and CIPP methods for sanitary sewers with different project and site conditions.
Author Contributions
Conceptualization, V.K. and M.N.; data curation, V.K.; formal analysis, V.K.; investigation, V.K.; methodology, V.K.; software, V.K.; supervision, M.N.; writing—original draft, V.K.; writing—review and editing, V.K. and M.N. All authors have read and agreed to the published version of the manuscript.
Funding
This research received no external funding.
Acknowledgments
This work has been derived from the first author’s Doctoral Dissertation and authors would like to acknowledge Tim Peterie and Terry Henry of Insituform Technologies, Inc., and industry experts from NASSCO, Inc. for providing information regarding CIPP installation.
Conflicts of Interest
The authors declare no conflict of interest.
Abbreviations
The following symbols are used in this paper:
| CFC-11 | Trichlorofluoromethane |
| CH4 | Methane |
| CO2 | Carbon dioxide |
| CO2EQ | Carbon dioxide equivalent |
| CTUh | Comparative toxic unit for human |
| DO | One-way distance hauling to the site |
| DR | Return distance from the site |
| EFi | Emission factor for the impact i |
| EFZM | Zero-mile emission factor |
| Emissions i | Emission amount generated by the equipment i |
| Eq | Equivalent |
| HRS | Hours of use |
| kg | Kilogram |
| N | Nitrogen |
| NOX | Oxides of nitrogen |
| O3 | Ozone |
| PM2.5 | Atmospheric particulate matter |
| SO2 | Sulfur dioxide |
| SOxconv | Fraction of fuel sulfur converted to PM |
| SOxdsl | Episodic fuel sulfur percentage |
| SPmadj | Sulfur content adjustment to PM emission factor |
References
- Allouche, E.; Alam, S.; Simicevic, J.; Sterling, R. A Retrospective Evaluation of Cured-in-Place Pipe (CIPP) Used in Municipal Gravity Sewers; Environmental Protection Agency: Washington, DC, USA, 2012.
- Bartlett, S.; Cisneros, H.; Decker, P.; Heartwell, G.; Warnock, A.; Nellenbach, M.; Campanelli, B. Executive Council on Infrastructure Water Task Force; Bipartisan Policy Center: Washington, DC, USA, 2017. [Google Scholar]
- Alsadi, A. Evaluation of Carbon Footprint during the Life-Cycle of Four Different Pipe Materials. Ph.D. Thesis, Louisiana Tech University, Ruston, LA, USA, 2019. [Google Scholar]
- Najafi, M.; Gokhale, S.B. Trenchless Technology: Pipeline and Utility Design, Construction, and Renewal; McGraw-Hil: New York, NY, USA, 2005. [Google Scholar]
- USEPA. Clean Watersheds Needs Survey (2012 Report to Congress); Document No. EPA-830-R-15005; Office of Transportation and Air Quality, U.S. Environmental Protection Agency (USEPA): Washington, DC, USA, 2012.
- Hashemi, B.; Iseley, T.; Raulston, J. Water Pipeline Renewal Evaluation Using AWWA Class IV CIPP, Pipe Bursting, and Open-Cut. In Proceedings of the International Conference on Pipelines and Trenchless Technology, Beijing, China, 26–29 October 2011. [Google Scholar]
- Kaushal, V. Comparison of Environmental and Social Costs of Trenchless Cured-in-Place Pipe Renewal Method with Open-Cut Pipeline Replacement for Sanitary Sewers. Ph.D. Thesis, University of Texas at Arlington, Arlington, TX, USA, 2019. [Google Scholar]
- Loss, A.; Toniolo, S.; Mazzi, A.; Manzardo, A.; Scipioni, A. LCA comparison of traditional open cut and pipe bursting systems for relining water pipelines. Resour. Conserv. Recycl. 2018, 128, 458–469. [Google Scholar] [CrossRef]
- Filion, Y.R.; MacLean, H.L.; Karney, B.W. Life-cycle energy analysis of a water distribution system. J. Infrastruct. Syst. 2004, 10, 120–130. [Google Scholar] [CrossRef] [Green Version]
- Venkatesh, G.; Brattebo, H. Energy consumption, costs and environmental impacts for urban water cycle services: Case study of Oslo (Norway). Energy 2011, 36, 792–800. [Google Scholar] [CrossRef]
- Chilana, L.; Bhatt, A.H.; Najafi, M.; Sattler, M. Comparison of carbon footprints of steel versus concrete pipelines for water transmission. J. Air Waste Manag. Assoc. 2016, 66, 518–527. [Google Scholar] [CrossRef] [PubMed] [Green Version]
- Ajdari, E. Volatile Organic Compound (VOC) Emission during Cured-in-Place-Pipe (CIPP) Sewer Pipe Rehabilitation. Ph.D. Thesis, University of New Orleans, New Orleans, LA, USA, 2016. [Google Scholar]
- Lueke, S.J.; Ariaratnam, T.S. Rehabilitation of underground infrastructure utilizing trenchless pipe replacement. Pract. Period Struct. Des. Constr. 2001, 6, 25–34. [Google Scholar] [CrossRef]
- Rameil, M. Handbook of Pipe Bursting Practice; Vulkan Verlag: Essen, Germany, 2007; ISBN 978-3802727504. [Google Scholar]
- Chirulli, R. Manuale di Tecnologie No-Dig Standard Edition; No-Dig Italy: Milan, Italy, 2011; ISBN 978-88-906098-0-0. [Google Scholar]
- Fröling, M.; Svanström, M. Life cycle assessment of the district heat distribution system, part 2: Network construction. Int. J. Life Cycle Assess 2005, 6, 425–435. [Google Scholar] [CrossRef]
- Maldikar, S. An Investigation of Productivity Loss Due to Outdoor Noise Conditions. Master’s Thesis, The University of Texas at Arlington, Arlington, TX, USA, 2010. [Google Scholar]
- Kamat, S.M. Comparison of Dust Generation from Open Cut and Trenchless Technology Methods for Utility Construction. Master’s Thesis, The University of Texas at Arlington, Arlington, TX, USA, 2011. [Google Scholar]
- Jung, Y.; Sinha, S. Evaluation of Trenchless Technology Methods for Municipal Infrastructure System. J. Infrastruct. Syst. 2007, 13, 144–156. [Google Scholar] [CrossRef]
- Bobylev, N. Comparative analysis of environmental impacts of selected underground construction technologies using the analytic network process. Autom. Constr. 2011, 20, 1030–1040. [Google Scholar] [CrossRef]
- Najafi, M. Pipeline Rehabilitation Systems for Service Life Extension—Chapter 10; University of Texas at Arlington: Arlington, TX, USA, 2011. [Google Scholar]
- Bottero, M.; Peila, D. The use of the analytic hierarchy process for the comparison between microtunneling and trench excavation. Tunn. Undergr. Space Technol. 2005, 20, 501–513. [Google Scholar] [CrossRef]
- Sterling, R.; Admiraal, H.; Bobylev, N.; Parker, H.; Godard, J.-P.; Vähäaho, I.; Rogers, C.D.F.; Shi, X.; Hanamura, T. Sustainability issues for underground space in urban areas. Proc. Inst. Civ. Eng. Urban Des. Plan. 2012, 165, 241–254. [Google Scholar] [CrossRef]
- Sihabuddin, S.; Ariaratnam, S.T. Quantification of Carbon Footprint on Underground Utility Projects. In Proceedings of the Construction Research Congress 2009: Building a Sustainable Future, Seattle, WA, USA, 5–7 April 2009; pp. 618–627. [Google Scholar]
- Kaushal, V.; Najafi, M.; Sattler, M.; Schug, K. Review of Literature on Chemical Emissions and Worker Exposures Associated with Cured-In-Place Pipe (CIPP) Installation. In Proceedings of the ASCE Pipelines 2019 Conference, Nashville, TN, USA, 21–24 July 2019. [Google Scholar]
- Howard, A. Pipeline Installation; Relativity Publishing: Lake Wood, CO, USA, 1996. [Google Scholar]
- Hashemi, B. Construction Cost of Underground Infrastructure Renewal: A Comparison of Traditional Open-Cut and Pipe Bursting Technology. Master’s Thesis, University of Texas at Arlington, Arlington, TX, USA, 2008. [Google Scholar]
- Monfared, M.A.N. Comparison of Trenchless Technologies and Open Cut Methods in New Residential Land Development. Master’s Thesis, University of Alberta, Edmonton, AB, Canada, 2018. [Google Scholar]
- ASCE. Guidelines for the Sustainable Design of Pipelines (Under Print); American Society of Civil Engineers (ASCE): Reston, VA, USA, 2019. [Google Scholar]
- Donaldson, B.M.; Baker, A. The Environmental Implications of Cured-in-Place Pipe Rehabilitation; VTRC 08-CR12; Virginia Transportation Research Council: Charlottesville, VA, USA, 2008. [Google Scholar]
- Kampbell, E. Understanding Environmental Implications of CIPP Rehab Technology. In Rehabilitation Technology, Underground Technology Cutting Edge Technical Information for Utility Construction and Rehabilitation; Underground Construction Magazine: Houston, TX, USA, 2009. [Google Scholar]
- Donaldson, B. Water Quality Implications of Culvert Repair Options: Vinyl Ester Based and Ultraviolet Cured-in-Place Pipe Liners; Virginia Center for Transportation Innovation & Research: Charlottesville, VA, USA, 2012.
- Heinselman, W. The History of Cured-in-Place-Pipe Lining in the United States, Express Sewer & Drain. Ph.D. Thesis, University of New Orleans University, New Orleans, LA, USA, 2012. [Google Scholar]
- Kozman, D.P. Evaluation of Cured-in-Place Pipe Allows Structural Renewal of Drinking Water Pipe; RS Technik LLC: Lake Mills, WI, USA, 2013. [Google Scholar]
- Das, S.; Bayat, A.; Gay, L.; Salimi, M.; Matthews, J. A Comprehensive Review on the Challenges of Cured-in-Place pipe (CIPP) Installations. J. Water Supply Res. Technol. AQUA 2016, 65, 583–596. [Google Scholar] [CrossRef]
- CUIRE. Evaluation of Potential Release of Organic Chemicals in the Steam Exhaust and Other Release Points during Pipe Rehabilitation Using the Trenchless Cured-In-Place Pipe (CIPP) Method (Final Report); NASSCO’s Phase 1 CIPP Steam Emissions Study; National Steel and Shipbuilding Company (NASSCO): San Diego, CA, USA, 2018. [Google Scholar]
- Zhao, J.Q.; Rajani, B. Construction and Rehabilitation Costs for Buried Pipe with a Focus on Trenchless Technologies (Final Report); Institute for Research in Construction National Research Council Canada: Ottawa, ON, Canada, 2002. [Google Scholar]
- Najafi, M. Pipeline Infrastructure Renewal and Asset Management; McGraw-Hill Education: New York, NY, USA, 2016. [Google Scholar]
- USEPA. Exhaust and Crankcase Emission Factors for Nonroad Engine Modeling Compression Ignition; Document No. EPA-420-R-10-018; Office of Transportation and Air Quality, U.S. Environmental Protection Agency (USEPA): Washington, DC, USA, 2010.
- Mohit, S.; Monfared, M.A.N.; Kang, C.; Bayat, A. Comparative study of greenhouse gas emissions from hand tunneling and pilot tube method underground construction methods. J. Green Build. 2017, 12, 54–69. [Google Scholar] [CrossRef]
- Tighe, S.; Lee, T.; McKim, R.; Haas, R. Traffic delay cost savings associated with trenchless technology. J. Infrastruct. Syst. 1999, 5, 45–51. [Google Scholar] [CrossRef]
- Tighe, S.; Knight, M.; Papoutsis, D.; Rodriguez, V.; Walker, C. User cost savings in eliminating pavement excavations through employing trenchless technologies. Can. J. Civ. Eng. 2002, 29, 751–761. [Google Scholar] [CrossRef]
- Gangavarapu, B.S. Analysis and Comparison of Traffic Disruption Using Open-Cut and Trenchless Methods of Pipe Installation; ProQuest Information and Learning Company: Ann Arbor, MI, USA, 2003. [Google Scholar]
- Najafi, M.; Kim, K.O. Life-Cycle-Cost Comparison of Trenchless and Conventional Open-Cut Pipeline Construction Projects. In Proceedings of the ASCE Pipeline Division Specialty Congress, San Diego, CA, USA, 1–4 August 2004. [Google Scholar]
- Atalah, A. Ground Movement in Hard Rock Conditions Related to Pipe Bursting. In Proceedings of the ASCE Pipelines 2004 Conference, San Diego, CA, USA, 1–4 August 2004. [Google Scholar]
- Piehl, R. Summary of Trenchless Technology for Use with USDA Forest Service Culverts; US Department of Agriculture, Forest Service, San Dimas Technology and Development Center: San Dimas, CA, USA, 2005.
- Khan, L.R.; Tee, K.F. Quantification and comparison of carbon emissions for flexible underground pipelines. Can. J. Civ. Eng. 2015, 42, 728–736. [Google Scholar] [CrossRef] [Green Version]
- International Organization for Standardization (ISO). Environmental Management-Life Cycle Assessment-Principles and Framework; ISO 14040: Geneva, Switzerland, 2006. [Google Scholar]
- Theis, T.; Tomkin, J. (Eds.) Sustainability-A Comprehensive Foundation. U of I Open Source Textbook Initiative. 2013. Available online: https://0-open-umn-edu.brum.beds.ac.uk/opentextbooks/textbooks/sustainability-a-comprehensive-foundation (accessed on 18 August 2019).
- PRé. Introduction to LCA with SimaPro. 2016. Available online: https://simapro.com (accessed on 17 August 2019).
- PRé. About SimaPro. Retrieved from SimaPro: 36T. 2019. Available online: https://simapro.com/36T (accessed on 18 August 2019).
- USEPA. Social Cost of Carbon; Office of Transportation and Air Quality, U.S. Environmental Protection Agency (USEPA): Washington, DC, USA, 2016.
- Solomon, S.; Albritton, D.L. Time-dependent ozone depletion potentials for short-and long-term forecasts. Nature 1992, 357, 33–37. [Google Scholar] [CrossRef]
- TRACI. Tool for the Reduction and Assessment of Chemical and Other Environmental Impacts TRACI 2.1: User’s Manual; SOP No. S-10637-OP-1-0; United States Environmental Protection Agency: Washington, DC, USA, 2012.
- USEPA. Collection Systems O7M Fact Sheet. USA USEPA, NR-009d 2010. In Exhaust and Crankcase Emission Factors for Nonroad Engine Modeling Compression Ignition; Document No. EPA-420-R-10-018; Office of Transportation and Air Quality, U.S. Environmental Protection Agency (USEPA): Washington, DC, USA, 1999. [Google Scholar]
- Rosenbaum, R.K.; Bachmann, T.M.; Gold, L.S.; Huijbregts, A.J.; Jolliet, O.; Juraske, R.; Koehler, A.; Larsen, H.F.; MacLeod, M.; Margni, M.; et al. USEtox—The UNEP-SETAC Toxicity Model: Recommended Characterisation Factors for Human Toxicity and Freshwater Ecotoxicity in Life Cycle Assessment. Int. J. Life Cycle Assess. 2008, 13, 532–546. [Google Scholar] [CrossRef] [Green Version]
- Hunt, D.V.L.; Nash, D.; Rogers, C.D.F. Sustainable utility placement via multi-utility tunnels. Tunn. Undergr. Space Technol. 2014, 39, 15–26. [Google Scholar] [CrossRef] [Green Version]
- Windsperger, A.; Steinlechner, S.; Schneider, F. Investigation of European Life Cycle Assessment Studies of Pipes Cycle Assessment Studies of Pipes Made of Different Materials for Water Supply and Sewer Systems—A Critical Comparison (Final Report Contracted by TEPPFA); The European Plastic Pipe and Fitting Association Institute for Industrial Ecology: St. Polten, Austria, 1999. [Google Scholar]
- Fei, D.; Gwendolyn, J.W.; Doosun, K.; Kevin, E.L.; Robert, G.A. Life cycle analysis for water and wastewater pipe materials. J. Environ. Eng. 2012, 139, 703–711. [Google Scholar]
- Clune, J.S.; Lockrey, S. Developing environmental sustainability strategies, the double diamond method of LCA and design thinking: A case study from aged care. J. Clean. Prod. 2014, 85, 67–82. [Google Scholar] [CrossRef]
- Russo, D.; Rizzi, C. Structural optimization strategies to design green products. Comput. Ind. 2014, 65, 470–479. [Google Scholar] [CrossRef]
- Perzon, M.; Johansson, K.; Fröling, M. Life cycle assessment of district heat distribution in suburban areas using PEX pipes insulated with expanded polystyrene. Int. J. Life Cycle Assess. 2007, 5, 317–327. [Google Scholar] [CrossRef]
- Lee, H. Cost Comparison of Pipeline Asset Replacement: Open-Cut and Pipe-Bursting. Master’s Thesis, Michigan State University, East Lansing, MI, USA, 2006. [Google Scholar]
- Lee, H.; Najafi, M.; Matthys, J. Cost Comparison of Pipeline Asset Replacement: Open-Cut and Pipe-Bursting. In Proceedings of the ASCE Pipelines 2007 Conference, Boston, MA, USA, 8–11 July 2007. [Google Scholar]
- Lee, R.K. Risk Associated with CIPP Lining of Stormwater Pipes and the Release of Styrene. In Proceedings of the North American Society for Trenchless Technology (NASTT) NO-DIG Conference, NASTT, Dallas, TX, USA, 27 April–2 May 2008; p. E-1-05. [Google Scholar]
- Rudolph, L.; Harrison, C. A Physician’s Guide to Climate Change, Health and Equity; Public Health Institute: Oakland, CA, USA, 2016; Available online: http://climatehealthconnect.org/wp-content/uploads/2016/09/FullGuideTEMP.pdf (accessed on 18 August 2019).
- Trenchless Technology Center (TTC). NASSCO CIPP Emissions Phase 2: Evaluation of Air Emissions from Polyester Resin CIPP with Steam Cure. In Final Report; NASSCO: San Diego, CA, USA, 2020. [Google Scholar]
- Joshi, A. A Carbon Dioxide Comparison of Open Cut and Pipe Bursting. Master’s Thesis, Bowling Green State University, Bowling Green, OH, USA, 2012. [Google Scholar]
- Kaushal, V.; Najafi, M.; Sattler, M.; Schug, K. Evaluation of Potential Release of Organic Chemicals in the Steam Exhaust and Other Release Points during Pipe Rehabilitation Using the Trenchless Cured-In-Place Pipe (CIPP) Method. In Processing North American Society for Trenchless Technology (NASTT) No-Dig Conference; North American Society for Trenchless Technology (NASTT): Chicago, IL, USA, 2019. [Google Scholar]
- Kaushal, V.; Iyer, G.; Najafi, M.; Sattler, M.; Schug, K. Review of Literature for Cured-in-Place Pipe (CIPP) Chemical Emissions and Worker Exposures. In Proceedings of the Transportation Research Board Annual Meeting, Washington, DC, USA, 13–17 January 2019. [Google Scholar]
© 2020 by the authors. Licensee MDPI, Basel, Switzerland. This article is an open access article distributed under the terms and conditions of the Creative Commons Attribution (CC BY) license (http://creativecommons.org/licenses/by/4.0/).


