Inspection and Assessment of Corrosion in Pretensioned Concrete Bridge Girders Exposed to Coastal Climate

 , and
, and
Abstract
:1. Introduction
2. Theoretical Background
2.1. Concrete Cover and Critical Chloride Content
2.2. Concrete Resistivity
2.3. Half-Cell Potential Mapping
2.4. Combining NDT Methods
2.5. Combining NDT with DT Methods
2.6. Investigations of Corrosion in Pretensioned Girders
3. Field Investigation of Dalselv Bridge
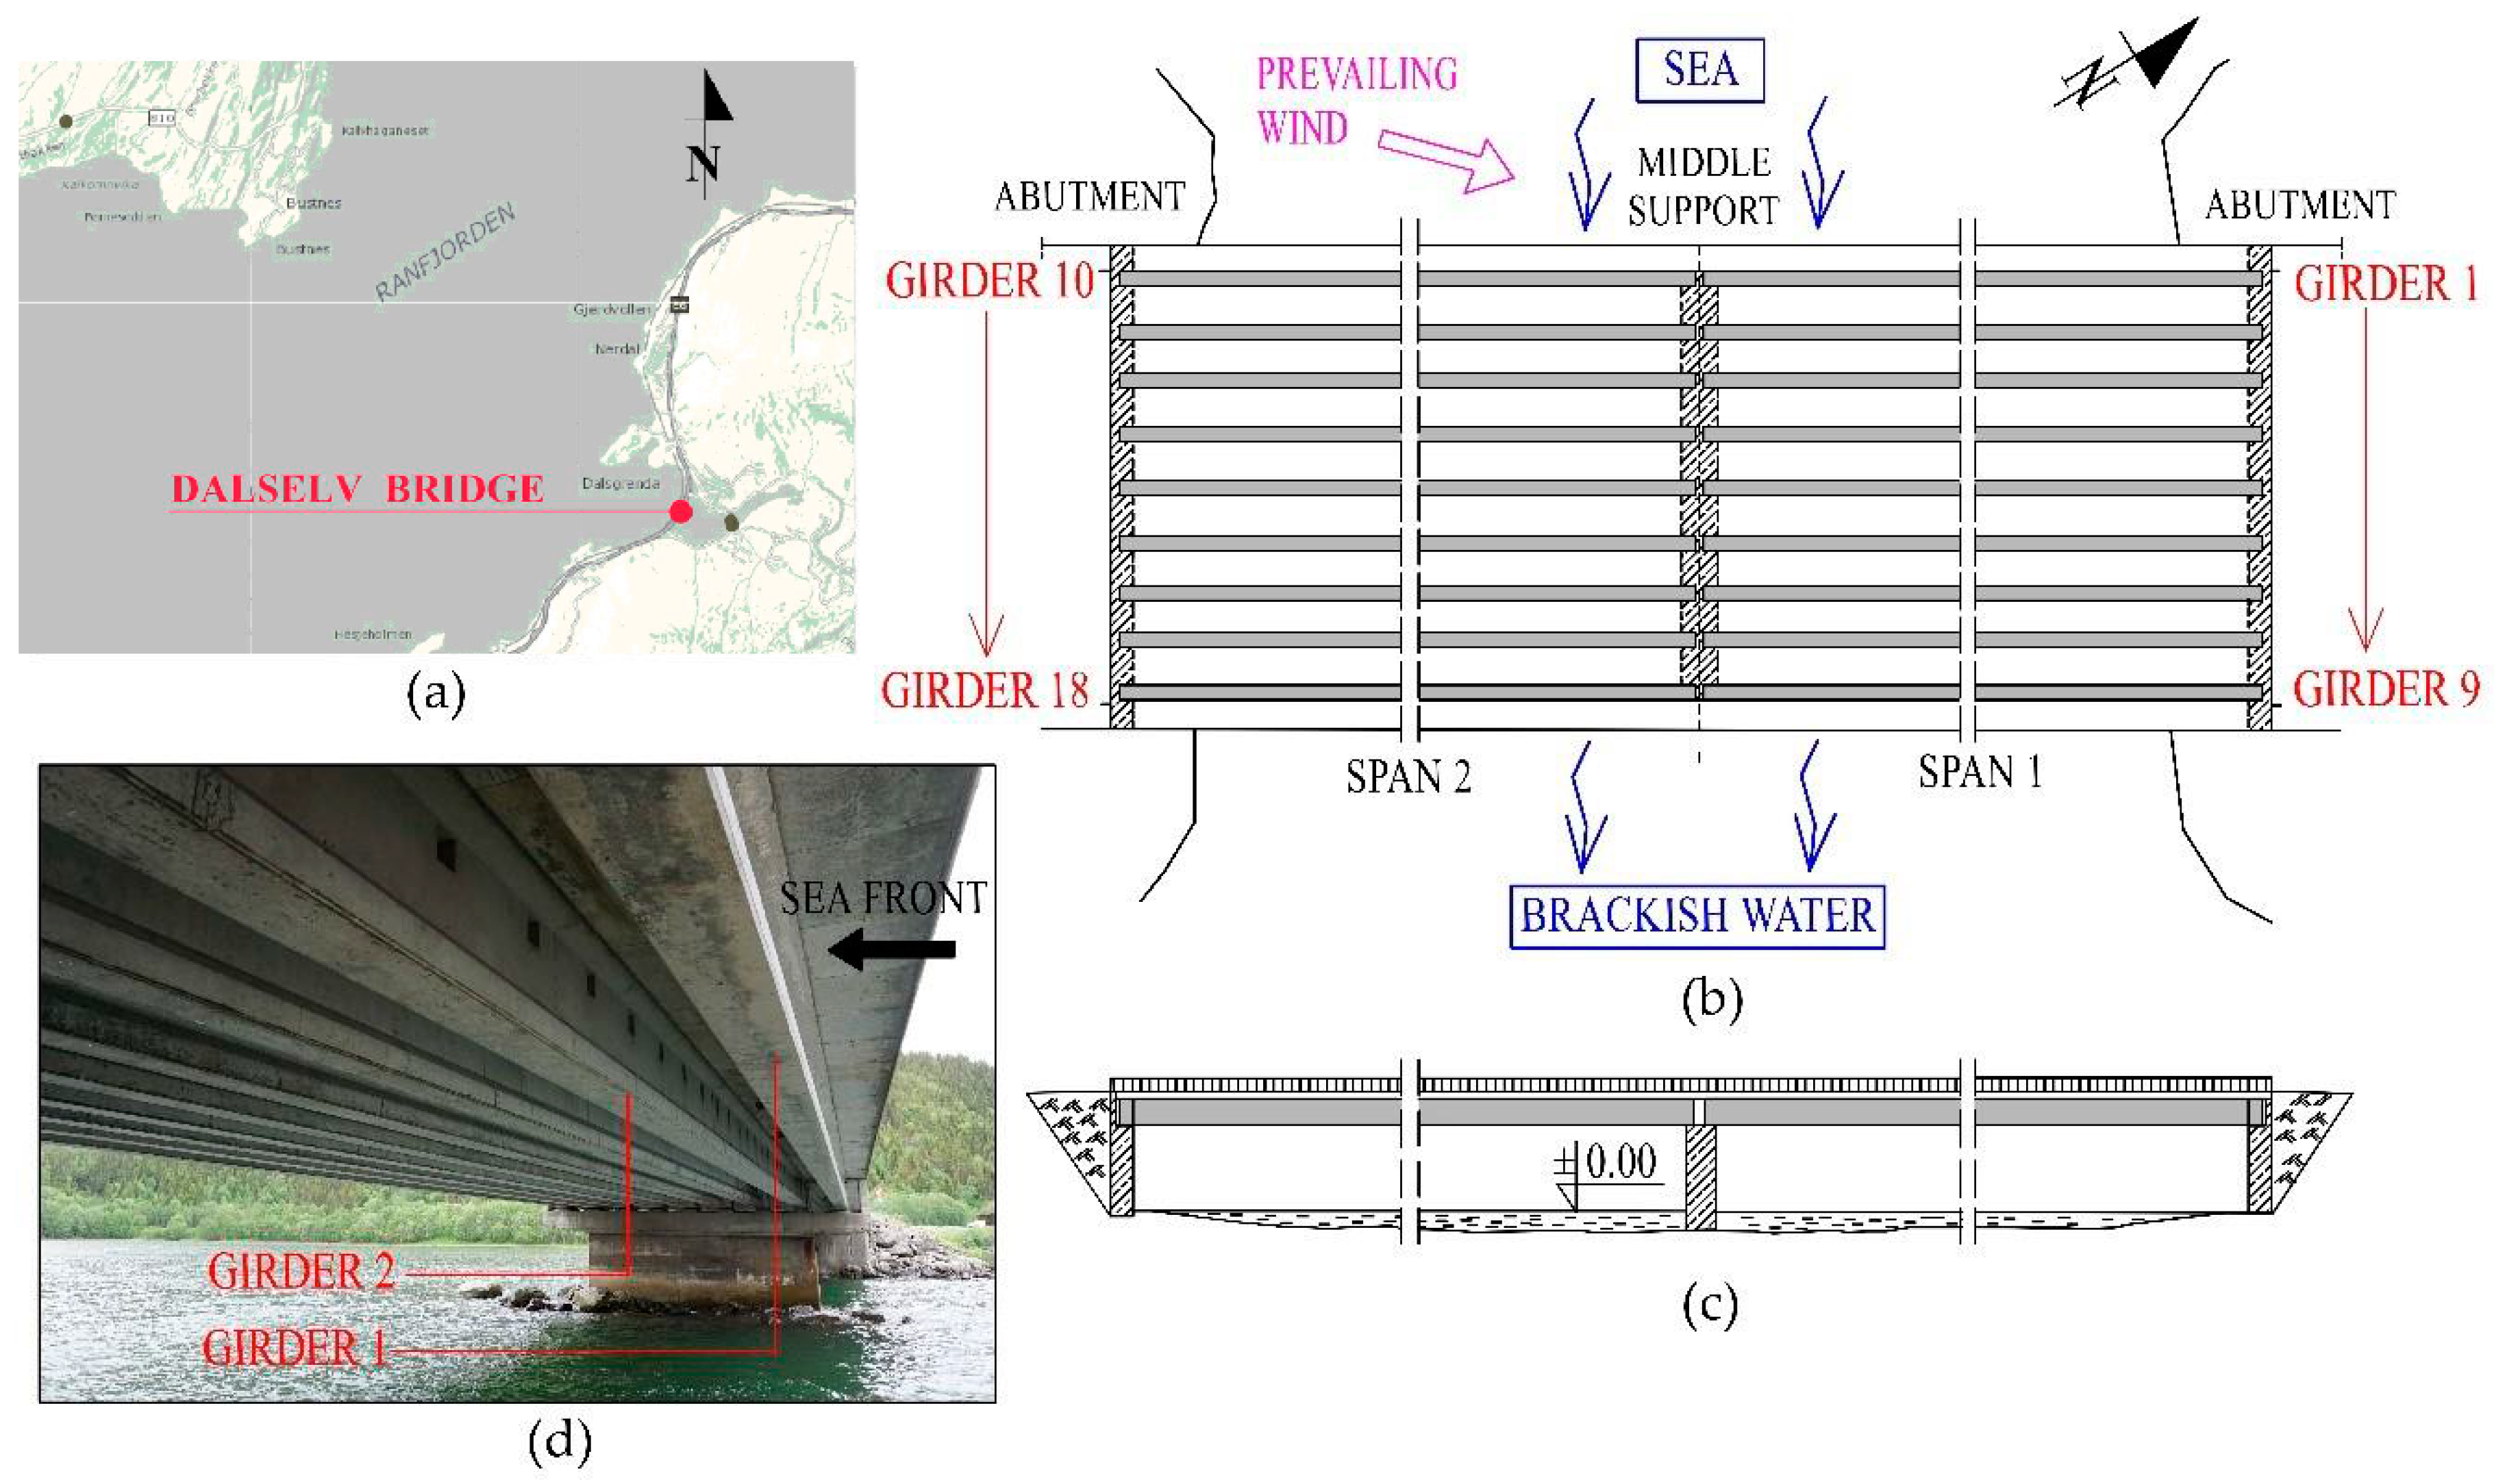
3.1. Bridge Details
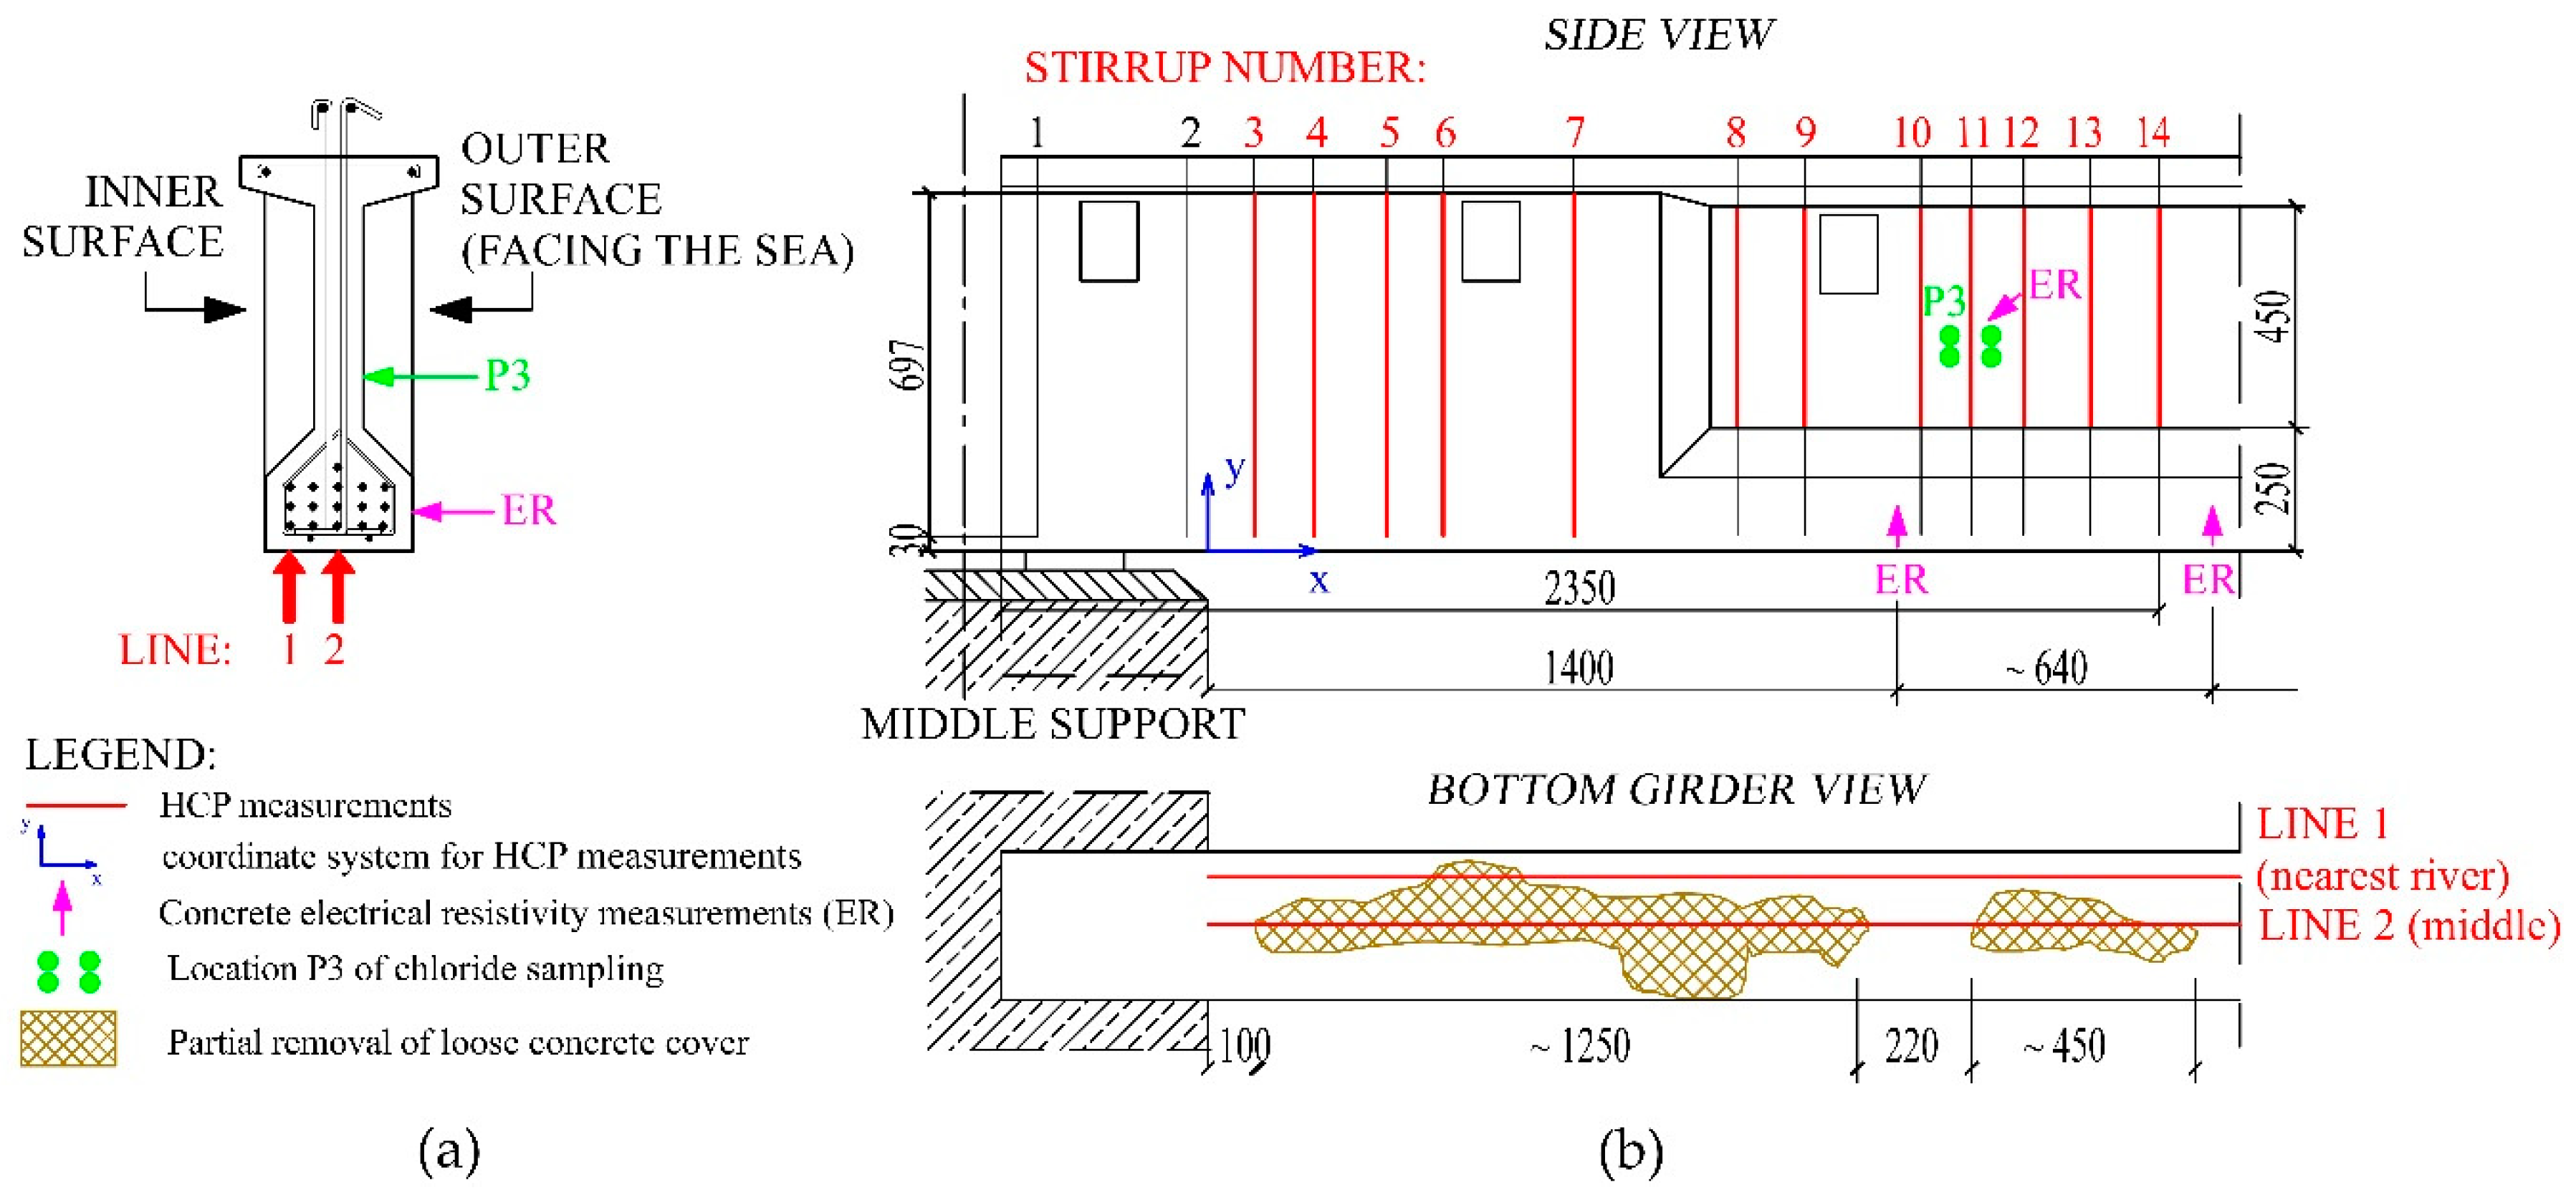
3.2. Inspection and Test Methods
3.2.1. Concrete Resistivity and Half-Cell Potentials
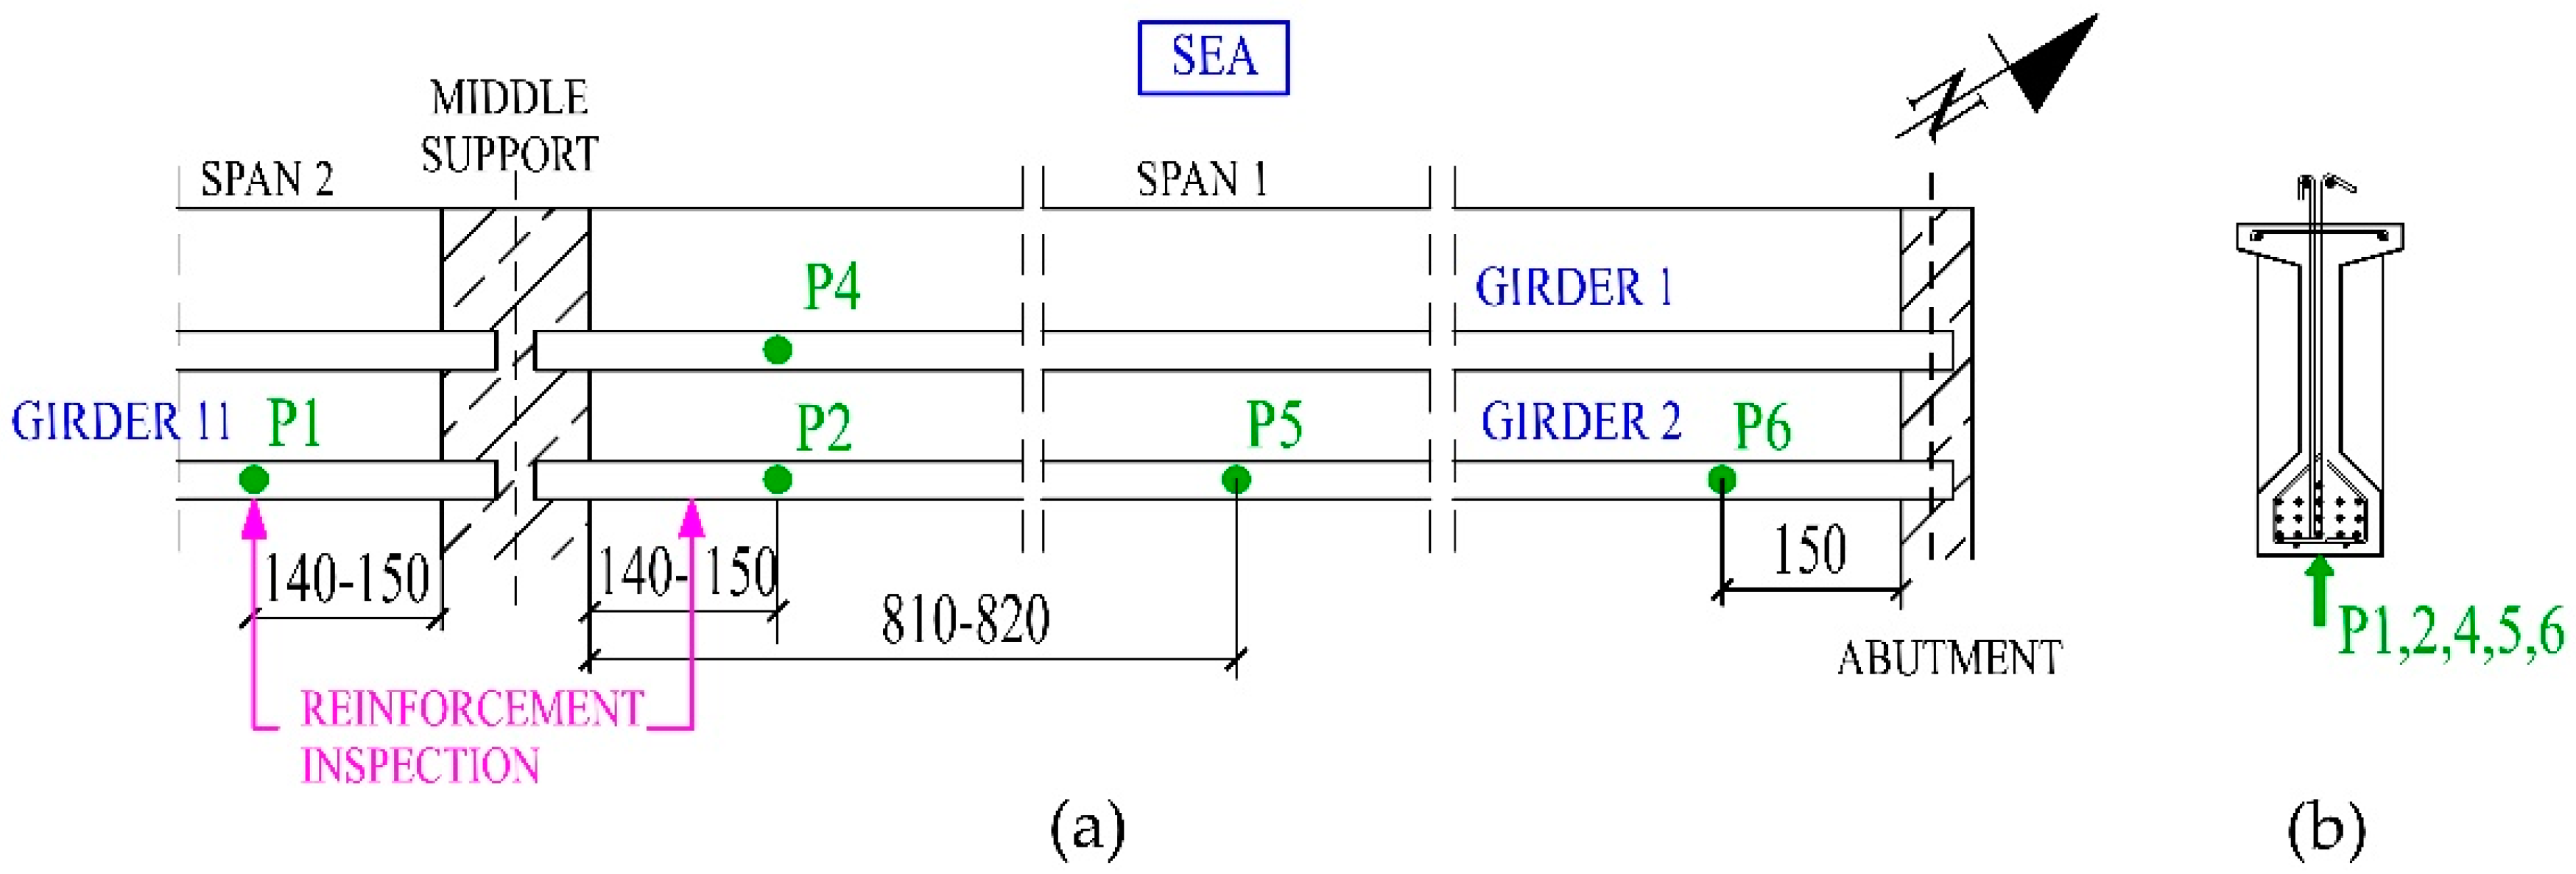
3.2.2. Chloride Concentrations and Reinforcement Inspection
4. Results from the Field Investigation
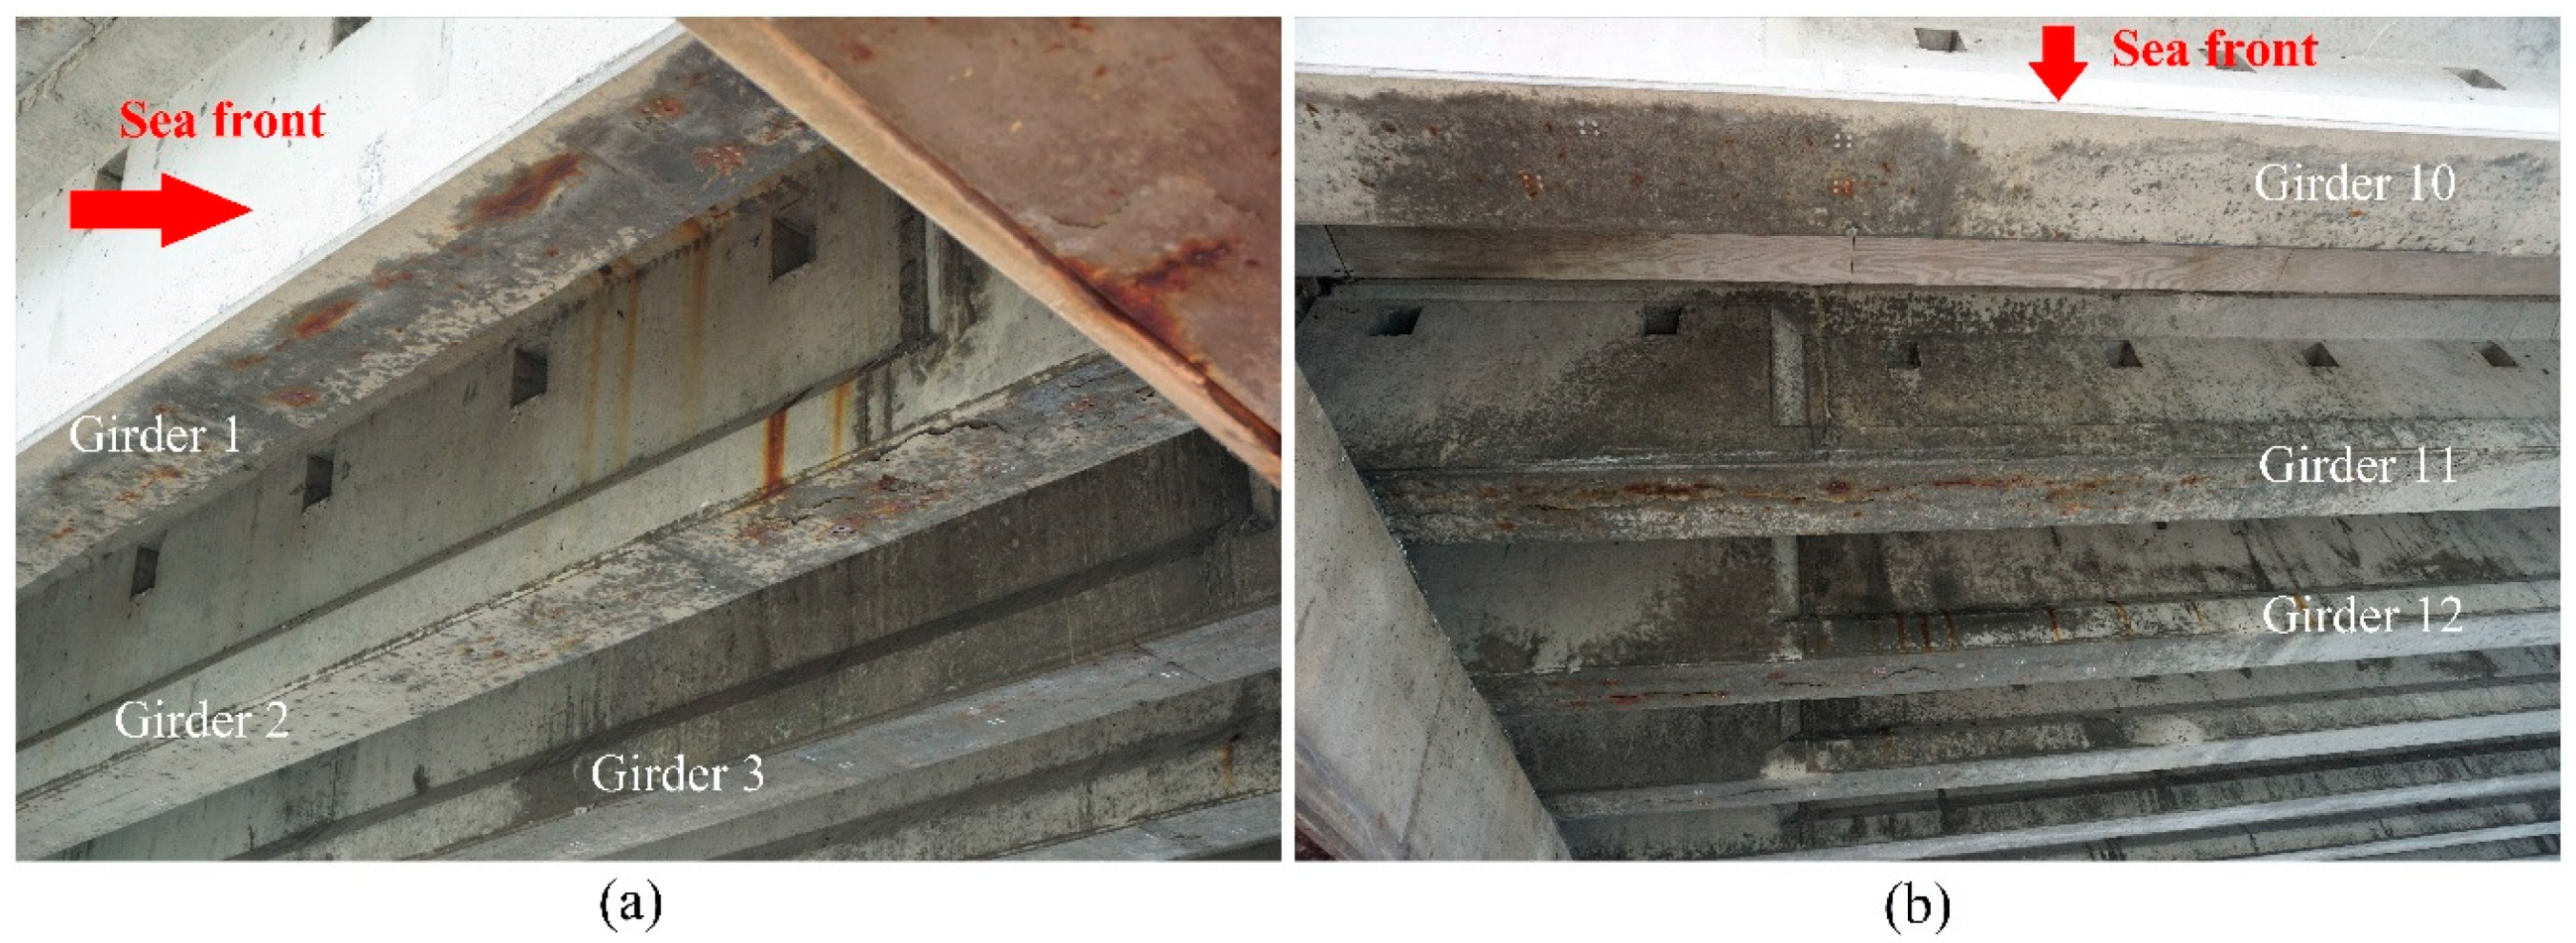
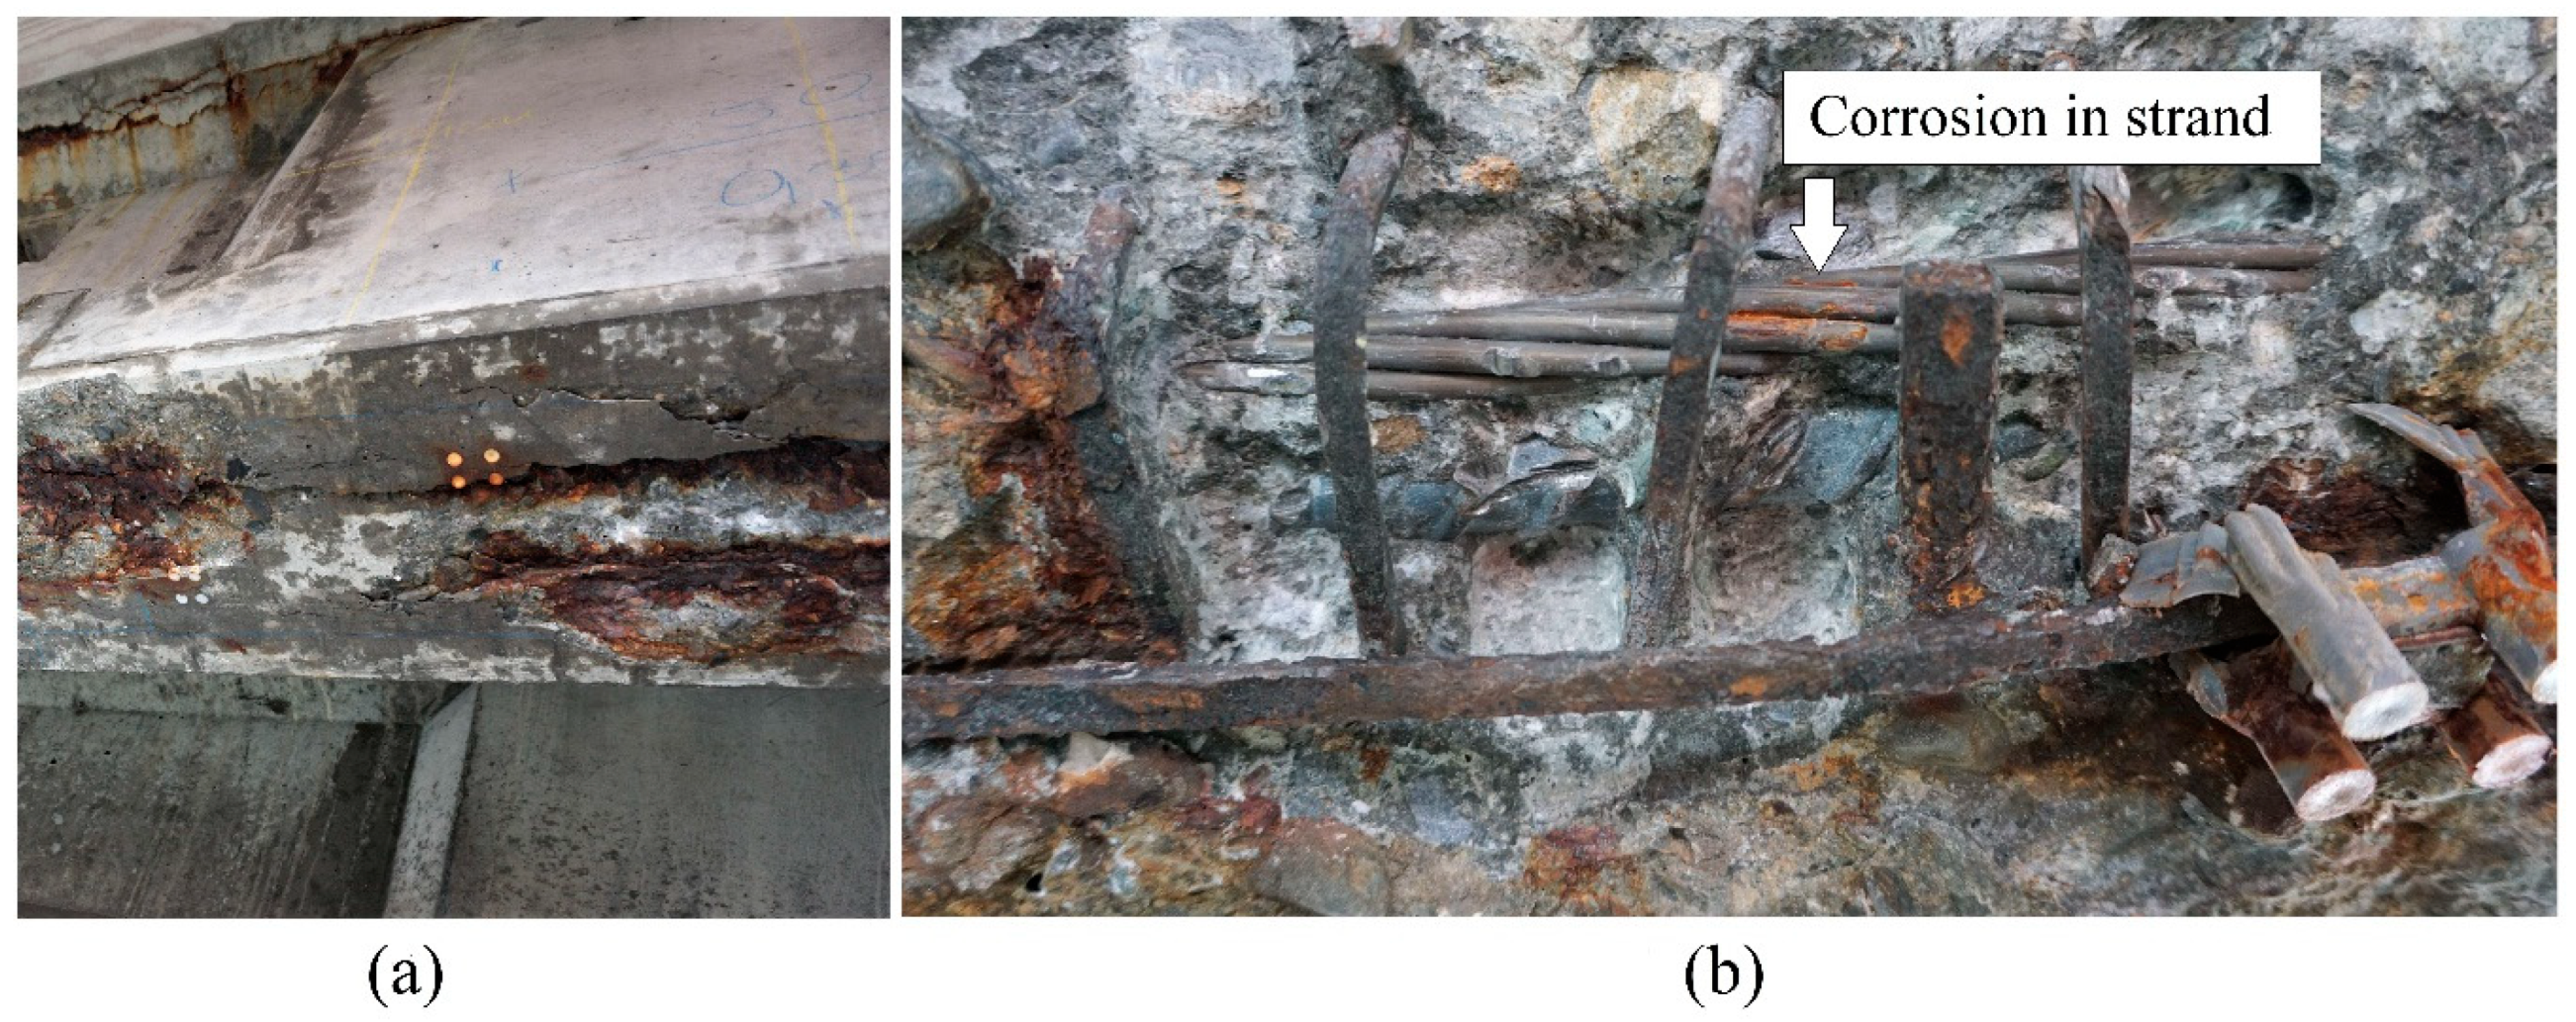
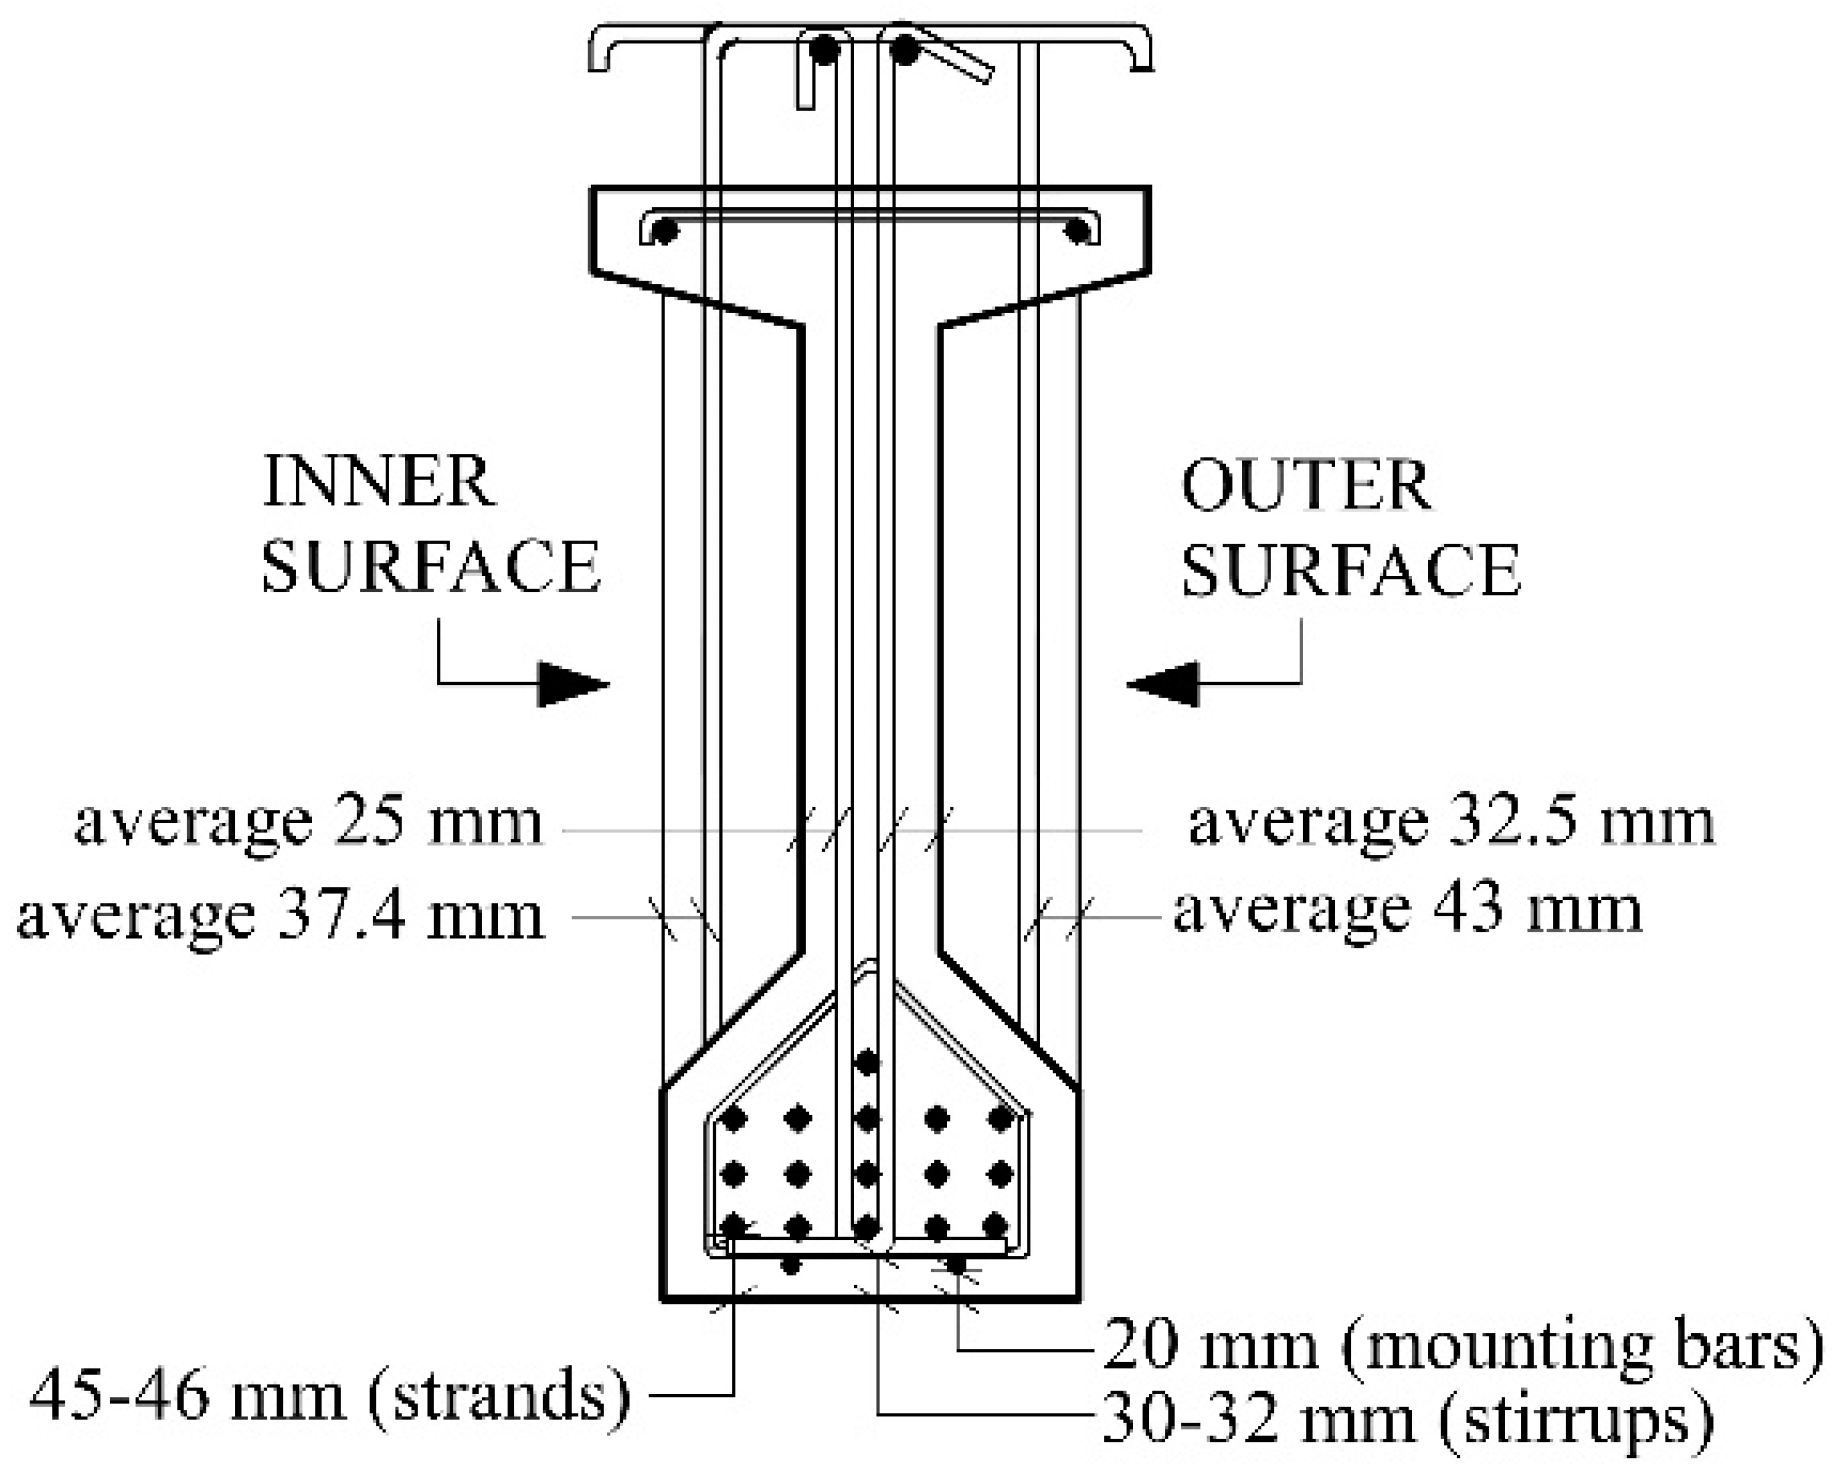
4.1. Visual Observations and Cover Thickness
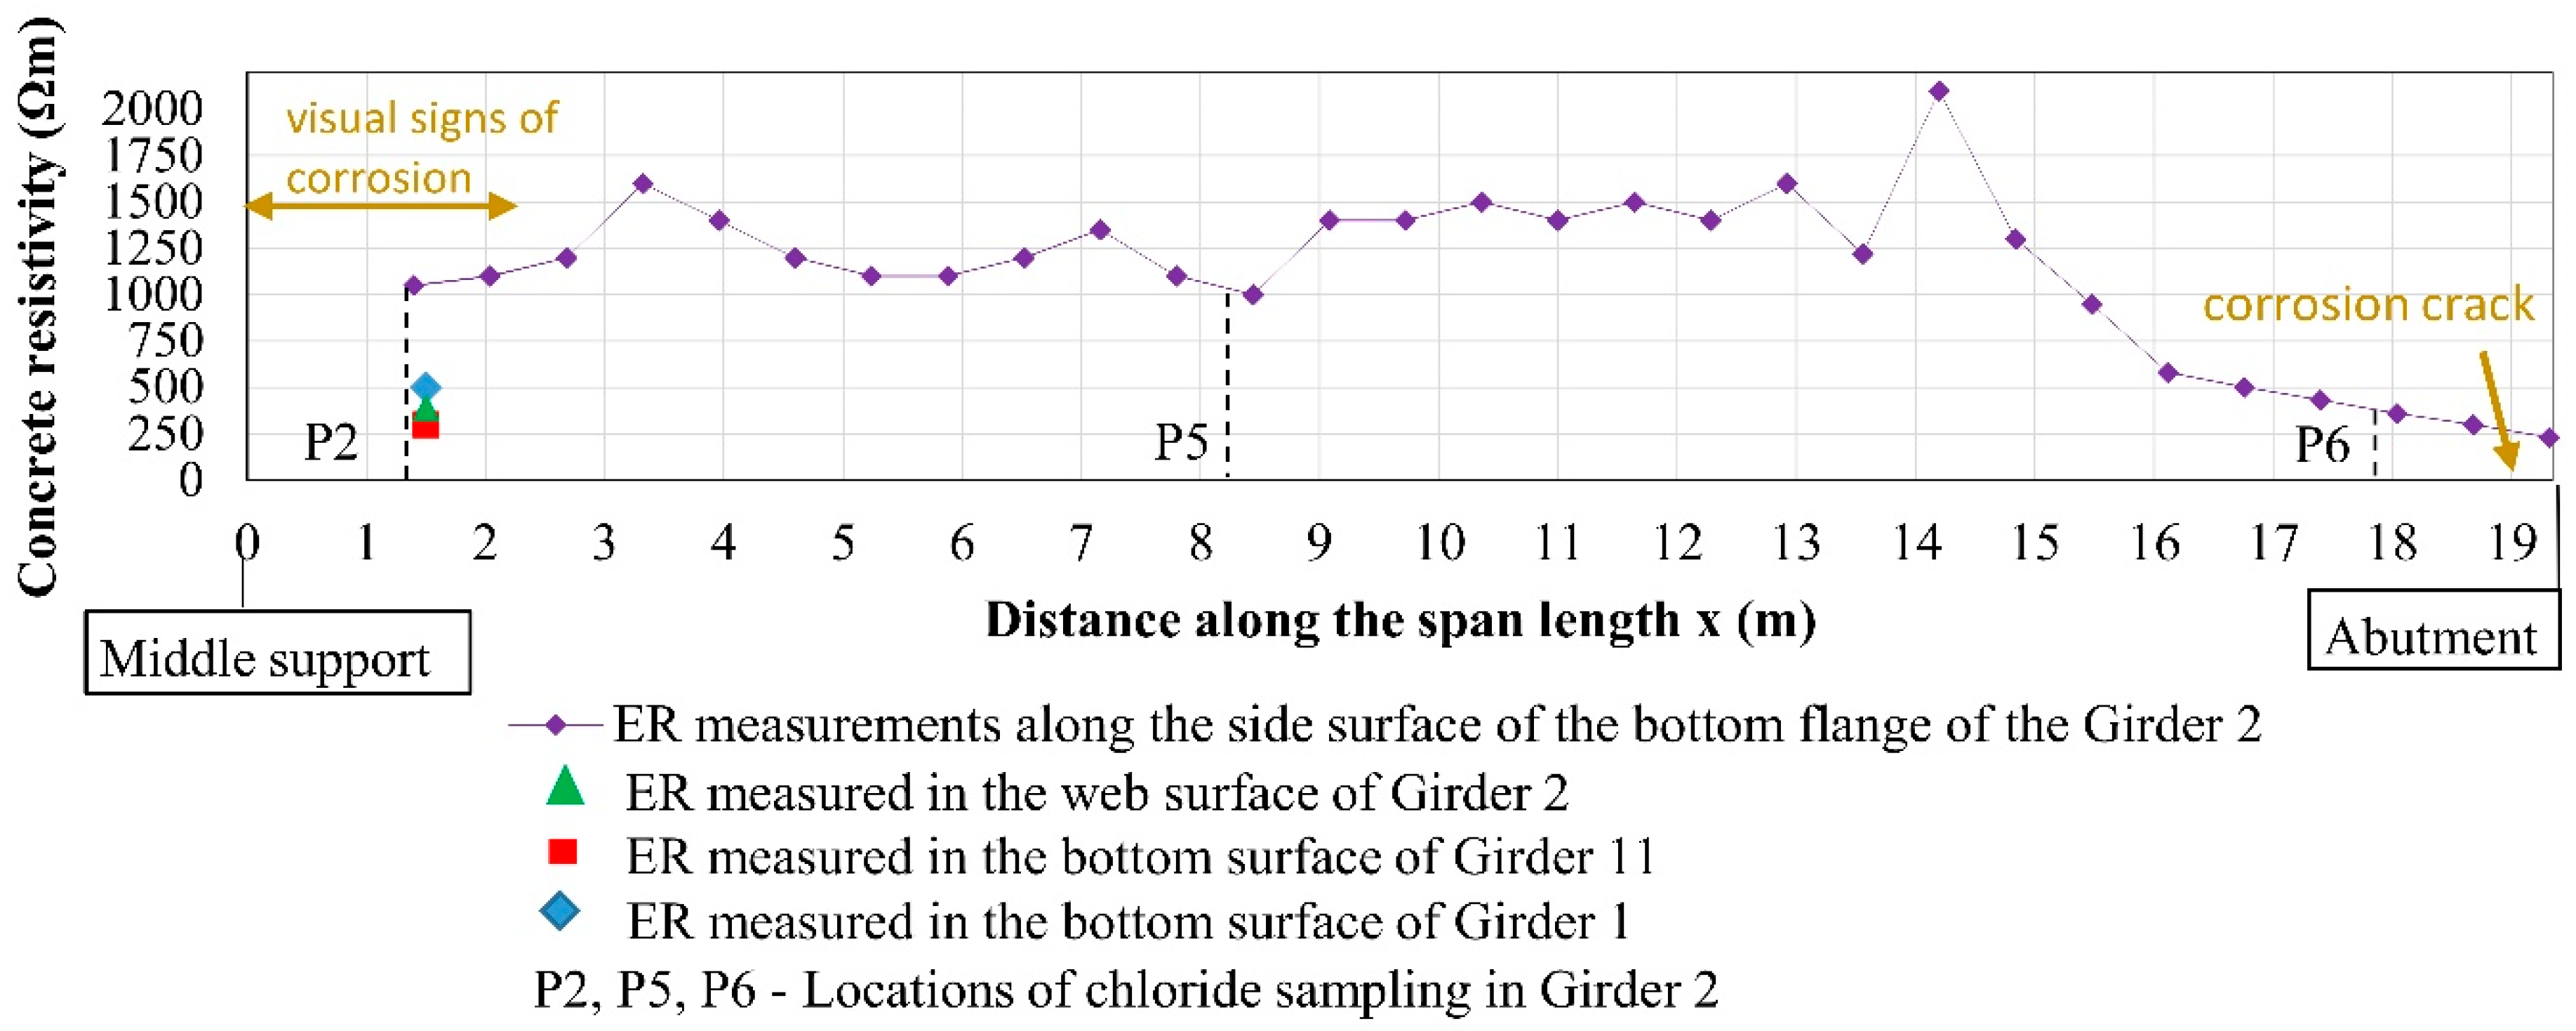
4.2. Concrete Resistivity
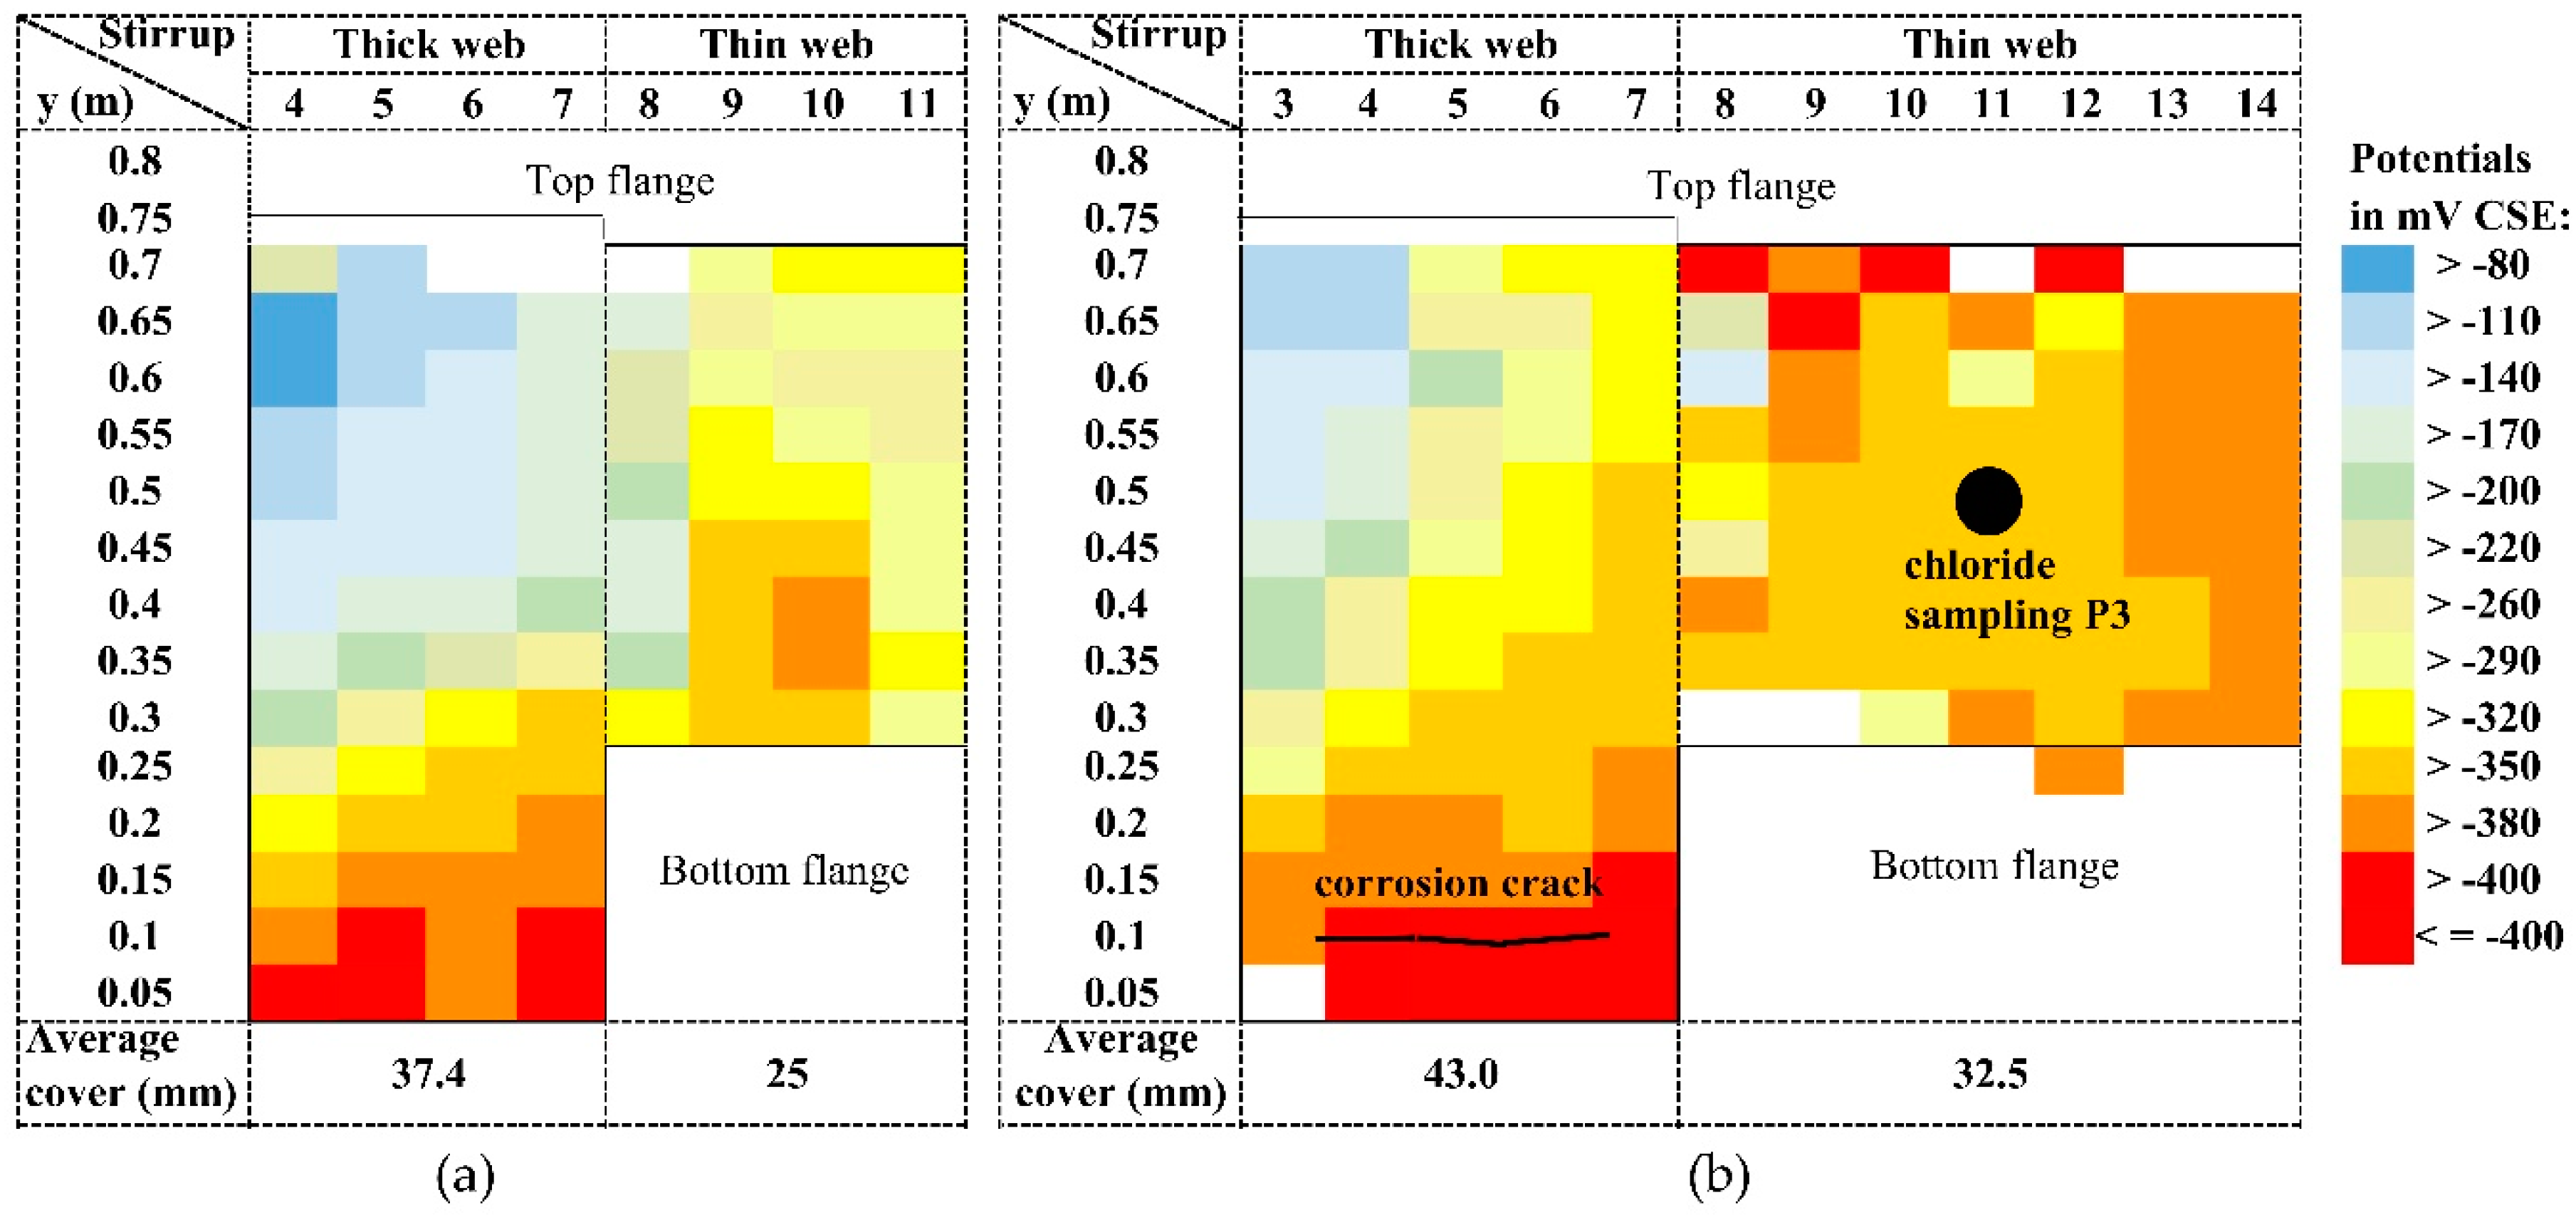
4.3. Half-Cell Potentials
4.4. Chloride Concentrations
5. Discussion
5.1. Environmental Exposure along the Girder
5.2. Assessment of Corrosion Probability
5.2.1. Based on HCP and ER Measurements
5.2.2. Based on Chloride Test Results
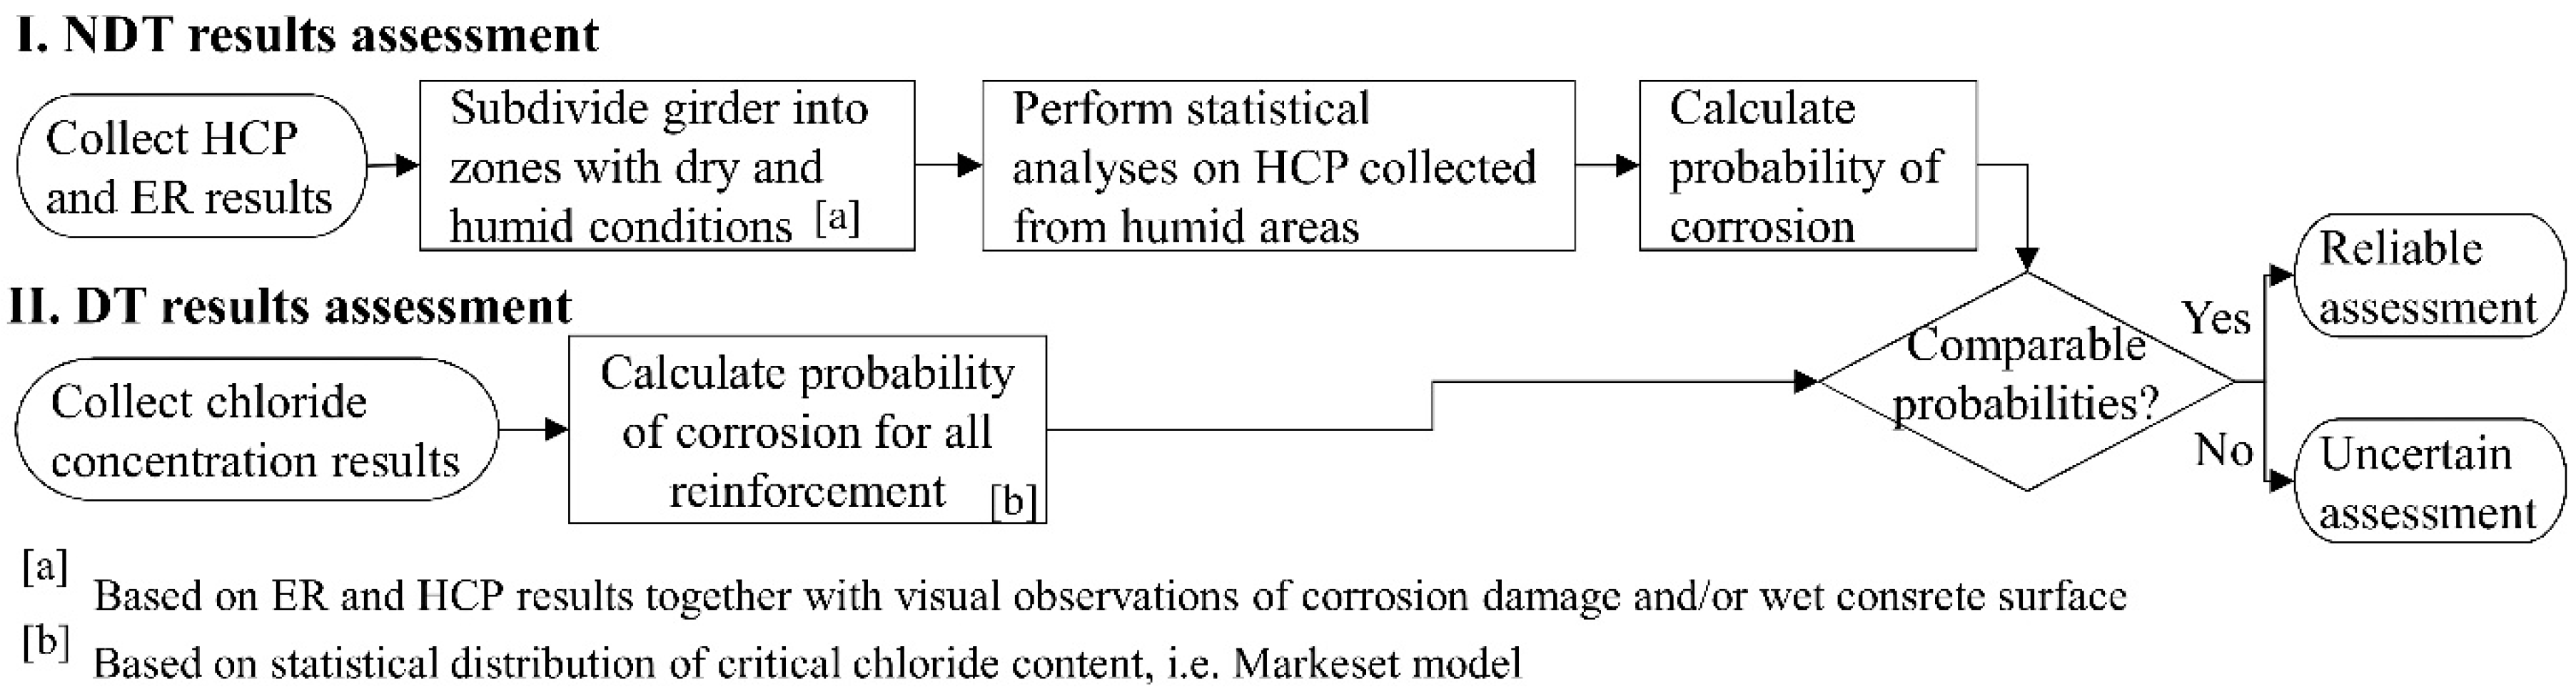
5.3. Combining NDT with DT Results
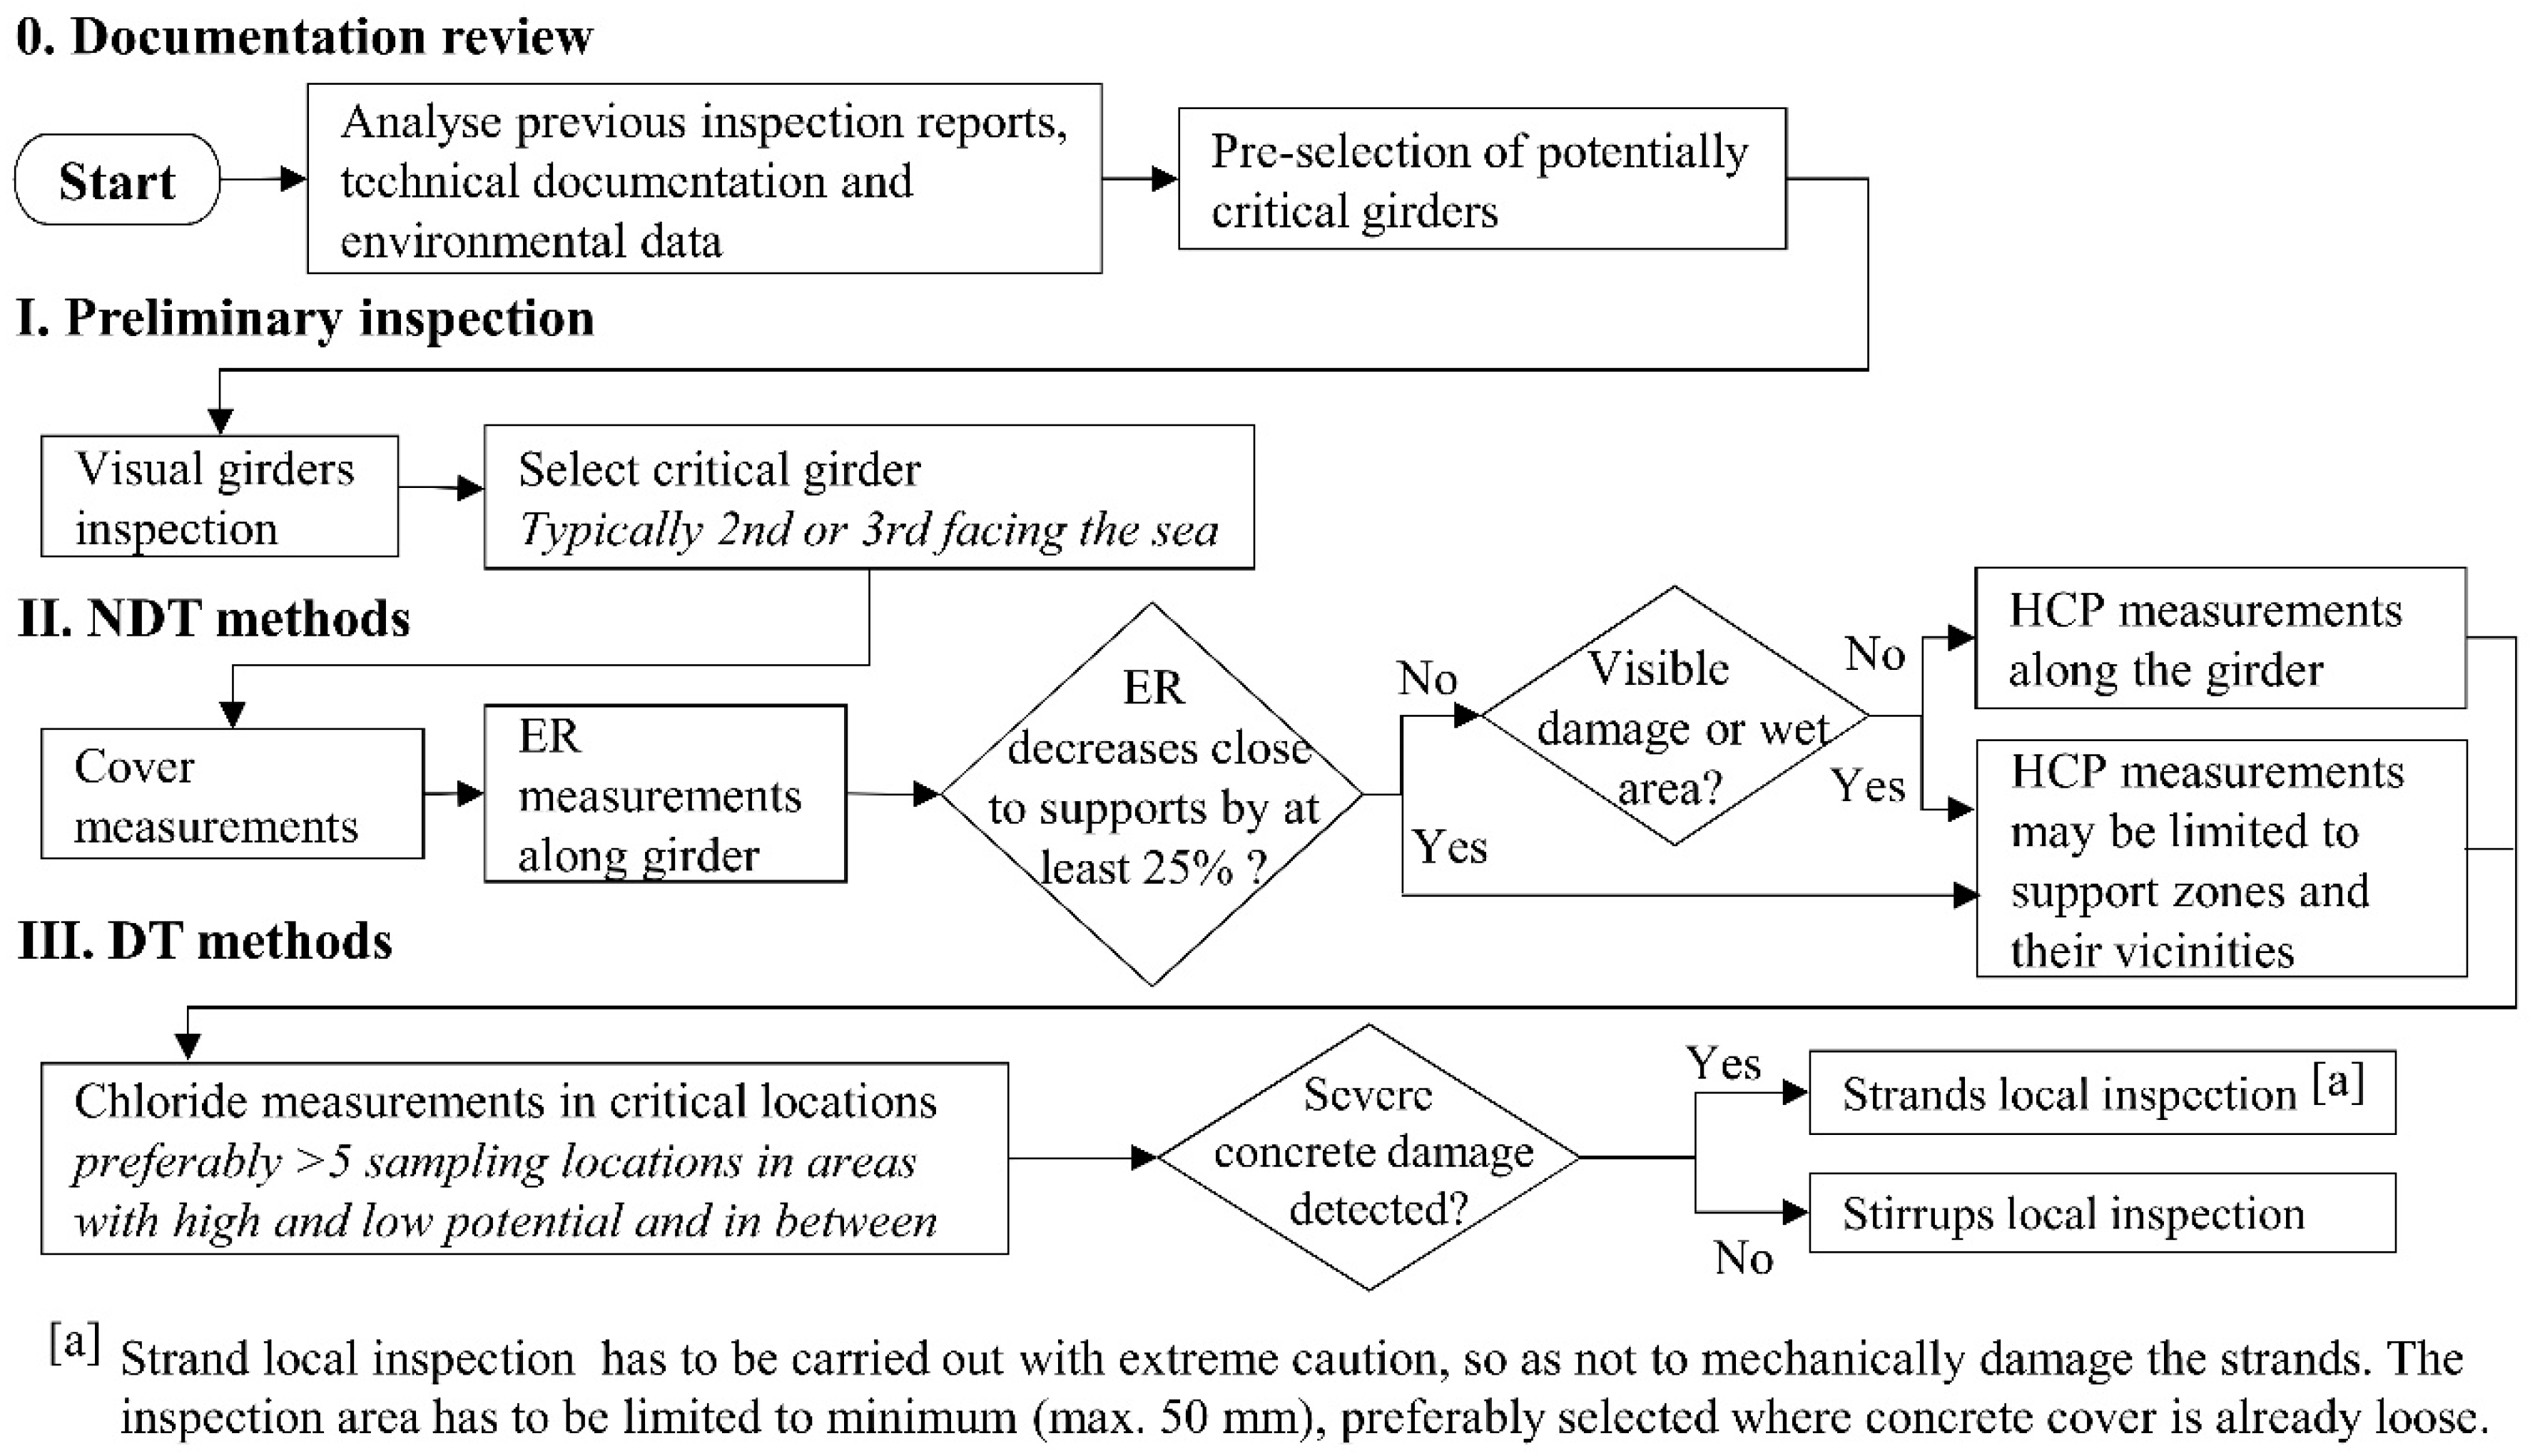
6. Procedure for Inspection and Assessment of Pretensioned Girders
7. Conclusions and Recommendations
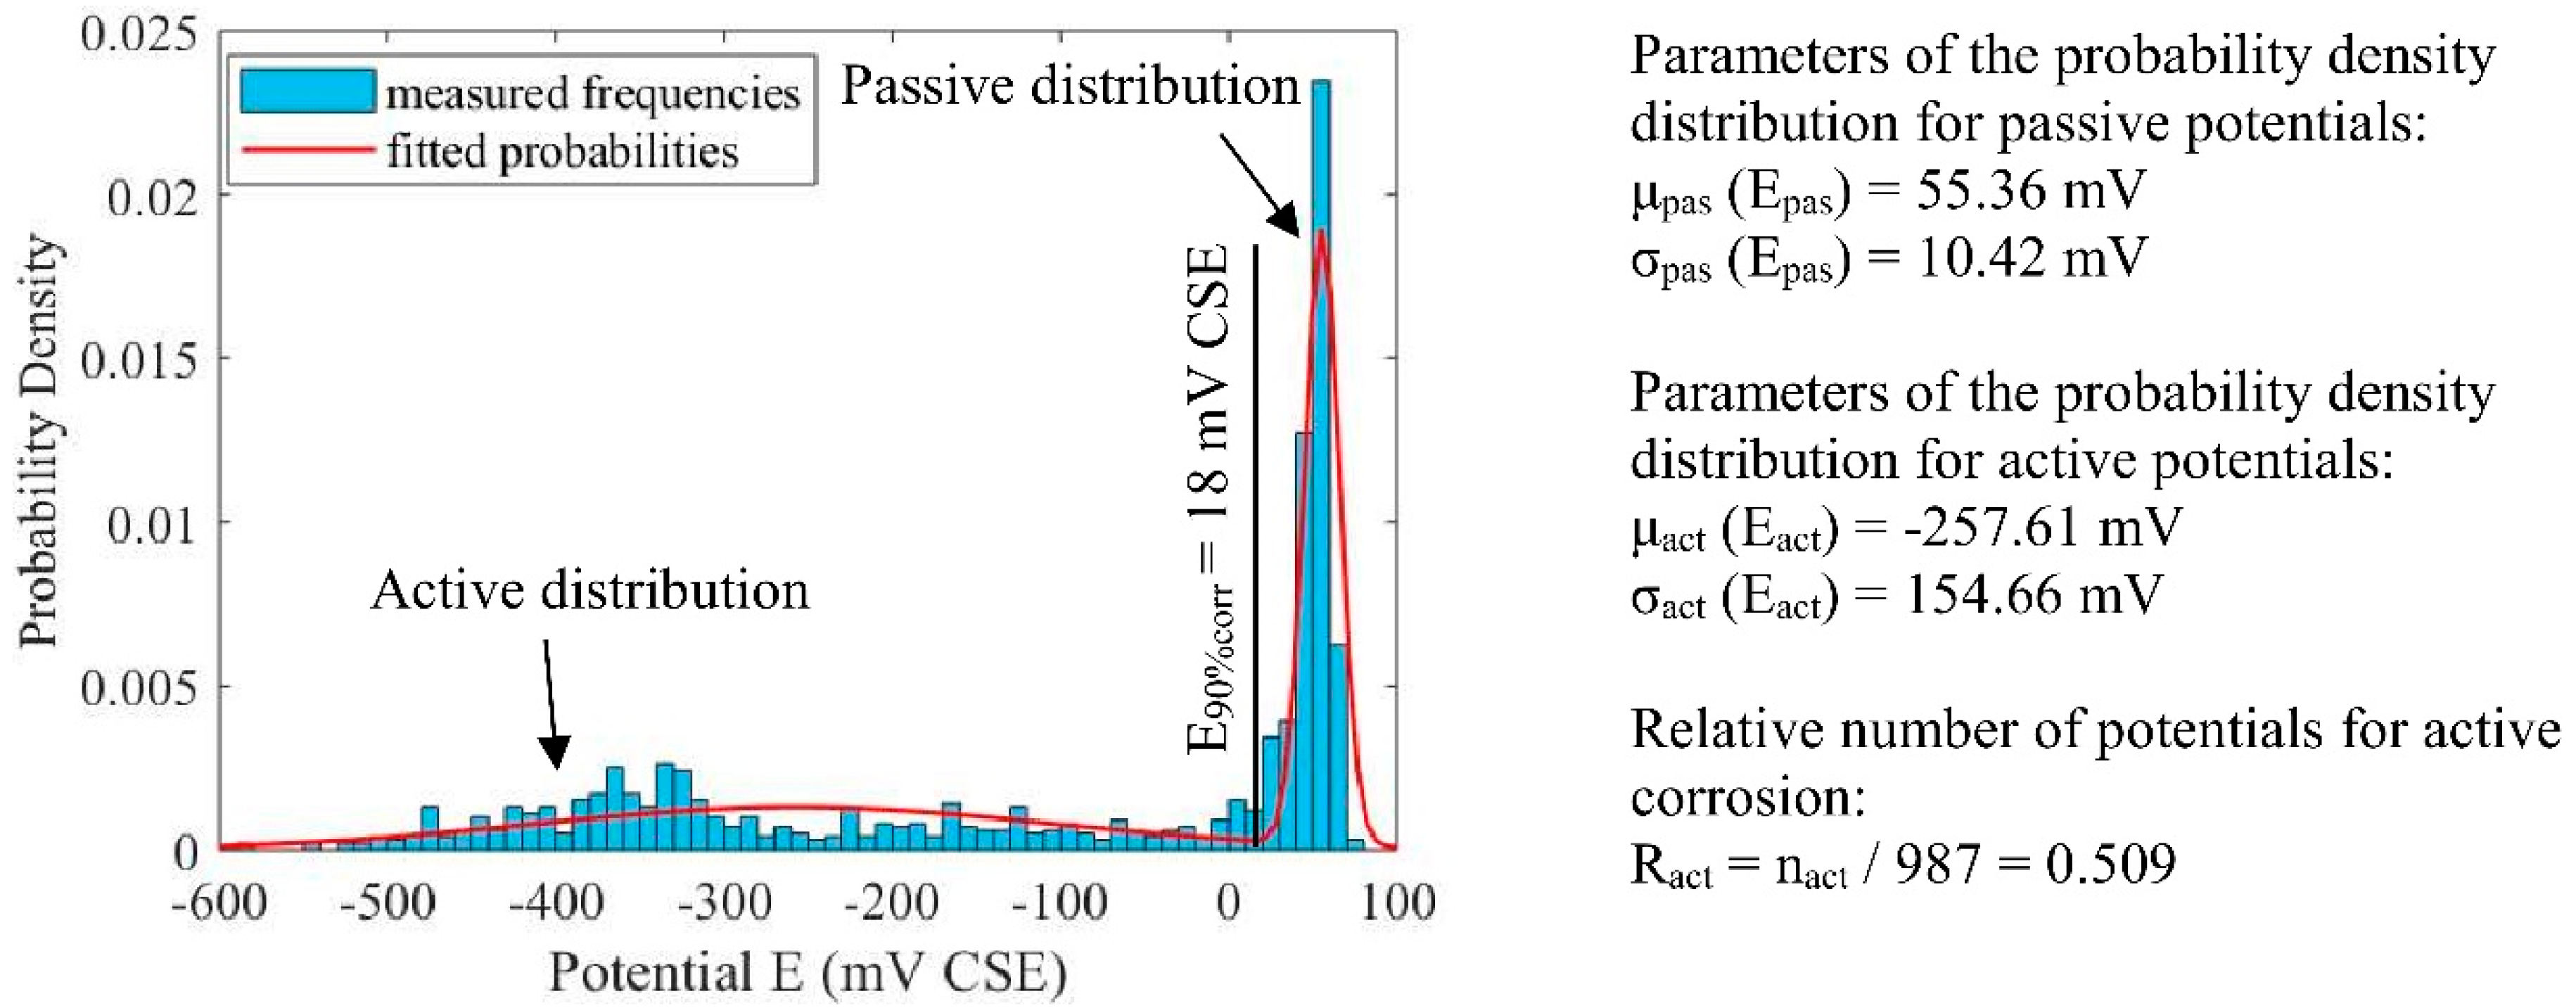
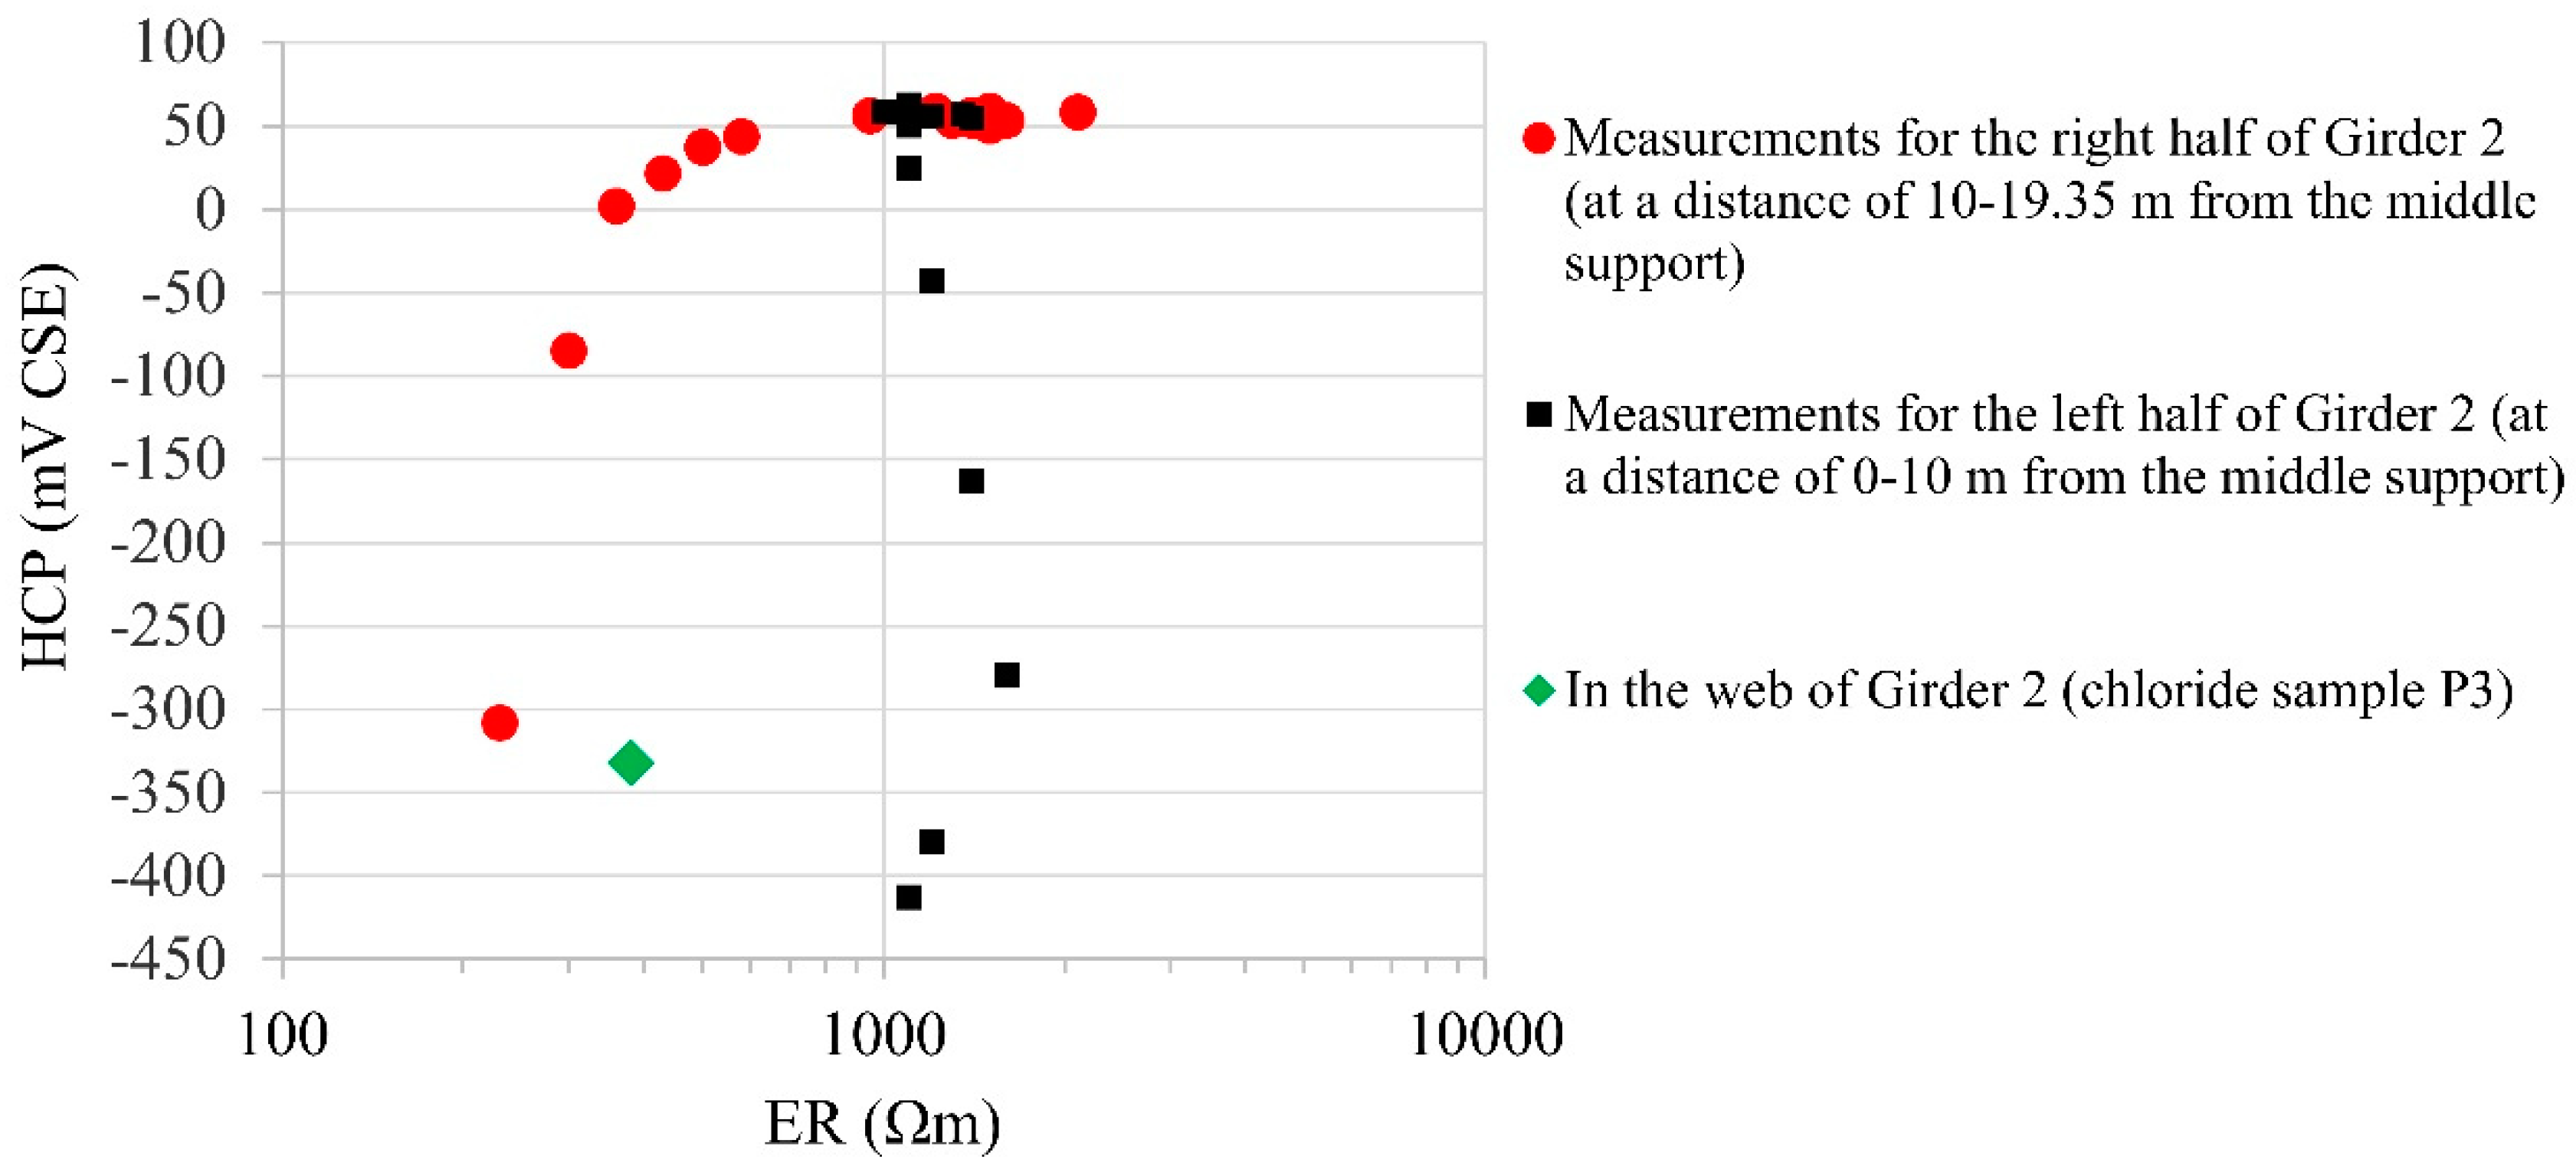
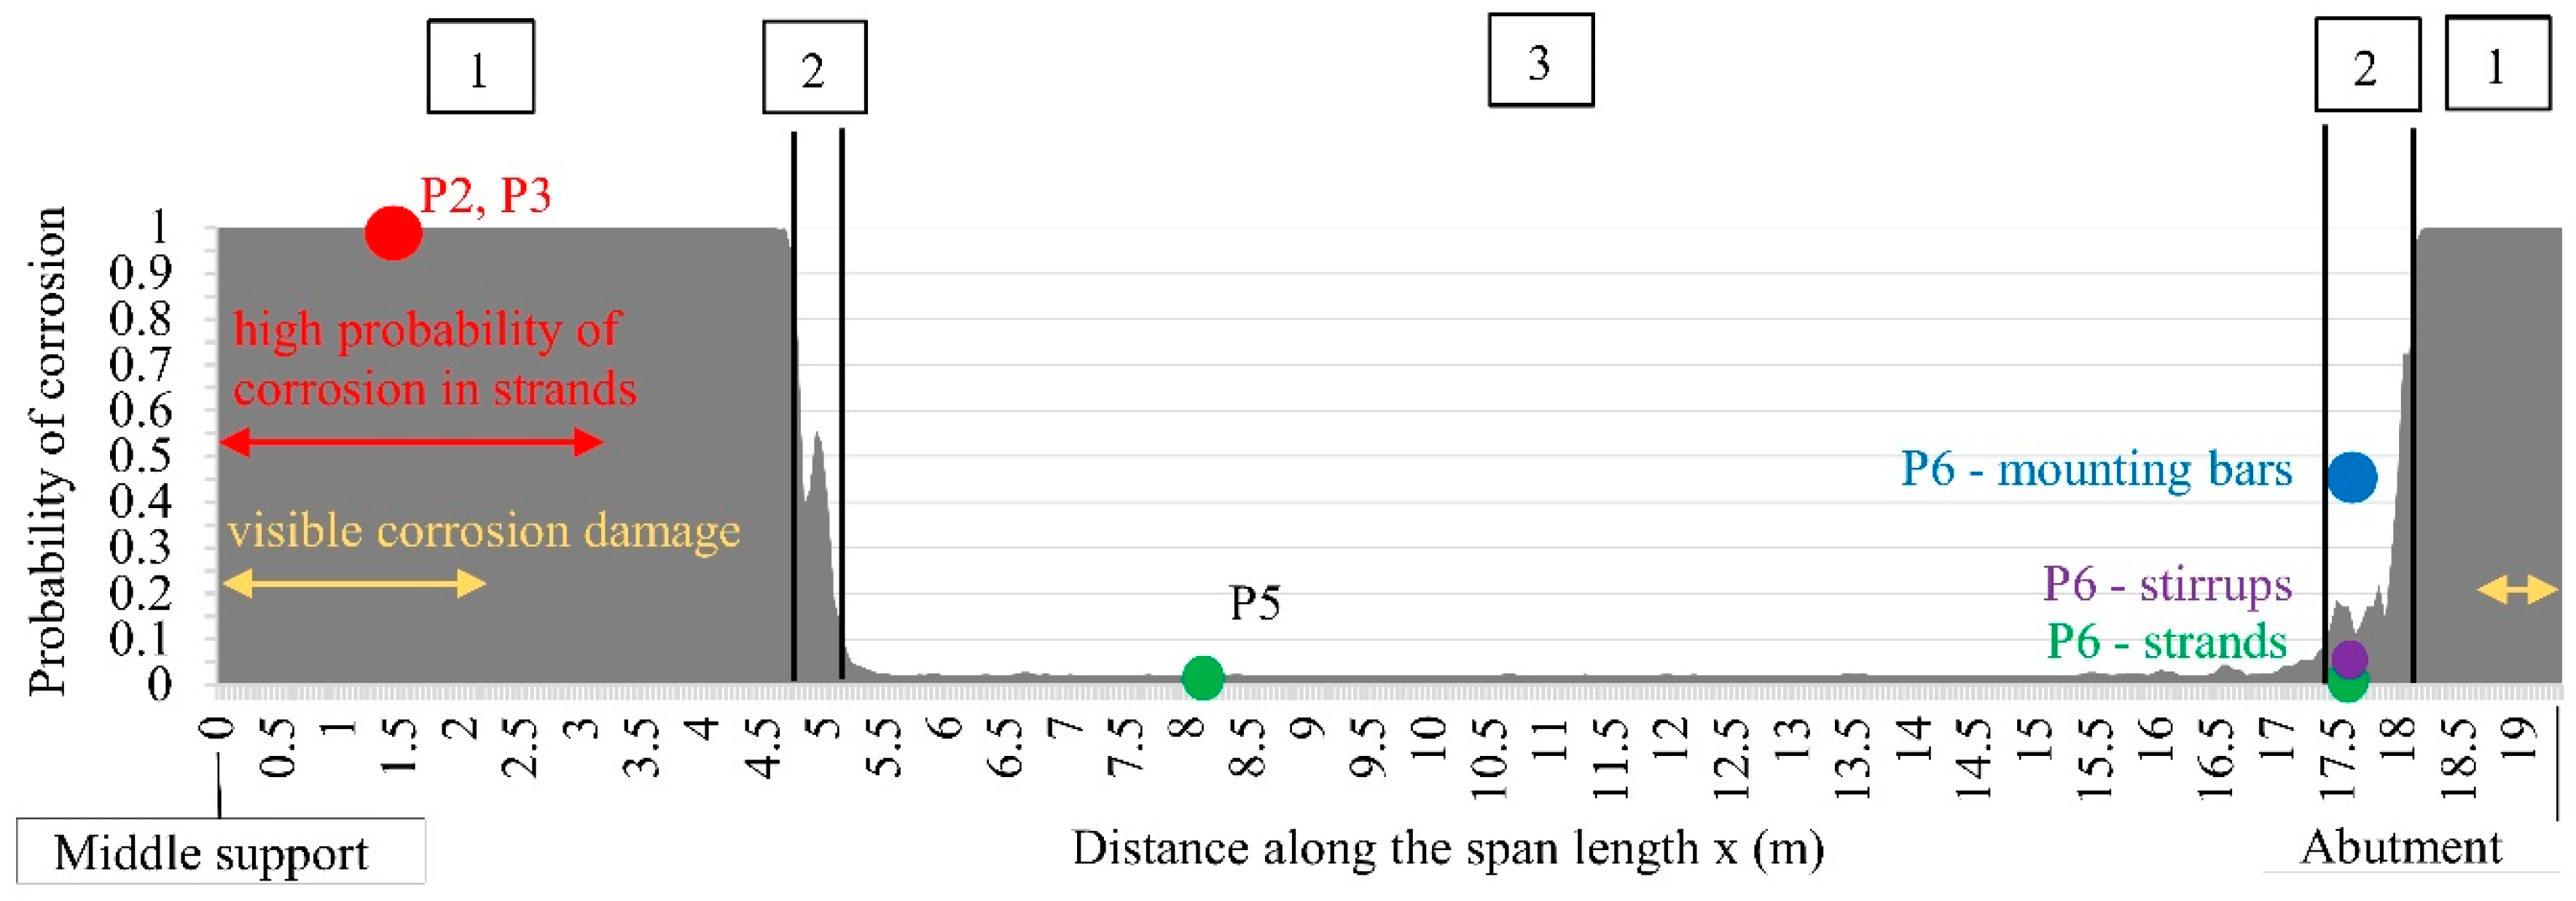
- Corrosion probability assessed on the basis of statistical analysis of HCP collected from areas with comparable moisture conditions was in good agreement with corrosion probability assessed on the basis of chloride concentrations. The combination of methods described in Section 6 enables reliable assessment of areas with varying corrosion probability. The zones with high corrosion probability extended beyond the visible corrosion damage, which indicates this approach can detect reinforcement corrosion before it is visible on the concrete surface. Although general areas with varying corrosion probabilities can be reliably estimated, the actual condition of the strands can only be found by removing concrete cover.
- The HCP method could not distinguish corrosion probability between closely spaced strands and other types of electrically connected reinforcement in the bottom flange of a girder (e.g., stirrups and mounting bars).
- Numerical criteria for corrosion probability assessment based on HCP given in ASTM C876 and for ER given in RILEM TC 154-EMC significantly underestimated areas with high corrosion probability in the case investigated. We cannot therefore recommend sole reliance on such absolute potential and resistivity thresholds in corrosion assessment. Moreover, we found HCP measurements to be more reliable than ER.
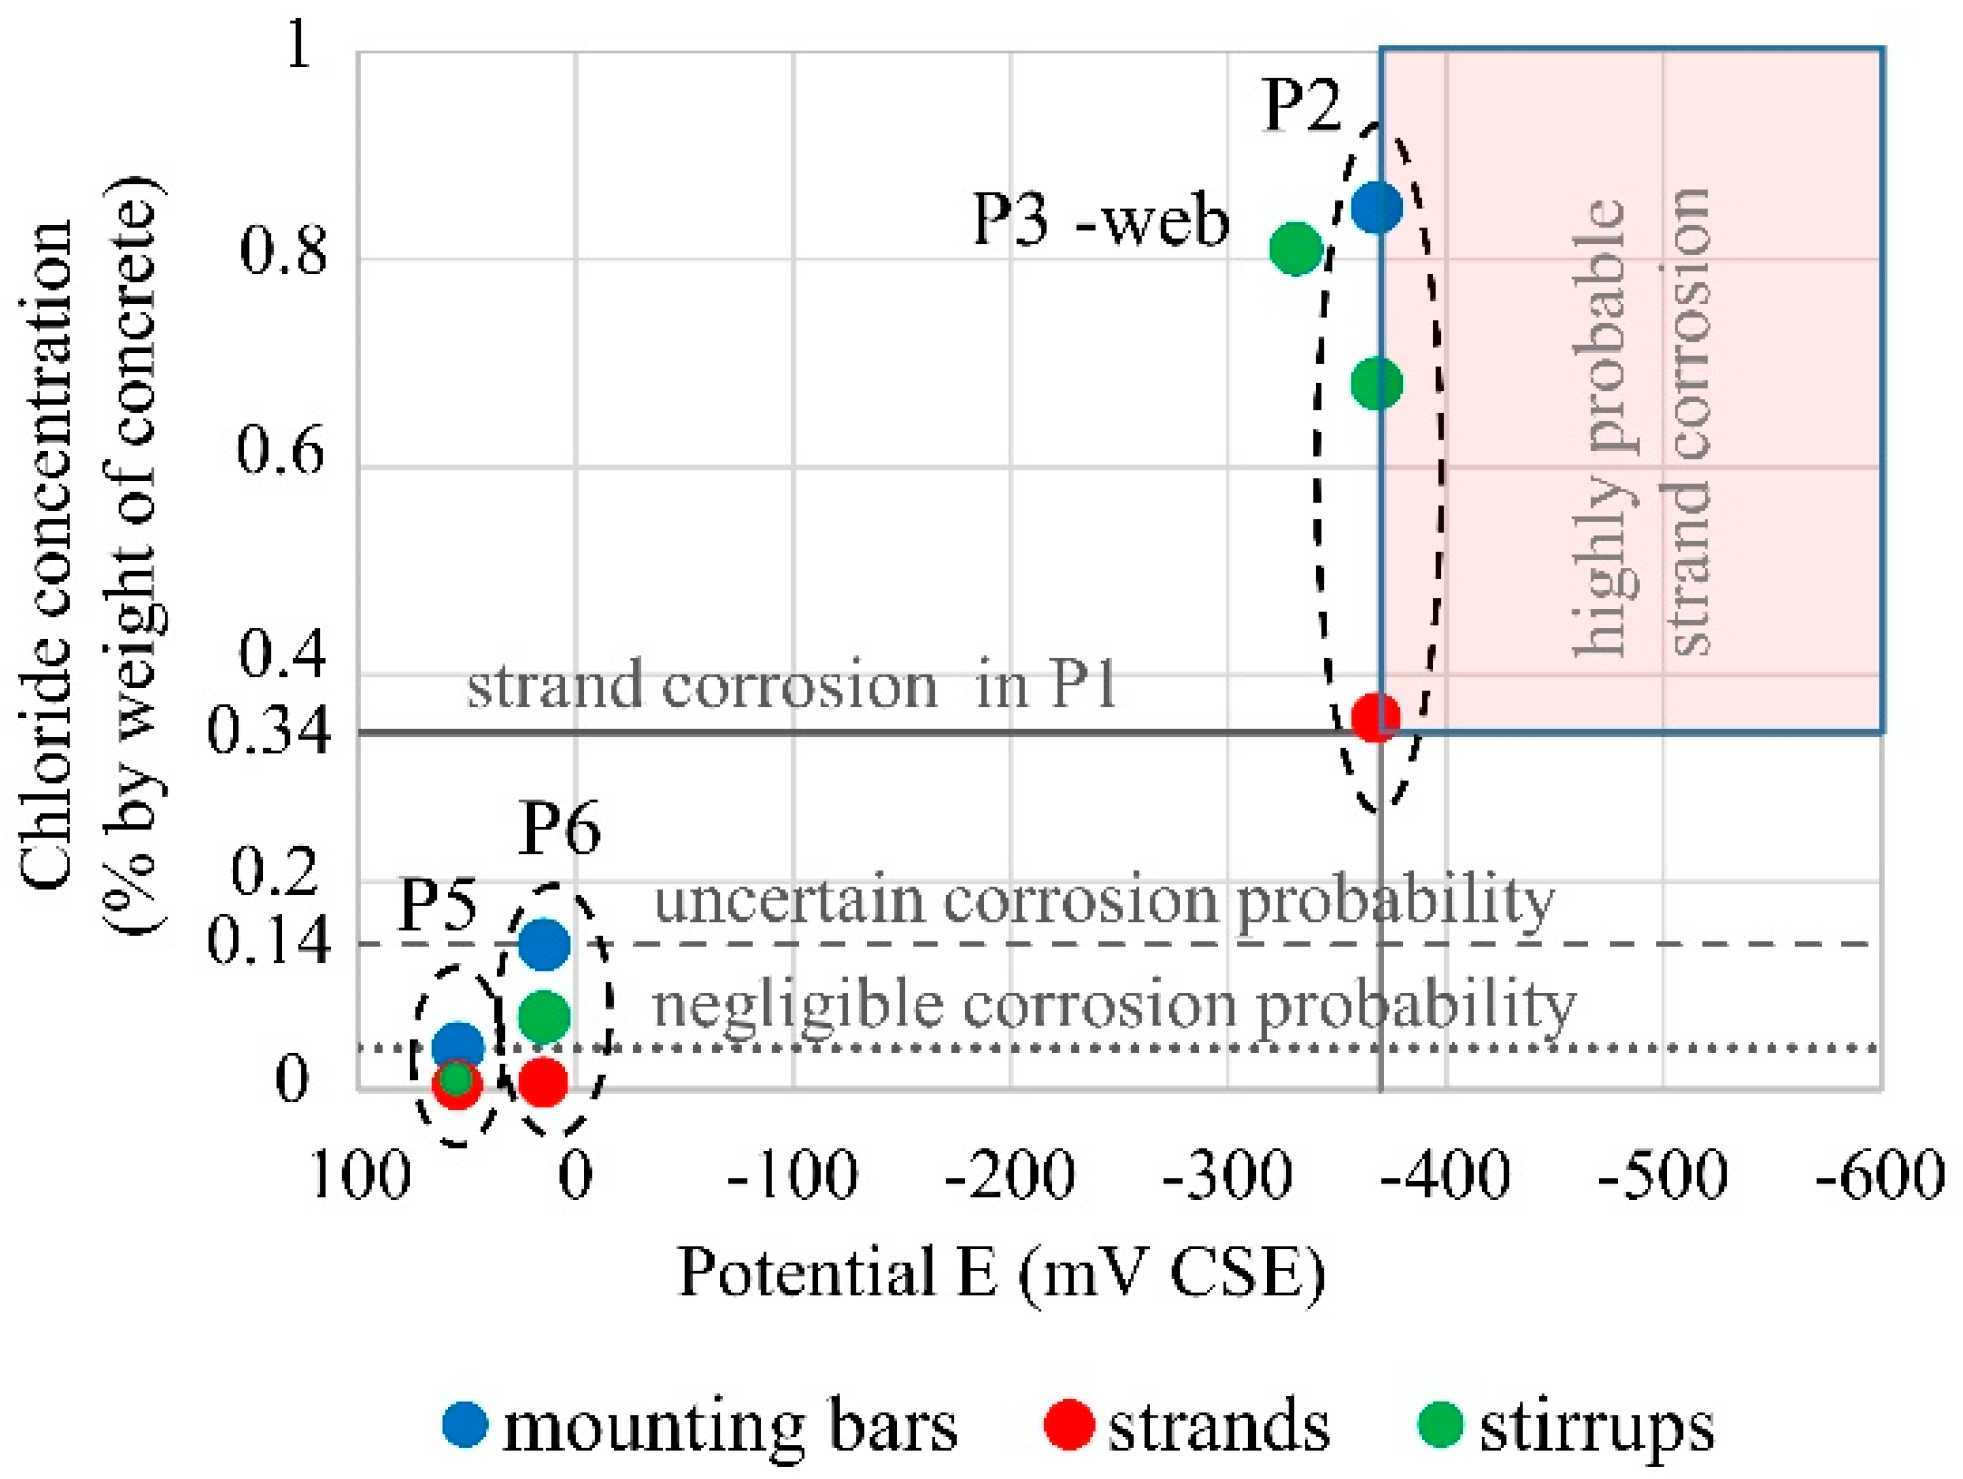
- Although very high chloride concentrations were measured at the level of strands (about nine times higher than the CEB conservative threshold of 0.2% by weight of cement) and severe concrete damage was observed around the ordinary reinforcement, only small corrosion spots were found on the strands. This could be due to macrocell corrosion delaying strand corrosion. Other factors could be differences in the quality of the concrete–steel interface and type of steel. Severe corrosion damage visible on the concrete surface does not necessarily indicate severe strand corrosion. High chloride concentrations alone cannot be interpreted as sufficient to indicate severe corrosion. Moreover, the assessment of corrosion probability from chloride concentrations alone could be uncertain due to the lack of research into the statistical distribution of chloride thresholds for prestressing reinforcement.
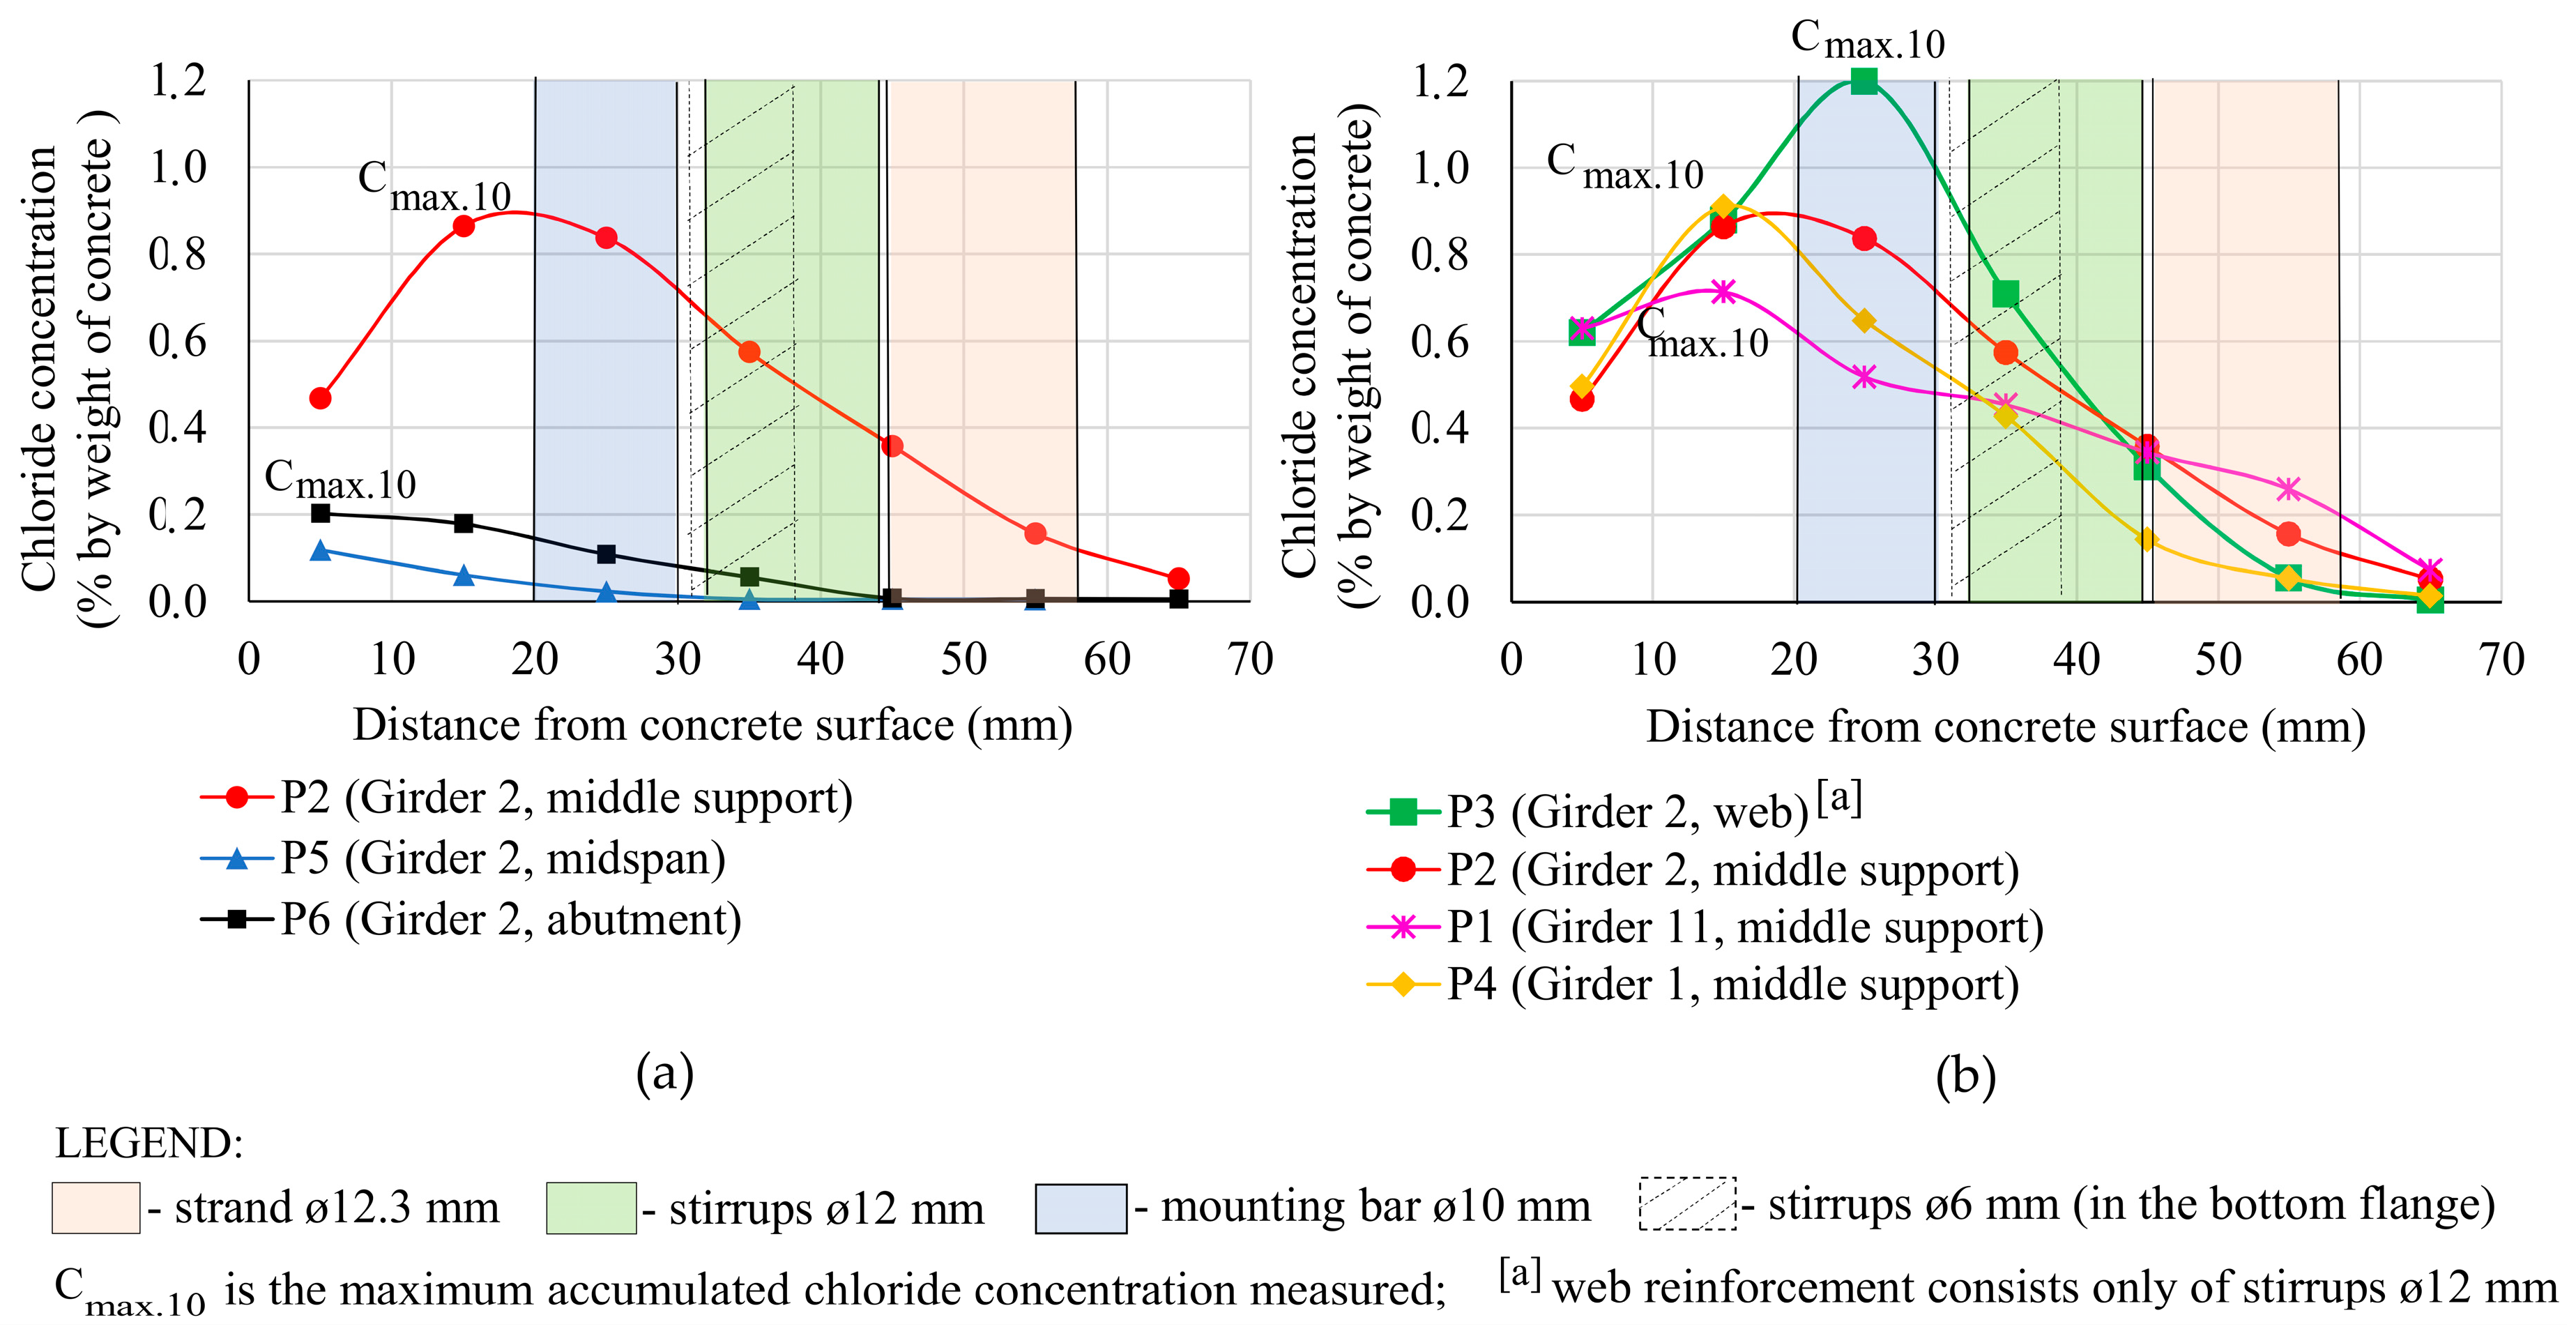
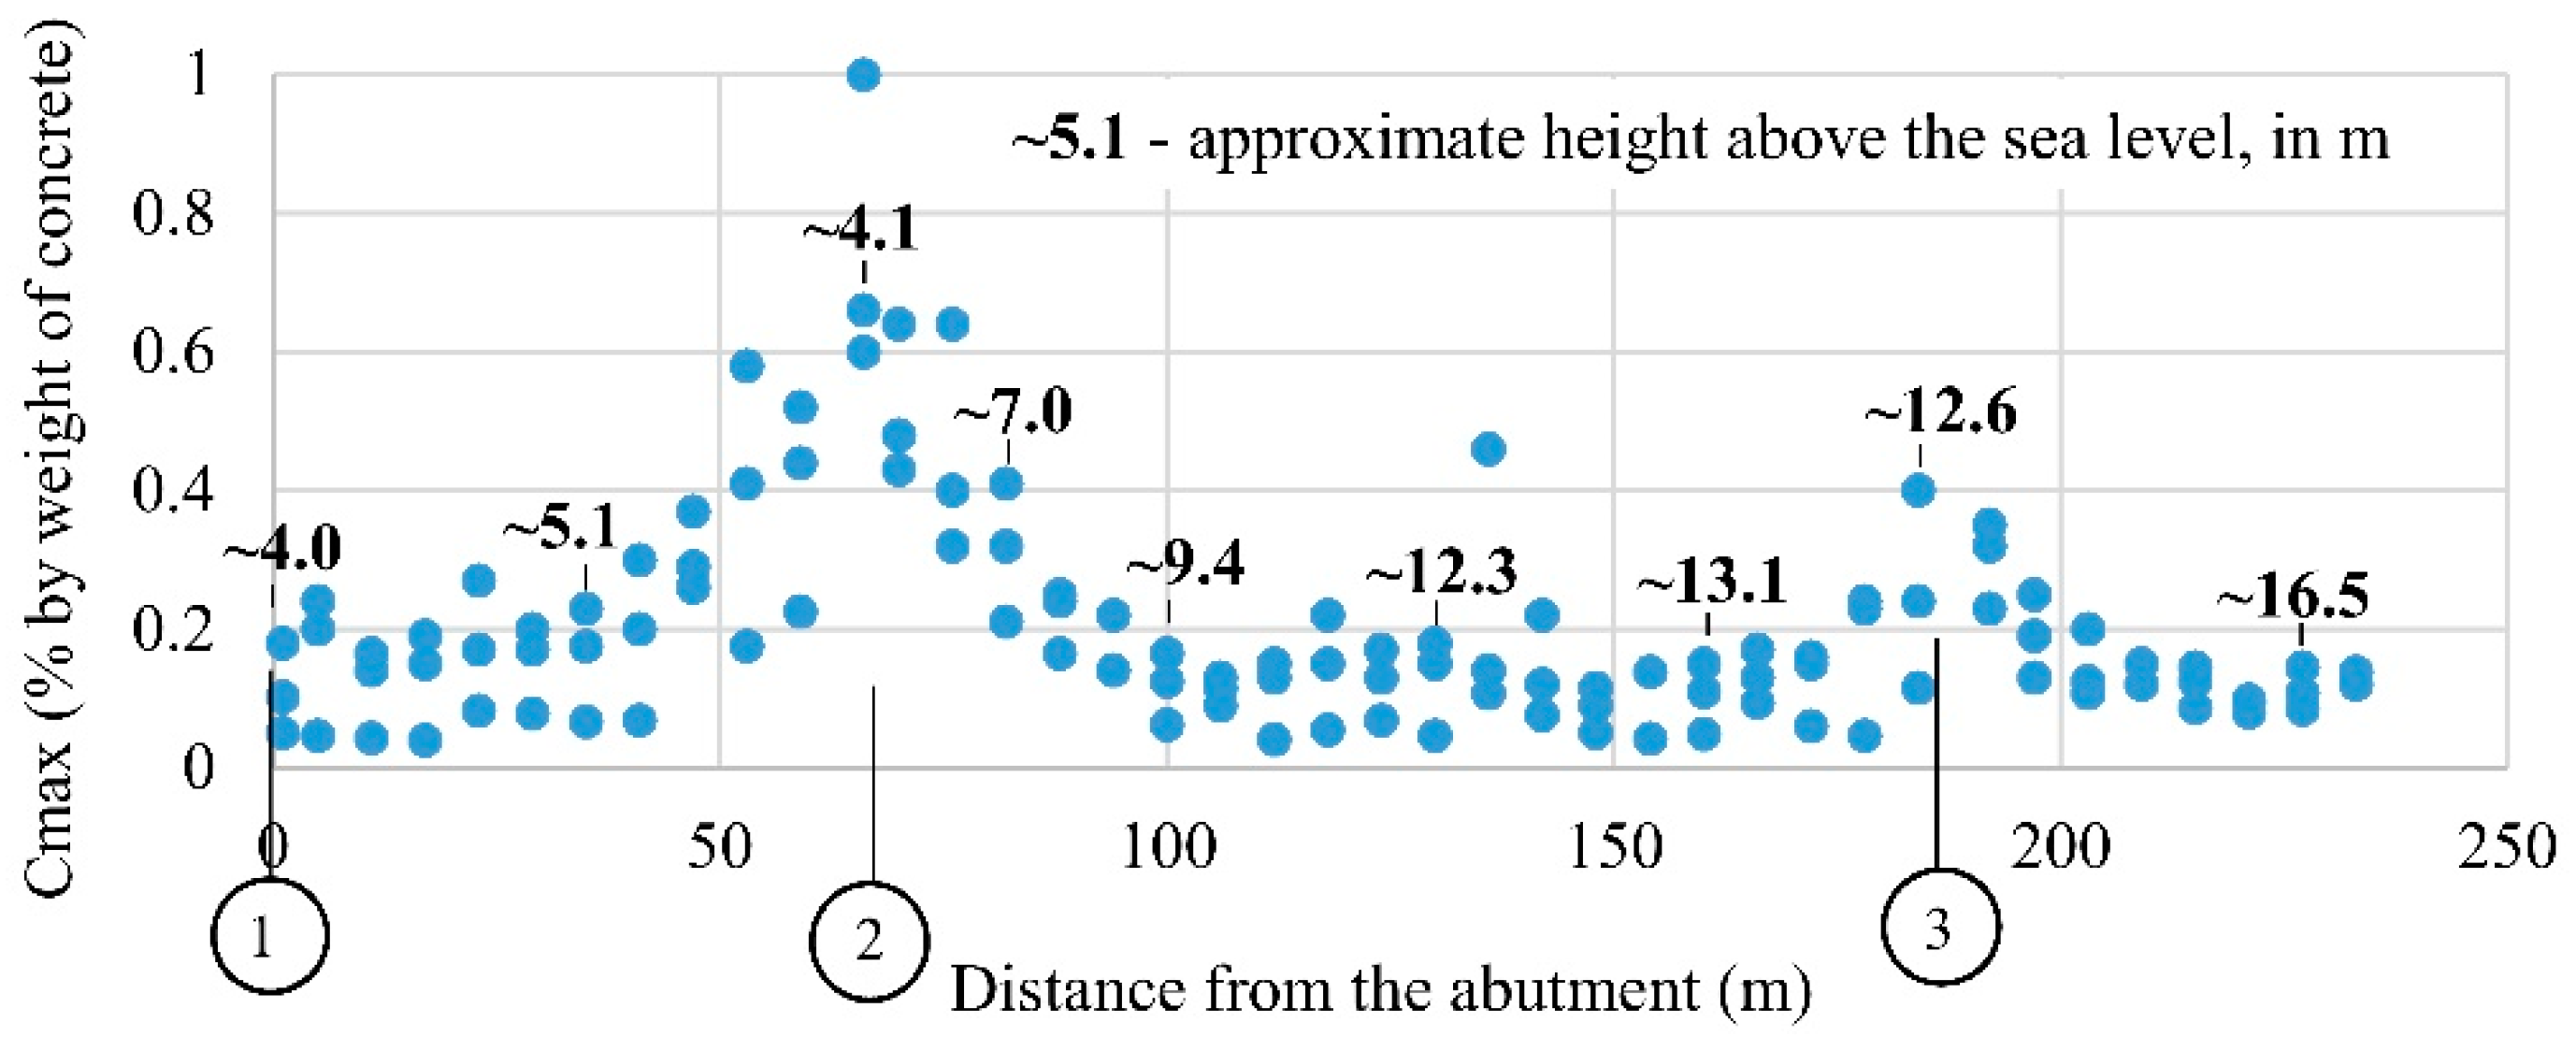
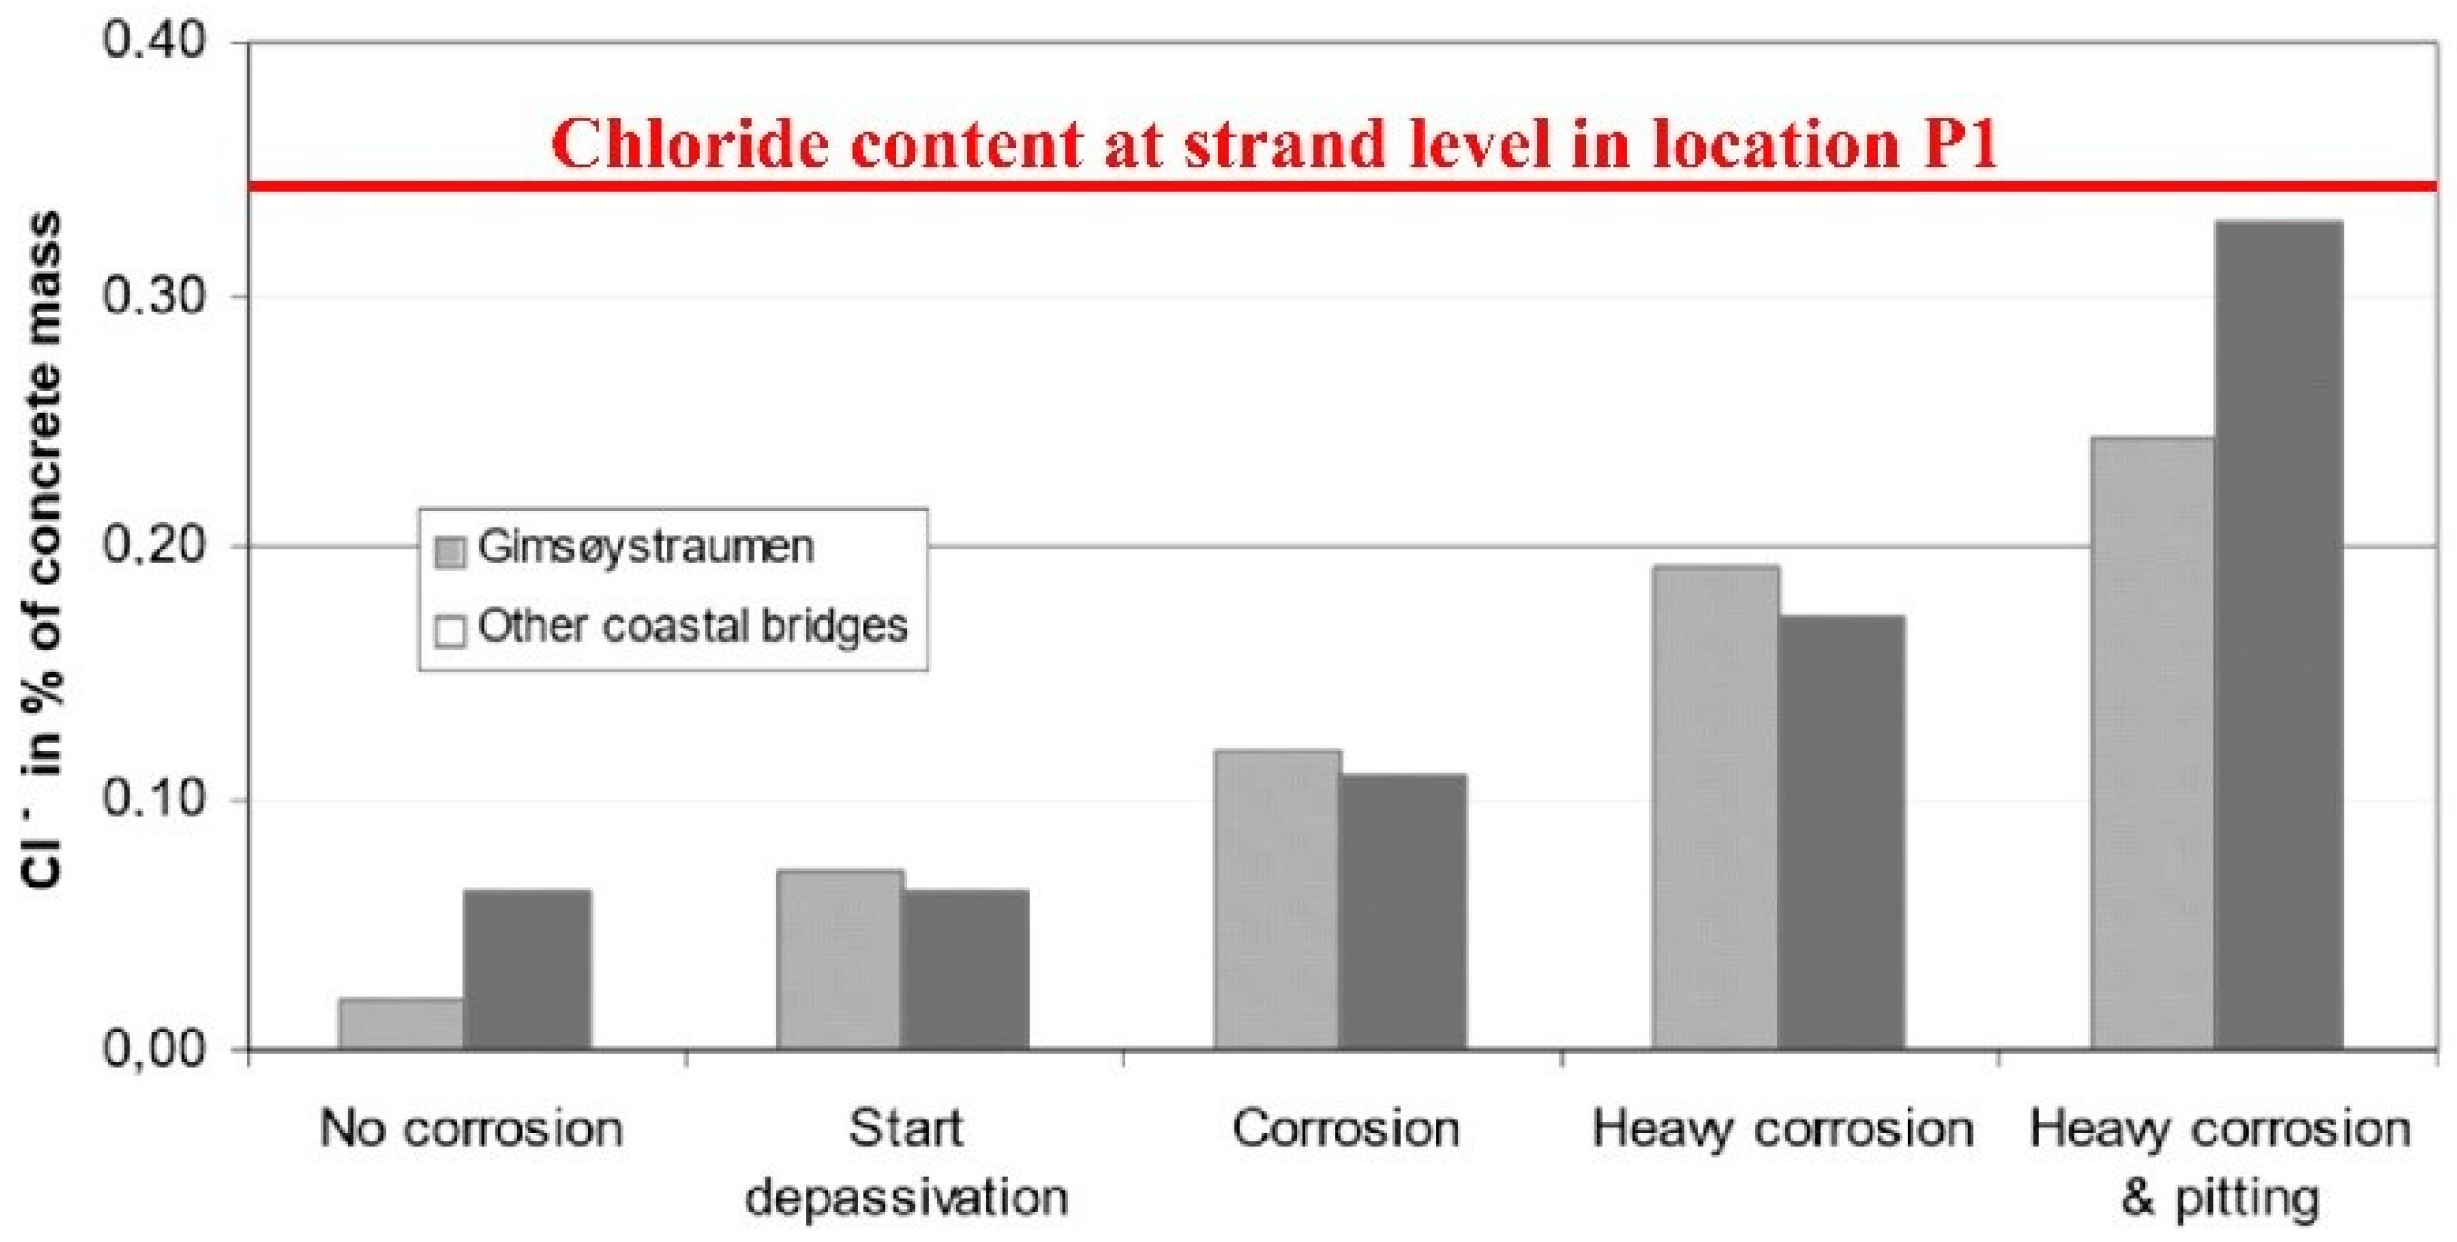
- We found corrosion in and near the support zones of NIB girders exposed to wetting–drying cycles (low ER, visible wet areas). In contrast, corrosion probability was negligible in the span where dry conditions were found (high ER). Higher moisture in combination with damaged or poor quality of concrete cover probably led to more than seven times higher maximum accumulated chloride concentration (up to 1.2% by weight of concrete) and consequently deeper chloride ingress in the support zones than in midspan.
- With regard to the 2nd girder from the side facing the sea, the exposure to moisture and chlorides near the supports was comparable for both the girder web and the bottom flange. A higher corrosion probability is also to be expected in the outer web surface facing the sea.
Author Contributions
Funding
Acknowledgments
Conflicts of Interest
References
- Norwegian Public Roads Administration. Report from a Special Inspection of Hafrsfjord Bridge (in Norwegian: Rapport fra Spesialinspeksjon Hafrsfjordbrua); Norwegian Public Roads Administration: Oslo, Norway, 2014.
- Osmolska, M.J.; Kanstad, T.; Hendriks, M.A.N.; Hornbostel, K.; Markeset, G. Durability of pretensioned concrete girders in coastal climate bridges: Basis for better maintenance and future design. Struct. Concr. 2019, 20, 2256–2271. [Google Scholar] [CrossRef]
- Bruce, S.M.; McCarten, P.S.; Freitag, S.A.; Hasson, L.M. Deterioration of Prestressed Concrete Bridge Beams; Land Transport New Zealand: Wellington, New Zealand, 2008.
- Angst, U.; Vennesland, Ø. Critical chloride content in reinforced concrete—State of the art. In Proceedings of the 2nd International Conference on Concrete Repair, Rehabilitation and Retrofitting, Cape Town, South Africa, 24–26 November 2008; pp. 149–150. [Google Scholar]
- Alonso, C.; Andrade, C.; Castellote, M.; Castro, P. Chloride threshold values to depassivate reinforcing bars embedded in a standardized OPC mortar. Cem. Concr. Res. 2000, 30, 1047–1055. [Google Scholar] [CrossRef]
- Alonso, C.; Castellote, M.; Andrade, C. Chloride threshold dependence of pitting potential of reinforcements. Electrochim. Acta 2002, 47, 3469–3481. [Google Scholar] [CrossRef]
- Manera, M.; Vennesland, Ø.; Bertolini, L. Chloride threshold for rebar corrosion in concrete with addition of silica fume. Corros. Sci. 2008, 50, 554–560. [Google Scholar] [CrossRef]
- Nygaard, P.V.; Geiker, M.R. A method for measuring the chloride threshold level required to initiate reinforcement corrosion in concrete. Mater. Struct. 2005, 38, 489–494. [Google Scholar] [CrossRef]
- Stark, D. Determination of permissible chloride levels in prestressed concrete. PCI J. 1984, 29, 106–119. [Google Scholar] [CrossRef]
- Pfeifer, D.W.; Perenchio, W.F.; Hime, W.G. A critique of the ACI 318 chloride limits. PCI J. 1992, 37, 68–71. [Google Scholar]
- Lee, S.K. Bridge deterioration: Part 2—Bridge deterioration caused by corrosion. Mater. Perform. J. 2012, 51, 2–7. [Google Scholar]
- Alonso, C.; Recio, F.J.; Sanchez, M.; Andrade, C. Chloride threshold determination in prestressing steel beams. In Proceedings of the 11DBMC International Conference on Durability of Building Materials and Components, Istanbul, Turkey, 11 May 2008. [Google Scholar]
- Azuma, Y.; Miyazato, S.; Niitani, K.; Yamada, K.; Tokumitu, S. Influence of chloride ion content and stress on steel corrosion in cement paste grout. In Proceedings of the 32nd Conference on Our World in Concrete and Structures, Singapore, 28–29 August 2007; pp. 143–148. [Google Scholar]
- Joseline, D.; Karuppanasamy, J.; Dhanya, B.S.; Pillai, R.G. Chloride Threshold of Prestressing Steel and Corrosion Initiation Time—Laboratory Tests and Case Study. In Proceedings of the International Conference and Expo on Corrosion (CORCON), New Delhi, India, 18–21 September 2016. [Google Scholar]
- Fib Bulletin 34: Model Code for Service Life Design; CEB-FIB: Lausanne, Switzerland, 2006.
- Markeset, G. Critical chloride content and its influence on service life predictions. Mater. Corros. 2009, 60, 593–596. [Google Scholar] [CrossRef]
- CEB. Durable Concrete Structures: Design Guide; Thomas Telford Ltd.: Westminster, UK, 1992. [Google Scholar]
- ACI Committee 222. Corrosion of Prestressing Steels; ACI 222.2R-01; American Concrete Institute: Farmington Hills, MI, USA, 2001. [Google Scholar]
- Norwegian Standards. NS-EN 206:2013+A1:2016+NA:2017: Concrete—Specification, Performance, Production and Conformity; Standard Norge: Oslo, Norway, 2017. [Google Scholar]
- Papè, T.M.; Melchers, R. Comparisons between two corrosion assessment methods and the corrosion of steel in prestressed concrete. In Proceedings of the Corrosion and Prevention Conference, Coffs Harbour, Australia, 15–19 November 2009; pp. 15–18. [Google Scholar]
- Blankvoll, A. Gimsøystraumen Bridge. Main Results and Overview of the Final Documentation (in Norwegian: Hovedresultater og Oversikt over Sluttdokumentasjon); Publication no. 89; Norwegian Public Roads Administration: Oslo, Norway, 1998.
- Bertolini, L.; Elsener, B.; Pedeferri, P.; Redaelli, E.; Polder, R. Corrosion of Steel in Concrete: Prevention, Diagnosis, Repair, 2nd ed.; John Wiley & Sons: Weinheim, Germany, 2014. [Google Scholar]
- Polder, R.B. Test methods for on site measurement of resistivity of concrete—A RILEM TC-154 technical recommendation. Constr. Build. Mater. 2001, 15, 125–131. [Google Scholar] [CrossRef]
- Wiwattanachang, N.; Giao, P.H. Monitoring crack development in fiber concrete beam by using electrical resistivity imaging. J. Appl. Geophys. 2011, 75, 294–304. [Google Scholar]
- Salehi, M.; Ghods, P.; Isgor, O.B. Numerical study on the effect of cracking on surface resistivity of plain and reinforced concrete elements. J. Mater. Civ. Eng. 2015, 27, 04015053. [Google Scholar]
- Chouteau, M.; Beaulieu, S. An investigation on application of the electrical resistivity tomography method to concrete structures. In Proceedings of the Geophysics 2002 Conference, Los Angeles, CA, USA, 15–19 April 2002. [Google Scholar]
- Morales, M.M.T. Experimental Investigation of the Effects of Embedded Rebar, Cracks, Chloride Ingress and Corrosion on Electrical Resistivity Measurements of Reinforced Concrete. Master’s Thesis, Oregon State University, Corvallis, OR, USA, 2015. [Google Scholar]
- Lopez, W.; Gonzalez, J.A. Influence of the degree of pore saturation on the resistivity of concrete and the corrosion rate of steel reinforcement. Cem. Concr. Res. 1993, 23, 368–376. [Google Scholar]
- Morris, W.; Vico, A.; Vazquez, M.; De Sánchez, S.R. Corrosion of reinforcing steel evaluated by means of concrete resistivity measurements. Corros. Sci. 2002, 44, 81–99. [Google Scholar]
- Gonzalez, J.A.; Miranda, J.M.; Feliu, S. Considerations on reproducibility of potential and corrosion rate measurements in reinforced concrete. Corros. Sci. 2004, 46, 2467–2485. [Google Scholar]
- Andrade, C.; Alonso, C. Corrosion rate monitoring in the laboratory and on-site. Constr. Build. Mater. 1996, 10, 315–328. [Google Scholar]
- Broomfield, J.; Millard, S. Measuring concrete resistivity to assess corrosion rates. Concrete 2002, 36, 37–39. [Google Scholar]
- Hornbostel, K.; Larsen, C.K.; Geiker, M.R. Relationship between concrete resistivity and corrosion rate–a literature review. Cem. Concr. Compos. 2013, 39, 60–72. [Google Scholar]
- Song, H.-W.; Saraswathy, V. Corrosion monitoring of reinforced concrete structures—A review. Int. J. Electrochem. Sci. 2007, 2, 1–28. [Google Scholar]
- Hornbostel, K.; Elsener, B.; Angst, U.M.; Larsen, C.K.; Geiker, M.R. Limitations of the use of concrete bulk resistivity as an indicator for the rate of chloride-induced macro-cell corrosion. Struct. Concr. 2017, 18, 326–333. [Google Scholar]
- Standard Test Method for Corrosion Potentials of Uncoated Reinforcing Steel in Concrete; ASTM C876; ASTM: West Conshohocken, PA, USA, 2015.
- Van Daveer, J.R. Techniques for evaluating reinforced concrete bridge decks. J. Am. Concr. Inst. 1975, 72, 697–704. [Google Scholar]
- Elsener, B.; Andrade, C.; Gulikers, J.; Polder, R.; Raupach, M. Recommendations of RILEM TC 154-EMC: Electrochemical Techniques for Measuring Metallic Corrosion Half-Cell Potential Measurements–Potential Mapping on Reinforced Concrete Structures. Mat. Struct. 2003, 36, 461–471. [Google Scholar]
- Yodsudjai, W.; Pattarakittam, T. Factors influencing half-cell potential measurement and its relationship with corrosion level. Measurement 2017, 104, 159–168. [Google Scholar] [CrossRef]
- Nakamura, E.; Watanabe, H.; Koga, H.; Nakamura, M.; Ikawa, K. Half-cell potential measurements to assess corrosion risk of reinforcement steels in a PC bridge. In Proceedings of the RILEM Conference: On Site Assessment of Concrete, Masonry and Timber Structures—SACoMaTiS, Como Lake, Italy, 1–2 September 2008; pp. 109–117. [Google Scholar]
- Kim, Y.Y.; Kim, J.M.; Bang, J.-W.; Kwon, S.-J. Effect of cover depth, w/c ratio, and crack width on half cell potential in cracked concrete exposed to salt sprayed condition. Constr. Build. Mater. 2014, 54, 636–645. [Google Scholar] [CrossRef]
- Gulikers, J.; Elsener, B. Development of a calculation procedure for the statistical interpretation of the results of potential mapping performed on reinforced concrete structures. Mater. Corros. 2009, 60, 87–92. [Google Scholar] [CrossRef]
- Novokshchenov, V. Corrosion surveys of prestressed bridge members using a half-cell potential technique. Corrosion 1997, 53, 489–498. [Google Scholar]
- Naito, C.J.; Jones, L.; Hodgson, I.C. Inspection Methods & Techniques to Determine Non Visible Corrosion of Prestressing Strands in Concrete Bridge Components: Task 3—Forensic Evaluation and Rating Methodology; Pennsylvania Department of Transportation, Bureau of Planning and Research: Harrisburg, PA, USA, 2010. [Google Scholar]
- Sadowski, L. Methodology for assessing the probability of corrosion in concrete structures on the basis of half-cell potential and concrete resistivity measurements. Sci. World J. 2013, 2013, 714501. [Google Scholar] [CrossRef] [Green Version]
- Pailes, B.M. Damage Identification, Progression, and Condition Rating of Bridge Decks Using Multi-Modal Non-Destructive testing. Ph.D. Thesis, University of New Jersey, Rutgers, NJ, USA, 2014. [Google Scholar]
- Kessler, S.; Gehlen, C. Probability of detection of corrosion detection in reinforced concrete structures. In Proceedings of the International Symposium Non-Destructive Testing in Civil Engineering (NDTCE 2015), Berlin, Germany, 15–17 September 2015. [Google Scholar]
- Kessler, S.; Gehlen, C. Reliability Evaluation of Half-Cell Potential Measurement Using POD. J. Infrastruct. Syst. 2017, 23, B4016007. [Google Scholar] [CrossRef]
- Kessler, S.; Gehlen, C. Influence of concrete moisture condition on half-cell potential measurement. In Proceedings of the 5th International Conference on the Durability of Concrete Structures (ICDCS), Shenzhen, China, 30 June 2016. [Google Scholar]
- Reichling, K.; Raupach, M.; Broomfield, J.; Gulikers, J.; Nygaard, P.V.; Schneck, U.; Sergi, G. Local detailed inspection methods regarding reinforcement corrosion of concrete structures. Mater. Corros. 2013, 64, 128–134. [Google Scholar] [CrossRef]
- Rogers, R.; Wotherspoon, L.; Scott, A.N.; Ingham, J.M. Residual strength assessment and destructive testing of decommissioned concrete bridge beams with corroded pretensioned reinforcement. PCI J. 2012, 57, 100–118. [Google Scholar]
- American Concrete Institute. Building Code Requirements for Structural Concrete (ACI 318-08) and Commentary: An ACI Standard; American Concrete Institute: Farmington Hills, MI, USA, 2008. [Google Scholar]
- Norwegian Public Roads Administration. Report from a Special Inspection of Hafrsfjord Bridge (in Norwegian: Rapport fra Spesialinspeksjon Hafrsfjord bru); Norwegian Public Roads Administration: Oslo, Norway, 1996.
- Neville, A.M. Properties of Concrete; Longman: London, UK, 1995. [Google Scholar]
- Petcherdchoo, A. Closed-form solutions for modeling chloride transport in unsaturated concrete under wet-dry cycles of chloride attack. Constr. Build. Mater. 2018, 176, 638–651. [Google Scholar] [CrossRef]
- Forsen, N.E.; Vennesland, Ø.; Vinje, L.; Torgersen, S.E. The Concrete Element Book, Volume D, Part 2 Environment and Durability, D11 Concrete Protection (in Norwegian: Betongelementboken, Bind D, del 2 Miljø og Bestandighet, D11 Sikring av Betongen), 1st ed.; Betongindustriens Landsforening: Oslo, Norway, 1997; pp. 68–70. [Google Scholar]
- Sun, C.; Yuan, L.; Zhai, X.; Qu, F.; Li, Y.; Hou, B. Numerical and experimental study of moisture and chloride transport in unsaturated concrete. Constr. Build. Mater. 2018, 189, 1067–1075. [Google Scholar] [CrossRef]
- Ye, H.; Jin, N.; Jin, X.; Fu, C.; Chen, W. Chloride ingress profiles and binding capacity of mortar in cyclic drying-wetting salt fog environments. Constr. Build. Mater. 2016, 127, 733–742. [Google Scholar] [CrossRef]
- Kompen, R.; Blankvoll, A.; Berg, T.; Noremark, E.; Austnes, P.; Grefstad, K.; Kristiansen, B.; Bonsak, B.; Halsen, J. Gimsøystraumen Bridge—Final Report. Publication no. 85. Climate Loads and Condition Assessment (in Norwegian: Klimapåkjenning og tilstandsvurdering); Norwegian Public Roads Administration: Oslo, Norway, 1998.
- Kessler, S.; Fischer, J.; Straub, D.; Gehlen, C. Updating of service-life prediction of reinforced concrete structures with potential mapping. Cem. Concr. Compos. 2014, 47, 47–52. [Google Scholar]
- Izquierdo, D.; Alonso, C.; Andrade, C.; Castellote, M. Potentiostatic determination of chloride threshold values for rebar depassivation: Experimental and statistical study. Electrochim. Acta 2004, 49, 2731–2739. [Google Scholar]
- Helland, S.; Maage, M.; Smeplass, S.; Fluge, F. Report No 19, Service Life Design of Concrete Structures: Task DP1 B4 (in Norwegian: Betongkonstruksjoners Livsløp); Norwegian Public Roads Administration: Oslo, Norway, 2008.
- Li, F.; Yuan, Y.; Li, C.-Q. Corrosion propagation of prestressing steel strands in concrete subject to chloride attack. Constr. Build. Mater. 2011, 25, 3878–3885. [Google Scholar] [CrossRef]


| Probability of Corrosion | Electrical Resistivity in Ωm |
|---|---|
| Negligible | Higher than 1000 |
| Low | Between 500 and 1000 |
| Moderate | Between 100 and 500 |
| High | Less than 100 |
| Probability of Corrosion | Half-Cell Potential in mV CSE (Copper/Copper Sulphate Electrode) |
|---|---|
| Less than 10% (low) | More positive than −200 |
| Uncertain | Between −350 and −200 |
| More than 90% (high) | More negative than −350 |
| Sampling Location | Strands | Stirrups | Mounting Bars |
|---|---|---|---|
| P1 (Girder 11, middle support) | 0.344 1/1.81 | 0.48 2/2.53 | 0.62 2/3.27 |
| P2 (Girder 2, middle support) | 0.358 1/1.89 | 0.68 2/3.58 | 0.85 2/4.48 |
| P3 (Girder 2, web) | - | 0.81 2/4.27 | - |
| P4 (Girder 1, middle support) | 0.143 1/0.75 | 0.52 2/2.74 | 0.78 2/4.11 |
| P5 (Girder 2, midspan) | 0.005 1/0.03 | 0.01 2/0.05 | 0.04 2/0.20 |
| P6 (Girder 2, abutment) | 0.007 1/0.04 | 0.07 2/0.37 | 0.14 2/0.74 |
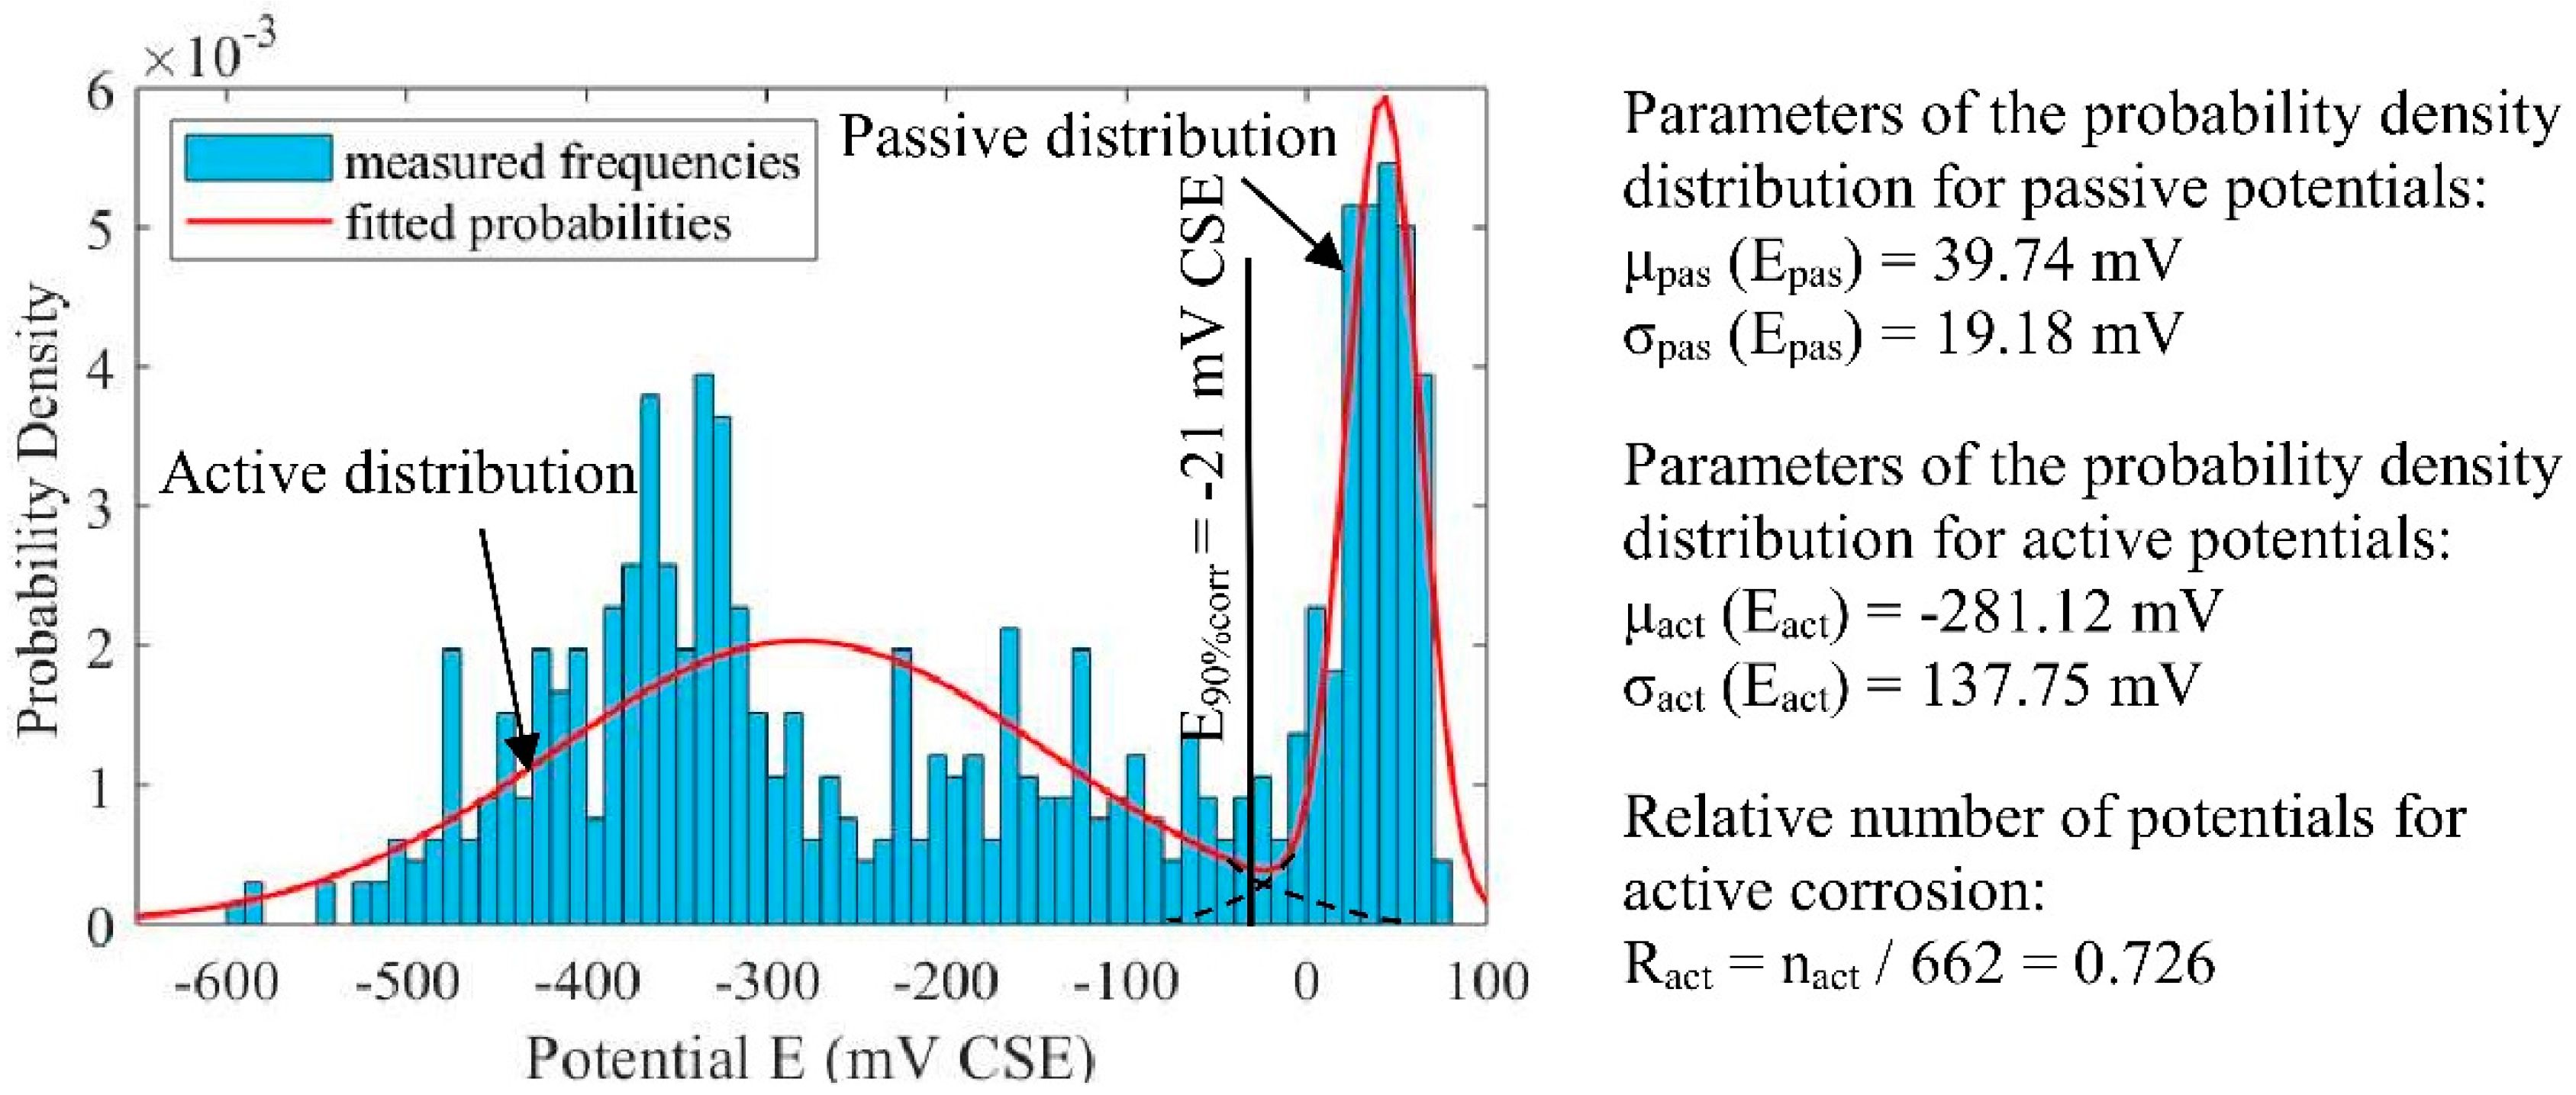
| Probability of Corrosion | Half-Cell Potential in mV CSE According to ASTM C876 [36] | Half-Cell Potential in mV CSE Obtained in This Study |
|---|---|---|
| Less than 10% (low) | More positive than −200 | More positive than about 10 |
| More than 90% (high) | More negative than −350 | More negative than about −25 |
© 2020 by the authors. Licensee MDPI, Basel, Switzerland. This article is an open access article distributed under the terms and conditions of the Creative Commons Attribution (CC BY) license (http://creativecommons.org/licenses/by/4.0/).
Share and Cite
Osmolska, M.J.; Hornbostel, K.; Kanstad, T.; Hendriks, M.A.N.; Markeset, G. Inspection and Assessment of Corrosion in Pretensioned Concrete Bridge Girders Exposed to Coastal Climate. Infrastructures 2020, 5, 76. https://0-doi-org.brum.beds.ac.uk/10.3390/infrastructures5090076
Osmolska MJ, Hornbostel K, Kanstad T, Hendriks MAN, Markeset G. Inspection and Assessment of Corrosion in Pretensioned Concrete Bridge Girders Exposed to Coastal Climate. Infrastructures. 2020; 5(9):76. https://0-doi-org.brum.beds.ac.uk/10.3390/infrastructures5090076
Chicago/Turabian StyleOsmolska, Magdalena J., Karla Hornbostel, Terje Kanstad, Max A.N. Hendriks, and Gro Markeset. 2020. "Inspection and Assessment of Corrosion in Pretensioned Concrete Bridge Girders Exposed to Coastal Climate" Infrastructures 5, no. 9: 76. https://0-doi-org.brum.beds.ac.uk/10.3390/infrastructures5090076