Article

Maintenance Modelling of Ceramic Claddings in Pitched Roofs Based on the Evaluation of Their In Situ Degradation Condition

1
CERIS, Instituto Superior Técnico, Universidade de Lisboa, Av. Rovisco Pais, 1049-001 Lisbon, Portugal
2
Department of Civil Engineering, Architecture and Georesources, Instituto Superior Técnico, Universidade de Lisboa, Av. Rovisco Pais, 1049-001 Lisbon, Portugal
*
Author to whom correspondence should be addressed.
Submission received: 31 August 2020 / Revised: 17 September 2020 / Accepted: 18 September 2020 / Published: 22 September 2020

Abstract

:
Existing maintenance policies have several limitations, mainly due to the lack of knowledge regarding the durability and performance of buildings. Usually, the maintenance policies are insufficiently accurate, neglecting the risk of failure over time and the global costs associated with repairs. In this study, a condition-based maintenance model, based on Petri nets, is proposed to evaluate the impact of three maintenance strategies of ceramic claddings in pitched roofs (CCPR): MS1—only total replacement; MS2—composed of total replacement and minor intervention and MS3—composed of total replacement, minor intervention and cleaning operations. In this study, 146 CCPR were inspected in situ, with a total area of 43,991.6 m2. The remaining service life of the CCPR; the global costs over the claddings’ lifetime (considering inspection, maintenance, replacement and disposal costs); the claddings’ degradation condition and the number of replacements during the time horizon are used to evaluate the performance of the different maintenance strategies through a simplified multi-criteria analysis. The results show that the gains in performance, in terms of expected service life and durability, of the consideration of preventive maintenance actions (minor interventions or cleaning operations) outweigh the increase of the operation costs.

1. Introduction

The performance of continuous and periodic inspections and maintenance activities in buildings and their components over time is not yet fully integrated in society. However, this interest has increased in the last decades [1,2,3]. Until the 2008/2009 economic crisis, the construction sector in Europe was strongly marked by the constructions of new buildings [4,5]. Consequently, nowadays, there is yet a lack of consolidated practices and guidelines in the maintenance and rehabilitation of the built environment [4]. Since regular inspections and maintenance activities, in general, are not mandatory [6], these activities are usually performed only when buildings and their components are already severely degraded, or corrective maintenance activities are carried out to react to failures failing to deal with the causes [7], leading to additional costs [8] and causing potential safety and health hazards to the users [9].
Furthermore, the existing methodologies have several limitations [10,11,12], such as: scarce data about maintenance protocols, poor or non-existent implementation of strategic procedures, lack of information regarding the durability and performance of buildings, insufficiently accuracy of the existing maintenance policies and lack of information about global costs associated with repairs. Therefore, the development of new scientifically well-founded methodologies and guidelines to improve the building asset management is crucial, mostly through careful planning of the inspections and maintenance activities [4,13]. This will enable a more rational management of the building stock through the implementation of more reliable maintenance policies and allow the adoption of more sustainable and durable solutions at the design stage.
The lack of maintenance and rehabilitation policies implemented during the lifetime of the buildings is especially noticeable in the envelope elements (façades, windows and roofs), promoting the premature aging of these elements. The building’s envelope elements are the first protection of the buildings [14] against the external environment degradation factors [15], and the roofing systems are the most vulnerable element [16]. According to several authors [17,18,19,20], roofing systems are the building element most affected by anomalies. Roofs are subjected to different degradation mechanisms, such as exposure to extreme and variable temperatures, solar radiation, rain and snow, wind, biological and chemical agents, traffic pollution and inadequate use [16,21]. In most circumstances, the outcome of the continuous degradation in roofs is more severe than in other parts of the building, since it can lead to structural problems, compromising the roof itself, as well the remaining structure of the building and/or neighbouring buildings, and cause damage to the goods inside the building [22,23].
Therefore, in this study, the maintenance of ceramic claddings in pitched roofs (CCPR) is the main focus. The life cycle Petri net-based model previously proposed by the authors [24] is implemented to evaluate the impact of different maintenance strategies (MS) over time and promote the durability of CCPR in a cost-effective way. Therefore, the following maintenance strategies are assessed: MS1—only total replacement; MS2—composed of total replacement and minor intervention and MS3—composed of total replacement, minor intervention and cleaning operations. The first one represents the most common solution adopted by the buildings’ owners. The other two are analysed in order to evaluate the impact of the different alternatives in the claddings’ service life and in the whole-life maintenance costs for the period under analysis. Finally, to support the decision-makers, the operation costs, the expected service life and the number of replacements during the time horizon are assessed through a simplified multi-criteria analysis. In residential buildings, pitched roofs are the most frequent roofing system; therefore, efforts to increase the knowledge about the durability, service life and maintenance policies of these systems are essential [25,26]. Regarding the type of cladding, ceramic tiles are selected, because they are the most popular solution in Portugal [27], as well as in other southern European countries [23]. This case study considers 146 claddings located in Portugal. The database was built through in situ visual inspection of CCPR in-service conditions. In an overall analysis, the results show that the implementation of maintenance programs that consider cleaning operations and minor interventions (i.e., preventive maintenance) is preferable, but the managers’/owners’ perceptions and opinions are always decisive in the maintenance strategy choice.

2. Background

Since the roof is an important element of a building, the implementation of a maintenance program to maintain the roof in an acceptable degradation condition is essential. However, to improve the decision-making process, greater knowledge about classification systems to measure the global degradation conditions, methodologies to predict the element’s service life and the impact of maintenance activities are fundamental.
Literature about degradation process and maintenance management CCPR is scarce, but there are some works about roofing systems, in general. For example, Kyle and Kalinger [22] developed a reliability-based system for the service life prediction and management of maintenance and repair procedures of low-slope roof systems. In this methodology, reliability is used as a performance requirement, and decisions about periodic inspections, preventive maintenance, repair and replacement are based on a life cycle economic analysis of the roof. Later, Zhang et al. [28] applied a Markov Chain model to roofing systems in order to simulate the stochastic degrading process and evaluate the life cycle performance and cost. According to the authors, the probabilistic information obtained from the model can be used to make well-informed decisions. Furthermore, the results show that the uncertainty propagation through the degradation process is not negligible and may significantly influence the final decision. Afterwards, Alaimo and Accurso [29], through a research carried out by the Unit of Palermo, applied the factor method, proposed by ISO 15686-2 [30], to predict the service life in pitched roofs with sandwich panels. In this study, performance grids were used to decrease the subjectivity of the attribution of coefficients to the different factors. The factor method was also used by Rudbeck [31] to assess the economic performance of low-slope roofing insulation systems. In this work, the author argued that the inclusion of the life cycle cost assessment is needed in the methods to predict the service life. In this way, the author developed a method that couples the net present value assessment and a service life prediction system. More recently, Ramos et al. [32], with the aim of developing a methodology to predict the service life of pitched roofs with ceramic tiles as external cladding, adopted a simple regression analysis to obtain the degradation curves. These curves were fitted to the sample collected during a fieldwork survey. Furthermore, the authors referred that the performance and the service life are influenced by several durability factors. To assess this issue, based on the roofs’ characteristics, various degradation patterns were established. Finally, Morgado et al. [21] established a maintenance plan for pitched roofs in current buildings considering the deterioration agents, defects and causes that influence the durability of the maintenance-source elements (MSE) of pitched roofs. Furthermore, they proposed a methodology to rank the priority of intervention in pitched roofs based on the anomalies detected, the environmental aggressiveness, the extent and the severity of the anomaly under analysis and the degradation level of the MSE. This study revealed that the inspections in the first years after construction are fundamental to the detection of symptoms of pre-pathology that originated from design and execution errors, thus avoiding pronounced degradation levels, and, hence economic disadvantages.
These works show that the service life prediction models data are essential to encourage the sustainable and balanced management of the roofing systems, enhance the use of resources, optimise maintenance activities, reduce the operations costs during the service life, and support decision-making. On other words, the incorporation of this information is fundamental to promote, in a cost-effective manner, the durability of the roofing systems, the adoption of an integrated approach that considers the systems’ performance over time, the influence of the different degradation mechanisms and the impact of the maintenance strategies is required.

3. Methodology

3.1. Maintenance Model

In this study, the impact of different maintenance strategies on the overall degradation of pitched roofs with ceramic tiles over their lifetime is assessed through a life cycle Petri net-based model. This model, besides including the stochastic assessment of the degradation condition of the elements, also integrates the inspection and maintenance processes. A detailed description of this methodology is given in Ferreira et al. [24].
The two-scale classification system implemented to describe the degradation process of CCPR is presented in Table 1 [32]. This classification system is based on the work of Gaspar and de Brito [33]. The degradation condition scale is composed of five conditions, ranging from condition A to E, where condition A means that CCPR does not present visual degradation, and E presents a generalised degradation (Figure 1). The degradation condition is estimated from the visual and physical evaluations of the CCPR anomalies observed during the fieldwork.
The degradation condition scale is converted into a quantitative index, called severity of degradation, Sw, which allows assessing the overall degradation condition of the cladding. The severity of degradation, Sw, is computed by Equation (1), which relates the area affected by the existing anomalies and the reference area and ranges from 0% (no visual degradation) to 100% (generalised degradation).
S w = ( A n × k n × k a , n ) A × ( k m a x ) ,
where Sw is the severity of degradation of the cladding in %, kn the multiplying factor of anomaly n, considering its degradation condition (range from 0 to 4), ka,n the weight of the existing anomaly (ka,n R+), An the area of cladding associated with the anomaly n in m2, A the total roof’s area in m2 and ∑(kmax) the sum of the multiplying factors for the highest degradation condition of each anomaly type. The type of anomalies, the kn and ka,n coefficient values, and the relationship between the severity of degradation, Sw, and the degradation condition, C, for the CCPR are shown in Table 1.
Furthermore, this methodology is established on the assumption that an inspection must be carried out before any other maintenance activities, and, based on the real degradation condition of the CCPR, the decision to intervene is made. To be precise, it is assumed that inspections are performed to assess the real degradation condition of the CCPR, since its condition is not known over time. In this way, the maintenance is planned based on the results of the inspections, i.e., a condition-based maintenance strategy is adopted.
In this methodology, four types of interventions are used in the maintenance programs: inspections, cleaning operations, minor interventions and total replacement [21,24,34,35,36,37,38]. In inspections, visual assessment (and non-destructive tests, when necessary) is used to identify the existing anomalies and, consequently, assess the real degradation condition of the CCPR. This intervention does not include maintenance works able to enhance the degradation condition of the CCPR. Cleaning operations include the complete removal of the aesthetical anomalies (debris and contaminants), mitigating the deterioration of the CCPR without correcting functional and structural existing problems in the CCPR. On the other hand, minor interventions, in addition to cleaning operations, consider local repair/replacement of the CCPR, correcting existing problems and preventing their evolution. The type of maintenance work performed varies according to the existing anomalies. Finally, the total replacement corresponds to the full renewal of the CCPR, i.e., the total removal of the old CCPR and transport to landfill and application of a new CCPR. Therefore, based on the inspections’ results, one option is chosen: (1) condition A, no maintenance works are required or performed, (2) condition B, a cleaning operation is needed, (3) condition C, a minor intervention is required and, finally, (4) condition D or E, a total replacement of the CCPR must be carried out, since the end of the service life was reached.

3.2. Deterioration Process

In this methodology, the degradation process allows assessing the behaviour of the cladding over time in terms of its degradation condition. If the degradation profile without the influence of maintenance activities is analysed, this will provide an estimation of the service life of the CCPR. This information is critical to make decisions about maintenance activities (type and frequency) during the building’s lifetime.
In the maintenance model, the Petri net degradation model is validated through the isomorphism between Markov chains (MC) and Petri nets (PN) with transition exponentials distributed [39]. This comparison allows the validation of the model proposed in this study, since Markov chains are widely used to model degradation processes [40,41,42,43,44,45,46]. When compared with Markov chains, Petri nets present several advantages: (1) the graphical representation can be used to describe the problem under analysis in an intuitive manner, (2) it is more flexible and has more capabilities than the Markov chains, allowing the incorporation of more rules in the model to accurately simulate complex situations and keeping the model size within manageable limits and (3) this modelling technique is not restricted to the exponential distribution to simulate the time.
In this study, three probability distributions are analysed: exponential, Weibull and lognormal. This choice is based on the literature on reliability analyses [47], since these are the distributions most used. The agreement of the distributions to the historical data is assessed through the log-likelihood value. This parameter allows assessing the approximation of the values predicted by the numerical model to the real observations [48]. Thus, the distribution that presents a better adjustment to the fieldwork data is the one that has the lowest log-likelihood value. Equation (2) is used to compute he log-likelihood value.
log L = i = 1 n j = 1 k log p i j ,
where pij is the probability of transition from degradation condition i to j, being i the degradation condition in the initial instant and j in the final instant, n the historical database size and k the number of intervals between inspections. In this methodology, Monte Carlo simulation is used to compute the probability of transition, pij.

3.3. Life Cycle Cost Analysis

In this methodology, the life cycle cost (LCC) is implemented to assess the economic impact. Equation (3) is used to estimate the LCC of the different maintenance strategies. The LCC allows the estimation of the cost at the time of reference of the analysis (not necessarily the present time) to perform the interventions in a future date [35,36].
L C C = t = 0 t h C i n s p e c t i o n , t + t = 0 t h C m a i n t e n a n c e , t ,
where ∑Cinspection,t is the accumulate costs associated with inspection over the time horizon, ∑Cmaintenance,t the accumulate costs associated with maintenance activities, th the time horizon of the analysis and t the year of the intervention’s occurrence. Equations (4) and (5) are used to compute the present values of the inspection and maintenance activities [49].
t = 0 t h C i n s p e c t i o n , t = t = 0 t h C i n s p e c t i o n ( 1 + υ / 100 ) t ,
t = 0 t h C m a i n t e n a n c e , t = t = 0 t h C m a i n t e n a n c e ( 1 + υ / 100 ) t ,
where Cinspection,t and Cmaintenance,t are the present values of the inspection and the maintenance cost at the time of reference, respectively, Cinspection and Cmaintenance the inspection and maintenance cost at time t, respectively, and υ, the real discount rate. Assuming a private sector environment, in this study, a 6% real discount rate is used [50]. Furthermore, the construction costs are not considered, since it is considered that the same type of CCPR is applied in all maintenance strategies analysed.

3.4. Efficiency Index and Performance Indicator

Lastly, to compare the efficiency of the different maintenance strategies, a performance indicator, PI, is used [38]. The performance indicator, PI, is given by Equation (6) and allows relating the mean sojourn time in the more favourable degradation conditions and the operation costs.
P I = E I C a n n u a l i s e d ,
where EI is the efficiency index and Cannualised the annualised operation cost of the maintenance strategy under analysis. The PI value ranges from 0 to +∞, and the higher the value, the more beneficial the cost/benefit ratio of the maintenance strategy is.
The EI, given by Equation (7), allows measuring the ability of the maintenance strategies to maintain the CCPR in the more favourable degradation conditions.
E I = 0 t h S w ( t )   d t 100 · t h ,
where ∫ Sw(t) dt is the area underneath the degradation profile (which represents the loss of performance of the CCPR over time), and 100∙th is the area underneath the degradation profile when there is no degradation (utopian situation). This parameter varies from 0 (severity of degradation is always 100% or condition E) to 1 (severity of degradation is always 0% or condition A). Finally, the annualised cost is computed through Equation (8).
C a n n u a l i s e d = L C C t h ,
where LCC is the life cycle cost of the maintenance strategy computed by Equation (3) and th the time horizon of the analysis (equal for all maintenance strategies considered).

4. Case Study: Ceramic Claddings in Pitched Roofs (CCPR)

The methodology described above is implemented to the CCPR. This case study considers 146 claddings located in Portugal. For each CCPR, the degradation condition was evaluated through in situ visual inspections. In addition, it should be mentioned that, in this study, a 150-year time horizon is assumed, and, furthermore, it is expected that the CCPR is in condition A in year 0. A large time horizon is used in order to guarantee a considerable percentage of the Monte Carlo simulation samples reach the end of the service life, allowing decreasing the uncertainty of the analysis.

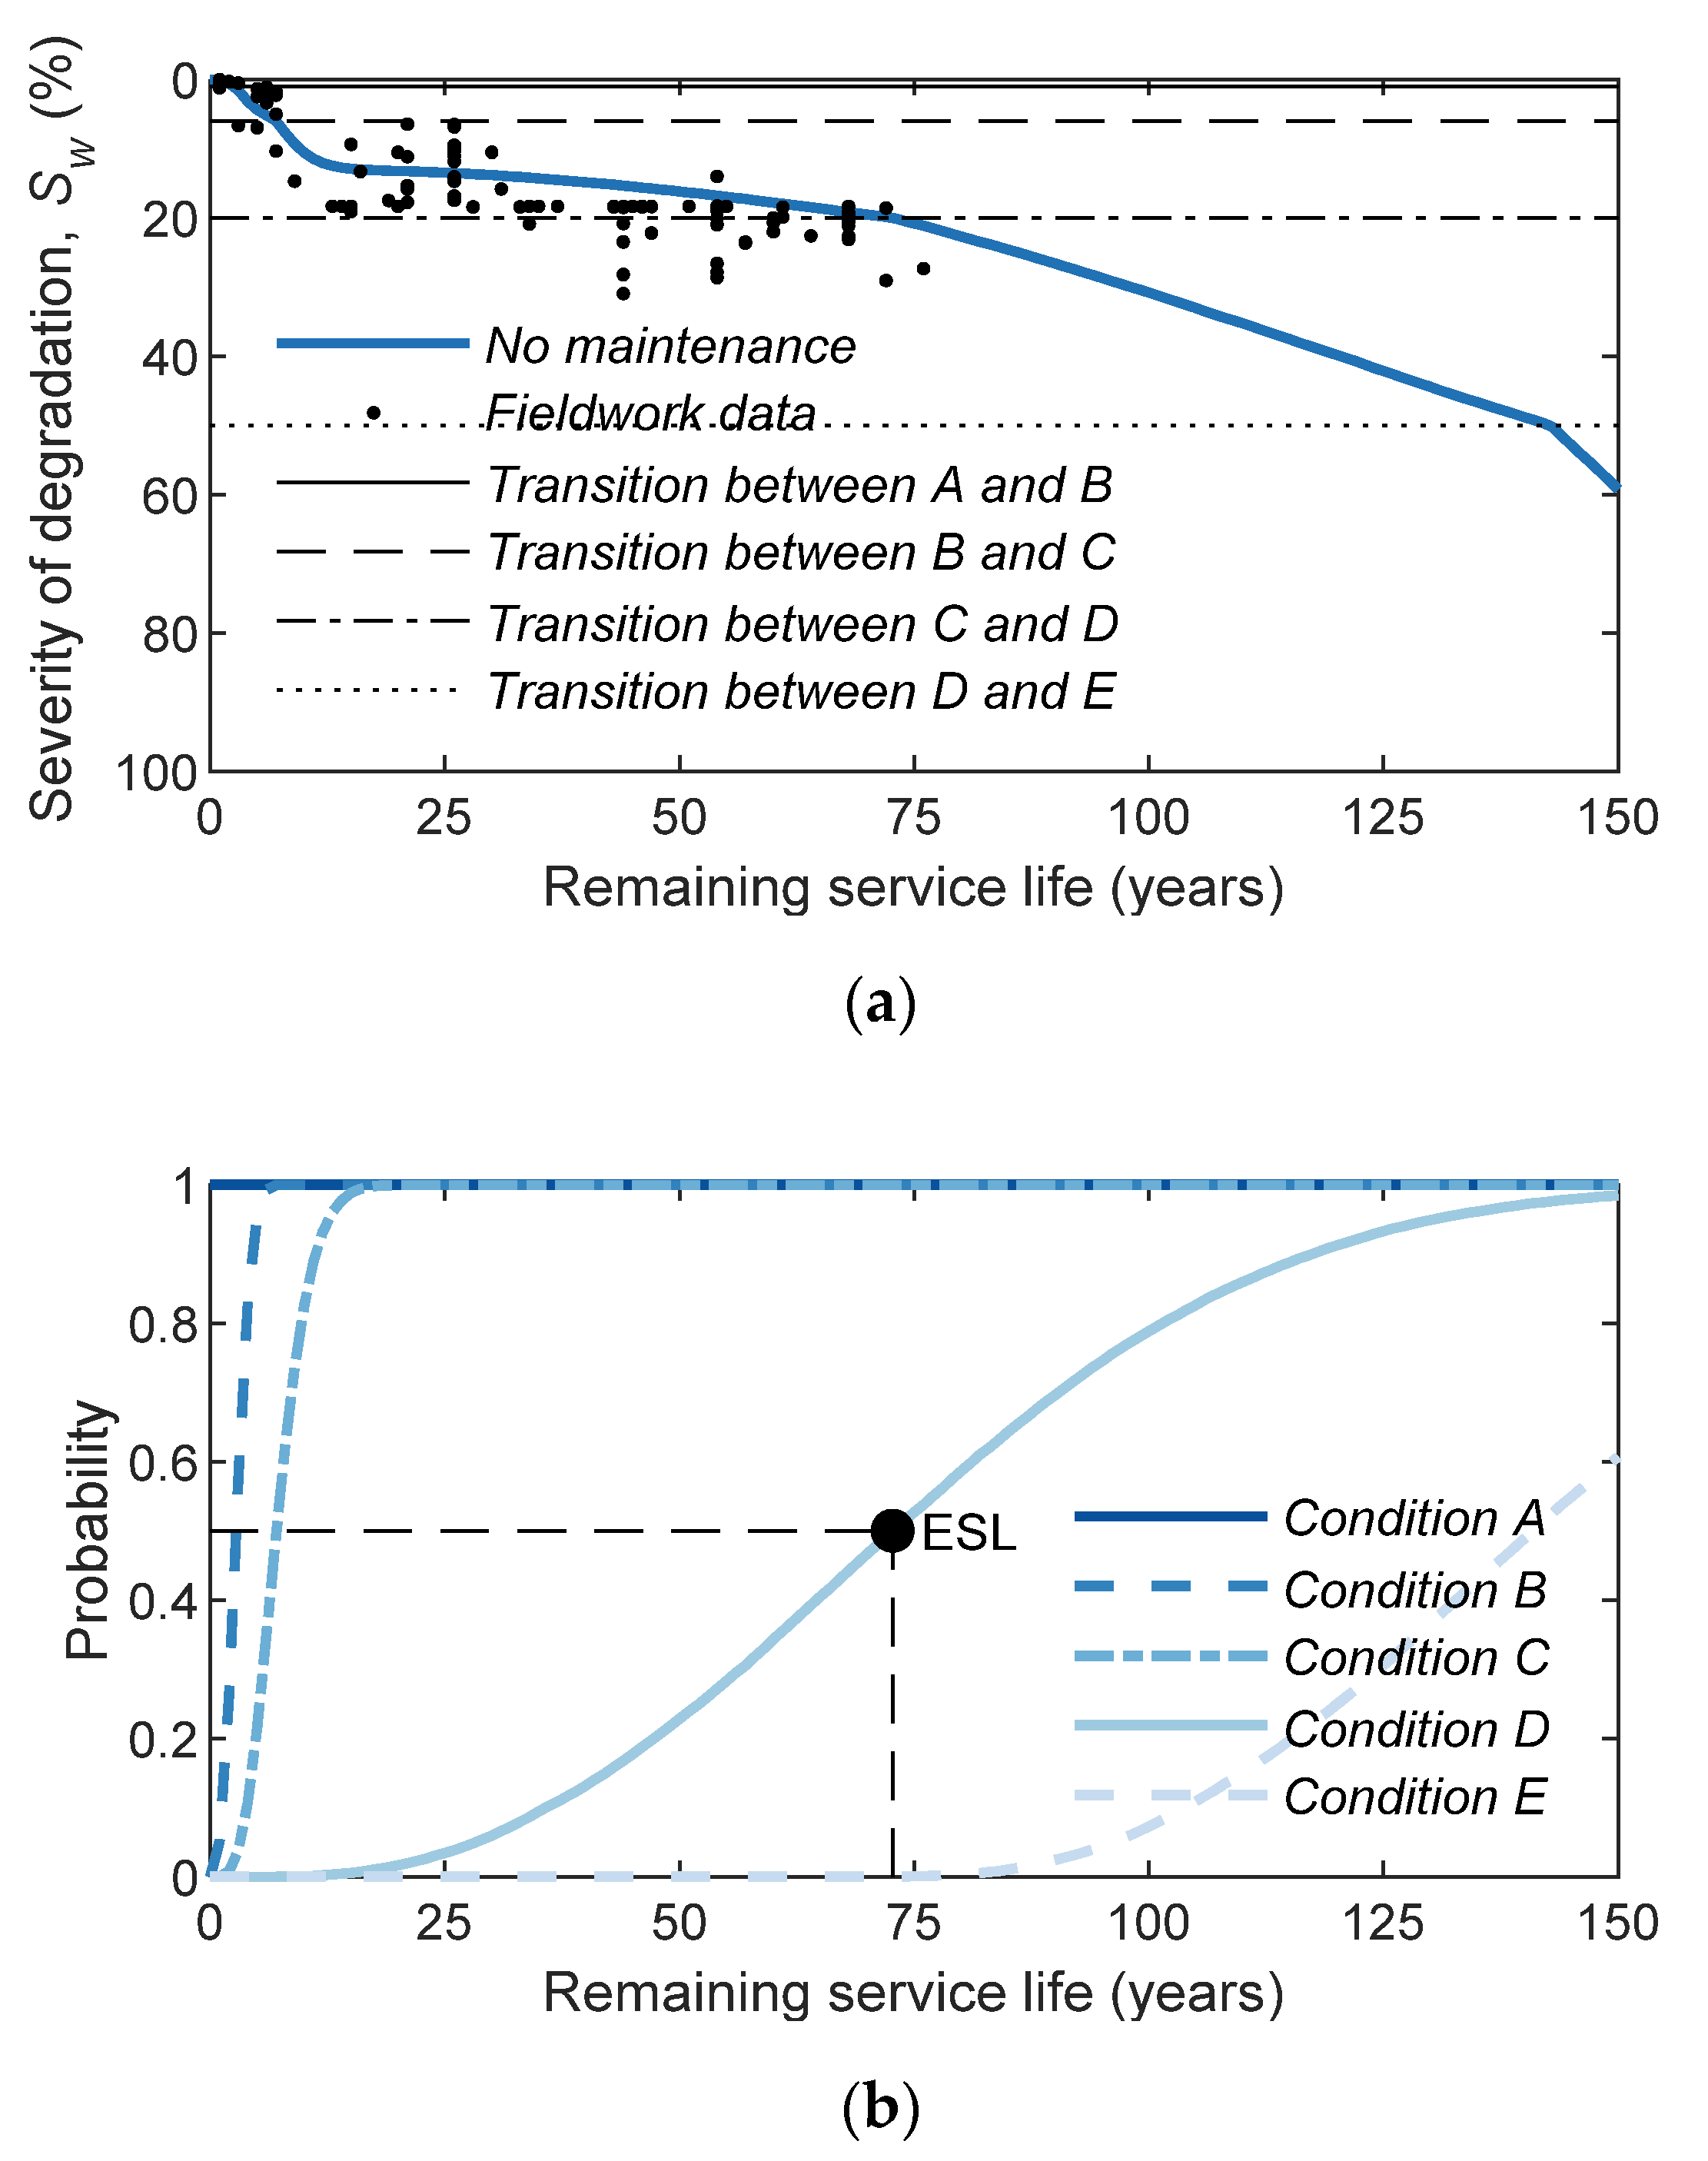
4.1. Degradation Process

4.1.1. Probabilistic Analysis

The optimal parameters of the three distribution functions analysed (exponential, Weibull and lognormal) are presented in Table 2, in terms of mean and standard deviation of the mean sojourn time in each degradation condition, as well as the respective log-likelihood value, log L. Specifically, for instance, according to a Weibull distribution, for a CCPR, a transition between condition A to B takes, on average, 2.8 years, with a standard deviation of 1.2 years; the transition between condition B to C takes, on average, 2.8 years with a standard deviation of 1.2 years; the transition between condition B to C takes, on average, 2.8 years with a standard deviation of 1.2 years; the transition between condition B to C takes, on average, 4.5 years with a standard deviation of 2.6 years; the transition between condition C to D takes, on average, 67.9 years with a standard deviation of 31.2 years; and, finally, the transition between condition D to E takes, on average, 2.8 years with a standard deviation of 1.2 years and the transition between condition B to C takes, on average, 68.1 years with a standard deviation of 3.1 years. In addition, Table 3 shows the number of predicted and observed CCPR in each degradation condition and the relative error associated with each condition.
The results reveal that two-parameter distributions (Weibull and lognormal) present a better agreement with the fieldwork data, since they present the lowest log-likelihood values and mean relative errors. Nevertheless, between them, the Weibull’s is chosen to model the degradation process of CCPR, since presents a better adjustment to the fieldwork data and more realistic sojourn times.

4.1.2. Validation

The validation of the degradation process is performed through the comparison of the predicted and observed CCPR in the different degradation conditions, as well as the relative errors computed by both models (Markov chains and Petri nets with exponential distributions). These values are shown in Table 4.
The last column of Table 4 (relationship between the results obtained by the two models) reveals that the two degradation models are similar, with the higher difference observed for degradation condition C. Therefore, it is confirmed that there is an isomorphism between both models, and the Petri nets model is appropriate to assess and describe the degradation of the CCPR.

4.1.3. Service Life

Figure 2 illustrates the degradation process of the CCPR without the impact of maintenance activities. More specifically, Figure 2a presents the degradation profile and Figure 2b the cumulative distribution functions (CDF) of the five degradation conditions. The CDF reveals: the probability of a cladding moving from one condition to the next, the expected service life and the mean sojourn time of the cladding in each degradation condition.
In terms of service life, it is assumed here that degradation condition D signifies the end of the service life (ESL) [32]. In the model, the probability of 50% between conditions C and D defines the ESL. This instant is identified in Figure 2b as the ESL. For the CCPR, an average service life (ASL) of 73 years is obtained. This value is slightly higher than the ones in the literature related to the durability of this building element [21,32,51,52,53,54,55,56] but still within the order of magnitude of the values suggested. Furthermore, it is noted that the sample analysed corresponds to a homogeneous design and execution characteristics, since the claddings in the database are owned by the Portuguese Air Force, and when the pitched roofs with ceramic tiles are properly built and maintained, their longevity and durability can be quite high [57].
Furthermore, Figure 2 also shows that, although the CCPR presented a long service life, the mean sojourn time in condition A and B (more favourable conditions) is very reduced (approximately 3 years in condition A and 5 years in condition B), showing that the presence of small anomalies leads the CCPR to move quickly from the most favourable to the following degradation conditions.

4.2. Maintenance Strategies, Assumptions and Costs

As mentioned above, MS1—only total replacement; MS2—composed of total replacement and minor intervention and MS3—composed of total replacement, minor intervention and cleaning operations are the maintenance strategies studied. The maintenance strategies were defined based on previous works [24,38] and on experts’ judgements.
MS1 is used to characterise the strategy most adopted by the owners/managers of buildings, where the CCPR are only intervened when the end of the service life is reached, with no maintenance action during this period [58]. In MS2, a minor intervention is included to delay or mitigate the degradation process without compromising important features of the building and to prevent unnecessary interruptions, allowing, in this way, to increase the service life of the CCPR [12]. Finally, in MS3, the use of cleaning operations represents the main maintenance activity (easiest and most economical) applied in CCPR [59].
Therefore, based on the methodology described in the previous sections and on the maintenance strategies defined, in the following points, the costs and the impacts of the different interventions in CCPR are presented, as well as the frequency of the inspections and the constraints of the numerical model. Lusa or Portuguese roof tiles are considered as the case study.

4.2.1. Costs of the Interventions

Table 5 presents the unit costs of the different interventions assumed in this study. The costs were adapted from the literature [60].
As mentioned above, for inspections, it is assumed that this intervention does not have any impact on the degradation of the CCPR. The purpose is to assess and identify the anomalies of the CCPR through visual assessment. In the composition of the cost, the labour cost of two inspectors (including travel expenses up to 25 km) and the production of a technical report are considered.
Cleaning operations intend to remove the aesthetic anomalies and are carried out when the CCPR reaches degradation condition B. Three levels of cleaning operations are defined in order to consider the different cleaning needs of the CCPR. Considering the degradation condition classification adopted (Table 1), the following is assumed:
  • Minor level: the total area CCPR mainly affected by surface soiling, and accumulation of the debris (anomaly AE-E1) is cleaned. This action includes personal protective equipment (protection fall) installation and low-pressure water jet cleaning.
  • Moderate level: the total area CCPR mainly affected by surface dirt, accumulation of debris and biological colonisation (anomaly AE-E1) is cleaned. This action includes personal protective equipment (protection fall) installation, low-pressure water jet cleaning and use of biocides to eliminate biological microorganisms.
  • Extensive level: the total area CCPR extensively affected by surface dirt, accumulation of debris, biological colonisation and parasitic vegetation (anomaly AE-E1) is cleaned. This action includes personal protective equipment (protection fall) installation, low-pressure water jet cleaning, the use of biocides to eliminate biological microorganisms and the use of herbicides and manual removal of parasitic vegetation.
Minor intervention is carried out when the degradation condition C is achieved and includes a cleaning operation and the local repair and/or replacement of the cladding. For the minor intervention, three intervention levels are also defined. The difference between them varies in terms of the percentage of area affected by the anomalies and the maintenance works used. In the minor level, one-half of the % area affected (maximum value) by the anomalies is considered in degradation condition C of the classification system adopted, in the moderate level, it is assumed that three-quarters of the % area affected (maximum value) by the anomalies is in degradation condition C of the classification system adopted and, finally, in the extensive level, the whole area affected by the anomalies is considered in degradation condition C of the classification system adopted. Therefore, considering the degradation condition classification adopted (Table 1), the following is assumed:
  • Minor level: cleaning operation of moderate level: repair and/or replacement up to 15% of the cladding affected by peeling/flaking/exfoliation (anomaly AE-F1), replacement up to 5% of the cladding affected by cracking/fracture (anomaly AE-F2), repair up to 5% of the cladding affected by detachment/cladding release (anomaly AE-F3) and repair up to 13% of the cladding affected by misalignment of the cladding (anomaly AE-S2), including replacement of the rafters/framing (tiles supporting system) in a suitable area (when necessary).
  • Moderate level: cleaning operation of moderate level: repair and/or replacement up to 23% of the cladding affected by peeling/flaking/exfoliation (anomaly AE-F1), replacement up to 8% of the cladding affected by cracking/fracture (anomaly AE-F2), repair or replacement up to 5% of the cladding affected by detachment/cladding release (anomaly AE-F3) and repair up to 19% of the cladding affected by misalignment of the cladding (anomaly AE-S2), including replacement of the rafters/framing in a suitable area (when necessary).
  • Extensive level: cleaning operation of moderate level: repair and/or replacement up to 30% of the cladding affected by peeling/flaking/exfoliation (anomaly AE-F1), replacement up to 10% of the cladding affected by cracking/fracture (anomaly AE-F2), replacement up to 5% of the cladding affected by detachment/cladding release (anomaly AE-F3) and repair up to 25% of the cladding affected by misalignment of the cladding (anomaly AE-S2), including replacement of the rafters/framing in a suitable area (when necessary).
Regarding minor interventions, anomaly AE-S1 (pronounced cladding deformation) is not considered, since, for its resolution, it would be necessary to intervene in the structure of the roof, which is outside the scope of the maintenance of the CCPR.
Finally, total replacement of the pitched roofs’ ceramic cladding is applied when the degradation condition D or higher is achieved. This intervention includes the personal protective equipment (protection from falls) installation, the demolition of the old cladding, the application of the new cladding and transport to landfill of construction waste generated.

4.2.2. Impacts of the Interventions

The impacts that the different interventions have in the CCPR are shown in Table 6. These parameters are computed through the assumptions expounded in Section 4.2.1 and the methodology described in Ferreira et al. [61]. For instance, a minor intervention of moderate level has a cost of 24.14 €/m2 (Table 5). This action is applied for a cladding in condition C, allowing improving, with a probability of 70.8%; the cladding’s condition to condition A, with a probability of 24.0%, and to condition B, with a probability of 5.2%, causes no significant improvement (i.e., maintains condition C).
For cleaning operations, the impact of the three levels is the same, since the difference between them concerns only the type of products used, and, for minor interventions, the impact of the three levels is similar, because the claddings part of the database in degradation condition C represents a reduced percentage of area with anomalies AE-F1, AE-F2, AE-F3 and AE-S2 (Table 1). In this way, in what follows, only the moderate intervention level is considered.

4.2.3. Inspection Frequency

In terms of inspection frequency, the interval adopted between inspections varies from six months to two -years, with a mode of one year. These values are defined through a literature review [21,23]. The inspection frequency is modelled in a deterministic manner. In a first approach, the value of one year is considered, and, posteriorly, the maximum and minimum values are used to perform a sensitivity analysis about how the inspection frequency influences the performance of the CCPR (Section 4.4).

4.2.4. Constraints

The proposed model presents the following constraints: (1) after two consecutive cleaning operations, this action is no longer efficient, and therefore, a minor intervention or total replacement should be performed, and (2) after two minor interventions, this action is no longer efficient, and a total replacement is required.

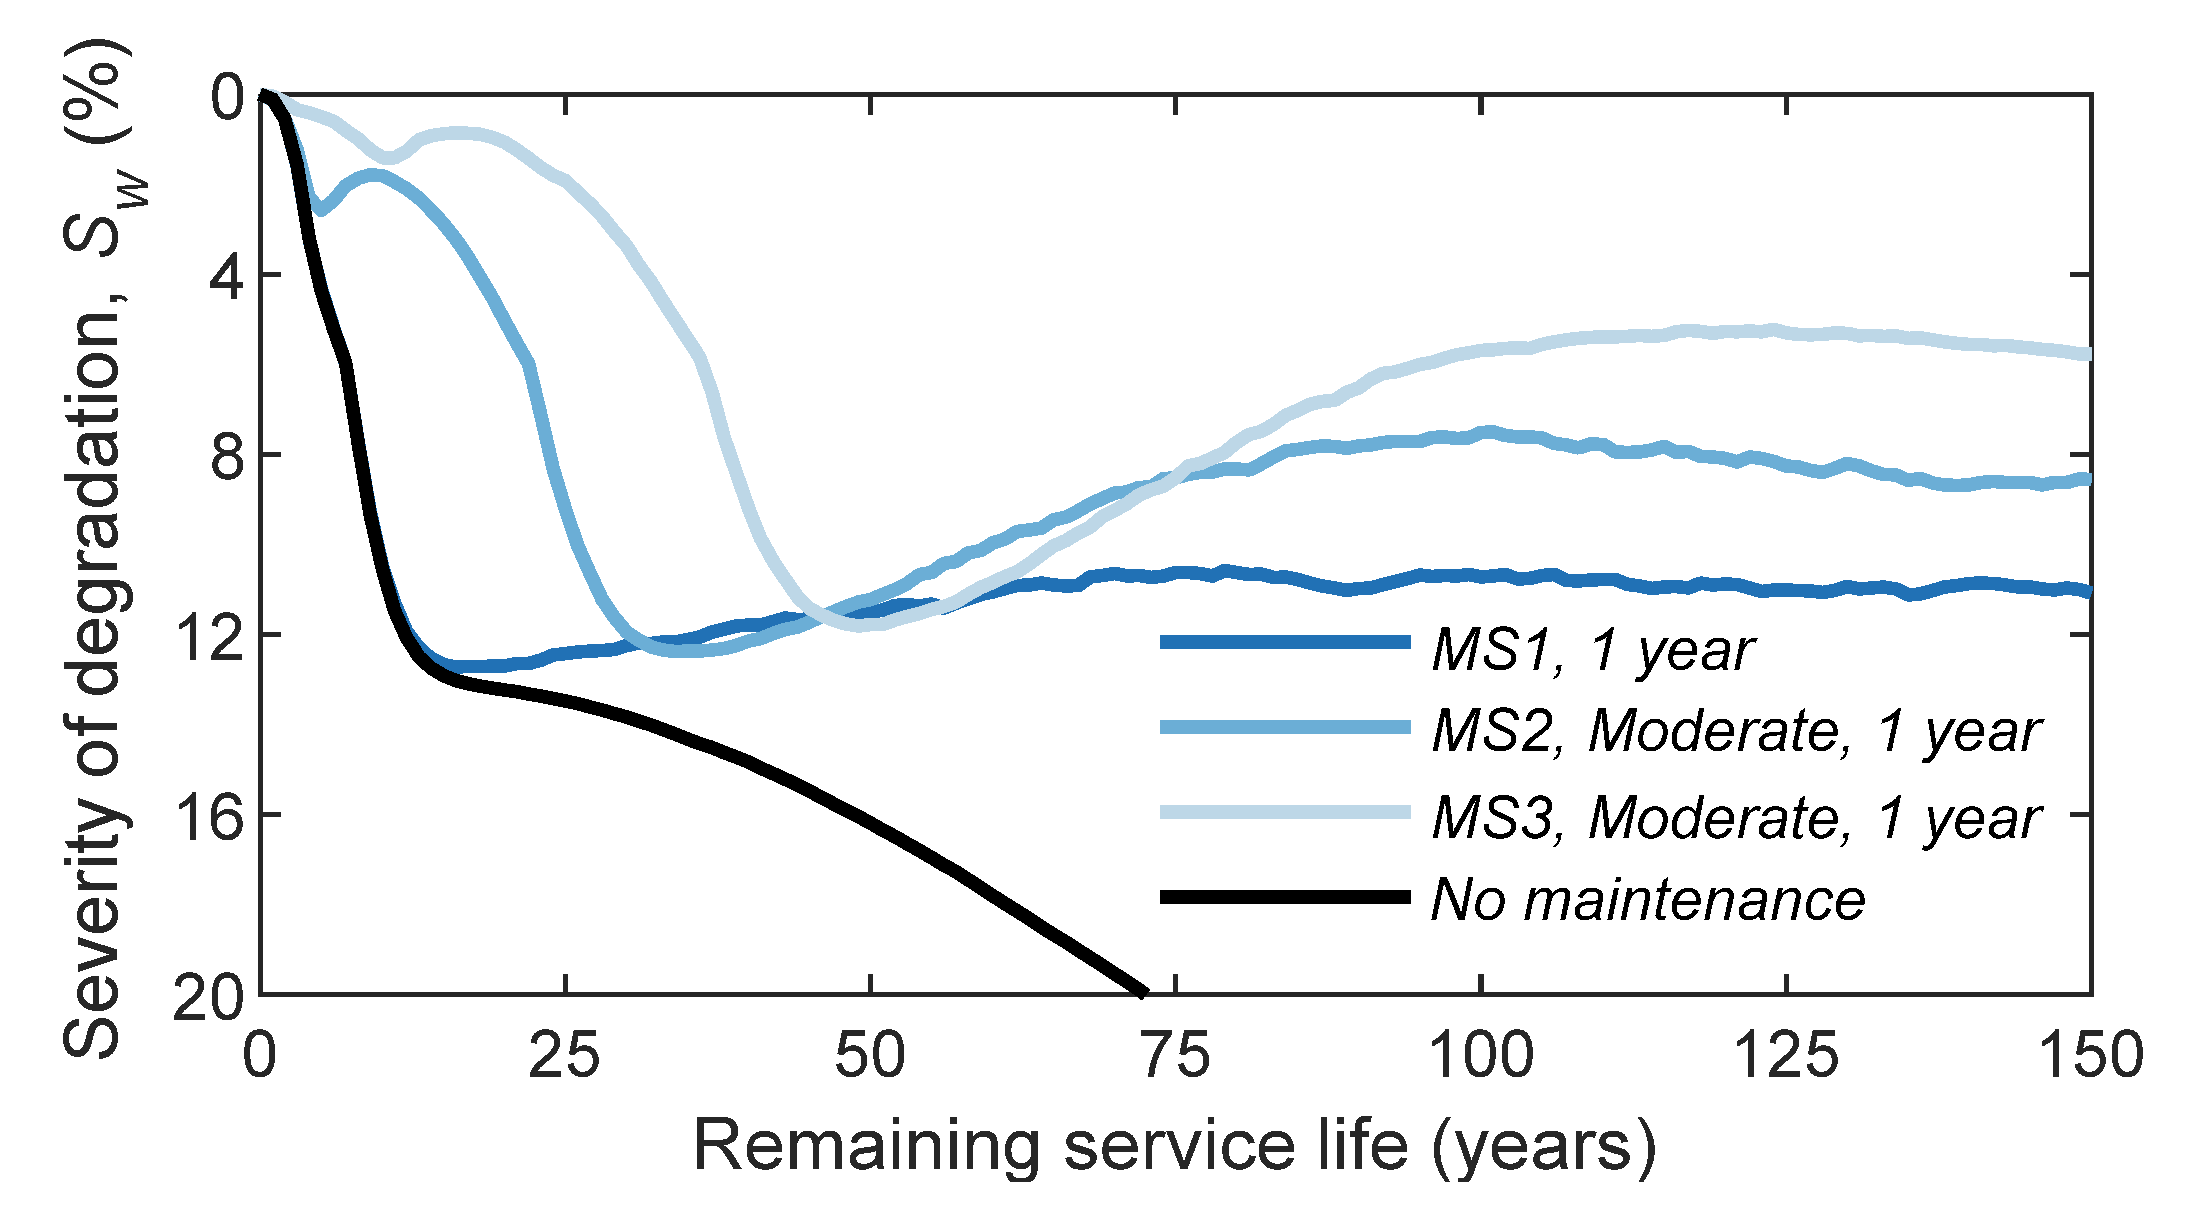
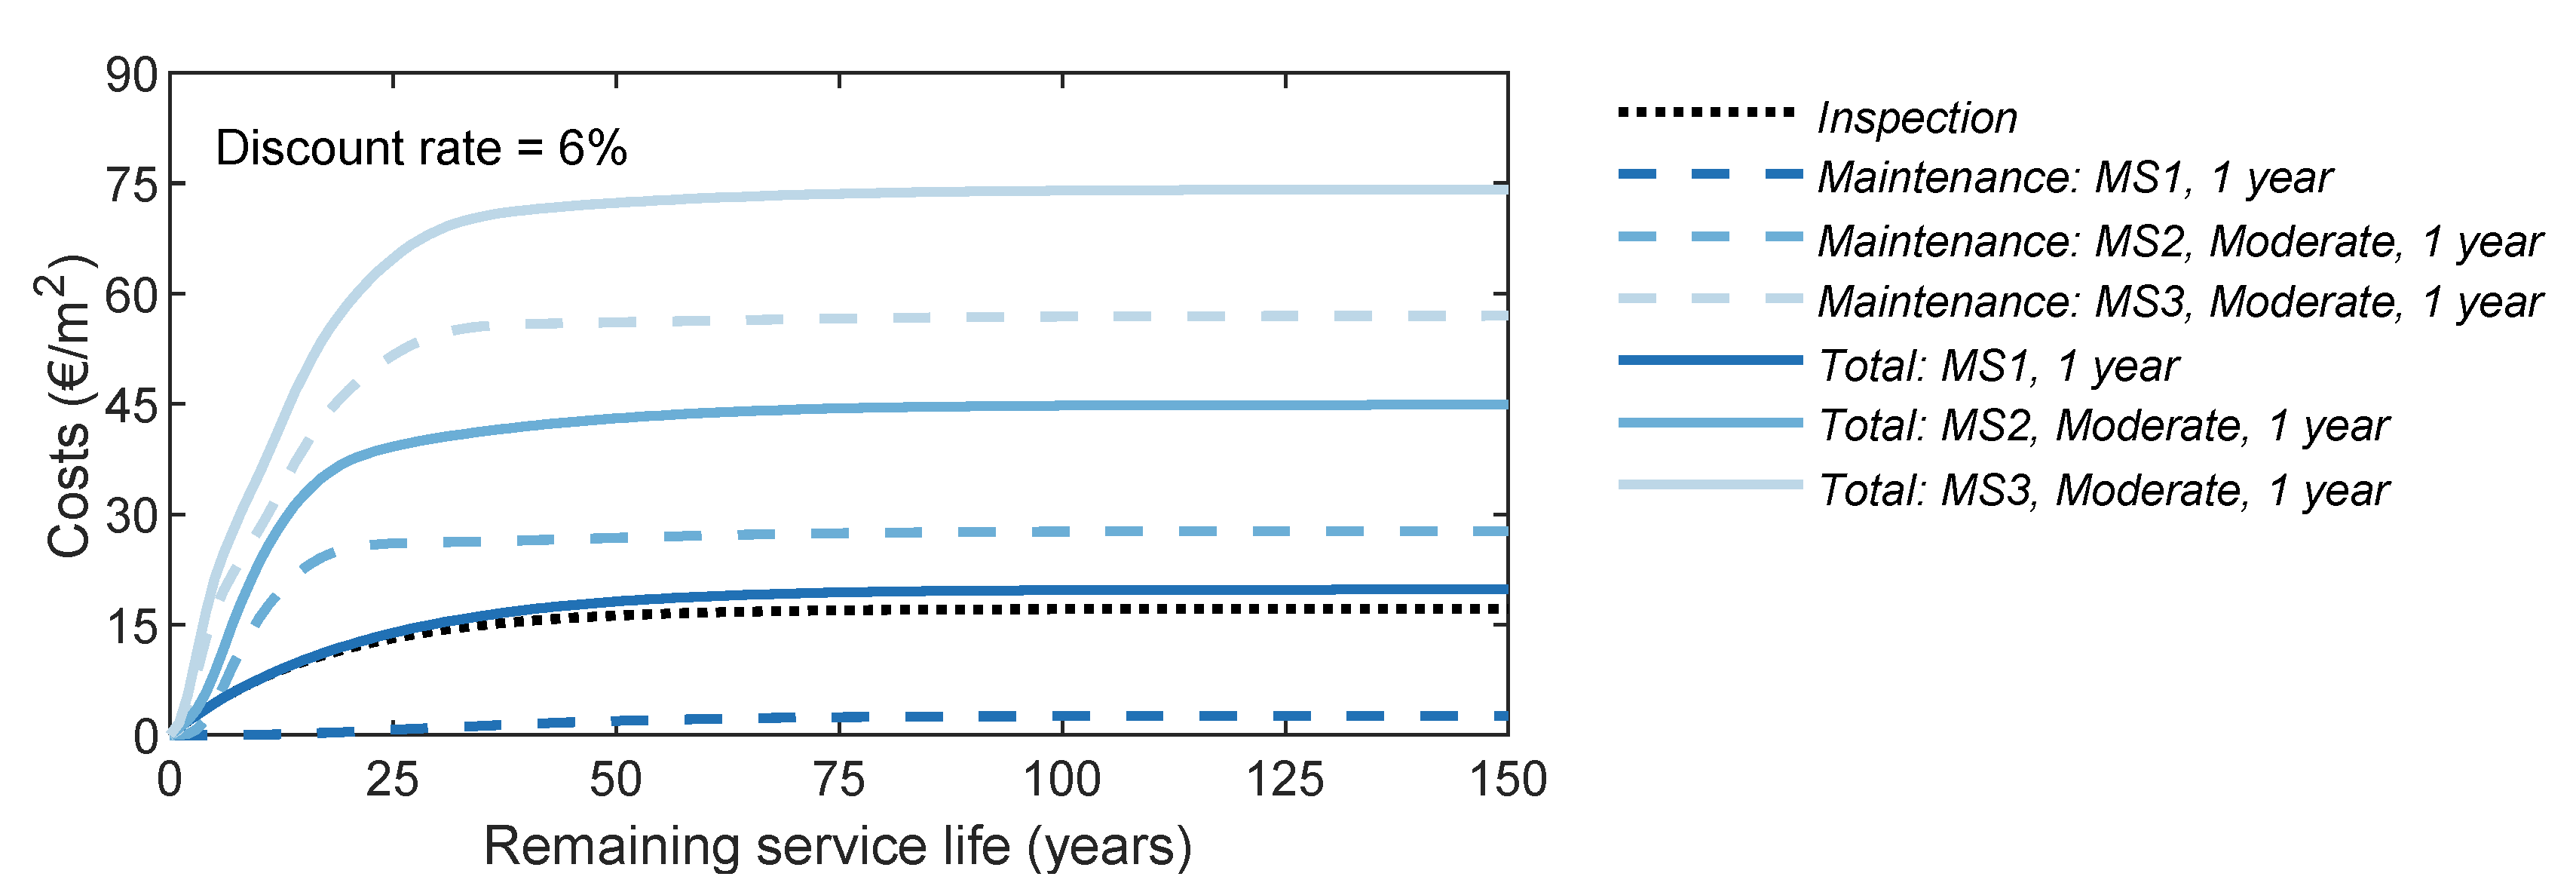
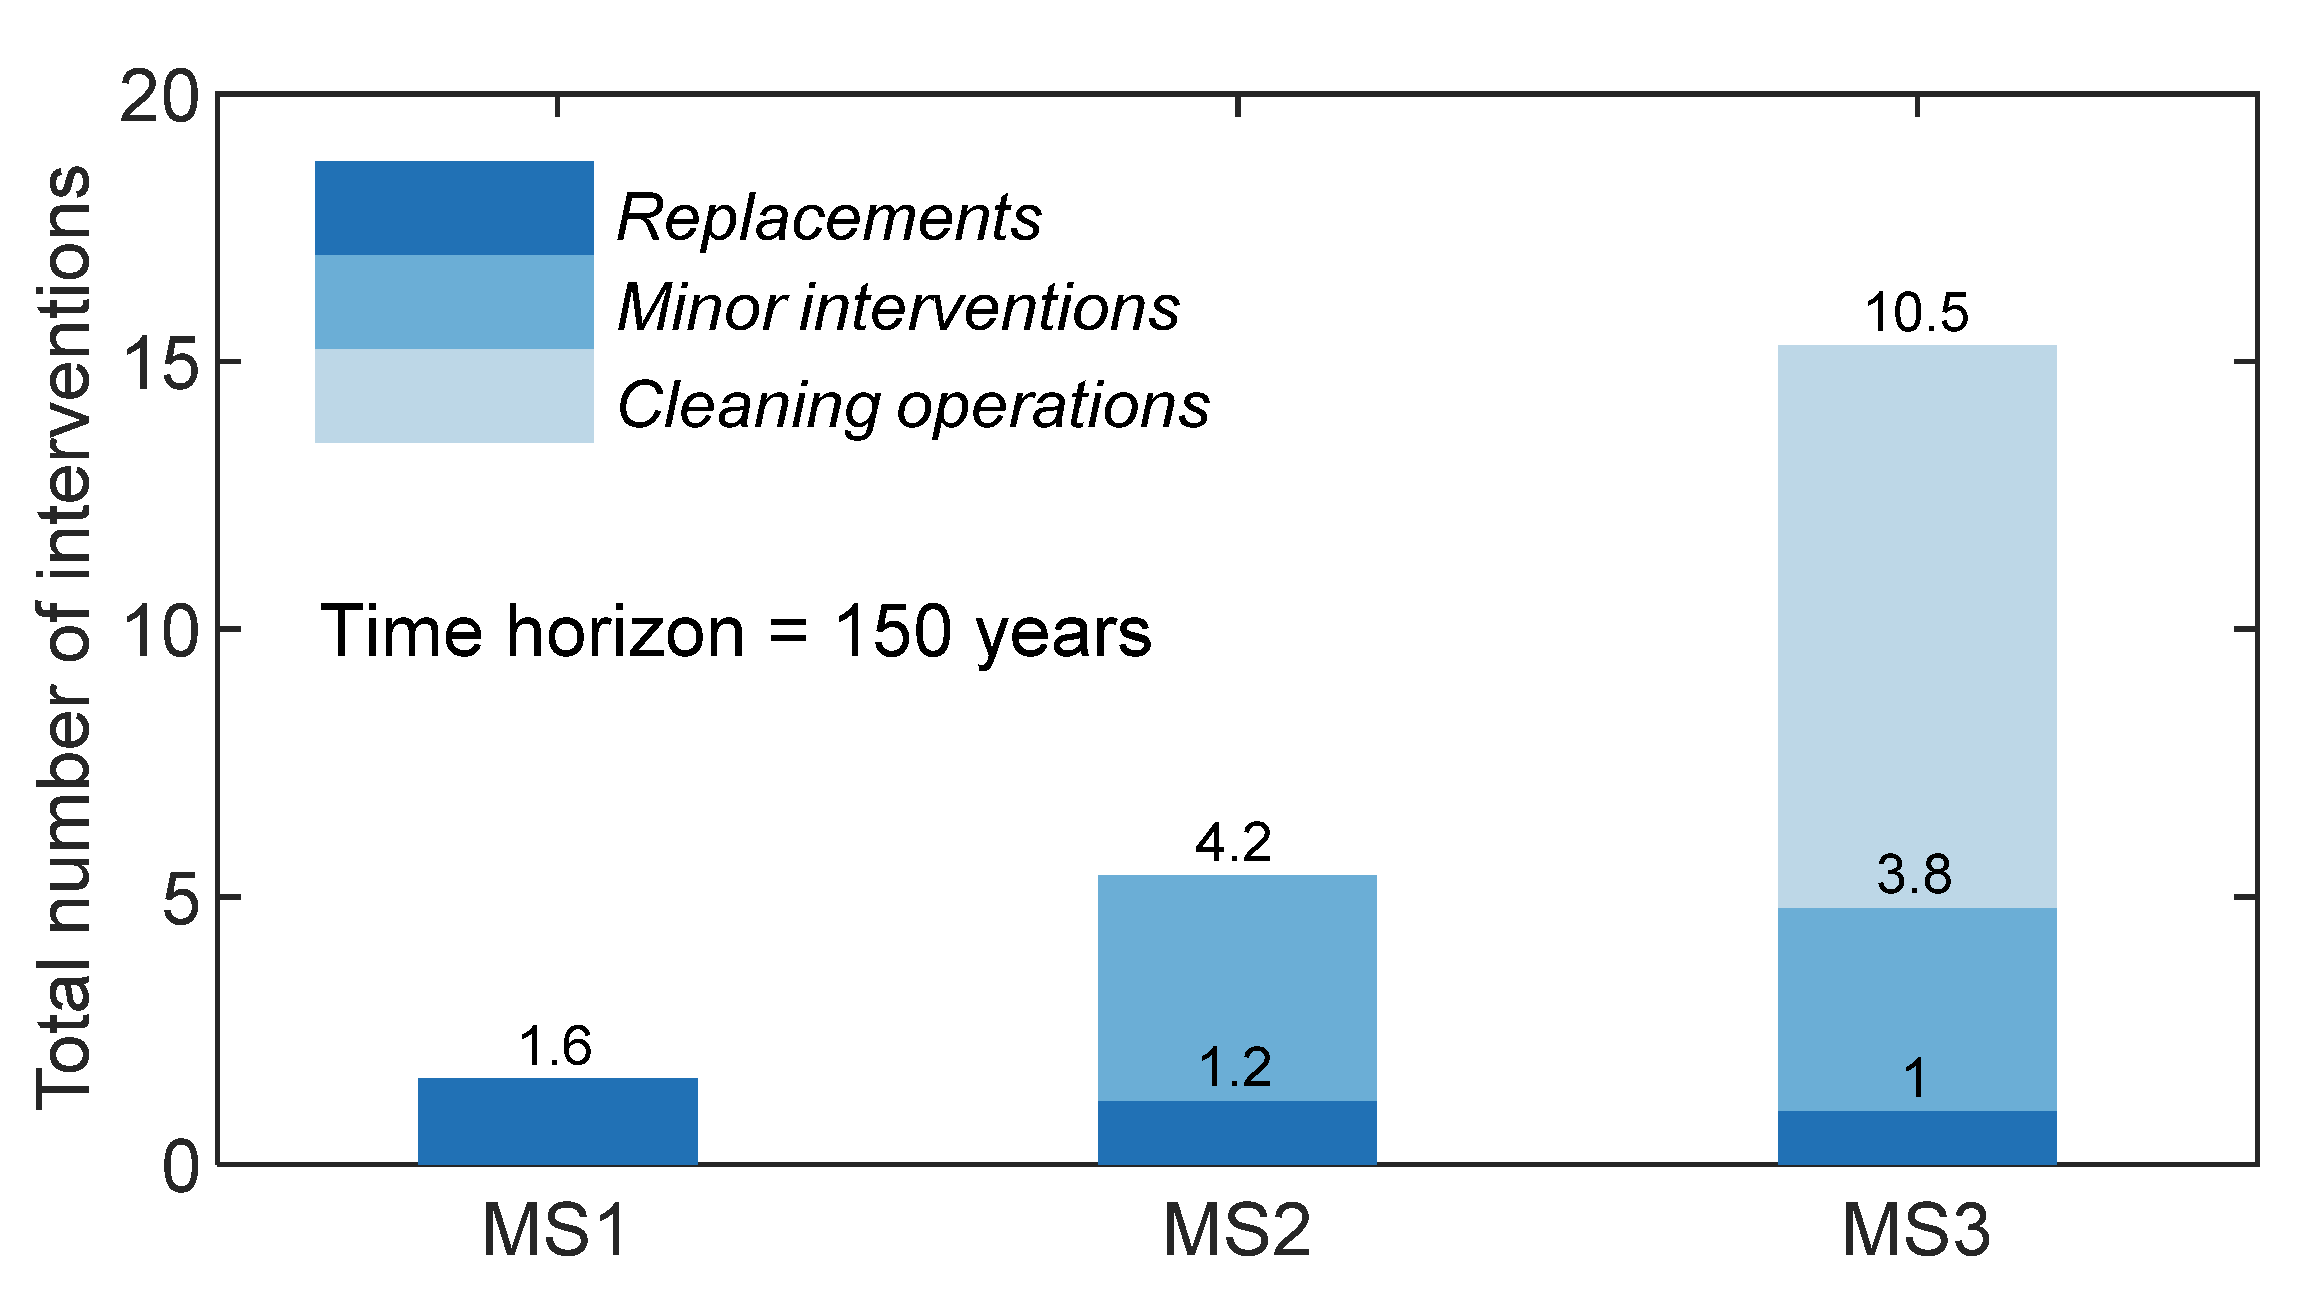
4.3. Maintenance Strategies Comparison

The degradation profiles obtained for the three maintenance strategies considered and for the situation without maintenance are compared in Figure 3.
The results reveal that considering preventive maintenance activities (such as cleaning operations and minor interventions) leads to an improvement of the performance (in terms of degradation) of the pitched roofs’ ceramic claddings. As the maintenance strategies become more complex (MS1, MS2 and, finally, MS3), the moment in which the worst mean severity of degradation, Sw, is reached, occurring later in the time horizon and the impact on the mean severity of degradation, Sw, over time is greater. In other words, MS3 is the one that presents a better mean severity of degradation, Sw, over time. However, if the operations costs associated with the three maintenance strategies are analysed (Figure 4), EM3 is the alternative with the highest maintenance costs, while MS1 is with the lowest maintenance costs. For example, at year 150, MS3 presents a life cycle cost of 74.14 €/m2 (23% of the cost is spent in inspections), while, for MS1, a life cycle cost of 19.78 €/m2 is estimated (87% of the cost is spent in inspections). These results are expected, since a number of interventions have a directed relationship with the maintenance costs (Figure 5), since the increase of the number of interventions implies the increase of the maintenance costs.
By analysing the instant when the first full renewal of the CCPR (i.e., total replacement) is carried out, the results shows that more complex maintenance strategies increase the service life of CCPR. It is assumed that the ESL is achieved when the first full renewal of the CCPR is carried out. In the model, the probability of total replacement equal to 50% defines the ESL. For instance, Figure 6a presents the cumulative distribution functions of the total replacement computed for the different maintenance strategies analysed. An ESL of 73 years is estimated for MS1. For MS2, this value increases to 87 years, and for MS3, it increases to 101 years. For the situation without maintenance (Section 4.1.3) and MS1, the ESL is equal. Since MS1 only considers a total replacement, the behaviour of both degradation profiles is equal until the degradation condition D is achieved for the first time. Therefore, in the situation without maintenance, the cladding continues to degrade until degradation condition E is reached (or Sw = 100%), while, in MS1, a total replacement of the cladding is carried out when the cladding achieves condition D, which allows improving the cladding to degradation condition A (or Sw = 0%). Instead, an analysis of the instant in which the first minor intervention occurs is analysed, revealing that cleaning operations postpone its need. For example, for MS2 and MS3, the minor interventions’ cumulative distribution functions are compared in Figure 6b. Considering MS2, at year 12, the cladding that has a probability of 90% has already been intervened at least once. For MS3, this probability is delayed to year 17. However, if the analysis is expanded to the instant of the second minor intervention, in year 21, for MS2, the cladding presents a probability of 90% that has already been intervened at least twice, while, for MS3, this probability is postponed to year 31.
The efficiency indexes and the performance indicators are compared in Table 7. As expected, by comparing with the situation without maintenance, all maintenance strategies improve the performance (in terms of degradation) of the CCPR. In addition, it is found that MS3 is slightly more efficient than MS1 or MS2 (higher efficiency index). In this maintenance strategy, the mean sojourn time in conditions A and B (best conditions) is clearly higher. However, if the performance indicator is assessed (relation between the EI and the annualised costs), MS1 is the alternative more advantageous. Although MS3 is the most efficient, this maintenance strategy is also the most expensive (Figure 4). Therefore, the performance indicator reveals that the increase in the cost of MS3 is not compensated by the improvement in the CCPR condition, when compared with MS1 or MS2.

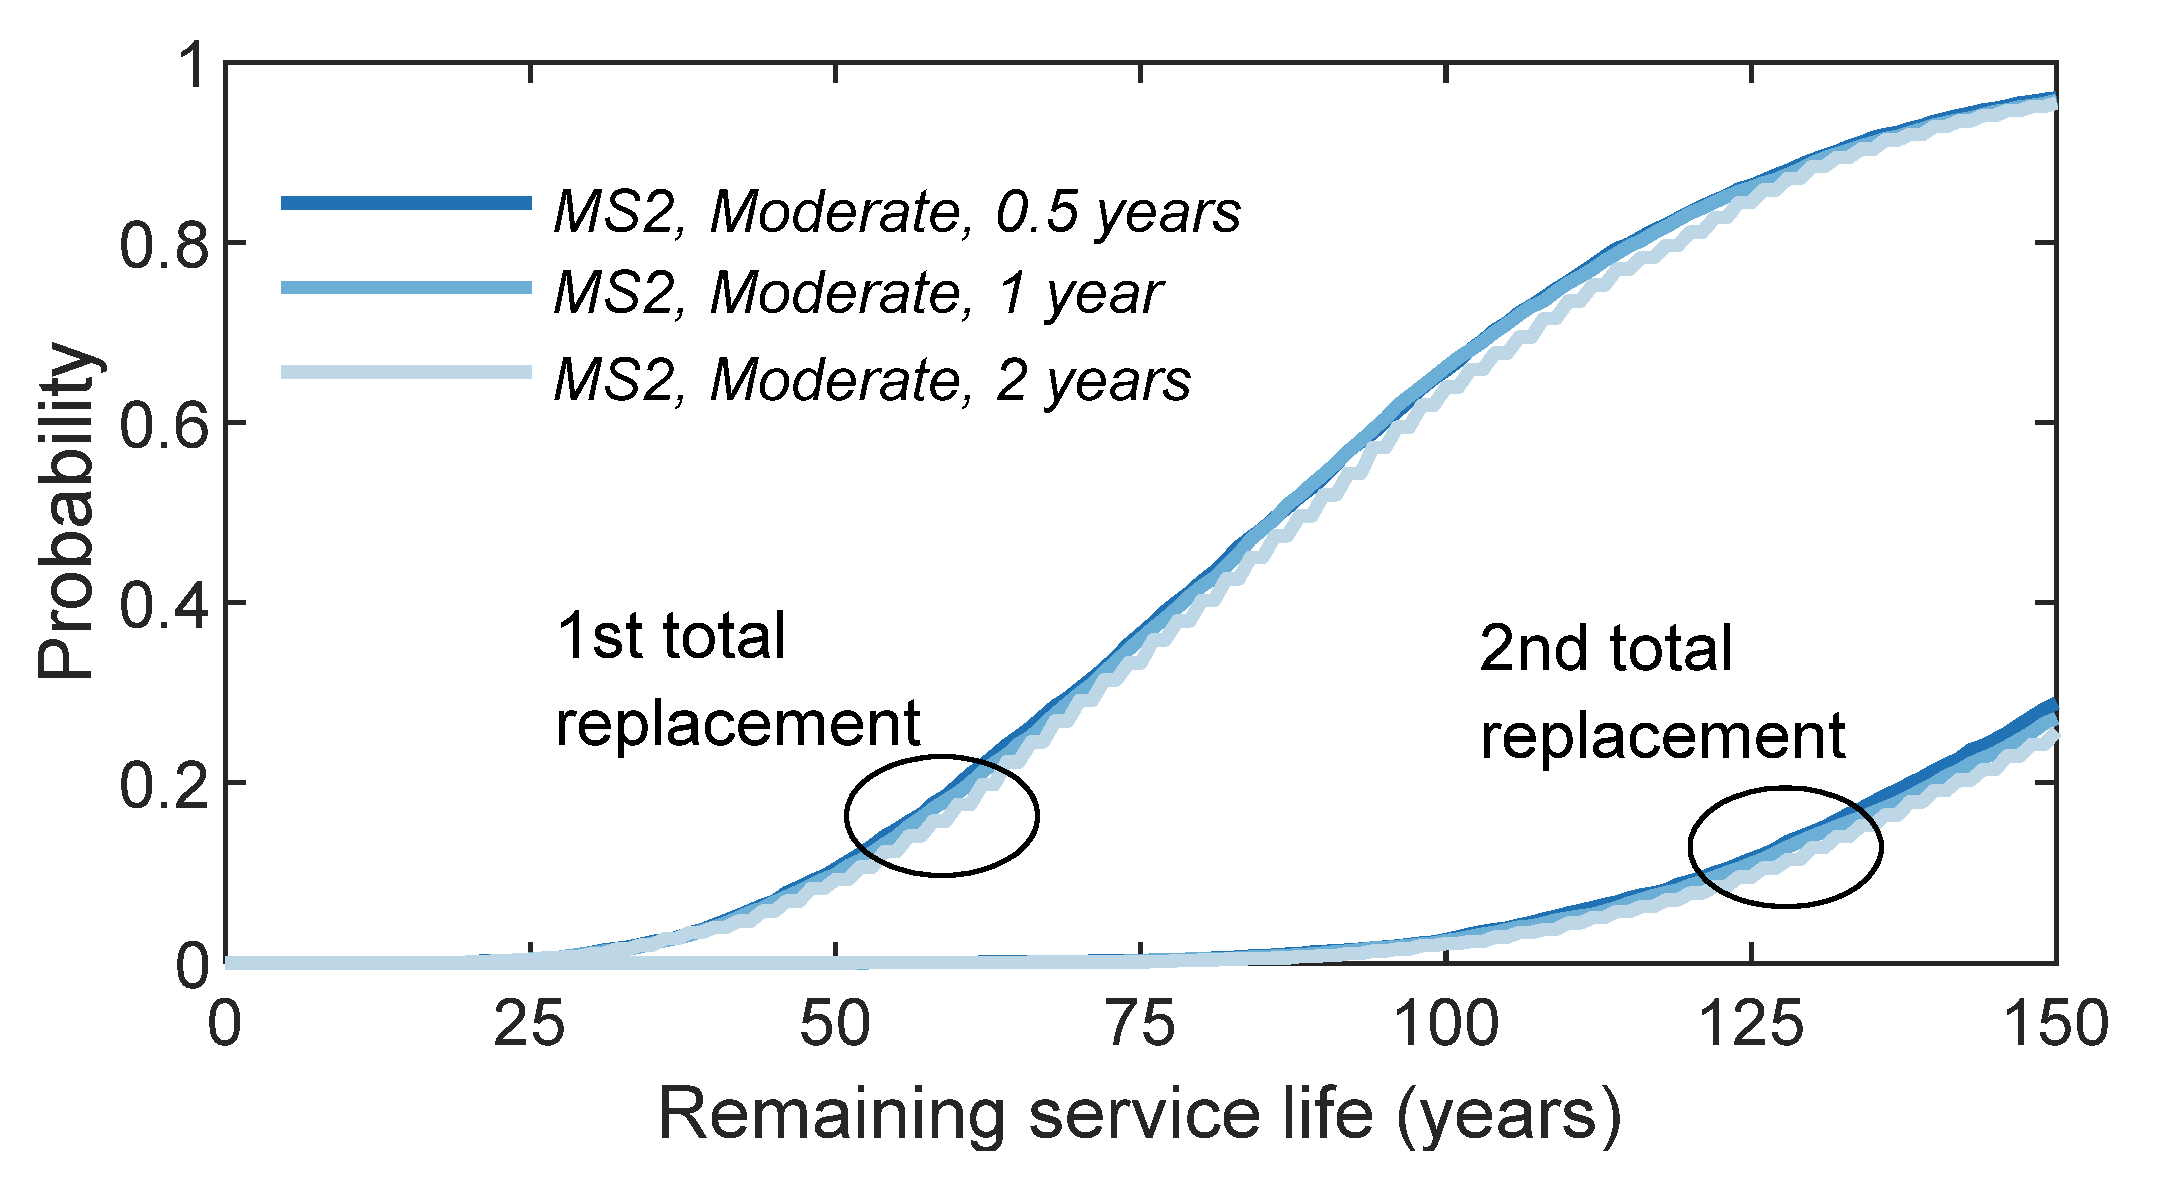
4.4. Inspection Frequency Sensitivity Analysis

To assess the influence of the inspection frequency on the degradation and maintenance costs of pitched roofs’ ceramic claddings, three-time intervals between inspections are analysed, considering the use of MS2 with a moderate intervention level. The time intervals considered are six months and one and two years. For the three inspection frequencies, the degradation profiles are presented in Figure 7, and the cumulative costs profiles are shown in Figure 8.
Figure 7 shows small differences in the degradation profiles. Over the time horizon, the behaviour and severity of the degradation values of the three degradation profiles are similar. However, Figure 8 reveals an increase of the maintenance costs for the time interval between inspections of six months, a consequence of the increase of the frequency of visual inspections carried out on pitched roofs’ ceramic claddings. At year 150, a six-month inspection frequency presents a life cycle cost of 63.14 €/m2 (55% of the cost is spent in inspections) while, for a two-year inspection frequency, a life cycle cost of 34.75 €/m2 is obtained (24% of the cost is spent in inspections).
In addition, for the three inspection frequencies, if the first total replacements’ cumulative distribution functions are compared (Figure 9), the results for the service life are also similar. For the six-month and one-year intervals, the probability of interventions being carried out earlier is slightly higher. This happens because inspections are performed more frequently, so there is a higher probability that the interventions will be carried out earlier. For these two intervals (six months and one year), an ESL of 87 years is the estimated while, for the time interval between the inspection of two years, the ESL increases to 89 years.
Finally, the efficiency indexes and the performance indicators for the three inspection frequencies are compared in Table 8. The results show that there are benefits in increasing the inspection frequencies in pitched roofs’ ceramic claddings, since a longer period does not compromise the claddings’ degradation conditions.

5. Multi-Criteria Analysis

The decision about the type of maintenance strategy to be implemented in one element can only be made by the owners/managers of the buildings. This decision process is rather subjective [62], since different decision-makers assign different weights to different criteria. However, the best choice is the one that considers all parameters available, such as: budget limitations, aesthetic appearance, desired condition level, local constraints and the social and economic contexts of the building, among other criteria.
A multi-criteria decision analysis (MCDA) can be used to manage all the information available, in a logical way, and aid decision-makers to identify a single option to select a short list of options for future detailed appraisals or to differentiate between acceptable and unacceptable possibilities [63]. An additive aggregation approach with compensatory rationality is implemented in this study. In this methodology, Equation (9) is used to rank the different options [64].
X i = j = 1 m λ j · x i j ,   with   j = 1 m λ j = 1   ( or   100 % ) ,
where Xi is the global ranking of the option i, λj the weight of criterion j and xij the standardised classification of option i, according to criterion j. Since the different criterion studied have different scales, a standardisation by interval is implemented in this study, using Equation (10) for an increased order of preference and Equation (11) for a decreased order of preference [47].
x i j = X i j min X i j max X i j min X i j ,
x i j = max X i j X i j max X i j min X i j ,
where Xij is the classification of option i according to criterion j, and min Xij and max Xij are, respectively, the minimum and maximum value of criterion j.
The results presented in Section 4.3 and Section 4.4 allow concluding that considering more complex maintenance strategies (for example, considering minor interventions and/or cleaning operations) increases the performance of the pitched roofs’ ceramic cladding’s degradation, promoting the durability of these claddings; however, these maintenance strategies lead to higher life cycle costs. For example, as the maintenance strategies become more complex (MS1, MS2 and, finally, MS3), the greater is the impact on the mean severity of the degradation (Figure 3) and the service lives of the claddings (Figure 6a) are. However, more complex maintenance strategies lead to higher maintenance costs (Figure 4), since a higher number of interventions are performed (Figure 5), consequently leading to a worse balance between the operation cost and efficiency. That is to say, although more complex maintenance strategies are more efficient, they are also more expensive, showing that, when compared with simpler maintenance strategies, the increase in the operation costs is not compensated by an improvement in the condition of the claddings over their lifetime (Table 7). Regarding the inspection frequency (Table 8), there are benefits in increasing the time interval between inspections in relation to the most common value (one year), since a longer period does not compromise the degradation condition of the CCPR and decreases the maintenance costs.
If, for the owners/managers, the choice of the best maintenance strategy is taken solely from the perspective of the life cycle costs (LCC), the best alternative is the solution with the lowest LCC. In these terms, the MS1 corresponds to the best alternative, while MS3 (a more complex maintenance strategy) represents the worst option. However, when all criteria are considered, other conclusions can be drawn. Therefore, in this study, the different maintenance strategies (options) are globally ranked in terms of durability (service life), performance (efficiency index) and maintenance costs. For that purpose, four scenarios are analysed, considering three criteria: (1) efficiency index, (2) maintenance costs including in the inspection costs and (3) the number of total replacements during the time horizon. The results obtained are presented in Table 9, Table 10, Table 11 and Table 12, and it should be noted that all solutions considered in this study are technically valid. In these tables, in columns two to four, the three criteria are standardised according to Equations (10) and (11); in column five, the maintenance strategies considered are rated according to Equation (9) and, in column six, the rate of the maintenance strategies is standardised according to Equations (10) and (11). For instance, according to the results presented in Table 9 (equal weight for the three criteria), the following observations can be drawn: for criterion 1 (efficiency index), MS1 presents the worst value over the time horizon, while MS3 shows the best value, for criterion 2 (maintenance costs), the results reveal that MS1 is the least expensive maintenance strategy, while MS3 is the most expensive, and, for criterion 3 (number of total replacements), the results show that MS3 is the maintenance strategy with less total replacements over the time horizon, while MS1 is the one with more total replacements. Consequently, in a global way, the results allow concluding that for this scenario; MS3 is the best solution, since it is the option with the highest standardised total rating. The same analysis can be used for the other scenarios.
When a MCDA is adopted, the MS1 is no longer the most beneficial maintenance strategy. In fact, for three of the four scenarios (1, 2 and 4), MS1 is ranked as the least advantageous strategy, while MS3 is defined as the most advantageous strategy. These results are expected, since MS1 has a higher number of total replacements during the time horizon, which causes a greater inconvenience to users in terms of normal use of the building and has a higher environmental impact, which is not considered in this cost analysis. In addition, MS1 has also the lowest efficiency index, not contributing to improve the quality and aesthetic perception of the cities and increasing the risks to the users. Furthermore, if a higher emphasis is given to the maintenance costs (Table 11), MS1 does not represent the most advantageous strategy. In this scenario, MS2 with an inspection frequency of two years is defined as the most beneficial strategy, while MS2 with an inspection frequency of six months is the least beneficial strategy.
Based on these results, in an overall analysis, consideration of the maintenance activities (minor interventions and cleaning operations) is preferable. From these four scenarios, MS3 (the most advantageous strategy) only loses to MS2 with an inspection frequency of two years if a higher emphasis is given to maintenance costs. On the other hand, the results show, in general, that MS1 is the least advantageous alternative.
Finally, the multi-criteria analysis is a tool to aid decision-makers to make more rational and informed decisions based on objective criteria. Nevertheless, the subjective criteria that always influences the decision-making process, such as the decision-makers’ backgrounds and perceptions, are practically impossible to model. Therefore, this type of criteria is beyond the scope of this study. Nevertheless, in future analyses, other criteria and scenarios can be evaluated depending on the decision-maker’s requests.

6. Conclusions

In this study, a life cycle condition-maintenance model, based on a Petri net framework, was applied to analyse the influence of alternative maintenance strategies over time and to promote the durability of pitched roofs’ ceramic claddings in a cost-effective way. For that purpose, MS1 (composed only of a total replacement); MS2 (composed of a total replacement and minor intervention) and MS3 (composed of a total replacement, minor intervention and cleaning operations) were analysed. At the end, a MCDA was performed to assess the performance of the different maintenance strategies, considering the economic impact and the durability.
The results show that the consideration of complex maintenance activities increases the service life of the pitched roofs’ ceramic claddings. By comparing with MS1, MS2 increases the predicted service life of the claddings by 19% (14 years), while MS3 leads to an increase of 38% (28 years). Furthermore, the results show that more detailed and intrusive maintenance strategies are slightly more efficient. However, in terms of costs, the opposite is observed: the increase in the number of actions has a greater impact on the operation costs of the maintenance strategies. Regarding the inspection frequency, there are benefits in increasing the time interval between inspections in relation to the most common value (one year), since a longer period does not compromise the degradation condition of the CCPR and decreases the maintenance costs.
In the MCDA, the different maintenance strategies (options) are globally ranked in terms of durability (service life), performance (efficiency index) and maintenance costs. The results show that, in three of the four scenarios analysed (1, 2 and 4), MS3 is ranked as the most advantageous maintenance strategy, while MS1 is defined as the least beneficial strategy. The best option is MS2 with an inspection frequency of two years only if a higher emphasis is given to maintenance costs (scenario 3). Therefore, these results demonstrate that, if a greater importance is given to a cladding’s durability and aesthetical appearance, more complex maintenance strategies are clearly the best options. For example, if the choice of the best maintenance strategy is taken solely from the perspective of life cycle costs (LCC), the best alternative is the solution with the lowest LCC, revealing that MS1 corresponds to the best alternative, while MS3 (more detailed and intrusive maintenance strategy) represents the worst option.

Author Contributions

Conceptualisation, C.F., A.S. and J.d.B.; methodology, C.F.; software, C.F.; validation, C.F.; investigation, C.F., A.S., J.d.B., I.S.D. and I.F.-C. and writing—review and editing, C.F., A.S., J.d.B., I.S.D. and I.F.-C. All authors have read and agreed to the published version of the manuscript.

Funding

This research was funded by the FCT (Portuguese Foundation for Science and Technology) through the project BestMaintenance-LowerRisks (PTDC/ECI-CON/29286/2017).

Acknowledgments

The authors gratefully acknowledge the support of the Portuguese Air Force and the CERIS Research Institute, Instituto Superior Técnico, Universidade de Lisboa.

Conflicts of Interest

The authors declare no conflict of interest.

References

  1. Shohet, I.M. Key performance indicators for strategic healthcare facilities maintenance. J. Constr. Eng. Manag. 2006, 132, 345–352. [Google Scholar] [CrossRef]
  2. Lind, H.; Muying, H. Building maintenance strategies: Planning under uncertainty. Prop. Manag. 2012, 30, 14–28. [Google Scholar] [CrossRef]
  3. Silva, A.; de Brito, J. Do we need a buildings’ inspection, diagnosis and service life prediction software? J. Build. Eng. 2019, 22, 335–348. [Google Scholar] [CrossRef]
  4. Falorca, J.F. Main functions for building maintenance management: An outline application. Int. J. Build. Pathol. Adapt. 2019, 37, 490–509. [Google Scholar] [CrossRef]
  5. Eurostat. Available online: https://ec.europa.eu/eurostat/statistics-explained/index.php/Construction_production_(volume)_index_overview (accessed on 15 July 2020).
  6. Shohet, I.M.; Puterman, M.; Gilboa, E. Deterioration patterns of building cladding components for maintenance management. Constr. Manag. Econ. 2002, 20, 305–314. [Google Scholar] [CrossRef]
  7. Mobley, R.K. Maintenance Engineering Handbook, 8th ed.; McGraw-Hill Professional: New York, NY, USA, 2014. [Google Scholar]
  8. Dann, N.; Cantell, T. Maintenance: From philosophy to practice. J. Archit. Conserv. 2005, 11, 42–54. [Google Scholar] [CrossRef]
  9. Chan, D.W. Sustainable building maintenance for safer and healthier cities: Effective strategies for implementing the Mandatory Building Inspection Scheme (MBIS) in Hong Kong. J. Build. Eng. 2019, 24. [Google Scholar] [CrossRef]
  10. Ashworth, A. Estimating the life expectancies of building components in life-cycle costing calculations. Struct. Surv. 1996, 14, 4–8. [Google Scholar] [CrossRef]
  11. Sherwin, D. A review of overall models for maintenance management. J. Qual. Maint. Eng. 2000, 6, 138–164. [Google Scholar] [CrossRef] [Green Version]
  12. Forster, A.M.; Kayan, B. Maintenance for historic buildings: A current perspective. Struct. Surv. 2009, 27, 210–229. [Google Scholar] [CrossRef]
  13. Ruparathna, R.; Hewage, K.; Sadiq, R. Multi-period maintenance planning for public buildings: A risk based approach for climate conscious operation. J. Clean. Prod. 2018, 170, 1338–1353. [Google Scholar] [CrossRef]
  14. BS 8298-1. Code of Practice for the Design and Installation of Natural Stone Cladding and Linin—Part 1: General; British Standards Institution (BSI): London, UK, 2010. [Google Scholar]
  15. Sandak, A.; Sandak, J.; Brzezicki, M.; Riggio, M. Bio-Based Building Skin; Springer International Publishing: Gateway East, Singapore, 2019. [Google Scholar]
  16. Garcez, N.; Lopes, N.; de Brito, J.; Silvestre, J. System of inspection, diagnosis and repair of external claddings of pitched roofs. Constr. Build. Mater. 2012, 35, 1034–1044. [Google Scholar] [CrossRef]
  17. Ilozor, B.D.; Okoroh, M.I.; Egbu, C.E. Understanding residential house defects in Australia from the State of Victoria. Build. Environ. 2004, 39, 327–337. [Google Scholar] [CrossRef]
  18. Watt, D.S. Building Pathology: Principles and Practice, 2nd ed.; Blackwell Publishing Ltd.: Oxford, UK, 2009. [Google Scholar]
  19. Yazdani, N.; Dowgul, R.W.; Manzur, T. Deficiency analysis of coastal buildings toward storm damage reduction. J. Perform. Constr. Facil. 2010, 24, 128–137. [Google Scholar] [CrossRef]
  20. Gullbrekken, L.; Kvande, T.; Jelle, B.P.; Time, B. Norwegian pitched roof defects. Buildings 2016, 6, 24. [Google Scholar] [CrossRef] [Green Version]
  21. Morgado, J.; Flores-Colen, I.; de Brito, J.; Silva, A. Maintenance planning of pitched roofs in current buildings. J. Constr. Eng. Manag. 2017, 143. [Google Scholar] [CrossRef]
  22. Kyle, B.R.; Kalinger, P. Service life prediction of roof systems by reliability-based analysis. In Proceedings of the 4th International Symposium on Roofing Technology, Gaithersburg, MD, USA, 17–19 September 1997. [Google Scholar]
  23. Garcez, N.; Lopes, N.; de Brito, J.; Sá, G. Pathology, diagnosis and repair of pitched roofs with ceramic tiles: Statistical characterisation and lessons learned from inspections. Constr. Build. Mater. 2012, 36, 807–819. [Google Scholar] [CrossRef]
  24. Ferreira, C.; Neves, L.C.; Silva, A.; de Brito, J. Stochastic maintenance models for ceramic claddings. Struct. Infrastruct. Eng. 2020, 16, 247–265. [Google Scholar] [CrossRef]
  25. Meijer, F.; Itard, L.; Sunikka-Blank, M. Comparing European residential building stocks: Performance, renovation and policy opportunities. Build. Res. Inf. 2009, 37, 533–551. [Google Scholar] [CrossRef]
  26. Da Silva, J.M.; Vicente, R. Pathology and defect of building façades and roofs: A state-of-the-art report on building pathology. In Building Pathology; de Freitas, V.P., Ed.; Conseil International du Bâtiment: Rotterdam, The Netherlands, 2013; pp. 123–131. [Google Scholar]
  27. INE. Censos 2011 Resultados Definitivos—Portugal; Instituto Nacional de Estatística: Lisbon, Portugal, 2012. [Google Scholar]
  28. Zhang, Y.; Vidakovic, B.; Augenbroe, G. Uncertainty analysis in using Markov chain model to predict roof life cycle performance. In Proceedings of the 10DBMC International Conference on Durability of Building Materials and Components, Lyon, France, 17–19 April 2005. [Google Scholar]
  29. Alaimo, G.; Accurso, F. The methods for the durability evaluation of pitched roof. In CIB W80 WG3—Test Methods for Service Life Prediction—State of the Art Report on Accelerated Laboratory Test Procedures and Correlation between Laboratory Tests and Service Life Data; Daniotti, B., Re Cecconi, F., Eds.; Conseil International du Bâtiment: Rotterdam, The Netherlands, 2010; pp. 3–13. [Google Scholar]
  30. ISO 15686-1. Buildings and Constructed Assets—Service Life Planning—Part 2: Service Life Prediction Procedures; International Organization for Standardization (ISO): Geneva, Switzerland, 2012. [Google Scholar]
  31. Rudbeck, C. Service life of building envelope components: Making it operational in economical assessment. Constr. Build. Mater. 2002, 16, 83–89. [Google Scholar] [CrossRef]
  32. Ramos, R.; Silva, A.; de Brito, J.; Gaspar, P.L. Methodology for the service life prediction of ceramic claddings in pitched roofs. Constr. Build. Mater. 2018, 166, 386–399. [Google Scholar] [CrossRef]
  33. Gaspar, P.L.; de Brito, J. Limit states and service life of cement renders on façades. J. Mater. Civ. Eng. 2011, 23, 1396–1404. [Google Scholar] [CrossRef]
  34. Flores-Colen, I.; de Brito, J.; Freitas, V. Discussion of criteria for prioritization of predictive maintenance of building façades: Survey of 30 experts. J. Perform. Constr. Facil. 2010, 24, 337–344. [Google Scholar] [CrossRef]
  35. Flores-Colen, I.; de Brito, J. A systematic approach for maintenance budgeting of buildings façades based on predictive and preventive strategies. Constr. Build. Mater. 2010, 24, 1718–1729. [Google Scholar] [CrossRef]
  36. Flores-Colen, I.; de Brito, J. Discussion of proactive maintenance strategies in façades’ coatings of social housing. J. Build. Apprais. 2010, 5, 223–240. [Google Scholar] [CrossRef]
  37. Madureira, S.; Flores-Colen, I.; de Brito, J.; Pereira, C. Maintenance planning of façades in current buildings. Constr. Build. Mater. 2017, 147, 790–802. [Google Scholar] [CrossRef]
  38. Ferreira, C.; Silva, A.; de Brito, J.; Dias, I.S.; Flores-Colen, I. Definition of a condition-based model for natural stone claddings. J. Build. Eng. 2020. [Google Scholar] [CrossRef]
  39. Molloy, M.K. Performance analysis using stochastic Petri nets. IEEE Trans. Comput. 1982, 913–917. [Google Scholar] [CrossRef]
  40. Butt, A.A.; Shahin, M.Y.; Feighan, K.J.; Carpenter, S.H. Pavement performance prediction model using the Markov process. Transp. Res. Rec. 1987, 1123, 12–19. [Google Scholar]
  41. Hawk, H.; Small, E.P. The BRIDGIT bridge management system. Struct. Eng. Int. 1998, 8, 309–314. [Google Scholar] [CrossRef]
  42. Thompson, P.D.; Small, E.P.; Johnson, M.; Marshall, A.R. The Pontis bridge management system. Struct. Eng. Int. 1998, 8, 303–308. [Google Scholar] [CrossRef]
  43. Ortiz-García, J.J.; Costello, S.B.; Snaith, M.S. Derivation of transition probability matrices for pavement deterioration modeling. J. Transp. Eng. 2006, 132, 141–161. [Google Scholar] [CrossRef]
  44. McDuling, J.; Horak, E.; Cloete, C. Service life prediction beyond the ‘factor method’. In Proceedings of the 11DBMC International Conference on Durability of Building Materials and Components, Istanbul, Turkey, 11–14 May 2008. [Google Scholar]
  45. Caleyo, F.; Velázquez, J.C.; Valor, A.; Hallen, J.M. Markov chain modelling of pitting corrosion in underground pipelines. Corros. Sci. 2009, 51, 2197–2207. [Google Scholar] [CrossRef]
  46. Silva, A.; de Brito, J.; Gaspar, P.L. Methodologies for Service Life Prediction of Buildings: With a Focus on Façade Claddings; Springer International Publishing: Zurich, Switzerland, 2016. [Google Scholar]
  47. Sánchez-Silva, M.; Klutke, G.A. Reliability and Life-Cycle Analysis of Deteriorating Systems; Springer International Publishing: Zurich, Switzerland, 2016. [Google Scholar]
  48. Kalbfleisch, J.D.; Lawless, J.F. The analysis of panel data under a Markov assumption. J. Am. Stat. Assoc. 1985, 80, 863–871. [Google Scholar] [CrossRef]
  49. Frangopol, D.M.; Kallen, M.J.; van Noortwijk, J.M. Probabilistic models for lifecycle performance of deteriorating structures: Review and future directions. Prog. Struct. Eng. Mater. 2004, 6, 197–212. [Google Scholar] [CrossRef]
  50. Langdon, D. Life Cycle Costing (LCC) as a Contribution to Sustainable Construction. Guidance on the Use of the LCC Methodology and Its Application in Public Procurement; Davis Langdon Management Consulting: London, UK, 2007. [Google Scholar]
  51. Housing Association Property Mutual (HAPM). Component Life Manual; E&FN Spon: London, UK, 1999. [Google Scholar]
  52. RICS. Building Maintenance: Strategy, Planning and Performance; Royal Institution of Chartered Surveyors (RICS): London, UK, 2000. [Google Scholar]
  53. Bauer, M.; Lair, J.; Wetzel, C. Predictive Model for Future Deterioration; INVESTIMMO Project, Final Technical Report; European Commission: Brussels, Belgium, 2004. [Google Scholar]
  54. NRCA. The Green roof Systems Manual; National Roofing Contractors Association (NRCA): Rosemont, IL, USA, 2007. [Google Scholar]
  55. National Association of Home Builders (NAHB). Bank of America Home Equity Study of Life Expectancy of Home Components; Economics Group: Washington, DC, USA, 2007. [Google Scholar]
  56. Madrigal, L.O.; Lanzarote, B.S.; Bretones, J.M.F. Proposed method of estimating the service life of building envelope. Rev. Constr. 2015, 14, 60–68. [Google Scholar]
  57. Bechthold, M.; Kane, A.; King, N. Ceramic Material Systems: In Architecture and Interior Design; Birkhäuser: Basel, Switzerland, 2015. [Google Scholar]
  58. Thai-Ker, L.; Chung-Wan, W. Challenges of external wall tiling in Singapore. In Proceedings of the Qualicer 2006: IX World Congress on Ceramic Tile Quality, Castellón, Spain, 12–15 February 2006. [Google Scholar]
  59. Raposo, S.; de Brito, J.; Fonseca, M. Planned preventive maintenance activities: Analysis of guidance documents. In Durability of Buildings Materials and Components; de Freitas, V.P., Delgado, J.M.P.Q., Eds.; Springer: Berlin/Heidelberg, Germany, 2013; pp. 35–60. [Google Scholar]
  60. CYPE Price Generator. Available online: http://www.geradordeprecos.info/ (accessed on 24 April 2020).
  61. Ferreira, C.; Silva, A.; de Brito, J.; Dias, I.S.; Flores-Colen, I. The impact of imperfect maintenance actions on the degradation of buildings’ envelope components. J. Build. Eng. 2020, 33. [Google Scholar] [CrossRef]
  62. Bana e Costa, C.A. Três convicções fundamentais na prática do apoio à decisão. Soc. Bras. Pesqui. Oper. 1993, 13, 9–20. [Google Scholar]
  63. Dodgson, J.S.; Spackman, M.; Pearman, A.; Phillips, L.D. Multi-Criteria Analysis: A manual; Department for Communities and Local Government: London, UK, 2009.
  64. Cochran, J.K.; Chen, H.N. Fuzzy multi-criteria selection of object-oriented simulation software for production system analysis. Comput. Oper. Res. 2005, 32, 153–168. [Google Scholar] [CrossRef]
Figure 1. Illustrative examples of the degradation condition of the pitched roofs analysed. From top to bottom: Condition (A)—Sw ≤ 1%; Condition (B)—1% < Sw ≤ 6%; Condition (C)—6% < Sw ≤ 20%; Condition (D)—20% < Sw ≤ 50%; and none of the elements analysed are in condition E.
Infrastructures 05 00077 g001
Figure 2. Degradation process of the ceramic claddings in pitched roofs (CCPR) without the impact of maintenance activities: (a) mean degradation profile overlapped by the fieldwork data and (b) cumulative distribution functions.
Infrastructures 05 00077 g002
Figure 3. Degradation profiles of the three maintenance strategies and the situation without maintenance.
Infrastructures 05 00077 g003
Figure 4. Cumulative costs (inspection, maintenance and total) profiles of the three maintenance strategies.
Infrastructures 05 00077 g004
Figure 5. Average number of interventions performed during the time horizon.
Infrastructures 05 00077 g005
Figure 6. Cumulative distribution functions associated with the: (a) total replacement and (b) minor intervention.
Infrastructures 05 00077 g006aInfrastructures 05 00077 g006b
Figure 7. Degradation profiles of the three inspection frequencies.
Infrastructures 05 00077 g007
Figure 8. Cumulative cost (inspection, maintenance and total) profiles of the three inspection frequencies.
Infrastructures 05 00077 g008
Figure 9. Cumulative distribution functions associated with the total replacement for the three inspection frequencies.
Infrastructures 05 00077 g009
Table 1. Pitched roofs’ ceramic claddings classification system (data adapted from [32]).
Degradation ConditionAnomalieska,n% Area AffectedSeverity of Degradation [%]
A (kn = 0)No visible degradation--Sw ≤ 1
B (kn = 1)AestheticDevelopment of parasitic vegetation/biological colonisation0.55≤101 < Sw ≤ 6
Staining, change of colour or of brightness of the tiles0.20≤20
FunctionalPeeling/flaking/exfoliation1.00≤10
StructuralMisalignment of the cladding1.00≤10
C (kn = 2)AestheticDevelopment of parasitic vegetation/biological colonisation0.55>10 and ≤306 < Sw ≤ 20
Staining, change of colour or of brightness of the tiles0.20>20 and ≤50
FunctionalPeeling/flaking/exfoliation1.00>10 and ≤30
Cracking/fracture1.00≤10
Detachment/cladding release0.20≤5
StructuralPronounced cladding deformation1.30≤25
Misalignment of the cladding1.00>10 and ≤25
D (kn = 3)AestheticDevelopment of parasitic vegetation/biological colonisation0.55>30 and ≤5020 < Sw ≤ 50
Staining, change of colour or of brightness of the tiles0.20>50
FunctionalPeeling/flaking/exfoliation1.00>30 and ≤50
Cracking/fracture1.00>10 and ≤30
Detachment/cladding release0.20>5 and ≤10
StructuralPronounced cladding deformation1.30>25 and ≤50
Misalignment of the cladding1.00>25 and ≤50
E (kn = 4)AestheticDevelopment of parasitic vegetation/biological colonisation0.55>50Sw > 50
FunctionalPeeling/flaking/exfoliation1.00>50
Cracking/fracture1.00>30
Detachment/cladding release0.20>10
StructuralPronounced cladding deformation1.30>50
Misalignment of the cladding1.00>50
Table 2. Optimal parameters.
Sojourn Time in Each Degradation ConditionExponentialWeibullLognormal
Mean time–T
(years)
TA2.72.82.7
TB5.14.54.6
TC148.267.991.6
TD7.19 × 10468.11.87 × 108
Standard deviation–SD
(years)
SDA2.71.21.5
SDB5.12.63.4
SDC148.231.275.9
SDD7.19 × 1043.15.33 × 109
- log L76.6168.4170.13
Table 3. Predicted and observed ceramic claddings in pitched roofs (CCPR) in the different degradation conditions, as well as the respective relative error.
Degradation Condition A B C D E
Observed131396240
PredictedExponential11.014.196.824.00.0
Weibull12.813.197.123.00.0
Lognormal12.912.497.822.90.0
Relative error (%)Exponential15.18.40.90.1-
Weibull1.50.51.24.2-
Lognormal0.84.31.84.6-
Table 4. Predicted and observed CCPR in the different degradation conditions, as well as the respective relative error obtained by Markov chains (MC) and the Petri net (PN) with transitions exponentially distributed.
Degradation Condition Observed Predicted Relative Error
MC PN MC (%) PN (%) MC/PN
A1311.411.012.015.11.0
B1314.514.111.78.41.0
C9689.896.86.50.90.9
D2424.724.02.80.11.0
E05.60.0---
Table 5. Unit costs of the interventions.
InterventionsApplication ZoneCost (Year 0) [€/m2]
InspectionsAll1.03
Cleaning operationsMinorB12.45
Moderate14.00
Extensive15.77
Minor interventionsMinorC20.80
Moderate24.14
Extensive27.10
Total replacementD, E59.12
Table 6. Impacts of the interventions.
InterventionsApplication ZoneImpact of the Interventions
(Probability of Transition to Conditions A (PA), B (PB) or C (PC))
PA (%)PB (%)PC (%)
InspectionsAll---
Cleaning operationsMinorB61.538.5-
Moderate
Extensive
Minor interventionsMinorC69.825.05.2
Moderate70.824.05.2
Extensive70.824.05.2
Total replacementD, E100--
Table 7. Efficiency index and the performance indicator of the three maintenance strategies.
Maintenance StrategyWithout MaintenanceMS1, 1-YearMS2, Moderate, 1-YearMS3, Moderate, 1-Year
Mean time of permanence in each conditiontpA (years)2.337.5016.3635.97
tpB (years)4.5311.4628.2826.55
tpC (years)67.63131.04105.3587.48
tpD (years)58.730.000.000.00
tpE (years)16.780.000.000.00
EI (-)0.690.880.900.92
Cannualised (€/m2)-0.130.300.49
PI (m2/€)-6.703.021.86
Table 8. Efficiency index and the performance indicator for the three inspection frequencies.
Maintenance StrategyMS2, Moderate, 0.5-YearsMS2, Moderate, 1-YearMS2, Moderate, 2-Years
tpA (years)15.4716.3616.10
tpB (years)28.3228.2827.93
tpC (years)106.21105.35105.39
tpD (years)0.000.000.59
tpE (years)0.000.000.00
EI (-)0.900.900.90
Cannualised (€/m2)0.420.300.23
PI (m2/€)2.143.023.89
Table 9. Scenario 1: with equal weights.
Efficiency Index (Criterion 1)Maintenance Cost
(Criterion 2)
Number of Total Replacements (Criterion 3)Total RatingStandardised Total Rating
MS1, 1-year0.001.000.001.000.00
MS2, Moderate, 1 year0.540.540.631.700.70
MS3, Moderate, 1 year1.000.001.002.001.00
MS2, Moderate, 0.5 years0.510.200.591.300.30
MS2, Moderate, 2 years0.500.720.661.890.89
Weights (%)33.333.333.3
Table 10. Scenario 2: the higher weight of the efficiency index.
Efficiency Index (Criterion 1)Maintenance Cost
(Criterion 2)
Number of Total Replacements (Criterion 3)Total RatingStandardised Total Rating
MS1, 1 year0.001.000.001.000.00
MS2, Moderate, 1 year0.540.540.632.240.62
MS3, Moderate, 1 year1.000.001.003.001.00
MS2, Moderate, 0.5 years0.510.200.591.820.41
MS2, Moderate, 2 years0.500.720.662.380.69
Weights (%)502525
Table 11. Scenario 3: the higher weight of the maintenance costs.
Efficiency Index (Criterion 1)Maintenance Cost
(Criterion 2)
Number of Total Replacements (Criterion 3)Total RatingStandardised Total Rating
MS1, 1 year0.001.000.002.000.45
MS2, Moderate, 1 year0.540.540.632.240.66
MS3, Moderate, 1 year1.000.001.002.000.45
MS2, Moderate, 0.5 years0.510.200.591.500.00
MS2, Moderate, 2 years0.500.720.662.611.00
Weights (%)255025
Table 12. Scenario 4: the higher weight of the number of total replacements.
Efficiency Index (Criterion 1)Maintenance Cost
(Criterion 2)
Number of Total Replacements (Criterion 3)Total RatingStandardised Total Rating
MS1, 1 year0.001.000.001.000.00
MS2, Moderate, 1 year0.540.540.632.330.66
MS3, Moderate, 1 year1.000.001.003.001.00
MS2, Moderate, 0.5 years0.510.200.591.890.44
MS2, Moderate, 2 years0.500.720.662.550.77
Weights (%)252550

