Quantifying Air Movement Induced by Natural Forces in an Isolated Structure in the Subsurface Infrastructure


1
Northwest Occupational Health & Safety, North Vancouver, BC V7K1P3, Canada
2
Programa de Engenharia Ambiental, Universidade Federal do Rio de Janeiro, Rio de Janeiro 21941-972, Brazil
3
Escola Politécnica, Universidade Federal do Rio de Janeiro, Rio de Janeiro 21941-972, Brazil
*
Author to whom correspondence should be addressed.
Infrastructures 2021, 6(1), 3; https://0-doi-org.brum.beds.ac.uk/10.3390/infrastructures6010003
Submission received: 2 December 2020
/
Revised: 21 December 2020
/
Accepted: 23 December 2020
/
Published: 25 December 2020
Abstract
:This article describes the development and demonstration of a non-intrusive method for the quantitative determination of speed of air movement along the ground and inside an isolated subsurface structure, a type of confined space. Natural ventilation occurs continuously and reduces risk to entrants from contact with a hazardous atmosphere. One of the most important parameters still undetermined was the speed of air movement during the process. Small puffs of artificial “smoke” were used to visualize air movement. Tracker, an open-source physics program, provided the capability to analyze this movement. Measurement of air speed requires access to individual frames in the video, capability to move forward and backward, and the means to manipulate the image to highlight the “smoke”. Background subtraction, control of brightness and contrast, and conversion of color to greyscale were essential for obtaining these measurements. Measurements for a single opening indicated that flow along the ground was borderline turbulent (Reynolds number ~3000) and in the opening and inside the airspace, within the bounds of laminar flow (Reynolds number <2250). Video obtained during this work showed behavior observable in laboratory studies of Helmholtz resonators. Results provide the basis for a larger study of the ventilation process to facilitate design improvements.
1. Introduction
The subsurface infrastructure contains many types of structures. Many of these structures satisfy requirements for classification as confined spaces. Many people have died in confined spaces, mainly because of the development of atmospheric hazards [1]. Ventilation of these structures is an important subject for research and other enquiry to prevent injury and death to passersby and people who enter and work in these structures. Confined spaces are spaces in which people do not normally work and are not equipped with amenities for occupancy. Confined spaces become workspaces when opened for access. Access and egress often are difficult because of the size and location of the opening for entry and can inhibit the provision of first aid and other emergency response services.
The term “confined space” elicits fear in workers and onerous responses from regulators. One such example is the regulatory requirement published by WorkSafeBC, the workplace regulatory in the Canadian province of British Columbia in which occurred the work to be described [2]. The agent for implementing these requirements is the Qualified Person. The Qualified Person anticipates, identifies, and evaluates conditions in the space prior to entry and during work activity in a written report and prepares a procedure for entry and work. This approach has achieved considerable success in minimizing accidents in these workspaces.
Informal inquiry of practitioners formally trained in occupational health and safety about the occurrence of ventilation induced by natural forces in isolated subsurface structures in the infrastructure consistently produces the opinion that ventilation does not occur despite the presence of one or more openings in the manhole cover. Since the literature and formal academic training offer little direct discussion about this topic, the basis for this opinion seems to be intuitive rather than inquiry- and science-based [3].
The possibility of ventilation induced by natural forces in these structures has received little formal attention over the years despite the concern generated by their designation as confined spaces. Investigators at the (US) Bureau of Mines produced the first reports on this subject [4,5,6,7]. More recently, other investigators commented on ventilation in mines [8], caves [9], subsurface structures in the British telecom system [10], and tombs constructed in Ancient Egypt [11].
McManus [12] investigated ventilation induced by natural forces in an isolated subsurface structure in the infrastructure, and McManus and Haddad [13,14,15] reported on these findings. These articles reported quantitatively on air motion along the ground outside the structure [13] and a decrease in the concentration of carbon monoxide injected into the structure [14]. Studies by investigators at the Bureau of Mines [4,5,6,7] and McManus [12] reported on the influence of the number of openings in manhole covers [13,14,15]. Videos obtained outside and inside the structure using a product that emits aerosols resembling “smoke” showed the entry of air from the surface into the opening(s) in the manhole cover containing one or two openings [15]. Measurement of the behavior of carbon monoxide injected into the chamber indicated that thorough mixing of the air was occurring in the airspace of the structure [14]. Movement of the “smoke” in the videos qualitatively reinforced this observation [15].
One of the parameters still lacking in the study of natural phenomena in these structures is quantitation of the speed with which the motion shown in the videos [15] is occurring. This article describes the development and demonstrates the use of a quantitative, non-intrusive method for addressing this challenge. The requirements are to visualize images in the videos as clearly as possible for quantitative interpretation and to determine how to track and extract information during the movement of the “smoke”. The literature in occupational health and safety offers nothing to assist in determining how to undertake this exploration.
Quantifying the speed of air movement would contribute significantly to the information needed to create mathematical models from the existing observation- and measurement-based material [12,14,16] with the intent to optimize ventilation induced by natural forces through opening(s) in the manhole cover. Natural forces potentially include air movement along the surface of the ground and differences in temperature between the exterior environment and the airspace in the structure. Optimization of ventilation through opening(s) in the manhole cover atop the closed and isolated structure in the period between entry and work would significantly reduce the risk of injury and death imposed on workers who enter and work in these structures due to overexposure and fire and explosion involving contaminants in the airspace [15,16].
At the beginning of this investigation, the expectation of success was by no means certain. There was no established method. Software used for motion analysis is designed to capture solid objects and not ephemeral, partially transparent substances such as chemical “smoke”. The videos to be used in this investigation were obtained in a manner to capture and visualize movement qualitatively and not quantitatively.
2. Materials and Methods
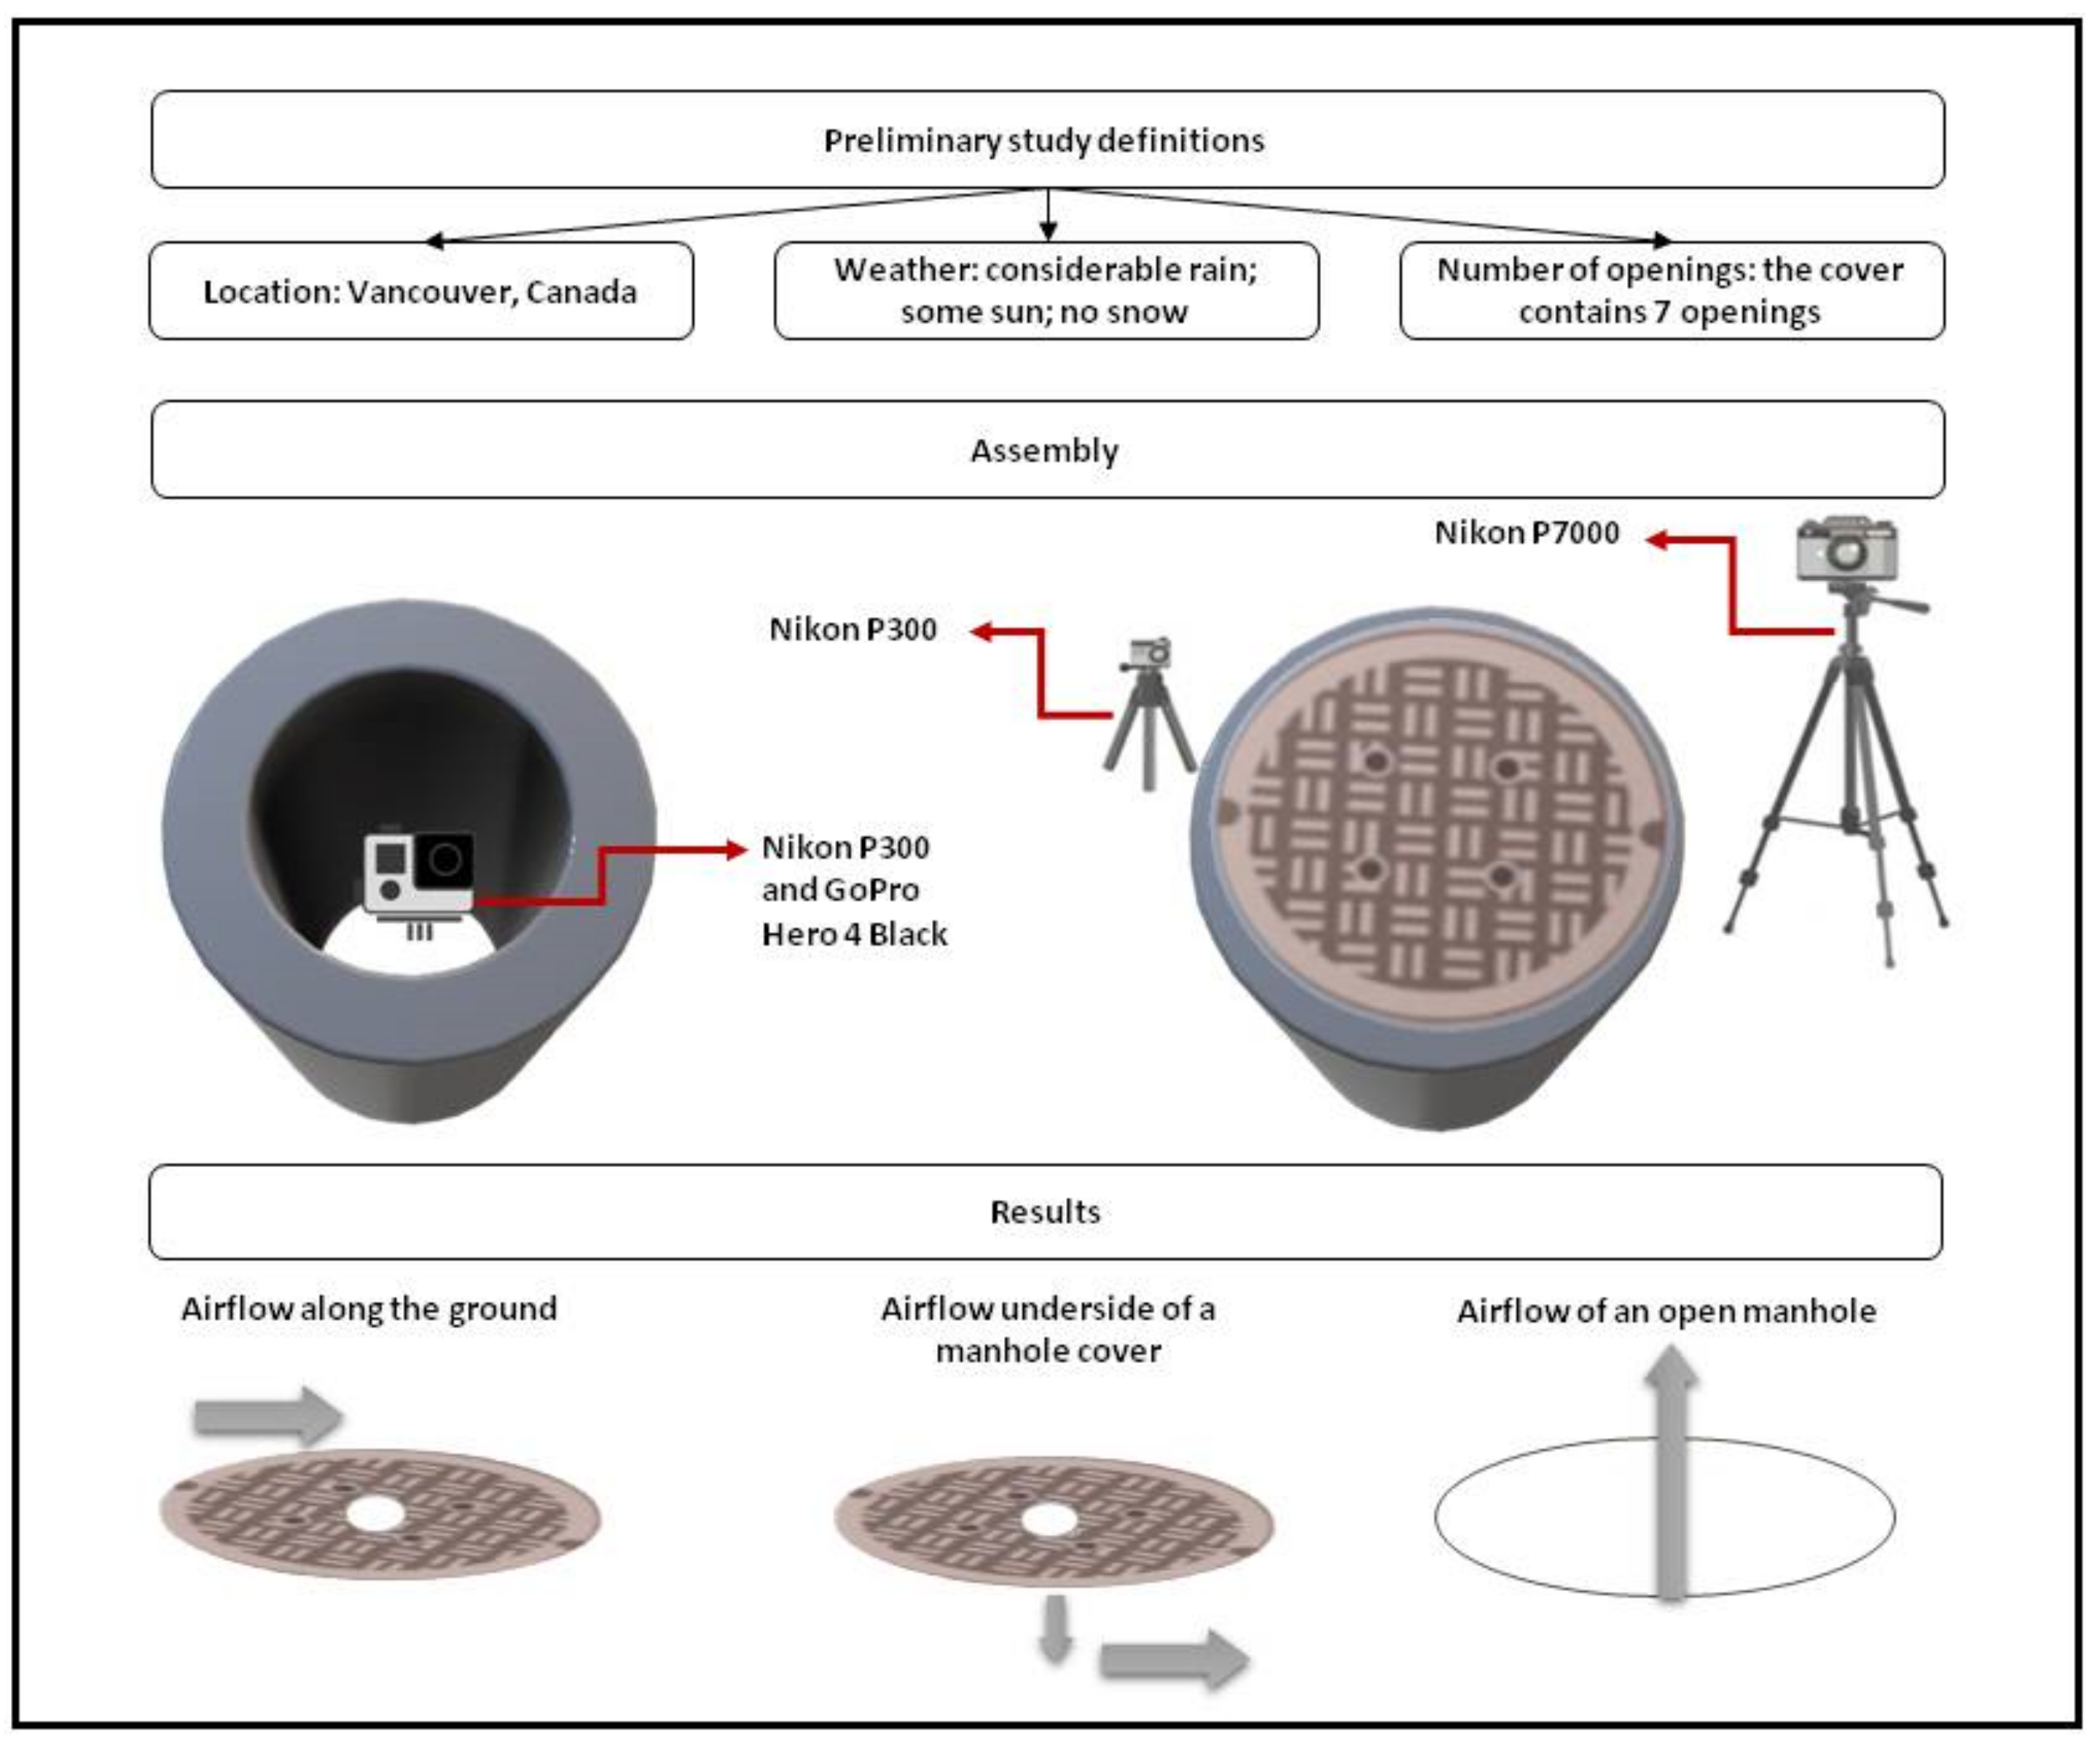
The strategy for quantifying air movement in the subsurface infrastructure adopted in this study is presented in Figure 1. A necessary first step was to obtain suitable videos as described in McManus and Haddad [15]. The videos to be used were obtained during a brief period of the year and may not reflect all circumstances and types and sizes of structure. Primary considerations involved in obtaining the videos included characteristics of the situation (location, weather, time of day, and the isolated subsurface structure and the number of openings). Four video cameras (up to two outside and two inside) were positioned inside and outside the chamber in order to record the movement of the smoke. With the help of software, it was possible to gain access to the frames in the video to assess the movement of the smoke and its speed. The last step of the proposed framework was the evaluation of the results and the different movements of the smoke inside and outside the chamber.
This work was performed in Vancouver, Canada during December, January, and February in the yard of a construction company that installs precast concrete vaults used in the subsurface telecommunications and electrical distribution systems [12]. The weather during the period was typical: considerable rain and periods of non-rainy conditions including some sun. There was no snow and exterior temperatures were at or slightly above freezing at night and slightly higher during the day.
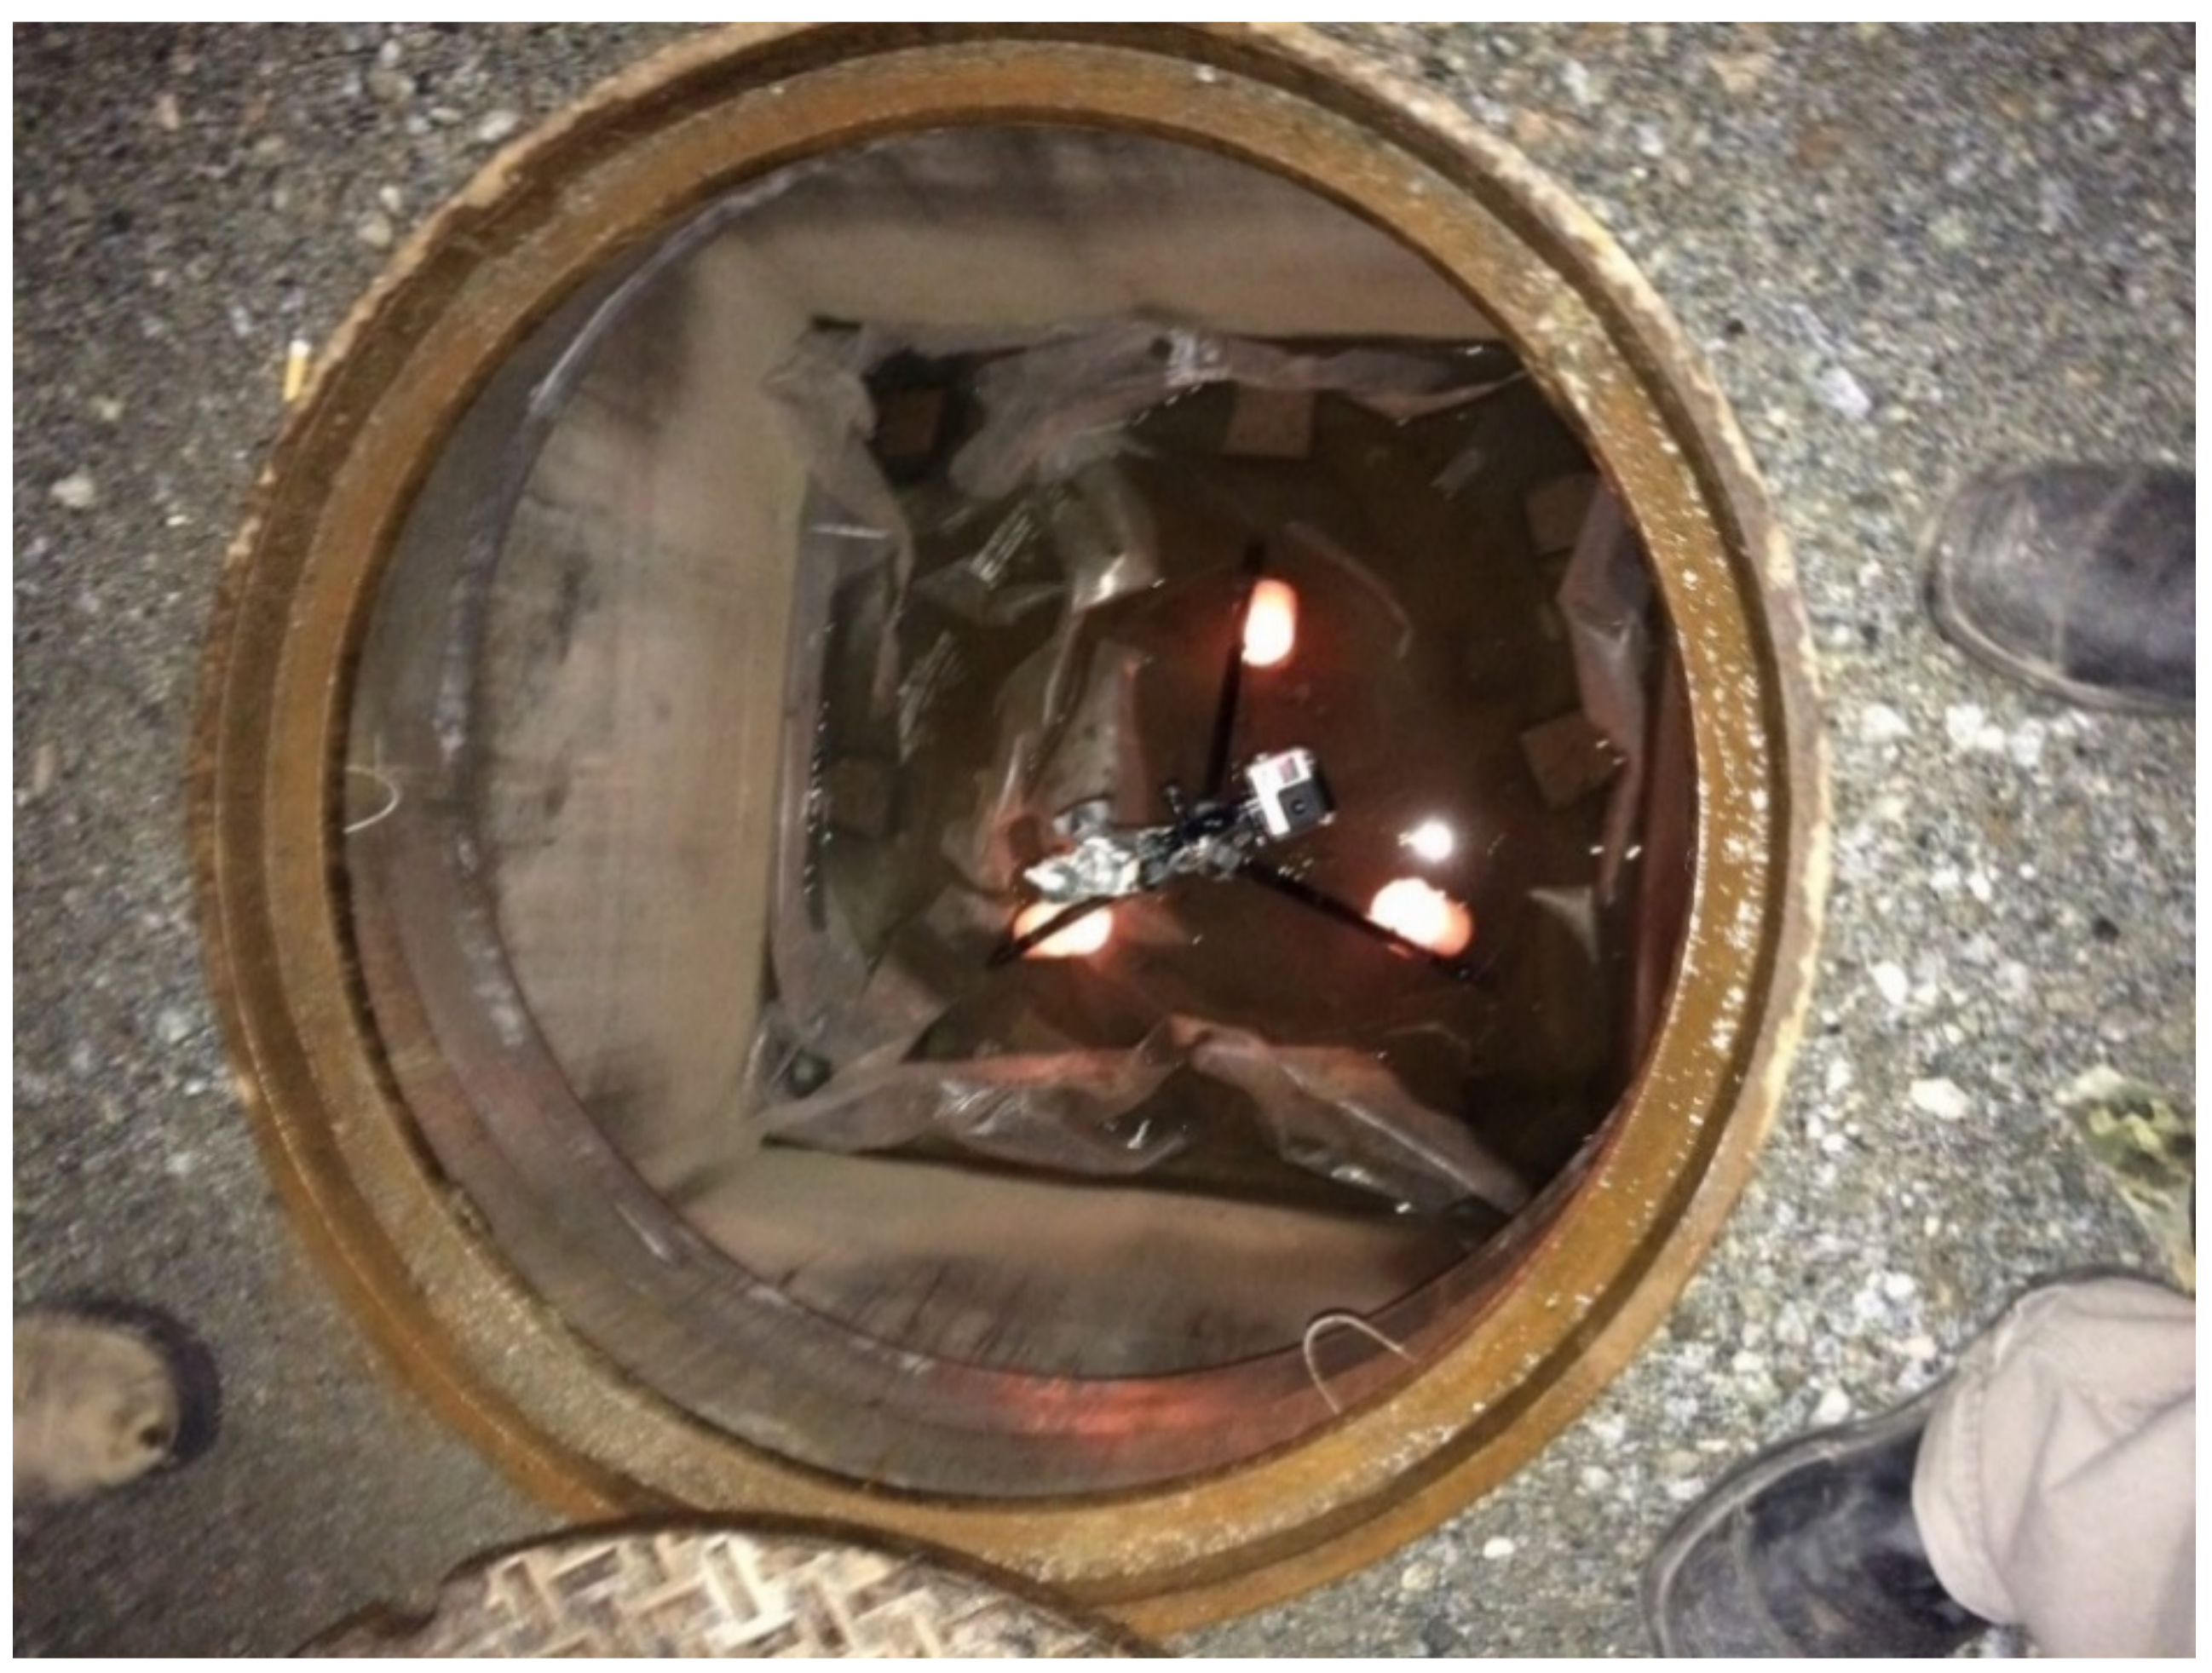
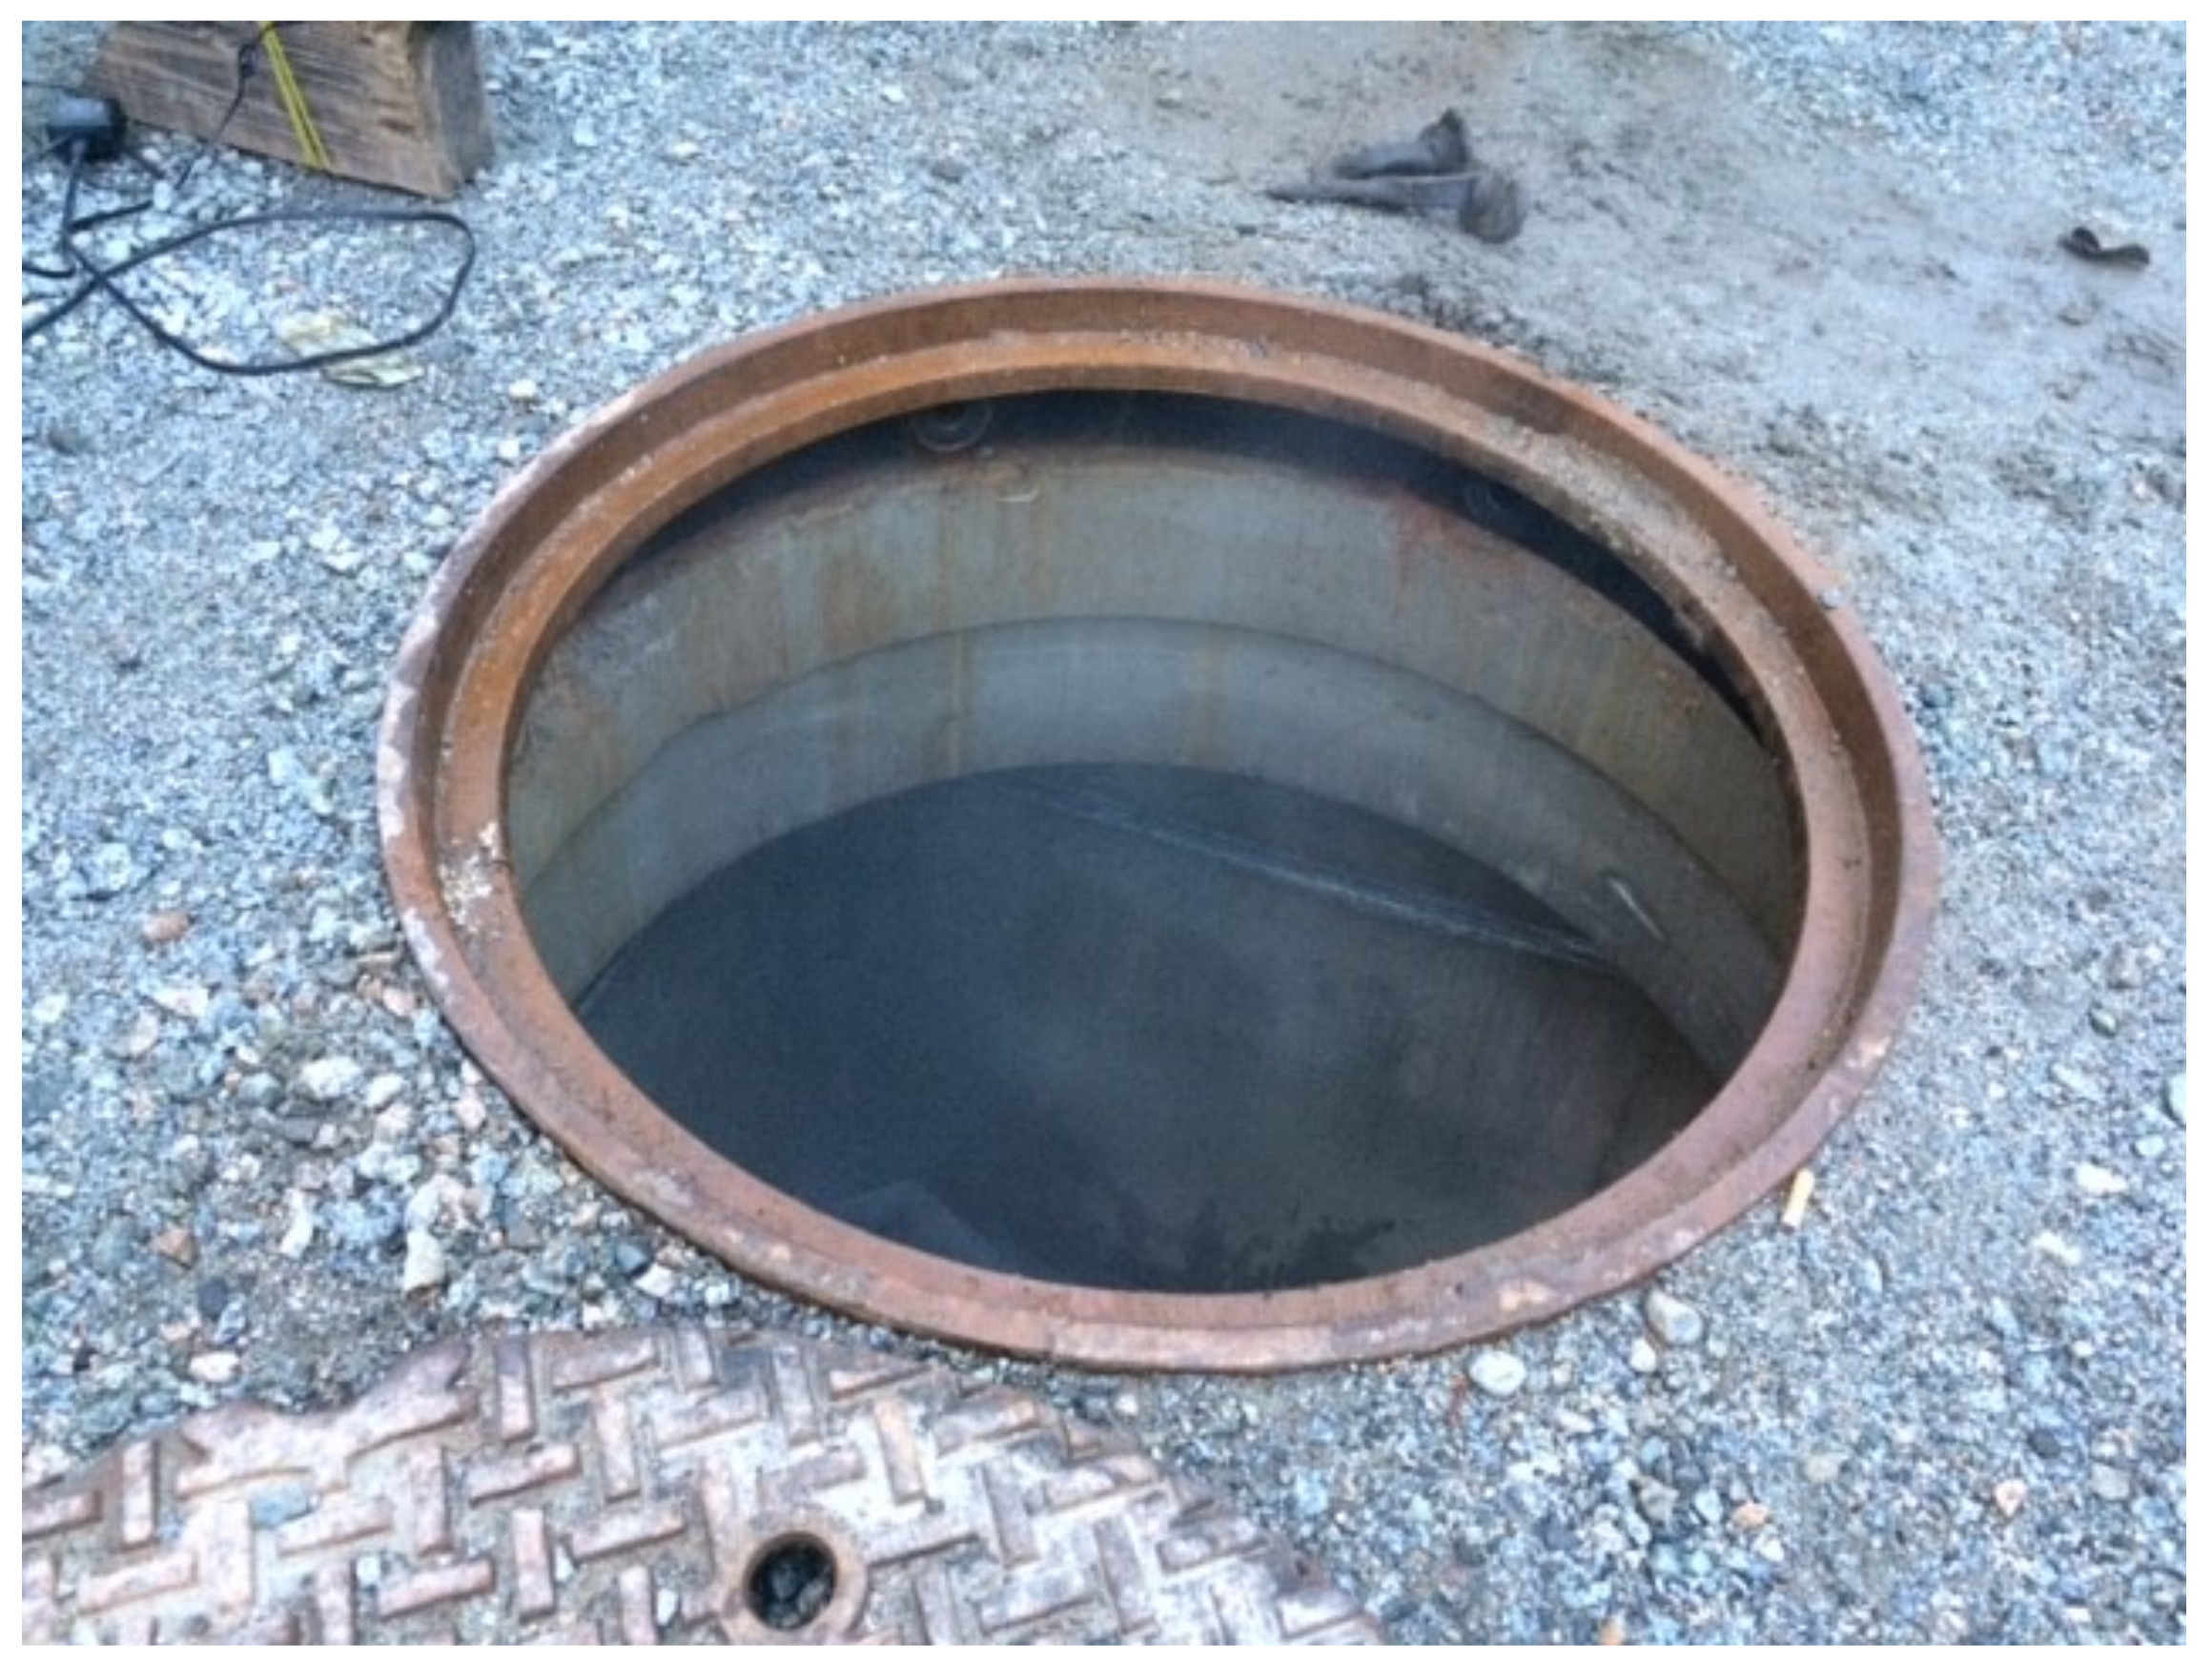
The vault is entered through a manhole (Figure 2). The cover in this situation contained 7 openings. The manhole opening was 860 mm in diameter. The center opening in the manhole cover was 28 mm in diameter and the circumferential openings 29 mm, respectively. The center opening or center opening and one circumferential opening or two circumferential openings opposite each other were opened during video production. The other circumferential openings were plugged.
McManus [12] and McManus and Haddad [15] described the techniques used in video production. Briefly, air motion was visualized using “smoke” tubes. These tubes emit a white chemical smoke when air passes through them.
Figure 3 shows the technique for visualizing air flow and capture using cameras. The direction of airflow along the ground changed continuously. In order to furnish a supply of “smoke” inside the structure, reorientation of the point of emission sometimes was necessary so as to maintain an upwind position and flow toward the opening in the manhole cover. That is, these maneuvers ensured that “smoke” always flowed toward the opening in the manhole cover under study. In the context of quantitative evaluation, maintaining the orientation of the point of emission upwind from the opening in the manhole cover into which entry into the airspace occurred ensured that the speed of air movement would always be a positive number and the measurements always consistent relative to each other.
Consumer-level video cameras, Nikon P300 and Nikon P7000 (Nikon Canada, Mississauga, ON, Canada), were used above ground. A Nikon P300 and a GoPro Hero 4 Black (GoPro, Inc., San Mateo, CA, USA) were used inside the structure. Figure 3 shows the setup used to obtain some of the videos along the ground. The Nikon P300 and GoPro Hero 4 Black were operated at 1080p and the Nikon P7000 at 720p to ensure images of high quality. This level of quality provided considerable benefit during quantitative assessment of frames in the videos.
Battery-operated consumer-level LED products (Canadian Tire Corporation, Toronto, ON) were used for lighting. LED products were chosen to minimize the production and radiation of heat into the interior of the structure. The LED products and cameras were mounted on a stand (Figure 2). The stand was positioned inside the center of the structure during video production.
Analysis performed during this work utilized Tracker, Video Analysis and Modeling Tool, Version 5.1.4, April 2020 (Open Science Foundation, Alexandria, VA, USA, https://physlets.org/tracker/), an open-source physics program. The videos obtained previously [12,15] and described above were used in the analysis reported here. Tracker can accommodate original versions and condensed videos up to 1 GB in size.
Tracker and similar video analysis software normally are presumed to be used for the analysis of solid objects. Ephemeral, quasi-transparent materials such as smoke create especial challenges. Features in this type of program essential for image analysis include a frame counter and the ability to modify the frame display rate, to calibrate distances in the visual field, to move backward and forward frame by frame, and to manipulate the appearance of images.
The “baseline subtract” and other image modification features were used during this analysis. “Baseline subtract” removes all information from a reference image containing features not needed in the image to be analyzed—in this case, the “smoke”. The result is that the image to be analyzed is very dark and shows the smoke more clearly against this background. To obtain this effect, all openings in the manhole cover were plugged prior to applying this feature. This ensured that only the “smoke” and light above the opening were detected when the plug was removed.
During the analysis, Tracker was operated at a very slow rate, typically 2.5 frames/s compared to the capture rate of the cameras ranging from 24 to 30 frames/s, to facilitate observation of stopping and starting and backward and forward motion.
A ruler and a known reference (diameter of the opening in the manhole or the manhole cover) were used to calibrate distance of travel. Distance of travel was measured between a starting point and a termination point. Both points were chosen on the basis of visibility and to maintain relative position within the shape created by the smoke. Distance of travel was measured using the ruler and converted to true distance. The ruler was positioned to include the starting point and the end point.
Manual measurement is a potential and anticipatable source of error in this method. This error could affect all measured values. The only way to minimize this problem is to repeat measurement steps when doubt exists. This involved use of the backward and forward function, frame by frame, in Tracker, sometimes multiple times to minimize uncertainty. At the time of this work, Tracker lacked an electronic ruler calibrated to a known distance. Provision of an electronic ruler that marks the beginning and end point of a measurement would be an invaluable improvement for minimizing errors and uncertainty associated with this type of measurement. The author of Tracker has taken this comment under advisement for addition to future versions of the program.
Travel distance was calculated as follows: (travel distance [ruler]) × (distance [known]/distance [ruler]). Distance [known] was either the diameter of the opening in the manhole cover (28 mm) or the diameter of the manhole (860 mm). Distance [ruler] was measured on the screen containing the video frames. The number of frames was determined from the counter on the display provided by Tracker. Air speed was calculated as follows: (frames/s) × (1/frames) × (travel distance [ruler]) × (distance [known]/distance [ruler]).
Any Video Converter, Version 6.3.8.0, January 2020 (Anvsoft Inc., Shenzhen, Guangdong, China https://www.any-video-converter.com/), was used to reduce large videos to 1 GB, the largest size accepted by Tracker. The frame rate could decrease from the original value during the condensation process. The condensing process may delete frames as well as modify the resolution in individual frames. The decrease in frame rate will affect the calculations.
IHSTAT developed and published by the American Industrial Hygiene Association (AIHA), Fairfax, VA, USA, [17] was used for statistical analysis of values within groups of tests. IHSTAT is an Excel application that determines through goodness of fit tests, for the purpose of determining compliance with regulatory standards and guidance values, whether samples are normally or lognormally distributed. AIHA [18] recommends use of the lognormal distribution for data that appear to be lognormally distributed and for data that are better represented statistically as lognormally distributed or represented by both the normal and lognormal distributions.
Microsoft Excel (Microsoft Corporation, Redmond, WA, USA) was used to perform t-tests on selected data. The measurements were converted to LN (natural logarithm) values prior to use in the t-test because of the lognormal distribution of the measured values.
3. Results
This study determined quantitatively important parameters involving air movement along the ground; along the ground at the opening(s) in the manhole cover; into the opening in the manhole cover; along the underside of the manhole cover; near the sidewall of the structure; and in the open manhole. McManus [12] and McManus and Haddad [15] examined the same videos qualitatively. Information combined from the two studies is important for supporting discussion later in this article.
Table 1, Table 2, Table 3, Table 4, Table 5 and Table 6 contain the results of measurements obtained during this work. The emphasis in the tests reported in Table 1, Table 2, Table 3, Table 4, Table 5 and Table 6 was the manhole cover containing a single opening. A single opening is the least intuitive geometry for understanding ventilation induced by natural forces in these structures because of the absence of a perceived route of entry and route of exit.
Table 1, Table 2, Table 3, Table 4, Table 5 and Table 6 present results organized by file number. A file number is the number of an individual video. Where possible, multiple measurements involving different groups of frames within a video were obtained in an attempt to determine the level of variation in the process.
Table 1 provides results from the study of air motion along the surface of the ground distant from the opening in the manhole and the observable influence of the ventilation process on airflow. Airflow upstream and removed from the opening in the manhole cover moved in a predictable, directed manner. Results obtained from individual videos overlapped. The normal distribution in some cases produced a slightly better fit to the data (slightly higher value in the W-test applied by IHSTAT) than the lognormal distribution. In most cases, the lognormal distribution produced considerably better results than the normal distribution. Combining the results from individual videos improved the value of the W-test reported by IHSTAT for the distribution.
Table 2 provides results along the surface of the ground near the opening in the manhole cover. Airflow near the opening in the manhole cover occurred unpredictably compared to airflow observed remote from the manhole cover summarized in Table 1. As discussed previously [12,15], when a single opening was present, movement of air near the opening in the manhole cover occurred in several ways: deflection around the opening; movement straight across the opening; movement across the opening and a downward turn followed by partial entry and return to ground level; movement across the opening and a downward turn followed by full entry; and movement part-way or fully across the opening with deflection upward. Deflection upward occurred vertically or at an angle (~45° to the horizontal). Entry into the structure through the opening in the manhole occurred briefly, discretely, and unpredictably. The significance of this behavior compared to that tabulated in Table 1 was not apparent; hence, this was the reason for subjecting this motion to further study.
The speed of air motion along the surface of the ground near the single opening in the manhole cover (Table 2) decreased in magnitude compared to that reported in Table 1. Results obtained from individual videos overlapped. The normal distribution in some cases produced a slightly better fit to the data (slightly higher value in the W-test applied by IHSTAT) than the lognormal distribution. In most cases, the lognormal distribution produced considerably better results than the normal distribution. Combining the results from individual videos improved the value of the W-test reported by IHSTAT for the distribution.
Performance of a t-test on the Ln (natural logarithm) values of the combined data in Table 1 and Table 2 indicated that the average air speeds differed significantly from each other (p < 0.05).
Visual comparison of the preliminary values provided in Table 2 obtained for two openings (center + circumference or three openings) with the distribution for the single opening indicated that overlap is likely to occur. Air movement visualized for two or more openings in the manhole cover and assessed here in Table 1 and Table 2 requires considerably more study.
In order to assess air motion inside the structure, application of the “baseline subtract” function in Tracker was essential for visualizing the “smoke” to enable tracking. Figure 4, Figure 5 and Figure 6 illustrate the use of this manipulation.
Table 3 provides results from the analysis of videos showing the movement of air downward though the opening in the manhole cover, viewed from inside the structure. Videos obtained in the structure also showed air motion across the opening (GoPro24, incorporated into Table 2), as discussed previously [12,15].
As in previous situations, results obtained from individual videos overlapped. The lognormal distribution produced a better fit to the data than the normal distribution (slightly higher value in the W-test applied by IHSTAT). Combining the results from individual videos improved the value of the W-test reported by IHSTAT for the distribution.
The speed observable during entry into the single opening in the center of the manhole cover is considerably less than the speed of air observable at ground level removed from the opening in the manhole cover (Table 1) and near the opening (Table 2). These differences are significant (p < 0.05).
The speeds determined in samples when two openings were present were considerably greater than for the single opening based on very limited sampling. These differences also were significant (p < 0.05). This finding supports the visual observation about more rapid movement of the “smoke” when two or more openings are present in the manhole cover, as described previously [12,15]. Differences between configurations (center + circumference versus two circumferential openings) were not significant (p > 0.05).
Table 4 provides results from the analysis of videos showing horizontal air motion along the underside of the manhole cover (single opening in the center of the manhole) and in the upper airspace of the chamber (two openings). The smoke always migrated from the center to the left side of the structure.
Horizontal air speed for the single center opening along the underside of the manhole cover was not significantly different (p > 0.05) from air speed in the upper airspace when two openings were present in the manhole cover based on very limited sampling.
Differences in horizontal air flow comparing the single opening in the center of the manhole cover versus two openings (center + circumference or circumferential openings opposite each other) were statistically different (p < 0.05) based on very limited sampling. The difference in mean horizontal air flow when two openings (center + circumference versus two circumferential openings) were compared together was not statistically different (p > 0.05).
Table 5 presents results from the analysis of sidewall motion observed in one of the videos. Injection of “smoke” into the openings occurred prior to obtaining this observation. The process of injection considerably increased the quantity of “smoke” available for observation. This observation occurred only in a limited part of this study and is expected to form the basis for additional study in this area in the future. As indicated by the frame count, the ascending motion occurred almost immediately following the descending motion.
Analysis of the limited data presented in Table 5 suggests that the difference in the mean descending and ascending air speeds was not significant.
Table 6 presents results for upward air motion in the open manhole. The smoke was introduced into the airspace of the structure through opening(s) in the manhole cover. The cover was opened slowly so as to minimize disruption of the internal atmosphere. Figure 7 and Figure 8 illustrate this phenomenon. No evidence of entry of air into the manhole to replace escaping air was identifiable during this limited study. The difference between air velocity measured in the videos was not significant (p > 0.05).
4. Discussion
This article describes the development and demonstration of a non-intrusive method for the quantitative determination of the speed of air movement along the ground and inside an isolated subsurface structure, a type of confined space. The work reported here involved a specific structure and occurred during a brief period during the year. Hence, the results indicate that the methodology developed and described here is feasible for widespread application. They also provide a starting point for widespread investigation of the phenomenon in other subsurface structures.
Quantitative determination of airspeed inside subsurface structures accessed through manhole covers is one of the most important remaining gaps in the information base concerning ventilation induced by natural forces. Natural forces in this context are the influences that cause the occurrence of ventilation in these structures. From what is already known from these studies [12,13,14,15], one can surmise the involvement of air motion along the ground and differences in temperature between the temperature above the ground and the interior of the airspace. However, work to determine the relationship between these parameters remains to be performed.
A companion article [15] reported on the development and application of a method for visualizing ventilation processes in subsurface structures. This method utilizes a tube colloquially known as a “smoke” tube to produce an aerosol that resembles smoke, LED lighting, and consumer video cameras. These products use chemical reactions rather than combustion to produce this aerosol [19,20,21]. These products are neither warmer nor cooler than ambient air. They are normally used in the study of air movement in buildings. Air currents entrain puffs of “smoke” produced by gentle expulsion from the tube. When emitted with skill, the puff has neutral buoyancy and remains at the level and position of generation.
Motion of the air induces movement in the puff. This movement enlarges the puff to the point where it is no longer visible. McManus [12] and McManus and Haddad [15] showed that this technique was well suited for use in recording air movement both inside and outside the isolated subsurface structure that is the subject of this investigation.
Despite historic use of “smoke” tubes over a prolonged period, there appear to be no studies on the validity of the results provided by them, especially when applied to quantitative use as described in this article. One possibility is the possibility of the influence of the “smoke” on airflow because of differing viscosity or density. Whatever error this causes could apply to all measured values. The marketplace offers several products contained in tubes as were used here and others for use in theatrical “smokes”. The answer to this concern must await future study, possibly involving a group of these products. The numerical data provided in this report must be considered at best quantitative and at worst qualitative until resolution of this question occurs.
During the study of airflow along the ground, “smoke” emitted from the tube into the channel formed by the steel of the manhole cover was similar in appearance to a “noodle” of toothpaste [12,15]. The “smoke” maintained its coherence and tubular form outside the structure until influenced by the movement of air along the surface of the ground and interaction with emissions from the structure occurring at the opening in the manhole cover.
Air moving along the surface of the ground interacted with air entering into the opening, grazing across the surface of the opening or emitting from the opening. Interaction of the “smoke” entrained in air moving along the surface of the ground with air at the opening influenced the appearance of the “smoke”, as mentioned in previous discussion. The “noodle” formed by the smoke on the ground tended to remain coherent when entry occurred but not under other circumstances. Dispersal of the “noodle” of “smoke” occurred during other interactions, including emission from the opening. Entry into the structure through the opening in the manhole occurred briefly, discretely, and unpredictably. Disruption of the smoke occurred in the area close to the opening almost all of the time.
Inside the structure, when a single opening was present, the “smoke” typically followed the wall of the cylindrical opening in the manhole cover [13,15]. The smoke formed into strands or into a filmy layer that resembled sheer curtains such as used in residences. The “smoke” did not form a plug to fill the cross-section of the opening. At the bottom of the opening in the manhole cover, the “smoke” made a turn of 90° and then followed the underside of the manhole cover to the outside wall. The “smoke” spread and became diffuse in the upper airspace during horizontal movement. Near the outside wall, the diffuse cloud turned and moved downward.
When two openings were present, entry of “smoke” occurred unpredictably and considerably more aggressively into the openings (center + circumference or two circumferential openings) [13,15]. Inside the structure, “smoke” entering in the openings tended to move downward into the airspace dispersing all the way. On occasion, following deliberate injection of a large quantity of “smoke” into the upper airspace, emission from a circumferential opening was visible. At the same time, horizontal movement of dispersed “smoke” was observable in the upper airspace and in vertical movement (up and down) near the walls. Air movement when two openings were present in the manhole cover differed considerably from what was observable when one opening was present.
Videos contain a progression of related images linked together in a coherent way. The file is structured so that the images occur at predictable intervals. Hence, the sequence of the images provides the basis for a timeline. Demarcation of change of position of the “smoke” relative to fixed objects of known dimension offers the ability to determine distance.
The motion tracking program, Tracker, is an essential tool for quantifying motion contained in videos. Normally, this program is utilized to follow the motion of solid objects. Experimentation showed that this technology was also readily suited to quantitative analysis of the videos produced during the previous study [12,15], despite the fact that this was not an anticipated use when they were recorded. Use of Tracker in tracking the motion of an ephemeral substance such as “smoke” requires some adaptation to the reality posed by this type of motion. As mentioned previously, the puff under study expands in volume as time progresses under the influence of motion induced by air movement.
Important capabilities in a program used in motion capture include control of brightness and contrast, manipulation of color, subtraction of background details, conversion to grayscale, and image capture. All of these had application in specific situations during this study. This study showed background subtraction to be the most important capability for this type of analysis.
Estimation of air speed close to boundary layers as occurred during this work enabled the calculation of Reynolds numbers [22]. Reynolds number is a measure of turbulence in fluids. In fluids that are laminar, the velocity increases in a predictable manner with height from a surface to a maximum and streamlines remain parallel [23]. In fluids that are turbulent, velocity no longer increases in a predictable manner with height above the surface and streamlines are irregular and no longer parallel. In other words, laminar flow is characterized by the absence of mixing within a fluid that is moving along a surface—for example, the moving water in a river just above a waterfall. This water appears to be clear. The same water falling vertically in the waterfall appears white. The whiteness of the water occurs due to the mixing that is occurring. This water is turbulent. Laminar flow is “smooth”. Turbulent flow is “rough”. Laminarity and turbulence are mathematical descriptions for the type of flow. Laminar flow occurs at low velocity. There is a region of mixed flow and, at high velocity, purely turbulent flow. Characterization of flow has extreme importance in engineering design.
Equation (1) [22,23] provides the Reynolds equation in situations where surfaces are long in the direction of flow compared to their height.
where:
- R is Reynolds number (unitless).
- ρ is density (kg/m3).
- v is speed (m/s).
- L is the length of travel (m).
- µ is dynamic viscosity (kg/(m)(s)).
Table 7 provides Reynolds numbers for results obtained during this work. Density of air was 1.260 kg/m3 at 8 °C [24]. Dynamic viscosity was 1.768 × 10⁻⁵ kg/[(m)(s)] at 8 °C [24]. The temperature inside the structure at the time that this work occurred was approximately 8 °C.
Reynolds numbers calculated from measured data in Table 7 suggest that air motion in the airspace of the structure accessed through a manhole cover containing a single opening is laminar. Laminarity could have considerable importance in the design of manhole covers to optimize air exchange between the interior airspace and the external atmosphere.
An isolated subsurface structure entered through a manhole cover containing a single opening meets the textbook description for classification as a Helmholtz resonator [25]. A Helmholtz resonator consists of a cavity with a fixed volume of compressible fluid connected to the external environment through a short neck or opening (the opening in the manhole cover). An isolated subsurface structure accessed through a manhole cover containing a single opening is consistent with this definition. Air in the cavity of a Helmholtz resonator is compressible and can contract and expand as does a spring. This process occurs when air blows across the surface of the opening.
Laboratory studies of Helmholtz resonators have contributed additional information that elaborates on the process. Laboratory studies occur under controlled conditions of constant flow and direction. This contrasts with the airflow that occurred outdoors along the ground during this study. Flow along the ground during this study changed rapidly and unpredictably in magnitude and direction on a per second basis [13]. Variable flow observed during the companion study [15] to this work confirmed these observations. The numerical values determined in this study for air speeds along the ground were, in reality, an average. When a single opening was present, movement of air at the opening in the manhole cover occurred in several ways: deflection around the opening; movement straight across the opening; movement across the opening and a downward turn followed by partial entry and return to ground level; movement across the opening and a downward turn followed by full entry; and movement part-way or fully across the opening with deflection upward.
These observations seemingly complicate the acceptance of the isolated outdoor subsurface structure as a Helmholtz resonator simply on the basis of satisfying the geometric description. In the case of laboratory models, Ghanadi [25] reported that air moves across the opening (grazing flow) in a sheet-like wave that breaks roughly half-way across and forms vortices near the distal (far) edge of the opening. These effects are consistent with motion observable in the videos of air motion along the ground at the entry of the opening in the manhole cover and beyond the distal edge, as described in the companion work [15], and were confirmed and supported by study of the videos, as occurred during this work (Table 1 versus Table 2). Effects observed beyond the distal edge included the angular rise of the plume of air.
Baumeister and Rice [26] showed that grazing flow occurs differently during the inhalation and exhalation parts of the respiratory cycle of Helmholtz resonators studied in laboratory settings. During inhalation, the effective surface area of the opening is reduced due to the blockage created by the grazing flow. Entry occurs down the wall of the opening. This behavior is also observable in the videos obtained inside the isolated subsurface structure [15]. During exhalation, the emerging flow considerably reduces the resistance to flow [26]. Pressurized air exhaled from the cavity is entrained into the grazing flow. These behaviors were also observable in the videos obtained outside the isolated subsurface structure [15].
Ghanadi reported that movement of the air disrupts the sheet-like structures to create the puffs that expand and migrate through the airspace [25]. Inside the isolated subsurface structure, the air moves continuously in patterns not yet fully described. No video exists to show air movement in the bottom of the structure. Some of this movement occurs along surfaces and other parts in vertical sheet-like structures. Sheet-like structures reminiscent of the Northern Lights (Aurora Borealis) were clearly visible from the underside of the opening in the manhole cover during some parts of the cycle [15]. Measurements of concentration of carbon monoxide introduced as a tracer gas remained almost constant for any moment in time at all heights in the airspace [14]. This means that the mixing pattern was rapid, thorough, and highly effective even for a single opening in the manhole cover.
The cycle itself was not evident at the level of observation undertaken during this work because of incomplete coverage by the cameras. This situation merits attention. Repetitiveness of behavior of the “smoke” was also clearly evident in the companion study [15] and during the present work. Focus on duration and repetitiveness of the cycle likely would produce an estimate of these parameters. Irregularity and inability to predict when entry will occur based on video showing partial versus full entry of the “smoke” into the isolated subsurface structure create doubt about the efficiency of the process reported in the companion article [15] compared to information reported for the laboratory studies [25,26], where conditions are constant, controlled, and predictable. While the process involving the isolated subsurface structure appears to be inefficient, the videos and studies of ventilation using CO showed the type and magnitude of interactions that were possible when “smoke” did not completely pass through the opening(s) in the manhole cover [12,14,15].
The preceding discussion involving comparison of behaviors obtained during laboratory studies with those observable in the videos lends further support to the conclusion reached in the companion article [15] based solely on geometry that the isolated subsurface structure containing one opening in the manhole cover is a Helmholtz resonator.
Behaviors observable in the videos and classification of a structure as a Helmholtz resonator have considerable implications regarding worker safety. Isolated subsurface structures of the type studied during this work meet regulatory requirements for classification as confined spaces [2].
Hazardous atmospheres in confined spaces have killed many people and continue to do so [1]. This work and the companion article [15] on qualitative aspects of air movement in the same structure and other articles in this series that quantify air exchange in this structure [14,19] show that these structures ventilate. Ventilation induced by natural forces is an extremely important but almost universally unrecognized contributor to safety during work involving confined spaces [3]. This ventilation is continuous. Air exchange occurring during this ventilation reduces the concentration of contaminated air in the airspace of the structure. Air exchange through a single opening in the manhole cover, while more efficient than two or more openings, delivers less uncontaminated air [14]. Helmholtz resonators have received attention in the literature. The mechanics of flow are described in equations [25]. Ventilation of the airspace when two or more openings are present has received considerably less attention. Similarly, experience gained from the videos shows that the ventilation pattern is different [15].
As yet, the efficiency and effectiveness of ventilation processes occurring in isolated subsurface structures compared to what is achievable is unknown. Considering this information in total indicates that there exists considerable incentive to investigate optimization of air exchange in isolated subsurface structures entered through manholes containing one or more openings. The literature on manhole covers contains no information concerning ventilation induced by natural forces [27,28]. The emphasis in this area concerns the suitability of the opening(s) for the removal and repositioning of the manhole cover and strength needed to support expected loads and to prevent deformation.
With regard to a single opening in the manhole cover, important considerations for future investigation include the diameter, shape, length, and angle of inclination of the opening. With regard to two openings, the spacing between openings and between the openings and the circumferential wall become important. Initial experimentation suggests that improvement in ventilation induced by natural forces is achievable through optimization of design. The methodology developed during this work and data determined are important contributors to the enquiry needed to investigate the contribution of different configurations of openings during the study of optimization.
5. Conclusions
This article describes the development and use of a potential simple and practical, non-obtrusive method for quantifying the average speed of air moving along the ground and inside an isolated subsurface structure. The method utilizes Tracker, an open-source program used for tracking and analyzing motion in physics and videos that visualize the movement using “smoke” tubes. Image manipulation provided in Tracker is essential for performing this analysis in an efficient and effective manner. Full implementation of the method beyond a qualitative to semi-quantitative level of confidence will depend on the resolution of questions regarding the density and viscosity of the “smoke”–air mixture compared to air. This method is applicable to any isolated subsurface structure known not to contain an atmosphere incompatible with the chemical “smoke” used in the analysis.
Quantitative analysis (given the limitation mentioned above) performed during this investigation suggests that air motion inside the isolated structure accessed through a manhole cover containing one opening is almost exclusively laminar (Reynolds number <2250). Results obtained during this study are better described through the lognormal distribution that typically describes environmental data. Significant differences exist between air speed along the ground and inside the structure. Quantitative study of ventilation induced by natural forces in isolated subsurface structures is an important undertaking that deserves to receive considerably greater attention than has occurred previously. The investigation reported here could be an important starting point in this endeavor.
Taken together, the results of laboratory studies of structures having similar geometry and the results obtained during this study and the companion work [15] support the conclusion that outdoor isolated subsurface structures entered through a manhole cover containing a single opening are classifiable as Helmholtz resonators. This classification has important ramifications in studies aimed at the optimization of ventilation induced by natural forces in these structures.
The techniques developed during this investigation have potential application in further study of these structures as part of an initiative to maximize ventilation induced by natural forces through modification of design.
Author Contributions
The following aspects of this article received respective contributions: Conceptualization, T.N.M.; methodology, T.N.M.; investigation, T.N.M.; resources, A.H.; writing—original draft preparation, T.N.M.; writing—review and editing, T.N.M., A.R. and A.H.; supervision, A.H.; project administration, A.H.; funding acquisition, A.H. All authors have read and agreed to the published version of the manuscript.
Funding
This research received no external funding.
Data Availability Statement
The numerical data reported in this study resulted from analysis of videos previously reported in [15]. These numerical data have not appeared elsewhere.
Acknowledgments
TNM received a scholarship from CAPES (Coordenação de Aperfeiçoamento de Pessoal de Nível Superior), Brasilia, DF, Brasil. Assed Haddad received a grant from CNPq (Conselho Nacional de Desenvolvimento Científico e Tecnológico), formerly Conselho Nacional de Pesquisas, Brasilia, DF, Brasil (the Brazililian National Research Council) in pursuit of this work. Special thanks are due to Jack Eusebio of Fred Thompson Contractors, Burnaby, British Columbia, Canada for permission to work on their premises during this work.
Conflicts of Interest
The authors declare no conflict of interest.
References
- McManus, N. Safety and Health in Confined Spaces; CRC Press: Boca Raton, FL, USA, 1998. [Google Scholar]
- WorkSafeBC. Occupational Health & Safety Regulation, Part 09 Confined Spaces; Workers Compensation Board of British Columbia: Richmond, BC, Canada, 2018; Available online: https://www.worksafebc.com/en/law-policy/occupational-health-safety/searchable-ohs-regulation/ohs-regulation/part-09-confined-space (accessed on 9 May 2020).
- AIHA-BC Yukon. In Proceedings of the 2017 AIHA (American Industrial Hygiene Association) Industrial Hygiene Conference, Burnaby, BC, USA, 10 March 2017.
- Jones, G.W.; Miller, W.E.; Campbell, J.; Yant, W.P. Ventilation of manholes. 1. In Effect of Holes in the Covers on Natural Ventilation (RI 3307); Department of the Interior, Bureau of Mines: Washington, DC, USA, 1936. [Google Scholar]
- Jones, G.W.; Miller, W.E.; Campbell, J.; Yant, W.P. Ventilation of manholes. 2. In Effect of the Size of the Manhole on Natural Ventilation (RI 3343); Department of the Interior, Bureau of Mines: Washington, DC, USA, 1937. [Google Scholar]
- Jones, G.W.; Baker, E.S.; Campbell, J. BM Ventilation of manholes. 3. In Effect of Wind Velocity on Natural Ventilation (RI 3412); Department of the Interior, Bureau of Mines: Washington, DC, USA, 1938. [Google Scholar]
- Jones, G.W.; Miller, W.E.; Campbell, J. BM Ventilation of manholes. 4. In Effect of Vertical Ducts in Combination with Openings in Manhole Covers on the Natural Ventilation (RI 3496); Department of the Interior, Bureau of Mines: Washington, DC, USA, 1940. [Google Scholar]
- Hartman, J.L.; Mutmansky, J.M.; Ramani, R.V.; Wang, Y.J. Mine Ventilation and Air Conditioning, 3rd ed.; John Wiley & Sons: New York, NY, USA, 2012. [Google Scholar]
- Sánchez-Cañete, E.P.; Serrano-Ortiz, P.; Domingo, F.; Kowalski, A.S. Cave ventilation is influenced by variations in the CO2-dependent virtual temperature. Int. J. Speleol. 2013, 42, 1–8. [Google Scholar] [CrossRef] [Green Version]
- Wiegand, K.; Dunne, S.P. Radon in the workplace—A study of occupational exposure in BT underground structures. Ann. Occup. Hyg. 1996, 40, 569–581. [Google Scholar] [CrossRef]
- Gribble, D. Natural ventilation, harnessed by New Kingdom Egyptian tomb builders, may explain the changed floor levels in the Valley of the Kings tomb KV5. Tunn. Underground Space Technol. 2009, 24, 62–65. [Google Scholar] [CrossRef]
- McManus, T.N. Natural Ventilation of Isolated Subsurface Structures in the Infrastructure. Ph.D. Thesis, Universidade Federal Fluminense, Programa de Pós-Graduação em Engenharia Civil, Niteroí, Brasil, 2016. [Google Scholar]
- McManus, T.N.; Haddad, A.N. Surface air movement: An important contributor to ventilation of isolated subsurface structures? Infrastructures 2019, 4, 23. [Google Scholar] [CrossRef] [Green Version]
- McManus, T.N.; Haddad, A.N. Ventilation of an isolated subsurface structure induced by natural forces. Infrastructures 2019, 4, 33. [Google Scholar] [CrossRef] [Green Version]
- McManus, T.N.; Haddad, A.N. Visualizing air motion involving isolated subsurface structures: A critical tool for understanding ventilation induced by natural forces. Infrastructures 2019, 4, 59. [Google Scholar] [CrossRef] [Green Version]
- McManus, T.N.; Haddad, A.N. Solvent evaporation in an isolated subsurface structure: An unrecognized and underappreciated risk. Infrastructures 2019, 4, 47. [Google Scholar] [CrossRef] [Green Version]
- AIHA (American Industrial Hygiene Association). IHSTAT (ver. 235); American Industrial Hygiene Association: Falls Church, VA, USA, 2016; Available online: https://www.aiha.org/get-involved/VolunteerGroups/Pages/Exposure-Assessment-Strategies-Committee.aspx (accessed on 28 January 2019).
- AIHA (American Industrial Hygiene Association). A Strategy for Assessing and Managing Occupational Exposures, 4th ed.; Jahn, S.D., Bullock, W.H., Ignacio, J.S., Eds.; American Industrial Hygiene Association: Falls Church, VA, USA, 2015. [Google Scholar]
- Dräger Safety. Air Current Tubes, Safety Data Sheet, Revision 12, 14.07.2015; Dräger Safety: Lübeck, Germany, 2015. [Google Scholar]
- MSA (Mine Safety Appliances). Ventilation Smoke Tube (Safety Data Sheet); Mine Safety Appliances Company: Cranberry Township, PA, USA, 2015. [Google Scholar]
- Sigma Aldrich. Ethylenediamine Diacetate. Safety Data Sheet, Product Number 420352, Version 5.0, Revision Date 28.07.2012; Sigma-Aldrich Brasil Ltd.: Sao Paulo, Brazil, 2012. [Google Scholar]
- Dunn, D.J. Fluid Mechanics, Tutorial No. 3, Boundary Layer Theory. Free Tutorials on Engineering and Science. Available online: https://www.academia.edu/11365317/Unit_41_Fluid_Mechanics_TUTORIAL_3_THE_FLOW_OF_REAL_FLUIDS (accessed on 9 May 2020).
- Dunn, D.J. Fluid Mechanics, Tutorial No. 1, Fluid Flow Theory. Free Tutorials on Engineering and Science. Available online: https://docplayer.net/14756807-Tutorial-no-1-fluid-flow-theory.html (accessed on 9 May 2020).
- Engineers Edge. Viscosity of Air, Dynamic and Kinematic; Engineers Edge LLC: Monroe, GA, USA, 2020; Available online: https://www.engineersedge.com/physics/viscosity_of_air_dynamic_and_kinematic_14483.htm (accessed on 25 July 2020).
- Ghanadi, F. Application of a Helmholtz Resonator Excited by Grazing flow for Manipulation of a Turbulent Boundary Layer. Ph.D. Thesis, University of Adelaide, Adelaide, Australia, 2014. [Google Scholar]
- Baumeister, K.J.; Rice, E.J. Visual Study of the Effect of Grazing Flow on the Oscillatory Flow in a Resonator Orifice; NASA TM-X-3288; National Aeronautics and Space Administration: Washington, DC, USA, 1975; Volume 1. Available online: https://ntrs.nasa.gov/archive/nasa/casi.ntrs.nasa.gov/19750023784.pdf (accessed on 9 May 2020).
- Young, J.E. What Makes Steel Manhole Covers Unsafe? PetrolPlaza, 1 February 1999. Available online: https://www.petrolplaza.com/knowledge/1871 (accessed on 27 June 2020).
- Kent Stainless. Manholes. Kent Stainless, Wexford, Ireland. Available online: https://cms.esi.info/Media/documents/145979_1398786980924.pdf (accessed on 27 June 2020).
Figure 1.
This diagram summarizes key information associated with work performed during this investigation. It also provides a ready reference for understanding parameters obtained during analysis using Tracker.
Figure 1.
This diagram summarizes key information associated with work performed during this investigation. It also provides a ready reference for understanding parameters obtained during analysis using Tracker.

Figure 2.
Interior view of the isolated subsurface structure showing the stand holding the cameras. The GoPro camera is clearly visible. The lighting configuration was an early version. This version provided insufficient illumination for obtaining videos.
Figure 2.
Interior view of the isolated subsurface structure showing the stand holding the cameras. The GoPro camera is clearly visible. The lighting configuration was an early version. This version provided insufficient illumination for obtaining videos.

Figure 3.
Technique for providing “smoke” near the opening in the manhole cover. All but the center opening were plugged. The photo also shows configurations of the cameras during experimentation to determine the optimum position for capturing video along the surface of the ground. (A low oblique angle as shown in the lower camera produced the best results).
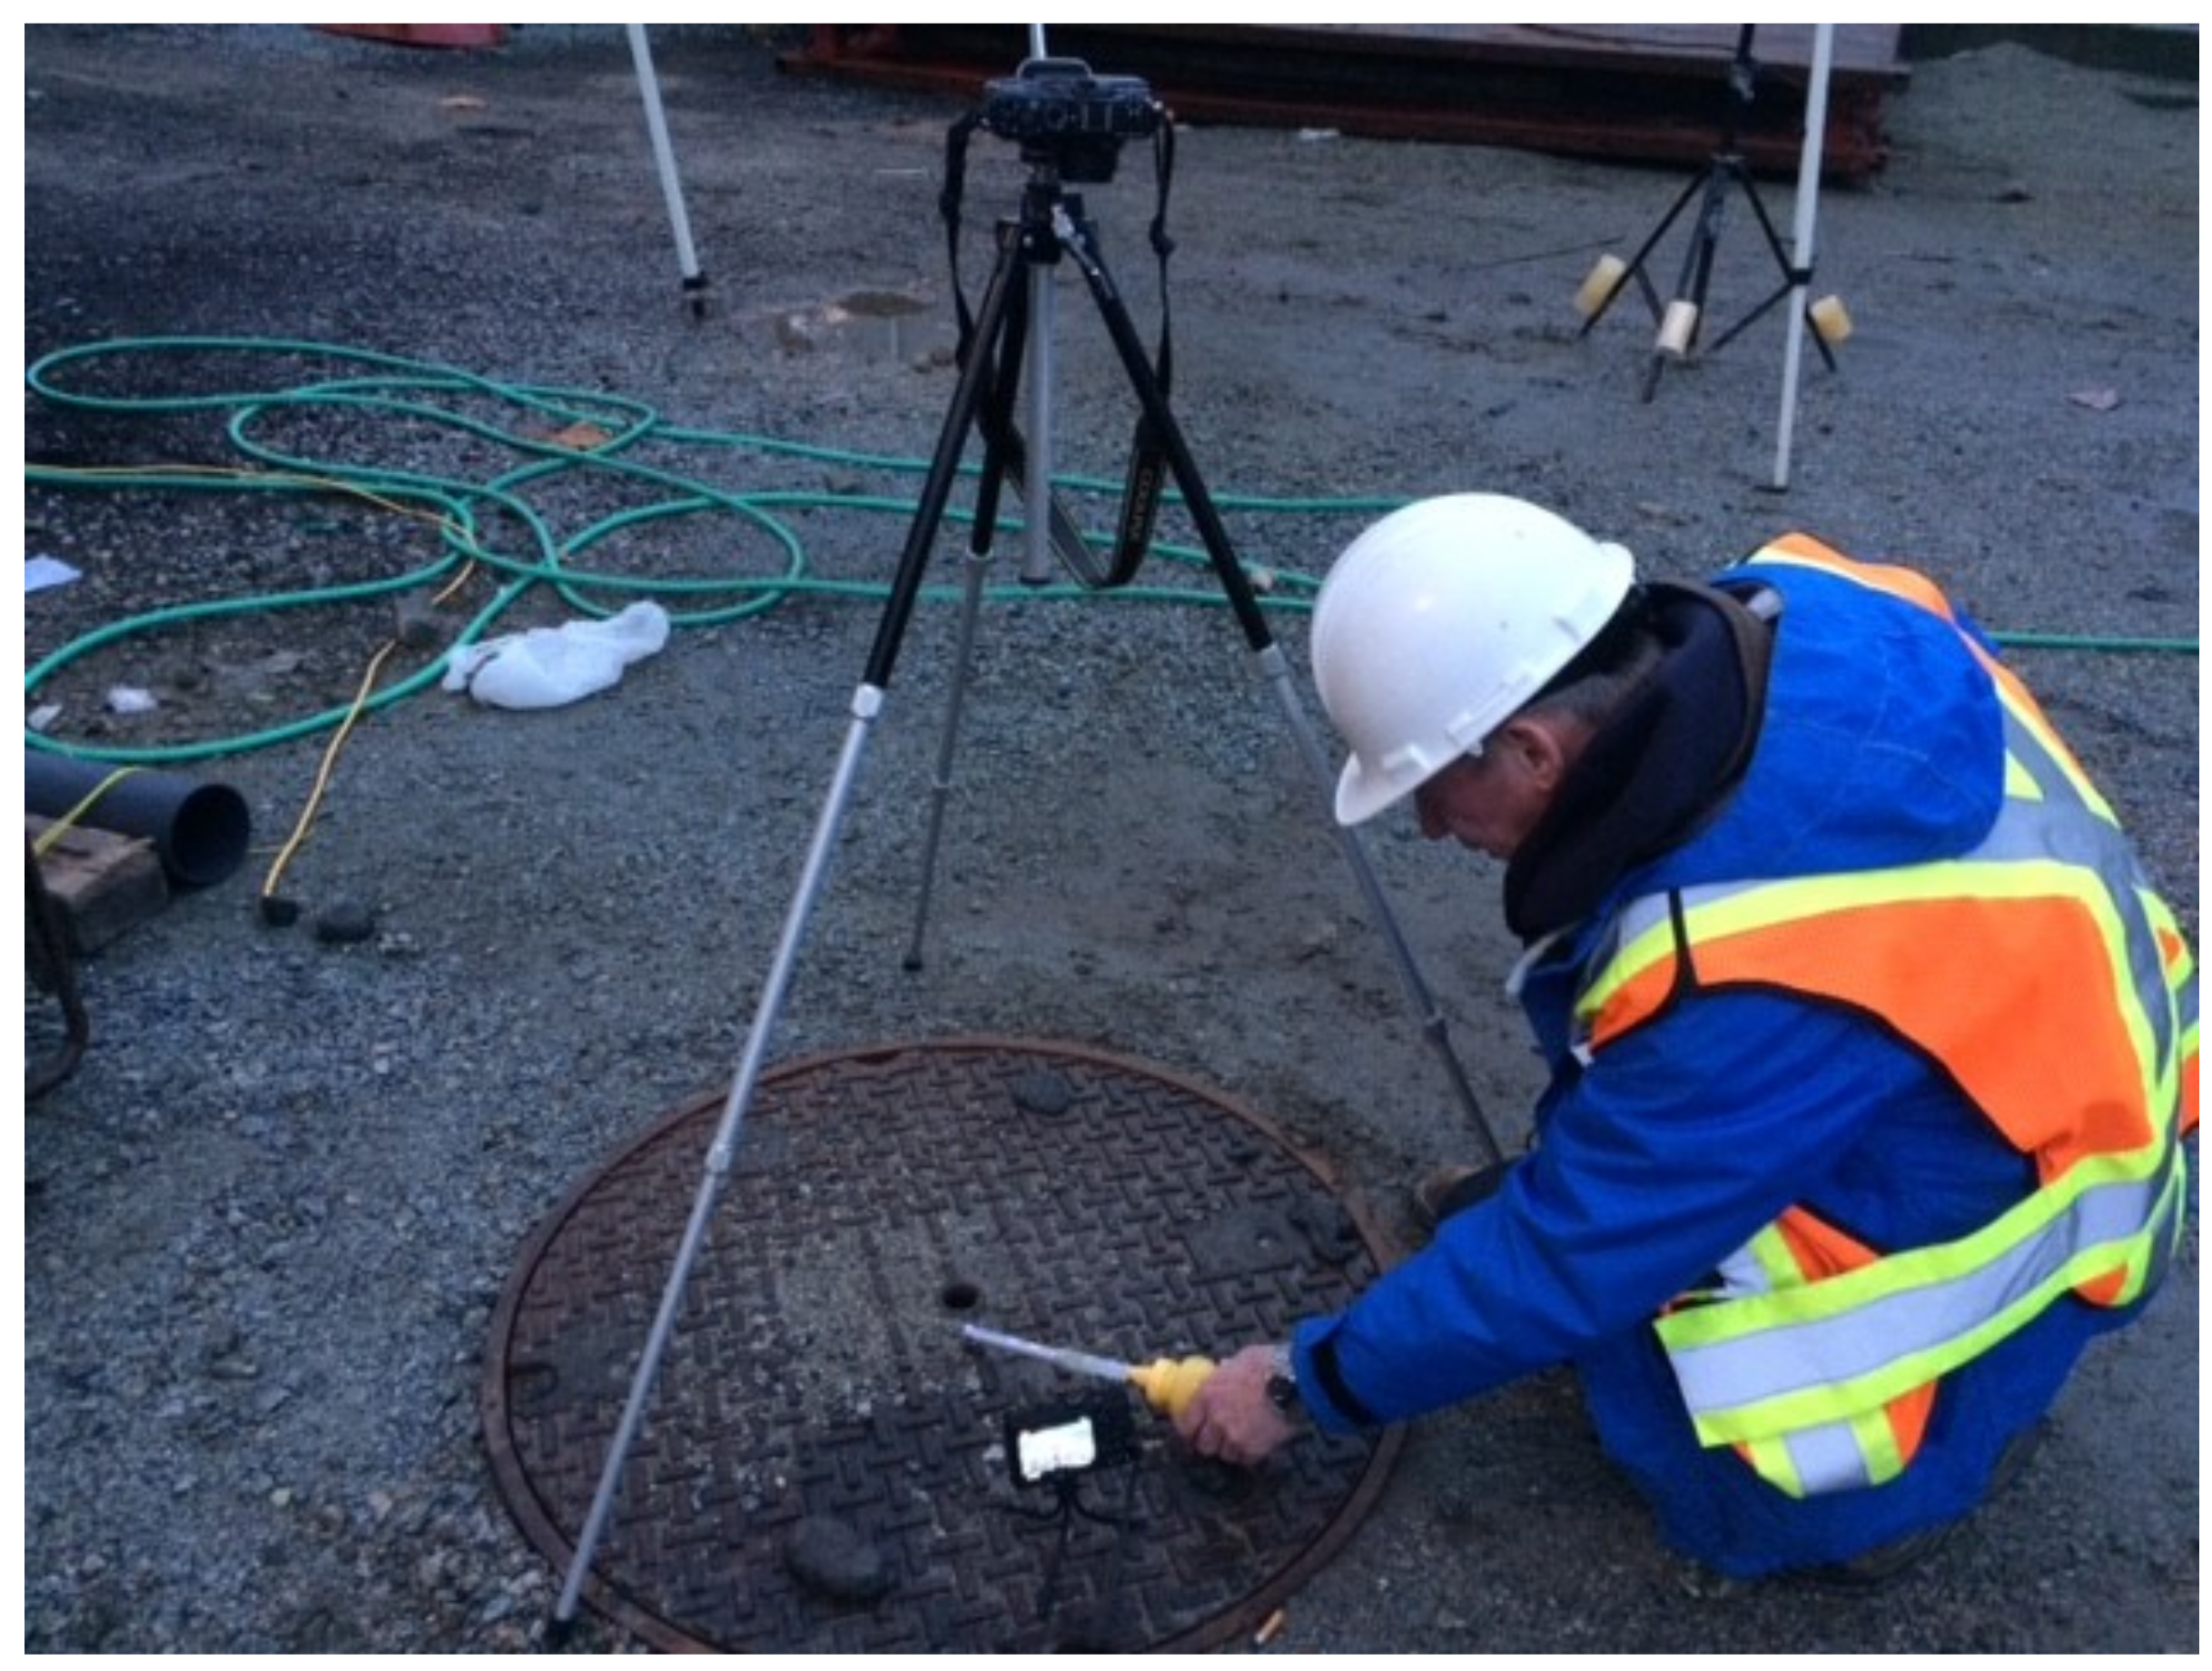
Figure 4.
Image capture from Tracker showing the interior of the structure and some of the lighting prior to application of the “baseline subtract” function.
Figure 4.
Image capture from Tracker showing the interior of the structure and some of the lighting prior to application of the “baseline subtract” function.
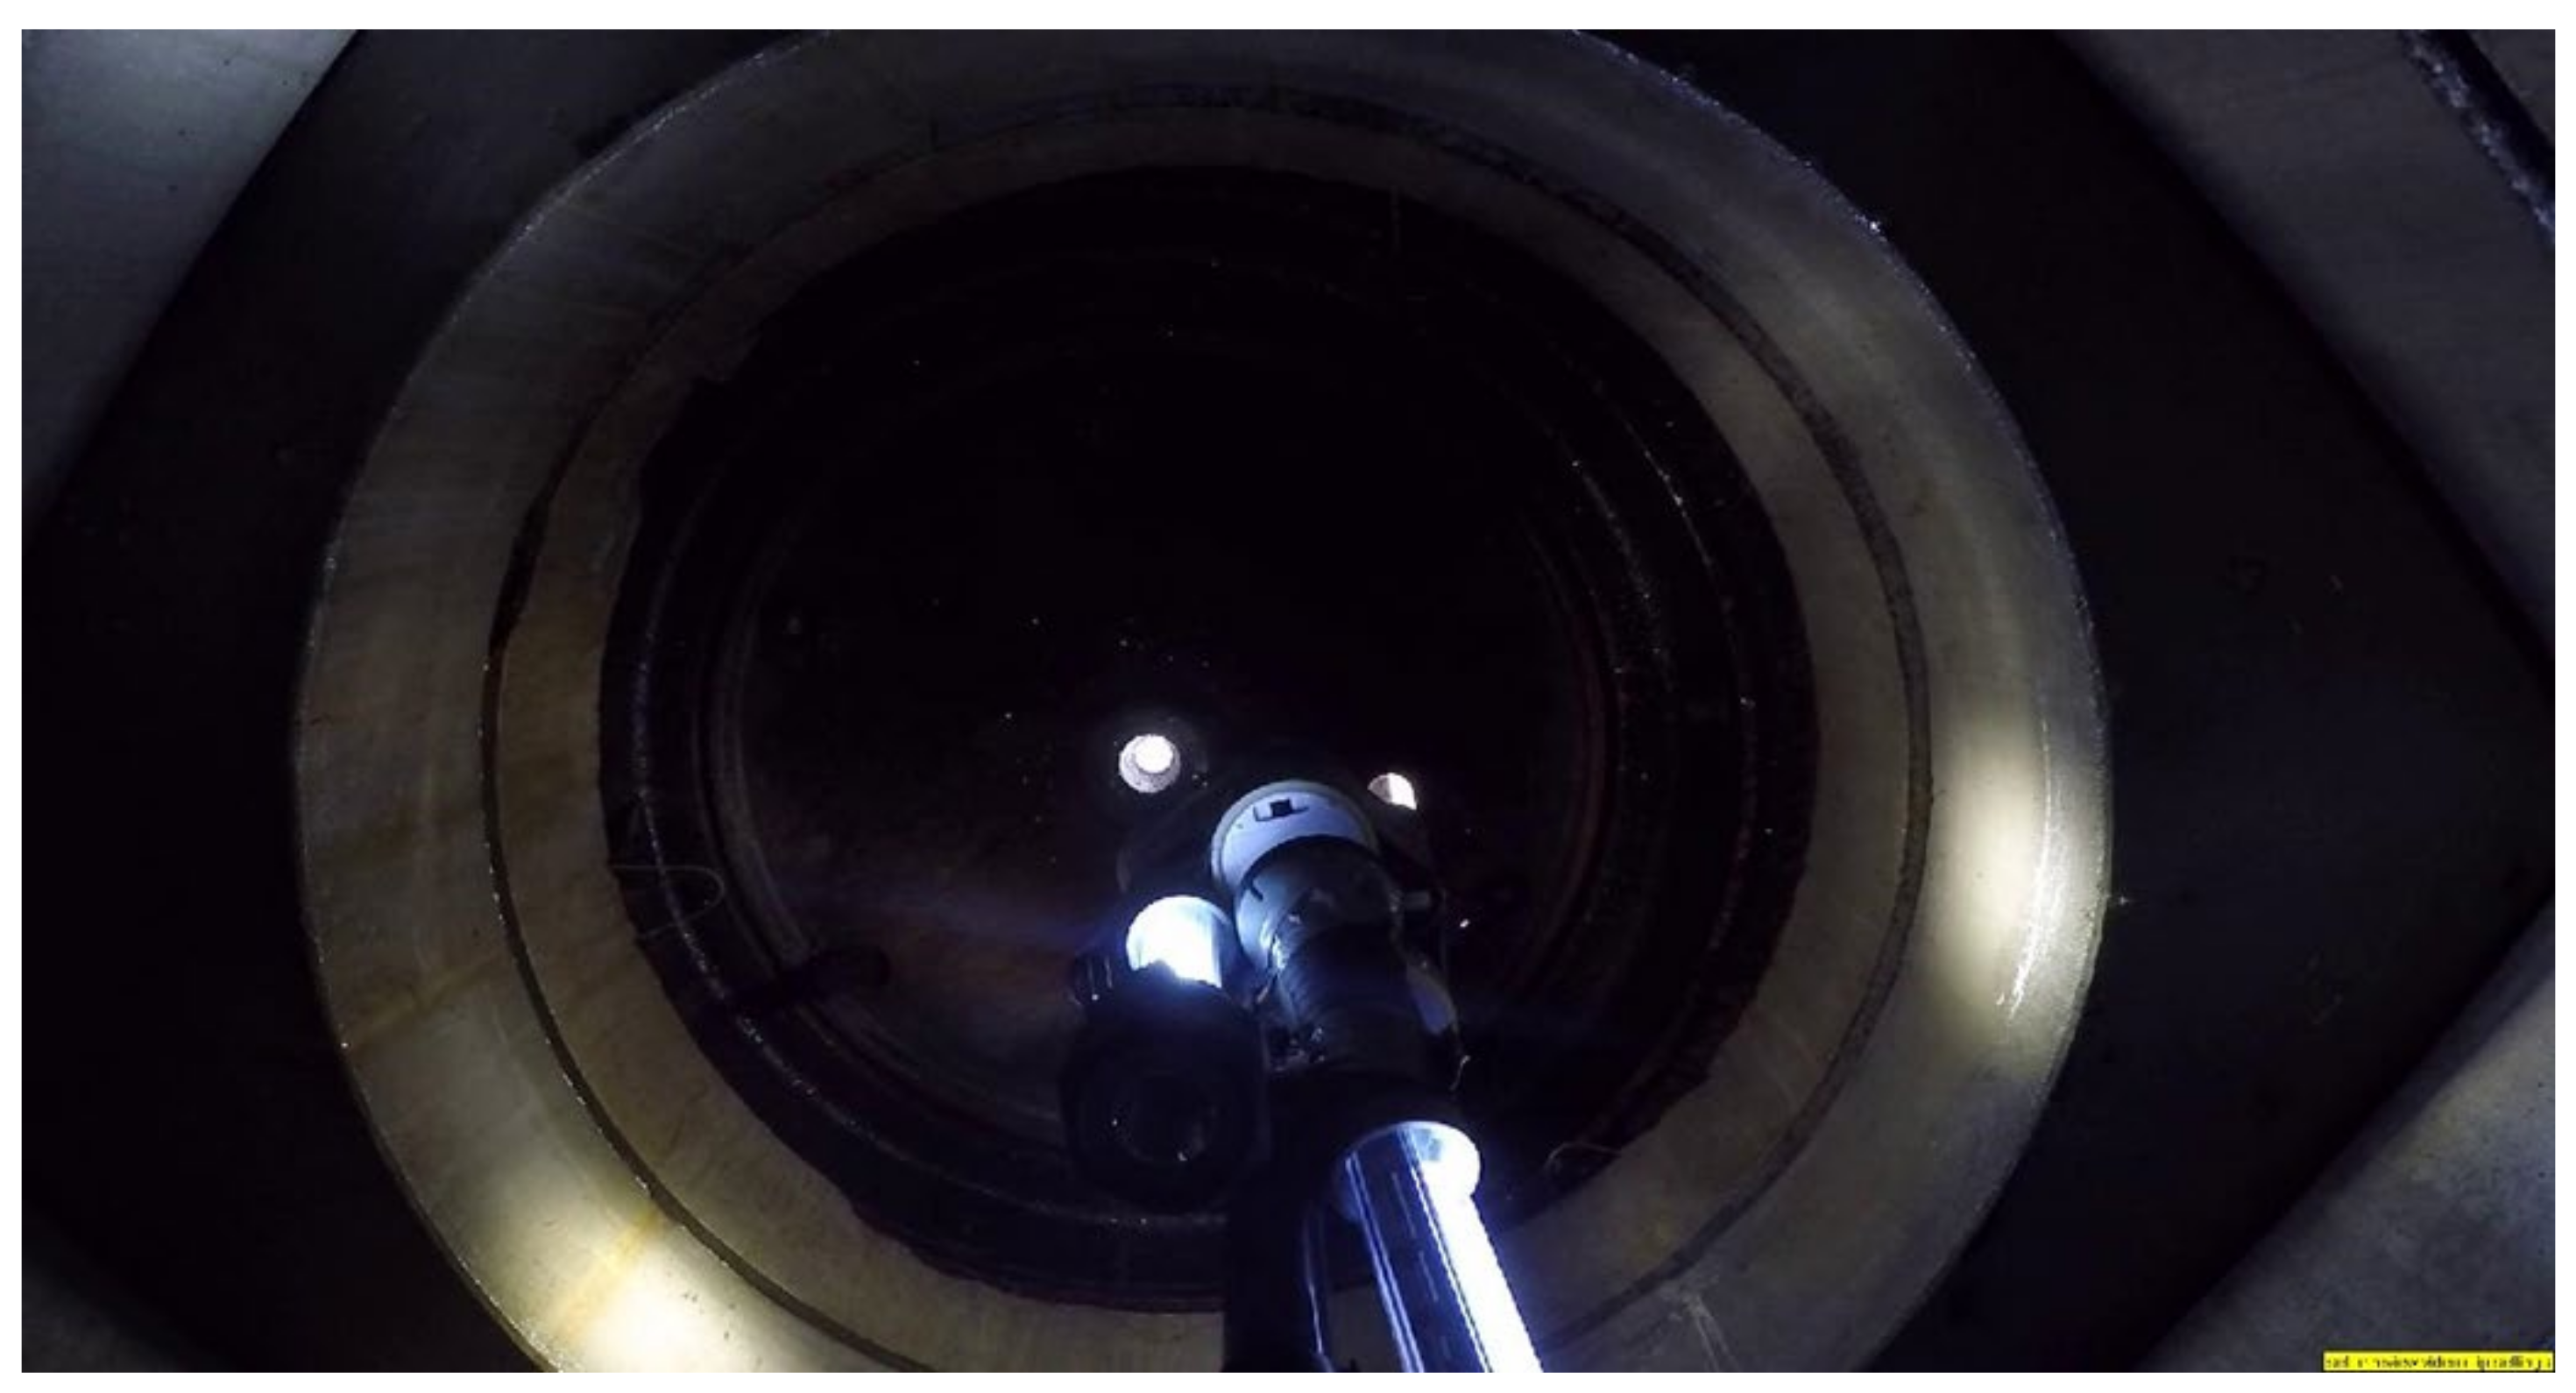
Figure 5.
Image capture from Tracker showing movement of “smoke” into the interior of the structure after descending down the center opening following application of the “baseline subtract” function to the image in Figure 4. The outline of only the lighting stand is barely visible. The incoming “smoke” is clearly visible in the 6 o’clock position.
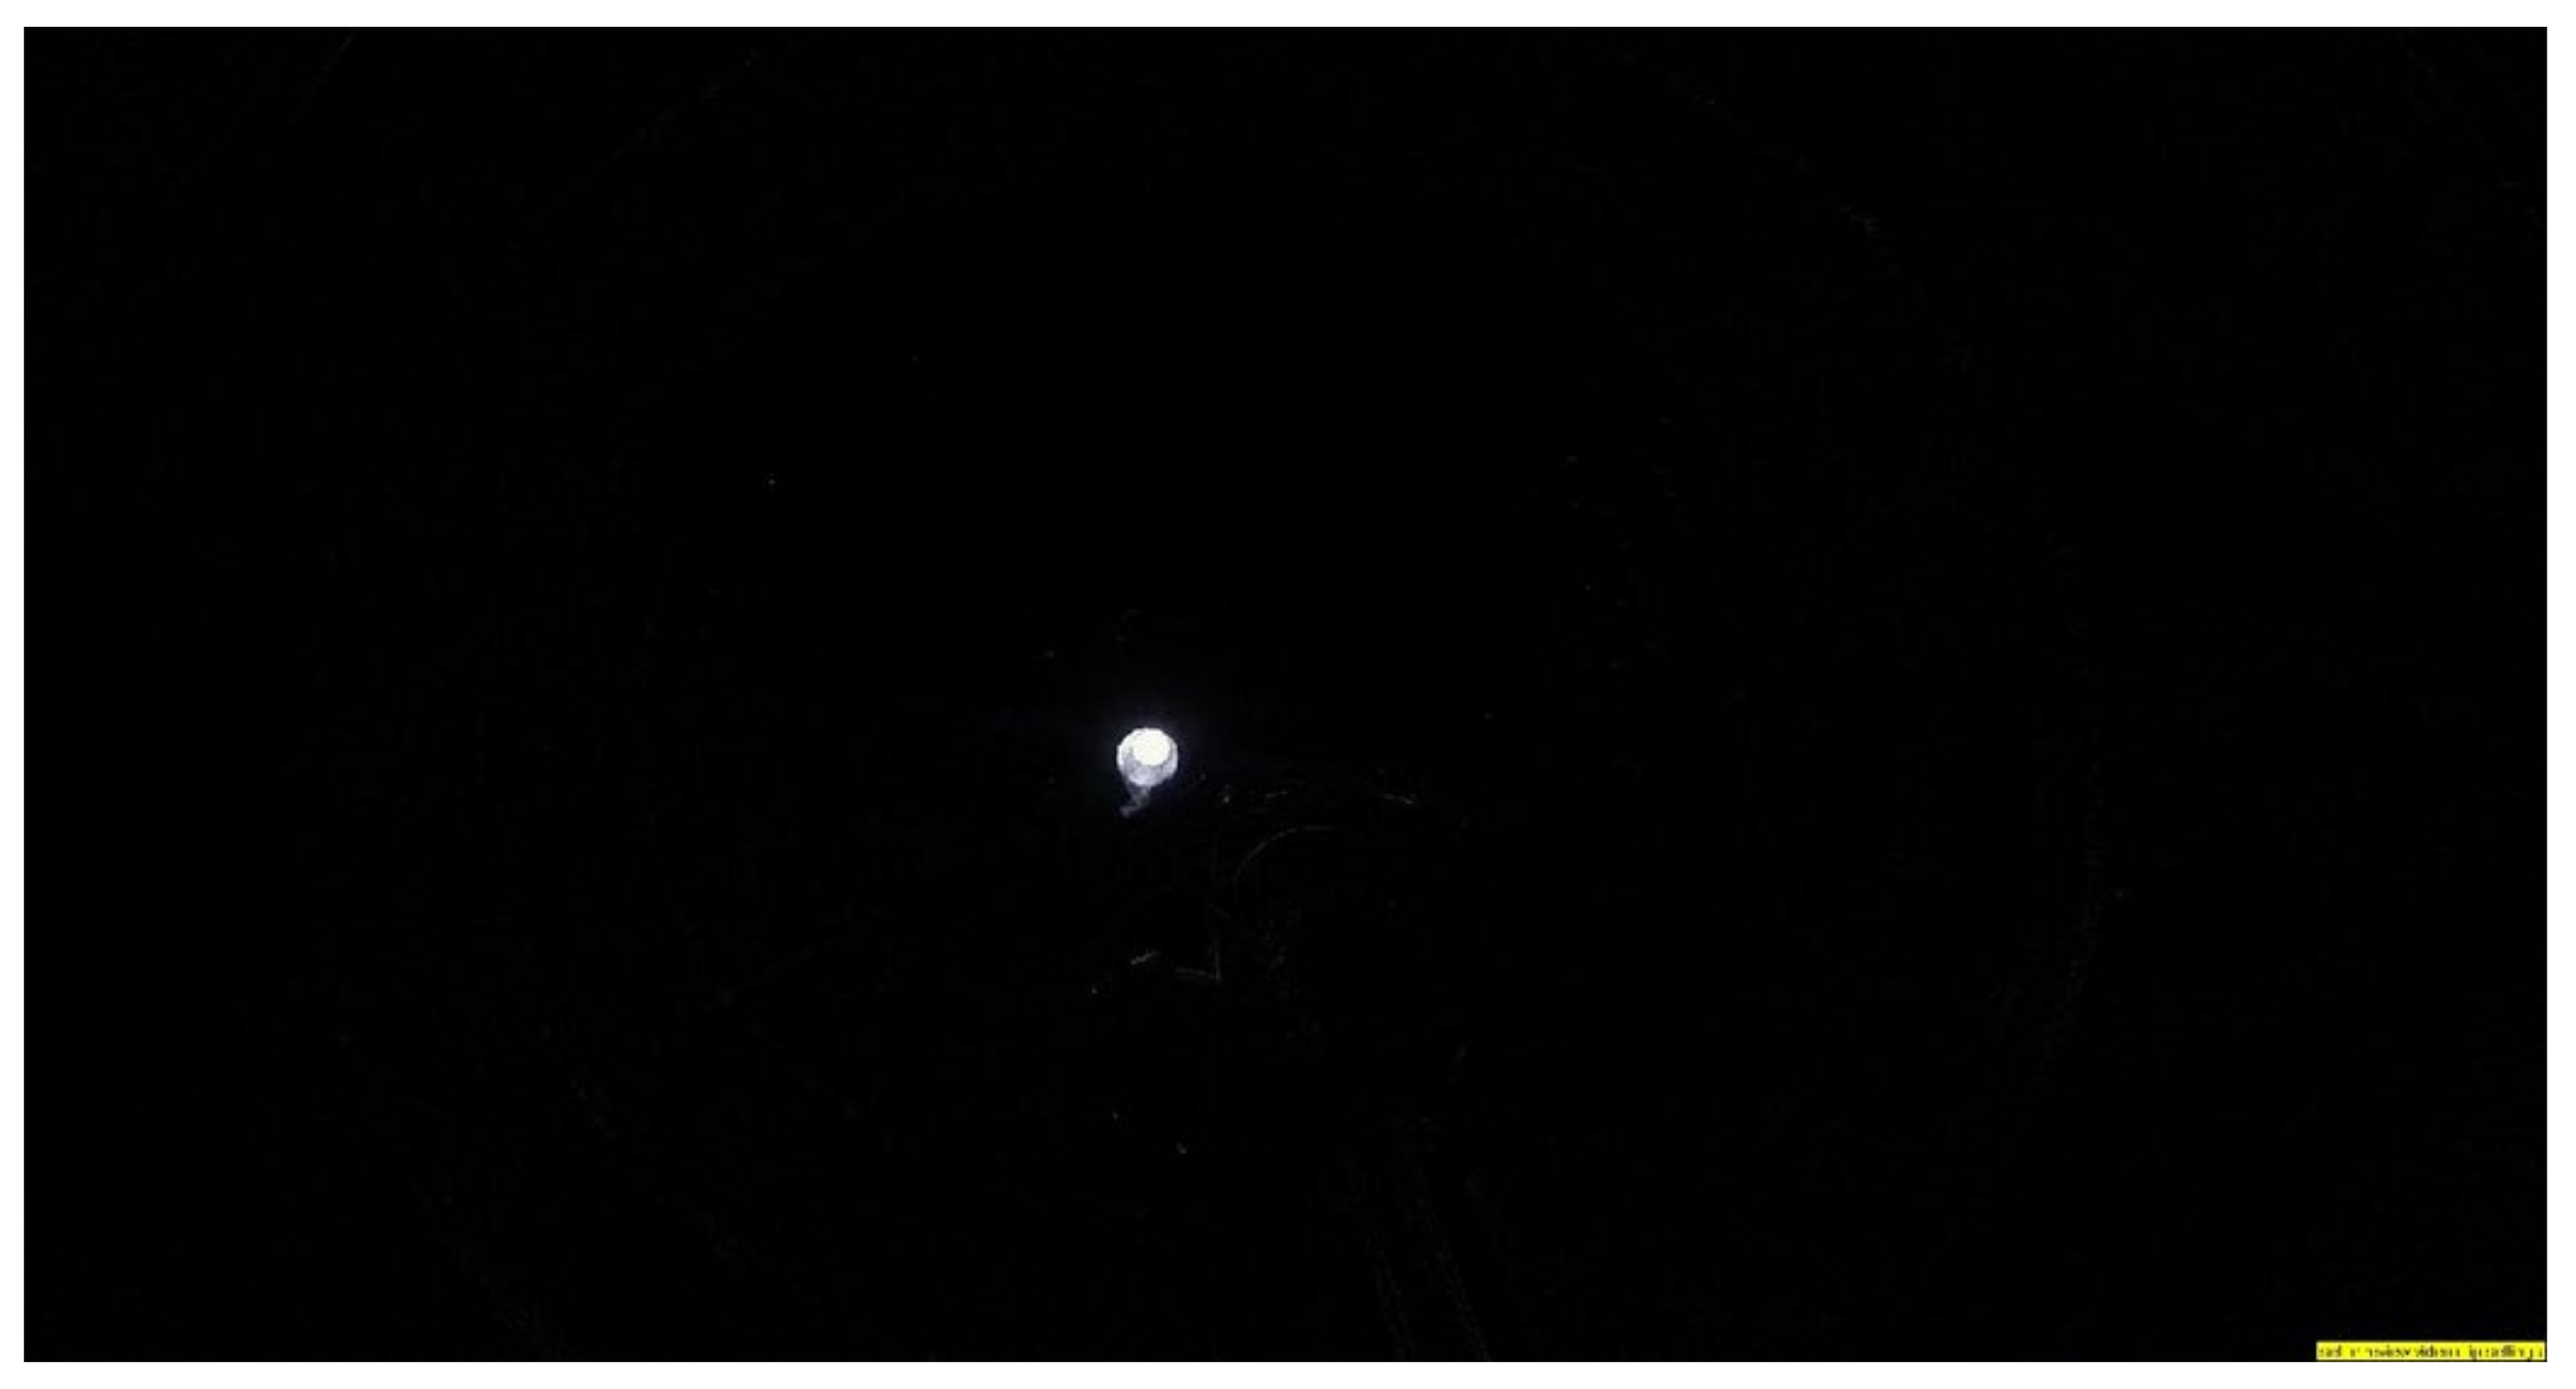
Figure 6.
Image capture from Tracker showing horizontal movement of a puff of “smoke” along the underside of the manhole cover. The puff is visible as a faint, small cloud of white at the 7 o’clock position just beyond the opening. Application of the “baseline subtract” function increased the visibility of the puff to the level needed for identification and measurement of distance travelled.
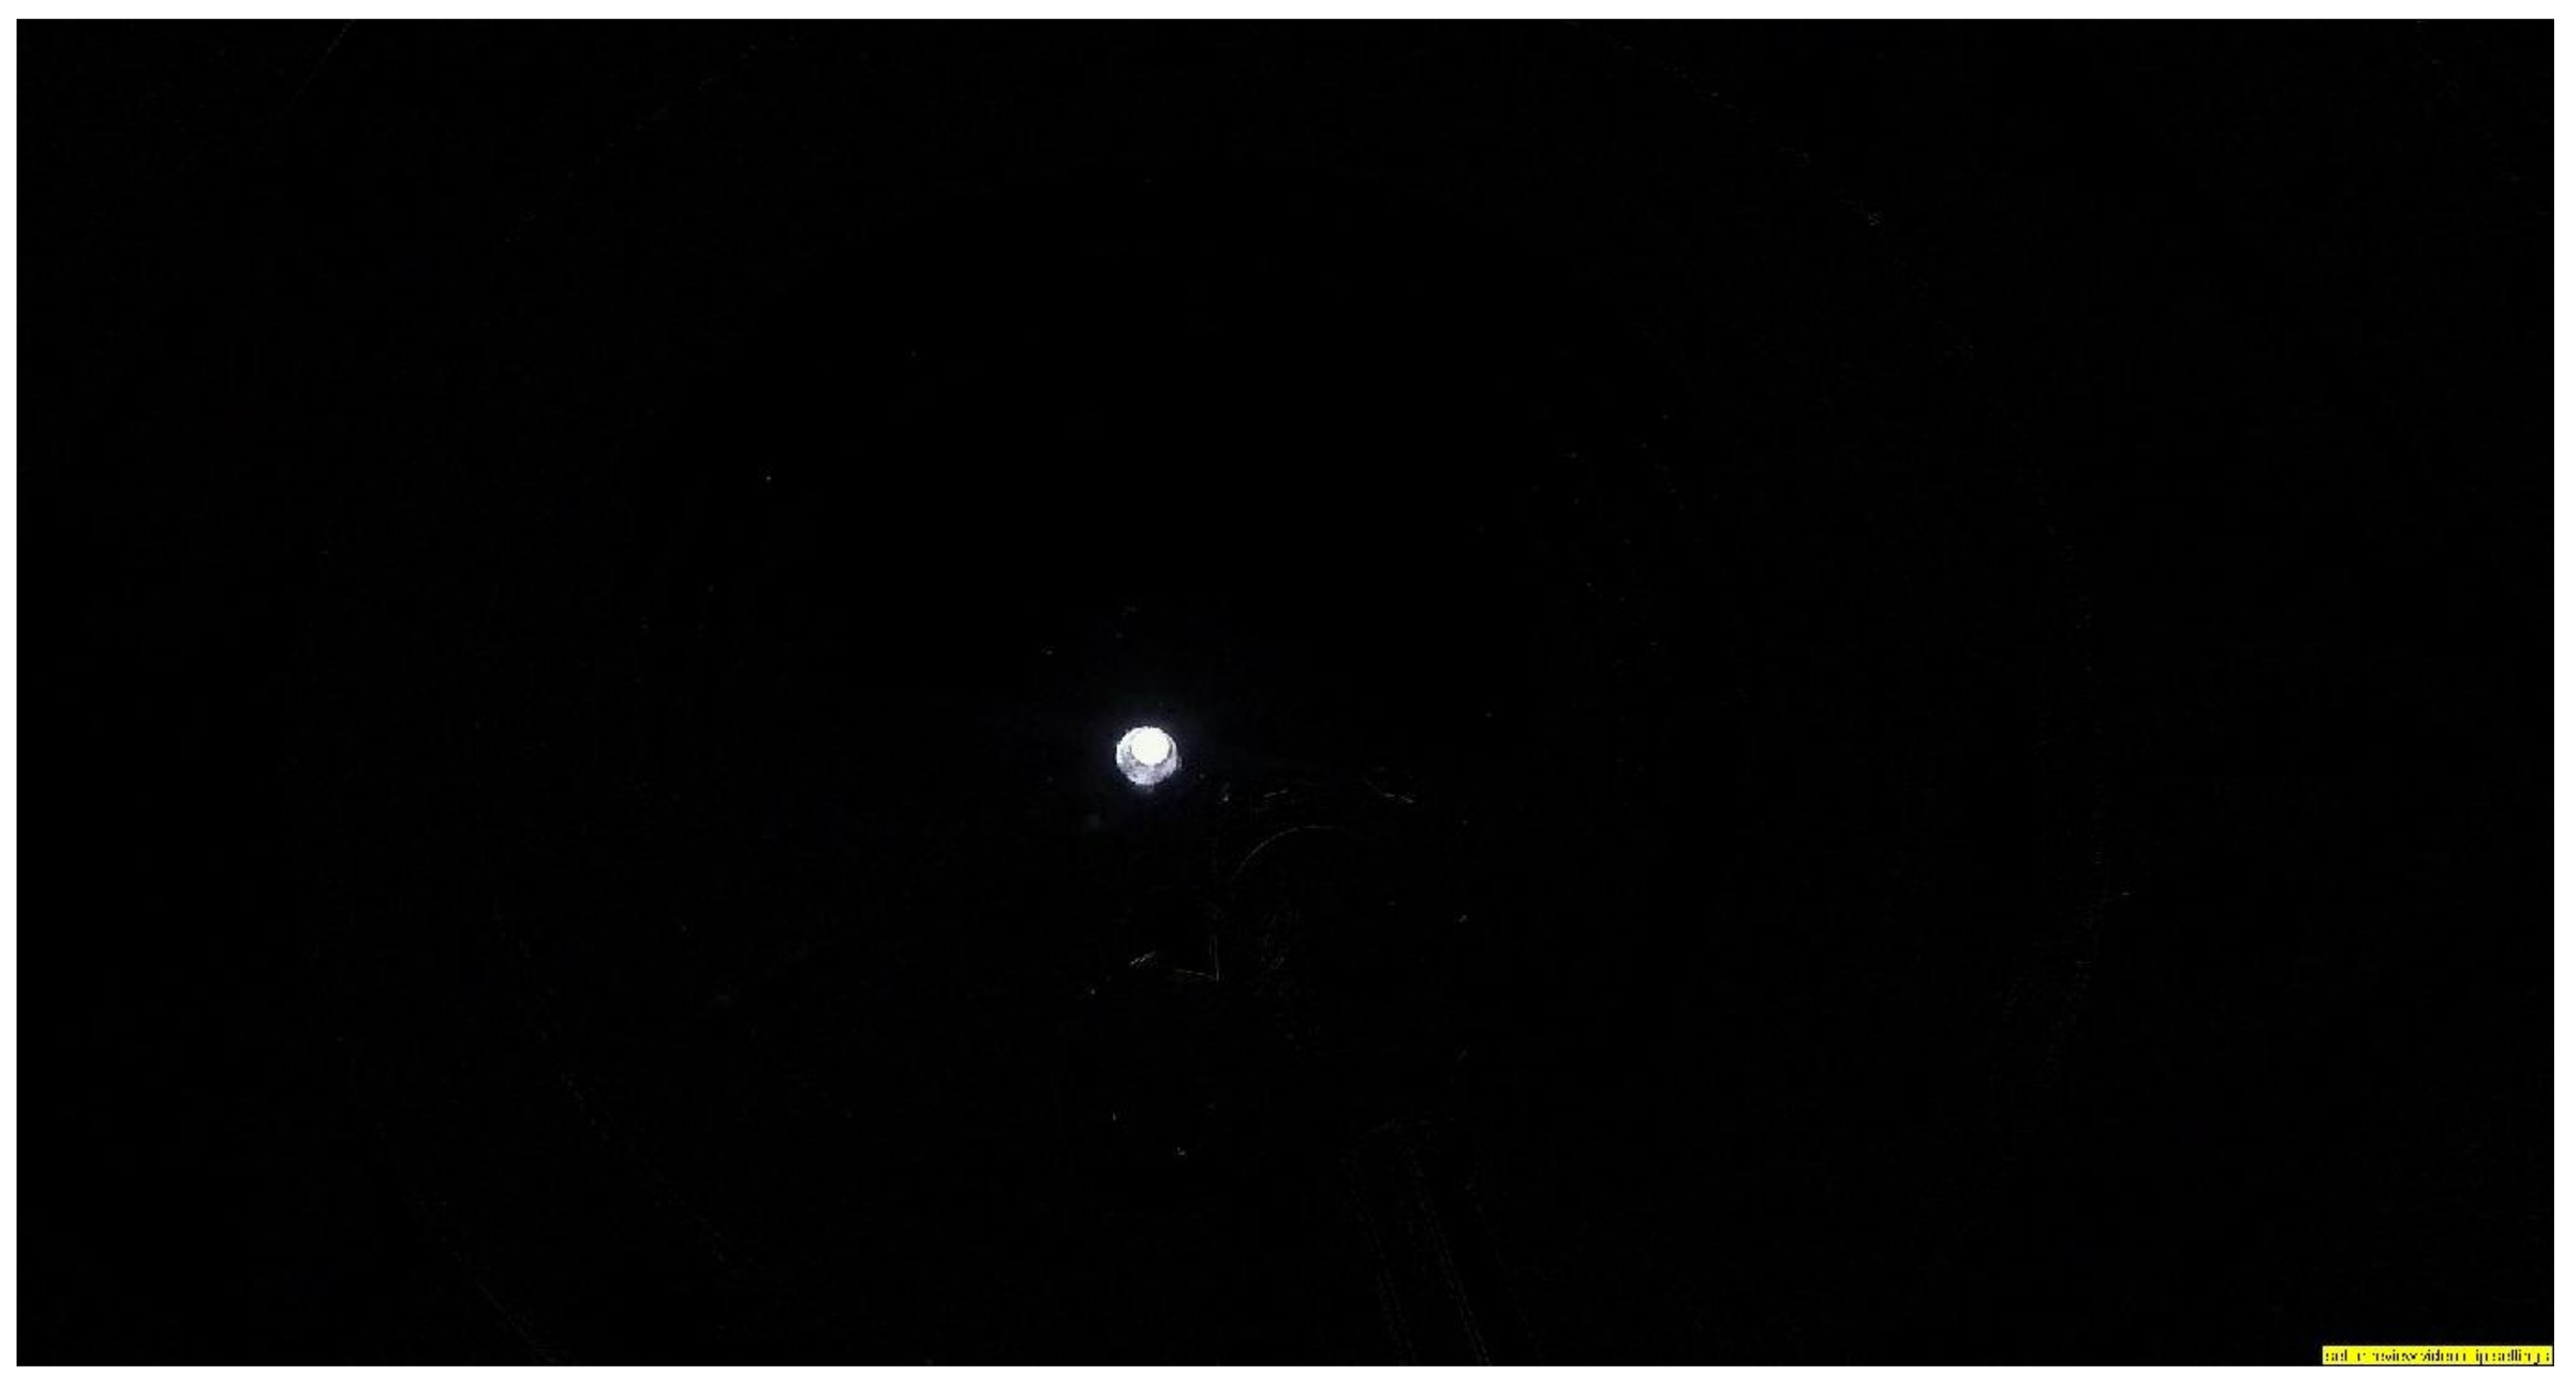
Figure 7.
Photo showing emission of “smoke” from the isolated subsurface structure soon after removing the manhole cover. The “smoke” appears as a hazy white coloration of the internal atmosphere.
Figure 7.
Photo showing emission of “smoke” from the isolated subsurface structure soon after removing the manhole cover. The “smoke” appears as a hazy white coloration of the internal atmosphere.

Figure 8.
Emission of puffs of “smoke” from an open manhole soon after removing the cover. The smoke appears as a white coloration of the internal atmosphere in the center of the manhole.
Figure 8.
Emission of puffs of “smoke” from an open manhole soon after removing the cover. The smoke appears as a white coloration of the internal atmosphere in the center of the manhole.
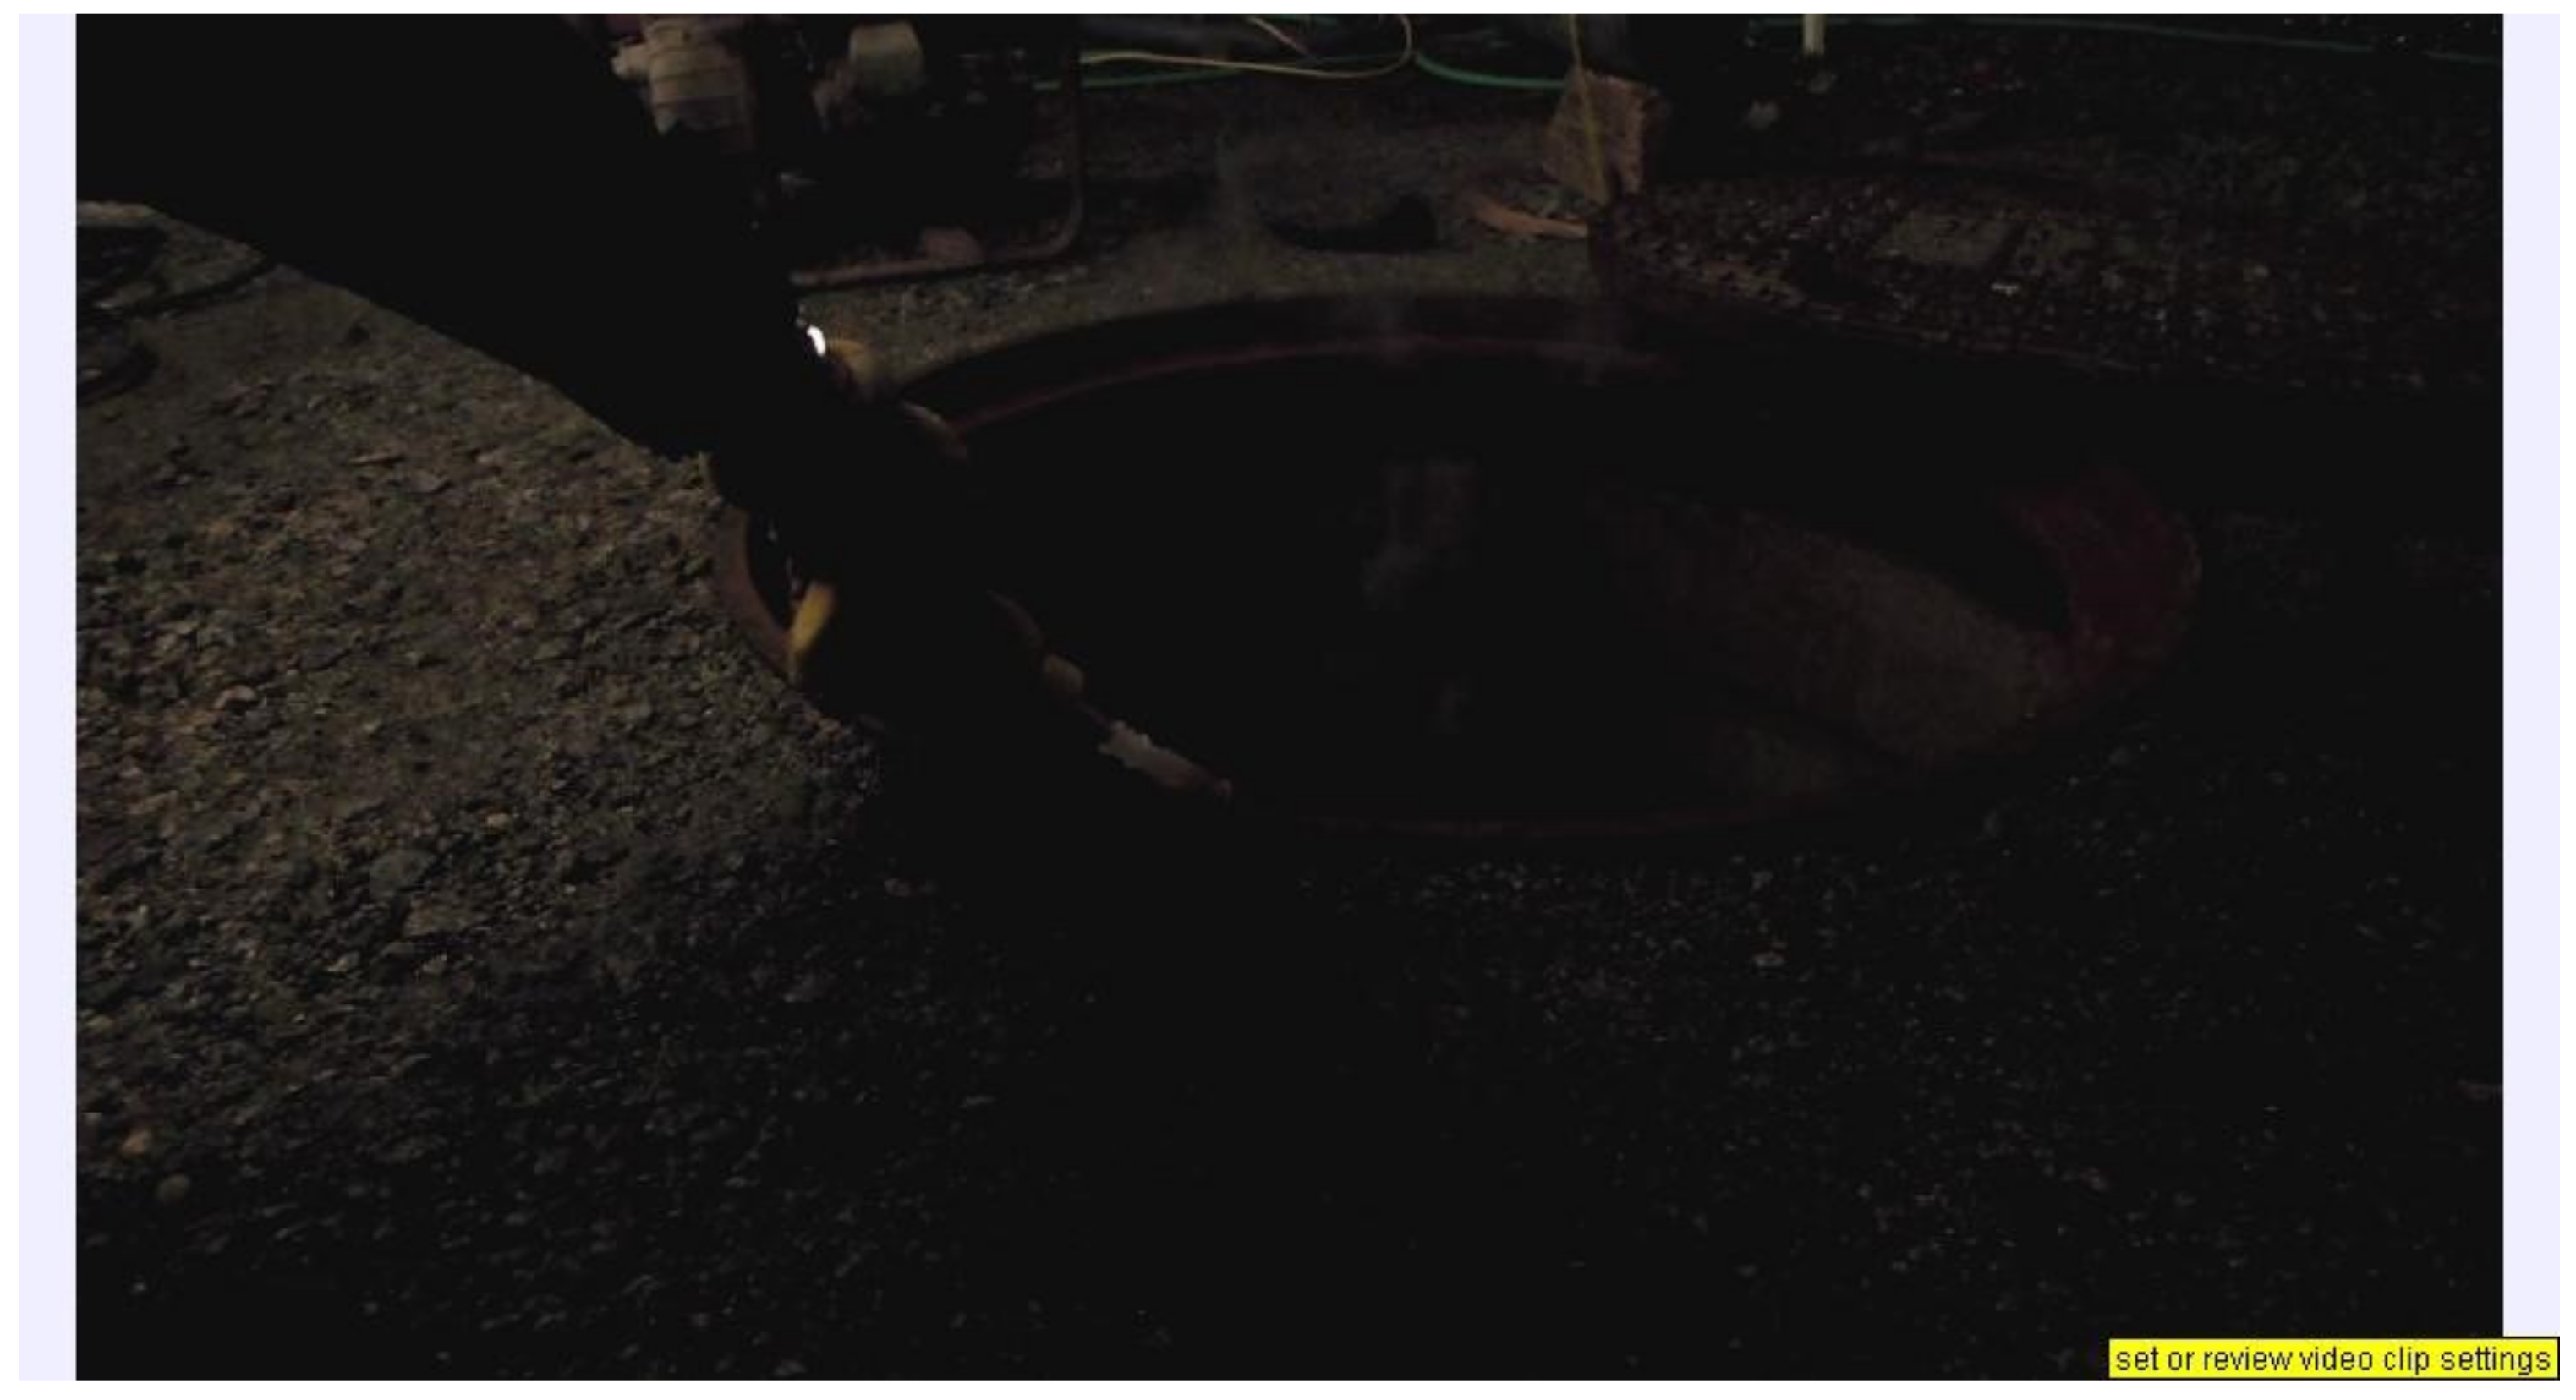
Figure 9.
Summary of air movement along the ground and inside the isolated subsurface structure. GM is geometric mean; GSD is geometric standard deviation.
Figure 9.
Summary of air movement along the ground and inside the isolated subsurface structure. GM is geometric mean; GSD is geometric standard deviation.


Table 1.
Air motion along the surface of the ground removed from the opening under study.
| Frame Number | Distance | Geometric | |||||||
|---|---|---|---|---|---|---|---|---|---|
| File | Start | Stop | Frames | Frame Rate/s | Ruler mm | Ratio | Speed mm/s | Mean mm/s | Standard Deviation |
| 0879 | 1367 | 1376 | 9 | 24 | 168 | 0.875 | 392 | 428 | 1.39 (0.950) |
| 1394 | 1402 | 8 | 24 | 156 | 0.875 | 410 | |||
| 1428 | 1436 | 8 | 24 | 160 | 0.875 | 420 | |||
| 1451 | 1464 | 13 | 24 | 155 | 0.875 | 250 | |||
| 1478 | 1484 | 6 | 24 | 160 | 0.875 | 560 | |||
| 1504 | 1509 | 5 | 24 | 155 | 0.875 | 651 | |||
| 0880 | 395 | 401 | 6 | 24 | 60 | 1.867 | 448 | 217 | 2.56 (0.902) |
| 334 | 339 | 5 | 24 | 34 | 1.867 | 305 | |||
| 1664 | 1670 | 6 | 24 | 10 | 1.867 | 75 | |||
| 0881 | 1119 | 1126 | 7 | 24 | 20 | 4.0 | 274 | 286 | 1.48 (0.756) |
| 1172 | 1180 | 8 | 24 | 21 | 4.0 | 252 | |||
| 2939 | 2947 | 8 | 24 | 47 | 4.0 | 564 | |||
| 3016 | 3027 | 11 | 24 | 25 | 4.0 | 218 | |||
| 4237 | 4269 | 32 | 24 | 75 | 4.0 | 225 | |||
| 0882 | 1337 | 1363 | 26 | 24 | 85 | 2.33 | 183 | 241 | 1.41 (0.935) |
| 1452 | 1472 | 20 | 24 | 80 | 2.33 | 224 | |||
| 1492 | 1512 | 20 | 24 | 140 | 2.33 | 391 | |||
| 1600 | 1628 | 28 | 24 | 85 | 2.33 | 170 | |||
| 1644 | 1666 | 22 | 24 | 117 | 2.33 | 297 | |||
| Combined result | 297 | 1.67 (0.944) | |||||||
Note: File refers to the number of an individual video. Numbers in brackets (0.xxx) are values obtained in the W-test applied by IHSTAT to the lognormal distribution.
Table 2.
Motion along the surface of the ground near the opening in the manhole cover.
| Frame Number | Distance | Geometric | |||||||
|---|---|---|---|---|---|---|---|---|---|
| File | Start | Stop | Frames | Frame Rate/s | Ruler mm | Ratio | Speed mm/s | Mean mm/s | Standard Deviation |
| Single opening | |||||||||
| 0881 | 970 | 974 | 4 | 24 | 12 | 4 | 288 | 228 | 1.57 (0.871) |
| 4133 | 4139 | 6 | 24 | 10 | 4 | 160 | |||
| 4155 | 4161 | 6 | 24 | 24 | 4 | 384 | |||
| 4299 | 4304 | 5 | 24 | 8 | 4 | 154 | |||
| 0882 | 5794 | 5804 | 10 | 24 | 45 | 2.33 | 252 | 252 | |
| 0887 | 538 | 552 | 14 | 24 | 28 | 4.67 | 224 | 289 | 1.44 |
| 1263 | 1272 | 9 | 24 | 30 | 4.67 | 374 | |||
| 0888 | 3546 | 3573 | 27 | 24 | 27 | 4 | 96 | 171 | 1.54 (0.816) |
| 4373 | 4384 | 11 | 24 | 30 | 4 | 262 | |||
| 4408 | 4420 | 12 | 24 | 28 | 4 | 224 | |||
| 4477 | 4488 | 11 | 24 | 27 | 4 | 236 | |||
| 4617 | 4629 | 12 | 24 | 28 | 4 | 224 | |||
| 5167 | 5187 | 20 | 24 | 20 | 4 | 96 | |||
| 6016 | 6035 | 19 | 24 | 30 | 4 | 152 | |||
| 7279 | 1553 | 1574 | 21 | 30 | 47 | 1.56 | 105 | 202 | 1.63 (0.964) |
| 1604 | 1617 | 13 | 30 | 68 | 1.56 | 245 | |||
| 1627 | 1639 | 12 | 30 | 85 | 1.56 | 332 | |||
| 3562 | 3574 | 12 | 30 | 50 | 1.56 | 195 | |||
| 7283 | 393 | 412 | 19 | 30 | 45 | 1.65 | 117 | 138 | 1.43 (0.839) |
| 415 | 432 | 17 | 30 | 37 | 1.65 | 108 | |||
| 437 | 446 | 9 | 30 | 38 | 1.65 | 209 | |||
| 7329 | 2316 | 2329 | 13 | 30 | 45 | 1.4 | 145 | 135 | 1.72 (0.937) |
| 2378 | 2396 | 18 | 30 | 31 | 1.4 | 72 | |||
| 2736 | 2747 | 11 | 30 | 29 | 1.4 | 111 | |||
| 2851 | 2855 | 4 | 30 | 30 | 1.4 | 315 | |||
| 6190 | 6210 | 20 | 30 | 58 | 1.4 | 122 | |||
| GoPro24 | 6030 | 6036 | 6 | 30 | 18 | 2.33 | 175 | 278 | 1.30 (0.858) |
| 6098 | 6100 | 2 | 30 | 11 | 2.33 | 320 | |||
| 6135 | 6137 | 2 | 30 | 10 | 2.33 | 291 | |||
| 6319 | 6323 | 4 | 30 | 15 | 2.33 | 218 | |||
| 6346 | 6349 | 3 | 30 | 12 | 2.33 | 233 | |||
| 6480 | 6482 | 2 | 30 | 12 | 2.33 | 350 | |||
| 6654 | 6656 | 2 | 30 | 12 | 2.33 | 350 | |||
| 6678 | 6680 | 2 | 30 | 12 | 2.33 | 350 | |||
| Combined result | 200 | 1.59 (0.937) | |||||||
| Two openings | |||||||||
| 0882 | 8670 | 8677 | 7 | 24 | 18 | 2.33 | 144 | 121 | 1.29 |
| 11954 | 11969 | 15 | 24 | 27 | 2.33 | 101 | |||
| Three openings | |||||||||
| 0883 | 2072 | 2130 | 58 | 24 | 90 | 2.33 | 87 | 87 | |
| 2193 | 2254 | 61 | 24 | 95 | 2.33 | 87 | |||
Note: Numbers in brackets (0.xxx) are values obtained in the W-test applied by IHSTAT to the lognormal distribution.
Table 3.
Air motion downward in the opening, underside of manhole cover.
| Frame Number | Distance | Geometric | |||||||
|---|---|---|---|---|---|---|---|---|---|
| File | Start | Stop | Frames | Frame Rate/s | Ruler mm | Ratio | Speed mm/s | Mean mm/s | Standard Deviation |
| Single opening | |||||||||
| 7676 | 7155 | 7195 | 40 | 30 | 23 | 1 | 17 | 28.1 | 1.63 (0.958) |
| 7248 | 7271 | 23 | 30 | 18 | 1 | 23 | |||
| 7298 | 7328 | 30 | 30 | 18 | 1 | 18 | |||
| 7373 | 7385 | 12 | 30 | 14 | 1 | 35 | |||
| 7495 | 7529 | 34 | 30 | 29 | 1 | 26 | |||
| 7535 | 7566 | 31 | 30 | 13 | 1 | 13 | |||
| 7738 | 7756 | 18 | 30 | 16 | 1 | 27 | |||
| 7776 | 7791 | 15 | 30 | 30 | 1 | 60 | |||
| 7927 | 7943 | 16 | 30 | 31 | 1 | 58 | |||
| 7984 | 8000 | 16 | 30 | 22 | 1 | 41 | |||
| 8052 | 8079 | 27 | 30 | 24 | 1 | 27 | |||
| GoPro23 | 6193 | 6211 | 18 | 24 | 41 | 2.33 | 127 | 69.4 | 1.51 (0.823) |
| 6229 | 6262 | 33 | 24 | 33 | 2.33 | 56 | |||
| 7320 | 7342 | 22 | 24 | 20 | 2.33 | 51 | |||
| 7343 | 7364 | 21 | 24 | 24 | 2.33 | 64 | |||
| GoPro27 | 5454 | 5459 | 5 | 24 | 4 | 2 | 38 | 51.3 | 1.66 (0.930) |
| 5725 | 5753 | 8 | 24 | 11 | 2 | 66 | |||
| 6089 | 6097 | 8 | 24 | 6 | 4 | 72 | |||
| 6135 | 6140 | 5 | 24 | 5 | 4 | 96 | |||
| 6561 | 6580 | 19 | 24 | 4 | 4 | 20 | |||
| 6807 | 6812 | 5 | 24 | 4 | 4 | 77 | |||
| 7246 | 7253 | 7 | 24 | 4 | 4 | 55 | |||
| 7601 | 7624 | 23 | 24 | 14 | 4 | 58 | |||
| 7828 | 7871 | 43 | 24 | 13 | 4 | 29 | |||
| Combined value | 41 | 1.81 (0.970) | |||||||
| Two openings, center + circumference | |||||||||
| GoPro27 | 13,711 | 13,716 | 5 | 24 | 5 | 4 | 96 | 89.3 | 1.28 (0.880) |
| 14,555 | 14,616 | 61 | 24 | 40 | 4 | 63 | |||
| 14,026 | 14,056 | 30 | 24 | 35 | 4 | 112 | |||
| 14,198 | 14,244 | 46 | 24 | 45 | 4 | 94 | |||
| GPro127 | 17,568 | 17,598 | 30 | 30 | 25 | 4.0 | 100 | 100 | |
| Combined value | 91.4 | 1.24 (0.826) | |||||||
| Two openings, circumferential opposite each other | |||||||||
| GoPro27 | 14,291 | 14,322 | 31 | 24 | 35 | 4 | 108 | 76.9 | 1.97 (0.889) |
| 14,332 | 14,381 | 49 | 24 | 24 | 4 | 47 | |||
| 14,391 | 14,449 | 58 | 24 | 30 | 4 | 50 | |||
| 15,459 | 15,579 | 20 | 24 | 55 | 4 | 264 | |||
| 15,732 | 15,751 | 19 | 24 | 20 | 4 | 101 | |||
| 15,763 | 15,796 | 33 | 24 | 40 | 4 | 116 | |||
| 15,796 | 15,866 | 70 | 24 | 30 | 4 | 41 | |||
| 15,844 | 15,945 | 101 | 24 | 40 | 4 | 38 | |||
Note: Numbers in brackets (0.xxx) are values obtained in the W-test applied by IHSTAT to the lognormal distribution.
Table 4.
Horizontal air motion along the underside of the manhole cover and the upper airspace.
| Frame Number | Distance | Geometric | |||||||
|---|---|---|---|---|---|---|---|---|---|
| File | Start | Stop | Frames | Frame Rate/s | Ruler mm | Ratio | Speed mm/s | Mean mm/s | Standard Deviation |
| Single opening | |||||||||
| GoPro24 | 7011 | 7019 | 8 | 24 | 25 | 2.33 | 175 | 205 | 1.25 |
| 7026 | 7033 | 7 | 24 | 30 | 2.33 | 240 | |||
| GoPro27 | 5454 | 5457 | 3 | 24 | 6 | 4 | 192 | 72.4 | 1.74 (0.976) |
| 5487 | 5496 | 9 | 24 | 7 | 4 | 75 | |||
| 6097 | 6192 | 95 | 24 | 60 | 4 | 61 | |||
| 6184 | 6203 | 19 | 24 | 26 | 4 | 131 | |||
| 6145 | 6163 | 18 | 24 | 11 | 4 | 59 | |||
| 6331 | 6335 | 4 | 24 | 5 | 4 | 120 | |||
| 6417 | 6421 | 4 | 24 | 5 | 4 | 120 | |||
| 6680 | 6686 | 6 | 24 | 4 | 4 | 64 | |||
| 6686 | 6697 | 11 | 24 | 10 | 4 | 87 | |||
| 6707 | 6720 | 13 | 24 | 7 | 4 | 52 | |||
| 5457 | 5460 | 3 | 24 | 11 | 4 | 352 | |||
| 6815 | 6824 | 9 | 24 | 4 | 4 | 43 | |||
| 6824 | 6828 | 4 | 24 | 3 | 4 | 72 | |||
| 6828 | 6836 | 8 | 24 | 2.5 | 4 | 30 | |||
| 7266 | 7281 | 15 | 24 | 5 | 4 | 32 | |||
| 7281 | 7298 | 17 | 24 | 6 | 4 | 34 | |||
| 7449 | 7470 | 21 | 24 | 9 | 4 | 41 | |||
| 7466 | 7478 | 12 | 24 | 6.5 | 4 | 52 | |||
| 7486 | 7510 | 24 | 24 | 6 | 4 | 24 | |||
| 7624 | 7647 | 23 | 24 | 15 | 4 | 63 | |||
| 7647 | 7687 | 40 | 24 | 28 | 4 | 67 | |||
| 7687 | 7706 | 19 | 24 | 20 | 4 | 101 | |||
| 7869 | 7884 | 15 | 24 | 10 | 4 | 64 | |||
| 7874 | 7895 | 21 | 24 | 20 | 4 | 91 | |||
| 7899 | 7922 | 23 | 24 | 20 | 4 | 83 | |||
| 7925 | 7936 | 11 | 24 | 5 | 4 | 44 | |||
| 8485 | 8525 | 40 | 24 | 40 | 4 | 96 | |||
| 8502 | 8554 | 52 | 24 | 40 | 4 | 74 | |||
| 10,714 | 10,728 | 14 | 24 | 15 | 4 | 103 | |||
| 12,714 | 12,729 | 15 | 24 | 17 | 4 | 109 | |||
| 12,728 | 12,741 | 13 | 24 | 16 | 4 | 118 | |||
| 12,793 | 12,806 | 13 | 24 | 10 | 4 | 74 | |||
| Combined value | 77 | 1.81 (0.984) | |||||||
| center + circumference | |||||||||
| GoPro27 | 13,716 | 13,733 | 17 | 24 | 8 | 4 | 45 | 84.4 | 1.65 0.985 |
| 13,740 | 13,766 | 26 | 24 | 20 | 4 | 74 | |||
| 13,936 | 13,946 | 10 | 24 | 11 | 4 | 106 | |||
| 13,996 | 14,010 | 14 | 24 | 21 | 4 | 144 | |||
| GPro127 | 1563 | 1599 | 36 | 30 | 20 | 4.0 | 67 | 67 | |
| Combined value | 80.6 | 1.56 (0.985) | |||||||
| 2× circumferential, opposite each other | |||||||||
| GoPro24 | 12,128 | 12,176 | 48 | 24 | 50 | 4 | 100 | 130 | 1.45 |
| 12,180 | 12,197 | 17 | 24 | 30 | 4 | 169 | |||
Note: Numbers in brackets (0.xxx) are values obtained in the W-test applied by IHSTAT to the lognormal distribution.
Table 5.
Sidewall motion, 2 openings, center + circumference.
| Frame Number | Distance | Geometric | |||||||
|---|---|---|---|---|---|---|---|---|---|
| File | Start | Stop | Frames | Frame Rate/s | Ruler mm | Ratio | Speed mm/s | Mean mm/s | Standard Deviation |
| Descending | |||||||||
| GoPro24 | 9348 | 9356 | 8 | 24 | 23 | 2.33 | 161 | 79.1 | 1.81 1.001 |
| 9371 | 9404 | 33 | 24 | 55 | 2.33 | 93 | |||
| 9456 | 9485 | 29 | 24 | 35 | 2.33 | 67 | |||
| 9488 | 9531 | 43 | 24 | 30 | 2.33 | 39 | |||
| Ascending | |||||||||
| GoPro24 | 9646 | 9678 | 32 | 24 | 85 | 2.33 | 149 | 126 | 1.30 0.804 |
| 10,112 | 10,149 | 37 | 30 | 95 | 2.33 | 144 | |||
| 10,371 | 10,407 | 36 | 30 | 60 | 2.33 | 93 | |||
Note: Numbers in brackets (0.xxx) are values obtained in the W-test applied by IHSTAT to the lognormal distribution.
Table 6.
Upward air motion in an open manhole.
| Frame Number | Distance | Geometric | |||||||
|---|---|---|---|---|---|---|---|---|---|
| File | Start | Stop | Frames | Frame Rate/s | Ruler mm | Ratio | Speed mm/s | Mean mm/s | Standard Deviation |
| 0886 | 3024 | 3045 | 21 | 24 | 19 | 13.54 | 294 | 280 | 1.39 (0.989) |
| 3082 | 3107 | 25 | 24 | 14 | 13.54 | 182 | |||
| 3133 | 3163 | 30 | 24 | 40 | 13.54 | 433 | |||
| 3654 | 3686 | 32 | 24 | 32 | 13.54 | 325 | |||
| 3874 | 3911 | 37 | 24 | 26 | 13.54 | 228 | |||
| 7442 | 3484 | 3497 | 13 | 30 | 24 | 7.96 | 441 | 369 | 1.26 (0.913) |
| 3569 | 3589 | 20 | 30 | 33 | 7.96 | 394 | |||
| 3601 | 3623 | 22 | 30 | 42 | 7.96 | 456 | |||
| 4279 | 4308 | 29 | 30 | 40 | 7.96 | 329 | |||
| 5764 | 5803 | 39 | 30 | 43 | 7.96 | 263 | |||
| Combined value | 321 | 1.36 (0.934) | |||||||
Note: Numbers in brackets (0.xxx) are values obtained in the W-test applied by IHSTAT to the lognormal distribution.
Table 7.
Reynolds numbers calculated from measured values.
| Location/Description | Length of Travel mm | Reason | Mean Air Velocity mm/s | Reynolds Number | Type of Flow |
|---|---|---|---|---|---|
| Along top of manhole cover | 150 | maximum distance | 291 | 3111 | borderline turbulent |
| Top of opening in manhole cover | 28 | measured value | 180 | 359 | laminar |
| Underside of opening in manhole cover | 30 | design value | 41 | 88 | laminar |
| Underside of manhole cover | 430 | maximum length | 77 | 2360 | borderline laminar |
| Sidewall upward motion | 95 | maximum distance | 126 | 853 | laminar |
| Sidewall downward motion | 70 | maximum distance | 79 | 394 | laminar |
Publisher’s Note: MDPI stays neutral with regard to jurisdictional claims in published maps and institutional affiliations. |
© 2020 by the authors. Licensee MDPI, Basel, Switzerland. This article is an open access article distributed under the terms and conditions of the Creative Commons Attribution (CC BY) license (http://creativecommons.org/licenses/by/4.0/).
Share and Cite
MDPI and ACS Style
McManus, T.N.; Rosa, A.; Haddad, A. Quantifying Air Movement Induced by Natural Forces in an Isolated Structure in the Subsurface Infrastructure. Infrastructures 2021, 6, 3. https://0-doi-org.brum.beds.ac.uk/10.3390/infrastructures6010003
AMA Style
McManus TN, Rosa A, Haddad A. Quantifying Air Movement Induced by Natural Forces in an Isolated Structure in the Subsurface Infrastructure. Infrastructures. 2021; 6(1):3. https://0-doi-org.brum.beds.ac.uk/10.3390/infrastructures6010003
Chicago/Turabian StyleMcManus, Thomas Neil, Ana Rosa, and Assed Haddad. 2021. "Quantifying Air Movement Induced by Natural Forces in an Isolated Structure in the Subsurface Infrastructure" Infrastructures 6, no. 1: 3. https://0-doi-org.brum.beds.ac.uk/10.3390/infrastructures6010003