Effect of Lintel Beam on Seismic Response of Reinforced Concrete Buildings with Semi-Interlocked and Unreinforced Brick Masonry Infills

 ,
,  ,
,
Abstract
:1. Introduction
2. Methodology
2.1. Adaptive Pushover Analysis
2.2. Materials Strain Limit Approach
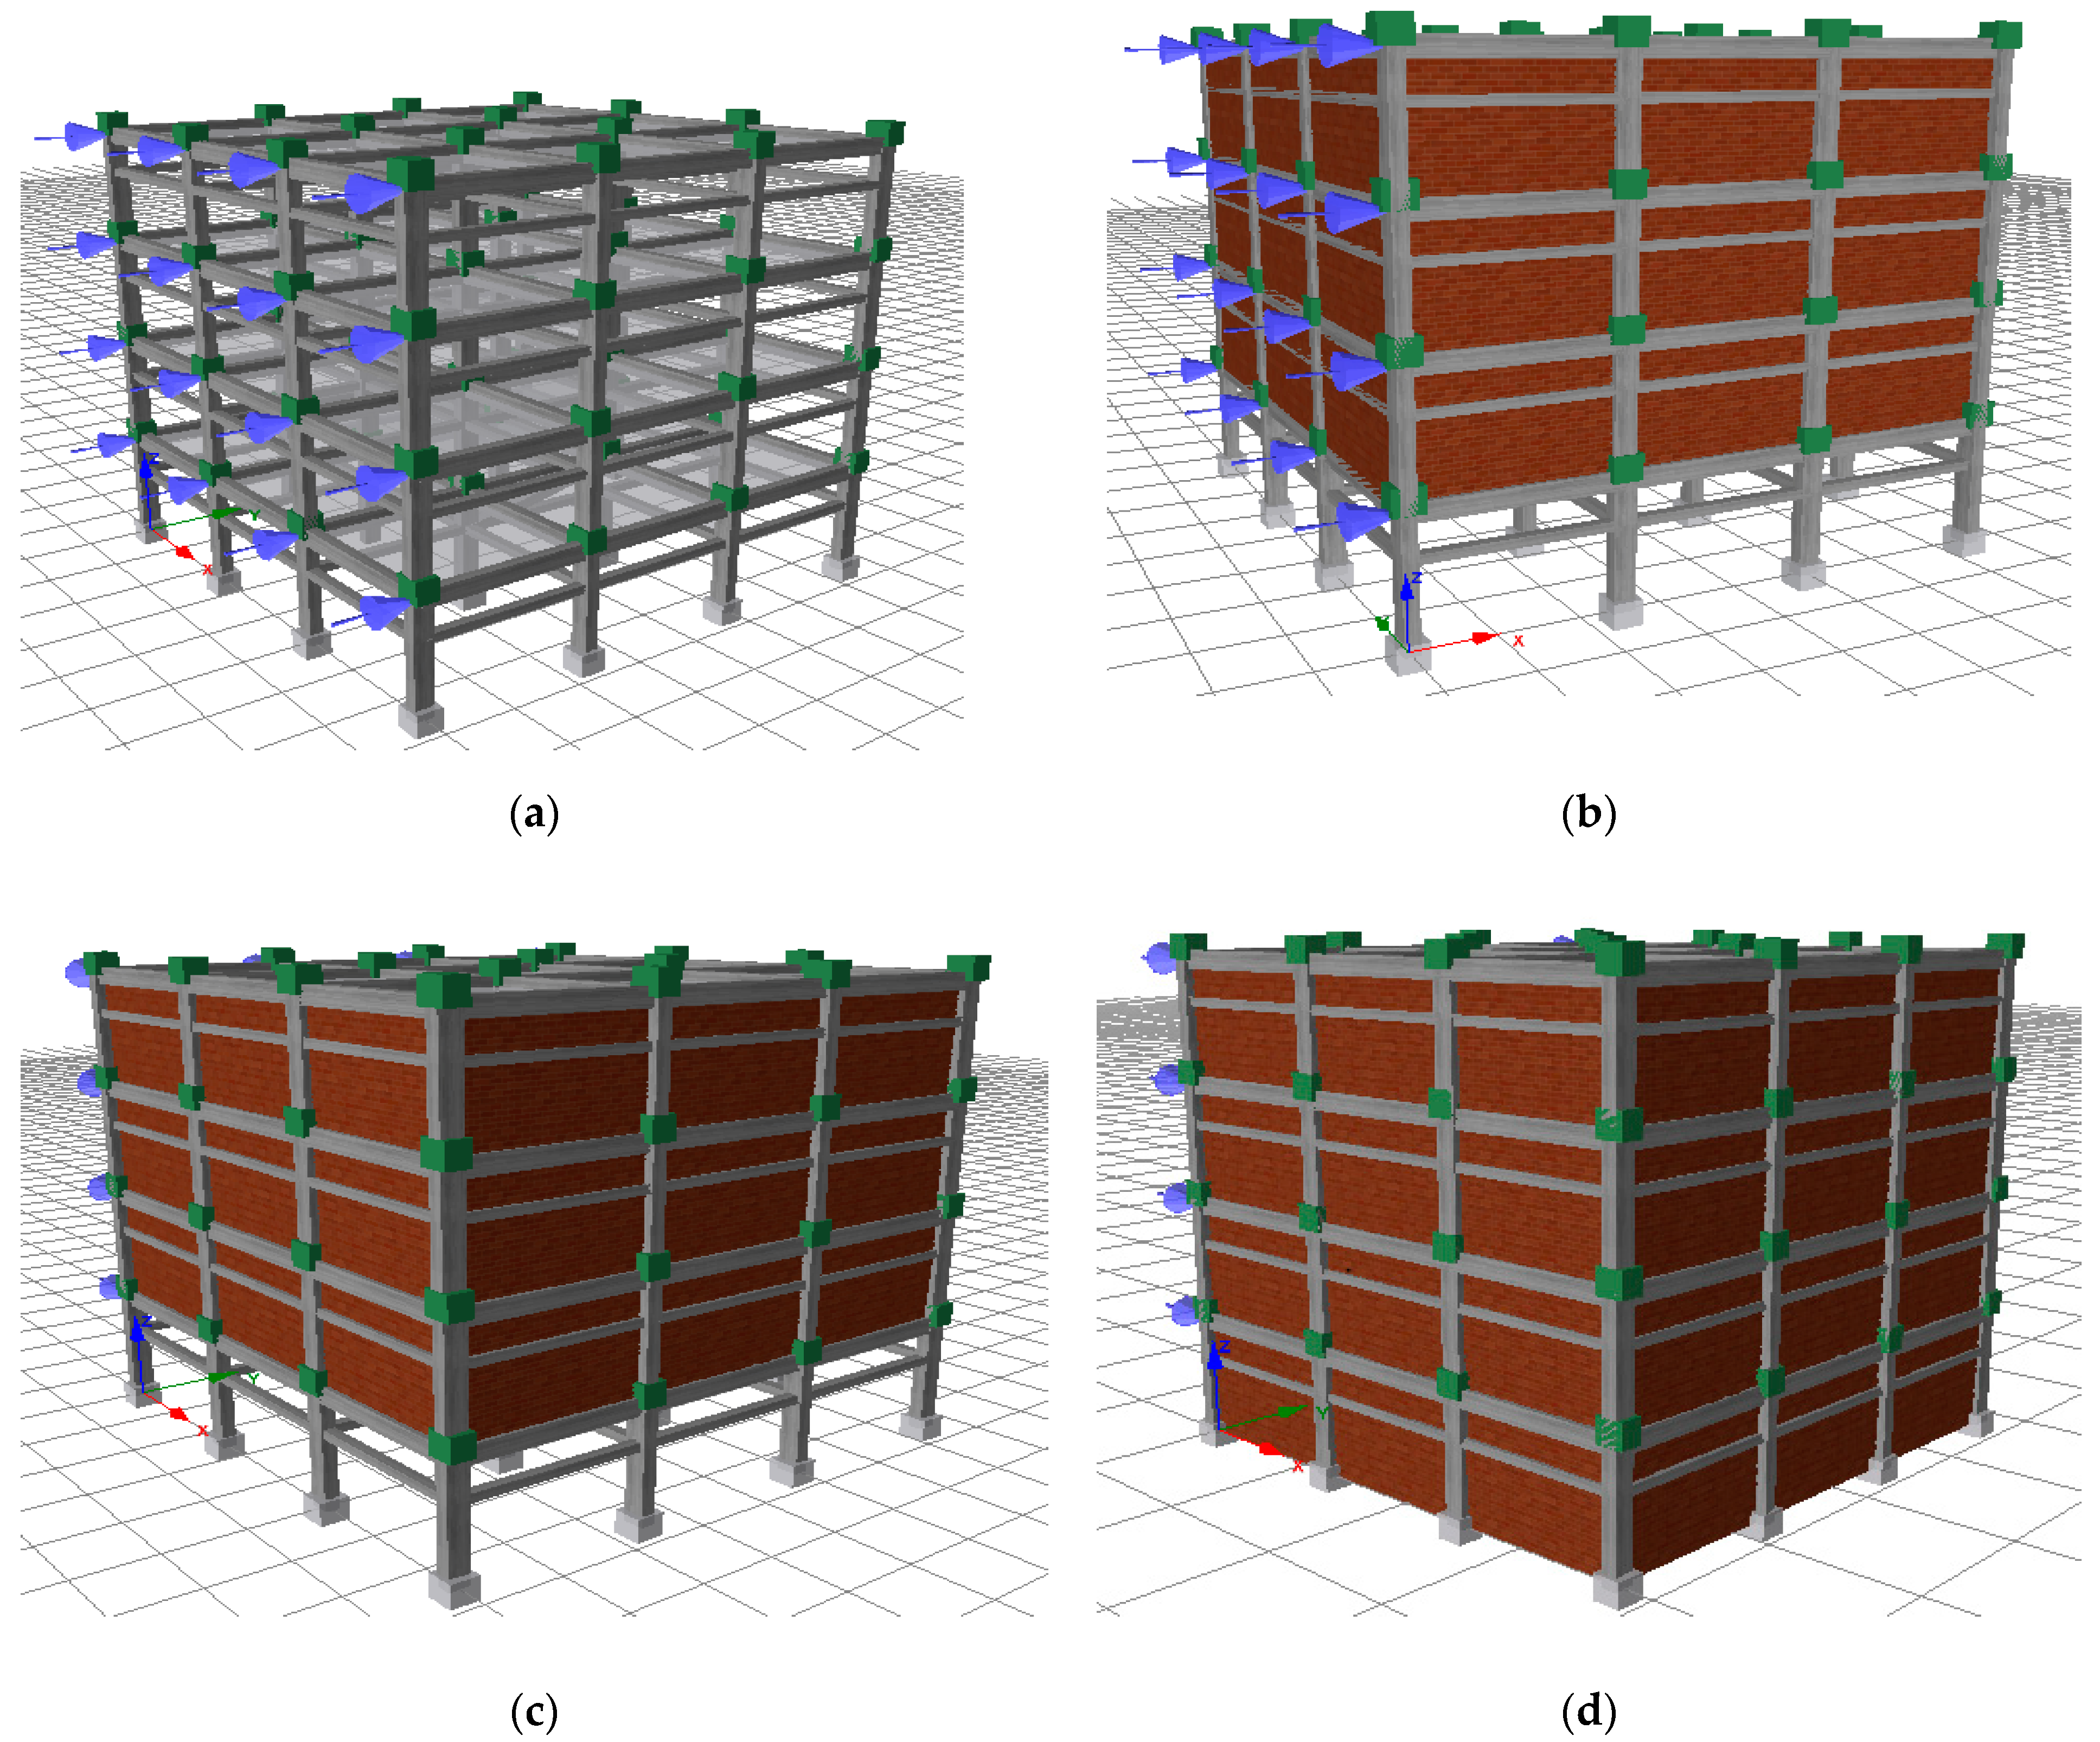
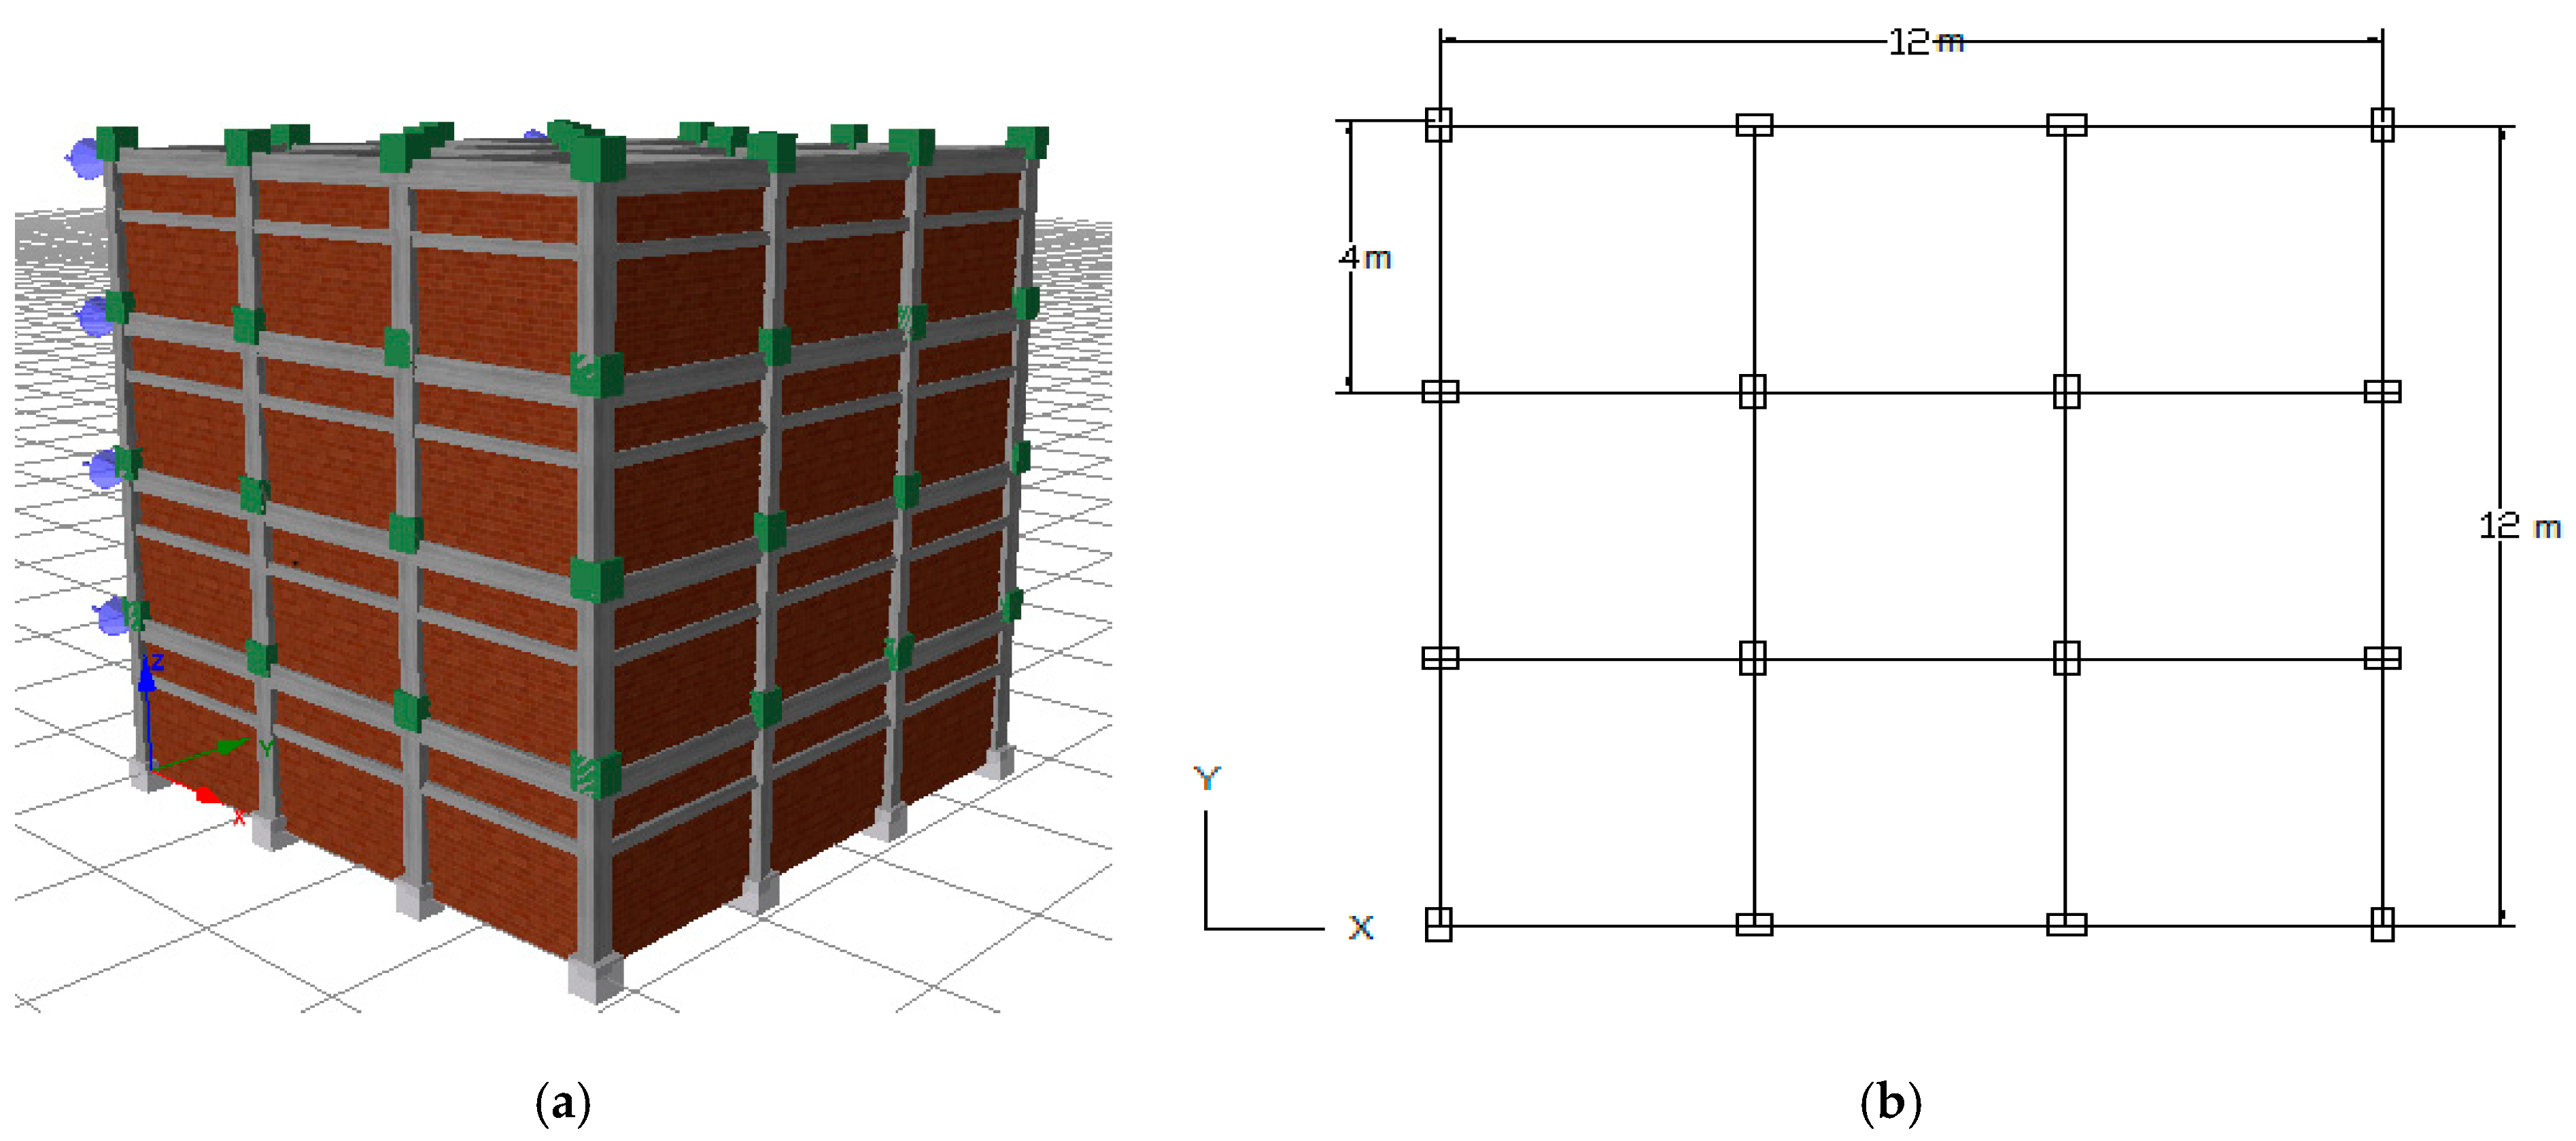
3. Model Description
3.1. Calculation of the Geometrical Parameters of the Infill Wall
3.2. Material Parameters
3.2.1. Concrete Model
3.2.2. Steel Model
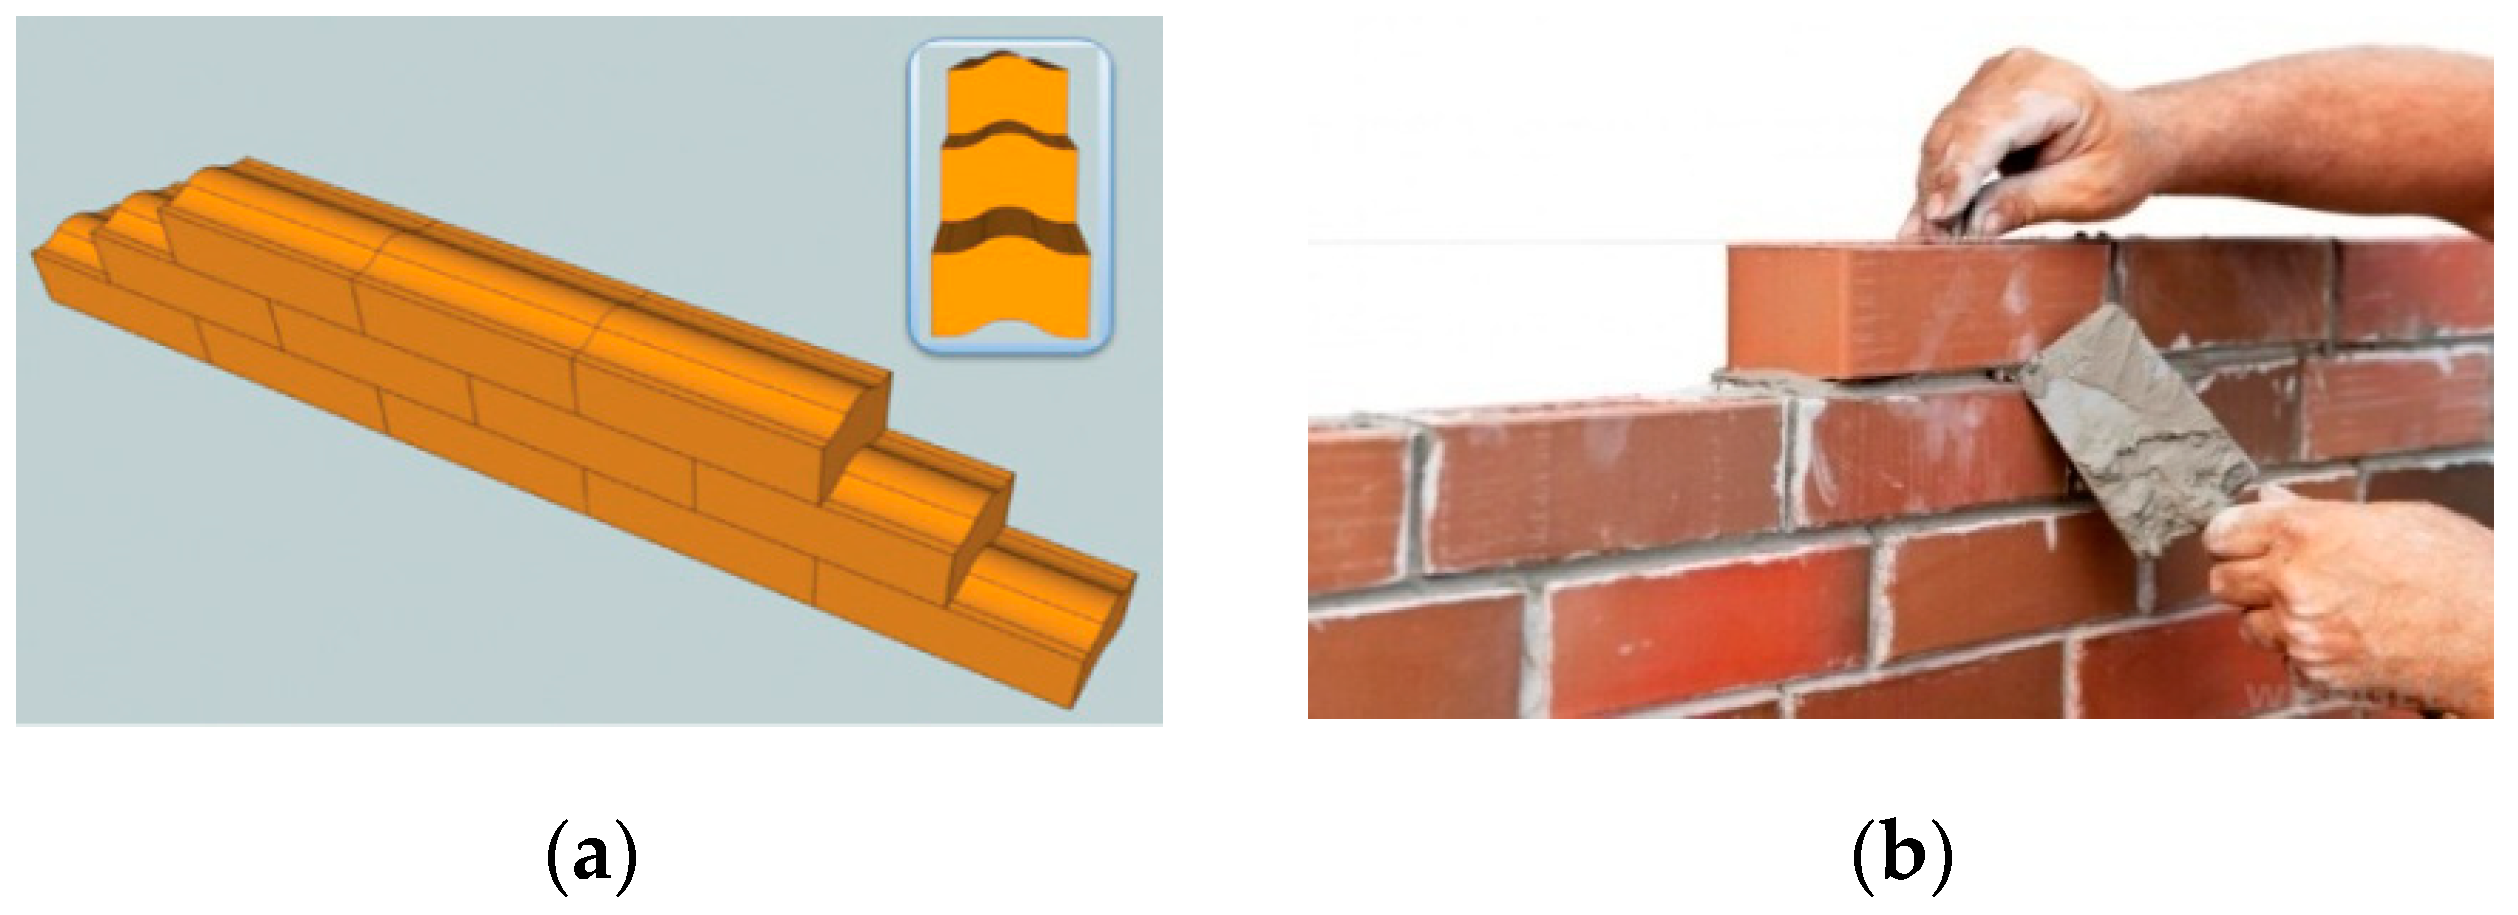
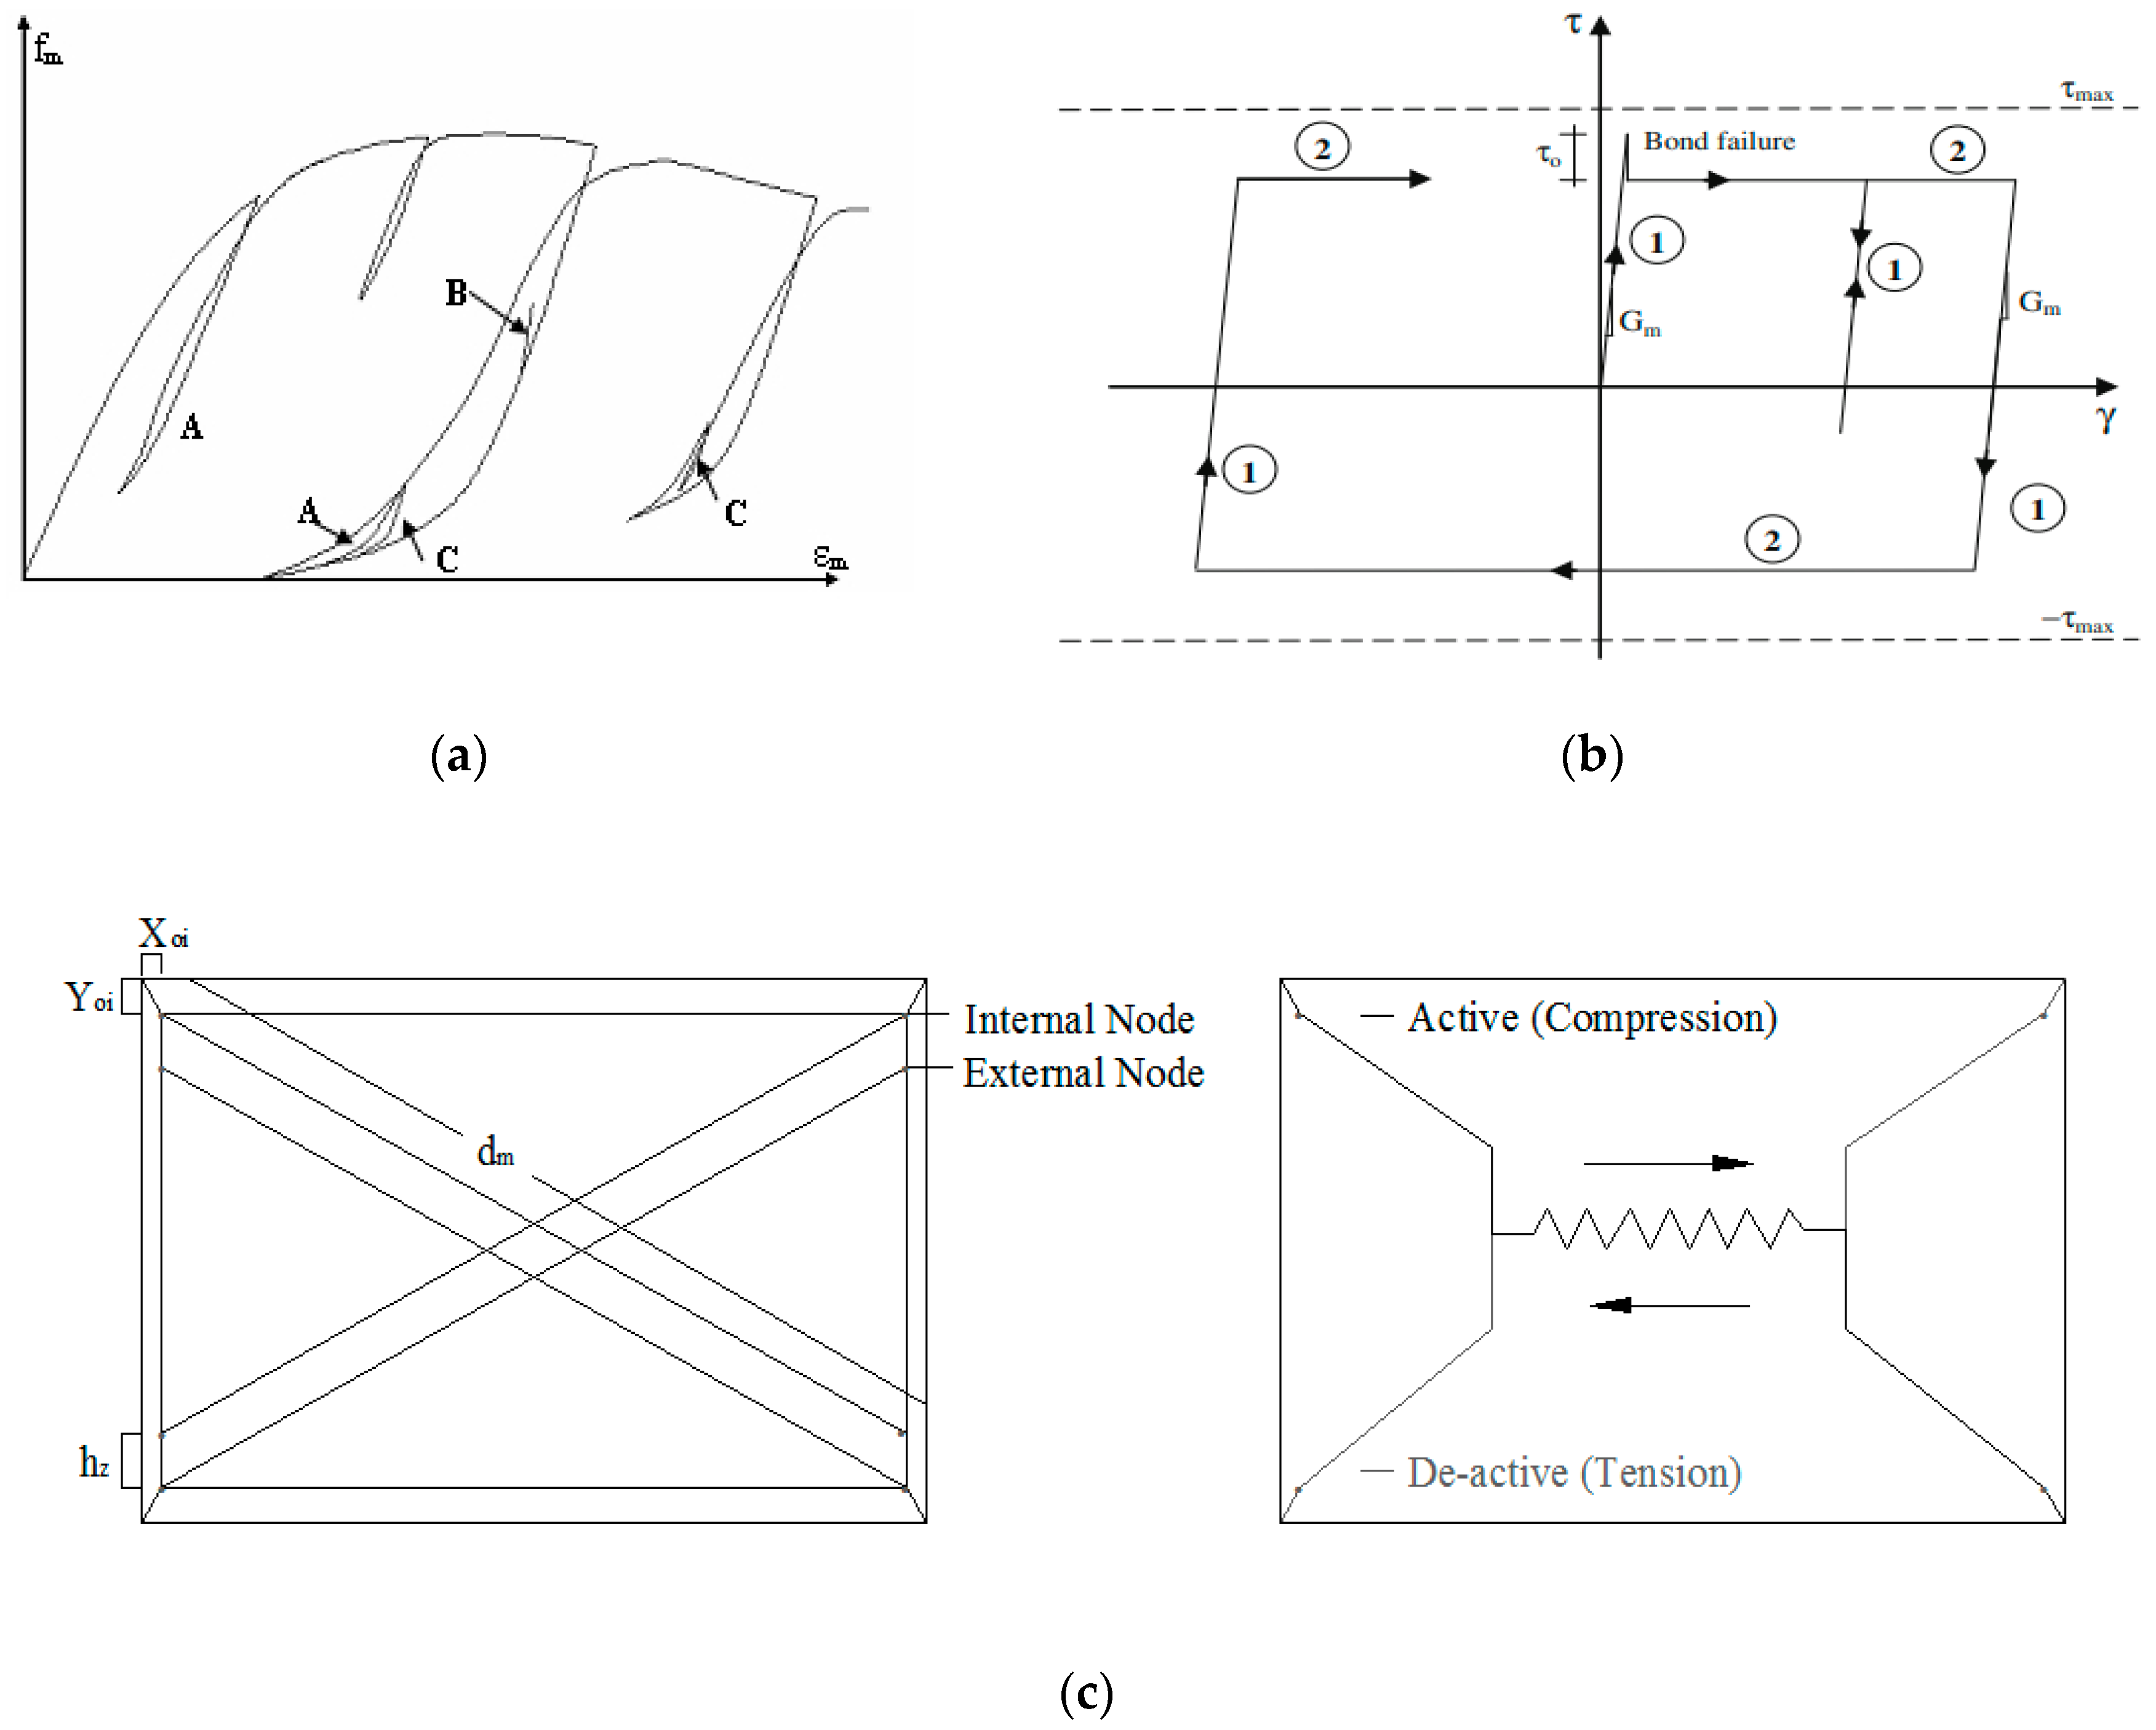
3.2.3. Infill Panel Element
4. Results and Discussion
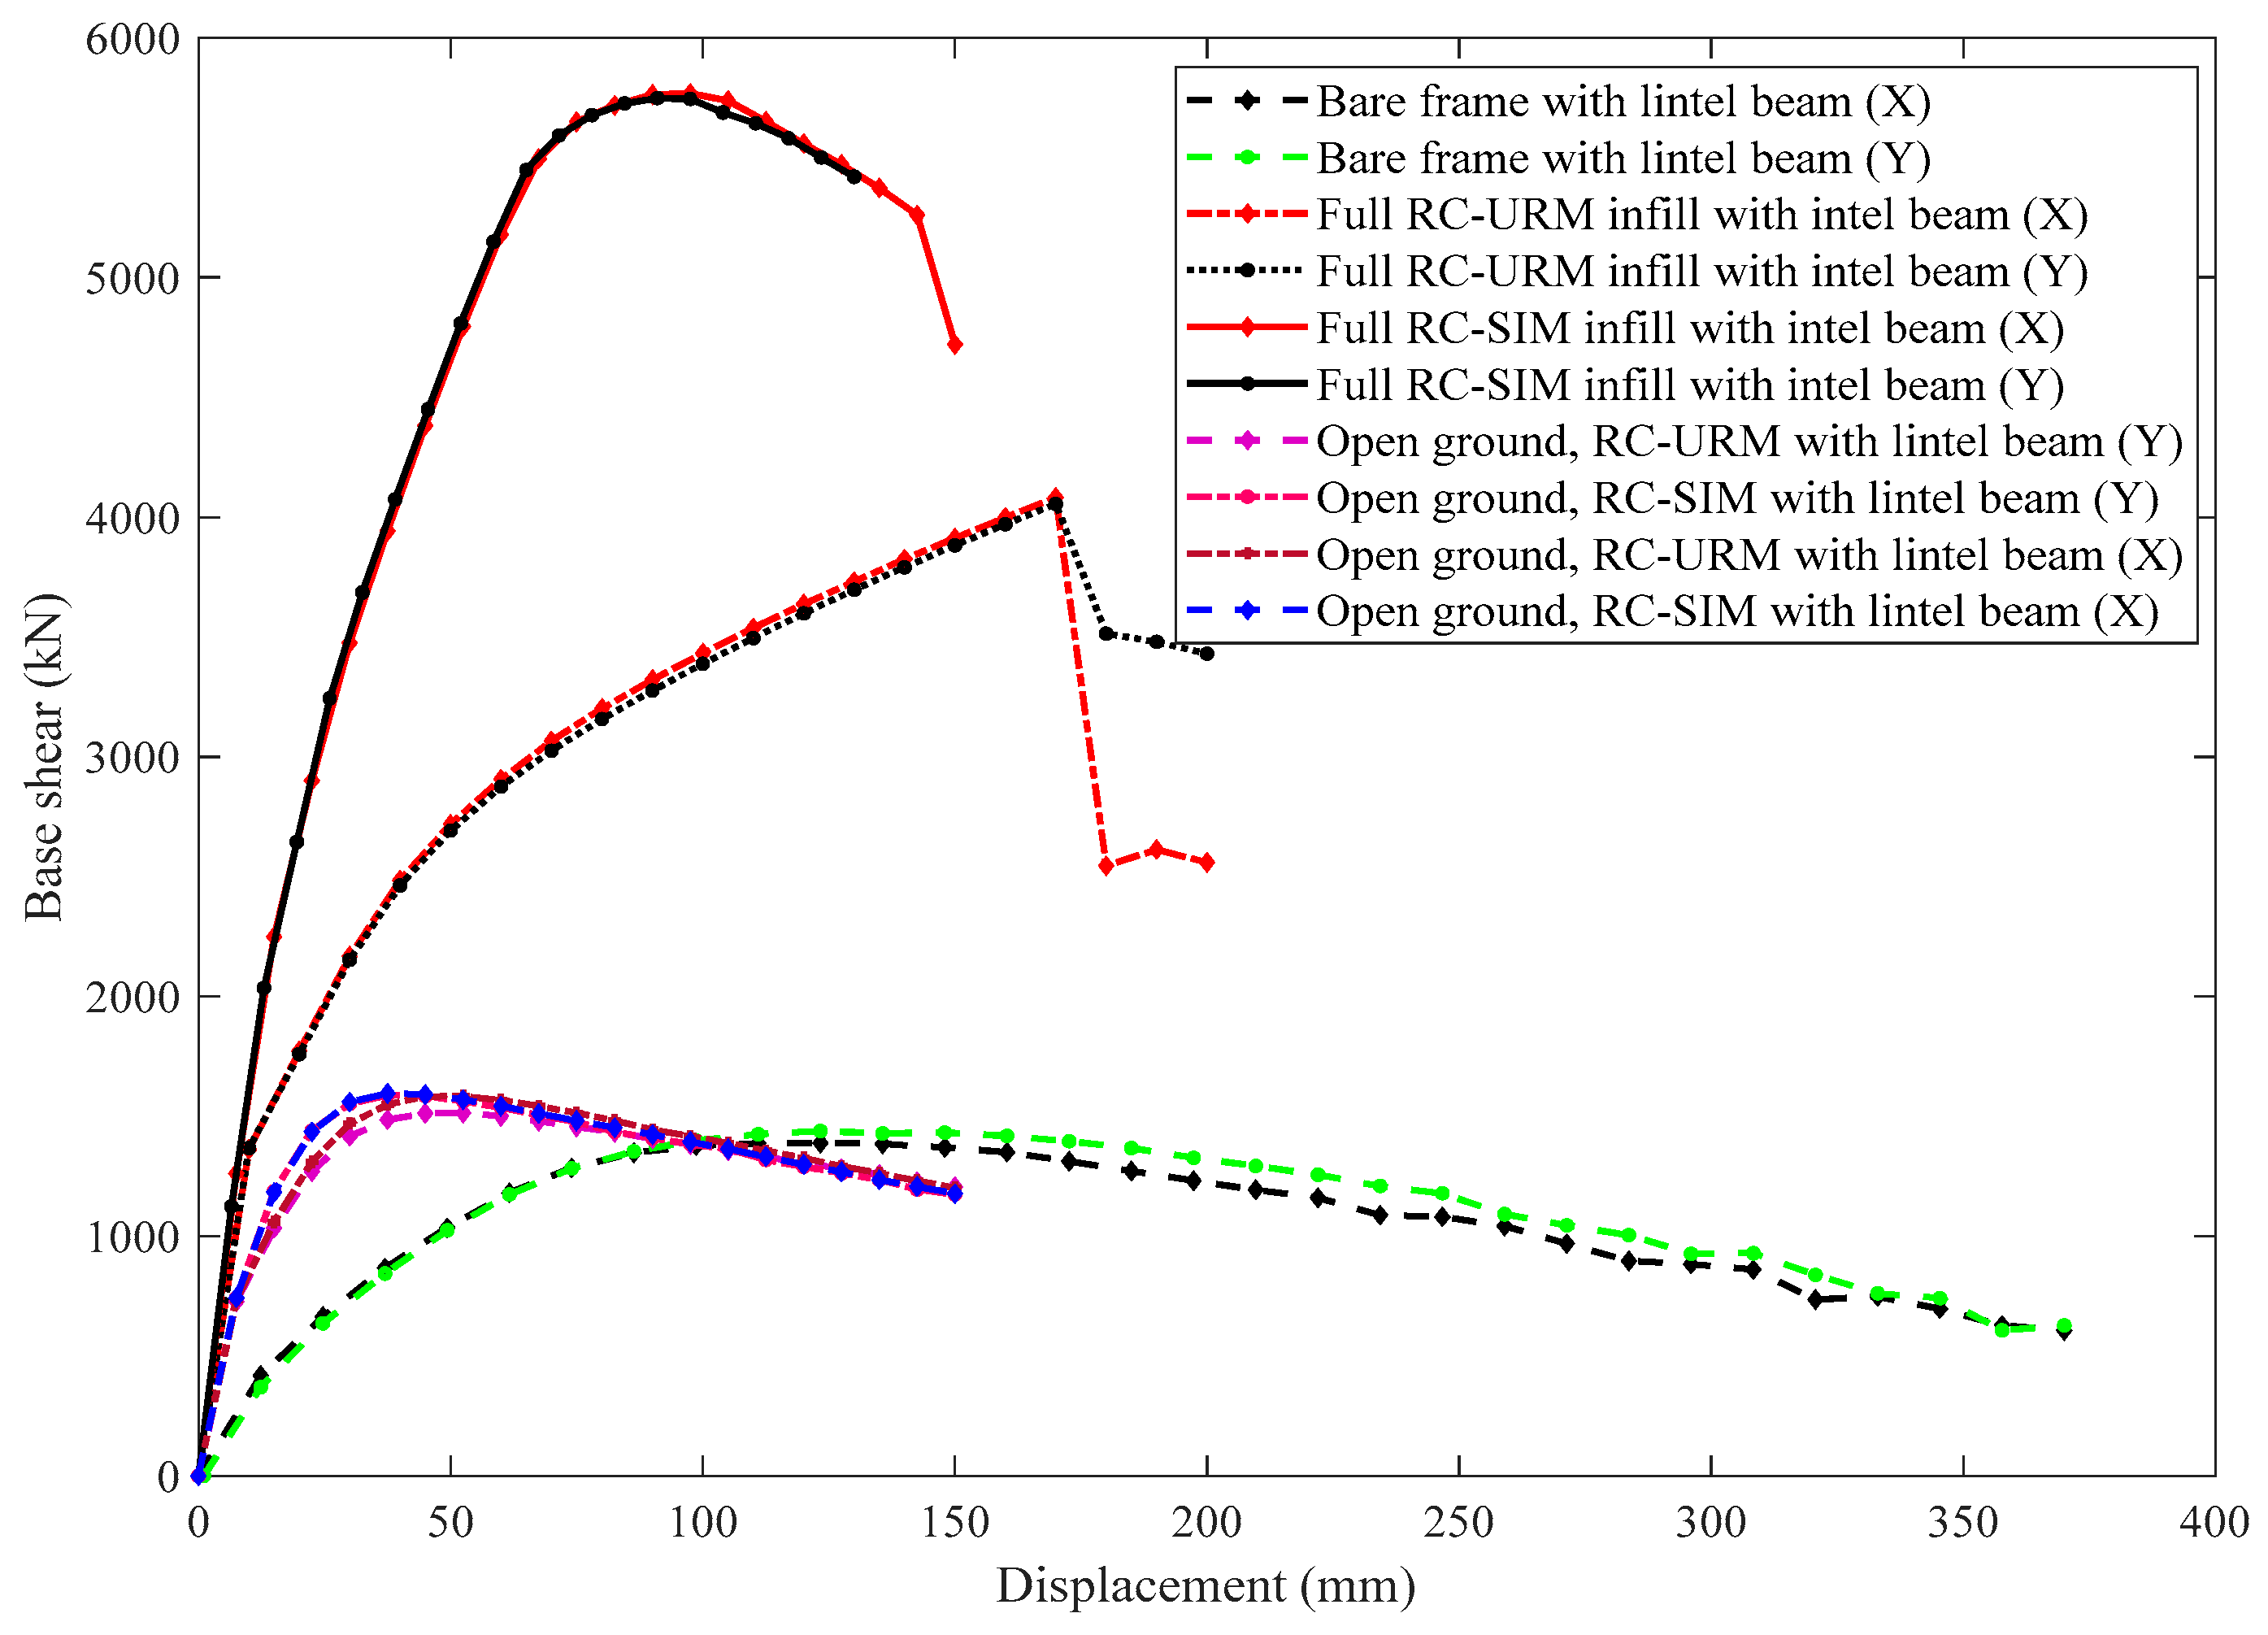
4.1. Pushover Curves
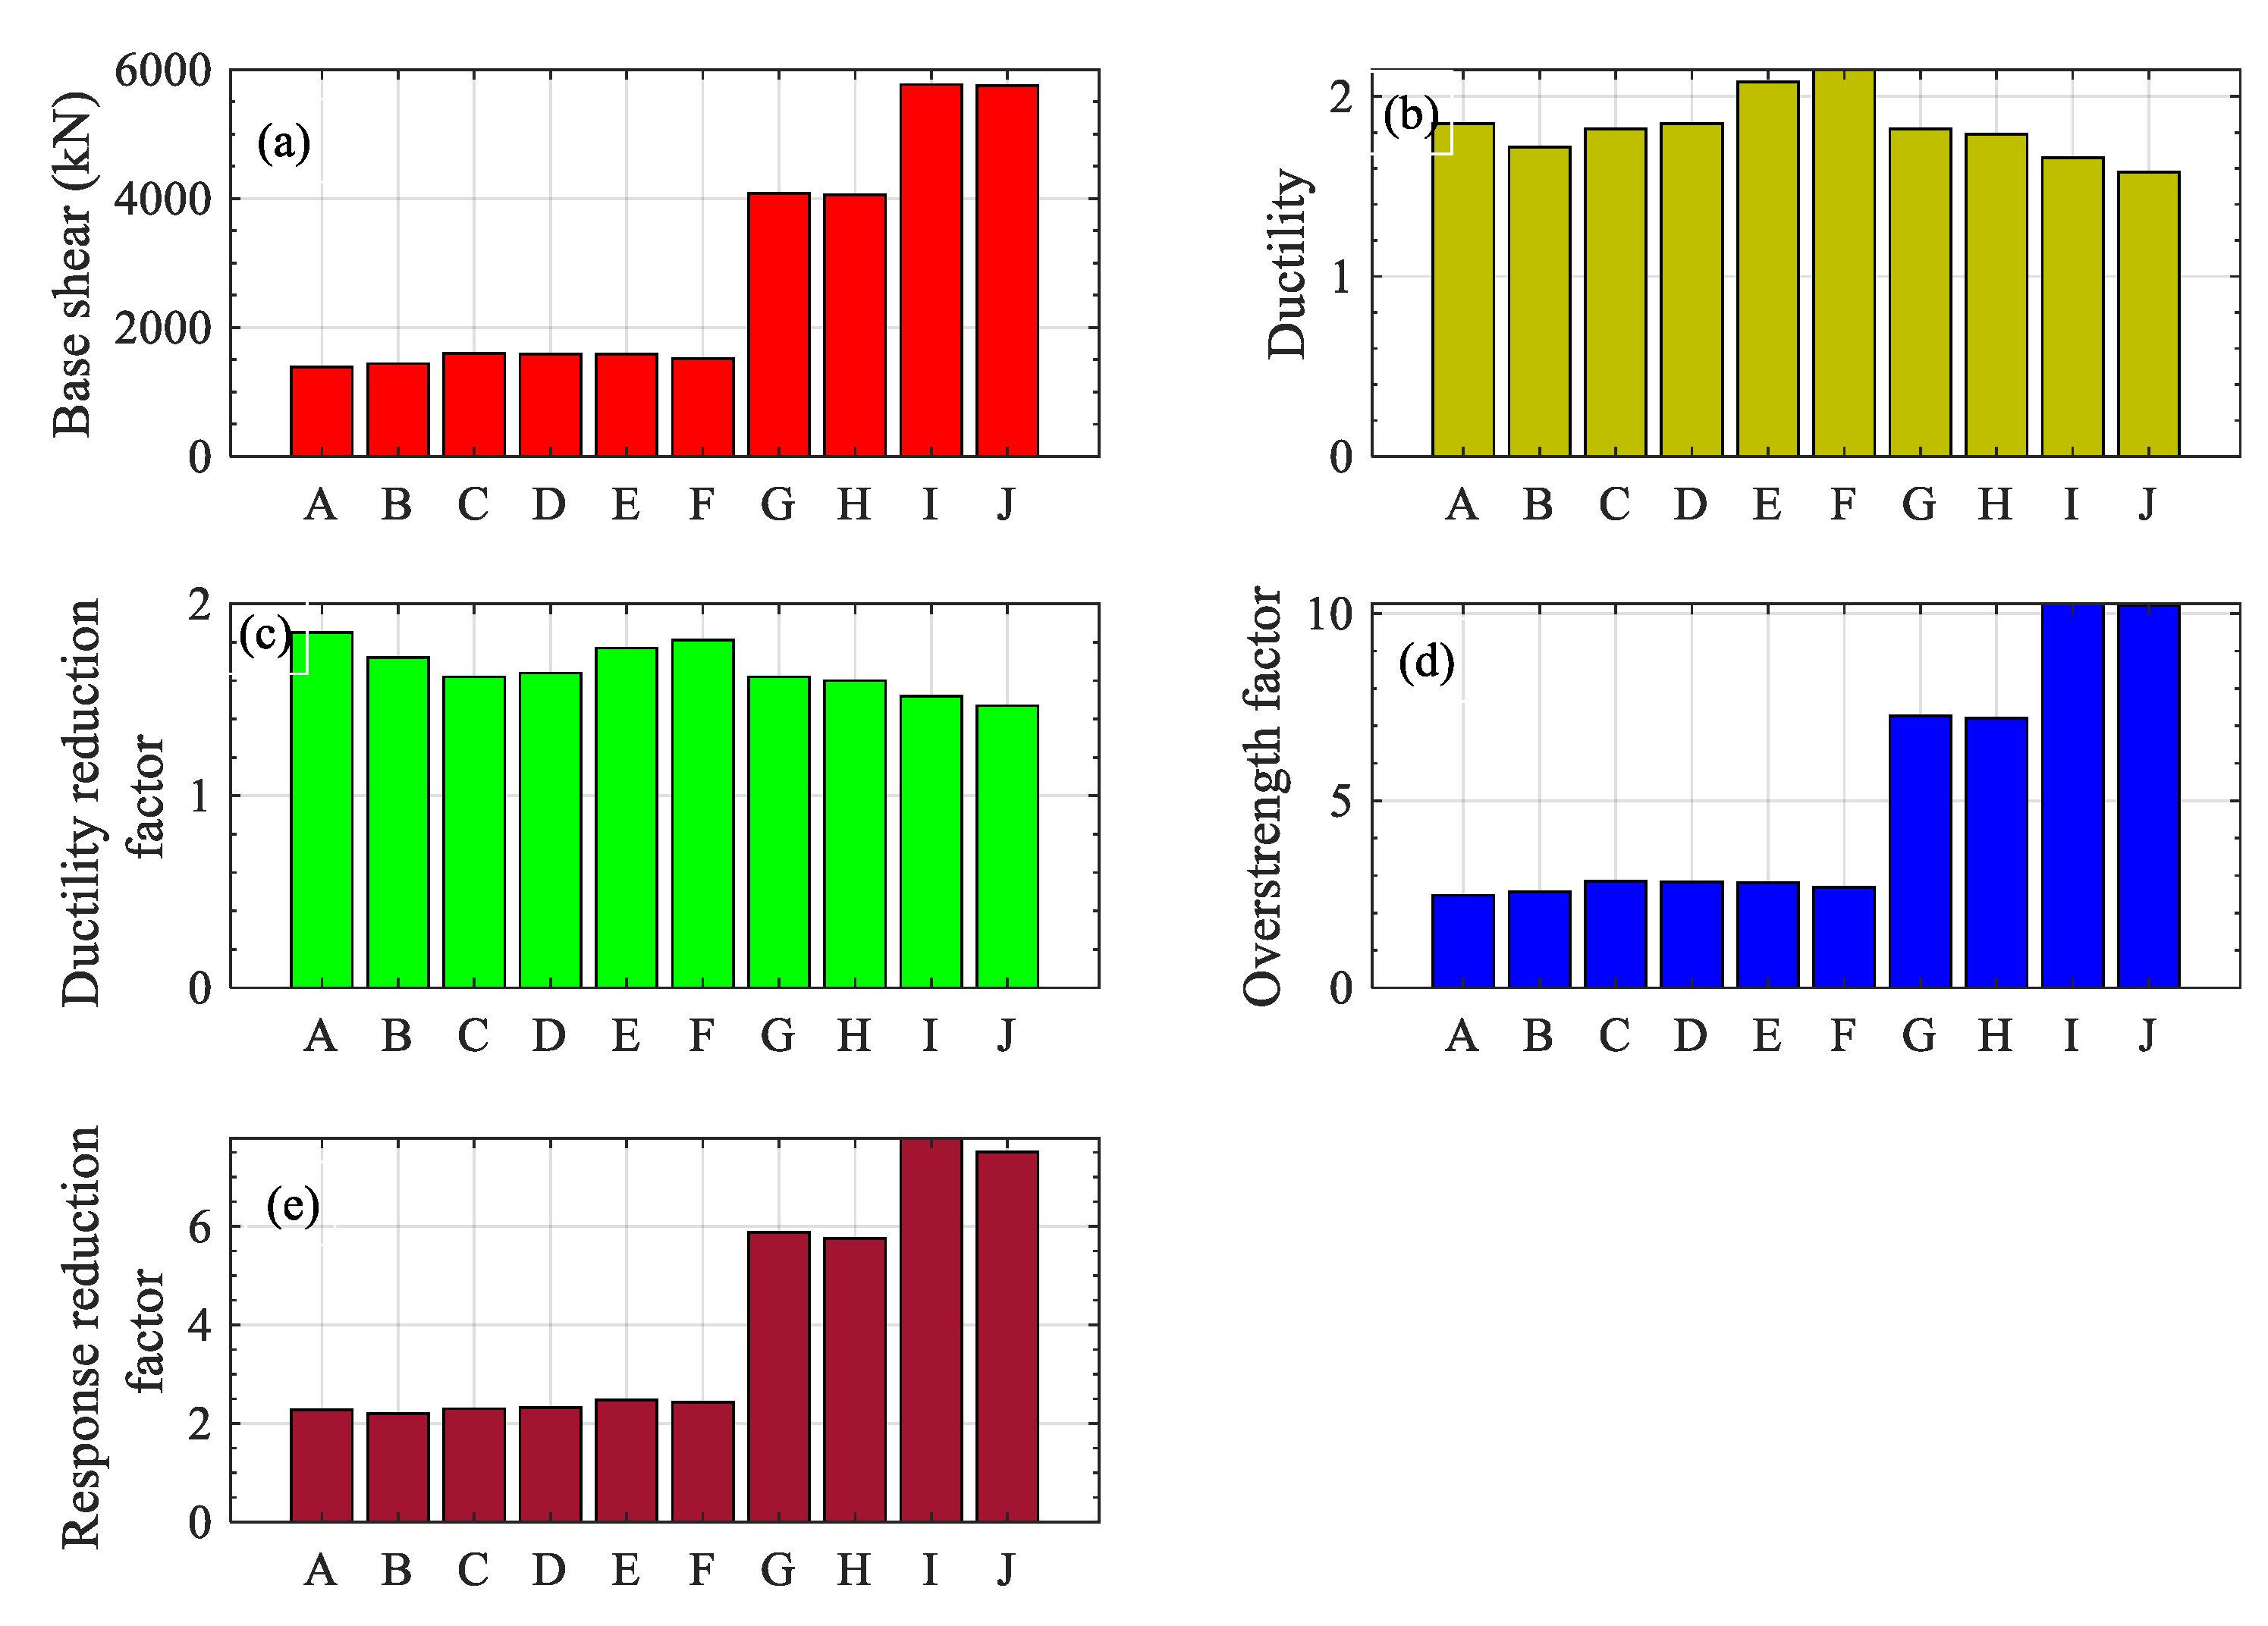
4.2. Base Shear
4.3. Ductility
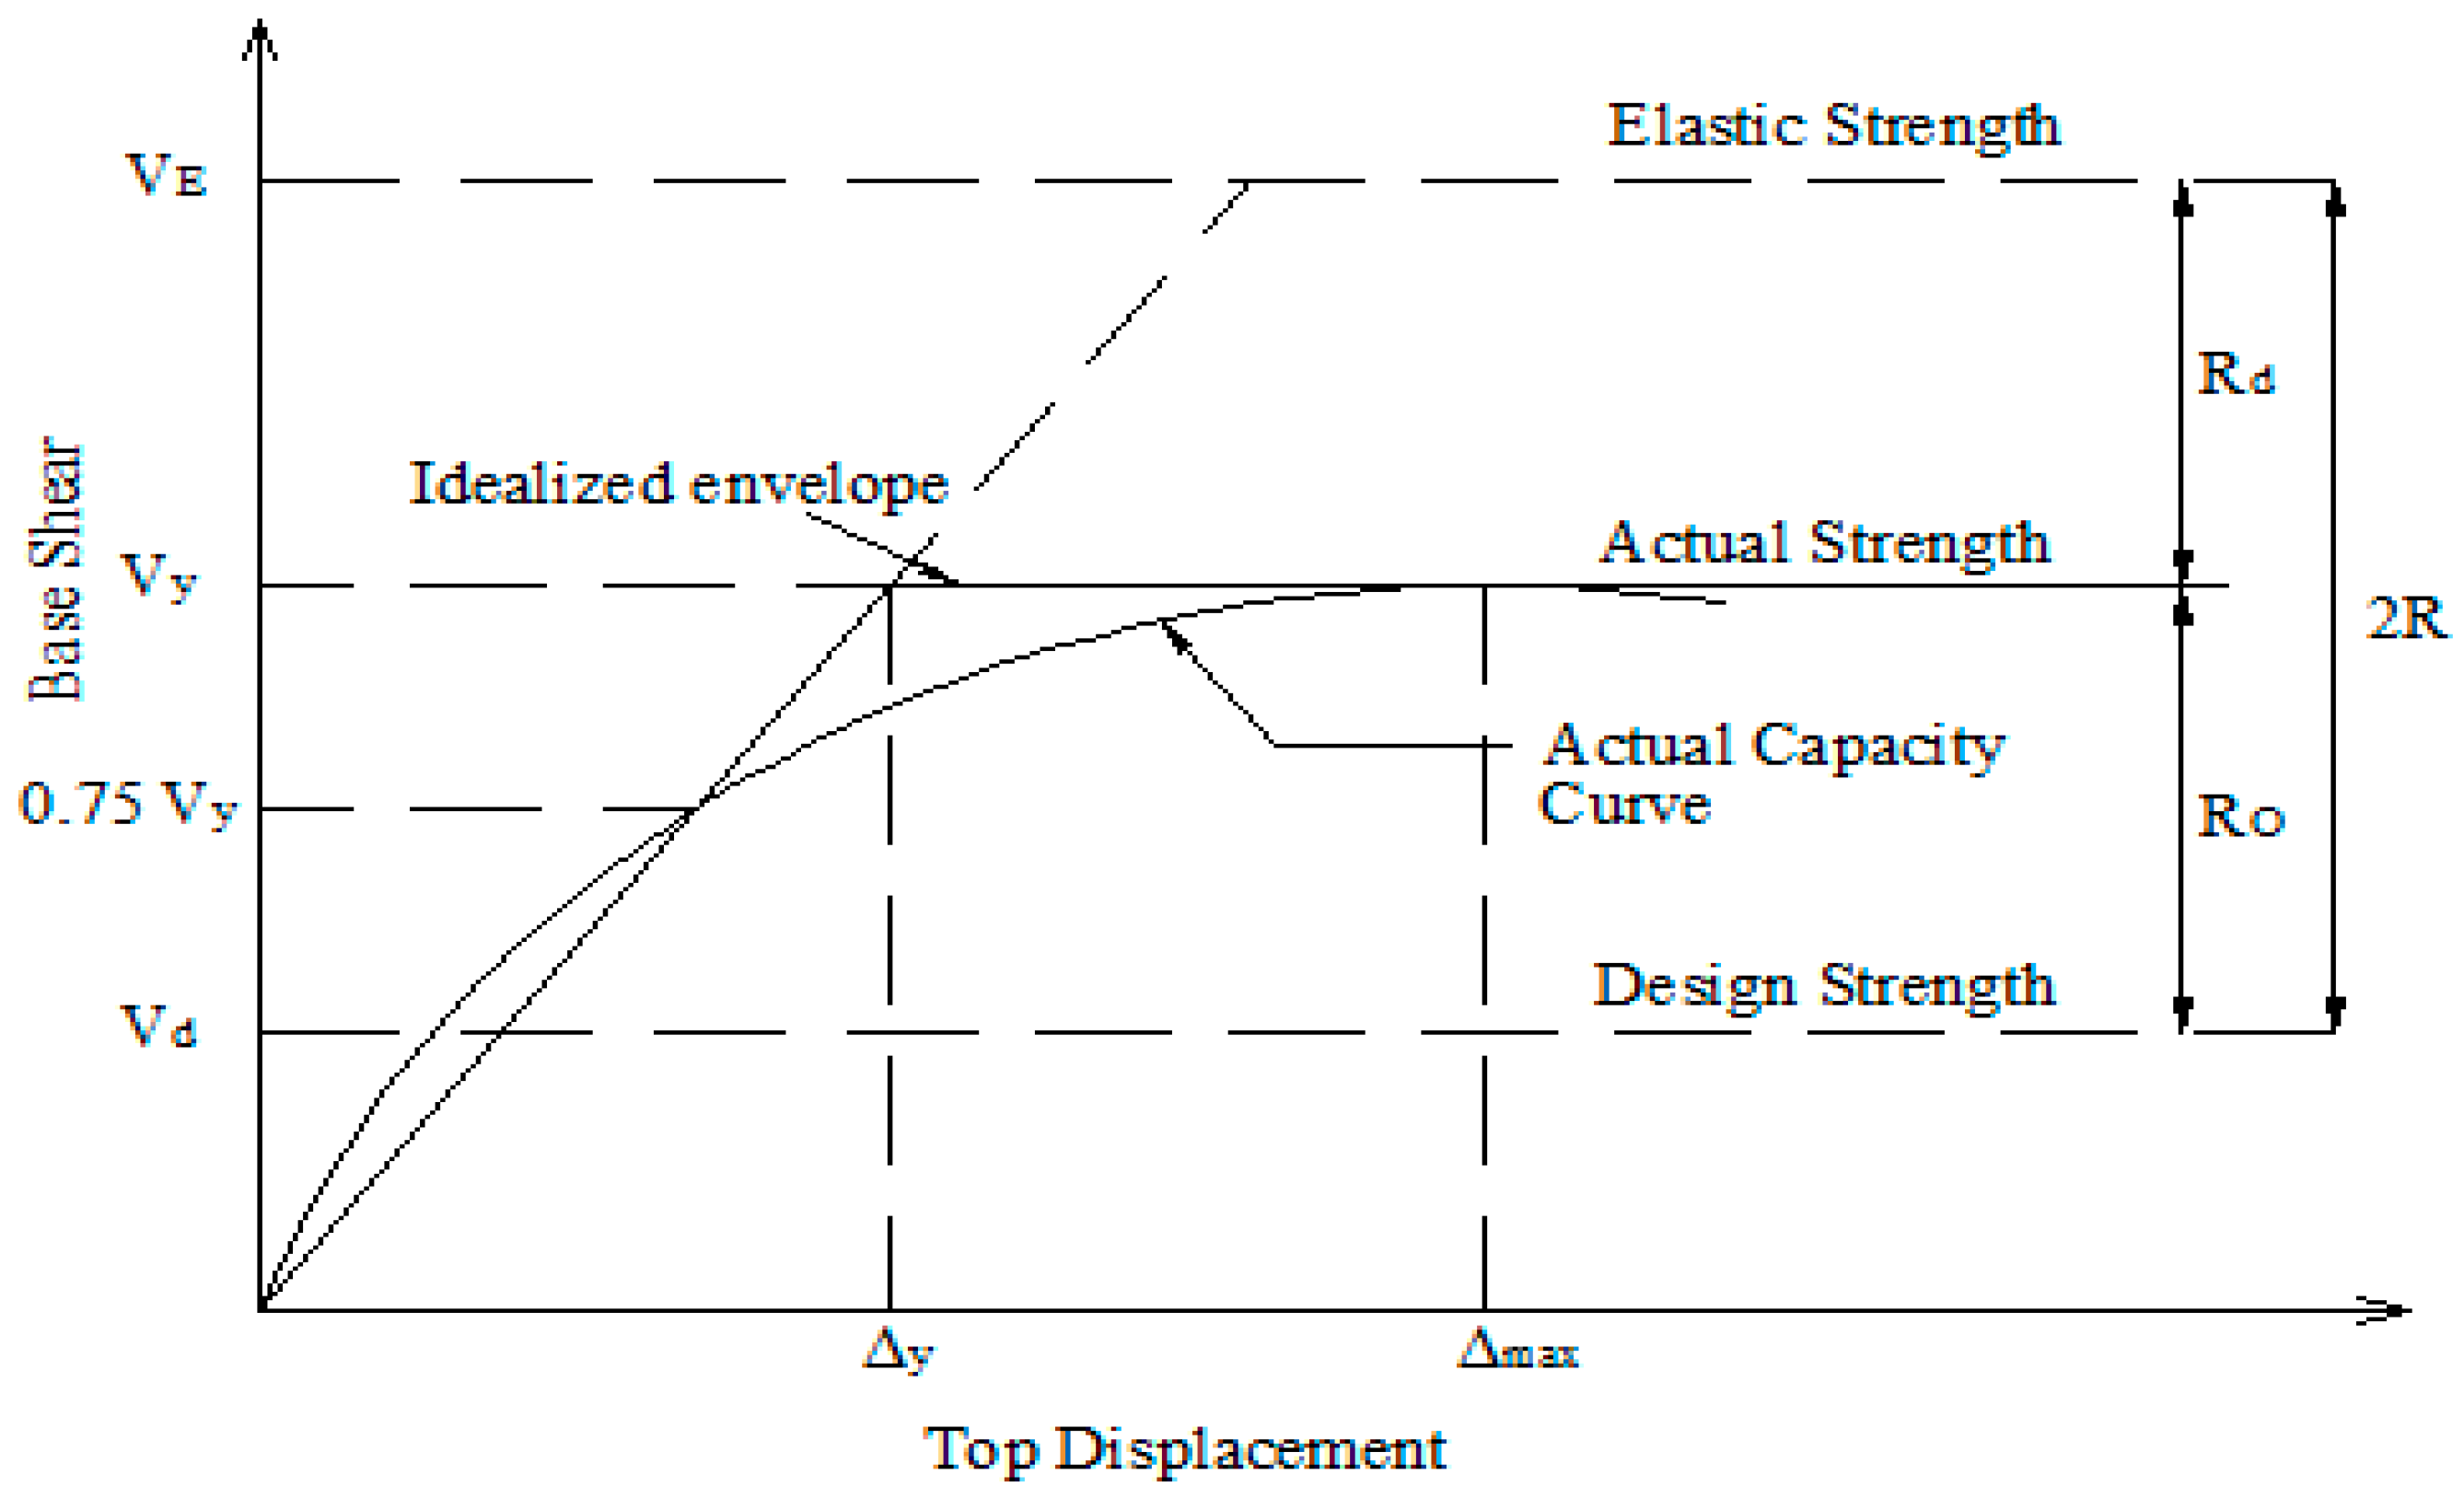
4.4. Ductility Reduction Factor
4.5. Overstrength Factor
4.6. Response Reduction Factor
4.7. Damage Patterns
5. Conclusions
Author Contributions
Funding
Institutional Review Board Statement
Informed Consent Statement
Data Availability Statement
Conflicts of Interest
References
- Gautam, D.; Rodrigues, H.; Bhetwal, K.K.; Neupane, P.; Sanada, Y. Common structural and construction deficiencies of Nepalese buildings. Innov. Infrastruct. Solut. 2016, 1, 1–18. [Google Scholar] [CrossRef] [Green Version]
- Gautam, D.; Chaulagain, H. Structural performance and associated lessons to be learned from world earthquakes in Nepal after 25 April 2015 (MW 7.8) Gorkha earthquake. Eng. Fail. Anal. 2016, 68, 222–243. [Google Scholar] [CrossRef]
- Wang, Z.; Totoev, Y.; Page, A.; Sher, W.; Lin, K. Numerical simulation of earthquake response of multi-storey steel frame with SIM infill panels. In Proceedings of the 2015 World Congress on Advances in Structural Engineering and Mechanics (ASEM15), Incheon, Korea, 25–29 August 2015; pp. 1–20. Available online: http://www.i-asem.org/publication_conf/asem15/6.ICEAS15/3f/F2G.4.ES359_1894F1.pdf (accessed on 10 October 2020).
- Wang, Z.; Totoev, Y.; Lin, K. Non-linear static analysis of multi-storey steel frame with semi-interlocking masonry infill panels. In Brick and Block Masonry: Trends, Innovations and Challenges, Proceedings of the 16th International Brick and Block Masonry Conference (IBMAC 2016), Padova, Italy, 26–30 June 2016; CRC Press, Taylor and Francis Group: London, UK, 2016; pp. 1375–1382. [Google Scholar] [CrossRef]
- Alguhane, T.M.; Khalil, A.H.; Fayed, M.N.; Ismail, A.M. Seismic assessment of old existing RC buildings with masonry infill in madinah as per ASCE. Int. J. Comput. Syst. Eng. 2015, 9, 52–63. [Google Scholar] [CrossRef]
- Shendkar, M.; Pradeep Kumar, R. Response reduction factor of RC framed structures with semi-interlocked masonry and unreinforced masonry infill. Indian Concr. Inst. J. 2018, January–March, 24–28. [Google Scholar]
- Chaulagain, H.; Rodrigues, H.; Spacone, E.; Guragain, R.; Mallik, R.; Varum, H. Response reduction factor of irregular RC buildings in Kathmandu valley. Earthq. Eng. Eng. Vib. 2014, 13, 455–470. [Google Scholar] [CrossRef]
- Maheri, M.R.; Akbari, R. Seismic behaviour factor, R, for steel X-braced and knee-braced RC buildings. Eng. Struct. 2003, 25, 1505–1513. [Google Scholar] [CrossRef]
- Goud, S.S.; Pradeep Kumar, R. Rationalizing response reduction factor R for better performance of reinforced concrete framed buildings. In Proceedings of the National Conference on Recent Research Advances in Civil Engineering (RRACE-2014), Tamilnadu, India, 7–8 November 2014; pp. 1–6. [Google Scholar]
- Smyrou, E.; Blandon, C.; Antoniou, S.; Pinho, R.; Crisafulli, F. Implementation and verification of a masonry panel model for nonlinear dynamic analysis of in-filled RC frames. Bull. Earthq. Eng. 2011, 9, 1519–1534. [Google Scholar] [CrossRef]
- Miranda, E.; Bertero, V. Evaluation of strength reduction factors for earthquake-resistant design. Earthq. Spectra 1994, 10, 357–379. [Google Scholar] [CrossRef]
- Elnashai, A.S.; Mwafy, A.M. Overstrength and force reduction factors of multistorey reinforced-concrete buildings. Struct. Des. Tall Build. 2002, 11, 329–351. [Google Scholar] [CrossRef]
- Motiani, R.; Kunal, J.R.; Gahrana, S.; Nambiar, A.; Desai, M. Evaluation of response reduction factor by pushover analysis. Int. J. Struct. Eng. 2018, 9, 116–129. [Google Scholar] [CrossRef]
- Nishanth, M.; Visuvasam, J.; Simon, J.; Packiaraj, J.S. Assessment of seismic response reduction factor for moment-resisting RC frames. IOP Conf. Ser. Mater. Sci. Eng. 2017, 263, 032034. [Google Scholar] [CrossRef]
- Zahid, M.; Robert, D.; Shahrin, F. An evaluation of overstrength factor of seismic designed low rise RC buildings. Procedia Eng. 2013, 53, 48–51. [Google Scholar] [CrossRef] [Green Version]
- Shendkar, M.; Mandal, S.; Pradeep Kumar, R.; Maiti, P.R. Response reduction factor of RC-infilled frames by using different methods. Indian Concr. Inst. J. 2020, April–June, 14–23. [Google Scholar]
- Mandal, S.; Shendkar, M.R. Evaluation of response reduction factor of RC-infilled frames. In Proceedings of the 17th World Conference on Earthquake Engineering (17WCEE), Sendai, Japan, 13–18 September 2020; pp. 1–12. [Google Scholar]
- Shendkar, M.R.; Mandal, S.; Pradeep Kumar, R. Effect of lintel beam on response reduction factor of RC-infilled frames. Curr. Sci. 2020, 118, 1077–1086. [Google Scholar] [CrossRef]
- Grubišić, M.; Ivošević, J.; Grubišić, A. Reliability analysis of reinforced concrete frame by finite element method with implicit limit state functions. Buildings 2019, 9, 119. [Google Scholar] [CrossRef] [Green Version]
- Rezaei Rad, A.; Banazadeh, M. Probabilistic risk-based performance evaluation of seismically base-isolated steel structures subjected to far-field earthquakes. Buildings 2018, 8, 128. [Google Scholar] [CrossRef] [Green Version]
- Kalkan, E.; Kunnath, S.K. Adaptive modal combination procedure for nonlinear static analysis of building structures. J. Struct. Eng. ASCE 2006, 132, 1721–1731. [Google Scholar] [CrossRef] [Green Version]
- Gupta, B.; Kunnath, S.K. Adaptive spectra-based pushover procedure for seismic evaluation of structures. Earthq. Spectra 2000, 16, 367–391. [Google Scholar] [CrossRef]
- Antoniou, S.; Pinho, R. Advantages and limitations of adaptive and nonadaptive force-based pushover procedures. J. Earthq. Eng. 2004, 8, 497–522. [Google Scholar] [CrossRef]
- Pacific Earthquake Engineering Research Center (PEER). PEER Strong Ground Motion Databases, Pacific Earthquake Engineering Research Center, University of California, Berkeley, CA, USA. 2020. Available online: https://peer.berkeley.edu/peer-strong-ground-motion-databases (accessed on 10 October 2020).
- Chaulagain, H.C. Assessment of Response Reduction Factor of RC Buildings in Kathmandu Valley Using Nonlinear Pushover Analysis. MEng Thesis, Purbanchal University, Biratnagar, Nepal, 2010. [Google Scholar]
- ATC-19:1995. Structural Response Modification Factors; ATC-19 Report; Applied Technology Council (ATC): Redwood City, CA, USA, 1995. [Google Scholar]
- Park, R. Ductility evaluation from laboratory and analytical testing. In Proceedings of the 9th World Conference on Earthquake Engineering, Tokyo, Japan, 2–9 August 1988; Volume 8, pp. 605–616. [Google Scholar]
- Newmark, N.M.; Hall, W.J. Earthquake Spectra and Design; Earthquake Engineering Research Institute: Berkeley, CA, USA, 1982. [Google Scholar]
- IS 1893:2016. Criteria for Earthquake Resistant Design of Structures–Part. 1 General Provisions and Buildings; 6th Revision; Bureau of Indian Standards: New Delhi, India, 2016.
- SeismoStruct–A Computer Program for Static and Dynamic Nonlinear Analysis of Framed Structures; Seismosoft Ltd.: Pavia, Italy, 2020. Available online: https://seismosoft.com/ (accessed on 10 October 2020).
- Smith, B.S. Behavior of square infilled frames. J. Struct. Div. (ASCE) 1966, 92, 381–403. [Google Scholar]
- Mander, J.B.; Priestley, M.J.; Park, R. Theoretical stress-strain model for confined concrete. J. Struct. Eng. (ASCE) 1988, 114, 1804–1826. [Google Scholar] [CrossRef] [Green Version]
- Mander, J.B.; Priestley, M.J.N.; Park, R. Observed stress-strain behavior of confined concrete. J. Struct. Eng. (ASCE) 1988, 114, 1827–1849. [Google Scholar] [CrossRef]
- Yassin, M.H.M. Nonlinear Analysis of Prestressed Concrete Structures under Monotonic and Cyclic Loads. Ph.D. Thesis, University of California, Berkeley, CA, USA, 1994. [Google Scholar]
- Menegotto, M.; Pinto, P.E. Method of analysis for cyclically loaded R.C. plane frames including changes in geometry and non-elastic behavior of elements under combined normal force and bending. In Proceedings of the ISBE Symposium on the Resistance and Ultimate Deformability of Structures Acted on by Well Defined Repeated Loads, Zurich, Switzerland, 2–5 September 1973; International Association for Bridge and Structural Engineering (IABSE): Lisbon, Portugal; pp. 15–22. [Google Scholar]
- Crisafulli, F.J. Seismic Behavior of Reinforced Concrete Structures with Masonry Infills. Ph.D. Thesis, University of Canterbury, Christchurch, New Zealand, 1997. [Google Scholar] [CrossRef]
- Shendkar, M.; Pradeep Kumar, R. Influence of opening in infill on R factor of RC infilled frame structures. Indian Concr. Inst. J. 2018, October–December, 1–6. [Google Scholar]
- IS-13920:2016. Ductile Design and Detailing of Reinforced Concrete Structures Subjected to Seismic Force; Bureau of Indian Standards: New Delhi, India, 2016. [Google Scholar]


| Type of Structure | Special Moment Resisting Frames |
|---|---|
| Number of stories | 4 |
| Seismic zone | IV |
| Floor height | 3 m |
| Bay length | 4 m along X and Y direction |
| Infill wall | SIM—110 mm and URM—113 mm |
| Compressive strength | SIM—2.5 MPa, URM—5.5 MPa |
| Modulus of elasticity | SIM—2500 MPa, URM—4000 MPa |
| Type of soil | Medium stiff soil |
| Column size (mm) | 300 × 450 |
| Beam size (mm) | 250 × 450 |
| Lintel Beam size (mm) | 230 × 230 |
| Slab depth (mm) | 150 |
| Live load (kN/m2) | 3 |
| Material | M-25 grade concrete (characteristic compressive strength is 25 MPa), and Fe-415 reinforcement (yield strength of steel is 415 MPa) |
| Damping in structure | 5% |
| Importance factor (I) | 1.2 |
| Response reduction factor (R) | 5 |
| 2.5 | |
| Seismic weight (W) | 7805.76 kN |
| Parameters | SIM Infill Values | URM Infill Values |
|---|---|---|
| Panel thickness | 110 mm | 113 mm |
| Out-of-plane failure drift | 7.6% | 0.50% |
| Strut area, A1 | 31,380.25 mm2 | 30,647.86 mm2 |
| Residual area, A2 | 60% | 50% |
| Equivalent contact length, hz | 25.17% | 22.18% |
| Horizontal offset, xoi | 5.62% | 5.62% |
| Vertical offset, yoi | 7.50% | 7.50% |
| Proportion of stiffness assigned to shear, γs | 70.00% | 5.00% |
| Specific weight, γ | 23.5 kN/m3 | 23.5 kN/m3 |
| Elastic modulus, Em | 2500 MPa | 4000 MPa |
| Compressive strength, fmθ | 2.5 MPa | 5.5 MPa |
| Tensile strength, ft | 0.0 MPa | 0.575 MPa |
| Strain at maximum stress, εm | 0.002 | 0.0012 |
| Ultimate strain, εult | 0.024 | 0.024 |
| Closing strain, εcl | 0.004 | 0.003 |
| Strut area reduction strain, ε1 | 0.0006 | 0.0003 |
| Residual strut area strain, ε2 | 0.001 | 0.0006 |
| Initial unloading stiffness factor, γun | 2.5 | 1.7 |
| Strain reloading factor, αre | 0.2 | 0.2 |
| Strain inflection factor, αch | 0.7 | 0.7 |
| Complete unloading strain factor, βa | 2 | 2 |
| Stress inflection factor, βch | 0.9 | 0.9 |
| Zero stress stiffness factor, γplu | 1 | 1 |
| Reloading stiffness factor, γplr | 1.5 | 1.1 |
| Plastic unloading stiffness factor, ex1 | 3 | 3 |
| Repeated cycle strain factor, ex2 | 1 | 1 |
| Shear bond strength, τ0 | 0.1 MPa | 0.3 MPa |
| Friction coefficient, μ | 1.2 | 0.7 |
| Maximum shear resistance, τmax | 1 MPa | 1 MPa |
| Reduction shear factor, αs | 1.5 | 1.5 |
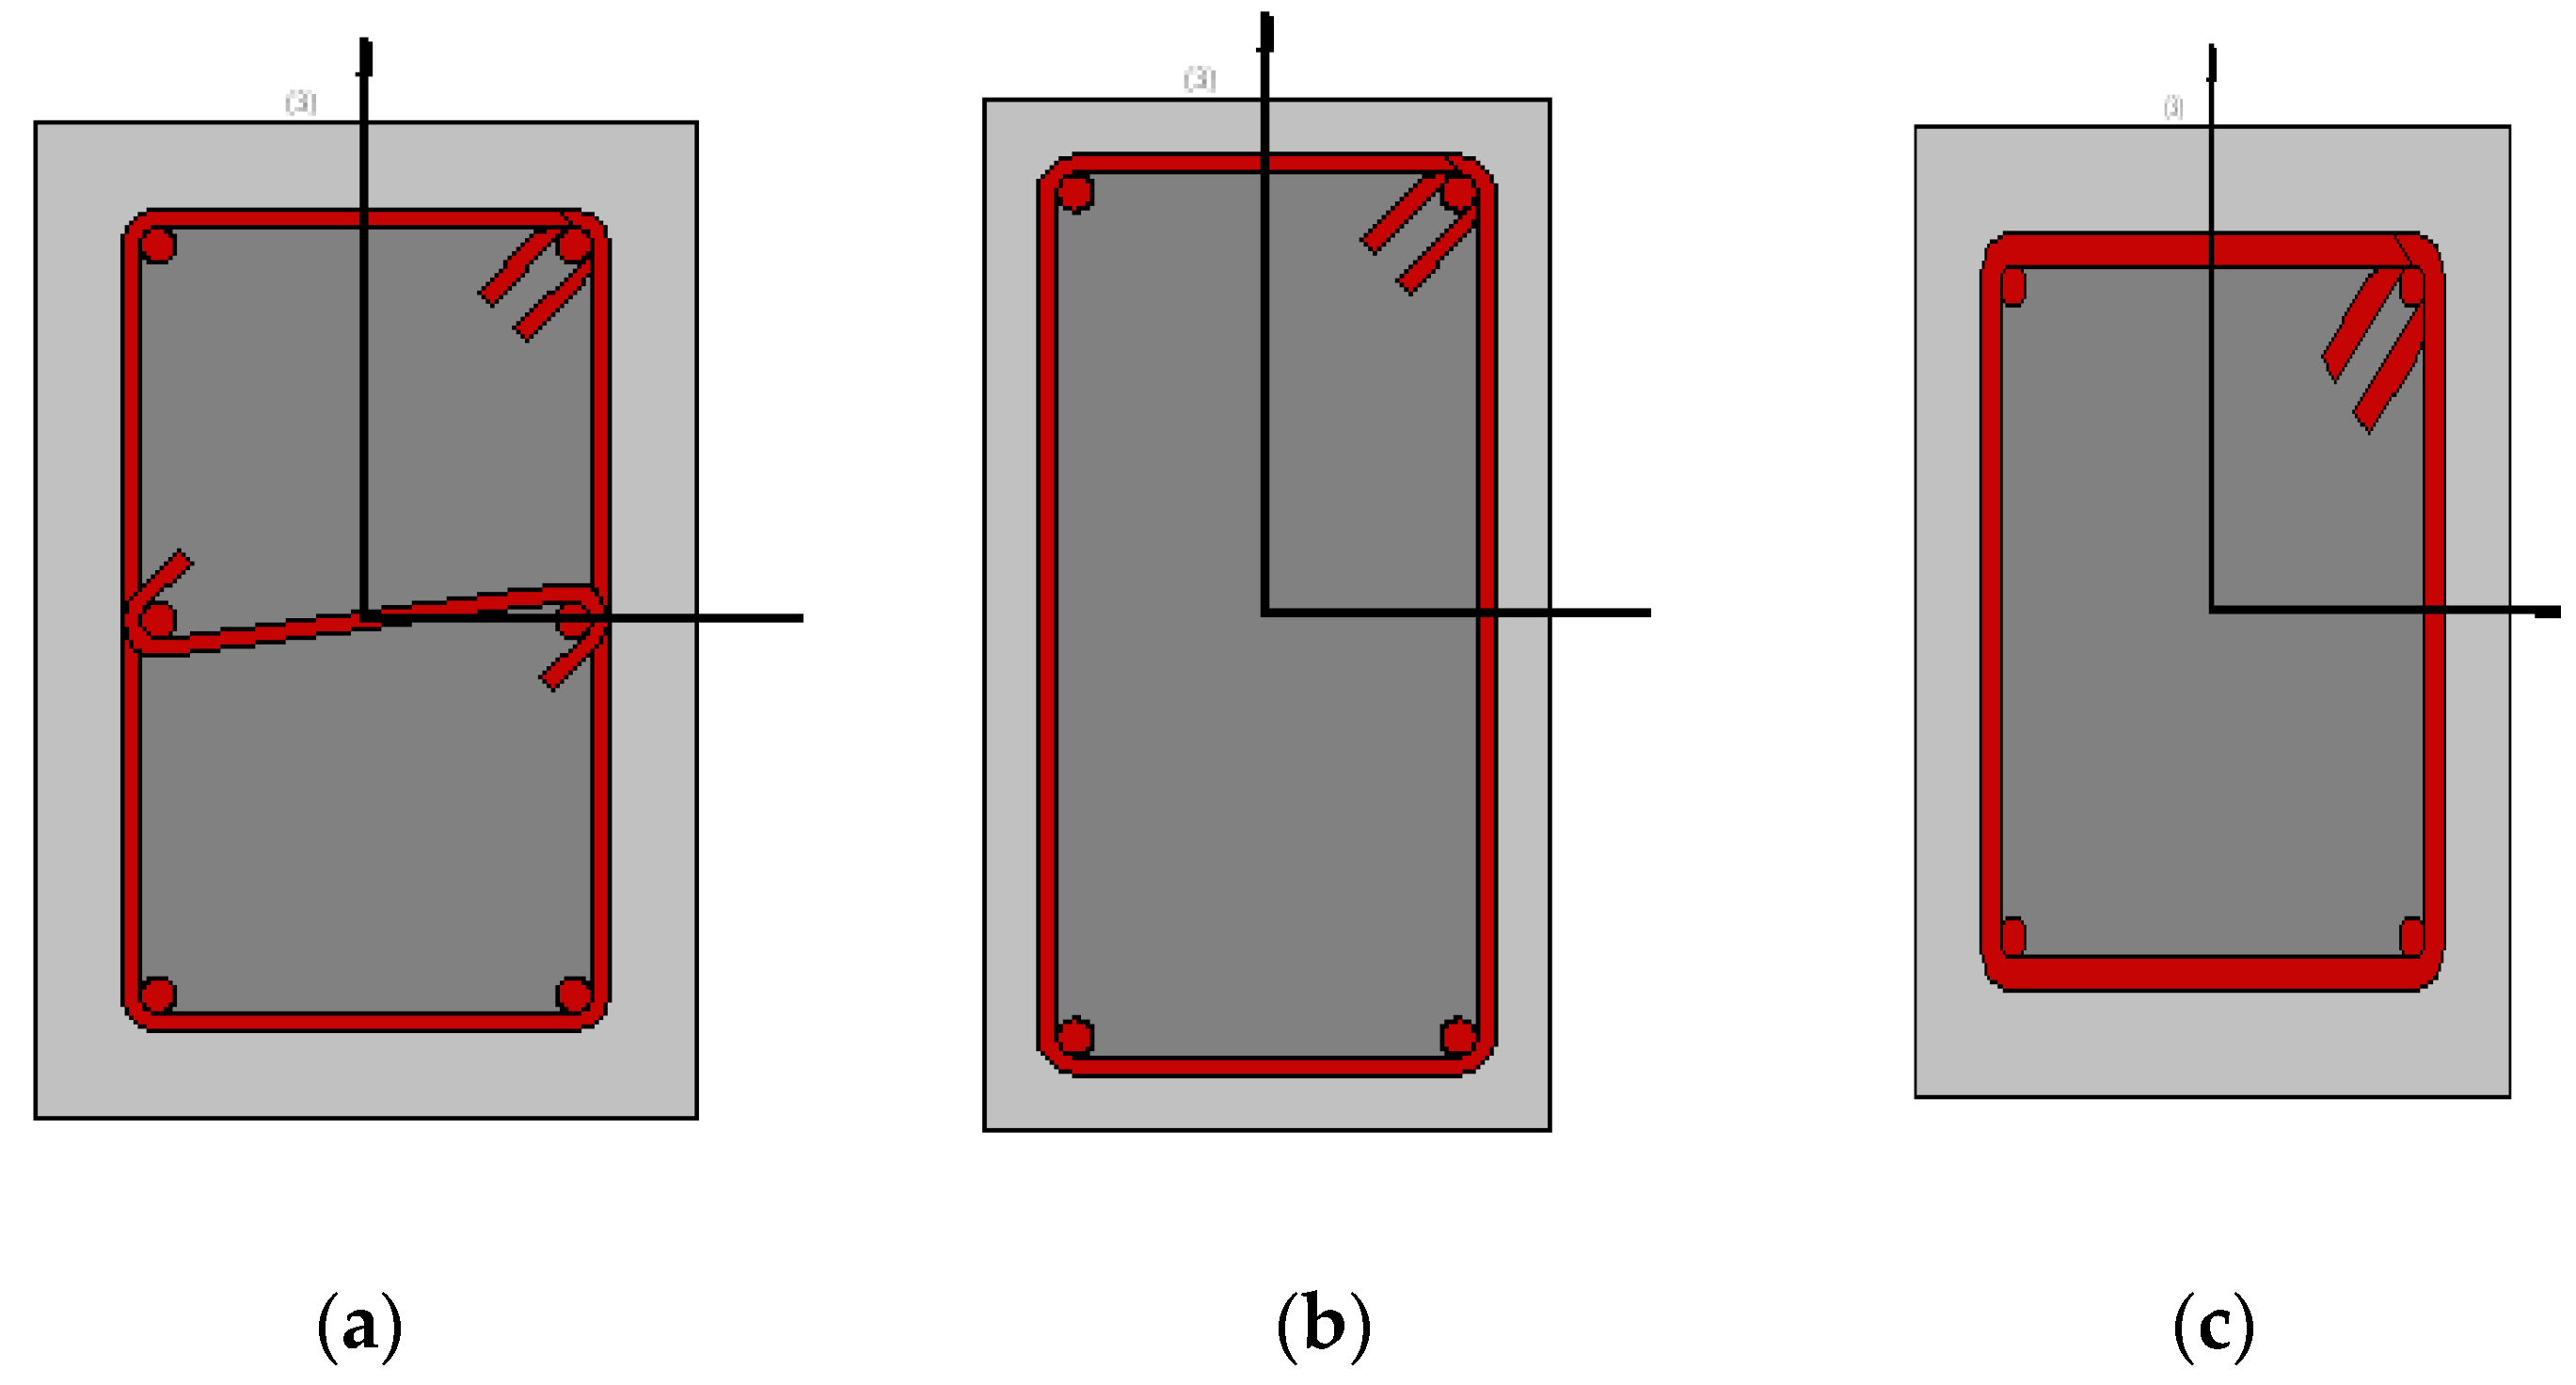
| Structural Member | Size (mm) | Main Reinforcement | Shear Reinforcement |
|---|---|---|---|
| All columns of the building | 300 × 450 | 4 nos. of 16 mm dia. at a corner and two nos. of 16 mm on the longer side | 8 mm dia. at 100 mm c/c |
| All beams of the building | 250 × 450 | 2 nos. of 16 mm diameter at top and bottom | 8 mm dia. at 100 mm c/c |
| All lintel beams of the building | 230 × 230 | 2 nos. of 10 mm diameter at top and bottom | 8 mm dia. at 200 mm c/c |
Publisher’s Note: MDPI stays neutral with regard to jurisdictional claims in published maps and institutional affiliations. |
© 2021 by the authors. Licensee MDPI, Basel, Switzerland. This article is an open access article distributed under the terms and conditions of the Creative Commons Attribution (CC BY) license (http://creativecommons.org/licenses/by/4.0/).
Share and Cite
Shendkar, M.R.; Kontoni, D.-P.N.; Mandal, S.; Maiti, P.R.; Gautam, D. Effect of Lintel Beam on Seismic Response of Reinforced Concrete Buildings with Semi-Interlocked and Unreinforced Brick Masonry Infills. Infrastructures 2021, 6, 6. https://0-doi-org.brum.beds.ac.uk/10.3390/infrastructures6010006
Shendkar MR, Kontoni D-PN, Mandal S, Maiti PR, Gautam D. Effect of Lintel Beam on Seismic Response of Reinforced Concrete Buildings with Semi-Interlocked and Unreinforced Brick Masonry Infills. Infrastructures. 2021; 6(1):6. https://0-doi-org.brum.beds.ac.uk/10.3390/infrastructures6010006
Chicago/Turabian StyleShendkar, Mangeshkumar R., Denise-Penelope N. Kontoni, Sasankasekhar Mandal, Pabitra Ranjan Maiti, and Dipendra Gautam. 2021. "Effect of Lintel Beam on Seismic Response of Reinforced Concrete Buildings with Semi-Interlocked and Unreinforced Brick Masonry Infills" Infrastructures 6, no. 1: 6. https://0-doi-org.brum.beds.ac.uk/10.3390/infrastructures6010006