
Effect of Type of Curing and Metakaolin Replacement on Air Lime Mortars for the Durability of Masonries


1
Department of Civil Engineering, NOVA School of Science and Technology, NOVA University of Lisbon, 2825-516 Caparica, Portugal
2
CERIS, Civil Engineering Research and Innovation for Sustainability, IST, 1049-001 Lisbon, Portugal
*
Author to whom correspondence should be addressed.
Infrastructures 2021, 6(10), 143; https://0-doi-org.brum.beds.ac.uk/10.3390/infrastructures6100143
Submission received: 7 September 2021
/
Revised: 30 September 2021
/
Accepted: 1 October 2021
/
Published: 8 October 2021
(This article belongs to the Special Issue Durability and Degradability of Construction Materials)
Abstract
:The interest in restoration and maintenance of old masonries towards their durability is nowadays combined with the concept of sustainability and the need to implement more suitable materials for building heritage interventions. This has led to the importance of having a better knowledge of air lime mortars, namely on the effect of pozzolanic additions, curing conditions and evolution at early stages. This study consisted in the characterization of mortars based on hydrated air lime and sand, with 1:2 (lime:sand) volumetric composition, with different weight percentages of substitution of lime by metakaolin (Mk): 0%, 10% and 20%. Mortar prisms were analyzed in three different curing environments: maritime (by the Atlantic Ocean), in laboratory humidity (95 ± 5% relative humidity, RH) and standard (65 ± 5% RH) conditioning. Tests were conducted to evaluate fresh and hardened properties of mortars, considering physical, chemical and mechanical performance at 28, 90 and 180 days. Results showed the viability of applying air lime-Mk mortars with curing conditions similar to the tested ones. In the standard curing, the mortar with 20% Mk revealed advantages in mechanical parameters. Concerning the behaviour towards water, improvements were shown at an early stage with the humid curing, while maritime curing benefited its behaviour for at least up to 6 months.
1. Introduction
Mortars have been used since ancient times. They are frequently used in renders, being the sacrificial coatings of many building facades. Their main purpose is to protect the substrate, namely the masonry walls, from exposure to external agents, such as weather, pollution and impact actions [1]. By protecting the substrate, they contribute to the durability of the whole system.
In Europe, the majority of historical mortars are lime-based and were used in construction until at least the beginning of the 20th century, contributing vastly to the history of construction [2]. After the invention of cement in the 19th century, and particularly with the increase of scientific studies about hydraulic reactions, the development and techniques related to lime mortars were forgotten. The apparent advantages of Portland cement, such as higher strength and quicker hardening, contributed on a large scale to increasing their use.
However, with the need for restoration and maintenance of old renders and the ill-omened effects of the use of Portland cement in architectural heritage, in the last decades, many scientific studies have been carried out about promoting the re-use of air lime mortars, namely for heritage repair and conservation [2,3,4]. The requirements for mortars to be used in conservation are quite different from those used in new construction, due to compatibility criteria and also to reversibility when high cultural values are involved. In these cases, it is intended to use mortars with high deformability and water vapor permeability, in order not to block moisture in the old masonries. Mortars should also have similar properties to the pre-existing mortars but lower than the substrate to avoid changing the original stress distribution [1].
Air lime-based mortars have positive environmental implications as compared with cement mortars due to their lower energy consumption for production, fired at less than 900 °C, and their contribution to CO2 balance by retaining and by carbonation when hardening the CO2 that was emitted from production [5]. They can be used in a wide variety of mixtures depending on their function, such as renders and plasters [6], repairing ornamental pieces and surfaces of historical buildings [7], bonding glazed tiles [8] and other use cases [4,9,10].
In new civil engineering applications and conservation, sometimes there is a need to improve air lime mortars, as they present slower setting and hardening, compared to cement ones. It is also notorious that their mechanical strengths are different from cement-based mortars [11]. Numerous studies have been carried out demonstrating that air lime mortars blended with pozzolans showed faster setting properties and an increase in their mechanical capacity and durability [12,13,14]. Pozzolans are fine graded materials that, together with binders that contain calcium hydroxide, react in the presence of water and constitute hydrated compounds. Therefore, pozzolans can partially replace mortar binders, making mortars more durable and eco-efficient. Examples of air lime–pozzolan mortars that are more than 2000 years old can be seen in several archaeological sites, both with natural pozzolans [12] and artificial pozzolans [15]. In these modified air lime mortars, it is important to understand the mechanisms of setting and hardening, as well as their chemical and mineralogical compositions [16].
The introduction of artificial pozzolans that result from waste generation can not only improve the characteristics of these mortars but also enhance the sustainability of the construction sector, through the recycling of materials [13].
Since metakaolin (Mk) has a high pozzolanic activity and is often used as a substitution of cement [17,18], it is interesting to evaluate the combination of this material with air lime. Previous research has shown some studies focusing on air lime-Mk mortars. In Table 1, a synthesis of some studies can be observed regarding air lime mortars, with substitutions of lime by Mk of up to 50%, with different volumetric proportions of the binder:aggregate and even with different curing cycles [19,20,21,22,23,24,25,26,27,28].
The majority of previous studies have assessed the influence of relatively high Mk contents on air lime mortars, which were mortars with binder:sand ratios of 1:3 (vol.), and the mortars were just assessed at younger ages. The curing conditions, namely temperature, relative humidity (RH) and salts exposure, should influence the kinetics of the hardening reactions and, subsequently, the mechanical strength [16]. The influence of natural exposure curing has rarely been assessed in previous studies of air lime–Mk mortars. Some research studies have mentioned the decrease in mechanical strength of air lime–Mk mortars after 3 months of age [19,20,27,28]. Therefore, the main objective of the present research was to evaluate the influence of curing conditions (near the Atlantic Ocean and with most probable contamination by salts, humidity and standard laboratory conditions) on the physic–mechanical characteristics of air lime-based mortars, with a binder:sand volumetric proportion of 1:2, when lime content replacement by Mk with percentages of 10 and 20% (vol.) occurs, after up to 6 months of the mortar’s age. The aim was to increase knowledge on how these replacements and curing conditions may affect mortars performance at relatively early ages and how can it affect their future durability.

Table 1.
Synthesis of air lime mortars with incorporation of metakaolin, test methods and results.
| Study | Mortars Analyzed | Tests | Results |
|---|---|---|---|
| Faria [23] | Binder(CL+Mk):Sand 1:2 with CL:Mk:sand (vol.) 1:0.5:3, 1:1:4, 1:1.5:5, submitted to dry and humid curing, tested at 60 d | Consistency (EN 1015-3) | 167–177 mm |
| FStr (EN 1015-11) | 0.08–1.07 MPa | ||
| CStr (EN 1015-11) | 0.36–8 MPa | ||
| Op (EN 1936) | 29–36% | ||
| Faria et al. [25] | Binder:sand 1:3 (vol.), with 0%, 30% and 50% substitutions of CL by Mk, submitted to standard and humid curing tested at 28 d | Consistency (EN 1015-3) | 132–144 mm |
| Ed (EN 14146) | 729–6690 MPa | ||
| FStr (EN 1015-11) | 0.08–1.09 MPa | ||
| CStr (EN 1015-11) | 0.13–2.82 MPa | ||
| Op (EN 1936) | 29–31% | ||
| CS (EN 15801) | 13.6–24.9 kg/m2 | ||
| CC (EN 15801) | 0.84–1.43 kg/(m2·min0.5) | ||
| Andrejkovičová et al. [20] | Binder:sand 1:3 (vol.) with 0% and 20% of Mk, submitted to weathering cycles, tested at 28, 90 and 180 d | Ed (BS 1881-209) | 2.8–4.0 MPa |
| FStr (EN 1015-11) | 0.125–0.175 MPa | ||
| CStr (EN 1015-11) | 0.40–0.55 MPa | ||
| Cardoso et al. [22] | Binder:sand 1:3 (vol.) with 0% and 9% substitutions of air lime by Mk, submitted to six different curing conditions, tested at 28, 90 and 365 d | Consistency (EN 1015-3) | 150 ± 10 mm |
| FStr (EN 1015-11) | 0.05–0.15 MPa | ||
| CStr (EN 1015-11) | 0.1–0.6 MPa | ||
| Faria & Martins [24] | Binder:sand 1:3 (vol.), with 0% and 20% substitutions of Mk, cured under different conditions of RH and CO2 content and tested at 60 d for mechanical tests and 120 d for capillarity and drying | Consistency (EN 1015-3) | 154–155 mm |
| Ed (EN 14146) | 2822–3691 MPa | ||
| FStr (EN 1015-11) | 0.3–0.7 MPa | ||
| CStr (EN 1015-11) | 0.4–1.3 MPa | ||
| CS (EN 15801) | 13.85–16.91 kg/m2 | ||
| CC (EN 1015-18) | 0.92–1.07 kg/(m2·min0.5) | ||
| Ferraz et al. [26] | Binder:sand 1:3 (vol.), with 0%, 10%, 20% and 30% substitutions of CL by Mk, tested at 28, 90 and 180 d | Consistency (EN 1015-3) | 130–140 mm |
| Ed (EN 14146) | 2.38–3.85 GPa | ||
| FStr (EN 1015-11) | 0.22–0.36 MPa | ||
| CStr (EN 1015-11) | 0.30–0.68 MPa | ||
| Gameiro et al. [19] | Binder:sand 1:1, 1:2 and 1:3 (vol.), with 0%, 30% and 50% substitutions of CL by Mk, tested at 28 and 90 d | Consistency (EN 1015-3) | 139–144 mm |
| FStr (EN 1015-11) | 0.50–2.6 MPa | ||
| CStr (EN 1015-11) | 1–15 MPa | ||
| Pavlík & Užáková, [27] | Binder:sand 1:1 (vol.), with 50% substitutions of CL by Mk, tested at 28, 90, 180 and 365 d | Consistency (EN 1015-3) | 152–150 mm |
| CStr (EN 1015-11) | 1.6–9 MPa | ||
| Arizzi & Cultrone [28] | Binder:sand 1:3 (vol.), with 0%, 10%, 15% and 20% substitutions of CL by Mk, tested at 28 and 120 d | Consistency (EN 1015-3) | 133–148 mm |
| FStr (EN 1015-11) | 1.69–2.93 MPa | ||
| CStr (EN 1015-11) | 2.36–9.12 MPa | ||
| Op (not specified) | 31–32% | ||
| Loureiro et al. [21] | Binder:sand 1:1, 1:2 and 1:3 (vol.), with 0%, 25% and 50% substitutions of CL by Mk, tested at 90 d | Consistency (NBR 13276) | 195–210 mm |
| Ed (EN 14146) | 6771–10485 MPa | ||
| FStr (EN 1015-11) | 0.81–2.72 MPa | ||
| CStr (EN 1015-11) | 2.02–12.63 MPa | ||
| Porosity (EN 1936) | 26–30% | ||
| Drying rate D1 (EN 16322) | 0.0042–0.0051 kg/(m2·min0.5) | ||
| Drying rate D2 (EN 16322) | 0.0391–0.0467 kg/(m2·min0.5) |
Notation: CL—air lime; CStr—compressive strength; Consistency—flow table consistency; Ed—dynamic modulus of elasticity; FStr—flexural strength; Op—open porosity; CS—capillary saturation value of samples with 40 mm × 40 mm × 80 mm; CC—capillary coefficient; RH—relative humidity.
2. Experimental Programme
To evaluate the influence of the replacement of the binder by Mk in air lime mortars, various tests were carried out on the fresh mortar and, after determined periods of curing, on hardened specimens. The effect of three different curing conditions were tested, to assess the performance and expected durability of the mortars.
2.1. Materials
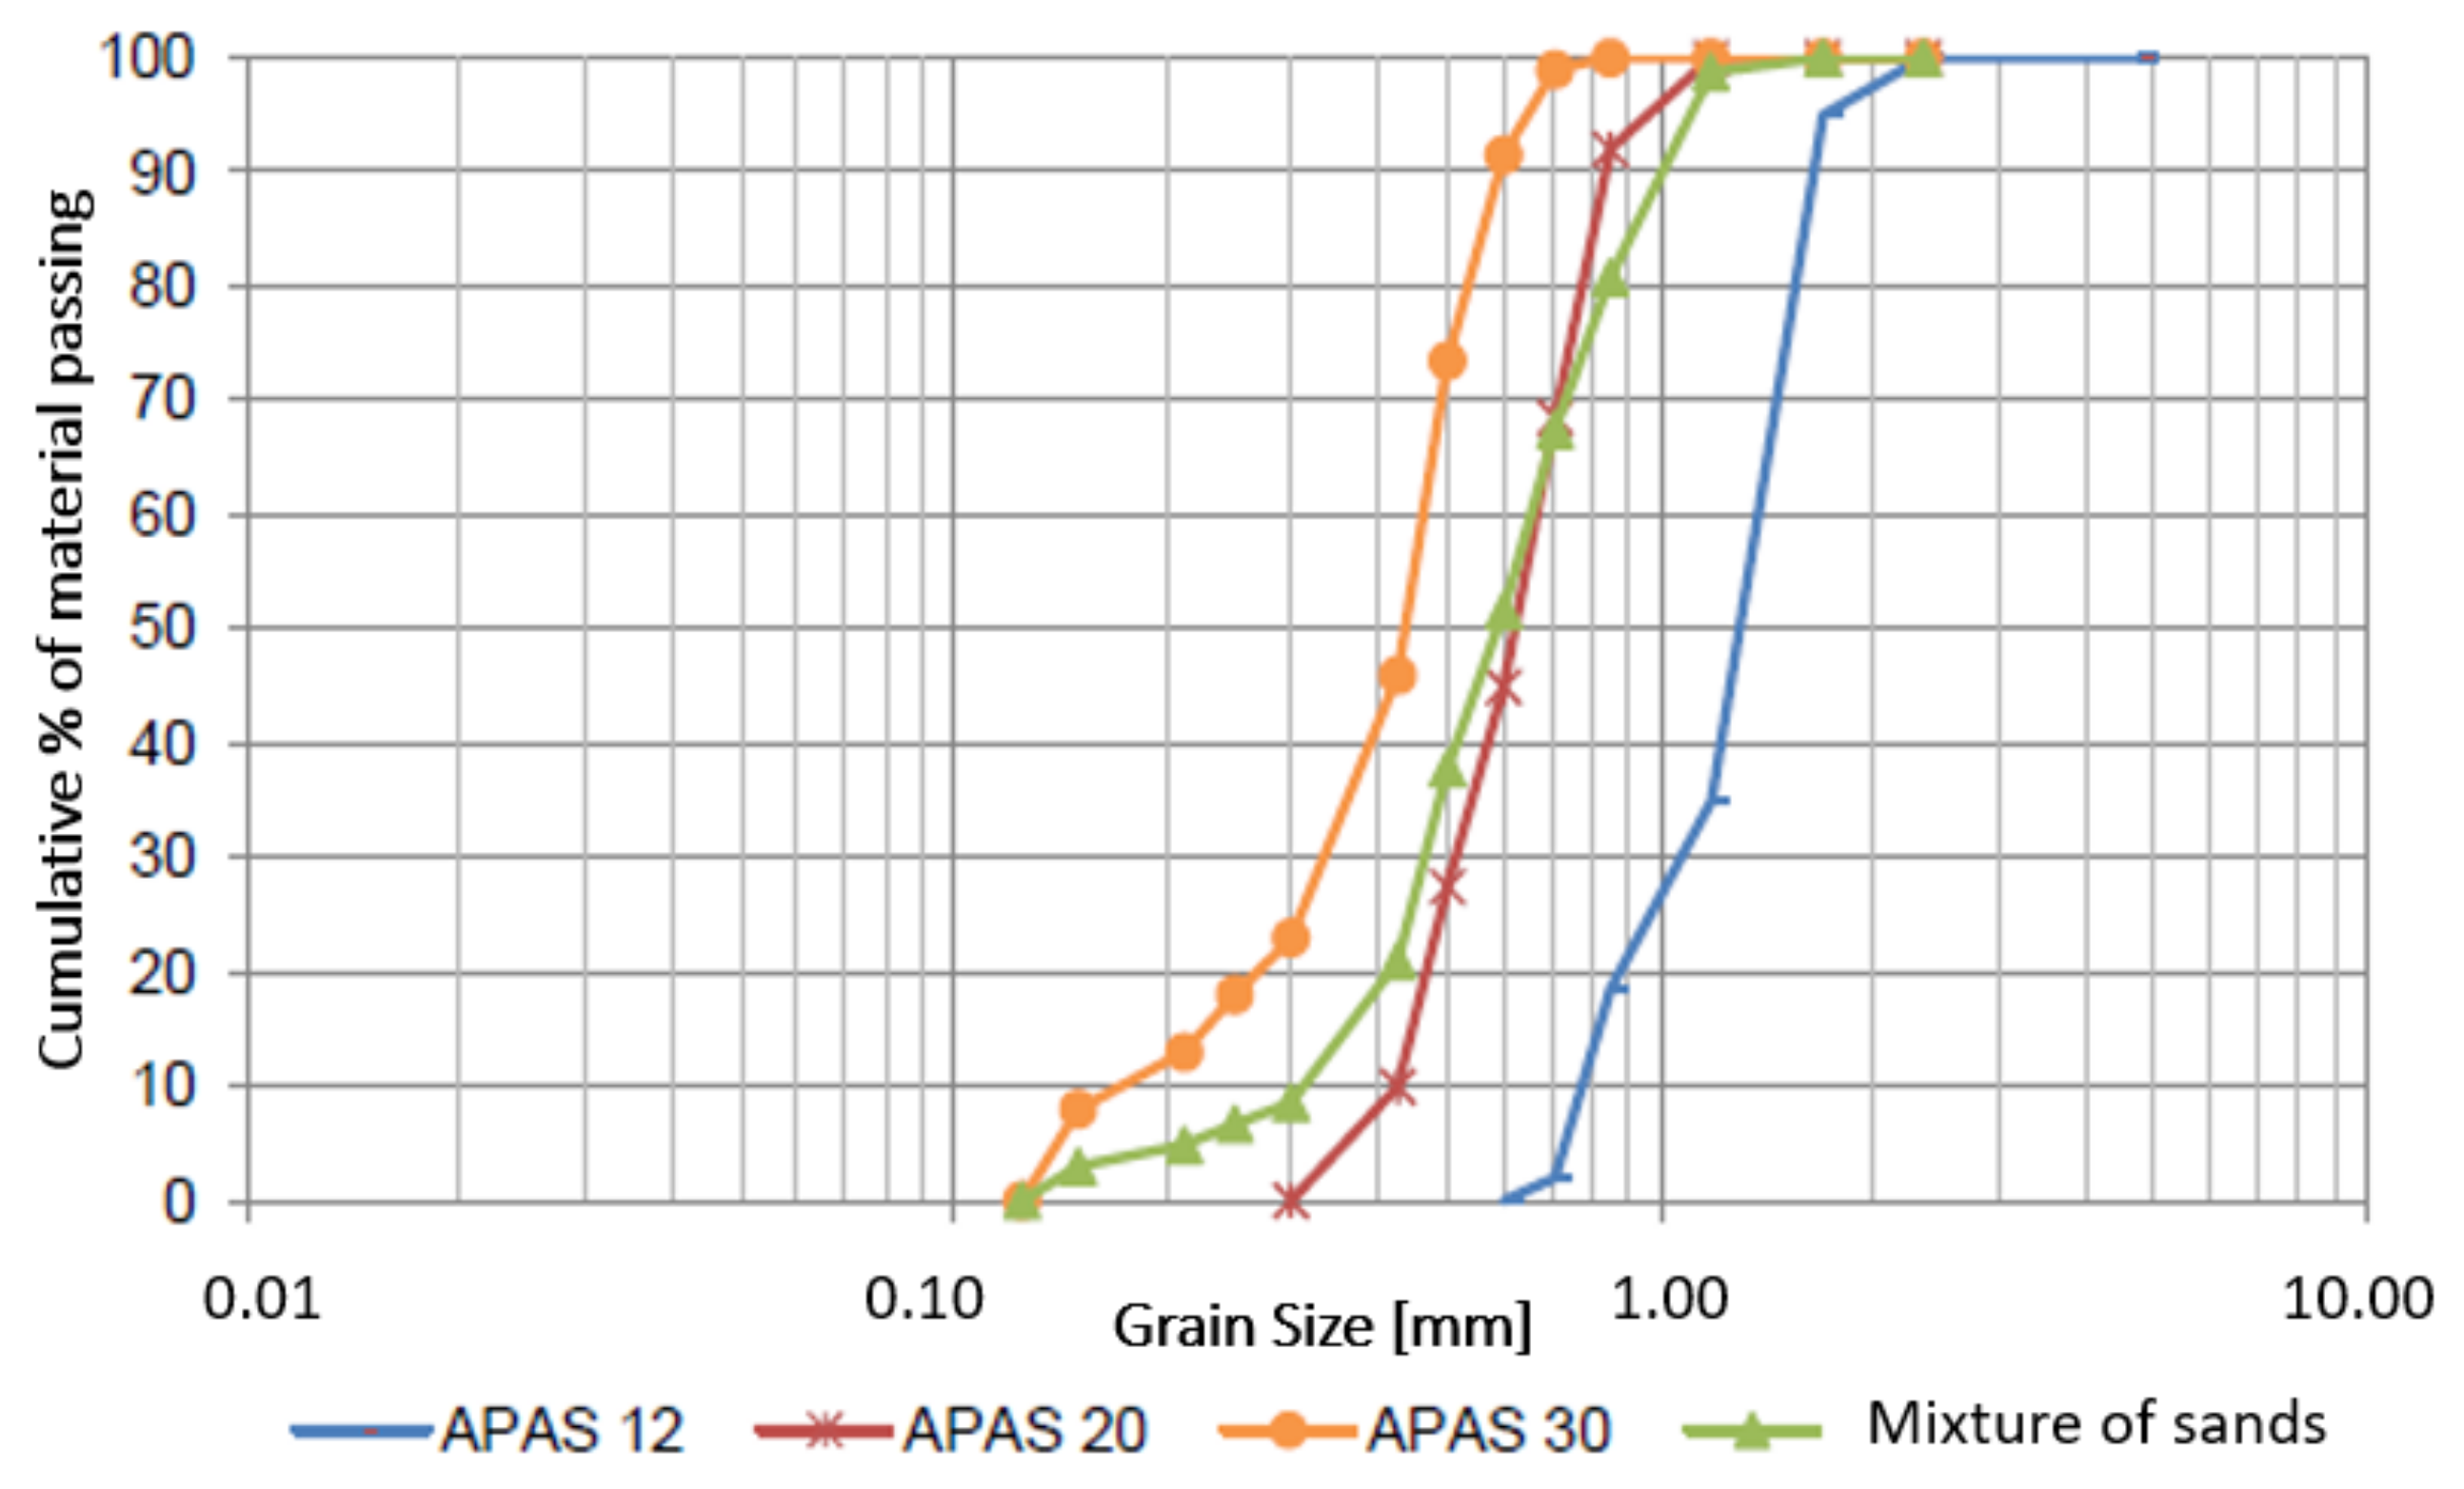
All the mortars were prepared with an industrial powder hydrated air lime (CL), classified as CL90-S by EN 459-1 [29] and produced by Lusical, Lhoist group, Portugal. The same CL was also used in previous studies, such as Gameiro et al. [19] where the chemical composition can be seen, Andrejkovičová et al. [20], Cardoso et al. [22], Faria & Martins [24] and Faria et al. [25]. The aggregate was obtained by mixing three types of washed and calibrated silica sands with different granulometry (APAS 12, APAS20, and APAS30, from Areipor) with a volume ratio of 1:1.5:1.5, respectively. The particle size distribution of each sand and the sand mixture (S) can be seen in Figure 1. The Mk used in the modified mortars was an artificial pozzolana, Argical M 1200S, from IMERYS, and it was obtained from micronizing and calcining a kaolinitic clay. The chemical composition of the Mk that was used was assessed by Gameiro et al. [19]. The loose bulk density off all dry constituents of mortars, based on EN 1097-3 [30], is shown in Table 2.
2.2. Mortars Preparation, Fresh State Characterization and Curing
A reference mortar, named CL, with a volumetric binder:aggregate proportion of 1:2 was produced. Based on that proportion, two mortars were formulated with partial replacements of the lime with Mk: CL_10Mk and CL_20Mk (corresponding to substitutions of 10% and 20% in volume), as shown in Table 3. The water was added to ensure workability for the reference mortar to be able to be applied as a render by a skilled professional and kept constant for the other mortars.
The mortar mixing procedure was based on the EN 1015-2 [31]. After cleaning and taring the trays, the components were placed from the coarsest to the finest granulometry. After mixing the dry materials, they were manually homogenized and placed in a mechanical mixer. The water was then added in the first 15 to 30 s and followed by 120 s of mechanical mixing. After this period, the process was interrupted to remove the materials which accumulated at the edges of the vat. The mechanical mixing process restarted with a duration of 30 s, concluding the kneading.
Mortars in the fresh state were characterized by the flow table consistency test, according to EN 1015-3 [32], bulk density following EN 1015-6 [33], air content according to EN 1015-7 [34] and water retention based on EN 1015-8 [35].
The mortar specimens were prepared in standardized prismatic metallic molds with 40 mm × 40 mm × 160 mm dimensions. The prismatic specimens were submitted to 3 distinct cures: maritime (m), humid (h), and standard (s) curing. The mortar specimens exposed to each curing are specified adding the type of curing (m, h or s) to its abbreviation in curved brackets.
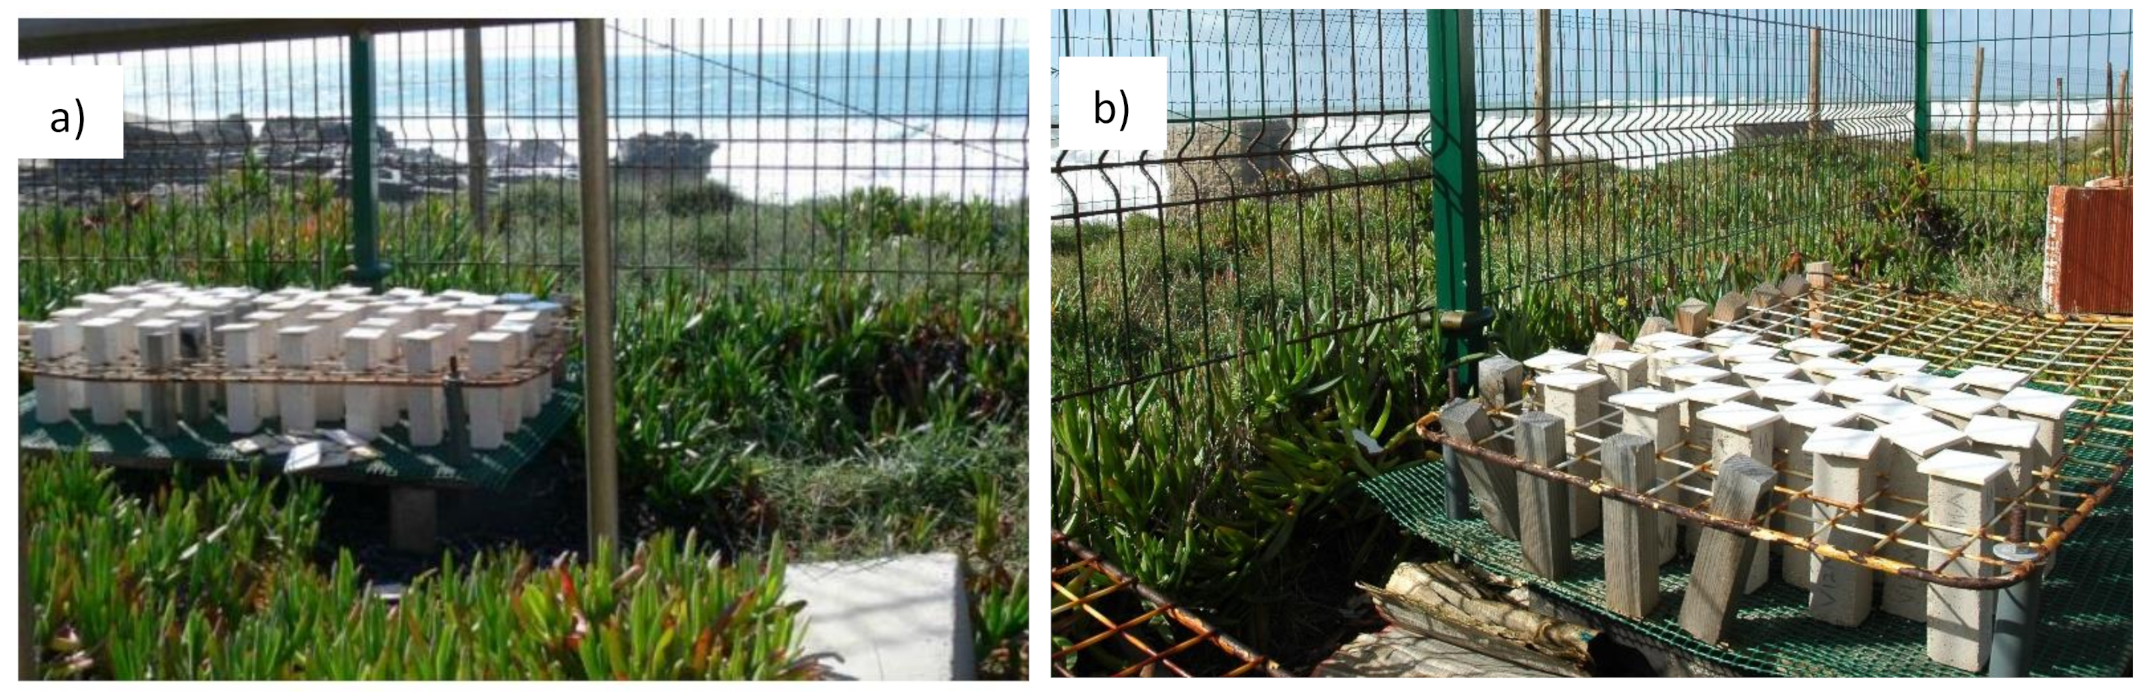
Standard curing corresponds to controlled conditions of (65 ± 5)% RH and temperature of (20 ± 2) °C, guaranteed by a controlled environment room. Humid curing corresponds to RH and temperature conditions of (95 ± 5)% and (20 ± 2) °C. This percentage was reached with the use of a large vat containing water, where a support grid, for the specimens, had been installed. The vat was kept closed with a polyethylene cover to create this high RH environment. The maritime cure was performed in natural exposure at the Portuguese Laboratory for Civil Engineering (LNEC) Natural Exposure Station, located in Cabo Raso, Lisbon. This natural exposure station is located only about 25 m from the Atlantic Ocean, which implies a natural sprinkling of saltwater, with a high concentration of chlorides and contact with salt fog. This environment is very aggressive and frequent in Portugal and other countries bordering the Ocean. Small size ceramic tiles were placed on the top of each specimen, and on the periphery, wooden prisms (false specimens) were placed to ensure that similar exposure conditions existed for all prismatic specimens (Figure 2).
2.3. Hardened State Characterization
The hardened state tests were carried out at 28, 90 and 180 days of the specimens’ lifespan.
The dynamic modulus of elasticity quantifies the mortar’s rigidity; the lower it is, the better the mortar can support small substrate deformations without cracking. It was determined based on EN 14,146 [36], for natural stone, using a Zeus Resonance Meter. Four non-destructive tests were performed with each specimen, changing the prism position in the equipment.
The flexural strength test was performed using a universal machine Zwick Rowell model Z050, with a load cell of 2 kN and a speed of 0.2 mm/min, based on EN 1015-11 [37].
The carbonation test was performed with phenolphthalein, with one half of each specimen tested for flexural strength at 90 days. It results in a chromatic variation of the surface when in contact with calcium hydroxide (Ca(OH)2), which is uncarbonated mortar), acquiring a pink color. The carbonated (CaCO3) part does not change color. In this test, only a quantitative evaluation of the evolution of carbonation was made, in visual terms.
The other half of each specimen was used in the compressive strength test, with the same equipment and using an apparatus that ensured a compressive area of 40 mm × 40 mm, a load cell of 50 kN and a speed of 0.7 mm/min, also following the EN 1015-11 [37].
Small samples of each specimen were prepared of around 40 mm × 40 mm × 20 mm and used in the open porosity and dry bulk density tests. The samples were subjected for 24 h to 60 °C, cooled and submitted to the open porosity and the bulk density tests based on EN 1936 [38] for natural stone, with a vacuum, hydrostatic weighing and water-saturated weighing.
In the capillarity water absorption test, samples of 40 mm × 40 mm × 70 mm in size were used. The test was carried out based on EN 15,801 [39]. Before starting the test, the samples were kept for at least 48 h in an oven at a temperature of 60 °C until they reached a constant mass value (corresponding to a variation of 0.1% mass within 24 h). The samples were removed from the oven and cooled at ambient temperature. They were wrapped in polyethylene film to waterproof their lateral faces and only allow water to be absorbed by a unidirectional capillary raise from the button. The test took place in a tank with saturated ambient conditions. Inside, a tray was placed and levelled, with a plastic net at the base (which ensures that the base of the samples was in contact with the water), filled with water up to a height of 5 mm and weighted after defined periods of time in contact with water. Water was added whenever necessary so that the height of the water remained constant. Capillary absorption curves were determined for each sample by weighing them until reaching an asymptotic value (Cs). For all mortars, the capillary coefficient (CC) was also calculated.
The drying capacity test started right after the capillarity test ended, with the same samples with lateral surfaces within the polyethylene film. After the initial weighing for drying (the last for capillary absorption), the samples were moved to a waterproof surface where standard cure conditions were imposed (RH of (65 ± 5)% and a temperature of (20 ± 3) °C), and they continued being weighted after defined periods of time, with the top surface as the only drying area. The drying curves, with a mass decrease per drying area by time and by the square root of time, were calculated and allowed determination of the rates for two drying phases, D1 (the first stage of drying) liquid front and D2 (the second stage of drying) including the moisture front [40], by the negative slope of the initial and intermediate linear segment, respectively, based on EN 16,322 [41].
3. Results and Analysis
3.1. Characteristics of Fresh Mortars
The results of the flow table consistency, water retention, air content and bulk density of fresh mortars are shown in Table 4.
Results obtained on the flow table consistency show that, for the same ratio of water/binder (the binder being the sum of air lime and Mk), the replacement of lime by Mk seems to tend to reduce the flow but without jeopardizing workability. That is not the case for instance when brick dust is added; that type of pozzolanic addition may have a great influence on fresh mortar behaviour because of the significant water absorption during mortar preparation [13]. However, the reduction did not correspond to the Mk content. As expected for air lime mortars, good workability was obtained, even with a low flow.
Gameiro et al. [19], using the same air lime and Mk and binder:sand ratios of 1:1, 1:2 and 1:3 (vol.) but with 0%, 30% and 50% lime replacement (Table 1), achieved an average flow of 138 ± 5 mm, showing very similar results to those obtained in Table 4. Faria et al. [25] also obtained flows of around 140 mm for 1:3 (vol.) binder:sand ratio and 0%, 30% and 50% Mk replacing lime. The same range of values of 140 mm for 1:3 (vol.) binder:sand ratio were achieved by Cardoso et al. [22], Faria & Martins [24] and Ferraz et al. [26], for 1:3 (binder:sand, in vol.), reached consistency flows of around 155 mm, slightly higher than the other studies, possibly due to different water/binder ratios.
Loureiro et al. [21], analyzing the consistency of air lime mortars with the addition of 0%, 25% and 50% of Mk (Table 1), obtained a higher consistency by using a different method, returning results not comparable. Pavlík & Užáková [27] also obtained values of around 150 mm for 1:1 (binder:sand, in vol.) with 50% substitution of Mk.
Regarding the water retention, air content and bulk density, all mortars had very similar results, showing the low influence of 10–20% Mk replacing air lime.
3.2. Characteristics of the Hardened Mortars
3.2.1. Dynamic Modulus of Elasticity
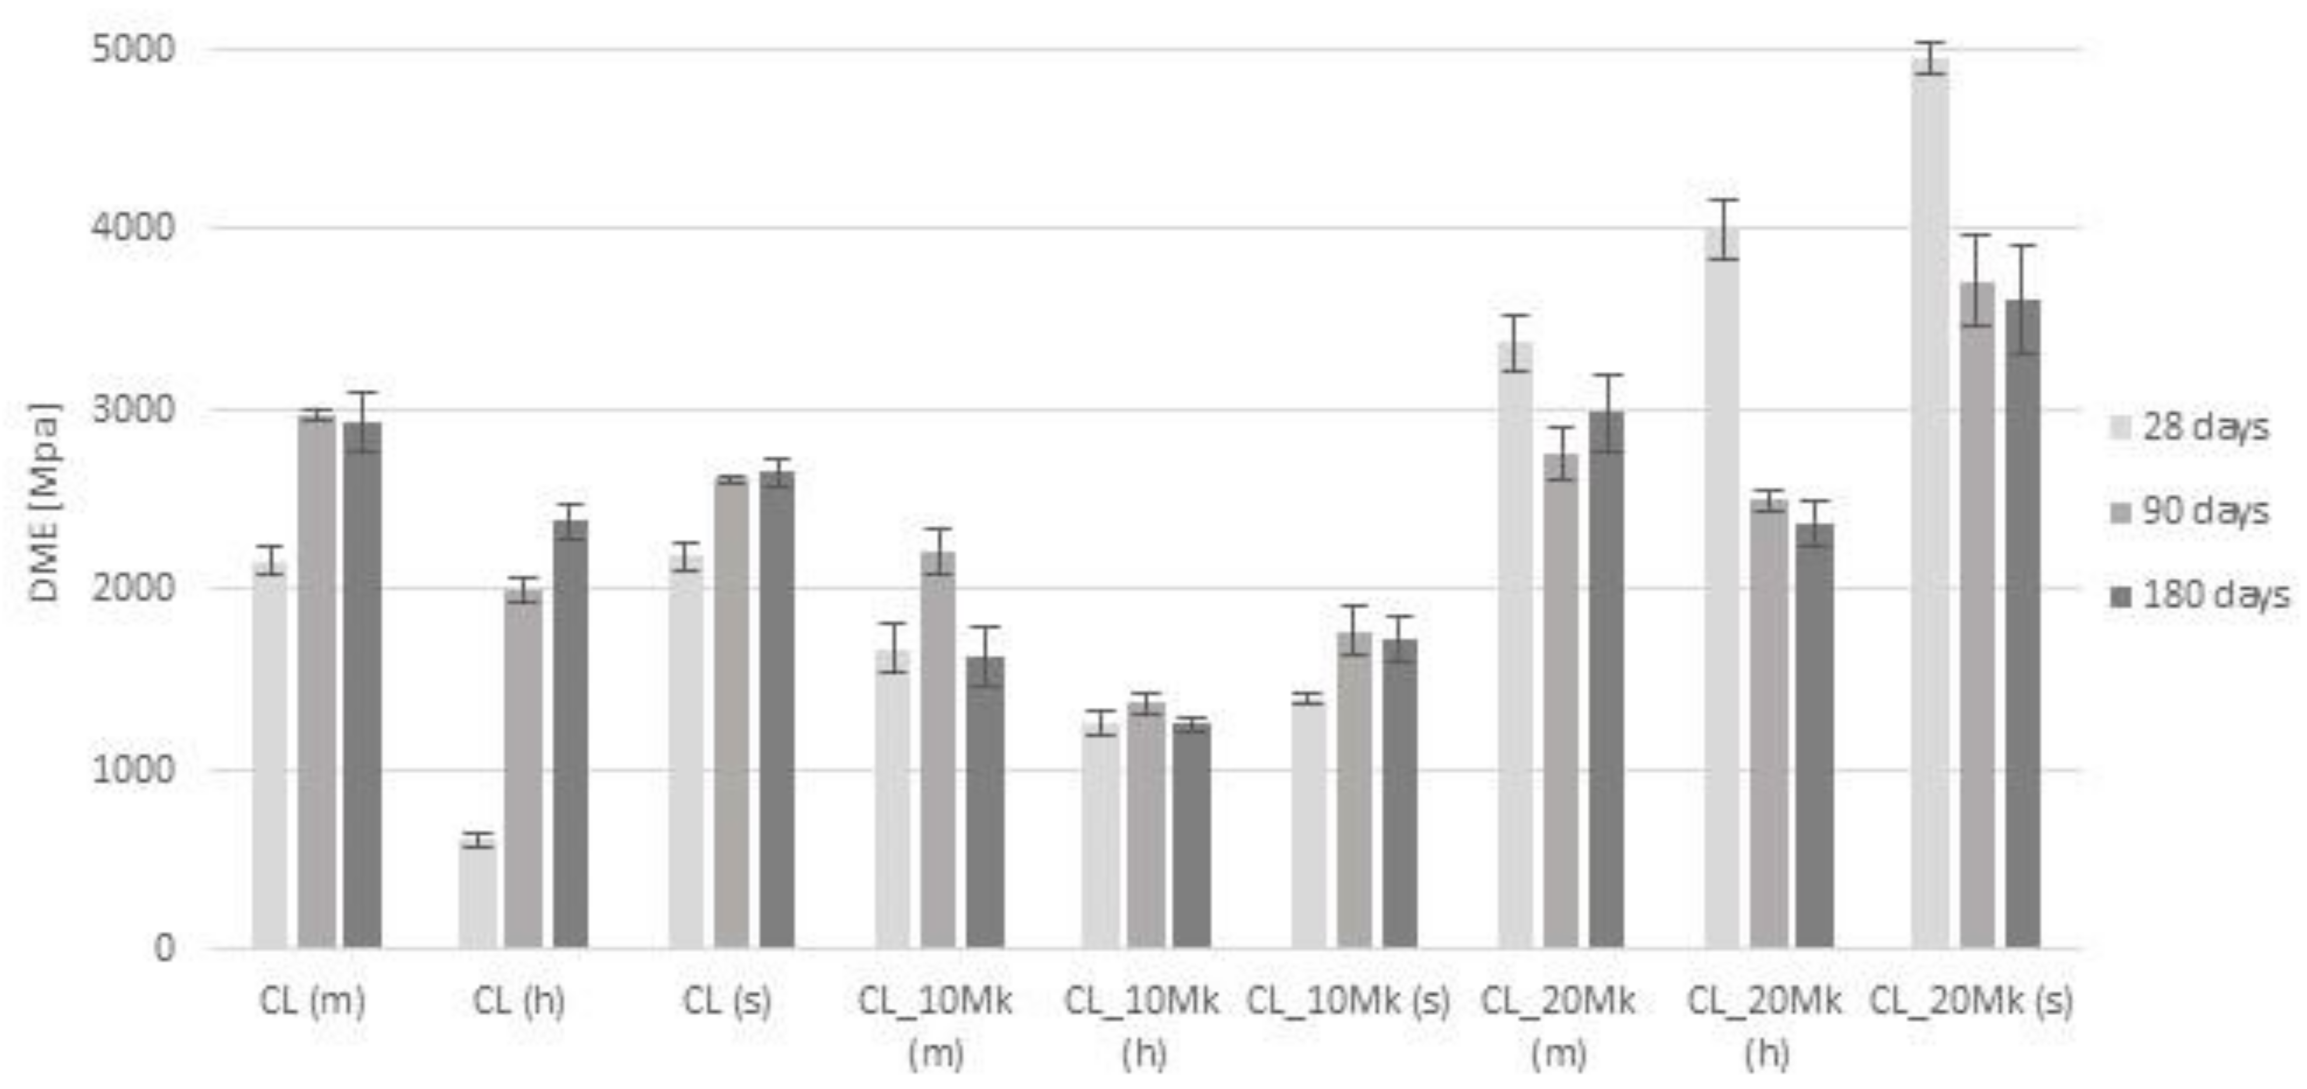
The results of the Dynamic modulus of elasticity test carried out at 28, 90 and 180 days are displayed in Figure 3.
The modulus of elasticity increased from 28 to 90 days in the mortars CL and CL_10Mk, for all types of curing conditions. On the other hand, all CL_20Mk registered a decrease in the value of DME with increasing age. It is also notable that humid curing delayed the DME of the reference air lime mortar at 1 month, and both maritime and standard curing were more adequate for that mortar. On the contrary, maritime curing seemed to optimize the DME of mortars with 10% replacement by Mk (CL_10Mk) at young ages; however, there was a decrease of DME from 3 to 6 months, although this was not so significant for the other curing conditions.
Mortars with 20% Mk replacing lime achieved the highest DME at 1 month, decreasing after 3 and 6 months; however, DME was always higher for these mortars.
Comparing the dynamic modulus of elasticity obtained in the present study with the results obtained by previous studies, it is possible to see that Andrejkovičová et al. [20], for mortars with 20% Mk, obtained very similar results compared to those present in Figure 3. Based on Loureiro et al. [21], the contents of hydraulic products of the air lime–Mk mortars with 20% Mk in comparison to the CL mortars justify the increase of the DME by the improvement of the cohesion and bonding between the particles. However, this increase was not observed in mortars with 10% substitution (Figure 3), which suggests that a higher Mk content is necessary for the hydration products to compensate for the lime replacement. Comparing the results at 90 days with mortars tested at 60 days by Faria & Martins [24], the values were in the same range. In Faria & Martins [24] study, the higher values were registered in mortars with 20% replacement of CL by Mk, in conditions with high RH and accelerated curing with CO2.
Faria et al. [25], at 28 days (a short curing period when considering lime-based mortars) and with humid curing, obtained higher values of DME with percentages of 30% and 50% of Mk. Ferraz et al. [26], for mortars with 0% of Mk, obtained an upward trend in elasticity modulus values from 28 to 90 days, especially for 30% Mk substitution, which reached the highest value of 3850 MPa. However, in the present study, the maximum value was achieved with 20% Mk at 28 days, with nearly 5000 MPa of DME, and a decrease from 28 to 90 days occurred, contradicting the results obtained by Ferraz et al. [26].
3.2.2. Flexural and Compressive Strength
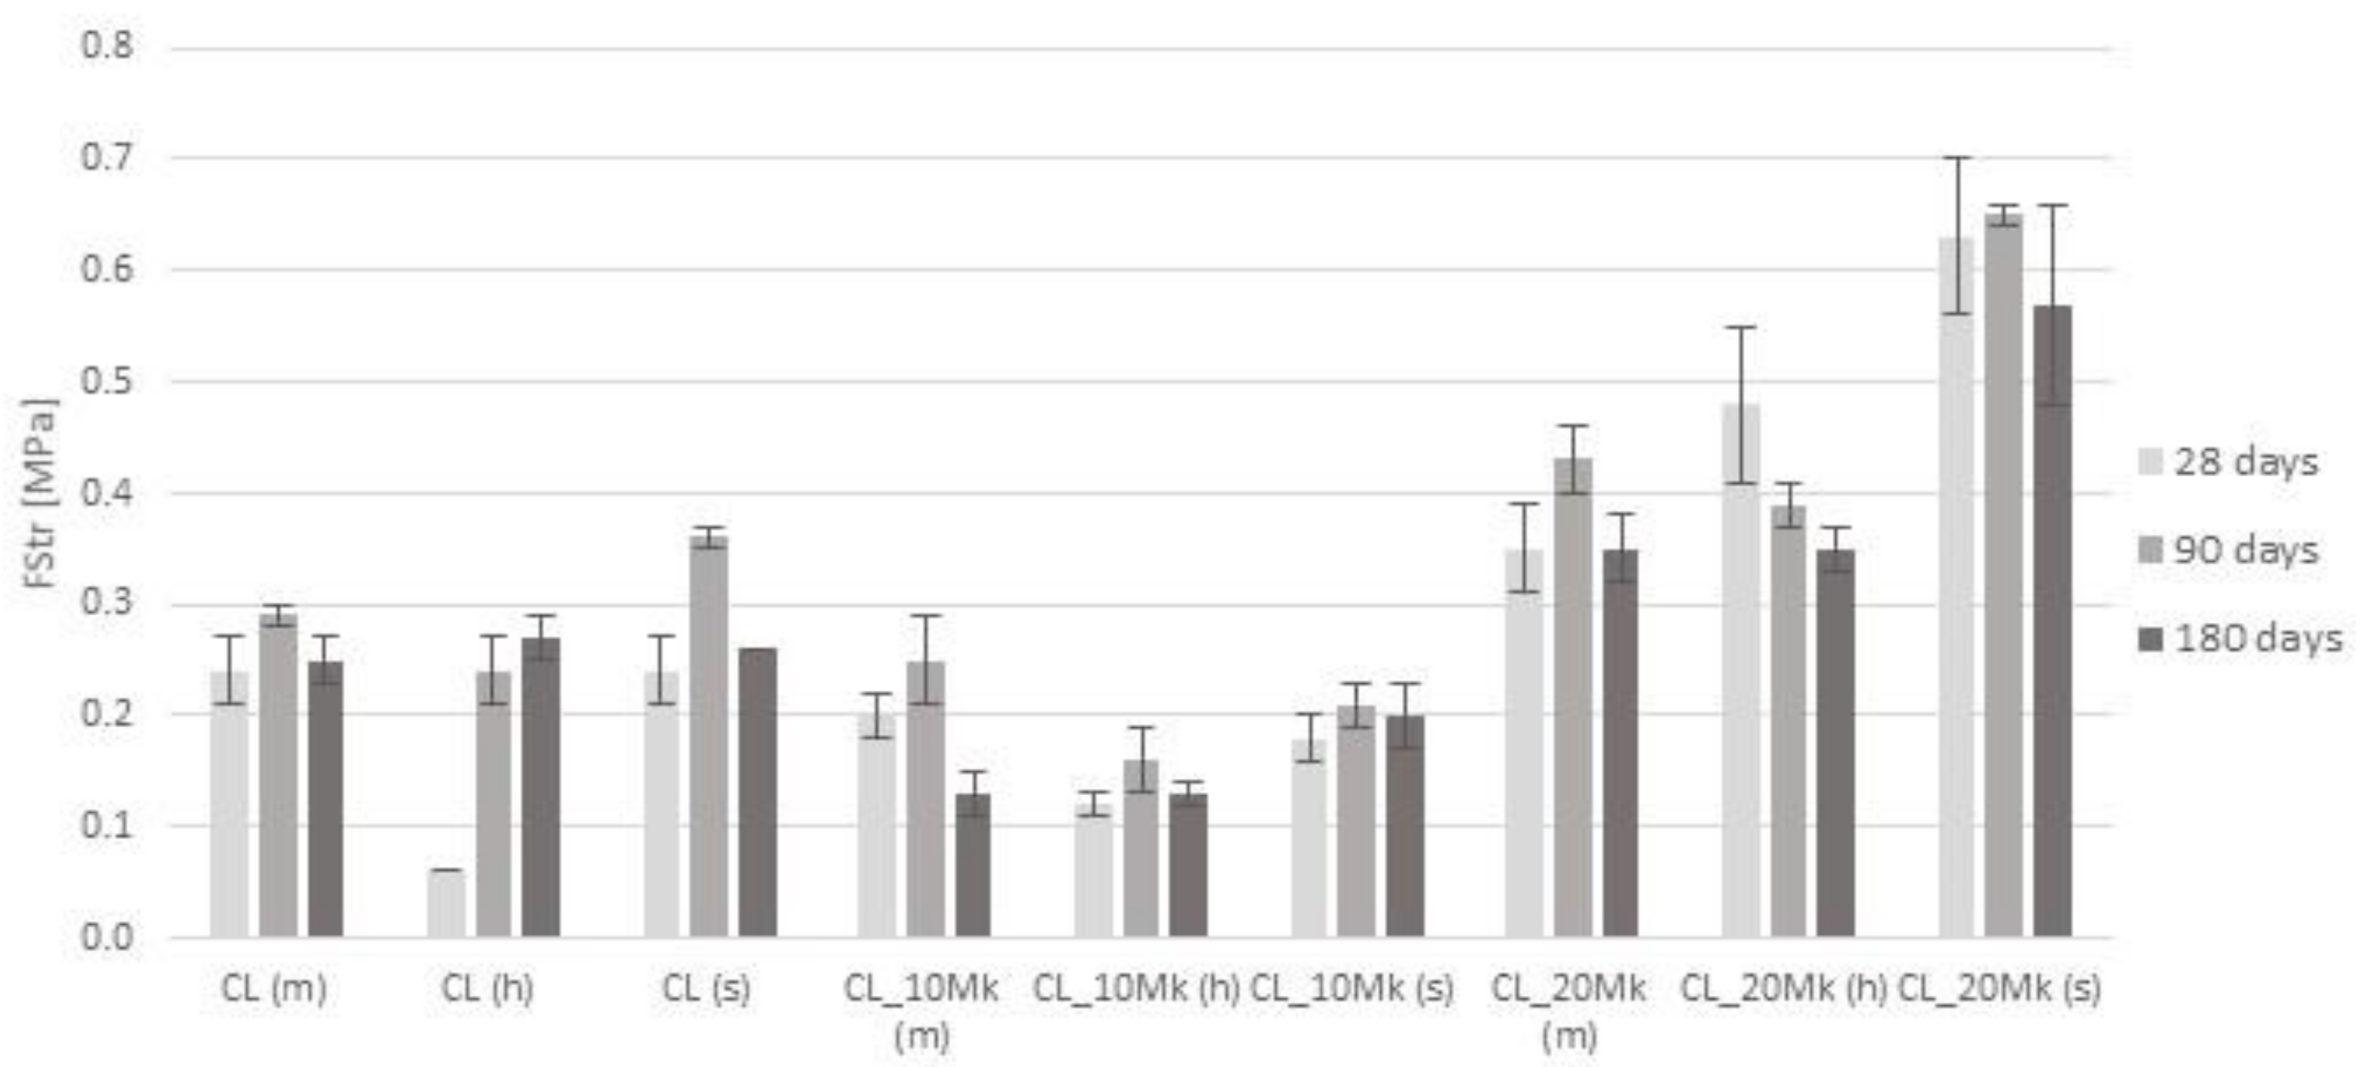
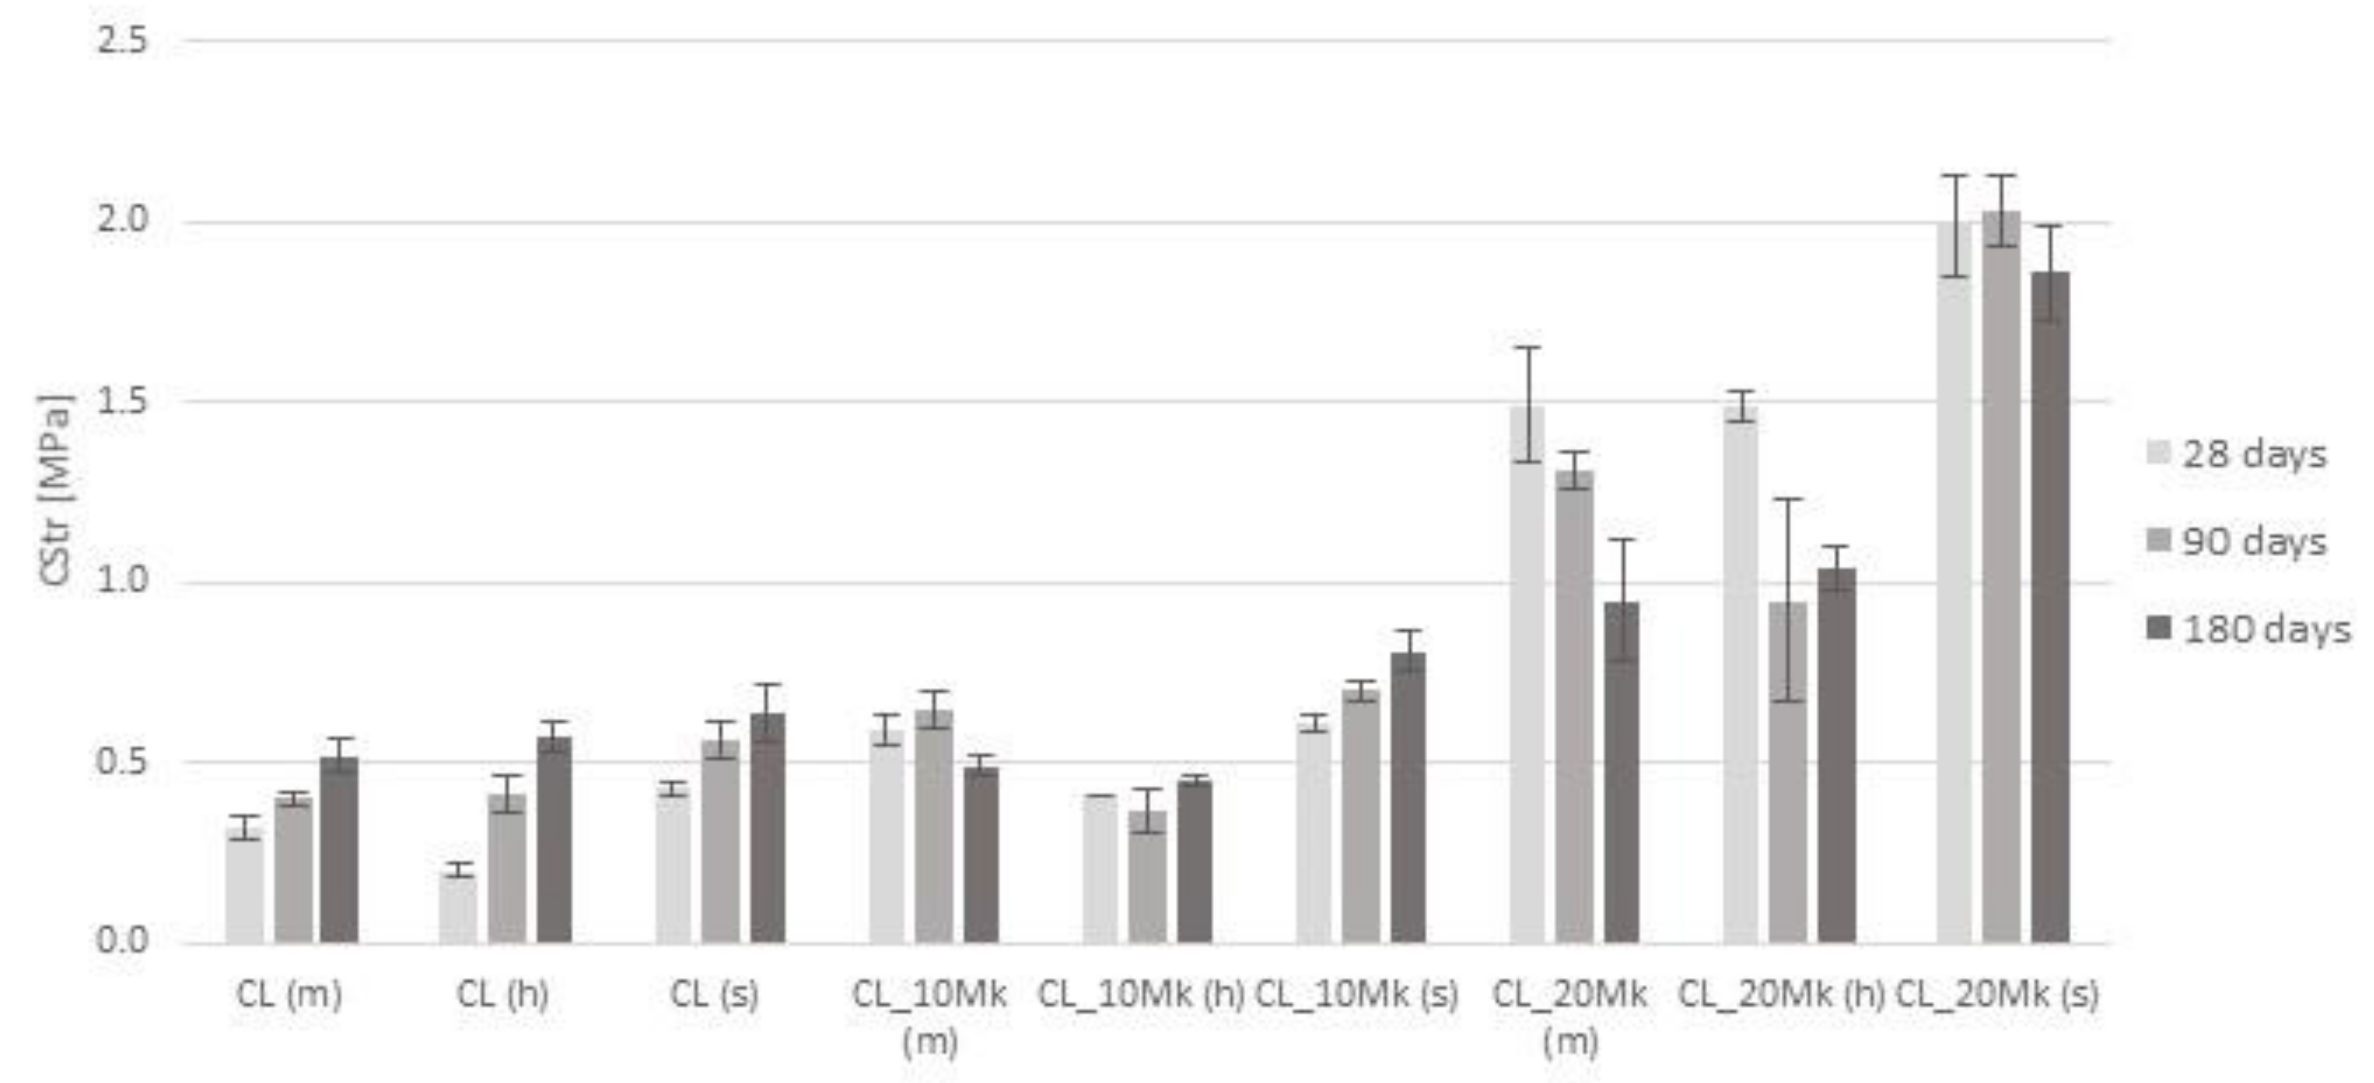
The flexural and compressive strength tests performed at 28, 90, and 180 days can be seen in Figure 4 and Figure 5, respectively.
It is possible to observe, in maritime and standard curing mortars, that the values of flexural strength increased from 28 to 90 days and decreased from 90 to 180 days. Regarding humid curing, this trend was only seen in the mortar with 10% Mk.
Both the maritime and the standard curing seemed beneficial for the reference air lime mortars, particularly after 1 month. However, there was a decrease from 3 to 6 months that did not occur with the humid curing. This curing seemed to delay the initial flexural strength of the reference and 10% Mk mortars. However, for the reference mortar, values drastically increased after 3 months.
Mortars with 20% replacement of lime by Mk achieved the highest flexural strength, particularly with the standard curing. Except for the reference mortar with humid curing, where flexural strength increased with age, and the mortar with 20% Mk with humid curing, where it decreased with age, there was always an increase from 1 to 3 months and a decrease for 6 months.
Gameiro et al. [19], for 30%, and Andrejkovičová et al. [20], for 20% of lime substitution by Mk, also obtained a decrease of flexural strength with age. This was possibly due to mortars’ shrinkage with microcracking and also due to the increase of the water/binder ratio. However, although there was a decrease in values, mortars with the presence of Mk, specifically with substitutions of 20% or more, always presented higher values of mechanical strengths over time, compared to reference mortars, which seemed to be induced by the occurrence of a pozzolanic reaction.
Figure 5 shows the result obtained for the compressive strength, and the highest values were obtained with the mortars where Mk replaced 20% of lime, for all the curing conditions and ages. However, the decrease with age was much less significant for standard curing mortars in comparison to maritime and humid curing mortars. For the reference air lime mortar, the compressive strength increased with time from 1 to 6 months, achieving the highest results with standard curing. With maritime curing, the results at 1 month were higher in comparison to the humid curing. This behaviour was also present in Pavlík & Užáková [27], where these authors obtained a significant decrease in compressive strength with the age for mortars of up to 365 days, with a binder:aggregate of 1:1 (vol.) and 50% substitutions of CL by Mk. However, the values obtained for these modified mortars were much higher than those obtained in reference mortars, showing one more time very significant mechanical improvement with Mk substitutions with mortar age. This decrease in mechanical strength can be explained by the fact that lime mortars that were cured in highly humid conditions, with feeble access to CO2, had a reduced carbonation rate. This uncarbonated lime in mortars that were in humid curing conditions justifies the decrease in compressive strength. The same behaviour was registered by Arizzi & Cultrone [28] in all mortars, with the exception of 10% substitution of lime by Mk, when an increase in compressive strength was obtained from 28 to 180 days.
Figure 5.
Compressive strength of mortars with 0, 10 and 20% Mk replacing air lime, after 28, 90 and 180 days in maritime, humid and standard curing conditions.
Figure 5.
Compressive strength of mortars with 0, 10 and 20% Mk replacing air lime, after 28, 90 and 180 days in maritime, humid and standard curing conditions.

In general, Gameiro et al. [19], Andrejkovičová et al. [20], Loureiro et al. [21], Faria & Martins [24] and Faria et al. [25] (Table 1) also obtained an increase of flexural and compressive strength with the increase of the percentage of lime substitution by Mk in all mortars. Nevertheless, Gameiro et al. [19] and Loureiro et al. [21], who performed tests on mortars with different binder:aggregate ratios, obtained a decrease of mechanical strength with the decrease of the binder:aggregate ratio, which could be induced, as in compressive tests, by mortars shrinkage with microcracking and also due to the increase of the water/binder ratio
Faria et al. [25], for substitutions of 30 and 50%, concluded that humid curing proved to be unfavorable for mechanical characteristics compared to standard curing, and the same occurred in the present study for 10 and 20%. As in the compressive strength test, this behaviour could also be explained by the lack of contact with CO2, causing a lower carbonation rate.
Cardoso et al. [22] concluded that pure lime mortars (CL mortars) have much higher mechanical behaviour than 9% Mk mortars, of nearly more than 80%. In the present study, something similar was found, although in a smaller percentage, with CL and CL_10Mk. It seemed that too low percentages of lime replacement by Mk could have a beneficial effect on the initial hardening period but could lead to mortars with reduced strength, with this behaviour being more visible in the flexural strength tests (Figure 4).
Unlike other studies, Ferraz et al. [26] stated that 10–30 wt.% Mk does not promote a significant influence on flexural and compressive strength, especially at 28 days of curing. It is noteworthy that for these authors, reference mortars with 0% Mk had a slight increase with age, but in mortars with Mk, there was also a slight decrease in mechanical characteristics from 90 to 180 days.
3.2.3. Carbonation
The qualitative results for the carbonation of all mortars after 90 days of curing are presented in Figure 6. Analyzing the results, it could be concluded that carbonation was much faster for standard curing reference air lime mortar, followed by maritime curing mortars and humid curing mortars. This behaviour was also observed in mortars with 10% and 20% Mk replacing lime. It is feasible to say that in mortars with Mk, the highest carbonation occurred in standard curing and the lowest in humid curing. However, it is likely that pozzolanic reaction may have caused pH changes, which may have masked the results.
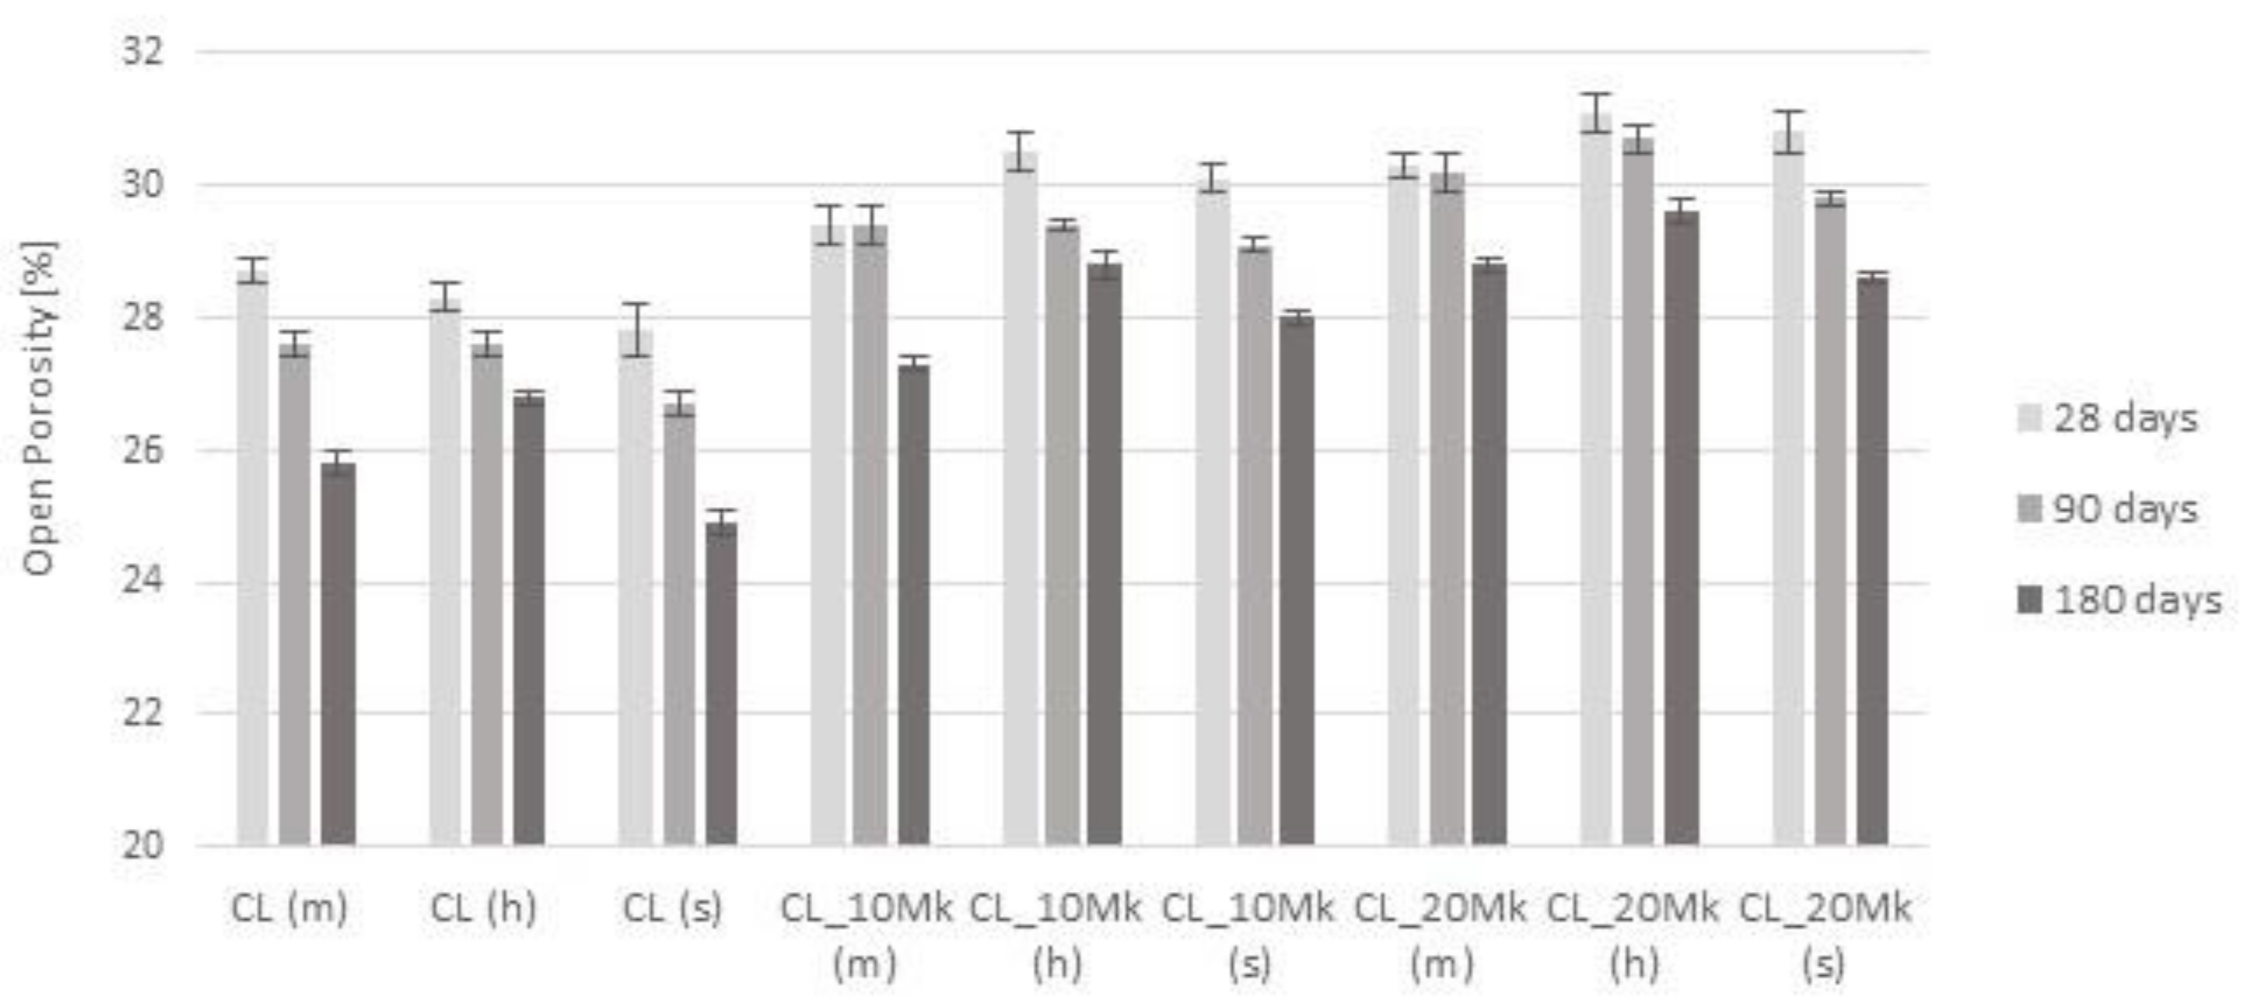
3.2.4. Open Porosity and Dry Bulk Density
The obtained results for the open porosity of all the mortars after 28, 90 and 180 days of different types of curing are presented in Figure 7. It can be observed that the open porosity increased when Mk was incorporated into the mortars. Humid curing presented the highest average value across all ages, and the standard cure showed the lowest average value at 90 and 180 days. Open porosity also decreased in every mortar from 1 to 6 months, except for CL_10 Mk (m), which kept its value from 1 to 3 months. The mortars where Mk replaced 20% of lime registered the highest values, meaning that the total volume of interconnected pores was higher than the reference mortars (CL) and the mortars where Mk replaces 10% of lime.
Loureiro et al. [21] also obtained similar results in the range of 28% for mortars with substitutions of 0% at 90 days. For 25 and 30% of lime substitution by Mk, results in the range of 27–29% were obtained, similar to those in Figure 7. Loureiro et al. [21] obtained the lowest values of porosity in the mortar only with air lime, similar to the results obtained in Figure 7, where CL (s) had the lowest value at 90 days of age. According to the same author, mortars with Mk were more cohesive than the air lime mortars but had a similar microstructure (in terms of void numbers) to the mortars without Mk.
Faria et al. [25], for 25%, 30% and 50% of lime substitution by Mk, obtained results in the same range as those present in Figure 6, with porosity slightly increasing with the increase of Mk. However, Arizzi & Cultrone [28] declared that the pore system of mortars with and without Mk presented similar open porosity values in the range of 31%. Despite the presence of Mk generating a new family of pores, whose volume increases at increasing Mk amounts [42], reference mortars also have a low volume of pores in the same range of the radius [43], translating into minimal differences of porosity.
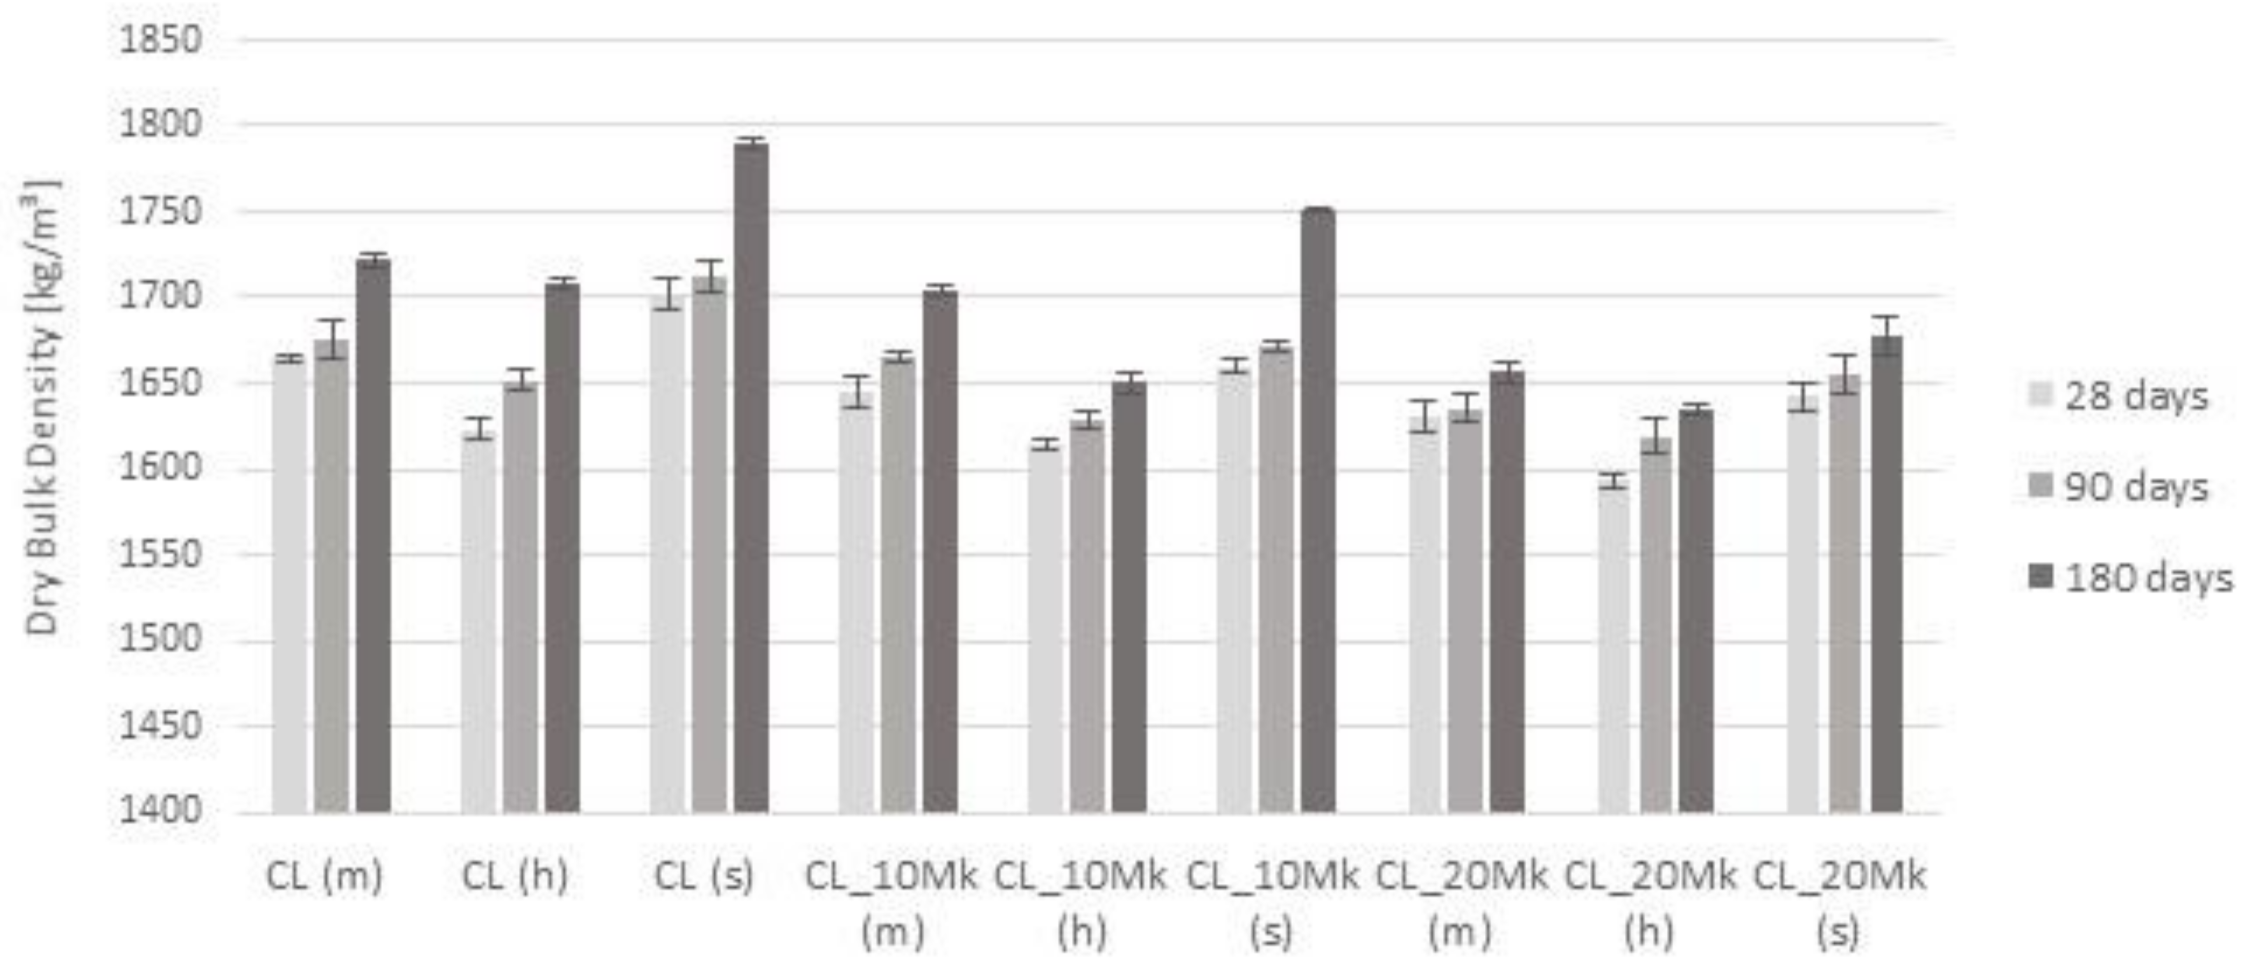
Figure 8 presents the results of dry bulk density obtained in the present study. It was possible to identify a trend, where bulk density increased from 1 to 6 months in all of the analyzed mortars. The reference mortar showed higher values than mortars where Mk replaced 10% and 20% of the binder, as expected, since mortars CL_10Mk and CL_20Mk (regardless of the curing) obtained higher values in the open porosity test. The variation in porosity and bulk density does not explain the different mechanical results obtained for the tested mortars.
Figure 7.
Open porosity of mortars with 0, 10 and 20% Mk replacing air lime, after 28, 90 and 180 days in maritime, humid and standard curing conditions.
Figure 7.
Open porosity of mortars with 0, 10 and 20% Mk replacing air lime, after 28, 90 and 180 days in maritime, humid and standard curing conditions.

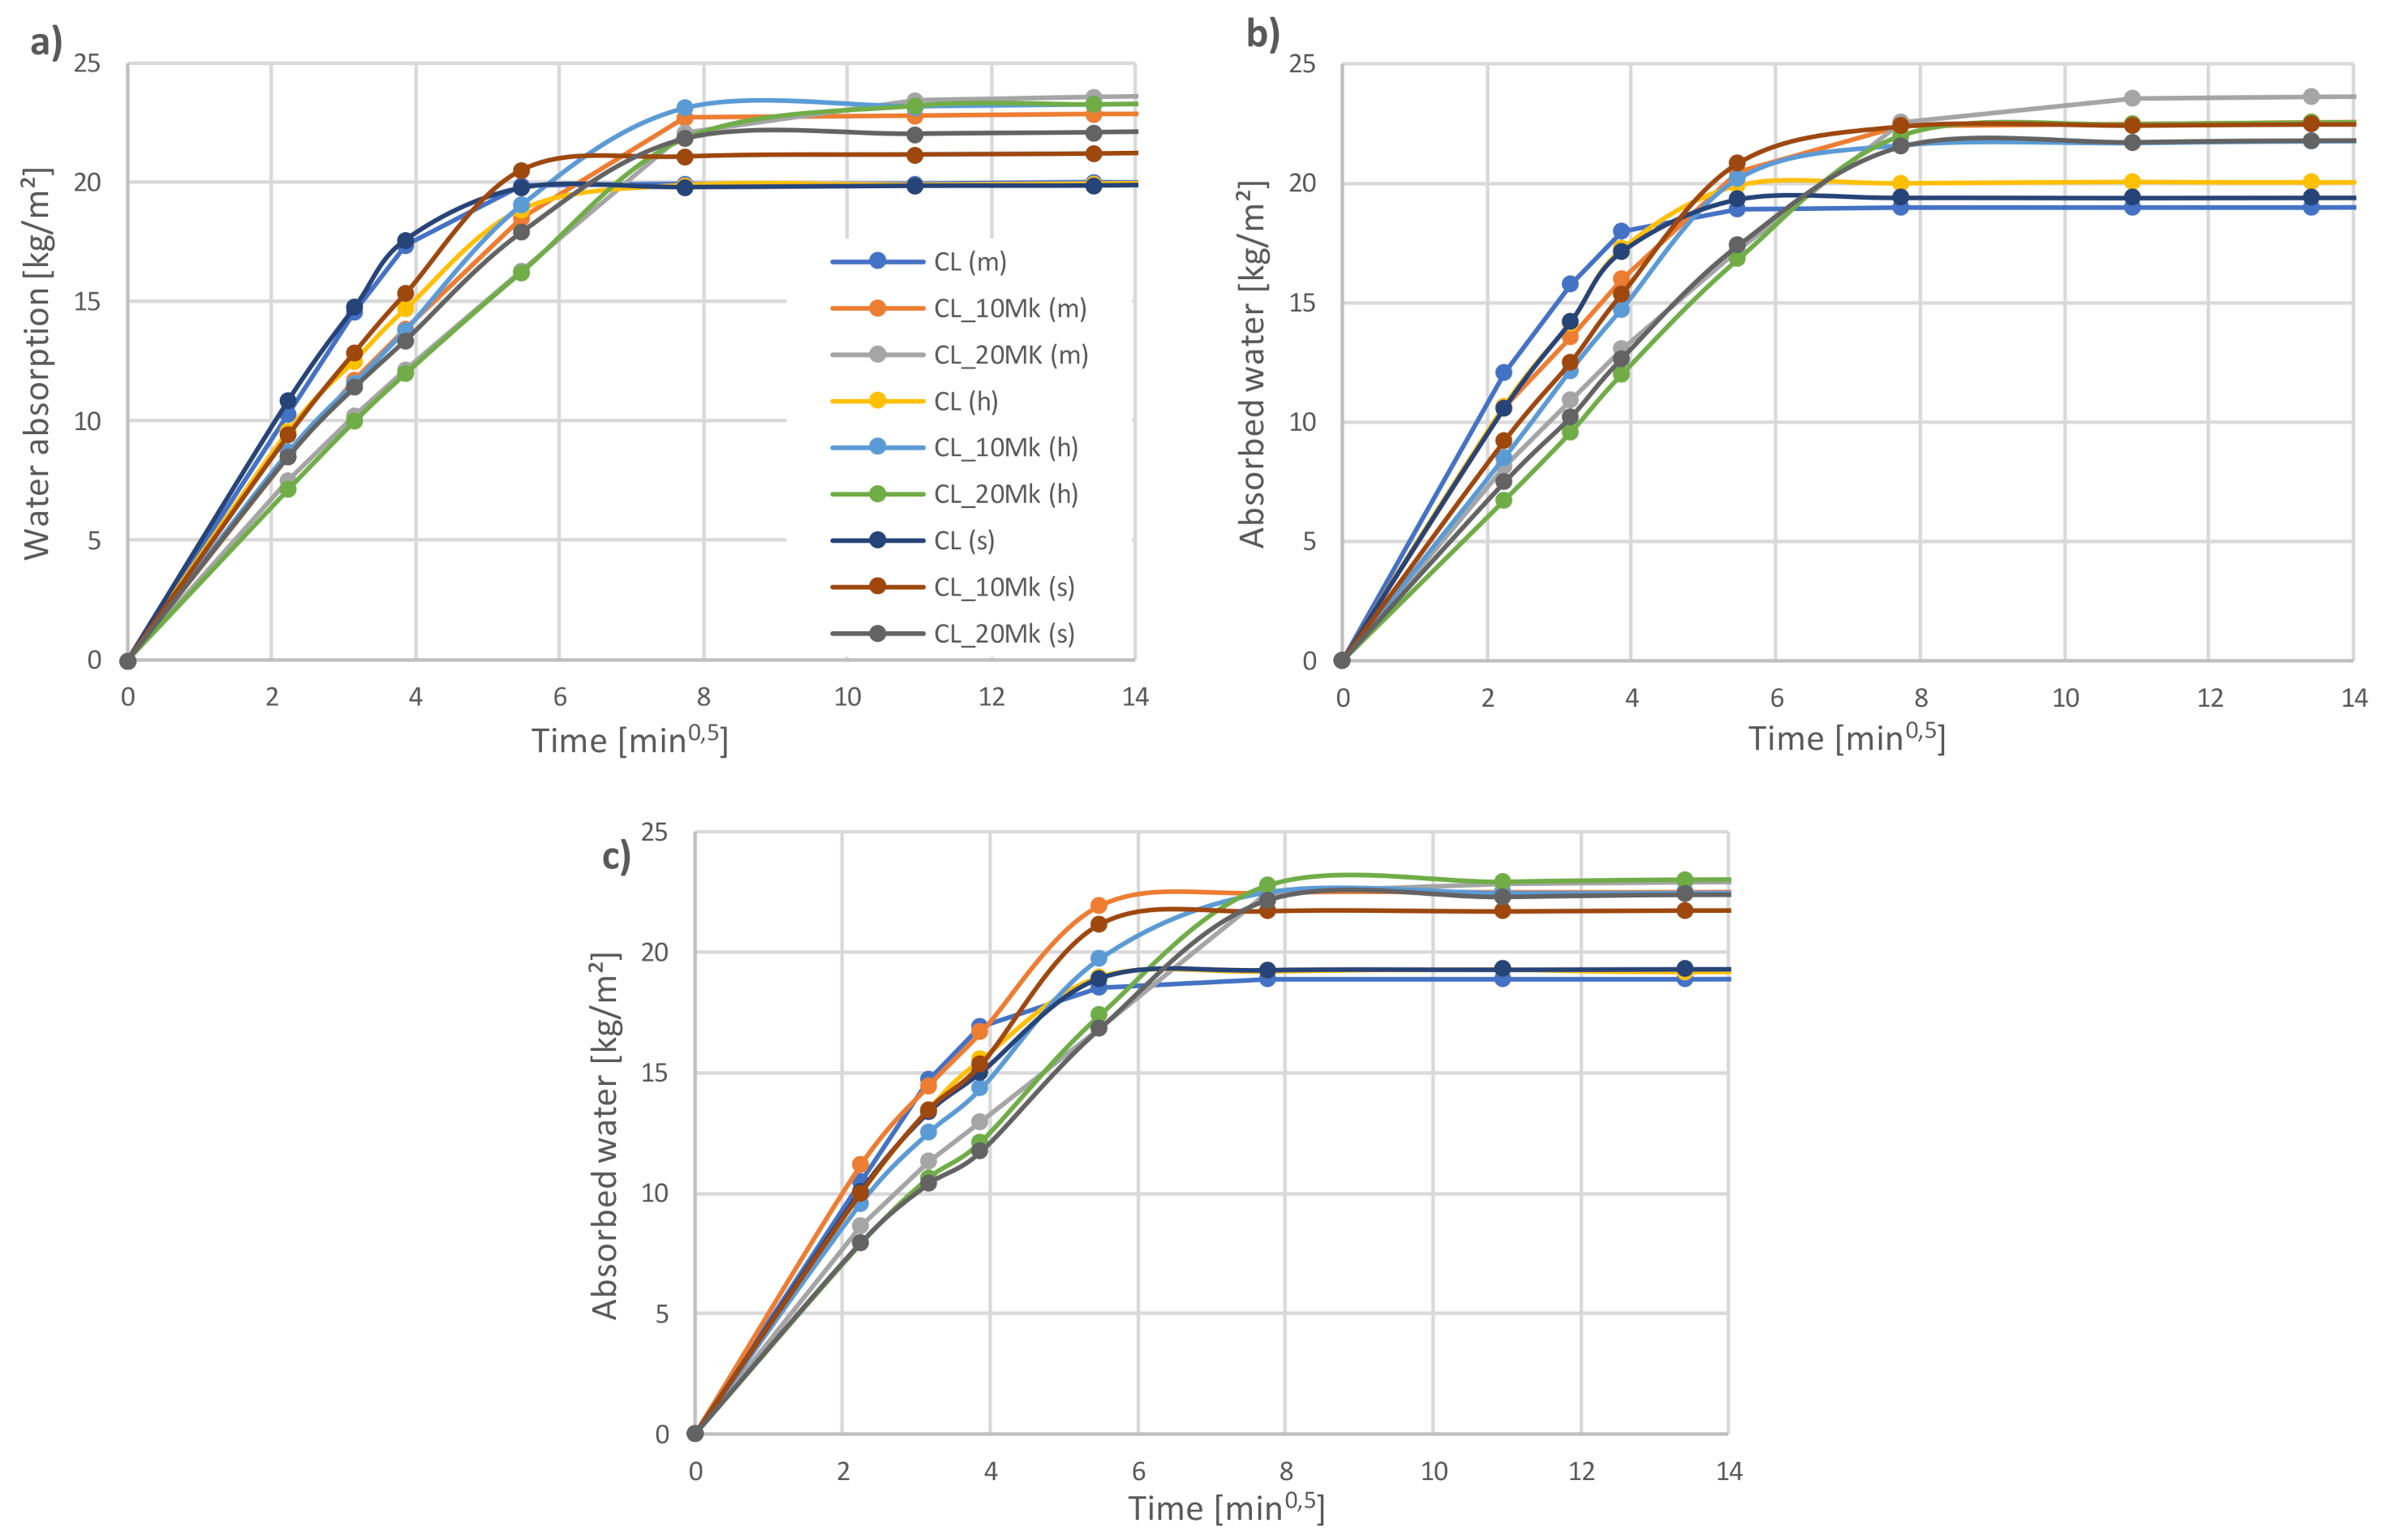
3.2.5. Capillary Water Absorption
The average capillarity curves of mortars at 28, 90 and 180 days of curing can be seen in Figure 9. At 28 days, both the maritime and standard curing for the CL mortar presented an increase in the initial rate, but in the total absorbed water absorption, they stabilized at lower values. Mortars with 20% replacement of lime by Mk, concretely CL_20 Mk (m) and CL_20 Mk (h), exhibited the opposite behaviour, presenting a slower absorption rate in the initial phase, but they stabilized at higher values of the total absorbed water. At 90 days and 180 days, it was also visible that mortars where Mk replaced 10% and 20% of the lime had a slower absorption in the first phase, compared to the reference mortars (CL), and they also presented higher values of the total absorbed water. It was also verified in all ages that the mortars submitted to humid curing had an increase in the initial rate and lower values of the total absorbed water, compared to maritime and standard curing. As can be seen in Table 5, with the introduction of Mk, a decrease in the initial rate existed, shown by the capillarity coefficient (CC), and so did an increase in the total absorbed water, shown by the Capillary saturation value (Cs). At 28 days, the reference mortars (CL) represented the worst cases of the capillarity coefficient, due to the faster ratio of water absorption. At 90 and 180 days, an increase of the CC was visible in humid curing compared to the others. Higher asymptotic values were achieved in CL_10Mk (m) and CL_20Mk (m) at 90 days.
In general, similar results of Cs were obtained by Faria et al. [25] and Faria & Martins [24], where the total absorbed water was higher for air lime mortars with Mk, and the capillary coefficient was lower when Mk partially substituted the lime. With the exception of mortars with 20% substitution of lime by Mk and in conditions of humid curing, Faria & Martins [24] obtained a decrease of total capillary water absorption when Mk was used, contradicting the results presented in Table 5, for CL_20Mk (h). However, Faria & Martins [24] and Faria et al. [25] presented lower values for CC, revealing slower absorption rates in the initial phase of drying.
3.2.6. Drying
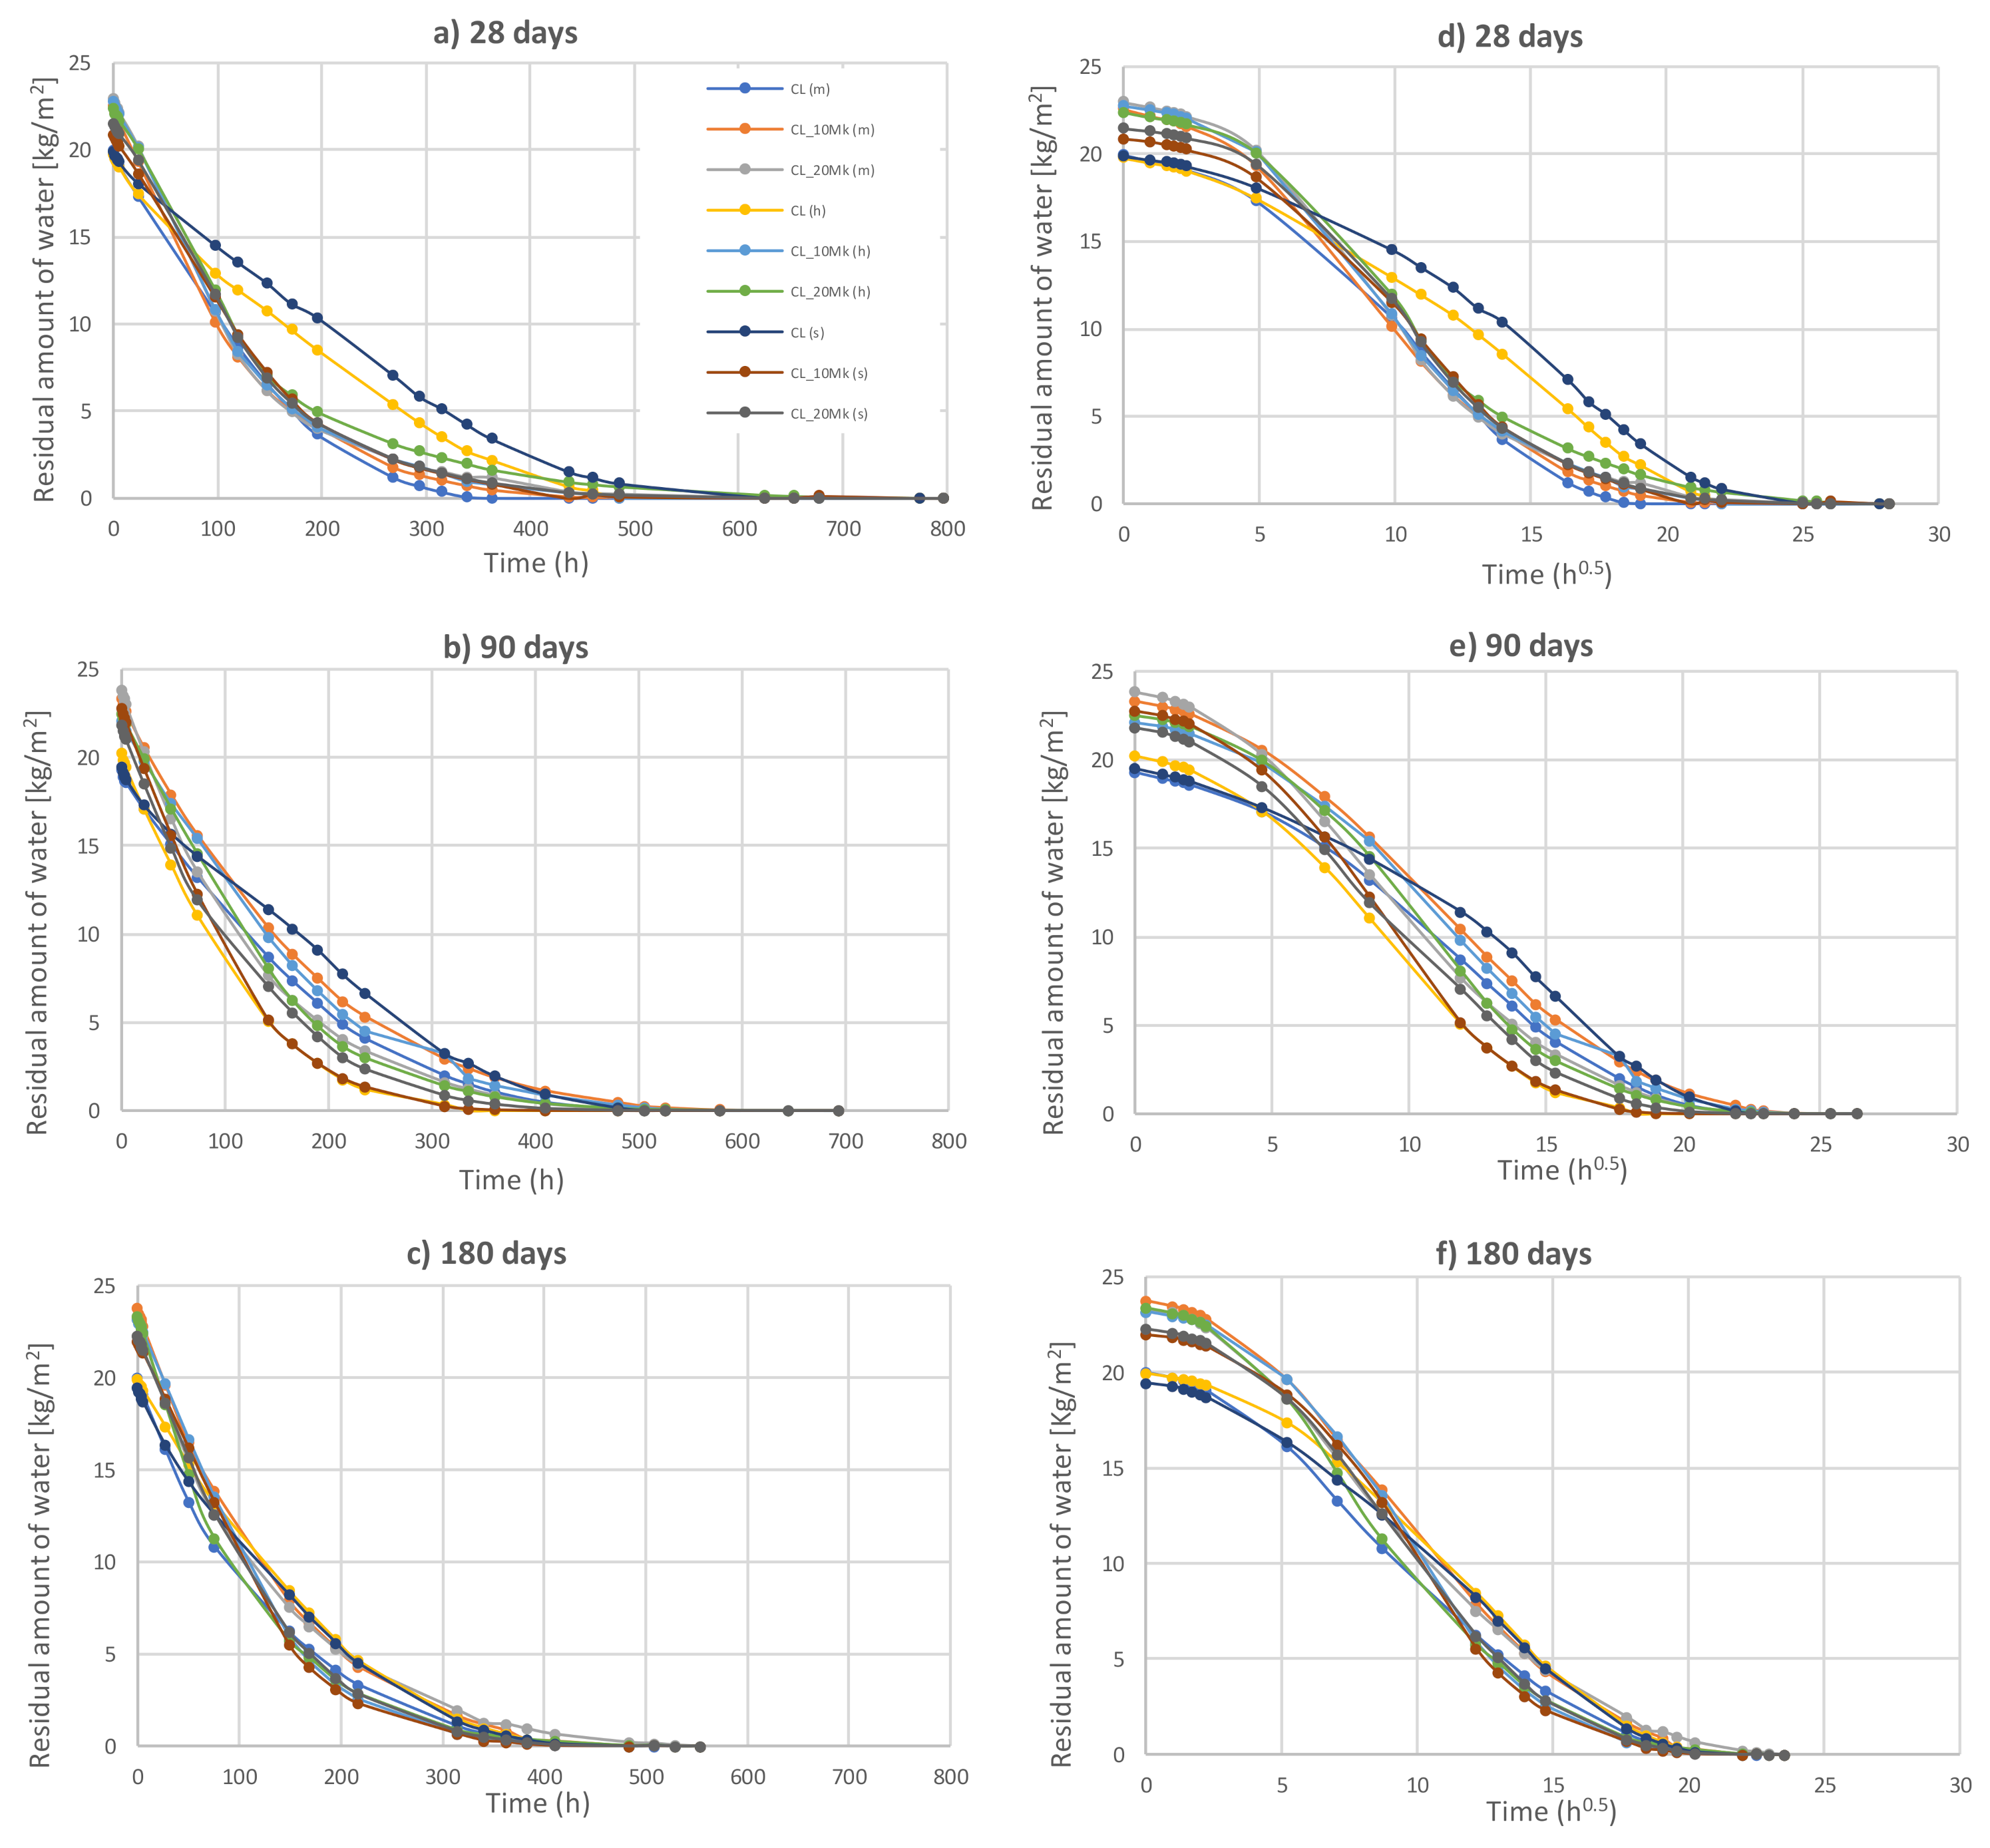
Is important to know how mortars lose the water that they have absorbed to better understand their future performance in terms of durability. A high drying capacity can improve a mortar’s durability, avoid the appearance of fungi [44] and contribute to salts’ transport to the surface. The drying curves of phase 1 and phase 2 at 28, 90 and 180 days, are presented in Figure 10.
Through the linear segments of the curves by time and by square root of time, it was possible to determine the first drying rate (D1) and the second drying rate (D2), respectively, as shown in Table 6. D1 is normally associated with the release of water, in the first drying stage, and D2 is related with the release of vapor in a more advanced drying phase.
At 28 days, maritime curing seemed to induce mortars to have the highest drying rates of the 1st phase (D1), meaning an increase in the release of water, in comparison to humid and standard curing conditions. D2 seemed to increase with the addition of Mk at this early age. As an absolute value, the highest ratios of D2 were observed in CL_10Mk(h) and CL_10Mk(s), meaning an increase in the evaporation rate due to improved diffusion. However, mortars with 10% substitution showed inconstant results over time.
Loureiro et al. [21], analyzing the drying rates of mortars with the same binder:aggregate ratio and 25% substitution of air lime by Mk (Table 1), achieved very different results when compared to those obtained in Table 6. According to the same author, mortars with a low binder content show a shorter D2, because that content may have favored the formation of larger pores, which results in a great loss of moisture during phase D1.
Table 6.
Values of drying rates for the first (D1) and second (D2) drying phases of mortars with 0, 10 and 20% Mk replacing air lime, after 28, 90 and 180 days in maritime, humid and standard curing conditions.
Table 6.
Values of drying rates for the first (D1) and second (D2) drying phases of mortars with 0, 10 and 20% Mk replacing air lime, after 28, 90 and 180 days in maritime, humid and standard curing conditions.
| Mortar (Curing) | Drying Rate, 1st Phase (D1) (kg/m2·h) | Drying Rate, 2nd Phase (D2) (kg/m2·h0.5) | ||||
|---|---|---|---|---|---|---|
| 28 Days | 90 Days | 180 Days | 28 Days | 90 Days | 180 Days | |
| CL (m) | 0.144 | 0.162 | 0.178 | 1.710 | 1.335 | 1.326 |
| CL_10Mk (m) | 0.163 | 0.166 | 0.176 | 1.472 | 1.534 | 1.639 |
| CL_20Mk (m) | 0.138 | 0.193 | 0.173 | 1.822 | 1.695 | 1.473 |
| CL (h) | 0.123 | 0.183 | 0.112 | 1.075 | 1.736 | 1.374 |
| CL_10Mk (h) | 0.124 | 0.147 | 0.133 | 1.779 | 1.642 | 2.080 |
| CL_20Mk (h) | 0.116 | 0.141 | 0.183 | 1.910 | 1.840 | 1.606 |
| CL (s) | 0.098 | 0.167 | 0.143 | 1.033 | 1.399 | 1.262 |
| CL_10Mk (s) | 0.113 | 0.176 | 0.112 | 1.759 | 1.960 | 2.066 |
| CL_20Mk (s) | 0.095 | 0.184 | 0.143 | 1.805 | 1.474 | 1.759 |
3.3. Application for New Construction and for Rehabilitation and Conservation Purposes
According to the European standard for mineral binder renders and plasters, EN 998-1 [45], mortar CL_20Mk (s) may be classified as CS II, having a compressive strength between 1.5–5.0 N/mm2 at 28 days. Although air lime-based renders and plasters may not be adequate for cement-based walls, they are clearly adequate for eco-efficient walls, such as contemporaneous rammed earth, cob, wattle and daub, earth blocks masonry and straw bale masonry. To develop more sustainable mortars with properties that are compatible with the rehabilitation of old buildings, it is important to compare them with studies that present the characteristics that mortars must have for rehabilitation. Veiga et al. [1] recommend a range of values for mortars for old buildings at 90 days. The CL_20Mk (s) mortar presented results in the ranges adequate to be used as plastering and rendering mortars and as repointing mortars: flexural strength of 0.2–0.7 N/mm2 for renders and plasters and 0.4–0.8 N/mm2 for repointing; compressive strength of 0.4–2.5 N/mm2 for renders/plasters and 0.6–3.0 N/mm2 for repointing; the dynamic modulus of elasticity of 2000–5000 N/mm2 for renders/plasters and 3000–6000 N/mm2 for repointing. However, the capillarity coefficient (CC) was not within the recommended limits. To lower the CC value, the sand mixture should probably have an increase of finer sand (APAS 30) or the introduction of a compatible hydrophobic admixture [46,47].
4. Conclusions
This paper aimed to contribute to the existing knowledge on air lime mortars with a volumetric binder:aggregate ratio of 1:2, considering the effects of substitutions of lime by metakaolin (Mk) in percentages of 10% and 20%, subjected to different curing conditions (maritime, humid and standard) for up to 180 days of age. The objective was to assess the effect that lime replacement by these percentages of Mk may have on the mortar’s performance and future durability at these young ages and to assess if the different tested curing conditions can significantly influence the results. The following conclusions were obtained:
- ▪ As the replacement level in air lime mortars increased, compressive and flexural strengths also increased. However, the 10% substitution (CL_10Mk) proved not to be optimized and revealed inconsistent results. The lack of consistency in the results meant that, in most cases, the properties of these mortars were worse than the reference ones (CL), which may justify further investigation.
- ▪ From the studied percentages, it could be concluded that in air lime mortars with proportions of 1:2 (vol.), only replacements of 20% of lime by Mk effectively improved the overall behaviour.
- ▪ Standard curing at (65 ± 5)% RH had a positive influence on mechanical strength parameters but a negative influence on water behaviour.
- ▪ Humid curing, close to saturated RH, showed a negative influence in mechanical strength tests, mainly durinb the initial ages of some mortars, but it had superior performance related to water. This could be due to the hydration between calcium hydroxide and the Mk silicates, which is slow, competing with the carbonation of the calcium hydroxide itself, which may be blocked by water layers at the mortar surface.
- ▪ Curing by the Atlantic Ocean, with salts contamination, had a negative impact on longer-term mechanical strength values (tested up to 180 days) and a negative effect on water behaviour, especially on drying. However, it will be important to continue assessing the mortar’s performance after further ageing and, if possible, on experimental rendered panels and case studies.
- ▪ From the present study and in comparison with results from literature, mortars with 20% Mk seem promising and should be further studied.
The Mk used was a commercial one, and the production process was not known. However, the firing of the kaolins to produce Mk does not surpass the firing of air lime (maximum 900 °C) and may even be reduced by up to 50% (to 600 °C). Furthermore, the kaolins used could be residues from other industries, such as from washed sands. Therefore, the technical characteristics of air lime–Mk mortars may be associated with the ecological aspect of formulation mortars with less embodied energy. Hence, there may be ecological advantages of using air lime–Mk mortars, not only in the rehabilitation of heritage buildings, but also as rendering and plastering mortars for new buildings.
In future work, it will be interesting to assess the effect of highly polluted environments, namely with contact with SO2.
Author Contributions
Conceptualization, P.F.; methodology, P.F.; validation, J.M.; formal analysis, J.M.; investigation, J.M. and V.S.; resources, P.F.; data curation, J.M. and V.S.; writing—original draft preparation, review and editing, J.M. and P.F.; visualization, J.M.; supervision, P.F.; project administration, P.F.; funding acquisition, P.F. All authors have read and agreed to the published version of the manuscript.
Funding
This research was funded by national funds from the Portuguese Foundation for Science and Technology by supporting the Civil Engineering Research and Innovation for Sustainability Unit—CERIS (project UIDB/04625/2020).
Institutional Review Board Statement
Not applicable.
Informed Consent Statement
Not applicable.
Data Availability Statement
The data that support the findings of this study are available from the corresponding author upon reasonable request.
Acknowledgments
Acknowledgements are due to Duarte Vargas for the mortar testing campaign.
Conflicts of Interest
The authors declare no conflict of interest. The funders had no role in the design of the study; in the collection, analyses or interpretation of data; in the writing of the manuscript or in the decision to publish the results.
References
- Veiga, M.D.R.; Fragata, A.; Velosa, A.; Magalhães, A.C.; Margalha, G. Lime-Based Mortars: Viability for Use as Substitution Renders in Historical Buildings. Int. J. Arch. Herit. 2010, 4, 177–195. [Google Scholar] [CrossRef]
- Veiga, R. Air lime mortars: What else do we need to know to apply them in conservation and rehabilitation interventions? A review. Constr. Build. Mater. 2017, 157, 132–140. [Google Scholar] [CrossRef]
- Botas, S.; Veiga, R.; Velosa, A.; Silva, A.S. Compatible Air Lime Mortars for Historical Tiled Facades: Bond and Mechanical Strength versus Tile–Mortar Interface Microstructure. J. Mater. Civ. Eng. 2020, 32, 04020112. [Google Scholar] [CrossRef]
- da Fonseca, B.S.; Pinto, A.F.; Silva, D.V. Compositional and textural characterization of historical bedding mortars from rubble stone masonries: Contribution for the design of compatible repair mortars. Constr. Build. Mater. 2020, 247, 118627. [Google Scholar] [CrossRef]
- Forster, A.M.; Válek, J.; Hughes, J.; Pilcher, N. Lime binders for the repair of historic buildings: Considerations for CO2 abatement. J. Clean. Prod. 2019, 252, 119802. [Google Scholar] [CrossRef]
- Nogueira, R.; Pinto, A.P.F.; Gomes, A. Design and behavior of traditional lime-based plasters and renders. Review and critical appraisal of strengths and weaknesses. Cem. Concr. Compos. 2018, 89, 192–204. [Google Scholar] [CrossRef]
- Válek, J.; Hughes, J.J.; Pique, F.; Gulotta, D.; Van Hees, R.; Papayiani, I. Recommendation of RILEM TC 243-SGM: Functional requirements for surface repair mortars for historic buildings. Mater. Struct. 2019, 52, 28. [Google Scholar] [CrossRef]
- Damas, A.L.; Veiga, M.D.R.; Faria, P.; Silva, A.S. Characterisation of old azulejos setting mortars: A contribution to the conservation of this type of coatings. Constr. Build. Mater. 2018, 171, 128–139. [Google Scholar] [CrossRef] [Green Version]
- Segura, J.; Aponte, D.; Pelà, L.; Roca, P. Influence of recycled limestone filler additions on the mechanical behaviour of commercial premixed hydraulic lime based mortars. Constr. Build. Mater. 2019, 238, 117722. [Google Scholar] [CrossRef]
- Pachta, V.; Marinou, P.; Stefanidou, M. Development and testing of repair mortars for floor mosaic substrates. J. Build. Eng. 2018, 20, 501–509. [Google Scholar] [CrossRef]
- Pozo-Antonio, J. Evolution of mechanical properties and drying shrinkage in lime-based and lime cement-based mortars with pure limestone aggregate. Constr. Build. Mater. 2015, 77, 472–478. [Google Scholar] [CrossRef]
- Papayianni, I.; Stefanidou, M. Durability aspects of ancient mortars of the archeological site of Olynthos. J. Cult. Herit. 2007, 8, 193–196. [Google Scholar] [CrossRef]
- Matias, G.; Faria, P.; Torres, I. Lime mortars with ceramic wastes: Characterization of components and their influence on the mechanical behaviour. Constr. Build. Mater. 2014, 73, 523–534. [Google Scholar] [CrossRef]
- Mansour, M.S.; Kadri, E.-H.; Kenai, S.; Ghrici, M.; Bennaceur, R. Influence of calcined kaolin on mortar properties. Constr. Build. Mater. 2010, 25, 2275–2282. [Google Scholar] [CrossRef]
- Borsoi, G.; Silva, A.S.; Menezes, P.; Candeias, A.; Mirão, J. Analytical characterization of ancient mortars from the archaeological roman site of Pisões (Beja, Portugal). Constr. Build. Mater. 2019, 204, 597–608. [Google Scholar] [CrossRef] [Green Version]
- Alvarez, J.I.; Veiga, R.; Martínez-Ramírez, S.; Secco, M.; Faria, P.; Maravelaki, P.N.; Ramesh, M.; Papayianni, I.; Válek, J. RILEM TC 277-LHS report: A review on the mechanisms of setting and hardening of lime-based binding systems. Mater. Struct. 2021, 54, 1–30. [Google Scholar] [CrossRef]
- Elavarasan, S.; Priya, A.; Ajai, N.; Akash, S.; Annie, T.; Bhuvana, G. Experimental study on partial replacement of cement by metakaolin and GGBS. Mater. Today: Proc. 2020, 37, 3527–3530. [Google Scholar] [CrossRef]
- Raheem, A.; Abdulwahab, R.; Kareem, M. Incorporation of metakaolin and nanosilica in blended cement mortar and concrete—A review. J. Clean. Prod. 2021, 290, 125852. [Google Scholar] [CrossRef]
- Gameiro, A.; Silva, A.S.; Faria, P.; Grilo, J.; Branco, T.; Veiga, R.; Velosa, A. Physical and chemical assessment of lime–metakaolin mortars: Influence of binder:aggregate ratio. Cem. Concr. Compos. 2014, 45, 264–271. [Google Scholar] [CrossRef] [Green Version]
- Andrejkovičová, S.; Velosa, A.L.; Rocha, F. Air lime–metakaolin–sepiolite mortars for earth based walls. Constr. Build. Mater. 2013, 44, 133–141. [Google Scholar] [CrossRef]
- Loureiro, A.; Paz, S.P.A.; Veiga, M.D.R.; Angélica, R.S. Assessment of compatibility between historic mortars and lime-METAKAOLIN restoration mortars made from amazon industrial waste. Appl. Clay Sci. 2020, 198, 105843. [Google Scholar] [CrossRef]
- Cardoso, D.; Gameiro, A.; Silva, A.S.; Faria, P.; Vieira, R.; Veiga, R.; Velosa, A. Influence of curing conditions in lime-metakaolin blended mortars—A mineralogical and mechanical study. In Proceedings of the HMC2013—Historic Mortars Conference, University of West Scotland, Glasgow, UK, 11–13 September 2013. [Google Scholar]
- Faria, P. Resistance to salts of lime and pozzolan mortars. In RILEM Proceedings pro067—International RILEM Workshop on Repair Mortars for Historic Masonry; Groot, C., Ed.; RILEM Publications: Paris, France, 2009; pp. 99–110. [Google Scholar]
- Faria, P.; Martins, A. Influence of air lime type and curing conditions on lime and lime-metakaolin mortars. In Durability of Building Materials and Components Building Pathology and Rehabilitation; de Freitas, V.P., Delgado, J.M.P.Q., Eds.; Springer: Berlin Heidelberg, 2013; Volume 3, pp. 105–126. [Google Scholar] [CrossRef]
- Faria, P.; Branco, T.; Carneiro, J.; Veiga, R.; Santos Silva, A. Argamassas com base em cal para a reabilitação de rebocos. In Proceedings of the 4º Congreso de Patología y Rehabilitación de Edificios. PATORREB 2012 Grupo, Santiago de Compostela, Spain, 12–14 April 2012. CD-ROM. [Google Scholar]
- Ferraz, E.; Andrejkovičová, S.; Velosa, A.L.; Silva, A.S.; Rocha, F. Synthetic zeolite pellets incorporated to air lime–metakaolin mortars: Mechanical properties. Constr. Build. Mater. 2014, 69, 243–252. [Google Scholar] [CrossRef]
- Pavlík, V.; Užáková, M. Effect of curing conditions on the properties of lime, lime–metakaolin and lime–zeolite mortars. Constr. Build. Mater. 2016, 102, 14–25. [Google Scholar] [CrossRef]
- Arizzi, A.; Cultrone, G. Comparing the pozzolanic activity of aerial lime mortars made with metakaolin and fluid catalytic cracking catalyst residue: A petrographic and physical-mechanical study. Constr. Build. Mater. 2018, 184, 382–390. [Google Scholar] [CrossRef]
- CEN. EN 459-1:2015. Building lime. Part 1: Definitions, Specifications and Conformity Criteria; CEN: Brussels, Belgium, 2015. [Google Scholar]
- CEN. EN 1097-3:1998. Tests for Mechanical and Physical Properties of Aggregates. Part 3: Determination of Loose Bulk Density and Voids; CEN: Brussels, Belgium, 1998. [Google Scholar]
- CEN. EN 1015-2:1998. Methods of Test for Mortars for Masonry. Part 2: Bulk Sampling of Mortars and Preparation of Test Mortars; 1998/A1:2006; CEN: Brussels, Belgium, 1998. [Google Scholar]
- CEN. EN 1015-3:1999. Methods of Test for Mortars for Masonry, Part 3: Determination of Consistency of Fresh Mortars; 1999/A1:2004/A2:2006; CEN: Brussels, Belgium, 1999. [Google Scholar]
- CEN. EN 1015-6:1998. Methods of Test for Mortars for Masonry, Part 6: Determination of Bulk Density of Fresh Mortars; 1998/A1:2006; CEN: Brussels, Belgium, 1998. [Google Scholar]
- CEN. EN 1015-7:1999. Methods of Test for Mortar for Masonry. Determination of Air Content of Fresh Mortar; CEN: Brussels, Belgium, 1999. [Google Scholar]
- CEN. EN 1015-8:1998. Methods of Test for Mortar for Masonry, Part 8: Determination of Water Retentivity of Fresh Mortar; CEN: Brussels, Belgium, 1998. [Google Scholar]
- CEN. EN 14146:2006. Natural Stone Test Methods. Determination of the Dynamic Modulus of Elasticity (By Measuring the Fundamental Resonance Frequency); CEN: Brussels, Belgium, 2006. [Google Scholar]
- CEN. EN 1015-11:2019. Methods of Test for Mortar for Masonry, Part 11: Determination of Flexural and Compressive Strength of Hardened Mortar; CEN: Brussels, Belgium, 2019. [Google Scholar]
- CEN. EN 1936:2008. Natural Stone Test Methods. Determination of Real Density and Apparent Density, and of Total and Open Porosity; CEN: Brussels, Belgium, 2008. [Google Scholar]
- CEN. EN 15801:2009. Determination of Water Absorption by Capillarity; CEN: Brussels, Belgium, 2009. [Google Scholar]
- Brito, V.; Gonçalves, T.D.; Faria, P. Coatings applied on damp building substrates: Performance and influence on moisture transport. J. Coat. Technol. Res. 2011, 8, 513–525. [Google Scholar] [CrossRef] [Green Version]
- CEN. EN 16322:2013. Conservation of Cultural Heritage—Test, Methods—Determination of Drying Properties; CEN: Brussels, Belgium, 2013. [Google Scholar]
- Arizzi, A.; Cultrone, G. Aerial lime-based mortars blended with a pozzolanic additive and different admixtures: A mineralogical, textural and physical-mechanical study. Constr. Build. Mater. 2012, 31, 135–143. [Google Scholar] [CrossRef]
- Lawrence, M.; Mays, T.J.; Rigby, S.; Walker, P.; D’Ayala, D. Effects of carbonation on the pore structure of non-hydraulic lime mortars. Cem. Concr. Res. 2007, 37, 1059–1069. [Google Scholar] [CrossRef]
- Salomão, M.C.D.F.; Bauer, E.; Kazmierczak, C.D.S. Drying parameters of rendering mortars. Ambiente Construído 2018, 18, 7–19. [Google Scholar] [CrossRef]
- Comité Européen de Normalisation. EN 998-1:2017. Specification for Mortar for Masonry—Part 1: Rendering and Plastering Mortar; Comité Européen de Normalisation: Brussels, Belgium, 2017. [Google Scholar]
- Nunes, C.; Slížková, Z. Freezing and thawing resistance of aerial lime mortar with metakaolin and a traditional water-repellent admixture. Constr. Build. Mater. 2016, 114, 896–905. [Google Scholar] [CrossRef]
- González-Sánchez, J.; Fernández, J.; Navarro-Blasco, Í.; Alvarez, J. Improving lime-based rendering mortars with admixtures. Constr. Build. Mater. 2020, 271, 121887. [Google Scholar] [CrossRef]
Figure 1.
Particle size distribution of each sand and the mixture of the three sands.

Figure 2.
Mortar specimens exposed at LNEC’s Natural Exposure Station in Cabo Raso, Lisbon, seeing organization and the Atlantic Ocean (a,b).
Figure 2.
Mortar specimens exposed at LNEC’s Natural Exposure Station in Cabo Raso, Lisbon, seeing organization and the Atlantic Ocean (a,b).

Figure 3.
Dynamic modulus of elasticity (DME) of mortars with 0, 10 and 20% Mk replacing air lime, after 28, 90 and 180 days in maritime, humid and standard curing conditions.
Figure 3.
Dynamic modulus of elasticity (DME) of mortars with 0, 10 and 20% Mk replacing air lime, after 28, 90 and 180 days in maritime, humid and standard curing conditions.

Figure 4.
Flexural strength of mortars with 0, 10 and 20% Mk replacing air lime, after 28, 90 and 180 days in maritime, humid and standard curing conditions.
Figure 4.
Flexural strength of mortars with 0, 10 and 20% Mk replacing air lime, after 28, 90 and 180 days in maritime, humid and standard curing conditions.

Figure 6.
Carbonation at 90 days of curing in maritime, saturation and standard conditions: (a) reference mortars CL (m), CL (h) and CL (s); (b) mortars CL_10Mk (m), CL_10Mk (h) and CL_10Mk (s); (c) mortars CL_20Mk (m), CL_20Mk (h) and CL_20Mk (s).
Figure 6.
Carbonation at 90 days of curing in maritime, saturation and standard conditions: (a) reference mortars CL (m), CL (h) and CL (s); (b) mortars CL_10Mk (m), CL_10Mk (h) and CL_10Mk (s); (c) mortars CL_20Mk (m), CL_20Mk (h) and CL_20Mk (s).

Figure 8.
Dry bulk density of mortars with 0, 10 and 20% Mk replacing air lime, after 28, 90 and 180 days in maritime, humid and standard curing conditions.
Figure 8.
Dry bulk density of mortars with 0, 10 and 20% Mk replacing air lime, after 28, 90 and 180 days in maritime, humid and standard curing conditions.

Figure 9.
The Capillary curves of mortars with 0, 10 and 20% Mk replacing air lime, after (a) 28 days; (b) 90 days; (c) 180 days in maritime, humid and standard curing conditions.
Figure 9.
The Capillary curves of mortars with 0, 10 and 20% Mk replacing air lime, after (a) 28 days; (b) 90 days; (c) 180 days in maritime, humid and standard curing conditions.

Figure 10.
Drying curves of mortars with 0, 10 and 20% Mk replacing air lime, after 28, 90 and 180 days in maritime, humid and standard curing conditions: (a–c) by time, showing the initial slope of drying phase 1 at each age; (d–f) by square root of time, showing the intermediate slope of drying phase 2 at each age.

Table 2.
Loose bulk density of mortars dry materials.
| Material | Air Lime (CL) | Metakaolin (Mk) | Sands | Mixture of Sands | ||
|---|---|---|---|---|---|---|
| APAS12 | APAS20 | APAS30 | ||||
| Loose bulk density [kg/dm3] | 0.361 | 0.294 | 1.412 | 1.405 | 1.388 | 1.463 |
Table 3.
Composition of mortars.
| Mortar | Volume | Weight | Mk | Quantities | |||||||
|---|---|---|---|---|---|---|---|---|---|---|---|
| CL (g) | Mk (g) | Sand (g) | Water (mL) | ||||||||
| CL:Mk:S | B:S | CL:Mk:S | B:S | (wt.% of CL) | APAS12 | APAS20 | APAS30 | ||||
| CL | 1:0:2 | 1:2 | 1:0:7.75 | 1:7.75 | 0 | 578.1 | 0.0 | 1129.6 | 1686 | 1665.6 | 1000 |
| CL_10Mk | 1:0.14:2.22 | 1:2 | 1:0.11:8.61 | 1:7.75 | 10 | 520.3 | 57.8 | ||||
| CL_20Mk | 1:0.31:2.50 | 1:2 | 1:0.25:9.69 | 1:7.75 | 20 | 462.5 | 115.6 | ||||
Notation: B = CL or CL + Mk (considering Mk included as binder).
Table 4.
Flow table consistency, water retention, air content, and bulk density of fresh mortars.
| Mortar | Flow (mm) | Water Retention (%) | Air Content (%) | Fresh Bulk Density (kg/m3) |
|---|---|---|---|---|
| CL | 141 ± 3 | 93.9 | 4.2 | 1952.2 |
| CL_10Mk | 134 ± 3 | 92.4 | 4.3 | 1965.1 |
| CL_20Mk | 137 ± 2 | 92.8 | 4.1 | 1961.7 |
Table 5.
Capillary saturation value (Cs) and capillary coefficient (CC) of mortars with 0, 10 and 20% Mk replacing air lime, after 28, 90 and 180 days in maritime, humid and standard curing conditions.
Table 5.
Capillary saturation value (Cs) and capillary coefficient (CC) of mortars with 0, 10 and 20% Mk replacing air lime, after 28, 90 and 180 days in maritime, humid and standard curing conditions.
| Mortar (Curing) | Cs (kg/m2) | CC (kg/(m2·min0.5)) | ||||
|---|---|---|---|---|---|---|
| 28 Days | 90 Days | 180 Days | 28 Days | 90 Days | 180 Days | |
| CL (m) | 20.4 | 19.7 | 20.3 | 4.5 | 4.7 | 4.4 |
| CL_10Mk (m) | 23.4 | 23.7 | 24.2 | 3.6 | 4.2 | 4.4 |
| CL_20Mk (m) | 24.0 | 24.4 | 23.7 | 3.2 | 3.4 | 3.4 |
| CL (h) | 20.2 | 20.6 | 20.4 | 3.8 | 4.5 | 4.1 |
| CL_10Mk (h) | 23.7 | 22.6 | 23.6 | 3.6 | 3.8 | 3.8 |
| CL_20Mk (h) | 23.6 | 23.1 | 24.2 | 3.1 | 3.1 | 3.2 |
| CL (s) | 20.3 | 19.8 | 20.1 | 4.6 | 4.4 | 4.0 |
| CL_10Mk (s) | 21.6 | 23.0 | 22.6 | 4.0 | 4.0 | 4.0 |
| CL_20Mk (s) | 22.4 | 22.2 | 23.1 | 3.5 | 3.3 | 3.1 |
Publisher’s Note: MDPI stays neutral with regard to jurisdictional claims in published maps and institutional affiliations. |
© 2021 by the authors. Licensee MDPI, Basel, Switzerland. This article is an open access article distributed under the terms and conditions of the Creative Commons Attribution (CC BY) license (https://creativecommons.org/licenses/by/4.0/).
Share and Cite
MDPI and ACS Style
Monteiro, J.; Silva, V.; Faria, P. Effect of Type of Curing and Metakaolin Replacement on Air Lime Mortars for the Durability of Masonries. Infrastructures 2021, 6, 143. https://0-doi-org.brum.beds.ac.uk/10.3390/infrastructures6100143
AMA Style
Monteiro J, Silva V, Faria P. Effect of Type of Curing and Metakaolin Replacement on Air Lime Mortars for the Durability of Masonries. Infrastructures. 2021; 6(10):143. https://0-doi-org.brum.beds.ac.uk/10.3390/infrastructures6100143
Chicago/Turabian StyleMonteiro, João, Vitor Silva, and Paulina Faria. 2021. "Effect of Type of Curing and Metakaolin Replacement on Air Lime Mortars for the Durability of Masonries" Infrastructures 6, no. 10: 143. https://0-doi-org.brum.beds.ac.uk/10.3390/infrastructures6100143