
Mechanical and Fresh Properties of Multi-Binder Geopolymer Mortars Incorporating Recycled Rubber Particles

Department of Civil and Environmental Engineering, University of Surrey, Guildford GU2 7HX, UK
*
Author to whom correspondence should be addressed.
Infrastructures 2021, 6(10), 146; https://0-doi-org.brum.beds.ac.uk/10.3390/infrastructures6100146
Submission received: 29 September 2021
/
Revised: 9 October 2021
/
Accepted: 12 October 2021
/
Published: 14 October 2021
(This article belongs to the Special Issue Reusing, Recycling and Repurposing Infrastructure: Components and Construction Materials)
Abstract
:This paper examines the performance of multi-binder conventional geopolymer mixes (GCMs) with relatively high early strength, achieved through curing at ambient temperature. Mixes incorporating ground granulated blast-furnace slag (GGBS), fly ash (FA) and microsilica (MS) and sodium metasilicate anhydrous, were assessed in terms of workability, mechanical properties and embodied carbon. A cement mortar was also prepared for the sake of comparison. The best performing GCM was then used as a reference for rubberised geopolymer mixes (RuGM) in which the mineral aggregates were replaced by recycled rubber particles in proportions up to 30% by volume. Experimental results were combined with embodied carbon estimations in a multi-criteria assessment to evaluate the performance of each material. A mix with a 75/25 GGBS-to-FA ratio, in which 5% MS was added, had the best performance in terms of strength, workability, water absorption and environmental impact. The compressive strength was above 50 MPa, similar to that of the cement mortar. The latter had significantly higher embodied carbon, with factors ranging between 3.48 to 4.20, compared with the CGM mixes. The presence of rubber particles reduced the mechanical properties of RuGM proportionally with the rubber amount, but had similar workability and embodied carbon to CGMs. Finally, a strength degradation model is validated against the tests from this paper and literature to estimate the compressive strength of RuGM, providing reliable predictions over a wide range of rubber contents.
1. Introduction
Concrete is the second-most consumed resource across the globe after water and the production of its main constituent, the cement, accounts for 8% of the total global carbon emissions [1]. To minimise the embodied carbon in construction, implementation of alternative binders should be accelerated [2]. Alkali activated materials are a promising alternative to conventional concretes for some applications. The suitability of these materials owes to the wide range of industrial by-products that can be employed as binders: fly ash (FA), microsilica (MS), metakaolin (MK) and ground granulated blast-furnace slag (GGBS), among others [3]. Geopolymers can not only act as a sustainable replacement for conventional concrete but also demonstrate high compressive strengths [4], excellent fireproofing [5], and enhanced durability [6].
Conventional geopolymer mixes (CGMs) consist of binders, an activator, water and aggregates. The synthesis of geopolymers typically requires an aluminosilicate ‘binder’ material, a strong alkali to act as an ‘activator’ and water [7]. This is a highly complex chemical reaction that takes place only when aluminosilicates react with alkaline element and produce materials that exhibit ceramic-like behaviour [8]. The fresh and hardened properties of geopolymers depend on multiple factors including the chemical composition of the binders, binder particle size, alkaline solution concentration, curing temperature and duration, and the free water in the mixture, among others.
For example, due to the high amount of calcium oxide and irregular particle shape, GGBS reduces setting times and increases early-age strength mixes at the cost of reducing fresh mix workability [9]. By contrast, high amounts of silicon dioxide combined with a spherical particle shape, fly ash contribute to reducing expansion during the curing process and improves long-term strength, though may impair the early strengths [10]. Microsilica has higher fineness compared to GGBS and fly ash, drawing more of the free water from the mix, which can help with strength but reduces workability and setting times [11].
Alkaline activators used in previous studies include sodium hydroxide, potassium hydroxide and sodium carbonate solutions [12,13,14,15]. As an alternative to using fluid activators, one-part CGMs consist of only dry constituents in the form of solid binders and solid alkaline activators [16,17]. The manufacturing procedure resembles that of conventional concrete, in which the water is added over the dry constituents. The activator in a one-part CGM can be any substance producing alkali cations, raising the pH and promoting dissolution [18]. The dissolution starts immediately after adding water into the dry mix, technologically being similar to the setting of conventional concretes [16]. Common activators employed in one-part CGMs are sodium metasilicates (anhydrous [19], pentahydrate [15], nonahydrate [16]), sodium carbonate [20], sodium aluminate [21], sodium sulphate and potassium hydroxide. The advantage of sodium metasilicate anhydrous over similar liquid solutions is that it not only provides alkaline conditions, but metasilicate particles can gradually attract surrounding moisture whilst curing and further promote chemical activation of binders, providing geopolymers with additional strength [22]. An excessive amount of alkali can weaken geopolymers as unreacted sodium metasilicate particles are generally weaker than the geopolymer matrix that surrounds them [22]. CGMs with sodium metasilicate can achieve excellent compressive strengths in the range of 40–100 MPa, outperforming similar mixes with sodium hydroxide [17].
The performance of conventional concrete materials provided with recycled tyre rubber particles as a replacement for conventional mineral aggregates has been studied extensively [23,24,25,26]. The proportion replaced influenced the fresh, mechanical and physical properties of rubberised concrete materials (RuC) [27,28]. Compressive and tensile strengths, as well as the elastic and dynamic modulus, decrease with rubber content, whilst the energy dissipation is typically improved compared to non-rubberised concrete [29,30]. These reductions appear due to poor compatibility between the soft rubber particles relative to the matrix, and their hydrophobic nature limiting the adhesion between the rubber and surrounding matrix [24,25]. However, some increase in strength can be achieved by surface preparation of the rubber particles by sodium hydroxide solution [31].
Rubberised geopolymer mixes (RuGM), mortars or concrete, in which the part of mineral aggregates and the cement based matrix are replaced by recycled rubber and industry by-products, respectively, combine the environmental benefits of using both waste and recycled materials in construction materials [32,33,34,35,36,37]. The lower elastic modulus of geopolymer systems compared to conventional cement-based materials can provide better compatibility with the added rubber particles. FA and GGBS have lower specific gravity compared to cement and can limit rubber floatation during vibration resulting in a more homogenous mix. Compared to cement based matrices, in geopolymer systems, the alkaline solution used to dissolve the alumina and silica in the precursors can improve the adhesion between rubber particle and matrix, ensuring better bonding with the geopolymer mix [36]. Whilst both CGM and RuC materials have been widely examined, studies on RuGM only recently emerged and the field remains relatively limited [34].
Although a number of studies exist on alkali activated materials incorporating GGBS and/or FA, most of the studies focused on two-part systems in which liquid activators were used, the mechanical properties of which were relatively low and more suited to subgrade practical applications. Apart from one study [22], research on the influence of incorporating microsilica (MS) in alkali activated systems is lacking to date [32]. Additionally, studies on two-part RuGM are limited [33,34,35,36,37], and those on one-part RuGM are non-existent [38]. This study aims at developing one-part FA/GGBS/MS CGM and RuGM systems that are safe and effective for on-site use, as well as have appropriate durability, enhanced mechanical and environmental performance for structural applications.
The best performing mix in terms of fresh, mechanical properties and embodied carbon is then used as a reference for RuGM. Rubber particles of various sizes from recycled car tyres are incorporated in the mix as a replacement of mineral aggregates in proportions up to 30% by volume. Experimental results from over 170 tests are then combined with embodied carbon estimations in a multi-criteria assessment to determine the efficiency of each mix. Finally, an existing strength prediction model for RuC is appraised and validated against the tests from this paper and those available in the literature.
2. Materials and Methods
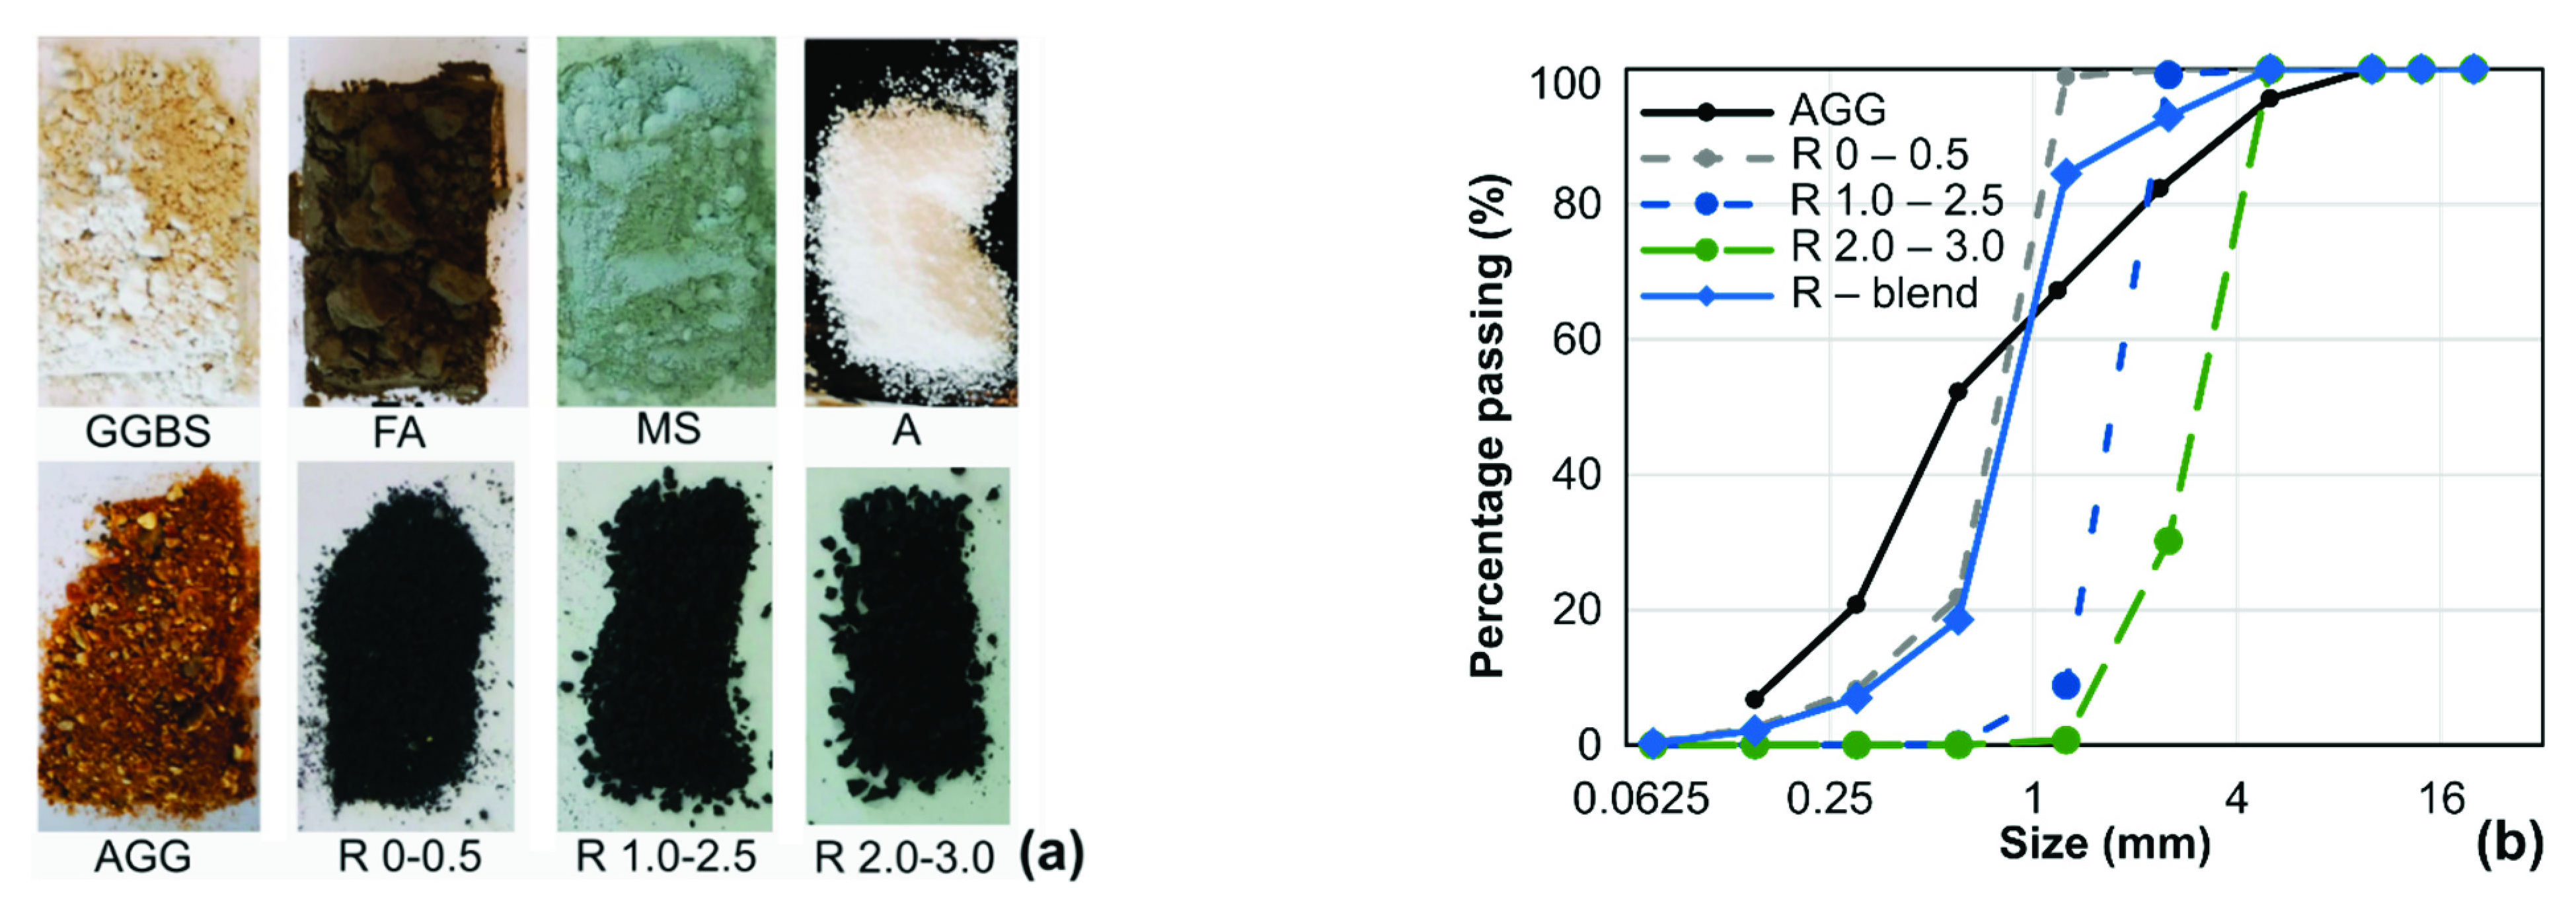
To compare the results of nine conventional geopolymer mixes (CGM) and nine rubberized geopolymer mixes (RuGM) against a control conventional cement mortar mix, a total of 171 cubic and prismatic samples were cast and tested to assess the mechanical and physical properties. In the first phase, the ratios of three binders (GGBS, FA, MS) shown in Figure 1a were varied to obtain the best mechanical performance workability, whilst the binder content was maintained constant. In the second phase, a proportion of mineral aggregates was replaced by rubber particles up 30% by volume. The particle types are shown in Figure 1a, whilst gradation curves for rubber and sand are shown in Figure 1b.
2.1. Materials
As noted above, the performance and properties of the mixes were measured against a mortar mix using CEM I, 52.5R [39] to BS EN 197-1 [40] cement with similar proportions of sand, water and admixture as those in the CGM and RuGM. The cement classification indicates that a standard mortar cube specimen with dimensions of 50 mm can withstand compressive stresses of at least 52.5 MPa before failure [39].
Ground granulated blast furnace slag (GGBS) was supplied by Hanson [41] and conformed with BS EN 196-2 [42]. Silica and alumina make up a significant proportion of GGBS, a by-product of iron smelting [43]. Aluminosilicate compounds that incidentally form within a blast furnace are the key components of GGBS that allow it to act as a pozzolan. GGBS has different chemical and physical properties that lead to them imposing different properties on GPC mixes compared to FA. GGBS has been shown to reduce setting times and increase early-age strengths mixes at the cost of reducing fresh mix workability [9]. With a particle size generally less than 30 microns, GGBS particle shape depends on the grinding technique and are rarely perfectly round [44]. The Specific Gravity (SG) of the GGBS was 2.90, loss of ignition was 0.59 and the pH-value was between 10–12.
Fly ash (FA) conforming to BS EN 450–1 [45] was supplied from CEMEX [46] and was provided at a particle fineness conforming with Category N of BS EN 450–1 [45]. FA is a powder pozzolanic material, a siliceous material that can react with specific alkalis to form cementitious compounds at ambient temperatures in the presence of moisture [10]. These include increased workability, reduced water demand, contribute to reducing expansion during the curing process and improved long-term strength [47]. For relatively large quantities, FA can, however, retard setting times and reduce early strengths. The fineness of the material and the particle diameter below 45 microns both act to improve particle packing and impart water-reducing properties within the matrix [46]. The SG of the FA was 2.30, loss of ignition 3.10, whilst the pH-value was similar to that of GGBS.
A Grade 940 microsilica (MS) [48] was used as the third binder in the geopolymer systems. This is an ultrafine grey powder that comes as a by-product from the production of silicon and ferrosilicon alloys in electric arc furnaces [49]. MS is also regarded as a pozzolan but these properties largely come about due to the material’s extreme fineness and ability to fill micropores, increasing mechanical strengths and improving resistance to erosion, shrinkage and cracking of conventional concrete/mortar [50]. However, the extremely fine particles also lead to the material having a particularly large surface area per unit volume [11]. This in turn causes MS to form more cohesive mixes but to also draw away available water compared to FA and GGBS. Less water made available for the hydration reaction, which provides concretes their strength, results in reduced workability and slower setting times, typically limiting MS to around 10% of the total binder mass.
Sodium metasilicate anhydrous (Na2SiO3) (manufactured by Atom Scientific Ltd., Hyde, UK) was used as the only solid activator in this study [51]. The molecular weight of this constituent is 212.14 g/mol, which is divided between 46.0% silicon oxide (SiO2) and 50.5% sodium oxide (Na2O), whilst the remaining 3.5% are other constituents. This corresponds to a Ms = SiO2/Na2O = 0.91 ratio/modulus, which is close to the optimum ranges (1–1.5) required for activation of slag-based CGMs [52]. It is worth noting that the Ms ranges for commercial sodium metasilicates are between 0.9–1.0, and these could be adjusted to match the optimum ranges by combining them with hydroxides in solutions. The solid activator pellets had diameters between 0.5–1.0 mm. The constituent had a specific gravity of around 2.61 and a pH value around 12.5 at 10 g/L [51]. Manufacturer data were used to provide the chemical composition and physical properties of the three binders and the activator (Table 1).
The sand was sourced from mineral deposits at a particle grading of 0–5 mm and possessed a specific gravity of 2.65 and a moisture content of 1.5%. Recycled rubber particles recovered from end-of-life car tyres were used in the mixes. All rubber particles are reported to have a 25% content of carbon black, polymers in the range of 40–55%, whereas the remaining constituents are softeners and fillers. These were supplied in particle size ranges of 0–0.5 mm, 1–2.5 mm and 2–4 mm. The specific gravity of these particles was in the range of 1.11. The particle size distribution of mineral aggregates and rubber determined following EN 933-1:2012 [53] are depicted in Figure 1b. A polycarboxylate water-reducer was used as the admixture [54] in proportions of 0.5% by binder mass.
2.2. Mix Designs and Mixing Procedure
As shown in Table 2 a total of 19 mixes, divided into the two groups mentioned above, were prepared. In all mixes, the total binder content was kept constant at 460 kg/m3 and selected from a mix design for conventional cement mortar of relatively high strength. For all mixes, the water-to-binder ratio was maintained at 0.45, which corresponds to 205 L/m3 of water. The mix design strategy was based on investigating the effects of altering the composition of the three chosen binders, FA, GGBS and MS, and the replacement of fine mineral aggregate with crumb rubber of different grades, at varying degrees of replacement. On that account, in the first phase GGBS was included in multiple intervals from 23–91%, FA from 9–68%, and MS from 5–13%. In the second phase, rubber replacements of 10%, 20% and 30% were tested with varying grades (Table 2). Mix designations included the percentage of each binder relative to the total binder amount, the rubber content and the rubber particle size. This is represented in the from GaaFbbMccRddE in which aa is the GGBS content (23–91%), bb is for the FA content (9–68%), cc is for the MS content (5–13%), dd is for the rubber content (0–30%) and E is for the rubber particle size (replaced with S for 0–0.5 mm, L for 1–2.5 mm, or B for a blend of 0–4 mm). For example, mix G71F24M05R20L includes 71% GGBS, 24% FA, 5% MS, 20% rubber of 1–2.5 mm particle size.
The first three mixes from Table 2 had the same amount of MS, no rubber and varying proportions of FA-to-GGBS (G82F09M09R00, G68F23M09R00, G45F45M09R00). The next three mixes looked at the influence of GGBS-to-MS proportions, whilst the other variables were constant (G95F00M05R00, G91F00M09R00, G87F00M13R00). Then, the GGBS-to-FA ratio was kept within similar ranges and the MS was varied from 5–13% (G71F24M05R00, G68F23M09R00, G65F22M13R00). For purely comparative reasons, a three-blend mix with low amounts of GGBS was also considered (G23F68M09R00). After the best balance between strength and workability was assessed on the above mixes, a non-rubberised reference mix was considered. Then, nine mixes were designed with the binder composition of mix G71F24M05R00 and they were varied by rubber aggregate grade and replacement. The choice of the reference binder composition for the rubberised mixes was largely based on 7-day compressive strengths, described below, and qualitative literature information. Finally, a cement-only mix utilising CEM I, 52.5 N was prepared with the same binder mass, water-to-binder ratio and quantity of admixture as the CGM mixes and a similar proportion of fine aggregate to reach the standard mix volume. This was included as a benchmark mix for assessing the performance and properties of the CGM mixes when using a multi-criteria assessment as described below. A binder to sand ratio of 1:4 was considered reasonable while a water-to-binder ratio of 0.45 was chosen, corresponding with 205 L/m3 water. In all mixes an activator-to-binder content of A/B = 0.08 was decided as it would give the best balance between strength, durability and embodied carbon [12,19].
A laboratory mixer with a detachable flat beater and 5-litre bowl was used to produce all mixes. To ensure consistent mixing results, the inside of the mixing bowl was sprayed with a water hose to ensure the sides were wet before adding ingredients. The dry ingredients were mixed for 2 min at a moderate speed. Afterwards the activator would be added to the mix, typically in the centre of the bowl to obtain a good distribution from the small quantity used. The ingredients were then mixed for 1 min at moderate speed. The sides of the bowl were then scraped of any material with a palette knife before adding 90% of the water to be added. The wet mixture was then mixed at a high speed for 1 min. The admixture was then diluted in the remaining 10% of the water and added into the mix. Finally, the ingredients were mixed for 4 min and then poured into moulds. The mixtures were then compacted using a vibrating table.
2.3. Methodology
Workability and fresh density were assessed immediately after the completion of a mix. Fresh material properties were assessed by means of a flow table test using the principles outlined in BS EN 1015-3 [55]. The wet densities were determined by evaluating the mass and volume of fresh mortars immediately after the casting using a tapered container of Ø85 mm average diameter and 45 mm depth. Randomly selected material was removed from the mixing bowl and was then introduced in two layers into the truncated conical mould, compacted by at least 10 strokes with a tamper. After the excess material was skimmed off, the supporting table was jolted 25 times and the truncated cone removed. Finally, the diameter of the spread was measured following two perpendicular directions. The material was then placed back into the main bowl and mixed for 60 s, removed from it, poured into moulds, and compacted on a vibrating table.
For each mix six cubes with dimensions of 50 mm and three prisms of dimensions 40 × 40 × 160 mm were prepared. Following 7 days of setting in a room with an ambient temperature and humidity of 16–20 °C and 60–65%, respectively, the specimens were demoulded from their formworks and given distinct labels. Three of the cubes were tested after 7 days of curing and the remaining three cubes would then be tested after 28 days of curing, with the three prisms being tested after them on the same day. The dimensions of each specimen were also recorded so that any loss of section or change in shape following the curing process could be accounted for when calculating the strength of a mixture.
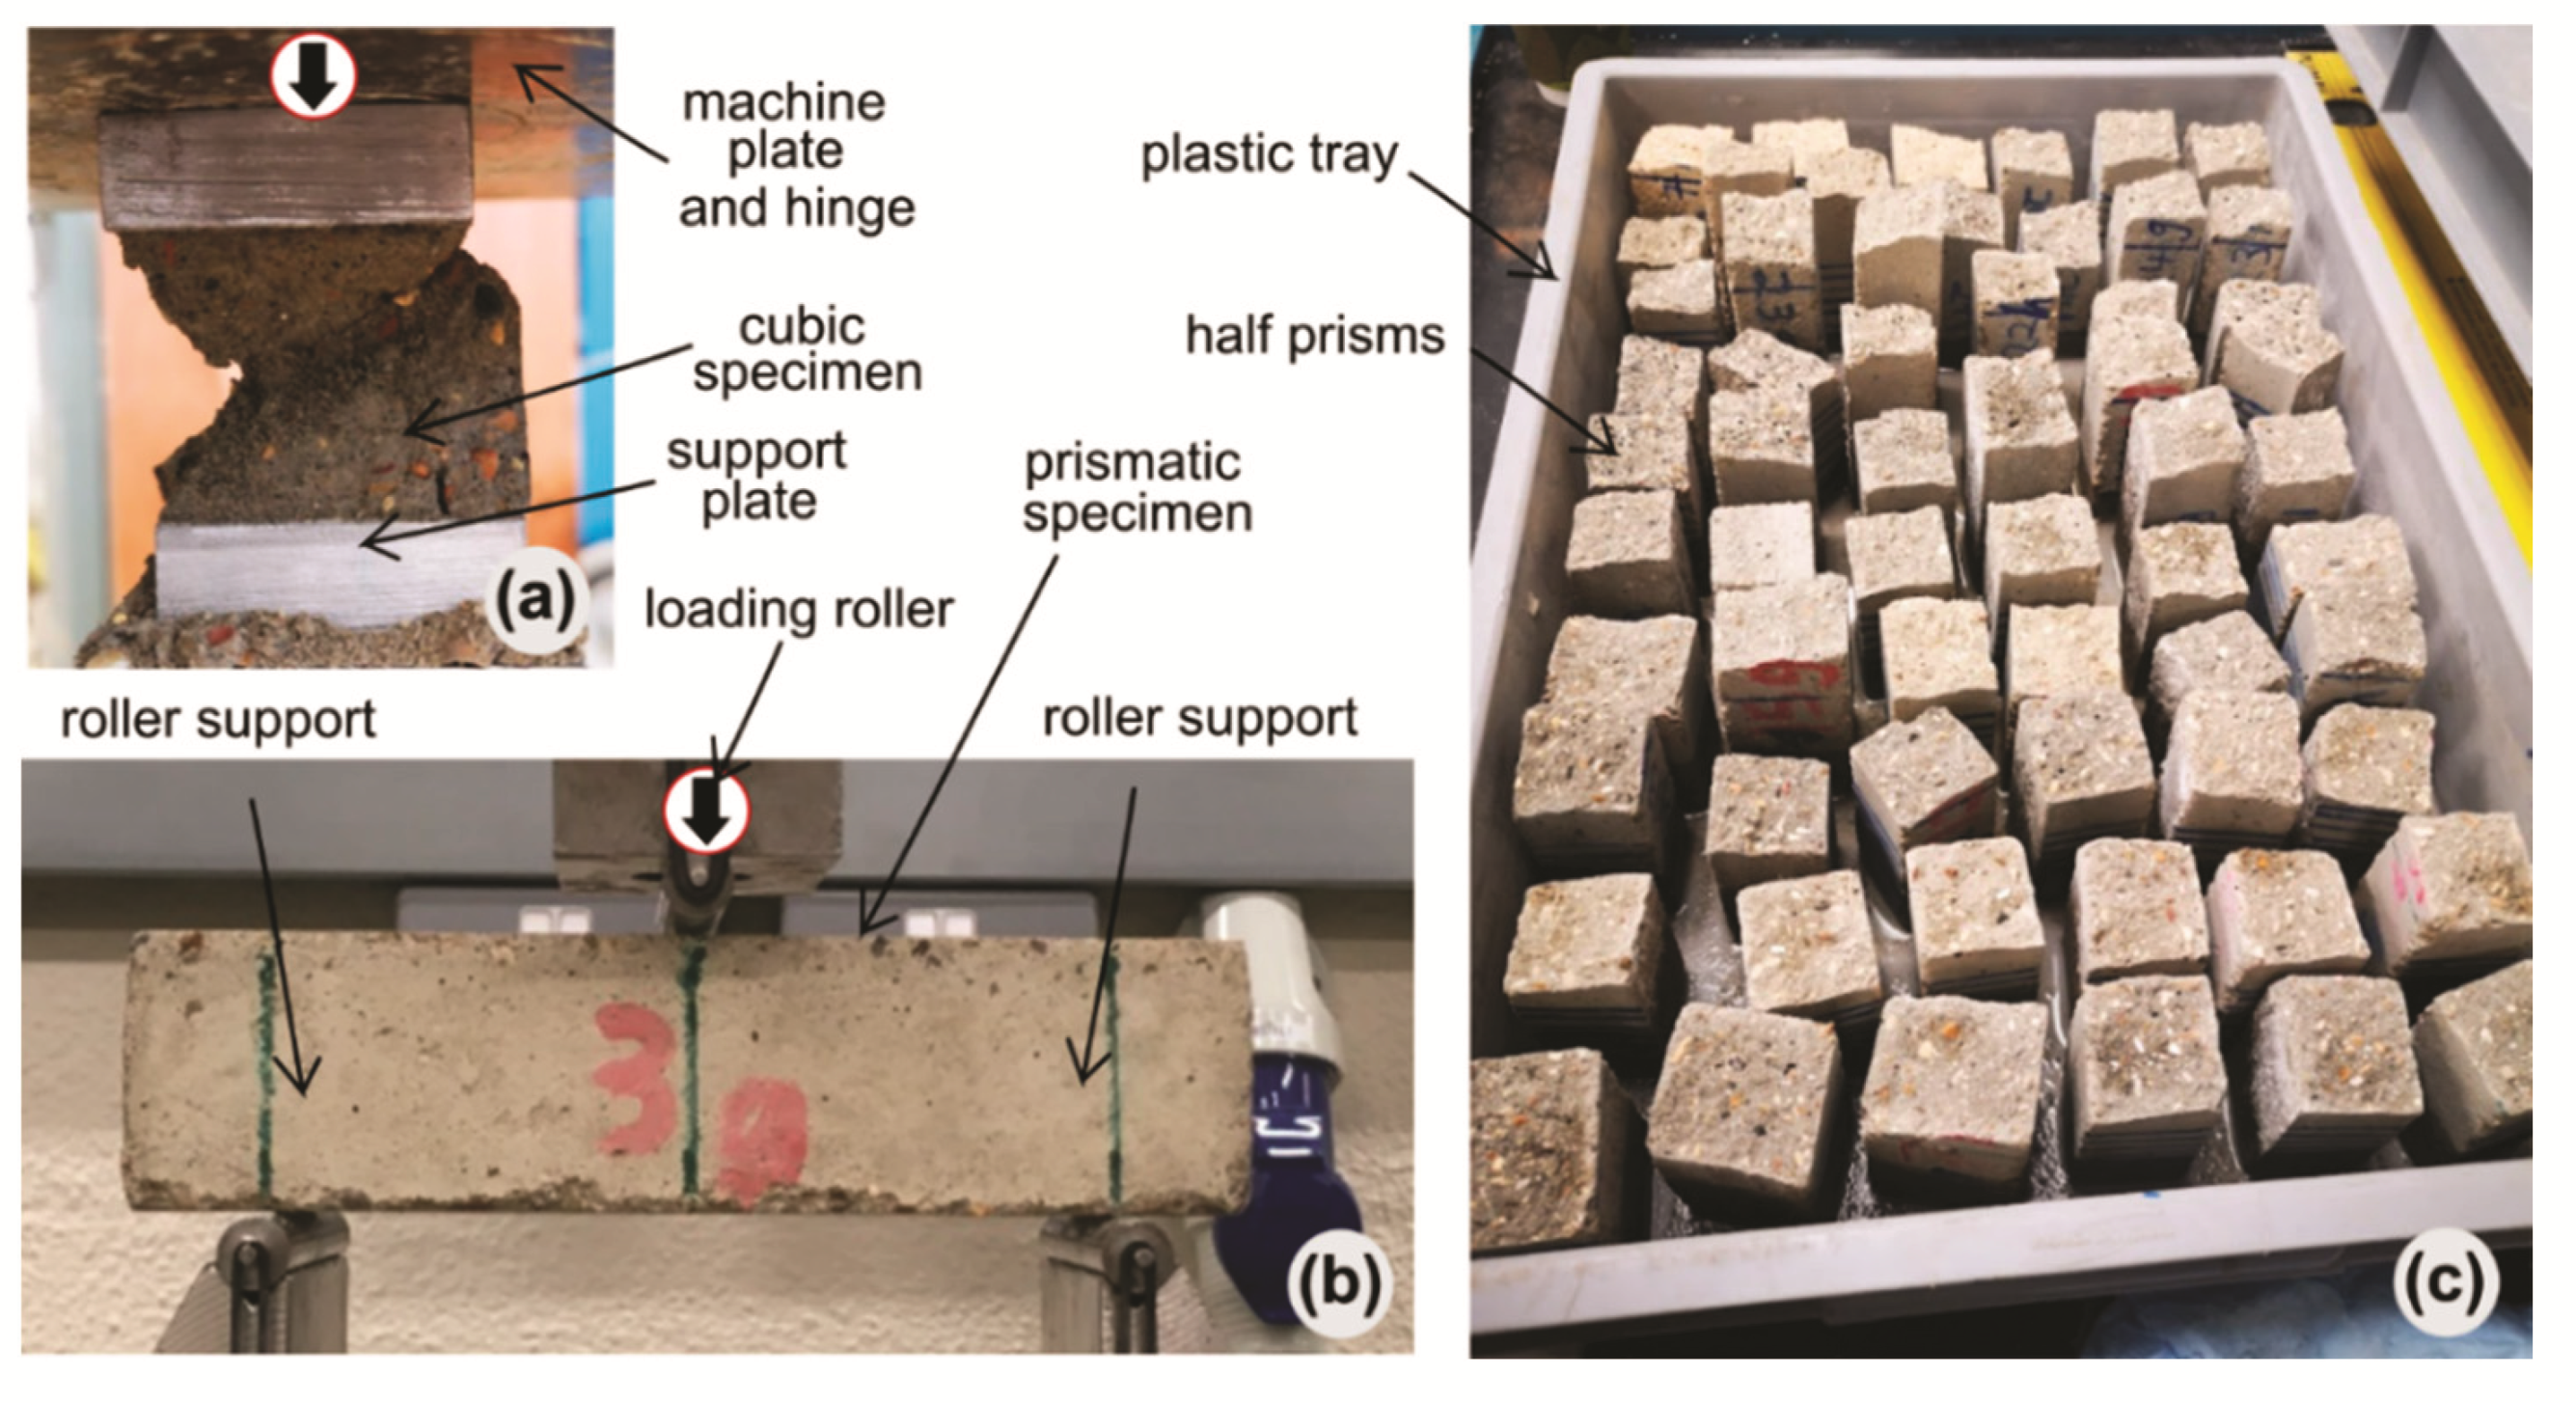
An ‘Avery’ testing frame, shown in Figure 2a, provided with a servo-hydraulic Instron actuator and load cell with a capacity of 1000 kN was used to test cube specimens in compression using a displacement rate of 0.5 mm/min. The specimens were placed between stiff steel plates and the load was applied through a hinge at the top. A three-point testing rig was installed in an electromechanical Instron 5500 machine to assess the flexural strength of the materials from prisms tests, as depicted in Figure 2b. The prisms were supported by two steel rollers and loaded by a third steel roller from above, all cylinders being horizontally perpendicular to the axis of the prism specimen [56,57]. A displacement control with a rate of 0.2 mm/min was used in this case.
Capillary water absorption was assessed using the principles of BS EN 13057 (BSI, 2002), on the broken prisms from flexural tests. The samples were oven-dried to constant mass in a ventilated oven at a temperature of 40 °C for a period of seven days. After oven-drying, the half prisms were marked with eight equispaced axial lines around the perimeter of the test face using a marker to their full height. The test face was placed in a shallow tray that contained 2 ± 1 mm water (Figure 2c). The whole tray was then covered with an upturned plastic tray to prevent air movement around the specimen under test. The water uptake was determined by weighting the sample at 12 min, 30 min, 1 h, 2 h, 4 h and 24 h after placement in the tray, as well as by its level, marked on the sample at each interval. After each measurement, the sample was returned immediately to the tray.
3. Results and Discussion
The main characteristics considered for the evaluation of the CGM and RuGM mixes discussed below are the fresh mix properties (workability and fresh density), the hardened properties (compressive and flexural strengths), as well as sorption coefficient. The influence of binder ratios and the presence of rubber particles are discussed and analysed. A brief assessment is also carried out to estimate the environmental impact of each mix based on factors such as material extraction, processing, transportation. The main results are listed in Table 3.
3.1. Fresh Properties
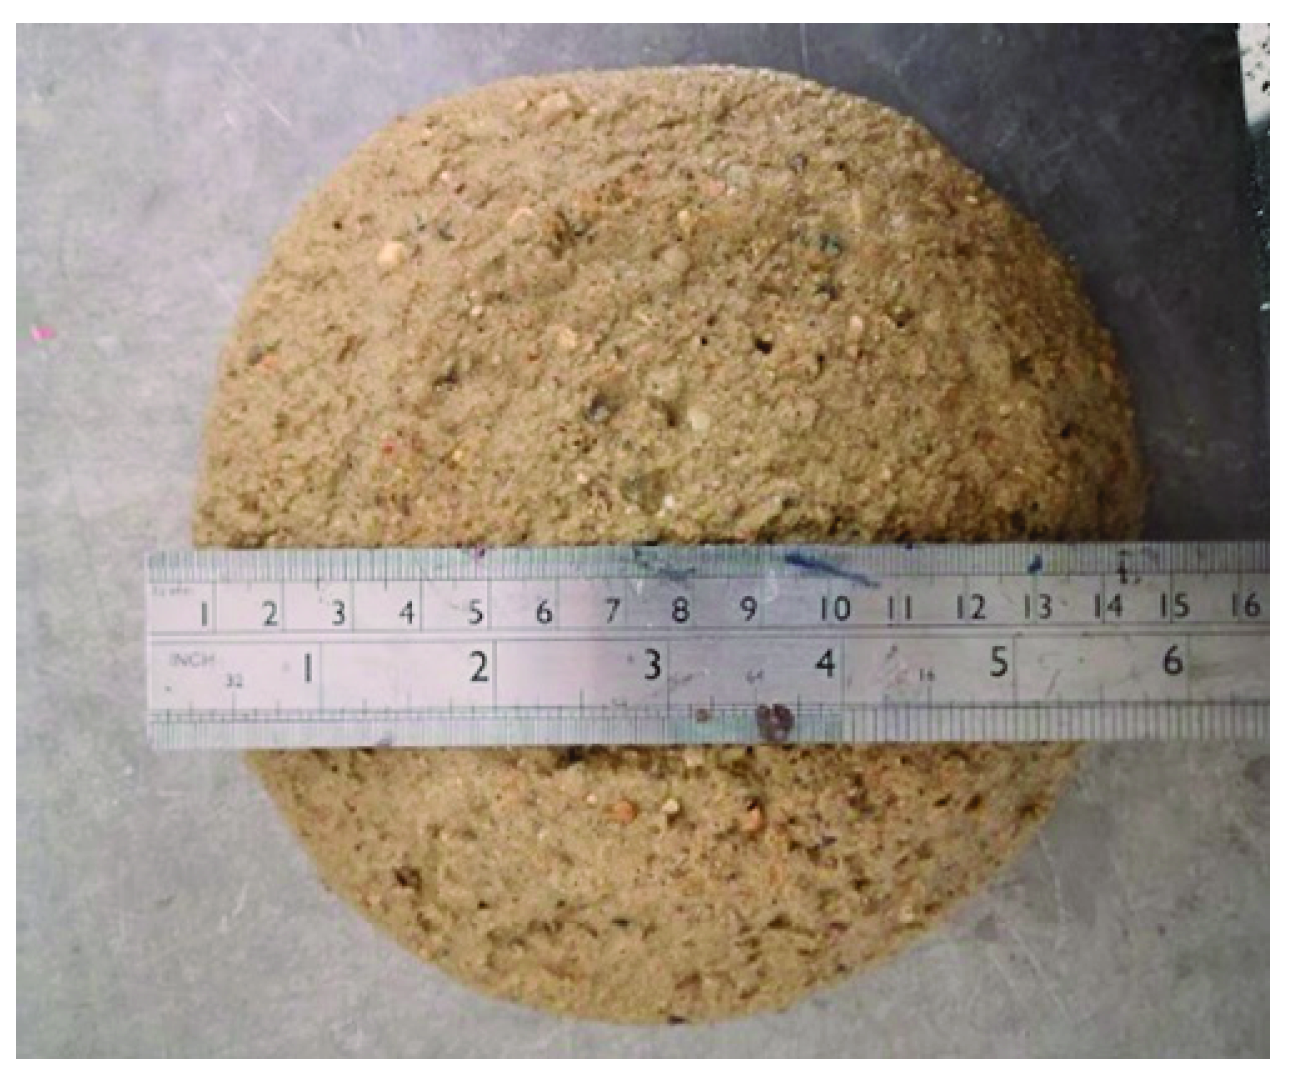
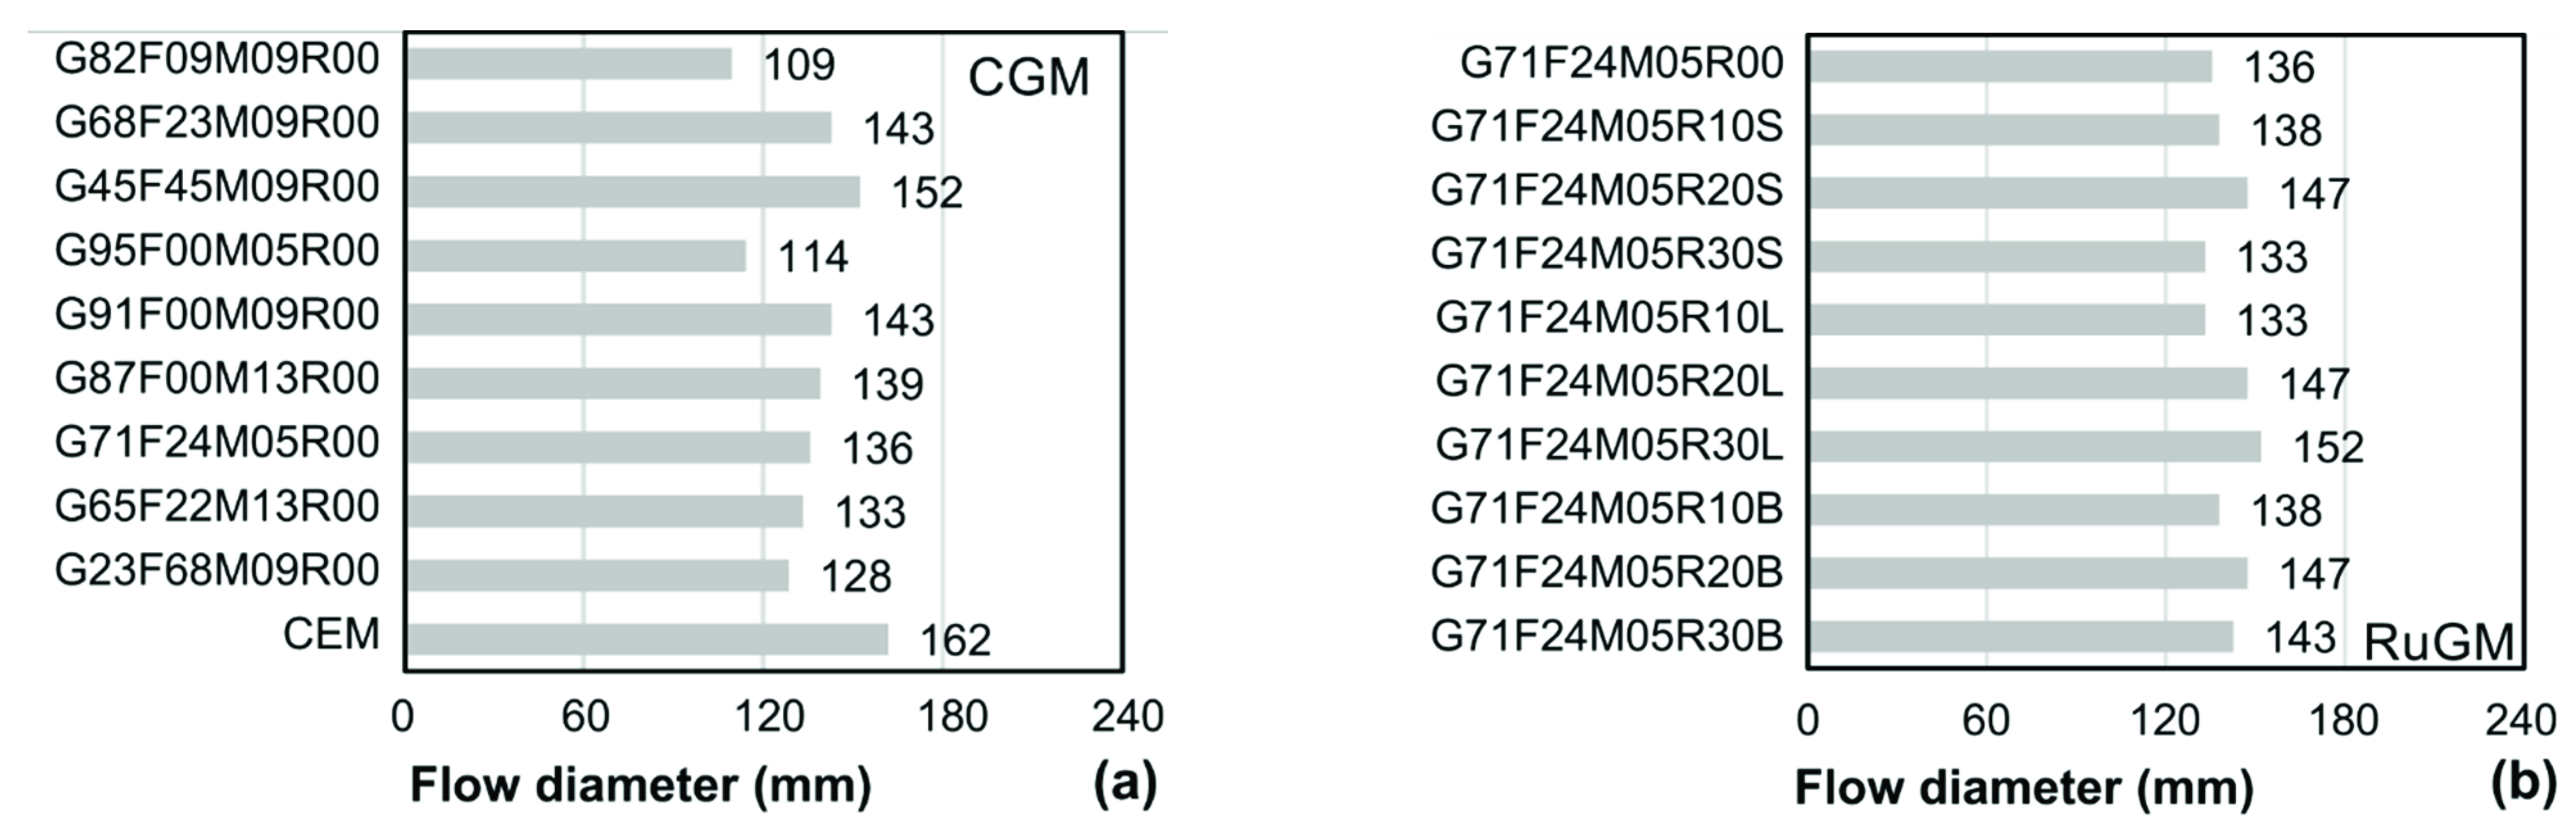
Figure 3 depicts the flow of a three-blend GCM, Figure 4a provides the relationship between flow diameter as a measure of workability and binder proportions, whilst Figure 4b presents the flow diameter versus rubber content. It is worth pointing out that flow diameters below 135 mm were relatively stiff with poor fluidity and difficult to cast, whilst mixes with test samples producing slump diameters above 150 mm were more fluid and could be cast with minimum vibration. Finally, values above 180 mm would be representative of a form of self-compacting mortars [55]. It was generally shown that as the ratio of FA to GGBS content increased, workability was enhanced. This is shown by direct comparison between mixes G82F09M09R00, G68F23M09R00 and G45F45M09R00, which had 9%, 23%, and 45% FA from the total binder quantity.
From the workability point of view, regardless of FA-to-GGBS ratio, the optimal proportion of binder replacement by MS was found to be 5–9%. This appears to be the commonly added proportion in conventional cement-based mixes with regards to seeking the durability benefits of MS [58]. It appears that increasing this proportion maintained or slightly reduced the workability, with a minimal effect on the high-GGBS/no-FA mixes (e.g., G87F00M13R00), but much more so when added to predominantly FA-based mixes (e.g., G23F68M09R00). This general effect on workability can be explained by the particularly high surface area to volume ratio of MS particles, because of its extreme fineness, drawing away available water and reducing fresh mix fluidity [50]. The cement-only mix showed generally better workability, with about 22% greater performance on average compared to all CGMs.
Based on the flow diameters from Figure 4a, as well as mechanical properties described later in the paper, a mix with a 75/25 GGBS-to-FA ratio, in which a relatively low amount of MS is added (~5%), has the best overall performance. Hence, G71F24M05R00 was considered as a reference for the second group of rubberised mixes. The results depicted in Figure 4b indicate that the presence of rubber had a minor effect on the workability, with a relatively constant trend. The flow diameters of rubberised mixes with the highest rubber content considered, 30%, were on average 5% higher than the GCM reference mix.
Overall, it was indicated that smaller rubber particles could reduce fresh mix workability more than coarser particles. Although rubber is hydrophobic, it is suggested that the smaller the rubber particles were, the more they tended to draw water, possibly due to the presence of the alkali activator which increased the surface roughness of the rubber particle. This could justify the increase in workability with rubber content, yet more in-depth microstructural investigations are required to support the assumption.
The fresh densities of the non-rubberised mixes, shown in Table 3, were very similar to each other and to that of cement mix, and varied between 2436–2571 kg/m3. As expected, mixes with a higher amount of GGBS, had higher densities due to the greater specific gravity of the constituent compared to FA and MS (e.g., G82F09M09R00 versus G45F45M09R00). Moreover, considering that MS is a distinctly light powder, fresh mixes also became lighter with increasing MS content (e.g., G95F00M05R00 vs. G87F00M13R00). Despite the variability of the differences observed, the fresh densities of the non-rubberised geopolymers largely resembled those of the cement-only mix. Fresh density dropped considerably with the incorporation of rubber (Table 3) and this was as expected given that the specific gravity of rubber is significantly lower than that of other constituents.
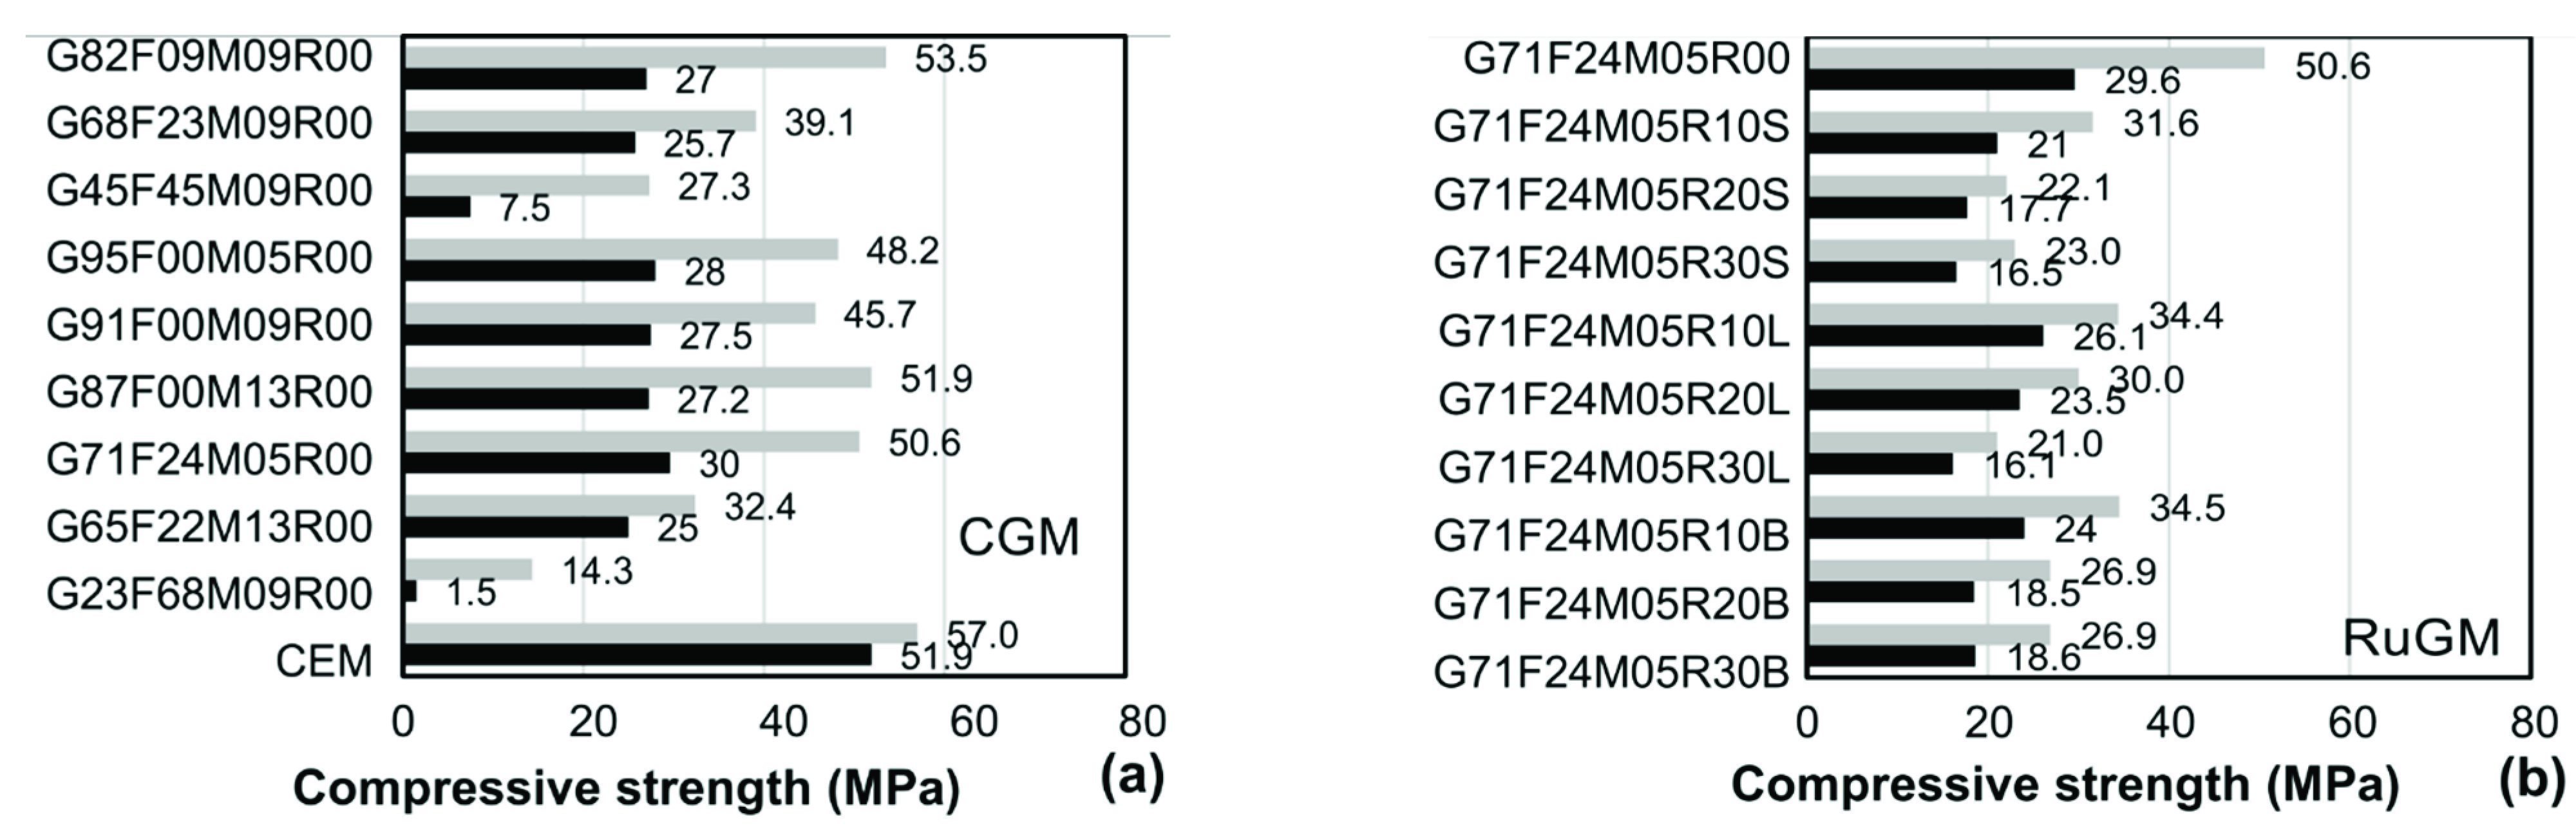
3.2. Mechanical Properties
Figure 5a provides the relationship between 7-day and 28-day compressive strength and binder proportions, whilst Figure 5b the relationship between the same strength and rubber content. By only looking at the GGBS-to-FA ratio, when the FA content increased, the compressive strength reduced. However, mixes made with predominantly GGBS suffered from poor workability as noted before, thus the addition of FA contribute to improving this, also reducing expansion and cracking under sustained load [46]. Although an even split between GGBS and FA provided excellent workability, the 7-day strength was very poor, not sufficient for cast-in-situ structural applications. Mix G45F45M09R00 had only 7.1 MPa strength at 7-days. Considering that a typical value for the compressive strength of structural concrete is 25 MPa, a GGBS-to-FA ratio of 75/25 appeared to strike a suitable balance between workability and strength. These mixes had a minimum 7-day strength of 23.1 MPa, with the 28-day strength varying from 32.4–50.7 MPa, depending on the MS proportion.
MS replacement up to 13% did not appear to show an appreciable difference in the 7 and 28-day compressive strengths of the 100% GGBS binder mixes (G95F00M05R00, G91F00M09R00, G87F00M13R00). There was, however, a steady decline in early and late compressive strengths of mixes with a FA content of 25% as MS content was increased (G71F24M05R00, G68F23M09R00, G65F22M13R00). Increasing MS replacement appeared to affect 28-day strengths more than 7-day strengths. This is likely to be due to a very high amount of silicon dioxide per total binder, with most of the MS and FA particles not being activated. The cement only mix had significantly higher compressive strengths at 7-days, by a factor of 1.7 compared to the best performing CGM mix. However, the 28-day strengths were only around 10% higher than the strongest CGMs, indicating the suitability of such materials for practical applications. By looking at the binder proportion ratios, as well as compressive strength increase from 7 to 28 days, and workability, the best performance was displayed by G71F24M05R00. As noted above, this was considered the reference mix for RuGMs.
Figure 5b displays how compressive strength gradually decreased the more rubber was used to replace its mineral aggregate, and this appeared to be typical of both the 7 and 28-day strengths. This was as expected, considering the rubber particles have a naturally lower stiffness compared to the sand aggregate and may act as voids [59]. In terms of the difference in particle size, mixes incorporating the rubber blend exhibited less variability particularly in the case of the 28-day strengths. This is likely to be due to the rubber blend being adjusted to resemble the aggregate gradation producing a better homogeneity and reduced porosity. Although adding rubber to mix designs has proven to reduce compressive strength, it can significantly alleviate the brittle failures that are typical of CGMs. Hardened mix specimens with greater rubber contents exhibited a visible, horizontal dilation before peak and failure took place slowly unlike the CGM specimens.
The flexural strengths of the CGMs varied between 0.6–2.0 MPa, with similar trends of the compressive strengths as a function of the binder proportions; the higher the GGBS content, the higher the strength. Compared to compressive strength tests, the flexural strengths had very large variations in proportion to the absolute values (Table 3). The presence of rubber particles led to a gradual reduction of flexural strength with an increase in rubber content. This was expected, as the shape of the rubber particles was relatively spherical, not contributing to restraining the post-peak crack mouth opening, which typically occurs for acicular particles [60].
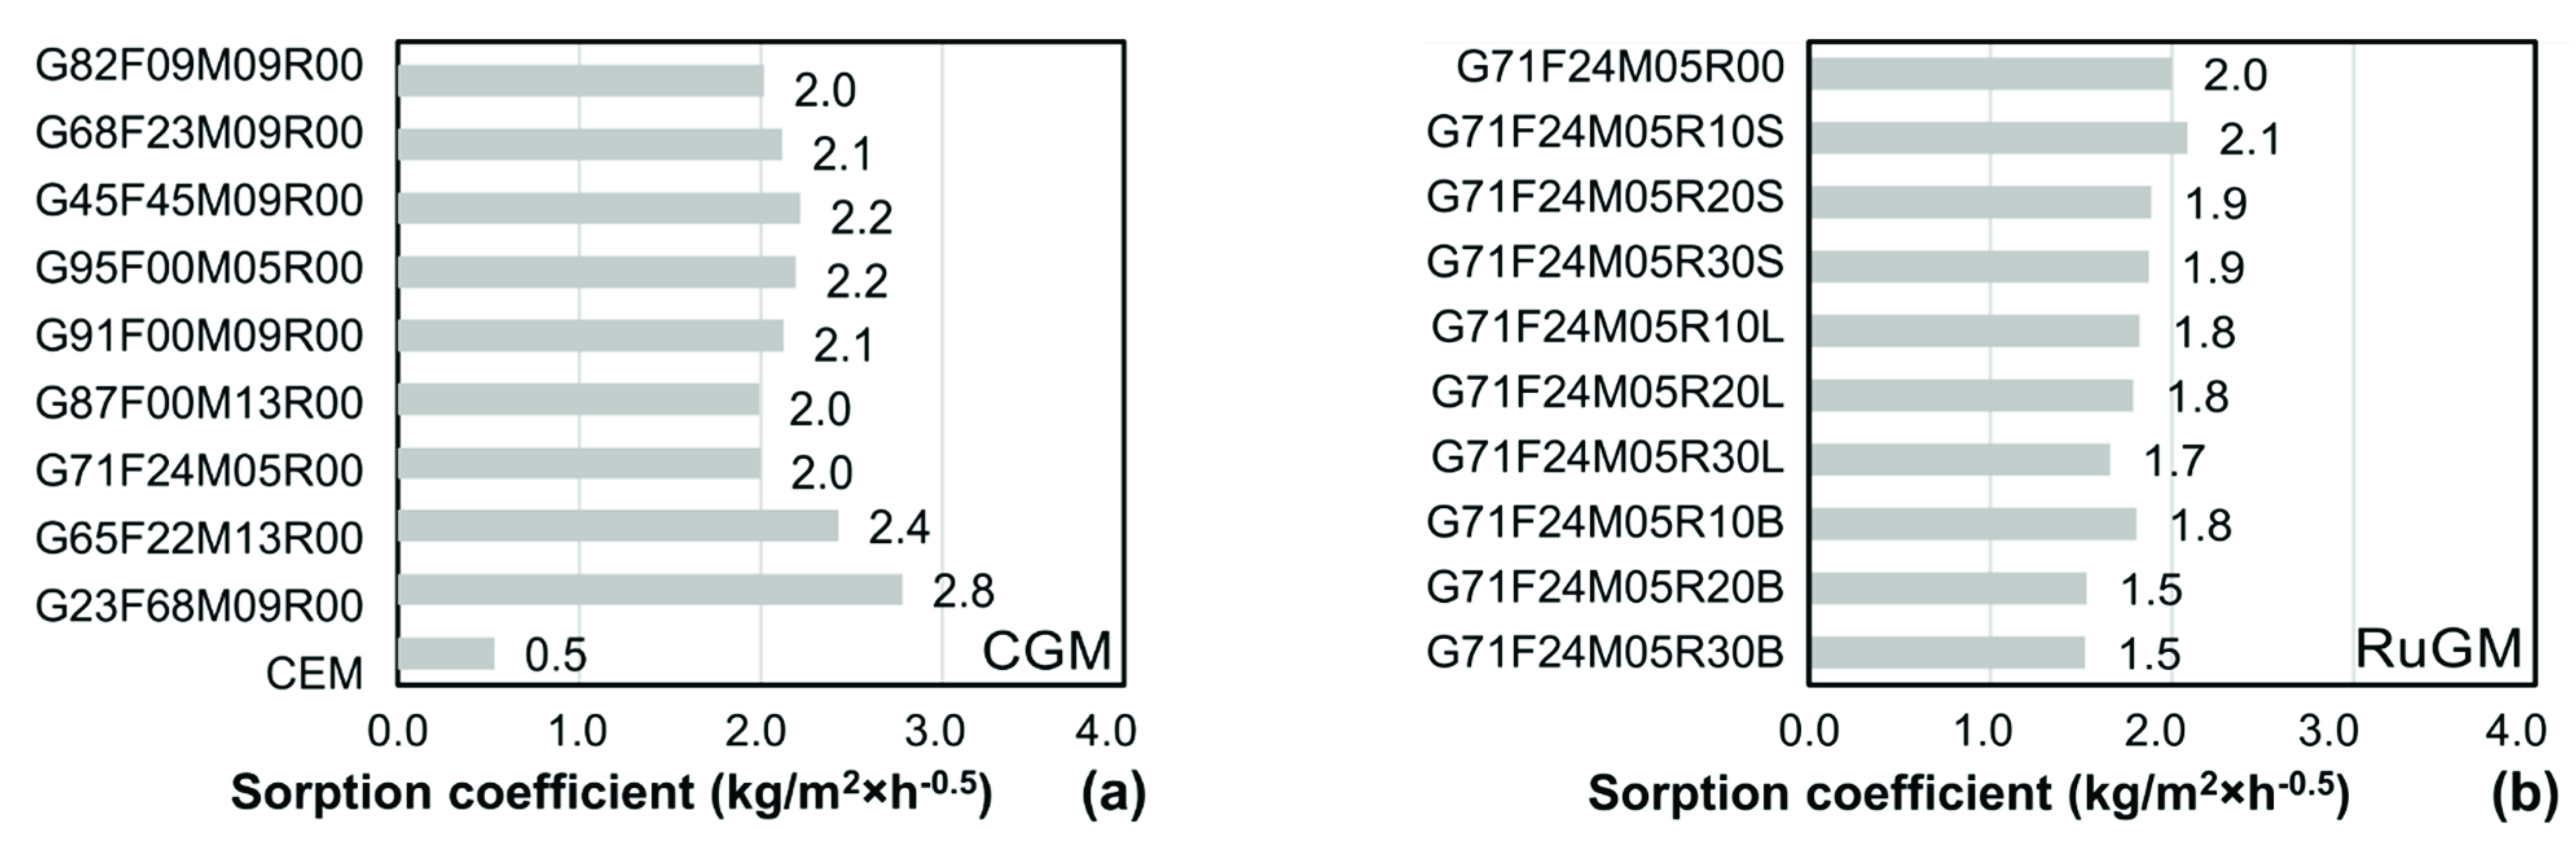
3.3. Capillary Absorption
Water absorption by capillary action is an important feature and measure of material durability as it relates to the water transport properties, and can give qualitative information regarding porosity [61]. Figure 6a depicts the sorption coefficient as the gradient of the water uptake–time curves for the CGM samples, whilst Figure 6b shows the same measure for the RuGM samples. Close inspection on the water uptake–time curves, it was shown what from the CGM mixes, G71F24M05R00 had the slowest water uptake, which was considered the reference for the RuGMs. Mixes with a high amount of FA had the quickest water uptake (G23F68M09R00), thus the poorest performance (GS12/FA87/WG0/A14/P5). By contract, mixes with no FA, and containing GGBS and MS were generally between the above two cases (e.g., G91F00M09R00). The sorption coefficients of high amount FA CGMs from this paper are within the ranges of FA-based CGMs with similar binder proportions from the literature [62,63]. Replacement of sand by rubber had a beneficial influence on the sorption coefficient. Most of the RuGM materials had lower coefficients than the CGM mixes. This may be justified by the hydrophobic nature of the rubber which acted as a barrier for the water transport through the network of pores. As indicated by Figure 6b, the sorption coefficient decreased with an increase in rubber content. As for the compressive strength, mixes incorporating the rubber blend exhibited less variability and lower capillary absorption compared to mixes with relatively lower amounts of rubber. This was likely due to the rubber blend being adjusted to resemble the aggregate gradation producing a better homogeneity and reduced porosity. The cement only mix had the lowest sorption coefficient as well as the lowest water uptake–time gradient. Although CGM and RuGM had higher sorption coefficients, in practice thicker concrete covers in steel reinforced concrete members would overcome issues related to durability. Further detailed investigations on CGM and RuGM are needed to validate the long-term performance and durability of these materials.
4. Comparative Assessments
In this section the experimental tests are combined with embodied carbon estimations in a multi-criteria assessment to determine the efficiency of each mix and provide guidance for practical application as well as limits regarding the exploitation of MS in CGM and RuGM systems. Additionally, an existing strength prediction model for RuC is appraised and validated against the tests from this paper and those available in the literature.
4.1. Embodied Carbon
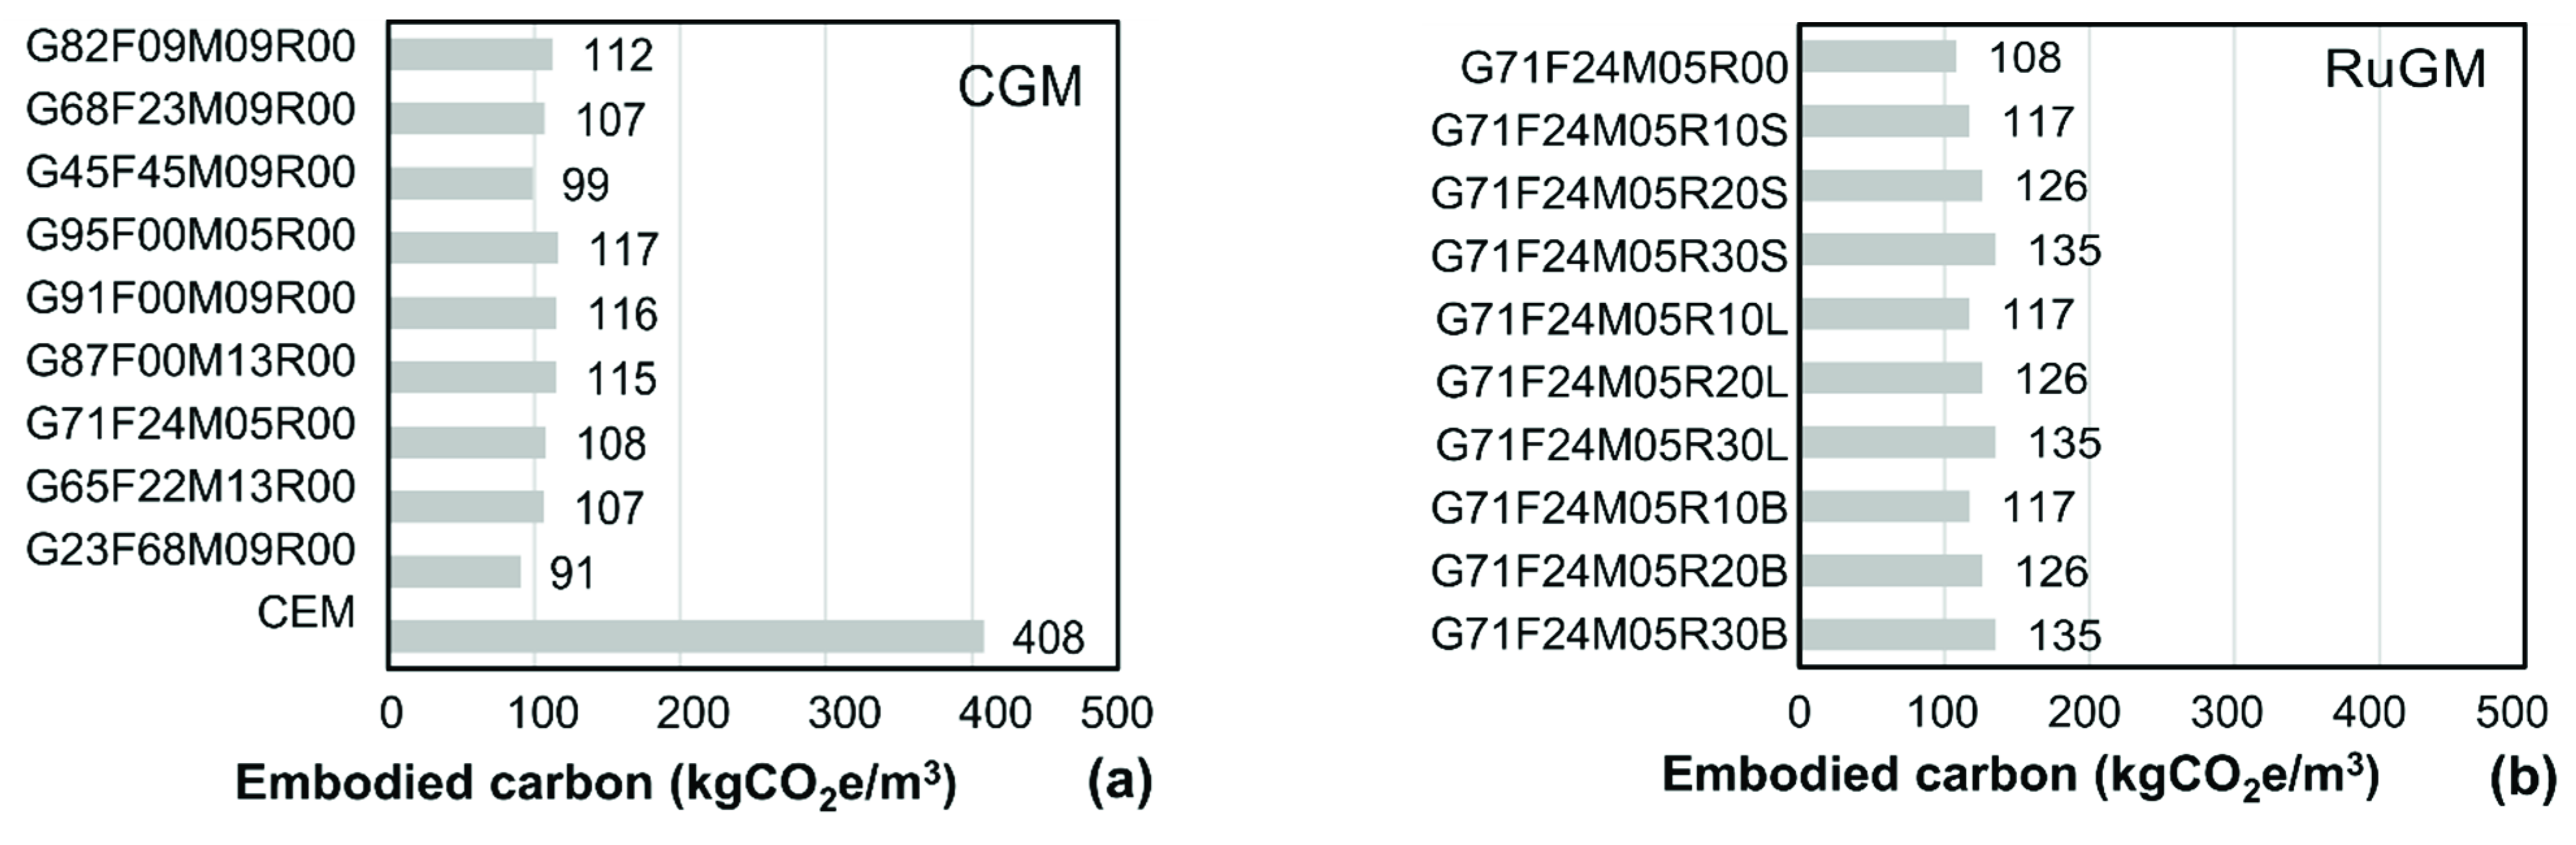
Basic sustainability analysis was carried out by assessing the embodied carbon of each mix, based on the embodied carbon values of its constituents [2]. The embodied carbon considered the effects of various greenhouse gases on the climate by a CO2 equivalence (CO2e) [64]. The life cycle inventory (LCI) used in this paper, depicted in Table 4, was based on values available in the literature [13,65,66,67,68]. The values used for the binders were using data from 2017/18 and represented ‘cradle to-factory-gate’ values as they did not consider transport from the place of manufacture to the ready-mix plant [66]. The recycled rubber production included collection, transport and processing (e.g., shredding and sieving), and avoided impacts due to collection, transport and landfill are not accounted for [69]. The LCI for the sodium metasilicate and superplasticiser was based on the consumption of energy and raw materials, emissions to air and water and solid waste generation, also assuming a ‘cradle-to-factory-gate’ approach [13,67].
These values were multiplied by the amounts of constituents in each mix to provide the embodied carbon of the mixes, shown in Table 2. As depicted in Figure 7, the embodied carbon of GCMs vary between 91 and 117 kgCO2e/m3, which is on average 25% of the corresponding cement-only mortar with 408 kgCO2e/m3. Incorporating rubber in the geopolymer matrix as a replacement for sand, increased the environmental load by 9.4%, 17.6% and 26.2%, for 10%, 20% and 30% rubber replacement, respectively, compared to the CGM reference mix. This was due to the rubber particles which had a higher embodied carbon than the mineral aggregates. However, even the most carbon-intensive RuGM had lower emissions by a factor of 3.0 than the cement-only mortar (135 kgCO2e/m3 versus 408 kgCO2e/m3). Assuming the cubic metre as the main functional unit for carbon assessments clearly showed that both CGM and RuGM were sustainable alternatives to cement mortars.
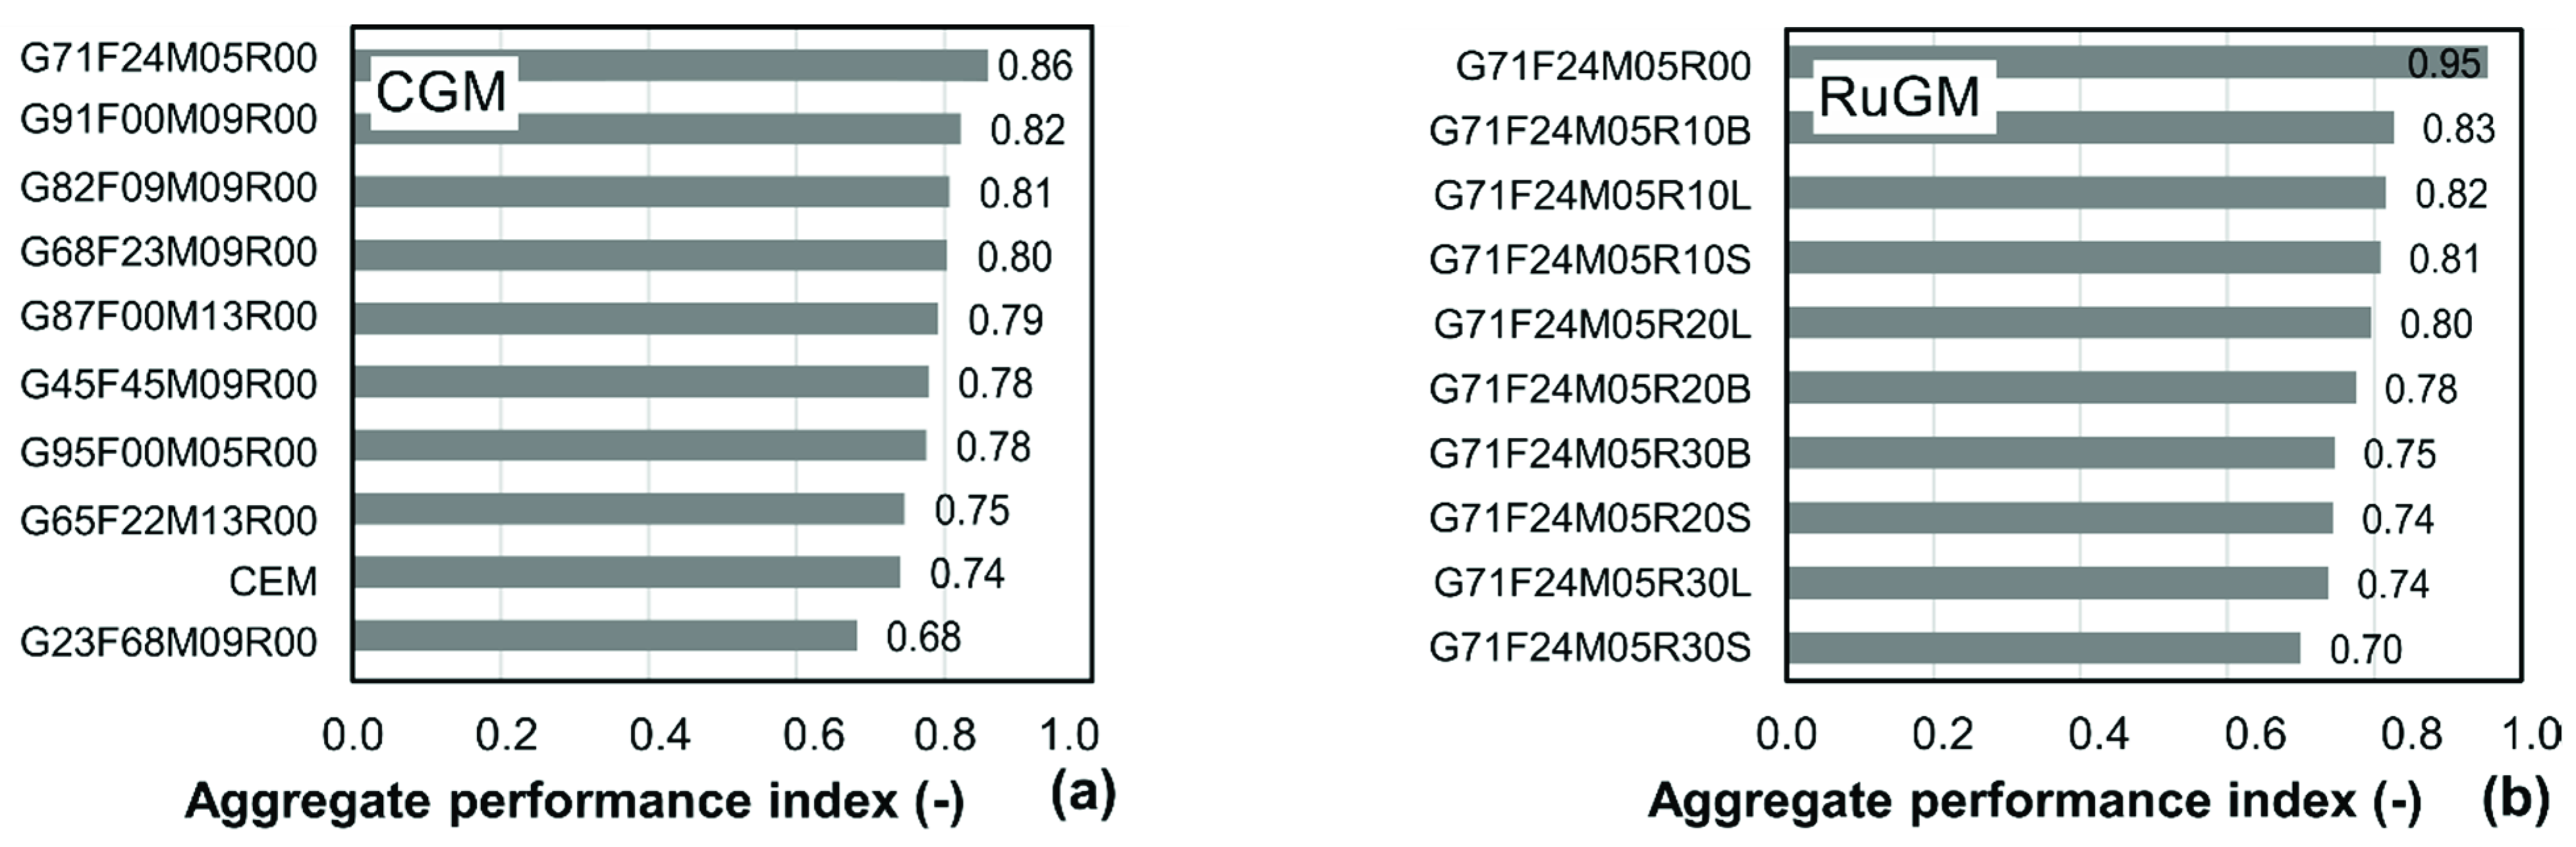
4.2. Multi-Criteria Assessment
A further step can be taken to reveal a more useful metric if the embodied carbon values are considered in combination with strength and workability parameters in a multi-criteria assessment, as a quantitative representation of the best performing GCM mix. To this end a multi-criteria decision-making approach, in which three key parameters of equal weighting, was considered. These parameters were the flow diameter, 28-day compressive strength, and embodied carbon, as measures of workability, mechanical performance, and environmental impact, respectively. The three parameters were divided into beneficial and non-beneficial criteria to differentiate the effect of each parameter on the final performance index. For example, high flow diameter and compressive strengths were beneficial, whilst low values were non-desirable. By contrast, low embodied carbon values were desirable, and high values were non-beneficial. To allow for aggregation of criteria with numerical and comparable data of different units and measures, these were normalised as a function of the criteria type [70].
Figure 8 shows the hierarchy obtained using the approach described above. Aggregate values close to unity indicated the best performance, whilst mixes with values tending to zero were not desirable. The high aggregate performance indices were largely due to the high mechanical properties, as well as enhanced workability and relatively low embodied carbon. It was shown that the best performing mix was G71F24M05R00, which was also chosen as the reference non-rubberised material, whilst the lowest scores were achieved by the high amount-FA mix (G23F68M09R00) and the cement-only mix (CEM). The former had very poor mechanical strengths compared to other mixes, whilst the latter had carbon-intensive cement as its only binder.
The best performing mixes were the three-blend (G71F24M05R00, G68F23M09R00), but a GGBS-MS mix appeared to perform well (G91F00M09R00), particularly due to higher strength and low embodied carbon attributed to MS. With regard to the poorest performing CGM, it is suggested that although FA had a substantially smaller carbon footprint than GGBS, it did not provide a proportional strength output when used in binder proportions larger than 25%. RuGM underperformed in this assessment as their mixes were typically weaker than their CGM reference counterpart, but ductility and energy absorption were not considered in this assessment, though these are the main features for which rubber is incorporated in geopolymers and concrete.
4.3. Strength Prediction Model for RuGM
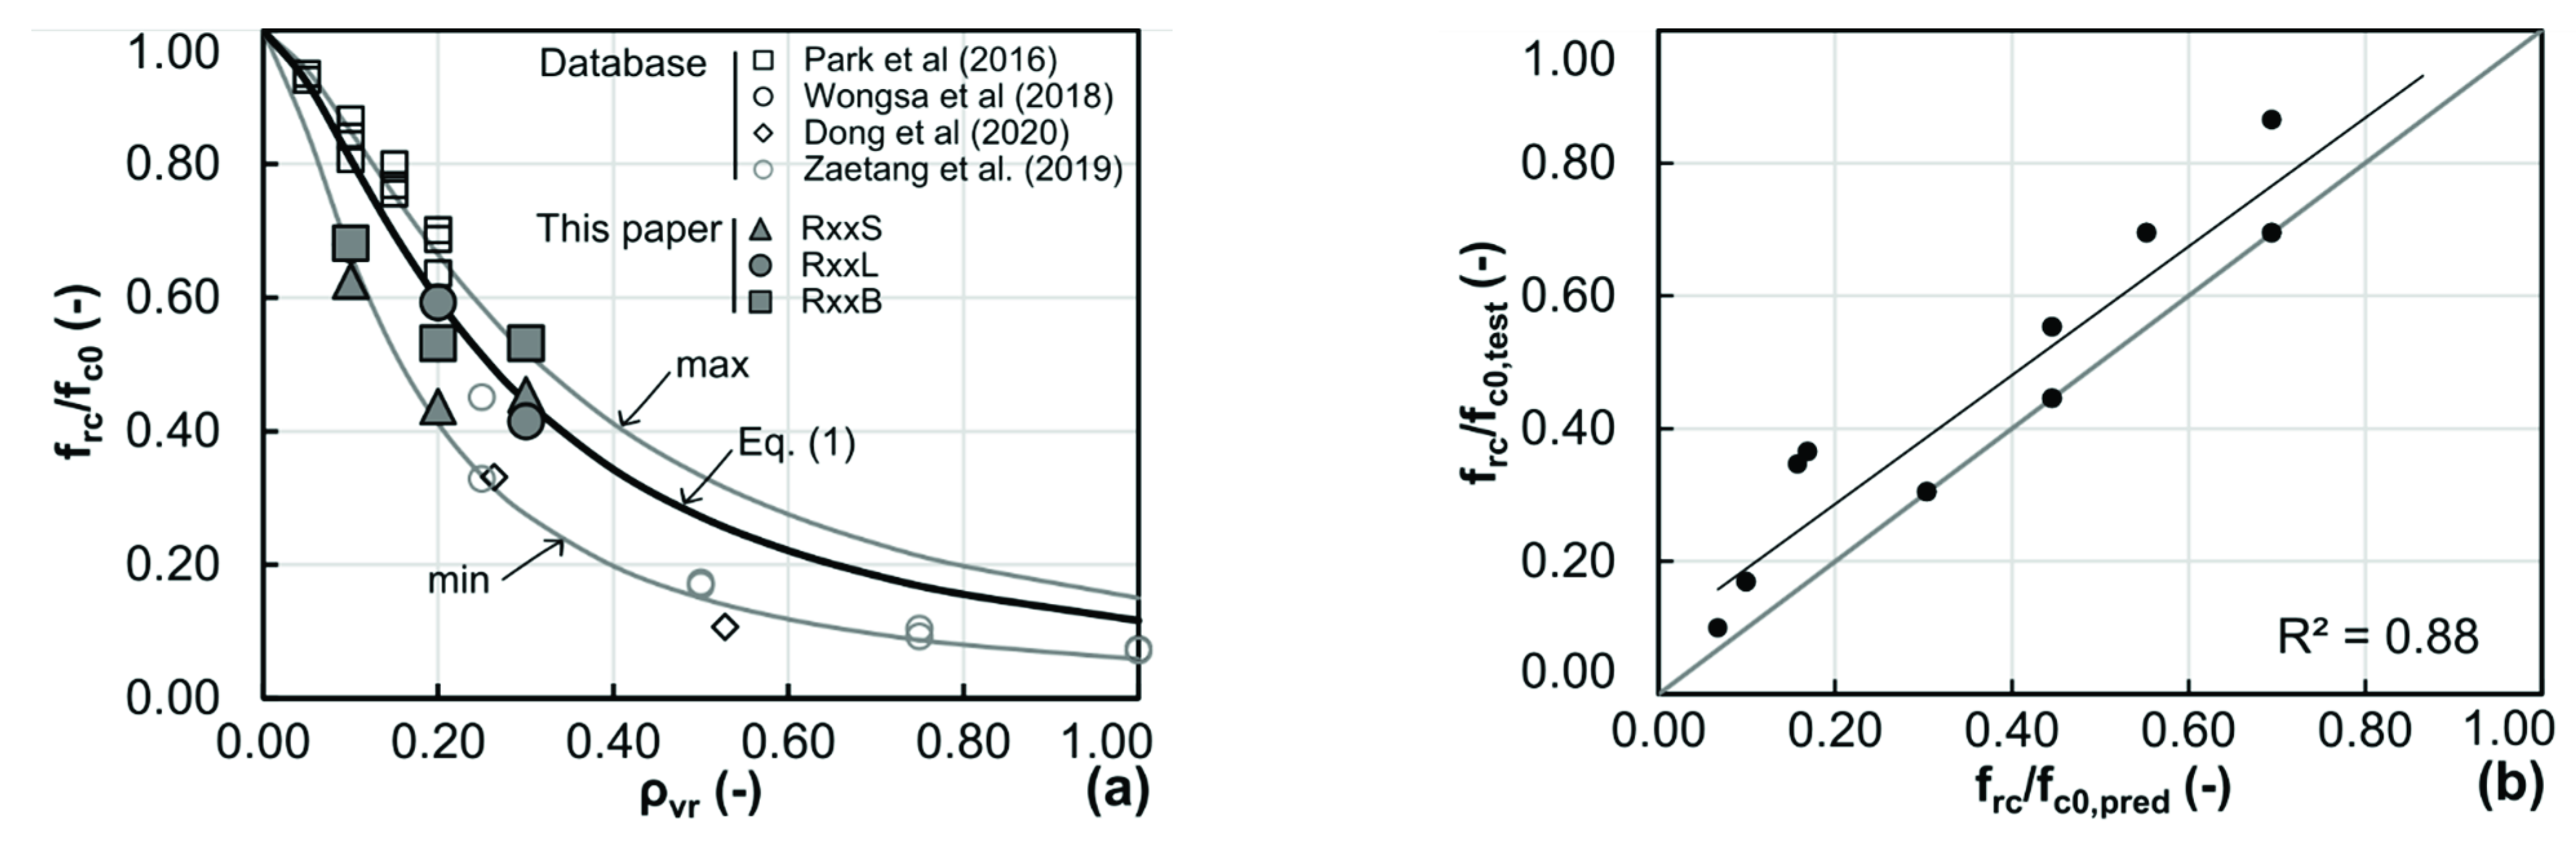
Previous material tests carried out as well as tests from a database of 238 conventional concrete mixes collected from the literature that included more than 700 tests [59], showed that the main parameters governing the strength of rubberised concrete were the volumetric replacement ratio ρvr, the size of replaced aggregate, and characteristics of rubber particles. The volumetric rubber ratio ρvr and the type of replaced mineral aggregate dg,repl are incorporated in the formulation (Equation (1)), which was also used for other forms of waste materials as replacement of sand [71]. The latter is represented by a factor λ which accounts for the size range of the mineral aggregate replaced; i.e., fine (λ = 2.43 for 0 mm < dg,repl < 5 mm), coarse (λ = 2.90 for 5 mm < dg,repl ≤ dg,max) or coarse and fine (λ = 2.08 for 0 mm < dg,repl ≤ dg,max).
As noted in the introduction, there is a very limited number of studies investigating the influence of rubber particles on the physical and mechanical properties of geopolymer systems. A total of 39 mixes that include both those with rubber and non-rubberised reference mixes, were however collated in a database, of which nine are from this paper. These include largely FA-based GGMs [29,32,33], and the multi-binder systems from this paper which have a high proportion of GGBS. The rubber replacement was largely below 30% [29,33], but two investigations reported full replacement of mineral aggregates by recycled rubber [32,34]. Whilst rubber replacements above 30% are impractical due to large reductions of mechanical properties, having datapoints beyond this value helps in providing confidence to the calibration factor λ.
where [-].
Figure 9a illustrates a representation of Equation (1), using a minimum λ = 2.0 and a maximum λ = 4.0 as the upper and lower bounds, respectively, of the dataset. As for rubberised concrete, replacement of sand with rubber particles of similar size the best prediction for rubberised geopolymer mortars is for λ = 2.43. This value ensures reliable predictions of the compressive strength degradation factor. In practice, this parameter can be obtained by assessing the compressive strength properties of the reference material and a case with plastic aggregates through testing. A direct comparison between the database fc/fc0 values and those predicted by Equation (1) indicates that the COV is about 20% and the test-to-predicted ratio is 1.18, which are within expected ranges with good control of testing parameters [72]. Additionally, Figure 9b shows the relationship between test fc/fc0 and estimated fc/fc0 values. It is shown that the data points are above of 1:1 line, generally indicating safe estimates for all members.
5. Conclusions
This paper examined the performance of multi-binder conventional geopolymer mixes (GCMs) with relatively high early strength and cured at ambient temperature. Mixes incorporating ground granulated blast-furnace slag (GGBS), fly ash (FA) and microsilica (MS) and sodium metasilicate anhydrous, were assessed in terms of workability, mechanical properties and embodied carbon. The best performing mix was then used as a reference for rubberised geopolymer mixes (RuGM). Rubber particles of various sizes from recycled car tyres were incorporated in the mix as a replacement of mineral aggregates in proportions up to 30% by volume. Experimental results from over 170 tests were combined with embodied carbon estimations in a multi-criteria assessment to determine the of each mix efficiency. The main remarks are outlined below.
- It is generally shown that as the ratio of FA to GGBS content increased, workability was enhanced, and regardless of the FA-to-GGBS ratio, the optimal proportion of binder replacement by MS was found to be 5–9%. A mix with a 75/25 GGBS-to-FA ratio, in which 5% MS was added had the best performance.
- The presence of rubber had a minor effect on the workability. Flow diameters of rubberised mixes with the highest rubber content considered, 30%, were on average 5% higher than the GCM reference mix. Smaller rubber particles reduced the workability to a greater extent than coarser particles.
- In terms of fresh density, mixes with a higher amount of GGBS had higher densities due to the superior specific gravity of the constituent compared to FA and MS. Incorporation of rubber reduces the fresh density proportional with the rubber content, as the specific gravity of rubber is significantly lower than that of other constituents.
- Mixes with a high amount of GGBS had relatively high strengths, whilst mixes with a high amount of FA had relatively poor strengths. A GGBS-to-FA ratio of 75/25 provides a suitable balance between workability and strength, and also the best performance in terms of capillary absorption from all CGMs. A high amount of MS replacement appeared to affect compressive strength, possibly due to a very high amount of silicon dioxide per total binder.
- A mix with a 75/25 GGBS-to-FA ratio, in which 5% MS was added had the best performance with a gradual increase in compressive strength from 7 to 28 days (30.0 to 50.6 MPa, respectively), comparable to that of the cement-only mortar.
- As expected, the presence of rubber particles reduced the mechanical properties or RuGM proportionally with the rubber amount, but test observations indicated that failure took place in a more ductile manner compared to CGMs. The flexural strengths largely reflected the trends observed in compressive tests.
- Finally, CGMs had between 91–117 kgCO2e/m3, with those with a higher amount of GGBS being more carbon-intensive. The cement-only mortar had significantly higher embodied carbon, with factors ranging between 3.48 to 4.20, compared with the CGM mixes.
- As the compressive strengths of CGMs from this paper vary between 14.3–51.9 MPa for the same amount of binder, whilst the embodied carbon values are within a much narrower range, a multi-criteria assessment was undertaken to highlight the material performance using three key parameters of equal weighting.
- The best performing CGM using this criterion is the material incorporating a 75/25 GGBS-to-FA ratio and 5% MS of the total binder, due to high strengths, appropriate workability and excellent sustainability attributes. The lowest scores were achieved by the high amount-FA CGMs and the cement-only mix, due to poor strengths and high embodied carbon, respectively.
- RuGM underperformed in this assessment as their mixes were typically weaker than their CGM reference counterpart, but ductility and energy absorption were not considered in this assessment, though these are the main features for which rubber is incorporated in geopolymers and concrete.
- Finally, a strength degradation model was validated against the tests from this paper and literature to estimate the compressive strength of RuGM, providing reliable predictions over a wide range of rubber contents.
Author Contributions
Conceptualization, D.V.B.; methodology, A.A. and D.V.B.; validation, D.V.B.; formal analysis, A.A. and D.V.B.; investigation, A.A. and D.V.B.; resources, D.V.B.; data curation, A.A. and D.V.B.; writing—original draft preparation, A.A. and D.V.B.; writing—review and editing, D.V.B.; supervision, D.V.B.; project administration, D.V.B.; funding acquisition, D.V.B. All authors have read and agreed to the published version of the manuscript.
Funding
This research has been supported by internal funding provided by the Department of Civil and Environmental Engineering at the University of Surrey.
Institutional Review Board Statement
Not applicable.
Informed Consent Statement
Not applicable.
Data Availability Statement
Data may be made available on request.
Acknowledgments
The authors gratefully acknowledge the support provided by the University of Surrey for provision of facilities to undertake the experimental work. The support of Adria Abruzzo, Hanson, Elkem and Sika through the provided materials is gratefully acknowledged.
Conflicts of Interest
The authors declare no conflict of interest.
References
- Lehne, J.; Preston, F. Making Concrete Change: Innovation in Low-Carbon Cement and Concrete; Chatham House Report; Energy Enivronment and Resources Department: London, UK, 2018; pp. 1–66. [Google Scholar]
- Sabău, M.; Bompa, D.V.; Silva, L.F. Comparative carbon emission assessments of recycled and natural aggregate concrete: Environmental influence of cement content. Geosci. Front. 2021, 12, 101235. [Google Scholar] [CrossRef]
- Okoye, F.N. Geopolymer binder: A veritable alternative to Portland cement. Mater. Today Proc. 2017, 4, 5599–5604. [Google Scholar] [CrossRef]
- Živica, V.; Palou, M.; Kuzielová, E.; Žemlička, M. Super high strength metabentonite based geopolymer. Procedia Eng. 2016, 151, 133–140. [Google Scholar] [CrossRef] [Green Version]
- Cheng, T.W.; Chiu, J.P. Fire-resistant geopolymer produced by granulated blast furnace slag. Miner. Eng. 2003, 16, 205–210. [Google Scholar] [CrossRef]
- Ge, X.; Duran, L.; Tao, M.; DeGroot, D.J.; Li, E.; Zhang, G. Characteristics of underwater cast and cured geopolymers. Cem. Concr. Compos. 2020, 114, 103783. [Google Scholar] [CrossRef]
- Luukkonen, T.; Abdollahnejad, Z.; Yliniemi, J.; Kinnunen, P.; Illikainen, M. Comparison of alkali and silica sources in one-part alkali-activated blast furnace slag mortar. J. Clean. Prod. 2018, 187, 171–179. [Google Scholar] [CrossRef]
- Sata, V.; Chindaprasirt, P. Use of construction and demolition waste (CDW) for alkali-activated or geopolymer concrete. In Advances in Construction and Demolition Waste Recycling; Woodhead Publishing: Swaston, UK, 2020; pp. 385–403. [Google Scholar] [CrossRef]
- Nath, P.; Sarker, P.K. Effect of GGBFS on setting, workability and early strength properties of fly ash geopolymer concrete cured in ambient condition. Constr. Build. Mater. 2014, 66, 163–171. [Google Scholar] [CrossRef] [Green Version]
- Bahadori, A. Essentials of Coating, Painting, and Lining for the Oil, Gas and Petrochemical Industries; Gulf Professional Publishing: Huston, TX, USA, 2015. [Google Scholar]
- Lewis, R.; Fidjestøl, P. Lea’s Chemistry of Cement and Concrete. In 11—Microsilica as an Addition, 5th ed.; Butterworth-Heinemann: Oxford, UK, 2019; pp. 509–535. [Google Scholar]
- Ryu, G.S.; Lee, Y.B.; Koh, K.T.; Chung, Y.S. The mechanical properties of fly ash-based geopolymer concrete with alkaline activators. Constr. Build. Mater. 2013, 47, 409–418. [Google Scholar] [CrossRef]
- Copetti Callai, S.; Tataranni, P.; Sangiorgi, C. Preliminary Evaluation of Geopolymer Mix Design Applying the Design of Experiments Method. Infrastructures 2021, 6, 35. [Google Scholar] [CrossRef]
- Zhang, Z.; Wang, H. Alkali-activated cements for protective coating of OPC concrete. In Handbook of Alkali-Activated Cements, Mortars and Concretes; Woodhead Publishing: Swaston, UK, 2015; pp. 605–626. [Google Scholar] [CrossRef]
- Bompa, D.V.; Xu, B.; Corbu, O. Influence of Waste Glass Powder on One-Part Multi-Binder Ambient Cured Geopolymer Mortars; Report; University of Surrey: Guildford, UK, 2021. [Google Scholar]
- Ma, C.; Long, G.; Shi, Y.; Xie, Y. Preparation of cleaner one-part geopolymer by investigating different types of commercial sodium metasilicate in China. J. Clean. Prod. 2018, 201, 636–647. [Google Scholar] [CrossRef]
- Luukkonen, T.; Abdollahnejad, Z.; Yliniemi, J.; Kinnunen, P.; Illikainen, M. One-part alkali-activated materials: A review. Cem. Concr. Res. 2018, 103, 21–34. [Google Scholar] [CrossRef]
- Provis, J.L.; van Deventer, J.S.J. Alkali Activated Materials: State-of-the-Art Report RILEM TC 224-AAM; Springer: Dordrecht, The Netherlands, 2014. [Google Scholar] [CrossRef]
- Nematollahi, B.; Sanjayan, J.; Qiu, J.; Yang, E.H. Micromechanics-based investigation of a sustainable ambient temperature cured one-part strain hardening geopolymer composite. Constr. Build. Mater. 2017, 131, 552–563. [Google Scholar] [CrossRef]
- Ke, X.; Bernal, S.A.; Provis, J.L. Controlling the reaction kinetics of sodium carbonate-activated slag cements using calcined layered double hydroxides. Cem. Concr. Res. 2016, 81, 24–37. [Google Scholar] [CrossRef] [Green Version]
- Sturm, P.; Gluth, G.J.G.; Brouwers, H.J.H.; Kühne, H.C. Synthesizing one-part geopolymers from rice husk ash. Constr. Build. Mater. 2016, 124, 961–966. [Google Scholar] [CrossRef]
- Dong, M.; Elchalakani, M.; Karrech, A. Development of high strength one-part geopolymer mortar using sodium metasilicate. Constr. Build. Mater. 2020, 236, 117611. [Google Scholar] [CrossRef]
- Kara De Maeijer, P.; Craeye, B.; Blom, J.; Bervoets, L. Crumb Rubber in Concrete—The Barriers for Application in the Construction Industry. Infrastructures 2021, 6, 116. [Google Scholar] [CrossRef]
- Bušić, R.; Miličević, I.; Šipoš, T.; Strukar, K. Recycled Rubber as an Aggregate Replacement in Self-Compacting Concrete—Literature Overview. Materials 2018, 11, 1729. [Google Scholar] [CrossRef] [PubMed] [Green Version]
- Bompa, D.V.; Elghazouli, A.Y. Creep properties of recycled tyre rubber concrete. Constr. Build. Mater. 2019, 209, 126–134. [Google Scholar] [CrossRef] [Green Version]
- Tate, S.M.; Hamid, H.F.; Durham, S.A.; Chorzepa, M.G. Investigation into Recycled Rubber Aggregates and Steel Wire Fiber for Use in Concrete Subjected to Impact Loading. Infrastructures 2020, 5, 82. [Google Scholar] [CrossRef]
- He, L.; Ma, Y.; Liu, Q.; Mu, Y. Surface modification of crumb rubber and its influence on the mechanical properties of rubber-cement concrete. Constr. Build. Mater. 2016, 120, 403–407. [Google Scholar] [CrossRef]
- Bompa, D.V.; Elghazouli, A.Y. Stress–strain response and practical design expressions for FRP-confined recycled tyre rubber concrete. Constr. Build. Mater. 2020, 237, 117633. [Google Scholar] [CrossRef]
- Jalal, M.; Grasley, Z.; Nassir, N.; Jalal, H. Strength and dynamic elasticity modulus of rubberized concrete designed with ANFIS modeling and ultrasonic technique. Constr. Build. Mater. 2020, 240, 117920. [Google Scholar] [CrossRef]
- Xu, B.; Bompa, D.V.; Elghazouli, A.Y. Cyclic stress–strain rate-dependent response of rubberised concrete. Constr. Build. Mater. 2020, 254, 119253. [Google Scholar] [CrossRef]
- Su, H.; Yang, J.; Ling, T.C.; Ghataora, G.S.; Dirar, S. Properties of concrete prepared with waste tyre rubber particles of uniform and varying sizes. J. Clean. Prod. 2015, 91, 288–296. [Google Scholar] [CrossRef] [Green Version]
- Park, Y.; Abolmaali, A.; Kim, Y.H.; Ghahremannejad, M. Compressive strength of fly ash-based geopolymer concrete with crumb rubber partially replacing sand. Constr. Build. Mater. 2016, 118, 43–51. [Google Scholar] [CrossRef]
- Azmi, A.A.; Abdullah, M.M.A.B.; Ghazali, C.M.R.; Sandu, A.V.; Hussin, K. Effect of crumb rubber on compressive strength of fly ash based geopolymer concrete. In Proceedings of the MATEC Web of Conferences, Phuket, Thailand, 1–2 May 2016; Volume 78, p. 01063. [Google Scholar] [CrossRef] [Green Version]
- Aslani, F.; Deghani, A.; Asif, Z. Development of lightweight rubberized geopolymer concrete by using polystyrene and recycled crumb-rubber aggregates. J. Mater. Civ. Eng. 2020, 32, 04019345. [Google Scholar] [CrossRef]
- Wongsa, A.; Sata, V.; Nematollahi, B.; Sanjayan, J.; Chindaprasirt, P. Mechanical and thermal properties of lightweight geopolymer mortar incorporating crumb rubber. J. Clean. Prod. 2018, 195, 1069–1080. [Google Scholar] [CrossRef]
- Dong, M.; Elchalakani, M.; Karrech, A.; Yang, B. Strength and durability of geopolymer concrete with high volume rubber replacement. Constr. Build. Mater. 2021, 274, 121783. [Google Scholar] [CrossRef]
- Zaetang, Y.; Wongsa, A.; Chindaprasit, P.; Sata, V. Utilisation of crumb rubber as aggregate in high calcium fly ash geopolymer mortars. Int. J. Geomate 2019, 17, 158–165. [Google Scholar] [CrossRef]
- Elzeadani, M.; Bompa, D.V.; Elghazouli, A.Y. Rubberised Geopolymer Concrete: A Review; Report; Imperial College London: London, UK, 2021. [Google Scholar]
- Hanson, n.d. High Strength 52,5N Technical Data Sheet. Available online: https://www.hanson-packedproducts.co.uk/en/system/files_force/assets/document/36/11/technical-data-sheet-high-strength_1.pdf?download=1 (accessed on 11 October 2021).
- BSI. BS EN 197-1:2011 Cement—Composition, Specifications and Conformity Criteria for Common Cements; BSI: London, UK, 2011. [Google Scholar]
- Hanson Port Talbot, n.d. GGBS Technical Data Sheet. Available online: https://www.hanson.co.uk/system/files_force/assets/document/9d/b2/port_talbot_regen_ggbs_-_tds.pdf?download=1 (accessed on 11 October 2021).
- BSI. BS EN 196-2:2013 Method of Testing Cement—Chemical Analysis of Cement; BSI: London, UK, 2013. [Google Scholar]
- Siddique, R. (Ed.) Self-Compacting Concrete: Materials, Properties and Applications; Woodhead Publishing: Swaston, UK, 2019. [Google Scholar]
- Wan, H.; Shui, Z.; Lin, Z. Analysis of geometric characteristics of GGBS particles and their influences on cement properties. Cem. Concr. Res. 2004, 34, 133–137. [Google Scholar] [CrossRef]
- BSI. BS EN 450-1:2012 Fly Ash for Concrete—Definition, Specifications and Conformity Criteria; BSI: London, UK, 2013. [Google Scholar]
- CEMEX. Fly Ash. 2020. Available online: https://www.cemex.co.uk/fly-ash.aspx (accessed on 11 October 2021).
- Thomas, M. Optimizing the Use of Fly Ash in Concrete; Portland Cement Association: Skokie, IL, USA, 2007. [Google Scholar]
- ELKEM, n.d. Elkem Microsilica Grade 940 for Concrete. Available online: https://www.elkem.com/globalassets/silicon-materials/construction/con-940-pds.pdf (accessed on 11 October 2021).
- Khatib, J. (Ed.) Sustainability of Construction Materials; Woodhead Publishing: Swaston, UK, 2016. [Google Scholar]
- Bu, J.; Tian, Z. Relationship between pore structure and compressive strength of concrete: Experiments and statistical modeling. Sādhanā 2016, 41, 337–344. [Google Scholar] [CrossRef] [Green Version]
- Atom Scientific, n.d. Sodium Metasilicate Anhydrous. Available online: https://atomscientific.com/product/sodium_metasilicate_anhydrous (accessed on 10 October 2021).
- Wang, S.D.; Scrivener, K.L.; Pratt, P.L. Factors affecting the strength of alkali-activated slag. Cem. Concr. Res. 1994, 24, 1033–1043. [Google Scholar] [CrossRef]
- BSI. BS EN 933-1:2012 Tests for Geometrical Properties of Aggregates—Part 1: Determination of Particle Size Distribution—Sieving Method; BSI: London, UK, 2012. [Google Scholar]
- Sika, n.d. Sika® ViscoFlow® 2000. Available online: https://sikaconcrete.co.uk/products-systems/sika-viscoflow-2000/ (accessed on 10 October 2021).
- BSI. BS EN 1015-3:1999 Methods of Test for Mortar for Masonry—Part 3: Determination of Consistence of Fresh Mortar (by Flow Table); BSI: London, UK, 1999. [Google Scholar]
- BS EN 1015-11:1999 Methods of Test for Mortar for Masonry—Part 11: Determination of Flexural and Compressive Strength of Hardened Mortar; BSI: London, UK, 1999.
- BSI. BS EN 13057:2002 Products and Systems for the Protection and Repair of Concrete Structures—Test Methods—Determination of Resistance of Capillary Absoroption; BSI: London, UK, 2002. [Google Scholar]
- Levy, S.M. Section 5—Calculations Relating to Concrete and Masonry. In Construction Calculations Manual; Levy, S.M., Ed.; Butterworth-Heinemann: Waltham, MA, USA, 2012; pp. 211–264. [Google Scholar]
- Bompa, D.V.; Elghazouli, A.Y.; Xu, B.; Stafford, P.J.; Ruiz-Teran, A.M. Experimental assessment and constitutive modelling of rubberised concrete materials. Constr. Build. Mater. 2017, 137, 246–260. [Google Scholar] [CrossRef] [Green Version]
- Xu, B.; Bompa, D.V.; Elghazouli, A.Y.; Ruiz-Teran, A.M.; Stafford, P.J. Behaviour of rubberised concrete members in asymmetric shear tests. Constr. Build. Mater. 2018, 159, 361–375. [Google Scholar] [CrossRef]
- Albitar, M.; Ali, M.M.; Visintin, P.; Drechsler, M. Durability evaluation of geopolymer and conventional concretes. Constr. Build. Mater. 2017, 136, 374–385. [Google Scholar] [CrossRef]
- Tekin, I.; Gencel, O.; Gholampour, A.; Oren, O.H.; Koksal, F.; Ozbakkaloglu, T. Recycling zeolitic tuff and marble waste in the production of eco-friendly geopolymer concretes. J. Clean. Prod. 2020, 268, 122298. [Google Scholar] [CrossRef]
- Valencia-Saavedra, W.G.; de Gutiérrez, R.M.; Puertas, F. Performance of FA-based geopolymer concretes exposed to acetic and sulfuric acids. Constr. Build. Mater. 2020, 257, 119503. [Google Scholar] [CrossRef]
- Horvath, A. Decision-Making in Electricity Generation Based on Global Warming Potential and Life-Cycle Assessment for Climate Change; Final Report; (UCEI) Energy Policy and Economics Working Paper Series; UC Berkeley University of California Energy Institute: Berkeley, CA, USA, 2005; 15p. [Google Scholar]
- Black, L. Low clinker cement as a sustainable construction material. In Sustainability of Construction Materials; Woodhead Publishing: Swaston, UK, 2016; pp. 415–457. [Google Scholar]
- The Concrete Centre. MPA Specifying Sustainable Concrete; The Concrete Centre: London, UK, 2020. [Google Scholar]
- European Federation of Concrete Admixture Associations. EFCA Environmental Declaration Superplasticizing Admixtures—2002, EFCA. Available online: http://www.efca.info/admixtures/environmental-and-sustainability-aspects/environmental-product-declarations-epd/ (accessed on 10 October 2021).
- Jones, R.; McCarthy, M.; Newlands, M. Fly ash route to low embodied CO2 and implications for concrete construction. In Proceedings of the World of Coal Ash Conference, Denver, CO, USA, 9–12 May 2011. [Google Scholar]
- Fantilli, A.P.; Chiaia, B.; Gorino, A. Ecological and mechanical assessment of lightweight fiber-reinforced concrete made with rubber or expanded clay aggregates. Constr. Build. Mater. 2016, 127, 692–701. [Google Scholar] [CrossRef]
- Vafaei, N.; Ribeiro, R.A.; Camarinha-Matos, L.M. April. Normalization techniques for multi-criteria decision making: Analytical hierarchy process case study. In Doctoral Conference on Computing, Electrical and Industrial Systems; Springer: Cham, Switzerland, 2016; pp. 261–269. [Google Scholar] [CrossRef] [Green Version]
- Bompa, D.V.; Xu, B.; Elghazouli, A.Y. Constitutive modelling and mechanical properties of cementitious composites incorporating recycled vinyl banner plastics. Constr. Build. Mater. 2021, 275, 122159. [Google Scholar] [CrossRef]
- Neville, A.M. The relation between standard deviation and mean strength of concrete test cubes. Mag. Concr. Res. 1959, 11, 75–84. [Google Scholar] [CrossRef]
Figure 1.
(a) mix constituents, (b) sieve analysis of mineral aggregates and rubber particles.

Figure 2.
Methodology: (a) compression tests, (b) flexural tests, (c) capillary absorption.

Figure 3.
The flow diameter of a CGM with a high amount of GGBS (G91F00M09R00).

Figure 4.
Flow diameter for: (a) CGM, (b) RuGM.

Figure 5.
Compressive strength results for: (a) CGM, (b) RuGM (note: black bars represent the compressive strength at 7 days, whilst the grey bars represent the compressive strength at 28 days).
Figure 5.
Compressive strength results for: (a) CGM, (b) RuGM (note: black bars represent the compressive strength at 7 days, whilst the grey bars represent the compressive strength at 28 days).

Figure 6.
Sorption coefficient for: (a) CGM, (b) RuGM.

Figure 7.
Embodied carbon for: (a) CGM, (b) RuGM.

Figure 8.
Aggregate performance index for: (a) CGM, (b) RuGM.

Figure 9.
Compressive strength modelling: (a) relationship between strength ratio and rubber content, (b) function fitness.
Figure 9.
Compressive strength modelling: (a) relationship between strength ratio and rubber content, (b) function fitness.


Table 1.
Properties of binders and activator.
| Oxide Composite | Fly Ash S [46] | GGBS [41] | Microsilica [48] | CEM I 52, 5R Cement [39] | Sodium Meta-Silicate Anhydrous [51] |
|---|---|---|---|---|---|
| SiO2 | 54.14 | 36.10 | >90 | 19.9 | 46.0 |
| Al2O3 | 26.65 | 11.90 | - | 5.2 | - |
| CaO | 3.36 | 40.80 | - | 63.5 | - |
| Fe2O3 | 6.51 | 0.50 | - | 3.4 | - |
| Na2O | 1.07 | - | - | 0.8 | 50.5 |
| K2O | 2.58 | - | - | 0.7 | - |
| MgO | 1.2 | 8.00 | - | 1.7 | - |
Table 2.
Mix designs.
| GGBS (kg/m3) | Fly Ash (kg/m3) | Microsilica (kg/m3) | Cement (kg/m3) | Activator (kg/m3) | Rubber < 0.5 mm (kg/m3) | Rubber < 2.5 mm (kg/m3) | Rubber < 4 mm (kg/m3) | Sand (kg/m3) | Water (L/m3) | |
|---|---|---|---|---|---|---|---|---|---|---|
| G82F09M09R00 | 376 | 42 | 42 | - | 37 | - | - | - | 1621 | 205 |
| G68F23M09R00 | 313 | 105 | 42 | - | 37 | - | - | - | 1606 | 205 |
| G45F45M09R00 | 209 | 209 | 42 | - | 37 | - | - | - | 1582 | 205 |
| G95F00M05R00 | 438 | 22 | - | 37 | - | - | - | 1637 | 205 | |
| G91F00M09R00 | 418 | 42 | - | 37 | - | - | - | 1632 | 205 | |
| G87F00M13R00 | 400 | 60 | - | 37 | - | - | - | 1628 | 205 | |
| G71F24M05R00 | 328 | 110 | 22 | 37 | 1610 | 205 | ||||
| G65F22M13R00 | 300 | 100 | 60 | - | 37 | - | - | - | 1602 | 205 |
| G23F68M09R00 | 105 | 313 | 42 | - | 37 | - | - | - | 1557 | 205 |
| CEM | - | - | - | 460 | - | - | - | - | 1712 | 205 |
| G71F24M05R00 | 328 | 110 | 22 | 37 | 1610 | 205 | ||||
| G71F24M05R10S | 328 | 110 | 22 | - | 37 | 48 | - | - | 1449 | 205 |
| G71F24M05R20S | 328 | 110 | 22 | - | 37 | 95 | - | - | 1288 | 205 |
| G71F24M05R30S | 328 | 110 | 22 | - | 37 | 143 | - | - | 1127 | 205 |
| G71F24M05R10L | 328 | 110 | 22 | - | 37 | - | 48 | - | 1449 | 205 |
| G71F24M05R20L | 328 | 110 | 22 | - | 37 | - | 95 | - | 1288 | 205 |
| G71F24M05R30L | 328 | 110 | 22 | - | 37 | - | 143 | - | 1127 | 205 |
| G71F24M05R10B | 328 | 110 | 22 | - | 37 | 41 | 3 | 5 | 1449 | 205 |
| G71F24M05R20B | 328 | 110 | 22 | - | 37 | 81 | 5 | 10 | 1288 | 205 |
| G71F24M05R30B | 328 | 110 | 22 | - | 37 | 122 | 7 | 14 | 1127 | 205 |
Table 3.
Main results.
| Mix ID | Flow Diameter (mm) | Fresh Density (kg/m3) | Compressive Strength 7 Days (MPa) | Compressive Strength 28 Days (MPa) | Flexural Strength (MPa) | Sorption Coefficient (kg/m2·h−0.5) | Embodied Carbon (kgCO2e/m3) |
|---|---|---|---|---|---|---|---|
| G82F09M09R00 | 109 | 2571 | 27.0 | 53.5 | 1.60 | 2.02 | 112 |
| G45F45M09R00 | 152 | 2477 | 7.5 | 27.3 | 1.00 | 2.22 | 99 |
| G95F00M05R00 | 114 | 2561 | 28.0 | 48.2 | 1.80 | 2.19 | 117 |
| G91F00M09R00 | 143 | 2534 | 27.5 | 45.7 | 1.50 | 2.13 | 116 |
| G87F00M13R00 | 139 | 2475 | 27.2 | 51.9 | 1.80 | 1.99 | 115 |
| G71F24M05R00 | 136 | 2517 | 29.6 | 50.6 | 1.90 | 2.00 | 108 |
| G68F23M09R00 | 143 | 2483 | 25.7 | 39.1 | 1.90 | 2.11 | 107 |
| G65F22M13R00 | 133 | 2436 | 25.0 | 32.4 | 2.00 | 2.43 | 107 |
| G23F68M09R00 | 128 | 2428 | 1.5 | 14.3 | 0.60 | 2.78 | 91 |
| CEM | 162 | 2461 | 51.9 | 57.0 | 4.80 | 0.53 | 408 |
| G71F24M05R00 | 136 | 2517 | 29.6 | 50.6 | 1.90 | 2.00 | 108 |
| G71F24M05R10S | 138 | 2450 | 21.0 | 31.6 | 1.70 | 2.09 | 117 |
| G71F24M05R20S | 147 | 2338 | 17.7 | 22.1 | 1.60 | 1.89 | 126 |
| G71F24M05R30S | 133 | 2193 | 16.5 | 23.0 | 1.30 | 1.87 | 135 |
| G71F24M05R10L | 133 | 2440 | 26.1 | 34.4 | 1.80 | 1.82 | 117 |
| G71F24M05R20L | 147 | 2358 | 23.5 | 30.0 | 1.70 | 1.99 | 126 |
| G71F24M05R30L | 152 | 2334 | 16.1 | 21.0 | 1.60 | 1.66 | 135 |
| G71F24M05R10B | 138 | 2442 | 24.0 | 34.5 | 1.50 | 1.80 | 117 |
| G71F24M05R20B | 147 | 2350 | 18.5 | 26.9 | 1.10 | 1.53 | 126 |
| G71F24M05R30B | 143 | 2244 | 18.6 | 26.9 | 0.90 | 1.52 | 135 |
Table 4.
Life cycle inventory.
| Materials | Embodied Carbon (kgCO2e/t) | References |
|---|---|---|
| Ground granulated blast-furnace slag (GGBS) | 79.6 | The Concrete Centre (2020) [66] |
| Fly ash (FA) | 0.1 | The Concrete Centre (2020) [66] |
| Microsilica | 28 | Black (2016) [65] |
| Portland cement, CEM I | 860 | The Concrete Centre (2020) [66] |
| Sodium metasilicate anhydrous | 1860 | Ma et al. (2018) [13] |
| Mineral aggregate | 2.6 | The Concrete Centre (2020) [66] |
| Crumb rubber | 200 | Fantili et al. (2016) [69] |
| Superplasticizer | 2388 | EFCA (2002) [67] |
| Water | 0 | Jones et al. (2011) [68] |
Publisher’s Note: MDPI stays neutral with regard to jurisdictional claims in published maps and institutional affiliations. |
© 2021 by the authors. Licensee MDPI, Basel, Switzerland. This article is an open access article distributed under the terms and conditions of the Creative Commons Attribution (CC BY) license (https://creativecommons.org/licenses/by/4.0/).
Share and Cite
MDPI and ACS Style
Abdelmonim, A.; Bompa, D.V. Mechanical and Fresh Properties of Multi-Binder Geopolymer Mortars Incorporating Recycled Rubber Particles. Infrastructures 2021, 6, 146. https://0-doi-org.brum.beds.ac.uk/10.3390/infrastructures6100146
AMA Style
Abdelmonim A, Bompa DV. Mechanical and Fresh Properties of Multi-Binder Geopolymer Mortars Incorporating Recycled Rubber Particles. Infrastructures. 2021; 6(10):146. https://0-doi-org.brum.beds.ac.uk/10.3390/infrastructures6100146
Chicago/Turabian StyleAbdelmonim, Ahmed, and Dan V. Bompa. 2021. "Mechanical and Fresh Properties of Multi-Binder Geopolymer Mortars Incorporating Recycled Rubber Particles" Infrastructures 6, no. 10: 146. https://0-doi-org.brum.beds.ac.uk/10.3390/infrastructures6100146