
Observed Risk and User Perception of Road Infrastructure Safety Assessment for Cycling Mobility


1
Department of Civil Engineering and Architecture, University of Catania, 95125 Catania, Italy
2
Department of Civil Engineering, University of Kentucky, Lexington, KY 40506, USA
*
Author to whom correspondence should be addressed.
Infrastructures 2021, 6(11), 154; https://0-doi-org.brum.beds.ac.uk/10.3390/infrastructures6110154
Submission received: 30 September 2021
/
Revised: 20 October 2021
/
Accepted: 23 October 2021
/
Published: 26 October 2021
(This article belongs to the Special Issue Solutions for the Infrastructure and Transport of Smart City 4.0)
Abstract
:The opportunities for data collection in smart cities and communities provide new approaches for assessing risk of roadway components. This paper presents and compares two different methodological approaches for cycling safety assessment of objective and perceived risk. Objective risk was derived from speed and direction profiles collected with Global Navigation Satellite System (GNSS) and camera installed on an instrumented bicycle. Safety critical events between cyclists and other road users were identified and linked to five different roadway components. A panel of experts was asked to score the severity of the safety critical events using a Delphi process to reach consensus. To estimate the perceived risk, a web-based survey was provided to the city bicyclist community asking them to score the same five roadway components with a 4-point Likert scale. A comparison between perceived and objective risk classification of the roadway components showed a good agreement when only higher severity conflicts were considered. The research findings support the notion that it is possible to collect information from bicycle probe data that match and user perceptions and thus, utilizing them to take advantage of such data in advancing the goals of in smart cities and communities.
1. Introduction
Mobility plays a fundamental role in smart cities and cycling is identified as one of the most relevant factors being a sustainable and active mode of transportation. In fact, cycling is globally sustainable, in terms of environmental damage, public health and social costs [1]. Cycling can be encouraged both by providing well-designed and safe cycling infrastructure connected to the overall network and by promoting it in terms of advertising the safety of cycling.
It is well established that the success of the increase in the use of bicycles is possible both due to the presence of cycle infrastructure (safe, convenient and connected) but also by policies that promote their use (such as for example the adaptation of offices with the provision of showers) [2]. Safety and comfort are two aspects that the bicycling environment should provide [3]. Past research has shown how the presence of cycle infrastructure, pavement conditions and road safety conditions play a fundamental role in encouraging cycling [4,5,6,7,8,9,10,11].
Worldwide, the crash risk for cyclists decreases if they use cycle infrastructure (e.g., cycle routes, cycle lanes, cycle paths, cycle tracks) when compared with cycling on road with traffic. The lack of quality infrastructure is one of the main obstacles to cycling safety and use, as past research has shown [5,12].
In most cities of Europe, North America, and Australia, cycling increased significantly from 2019 to 2020, despite the COVID-19 pandemic, with an accompanying increase in bicycle sales (e.g., +20% in Italy, +20% in the UK, +27% in France, +17% in Germany, +39% in the USA, and +23% in Australia) [13]. This increase is indirectly linked to a loss of passengers in public transport, who avoided public transit during the pandemic because of been frightened by crowded trains and buses. A survey carried out in Sicily showed high preference in increased use of micromobility post lockdown; a trend especially true among public transport users and remote work supporters [14]. Additional data from consumer surveys reiterate the continued reduction of public transport use because of increased cycling. Government support for expanding and improving cycling infrastructure, programs and policies can certainly ensure that cycling continues to increase.
A report from the European Parliament pointed out that 36.2% of Europeans travel less than 10 km; therefore, walking and cycling can be a feasible option, but the road infrastructure is not adequate to accommodate these modes [15].
Decisions to cycle may be guided more by subjective perceptions than objective empirical data [16,17]. It is well established that the probability of an adverse event (for example the occurrence of a crash) and the extent of the consequences (for example the severity of the injury) contribute to the determination of the risk. Such risk perception varies according to individual characteristics (age, sex, attitude) as well as social and cultural conditions [18]. The subjective perception of risk depends on factors related to traffic characteristics (e.g., volume and speed), the presence of dedicated cycling infrastructure, as well as the characteristics of the cyclist (e.g., age, experience) [19,20]. Roads with cycle tracks are considered safer by cyclists than shared traffic roads. As a compromise of these two extremes, the cycle lanes are safer than shared traffic roads but less safe than cycle tracks [21].
It is important to consider these perceptions, as they can significantly encourage or discourage cycling [22,23]. In fact, even in the presence of safe cycling infrastructure, people could choose not to ride a bicycle if there is a discordance between the objective and the perceived risk [11].
This paper investigates the observed objective and perceived subjective risk in selected roadway components in the municipal of Catania, Italy.
Using both quantitative and qualitative research methods, the aim of this research is to estimate correlations between the two methods and their capability to identify and classify sites with high risk situations for cyclists, by using observed traffic conflicts and users’ opinions to be used as a surrogate method for estimating bicycle safety and crashes.
The paper is organized as follow:
- Explanation of the study area and road infrastructure
- Assessment of the objective risk related to road infrastructure components and a Delphi procedure to improve the safety critical events (SCE) classification utilizing expert judgment
- Assessment of the perceived risk by users in different road infrastructure using a web-based survey
- Analysis and comparison of the objective and perceived risk to rank the safety performance of different road infrastructure in cycle paths
- Conclusions with lessons learned and recommendations
Figure 1 shows the workflow of the research effort undertaken.
2. Study Methods
2.1. Explanation of the Study Area and Road Infrastructure
The city of Catania is the second largest city in Sicily located on the east coast, facing the Ionian Sea. It has a population of 320,000 inhabitants. The subtype Köppen Climate classification for this climate is “Csa” (Mediterranean climate): it has hot summers, but winters are mild with cold nights.
According to the TomTom Congestion Index [24], Catania is in third place among Italian metropolitan areas with population greater than 800,000 with average daily congestion level of 23% (reaching 31% in the mornings and 41% in the evenings), despite the COVID-19 severe restrictions during 2020. Therefore, Catania provides good weather environment for cycling, but unfortunately, due to the area topography and location on the slopes of the Etna (the highest volcano in Europe with 3300 m), and the lack of effective transport policies for cycling, Catania has a limited network of bicycle facilities (tracks, lanes, and shared facilities) less than 8 km. On the other hand, the attractiveness of cycling for health and environmental reasons is encouraging more people to use bicycles for daily and recreational purposes. The increase in bicyclist mobility coupled with the lack of appropriate bicycling infrastructure could pose significant safety concerns and it is a critical issue in transport policies due to the potential for increased number of severe crashes.
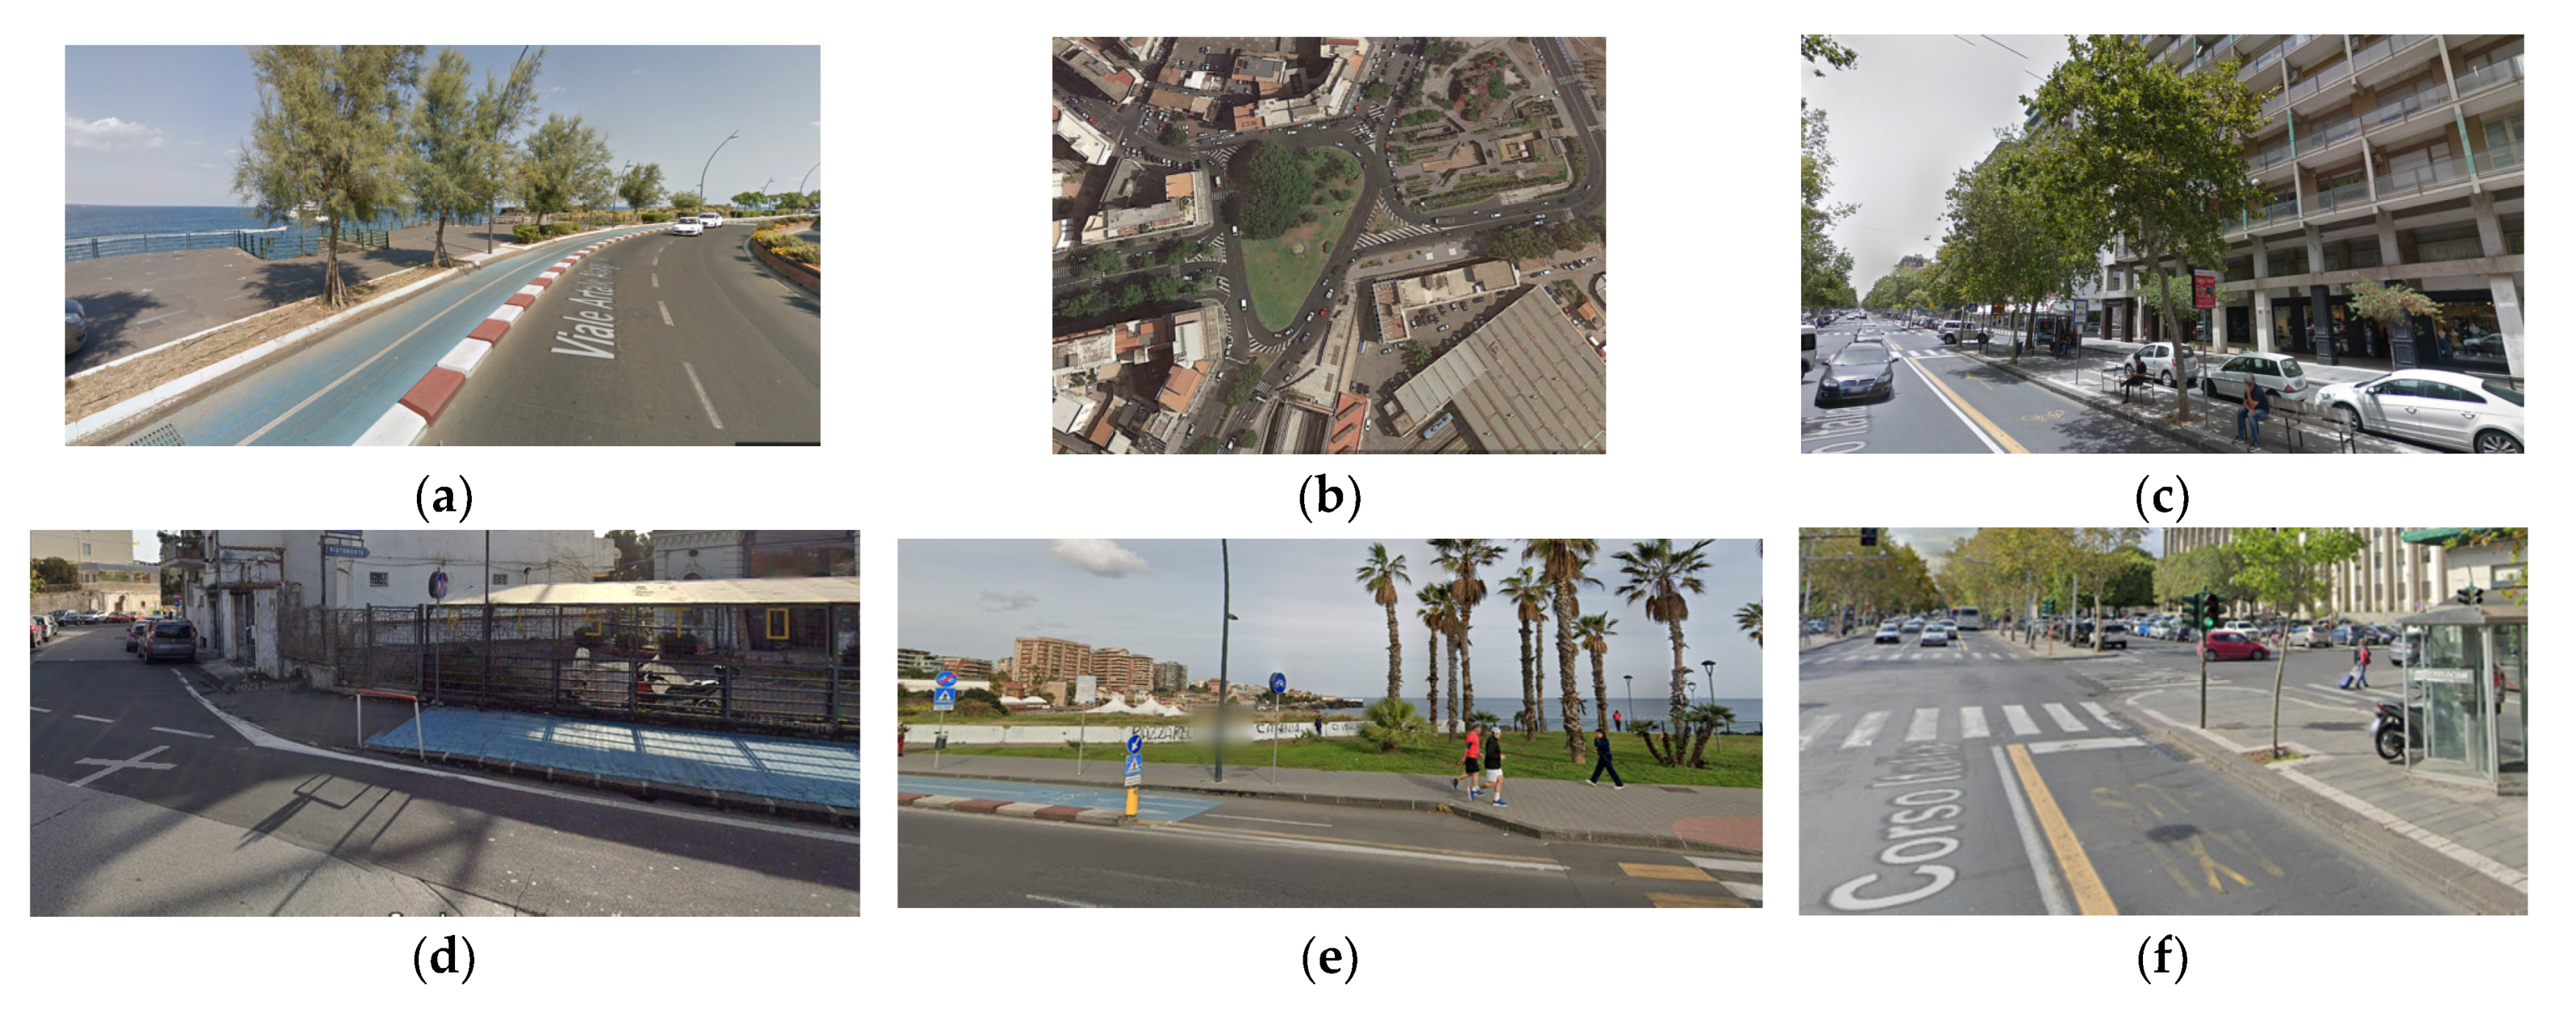
The most used cycling route in Catania was used in this study because it offers a variety of different road characteristics. Moreover, this is the longest route in the city and it is heavily used both as recreational and commuter route. The aim of the study was to evaluate roadway components that have the potential to demonstrate different safety levels and conditions and examine whether the approaches used for estimating the perceived and objective safety classifications could produce similar outcomes. The test route in composed by: (a) a cycle track, a two-way cycle lane, 2.0 m wide and 2.4 km long, divided from the vehicular traffic lanes with a curb; (b) a 5-leg roundabout, with a non-circular shape; and (c) a shared bicycle and bus lane, 3.5 m wide and 1.0 km long, separated by road marking from the vehicular traffic lanes (Figure 2). Crossroads and traffic signals are located along the entire cycling route. It should be noted here that the cycle track termini are considered separate, as the cycle track terminates at both ends in traffic and this can pose specific safety concerns and issues.
2.2. Risk Assessment
One of the main restraints for cycling is the perceived lack of safety conditions. Therefore, both for protecting the vulnerable bicycle users and increasing the attractiveness of cycling, it is imperative to effectively identify hazardous conditions and sites to be improved. The study approach was to analyze the capability to identify at-risk conditions for bicyclists using two different methodologies as an assessment technique to identify objective and perceived hazards.
2.2.1. Objective Risk
Underreporting of crashes is a cause of concern because crashes involving cyclists have the lowest probability of being reported to the police especially when they are single-vehicle crashes [25]. Observational studies usually do not suffer from this distortion. The traffic conflict technique (TCT), which is based on field observation, is a very capable methodology and allows for describing the interactions between road users involved in a critical traffic safety event and not just in a crash. With this technique, it is possible to evaluate critical safety events (SCE) as “situations that require a sudden and evasive maneuver to avoid an accident or to correct unsafe acts performed by the driver himself or by other road users” [26]. To identify SCEs in cycling paths an instrumented probe bicycle (IPB) was used that was furnished with cameras, accelerometers and Global Navigation Satellite System (GNSS) to collect data. Several studies with IPBs have been proposed around the world (e.g., [3,27,28,29]) to capitalize on new opportunities for data collection offered in smart cities and communities. Information collected by IPB is generally divided into two all-purpose classes: internal and external information. Internal information is related to the motion characteristics of the bicycle (e.g., speed, acceleration, direction) or to direct influences on the bicycle (e.g., applied forces and torques), while the external information includes factors within the surrounding environment that indirectly affect the ride of the cyclist, especially in the presence of other road users. For the aims of this research, the combination of bicyclist tracking of speed and direction (internal) and video recording (external) were used to identify and classify the safety critical events. More specifically, speed and direction were available in GNSS NMEA (National Marine Electronics Association) string, as speed in knots and heading in radiant, respectively.
2.2.2. Perceived Risk
Risk perception is a multidimensional phenomenon that utilizes the judgment of various road users on the likelihood of being involved in something unpleasant [9,30,31,32].
There are various methodologies to measure it and among these, the most common is the use of surveys. These contain elements that describe certain traffic behaviors or situations and ask participants to assess the likelihood of a negative outcome or express their perceived risk level [33,34]. In fact, the purpose of a survey is to allow the survey administrator to obtain a general conclusion (generalization) about a population on a specific topic.
This approach is necessary when the importance of a result depends on how widespread the result is. For this reason, a web-based survey was developed to solicit responses on cyclists’ attitudes and opinions on bicycle infrastructure. In modern Smart Cities and Communities, web-based surveys ensure that researchers gather and analyze information quickly and flexibly [35].
3. Assessment of the Objective Risk
3.1. Data Collection and Traffic Conflict Identification
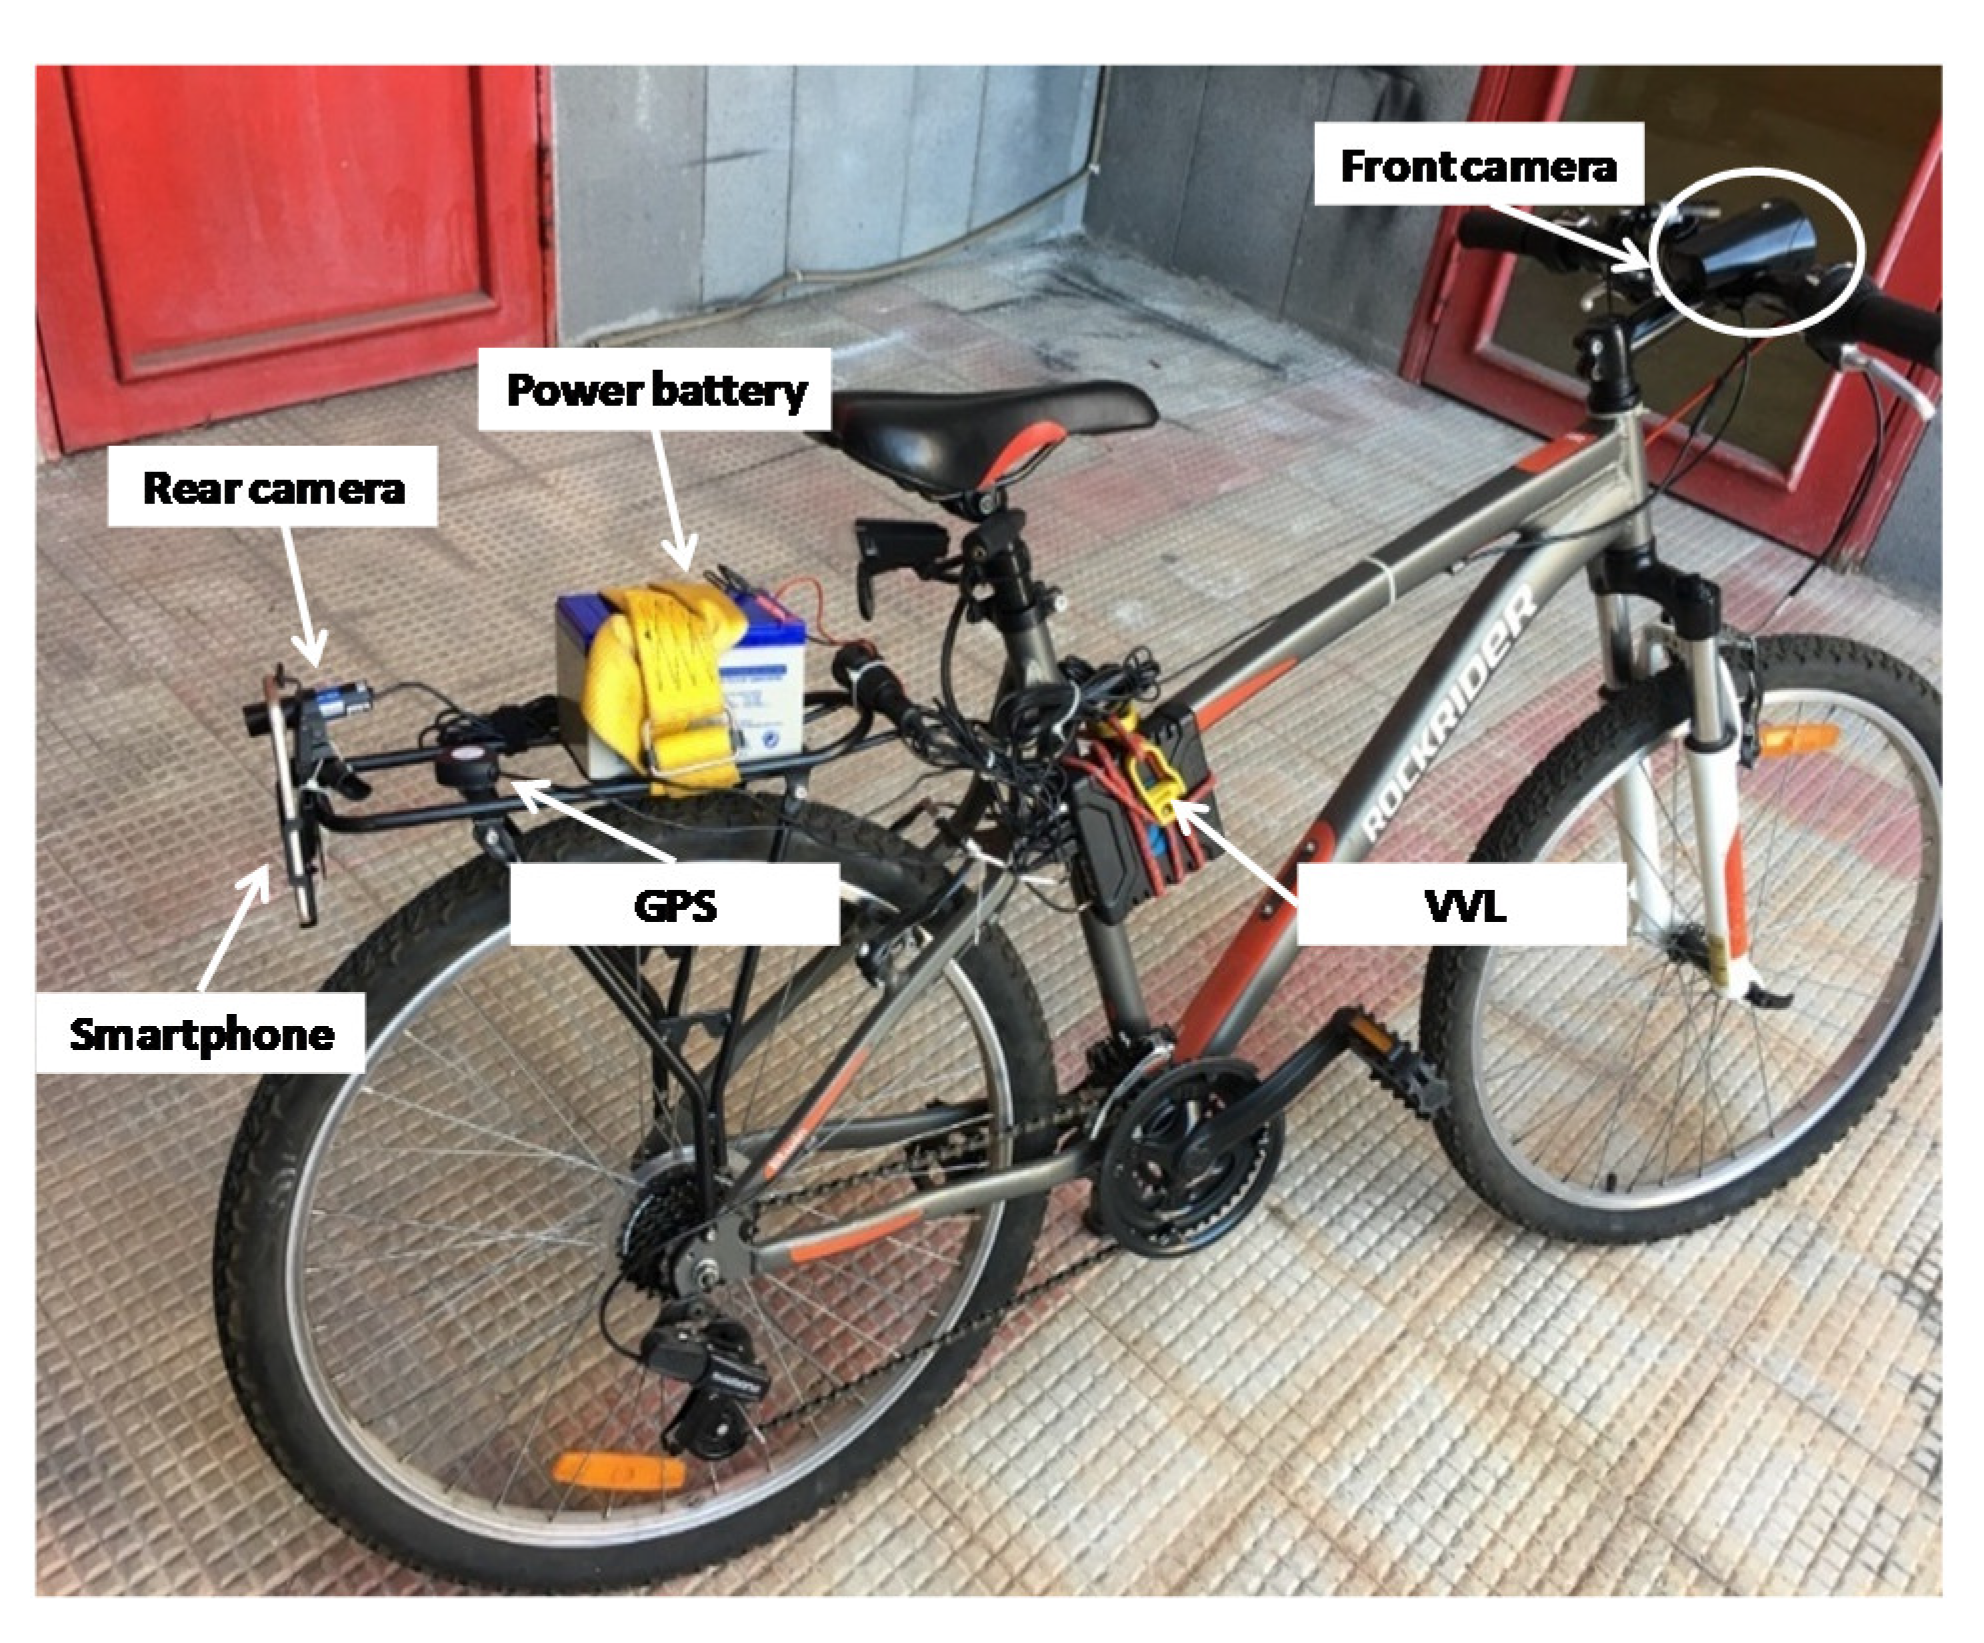
For the collection of internal and external cycle data, an IPB (Figure 3) was equipped with a GNSS-video system (Video Vbox Lite®, Buckinghamshire, UK) and a smartphone [36].
The Video Vbox Lite (VVL) provided GNSS NMEA data (latitude, longitude, elevation, speed, heading) with a frequency of 10 Hz synchronized with a video recording from two cameras. One camera recorded the front view of the cyclist while the other one was rear-facing. Video recording was used to identify SCEs as a situation in which the bicyclist approaches another road user in space and time to such an extent that there is risk of collision if their movements (i.e., trajectories) remain unchanged [26,37]. The smartphone was used as supplementary system to record GNSS NMEA data with a 1 Hz frequency and tri-axial accelerations at 50 Hz sampling rate.
In cyclist safety assessment, SCEs have the potential to assist in early detection of high-risk areas and to mitigate both real and perceived safety issues, thereby enabling increased ridership and bicycle use. A crash is a relatively rare event when compared to the number of near miss incidents that can be more effectively collected also in short time. Moreover, near misses are more frequently experienced by cyclists and significantly associated with observations of traffic hazard, which ultimately affect whether and how often people cycle [21,38,39]. Thus, collecting SCEs data allows for bigger data sets to be generated and enables earlier detection of problematic areas supported though robust statistical analysis [40,41].
Ten cyclists participated in the research test rides. There were eight males and two females, aged between 27 and 65 (40% over 40 years old), and there was a uniform distribution of cycling experience between more and less experienced cyclists. No training was required, and cyclists were instructed to ride in a normal manner using the instrumented bicycle. Each participant rode for approximately 30 min. The test was performed in daylight and good weather conditions avoiding congestion during peak traffic hours.
The research team processed the videos and carried out the event detection with direct observation of the video that was recorded during the test. A SCE was defined as the interaction between the cyclist and another user requiring the bicyclist to perform an evasive maneuver (i.e., braking, swerving).
For each SCE, the following were reported (Figure 4):
- Information about the event including ID user, test date, opponent, localization, GPS coordinates, maximum and minimum speed during the event, speed variation and event duration;
- Video screenshots during the duration of the event;
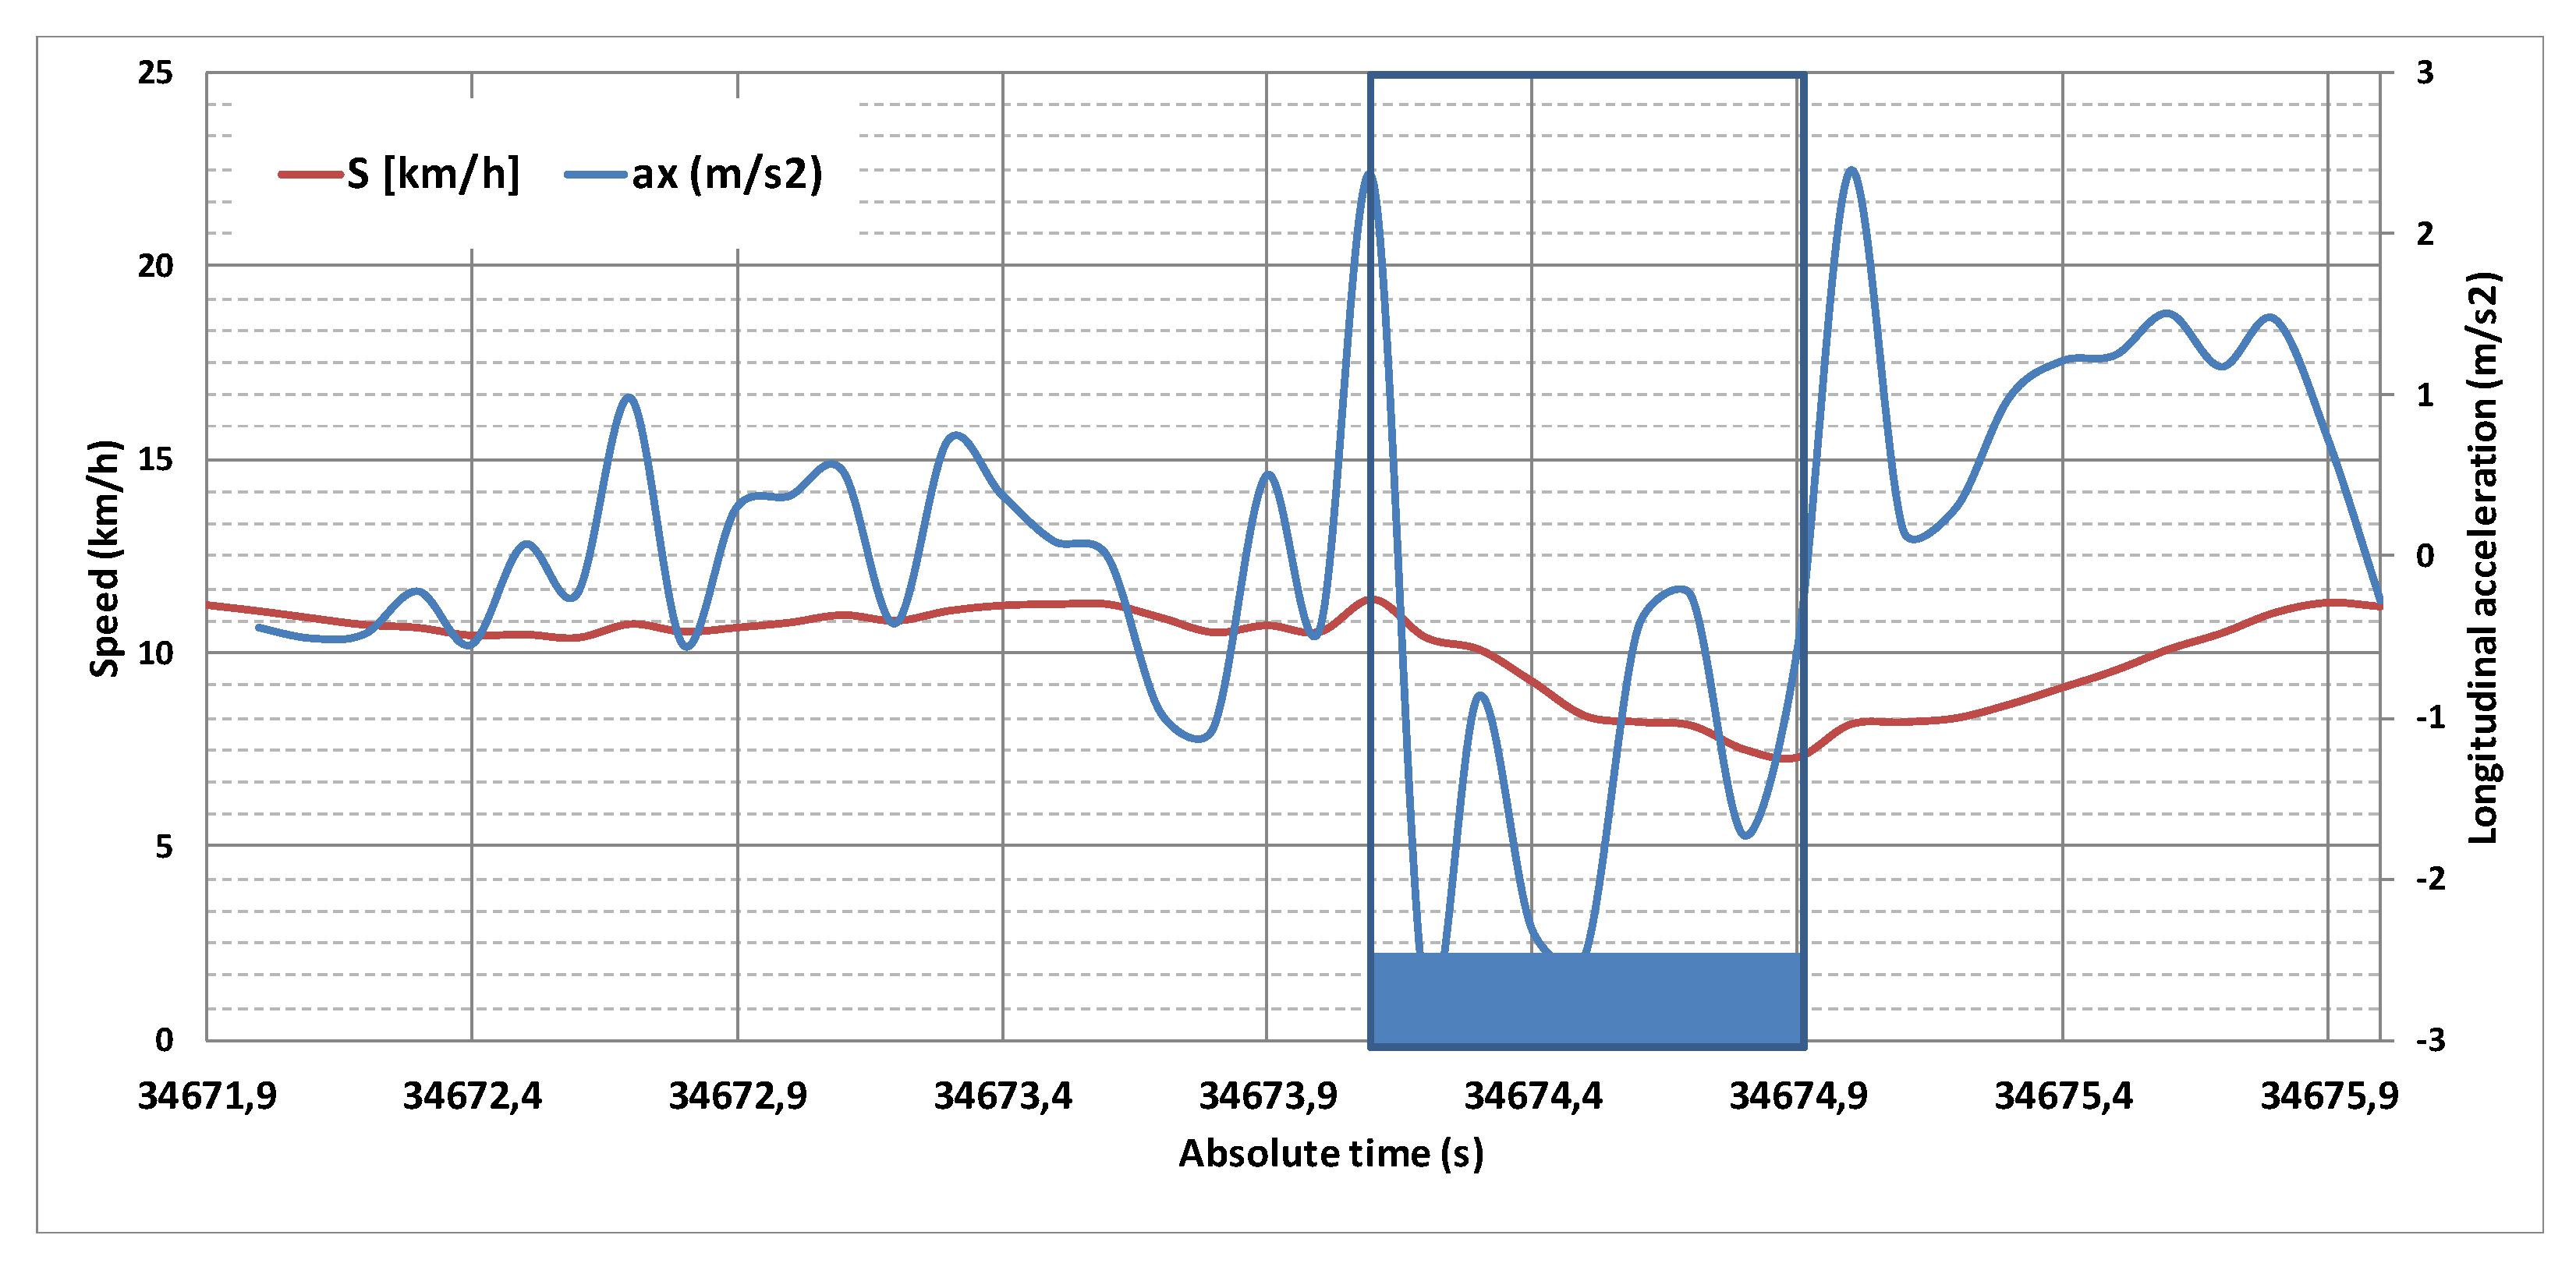
- Speed profile and derived longitudinal acceleration profile (for a time interval of 4 s) identifying the event with a boxed area (Figure 5);
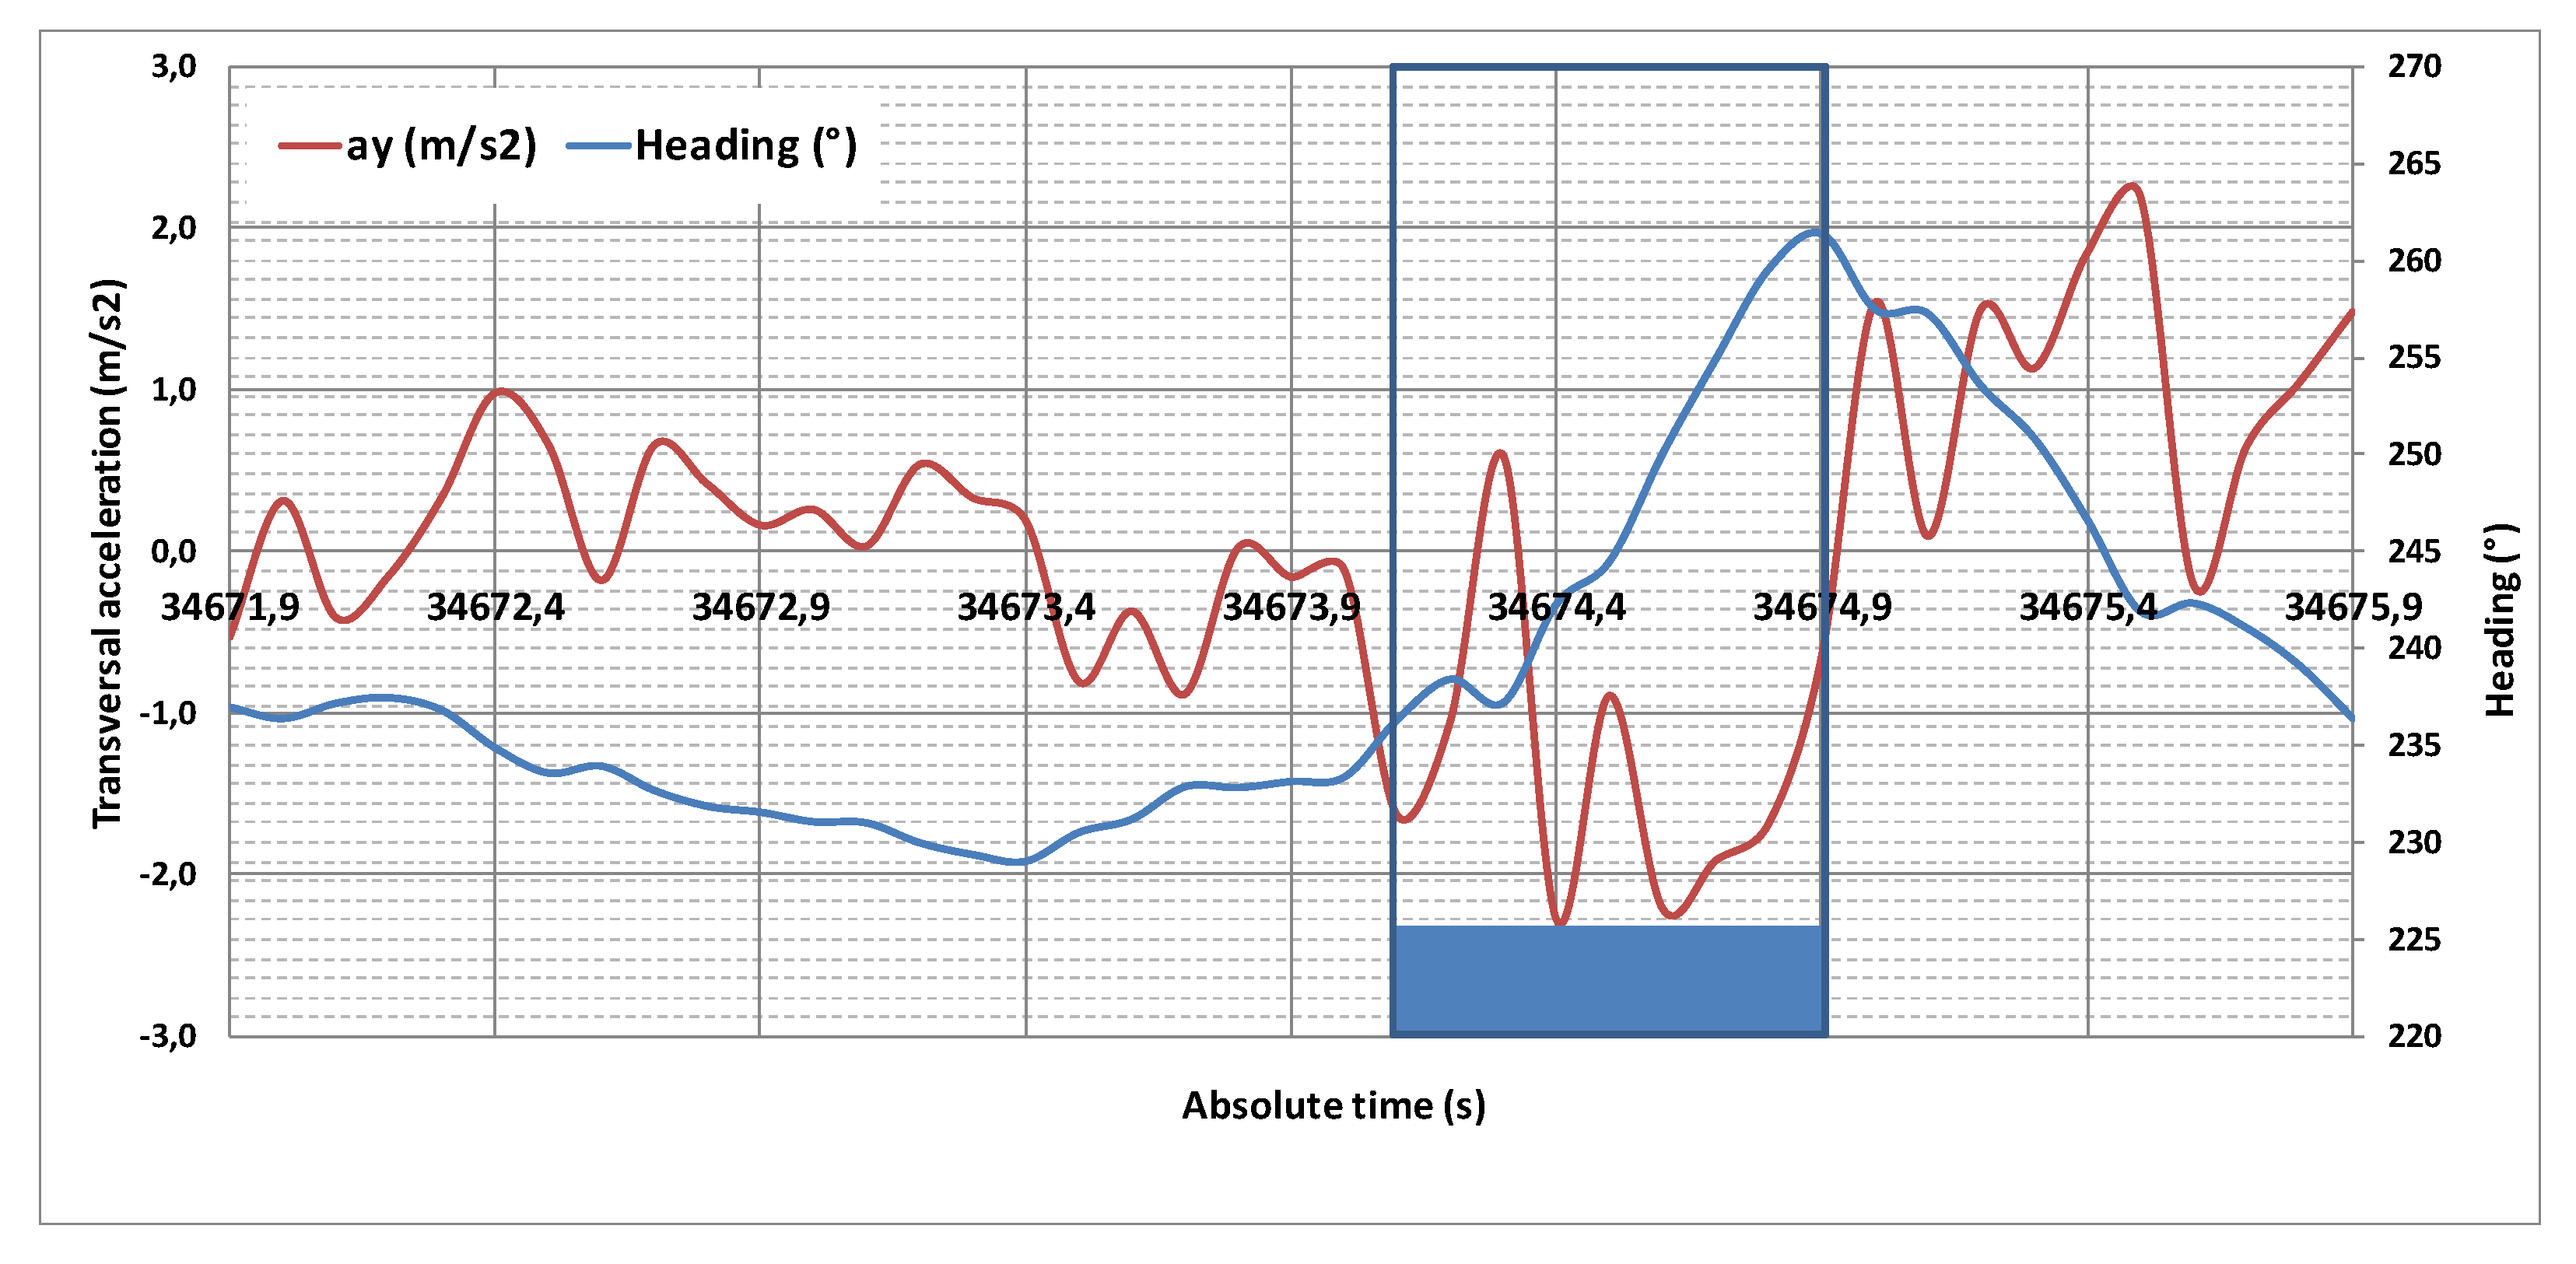
- Heading profile and derived transversal acceleration profile (for a time interval of 4 s) identifying the event with a boxed area (Figure 6). The heading represents the absolute direction (360 degrees) in which the cyclist is moving.
A total of 49 SCEs were identified in the video records (Figure 7) and confirmed by the test riders during the follow-up interview. Among the three areas, the shared bicycle and bus lane showed the highest numbers of conflicts (34.6%), followed by the cycle track (21.2%) and the roundabout (19.2%). The cycle track termini showed low number of conflicts. It is worth noting that conflicts in the cycle track are between bicyclists and other road users crossing the lane mainly from side access.
3.2. Data Analysis and Conflict Classification
To validate the study, a panel of five international experts in cycling safety was assembled to review the conflicts and assess the severity of the evasive maneuver (braking and/or swerving) examining the 4-s video recording and data profiles (Figure 5 and Figure 6). Ratings were given using a 4-point Likert scale without ties to force a decision: the scale was “Very Low”, “Low”, “Medium” and “High” severity. A multi-round Delphi process was used to achieve consensus among the panel members and improve the reliability of the panel answers. The Delphi method tries to improve the opinions of a panel of experts to reach a decision based on sharing the information of the prior evaluations to all members. The technique uses an iterative feedback procedure in two or more rounds; in the second and later rounds of the survey, the outcomes of the preceding round are given to the members as feedback. Therefore, from the second round onward, the experts’ answers are influenced by the opinions of the other members. In fact, it is supposed that during this procedure the range of the answers will decline, and the group will converge towards the “correct” answer.
In the first round, using the video and profile analysis, each expert scored subjectively each SCE, as previously explained. After this round, the experts were provided with an anonymized summary of all scores from the previous round. Experts were asked to review their earlier answers considering the replies of other panel members and provide an adjusted score or retain their original score.
To evaluate the improvement in the consensus of the panel the inter-rater agreement (IRA) statistics was used to compare the extent to which the responses of the 5 independent raters are concordant in the different rounds, as the answers are measured using a Likert-type scale [42,43]. To that aim the usefulness of IRA is that it provides a single value of agreement for each rating target, thereby facilitating identification of units of raters who are at higher or lower agreement [44]. For use on single-item scales, the IRA statistic awg was used [45]:
with where the maximum possible variance given k raters, M is the observed mean rating, and H and L are the maximum and minimum discrete scale values, respectively.
The advantage of awg is that the value may vary between −1 and +1, where −1.0 indicates maximum disagreement, 0 indicate consensus only by chance with the observed variance at 50% of the maximum variance, and +1.0 indicate perfect agreement, making simple the interpretation. To evaluate the change of consensus from the first to the second round of the Delphi procedure, the values of awg were calculated and positive results were obtained because the value increased from 0.59 to 0.81. The IRA statistic provides the magnitude of the increase in the consensus from the former to the latter round, showing that the process was successful in training the panel members and no further rounds were needed.
4. Perceived Risk
A web-based survey was developed to collect responses about bicyclist attitudes and opinions on the perceived safety of bicycle infrastructure. The survey contained five parts: demographic questions, questions about bicycle usage and impediments to bicycling, a list of items that would help increase the use of bicycle as a transport mode, and a series of elements that could be useful in a smartphone app. The results of this survey have been widely discussed in previous works [5,12]. The survey also contained a section that is of interest for the present paper because it required respondents to rate the safety of selected intersections and routes in the city of Catania. A total of 78 responses were collected though the web survey coming from both members of an Italian cyclist association and other cyclists in Catania. The sample size may be considered appropriate for a margin of error of 10% at a significance level of 95% as derived using the following estimation formula [46]:
where for
- n = minimum sample size,
- Z = Z statistic =1.96 for a 95% level of confidence
- P = 0.25 expected proportion
- d = 0.1.
The sample was composed by 70% of males, 28% over 40 years old and 51% between 27 and 40 years. Seventy five percent of the respondents declared a medium/high frequency in cycling. The two samples of test rider and survey participants can be considered homogeneous. Anyway, the two samples are not necessarily correlated because the in-field test was carried out to collect SCEs while the survey collected opinions.
Answers were recorded using a 4-point Likert scale without ties to force a decision. The scale was “Very Safe” (4), “Safe” (3), “Unsafe” (2), and “Very Unsafe” (1). The summary statistics of the survey is reported in Table 1. Rank 5 indicates the safest and 1 the most unsafe. Only the cycle track received a safe average score close to 3 (2.81). The worst site was considered the roundabout followed by the shared bicycle-bus lane and cycle track termini.
Cronbach’s alpha coefficient was used to assess how well the set of answers in the survey give consistent results. Because alpha is equal to 0.72 and it was larger than 0.7, it can be assumed that the survey represents a reliable set of variables [45].
Moreover, to determine whether the medians of the five roadway components noted in Table 2 are significantly different from each other, the non-parametric Kruskal–Wallis test [47] was performed (Table 2). As the p-value is less than 0.05, there was statistically significant difference among the medians at the 95.0% confidence level.
5. Comparison and Discussion of Observed and Perceived Risk
The aim of the paper is to assess and compare the objective and perceived risk that could be used to analyze the safety performance of different roadway components as they relate to bicyclist safety. The survey among cyclists returned a consistent rank of perceived risk of the different bicycle infrastructure components as reported in Table 1.
The objective risk can be derived from the count and severity of traffic conflicts recorded during the ride tests. The exposure to the occurrence of a conflict rises with the time the bicyclist spends in the road section and therefore travel time was considered as an exposure metric to normalize the conflict rate among different roadway components and allow for comparisons. It is worth mentioning that the most theoretically correct measure of exposure is the number of encounters or simultaneous arrivals at the same point of two road users [46]. However, without an automated tool (e.g., camera surveillance) it is very difficult to count simultaneous arrivals automatically and therefore travel time is the next best measure of exposure.
The mean travel time of the bicyclists for each site was calculated from the data recording and values are reported in Table 3, which also shows the total number of SCEs and the number of events in the four severity scores assigned by the expert panel.
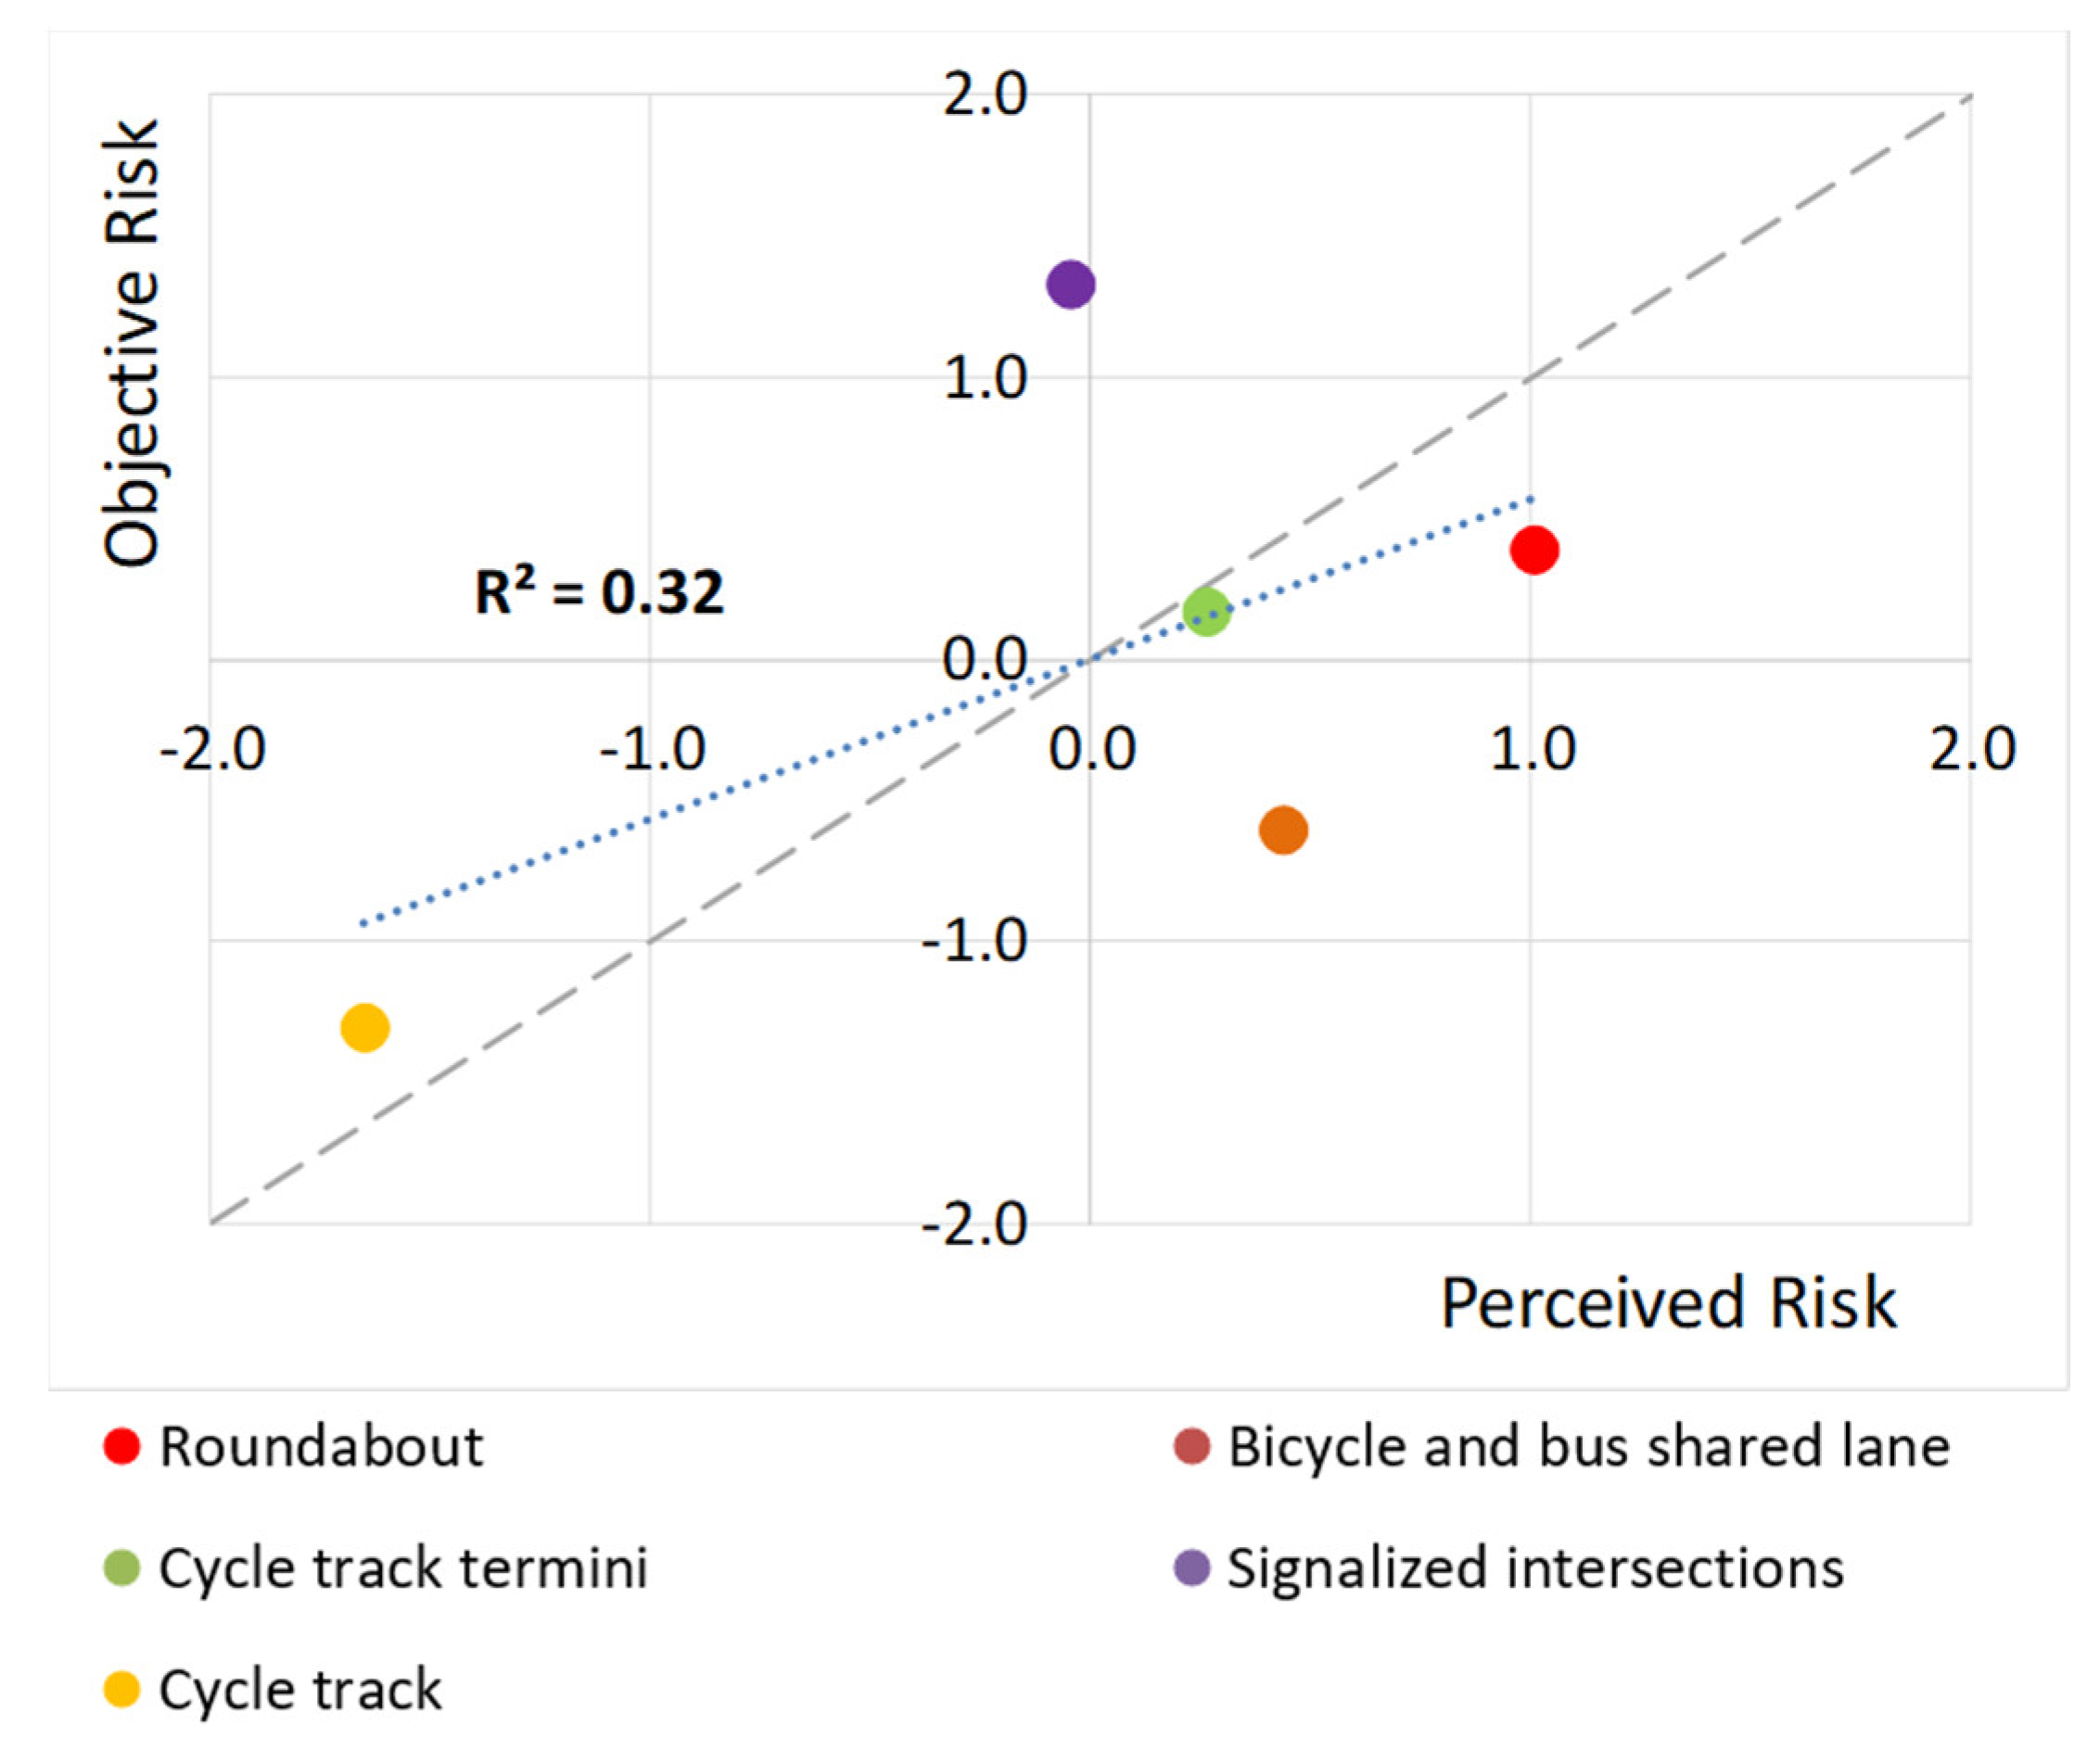
To allow for comparisons, because the SCE rate and subjective mean rating have different scales and metrics, they were first normalized using their maximum value and then standardized. Figure 8 showed the results accounting for all detected SCEs. It should be noted that in Figure 8 the diagonal line represents the perfect correspondence between the two-risk ratings. Results showed that generally, the perceived risk is higher than the observed. Perceived and observed risk at the cycle track termini and at the cycle track are consistent. Signalized intersections are perceived less dangerous than observed and, on the opposite, the shared bicycle and bus lane and the roundabout are perceived to be riskier than observed. Because data are dispersed around the equality diagonal, to better investigate if SCE rate and subjective risk have a similar trend, a linear regression was applied to test the goodness of fitting of the model using the R2 statistics. When all severity classes of SCEs were considered, the model goodness of fit was relatively low (R2 = 0.32) and did not correlate well the relationship between perceived and objective risk.
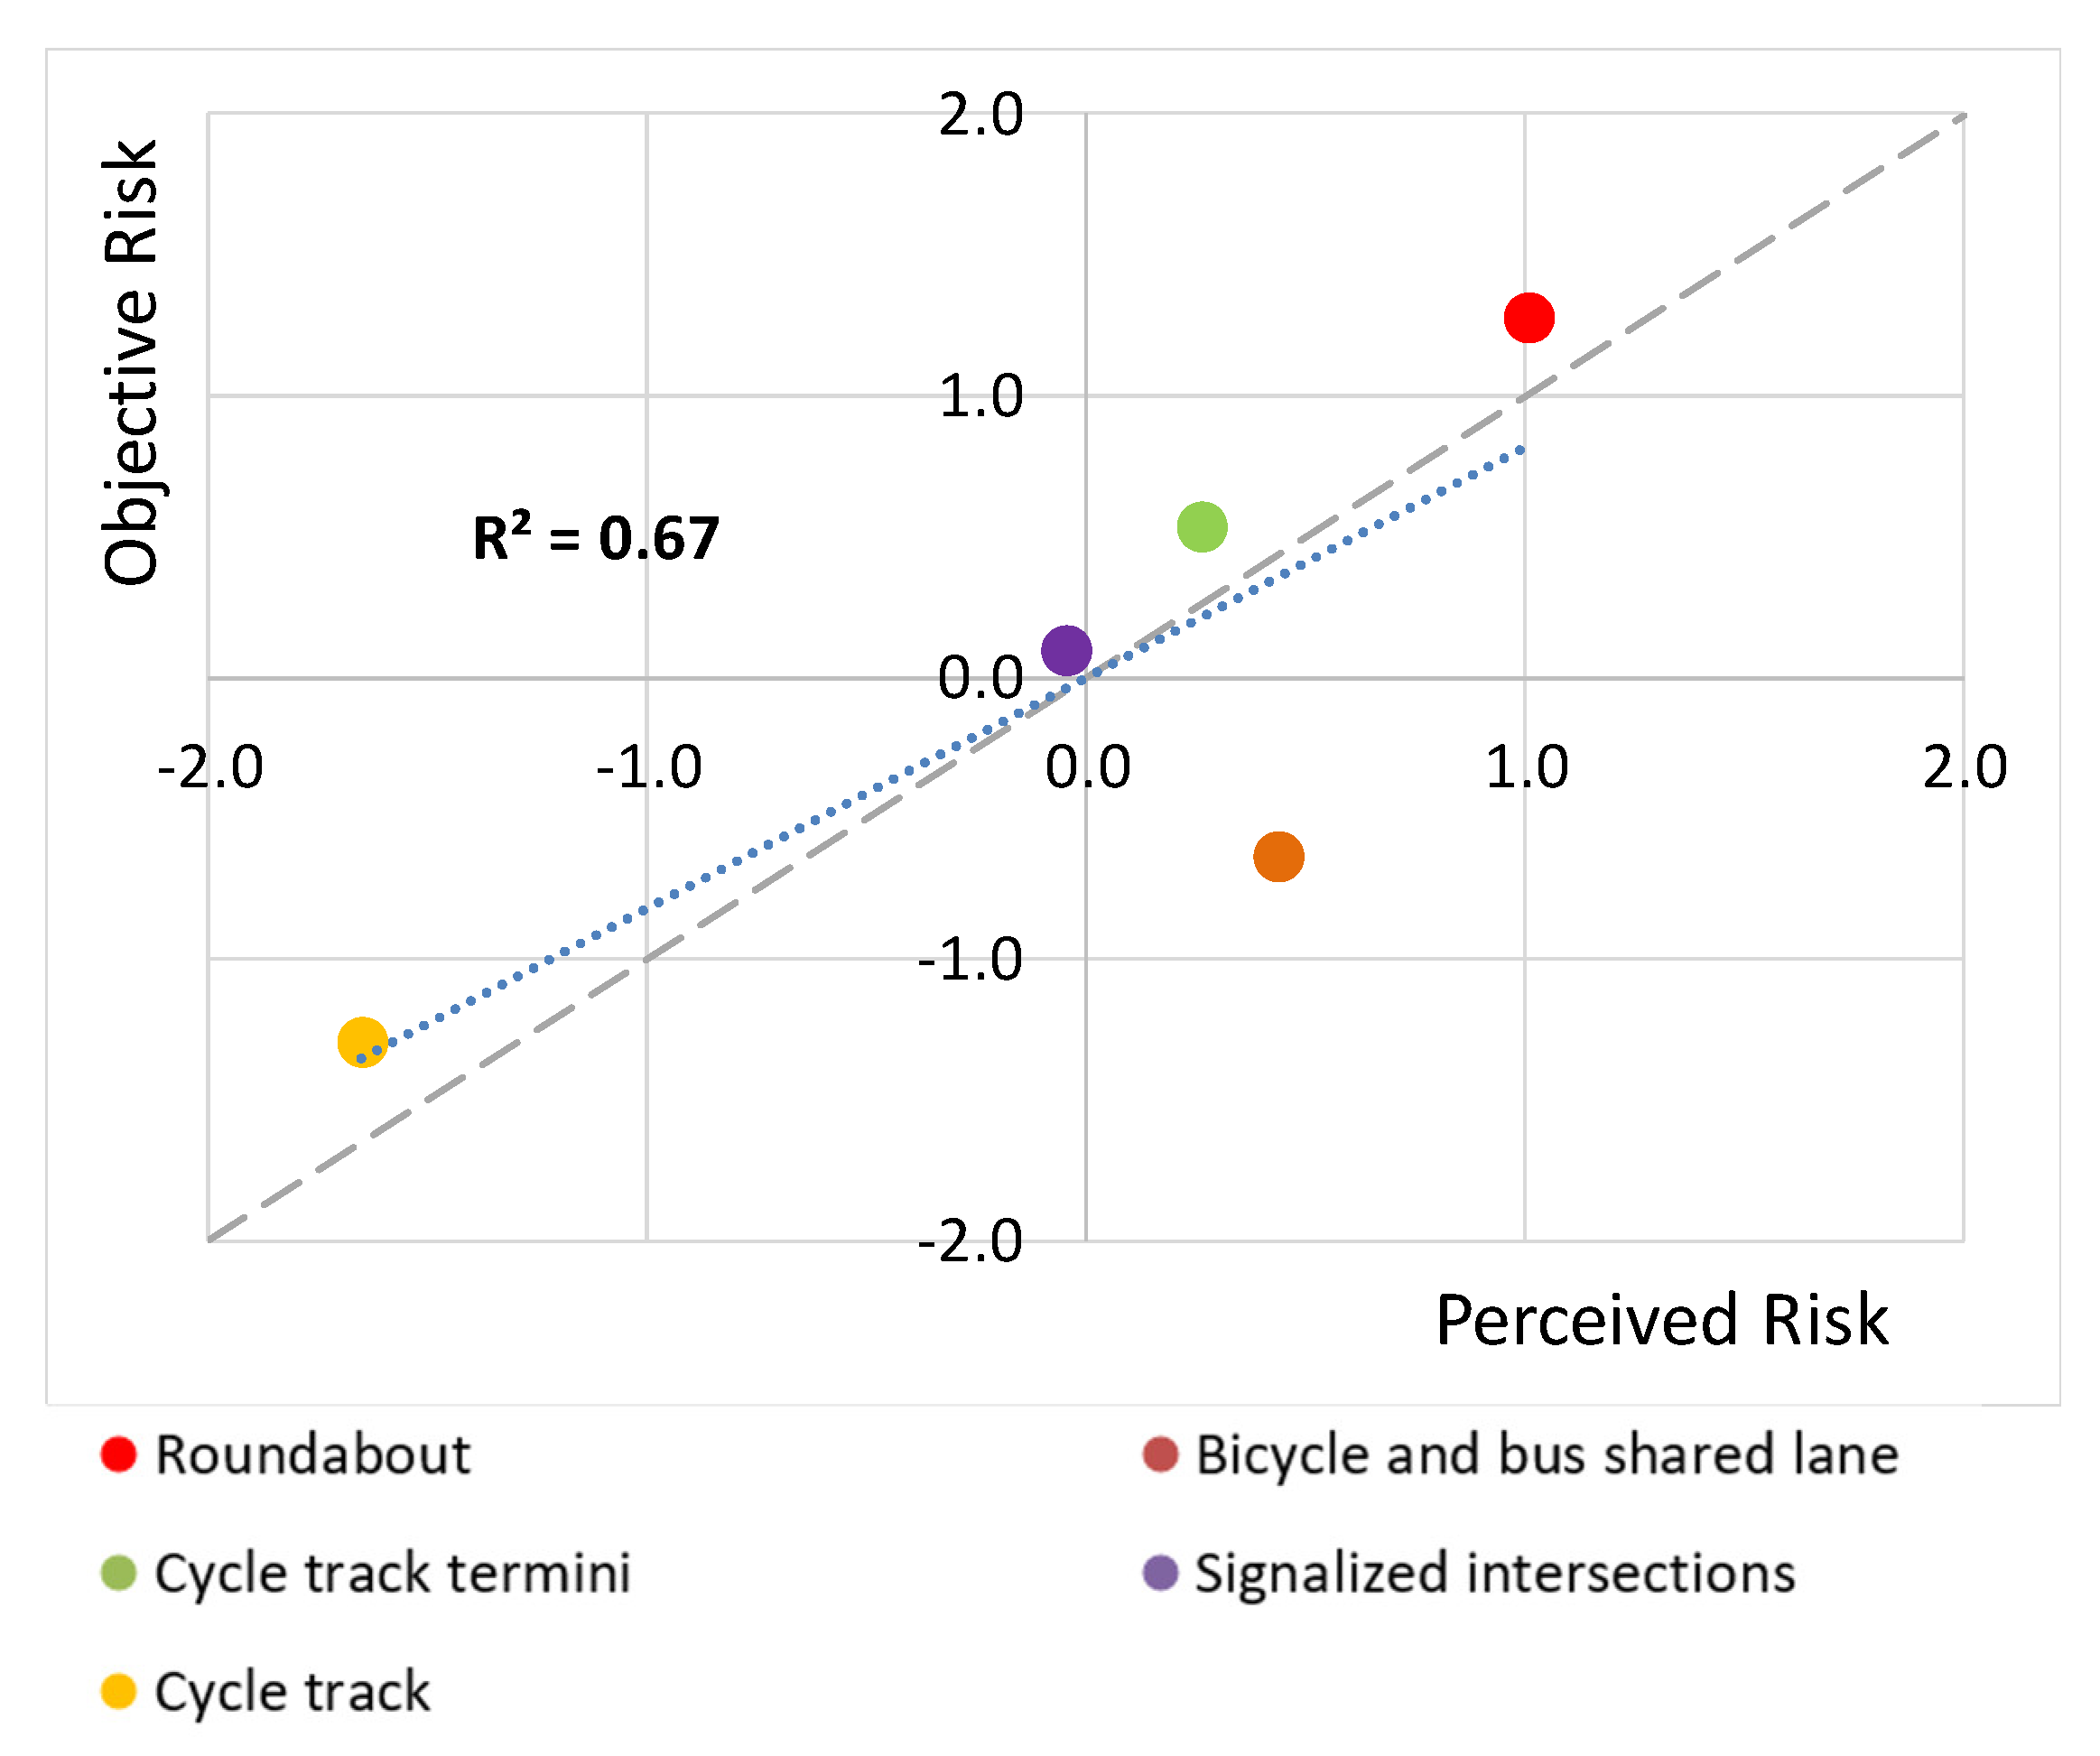
If the analysis is carried out only for the SCEs with medium and high severity (Figure 9), the improvement in the correlation between perceived and objective risk was notable as highlighted by the increase in the goodness of fit (R2 = 0.64) and thus, underscoring the good agreement between the two procedures.
For the medium and high severity SCEs, the perceived risk of signalized intersections was the same as the observed while the observed risk of the roundabout increased. The lower agreement between observed and perceived risk remained for the shared bicycle and bus lane, while for the other roadway components the correlation was very strong.
6. Conclusions
All international bodies with responsibility in urban mobility, including the European Commission, want to effectively incorporate cycling into connected and smart transport modes and people are encouraged to walk and cycle more as sustainability moves up in the political agenda [48]. When the share of vulnerable road users increases, road safety becomes a top priority because 70% of reported road deaths in urban areas involve Vulnerable Road Users (i.e., pedestrians, cyclists, and motorcycle riders). Among other actions, safer road infrastructure with appropriate design of the urban cycling network and identification of high-risk locations for safety improvements are considered among the pillars for safe mobility. This may be more imperative considering the increase in cycling after the COVID 19 period and the potential for these changes to be permanent [15].
Lack of consistent data on traffic volume and crashes involving cyclists is a key limitation for a reliable assessment of the safety performance of the urban road network that cyclists also use. Smart mobility tools provide the opportunity to collect new type of data involving the cycling community that is usually very active and collaborative, as experienced in the development of the present study.
Using self-reporting perceived risk offers the advantage of a broader picture of safety at the network level, and it is easy to collect. However, such data represent only the road user’s perspective [25]. Detection of safety critical events with light technologies like GNSS in smartphones is an alternative measure of more objective estimation of traffic safety conditions that can make up for the lack of crash data.
This study applied and compared the two assessment approaches and aimed in evaluating their reliability and agreement. Both samples were composed by cyclists of different age, gender and medium/high cycling use: the web survey involved 78 cyclists while the “on the road” test was carried out with about 3 h of bicycle tracking of 10 users. All the collected data was geared to evaluate five different roadway components in the city of Catania. The work presented here demonstrated that higher severity SCEs, identified by tracking speed and direction profiles of the bicycle path, were in good agreement with the perceived risk reported by the users, who participated in a web survey. Based on the literature review conducted as part of this study, there is no prior research effort that has compared such approaches. Therefore, the study results are encouraging about the suitability of utilizing automated collection methods and the opportunity to collect data in smart cities and communities, as they allow for detecting areas for critical safety events and identification of them in order to improve cycling and support a safer cycling mobility.
It is worth mentioning that the risk score and ranking of the different road components, are consistent with the literature (e.g., roundabout at the highest risk rank and cycle track at the lowest), and thus allow for enriching the state of knowledge and further support prior research. The goal of this study was to investigate tools applicable for the identification of high-risk locations. In the same way, because the subjective risk may be related to the user’s composing the sample in Catania, different risk perception could be expected from other bicyclist communities with different attitudes and expectation in road infrastructure quality. Even though the sample sizes of the two groups were suitable for the present exploratory study, extending the survey to a larger population, increasing the observation period of SCEs and testing the procedure in different sites and cities can be useful for further studies and expanding the findings of the research.
This limitation does not affect the identification and estimation of objective risk that is more critical and presents more challenges in cycling safety due to limited data collection and analysis. The next steps of this research involve the investigation of algorithms that can be applied for an automatic detection and classification of SCEs by using both statistical tools (multivariate outlier detection) and artificial intelligence (e.g., classification neural network).
Author Contributions
Conceptualization, S.C., G.P. and N.S.; methodology, S.C., G.P. and N.S.; formal analysis, G.P.; investigation and data curation, G.P.; writing—original draft preparation, G.P.; writing—review and editing, S.C. and N.S.; funding acquisition, S.C. All authors have read and agreed to the published version of the manuscript.
Funding
This research has been partially financed by “Astro Database” Project of the University of Catania.
Institutional Review Board Statement
Not applicable.
Informed Consent Statement
Informed consent was obtained from all subjects involved in the study.
Data Availability Statement
The data presented in this study are available on request from the corresponding author. The data are not publicly available due to privacy.
Acknowledgments
The authors wish to thank to the expert’s panel for their valuable contribution with the participation at the Delphi procedure.
Conflicts of Interest
The authors declare no conflict of interest.
References
- Pucher, J.; Buehler, R. Cycling towards a more sustainable transport future. Transp. Rev. 2017, 37, 689–694. [Google Scholar] [CrossRef] [Green Version]
- Iwinska, K.; Blicharska, M.; Pierotti, L.; Tainio, M.; de Nazelle, A. Cycling in Warsaw, Poland—Perceived enablers and barriers to cyclist and non-cyclists. Transp. Res. Part A 2018, 113, 291–301. [Google Scholar] [CrossRef] [PubMed]
- Feizi, A.; Oh, J.-S.; Kwigizile, V.; Joo, S. Cycling environment analysis by bicyclists’ skill levels using instrumented probe bicycle (IPB). Int. J. Sustain. Transp. 2020, 14, 722–732. [Google Scholar] [CrossRef]
- Biernat, E.; Buchholtz, S.; Bartkiewicz, P. Motivations and barriers to bicycle commuting: Lessons from Poland. Transp. Res. Part F 2018, 55, 492–502. [Google Scholar] [CrossRef]
- Stamatiadis, N.; Pappalardo, G.; Cafiso, S. A Comparison of Bicyclist Attitudes in Two Urban Areas in USA and Italy. Adv. Intell. Syst. Comput. 2019, 879, 272–279. [Google Scholar] [CrossRef]
- Hagemeister, C.; Kropp, L. The door of a parking car being opened is a risk. No kerb-side parking is the key feature for perceived safety of on-road cycling facilities. Transp. Res. Part F 2019, 66, 357–367. [Google Scholar] [CrossRef]
- La Paix, L.; Cherchi, E.; Geurs, K. Role of perception of bicycle infrastructure on the choice of the bicycle as a train feeder mode. Int. J. Sustain. Transp. 2020, 15, 486–499. [Google Scholar] [CrossRef]
- Marquarta, H.; Schlink, U.; Ueberham, M. The planned and the perceived city: A comparison of cyclists’ and decision makers’ views on cycling quality. J. Transp. Geogr. 2020, 82, 102602. [Google Scholar] [CrossRef]
- Kummeneje, A.; Rundmo, T. Attitudes, risk perception and risk-taking behaviour among regular cyclists in Norway. Transp. Res. Part F 2020, 69, 135–150. [Google Scholar] [CrossRef]
- Sottile, E.; Piras, F.; Calli, D.; Meloni, I. Why don’t Italians cycle to work? An experimental analysis. Case Stud. Transp. Policy 2021, 9, 362–373. [Google Scholar] [CrossRef]
- Winters, M.; Babul, S.; Becker, H.J.; Brubacher, J.R.; Chipman, M.; Cripton, P.; Cusimano, M.D.; Friedman, S.M.; Harris, M.A.; Hunte, G.; et al. Safe Cycling: How Do Risk Perceptions Compare with Observed Risk? Can. J. Public Health 2012, 103, S42–S47. [Google Scholar] [CrossRef]
- Stamatiadis, N.; Pappalardo, G.; Cafiso, S. Use of Technology to Improve Bicycle Mobility in Smart Cities. In Proceedings of the 5TH IEEE International Conference On Models And Technologies For Intelligent Transportation Systems, Napoli, Italy, 26–28 June 2017; Proceedings 8005636. pp. 86–91. [Google Scholar]
- Buehler, R.; Pucher, J. COVID-19 Impacts on Cycling, 2019–2020. Transp. Rev. 2021, 41, 393–400. [Google Scholar] [CrossRef]
- Campisi, T.; Basbas, S.; Skoufas, A.; Akgün, N.; Ticali, D.; Tesoriere, G. The Impact of COVID-19 Pandemic on the Resilience of Sustainable Mobility in Sicily. Sustainability 2020, 12, 8829. [Google Scholar] [CrossRef]
- Lozzi, G.; Marcucci, E.; Gatta, V.; Pacelli, V.; Rodrigues, M.; Teoh, T. COVID-19 and Urban Mobility: Impacts and Perspectives. Policy Department for Structural and Cohesion Policies, Directorate-General for Internal Policies PE 652.213—September 2020. Available online: https://www.europarl.europa.eu/thinktank/it/document.html?reference=IPOL_IDA%282020%29652213 (accessed on 16 October 2021).
- Dill, J.; Voros, K. Factors affecting bicycling demand: Initial survey findings from the Portland, Oregon, region. Transp. Res. Rec. 2007, 2031, 9–17. [Google Scholar] [CrossRef]
- Kaplan, S.; Luria, R.; Prato, C.G. The relation between cyclists’ perceptions of drivers, self-concepts and their willingness to cycle in mixed traffic. Transp. Res. Part F 2019, 62, 45–57. [Google Scholar] [CrossRef]
- Prati, G.; Fraboni, F.; De Angelis, M.; Pietrantoni, L.; Johnson, D.; Shiresc, J. Gender differences in cycling patterns and attitudes towards cycling in a sample of European regular cyclists. J. Transp. Geogr. 2019, 78, 1–7. [Google Scholar] [CrossRef]
- Xing, Y.; Volker, J.; Handy, S. Why do people like bicycling? Modeling affect toward bicycling. Transp. Res. Part F 2018, 56, 22–32. [Google Scholar] [CrossRef]
- von Stülpnagel, R. Gaze behavior during urban cycling: Effects of subjective risk perception and vista space properties. Transp. Res. Part F 2020, 75, 222–238. [Google Scholar] [CrossRef]
- Puchades, V.M.; Fassina, F.; Fraboni, F.; De Angelis, M.; Prati, G.; de Waard, D.; Pietrantoni, L. The role of perceived competence and risk perception in cycling near misses. Saf. Sci. 2018, 105, 167–177. [Google Scholar] [CrossRef] [Green Version]
- Poulos, R.G.; Hatfield, J.; Rissel, C.; Flack, L.K.; Grzebieta, R.; McIntosh, A.S. Cyclists’ self-reported experiences of, and attributions about, perceived aggressive behaviour while sharing roads and paths in New South Wales, Australia. Transp. Res. Part F 2019, 64, 14–24. [Google Scholar] [CrossRef]
- Useche, S.A.; Montoro, L.; Sanmartin, J.; Alonso, F. Healthy but risky: A descriptive study on cyclists’ encouraging and discouraging factors for using bicycles, habits and safety outcomes. Transp. Res. Part F 2019, 62, 587–598. [Google Scholar] [CrossRef]
- Tom Tom. European Traffic Index. 2020. Available online: www.tomtom.com/en_gb/trafficindex/list?citySize=SMALL&continent=EU&country=IT (accessed on 3 March 2021).
- Polders, E.; Brijs, T. How to Analyse Accident Causation? A Handbook with Focus on Vulnerable Road Users (Deliverable 6.3); Horizon 2020 EC Project, InDeV.; Hasselt University: Hasselt, Belgium, 2018. [Google Scholar]
- Cafiso, S.; Di Graziano, A.; Pappalardo, G.; Giudice, O. In-vehicle Stereo Vision system for identification of traffic conflicts between Bus and Pedestrian. J. Traffic Transp. Eng. 2017, 4, 3–13. [Google Scholar] [CrossRef]
- Calvey, J.C.; Shackleton, J.P.; Taylor, M.D.; Llewellyn, R. Engineering condition assessment of cycling infrastructure: Cyclists’ perceptions of satisfaction and comfort. Transp. Res. Part A 2015, 78, 134–143. [Google Scholar] [CrossRef]
- Werneke, J.; Dozza, M.; Karlsson, M. Safety-critical events in everyday cycling—Interviews with bicyclists and video annotation of safety-critical events in a naturalistic cycling study. Transp. Res. Part F 2015, 35, 199–212. [Google Scholar] [CrossRef]
- Rybarczyk, G.; Ozbil, A.; Andresen, E.; Hayes, Z. Physiological responses to urban design during bicycling: A naturalistic investigation. Transp. Res. Part F 2020, 68, 79–93. [Google Scholar] [CrossRef]
- Freitas, A.L.P.; Maciel, A.B.L. Assessing cyclists’ perceptions, motivations and behaviors: An exploratory study in Brazil. Procedia Eng. 2017, 198, 26–33. [Google Scholar] [CrossRef]
- Bösehans, G.; Massola, G.M. Commuter cyclists’ risk perceptions and behaviour in the city of São Paulo. Transp. Res. Part F 2018, 58, 414–430. [Google Scholar] [CrossRef]
- Oldmeadow, J.A.; Povey, S.; Povey, A.; Critchley, C. Driver anger towards cyclists in Australia: Investigating the role of the perceived legitimacy of cyclists as road users. Transp. Res. Part F 2019, 63, 240–251. [Google Scholar] [CrossRef]
- Griffin, W.; Haworth, N.; Twisk, D. Patterns in perceived crash risk among male and female drivers with and without substantial cycling experience. Transp. Res. Part F 2020, 69, 1–12. [Google Scholar] [CrossRef]
- Clark, C.; Mokhtarian, P.L.; Circella, G.; Watkins, K. The role of attitudes in perceptions of bicycle facilities: A latent-class regression approach. Transp. Res. Part F 2020, 77, 129–148. [Google Scholar] [CrossRef]
- Nayak, M.S.D.P.; Narayan, K.A. Strengths and weaknesses of online surveys. IOSR Journal of Humanities and Social Sciences (IOSR-JHSS) 2019, 24, 31–38. [Google Scholar] [CrossRef]
- Murgano, E.; Caponetto, R.; Pappalardo, P.; Cafiso, S.; Severino, A. A novel acceleration signal processing procedure for cycling safety assessment. Sensors 2021, 21, 4183. [Google Scholar] [CrossRef] [PubMed]
- Cafiso, S.; Di Graziano, A.; Pappalardo, G.; Giudice, O. Using GPS data to detect critical events in motorcycle rider behaviour. Int. J. Mob. Netw. Des. Innov. 2014, 5, 195–204. [Google Scholar] [CrossRef]
- Sanders, R.L. Perceived traffic risk for cyclists: The impact of near miss and collision experiences. Accid. Anal. Prev. 2015, 75, 26–34. [Google Scholar] [CrossRef] [PubMed]
- Chaloupka-Risser, C.; Füssl, E. The importance of communication between cyclists and other traffic participants and its potential in reducing traffic safety-critical event. Trans. Transp. Sci. 2017, 8, 24–30. [Google Scholar] [CrossRef] [Green Version]
- Nelson, T.; Denouden, T.; Jestico, B.; Laberee, K.; Winters, M. BikeMaps.org: A Global Tool for Collision and Near Miss Mapping. Front. Public Health 2015, 3, 53. [Google Scholar] [CrossRef] [Green Version]
- Götschi, T.; Castro, A.; Deforth, M.; Miranda-Moreno, L.; Zangenehpour, S. Towards a comprehensive safety evaluation of cycling infrastructure including objective and subjective measures. J. Transp. Health 2018, 8, 44–54. [Google Scholar] [CrossRef] [Green Version]
- van Mierlo, H.; Vermunt, J.K.; Rutte, C.G. Composing group-level constructs from individual-level survey data. Organ. Res. Methods 2009, 12, 368–392. [Google Scholar] [CrossRef] [Green Version]
- Gisev, N.; Bell, S.; Chen, T.F. Interrater agreement and interrater reliability: Key concepts, approaches, and applications. Res. Soc. Adm. Pharm. 2013, 9, 330–338. [Google Scholar] [CrossRef] [PubMed]
- O’Neill, T.A. An Overview of Interrater Agreement on Likert Scales for Researchers and Practitioners. Front. Psychol. 2017, 8, 1–15. [Google Scholar] [CrossRef] [PubMed] [Green Version]
- Brown, R.D.; Hauenstein, N.M.A. Interrater Agreement Reconsidered: An Alternative to the rwg Indices. Organ. Res. Methods 2005, 8, 165–184. [Google Scholar] [CrossRef]
- Daniel, W.W.; Cross, C. Biostatistics: A Foundation for Analysis in the Health Sciences, 10th ed.; John Wiley & Sons: New York, NY, USA, 1999. [Google Scholar]
- Vargha, A.; Delaney, H.D. The Kruskal-Wallis Test and Stochastic Homogeneity. J. Educ. Behav. Stat. 1998, 23, 170–192. [Google Scholar] [CrossRef]
- European Transport Safety Council. How Safe Is Walking and Cycling in Europe? PIN Flash Report 38. 2020. Available online: https://etsc.eu/wp-content/uploads/PIN-Flash-38_FINAL.pdf (accessed on 11 September 2021).
Figure 1.
Data collection and analysis flowchart.

Figure 2.
Road infrastructure analyzed: (a) cycle track; (b) roundabout; (c) bicycle and bus shared lane; (d,e) cycle track termini; (f) signalized intersection.
Figure 2.
Road infrastructure analyzed: (a) cycle track; (b) roundabout; (c) bicycle and bus shared lane; (d,e) cycle track termini; (f) signalized intersection.

Figure 3.
Instrumented bicycle.

Figure 4.
Example of safety critical event (video frames and data sheet).

Figure 5.
Speed profile and longitudinal acceleration profile.

Figure 6.
Transversal acceleration profile and heading profile (SCE in the blue box time window).

Figure 7.
Distribution of SCE by bicycle facility area.

Figure 8.
Observed vs. perceived risk for all severity SCEs (higher values = higher risk).

Figure 9.
Observed vs. perceived risk for high/medium severity SCEs (higher values = higher risk).


Table 1.
Summary statistics.
| Site Category | Count | Mean | Median | Standard Deviation | Risk Rank |
|---|---|---|---|---|---|
| Cycle track termini | 157 | 2.03 | 2.0 | 0.88 | 2 |
| Roundabout | 78 | 1.89 | 2.0 | 0.84 | 1 |
| Signalized intersections | 464 | 2.13 | 2.0 | 0.76 | 4 |
| Cycle track | 78 | 2.81 | 3.0 | 0.82 | 5 |
| Bicycle and bus shared lane | 78 | 2.08 | 2.0 | 0.75 | 3 |
Table 2.
Kruskal–Wallis test.
| Site Category | Sample Size | Average Rank |
|---|---|---|
| Cycle track termini | 157 | 499.143 |
| Roundabout | 78 | 406.647 |
| Signalized intersections | 464 | 537.878 |
| Cycle track | 78 | 733.571 |
| Bicycle and bus shared lane | 78 | 469.41 |
Test statistic = 68.7314, p-Value < 0.01.
Table 3.
Travel time and safety critical events severity values.
| Site Category | Travel Time (s) | SCEs in Different Severity Classes | Total SCEs | SCE Rate (Total SCE/min) | |||
|---|---|---|---|---|---|---|---|
| Very Low | Low | Medium | High | ||||
| Signalized intersections | 50 | 2 | 4 | 1 | 1 | 8 | 9.6 |
| Roundabout | 90 | 0 | 4 | 4 | 2 | 10 | 6.7 |
| Cycle track termini | 20 | 0 | 1 | 1 | 0 | 2 | 6.0 |
| Bicycle and bus shared lane | 300 | 1 | 10 | 6 | 1 | 18 | 3.6 |
| Cycle track | 470 | 1 | 6 | 3 | 1 | 11 | 1.4 |
| Total | 930 | 49 | 3.2 | ||||
Publisher’s Note: MDPI stays neutral with regard to jurisdictional claims in published maps and institutional affiliations. |
© 2021 by the authors. Licensee MDPI, Basel, Switzerland. This article is an open access article distributed under the terms and conditions of the Creative Commons Attribution (CC BY) license (https://creativecommons.org/licenses/by/4.0/).
Share and Cite
MDPI and ACS Style
Cafiso, S.; Pappalardo, G.; Stamatiadis, N. Observed Risk and User Perception of Road Infrastructure Safety Assessment for Cycling Mobility. Infrastructures 2021, 6, 154. https://0-doi-org.brum.beds.ac.uk/10.3390/infrastructures6110154
AMA Style
Cafiso S, Pappalardo G, Stamatiadis N. Observed Risk and User Perception of Road Infrastructure Safety Assessment for Cycling Mobility. Infrastructures. 2021; 6(11):154. https://0-doi-org.brum.beds.ac.uk/10.3390/infrastructures6110154
Chicago/Turabian StyleCafiso, Salvatore, Giuseppina Pappalardo, and Nikiforos Stamatiadis. 2021. "Observed Risk and User Perception of Road Infrastructure Safety Assessment for Cycling Mobility" Infrastructures 6, no. 11: 154. https://0-doi-org.brum.beds.ac.uk/10.3390/infrastructures6110154