Article

Diagnostic Reliability in the Assessment of Degradation in Precast Concrete Elements

by
Antonio Bossio
1,
Giuseppe Faella
2,
Giorgio Frunzio
2,
Mariateresa Guadagnuolo
2,* and
Roberto Serpieri
2
1
Structures for Engineering and Architecture Department, University of Naples “Federico II”, 80125 Naples, Italy
2
Dipartimento di Architettura e Disegno Industriale, University of Campania “Luigi Vanvitelli”, 81031 Aversa, Italy
*
Author to whom correspondence should be addressed.
Submission received: 11 October 2021 / Revised: 8 November 2021 / Accepted: 10 November 2021 / Published: 18 November 2021

Abstract

:
In the past century, precast reinforced concrete has become the most widely used construction material in infrastructure engineering, especially for long-span structures. Nowadays, a growing research area concerns the assessment of concrete strength degradation due to environmental exposure and reinforcement corrosion. This paper reports an experimental campaign on some prefabricated concrete elements that were exposed to atmospheric agents for approximately 20 years. The campaign took the uncommon opportunity to access the full inspection and sampling of rebar. The included activities had different invasiveness and encompassed inspections, core sampling, corrosion potential mapping, compressive strength tests, as well as neutralization depth assays on cored surfaces, on chisel-split surfaces, and on drilling powders. The results bring together a global diagnostic picture of very limited degradation and of elements that are fully able to attend their design service life; the latter is estimated to be considerably higher than 20 years and to exceed 75 years if the concrete mix does not show quality issues. Results also permit drawing considerations on a hierarchy of diagnostic reliability in the evaluation of RC degradation, in which concrete core sampling plays the role of golden standard.

1. Introduction

The well-known 2018 collapse of the Polcevera Bridge, designed by Riccardo Morandi, as well as the 2020 collapse of the Albiano Magra highway viaduct and the 2017 Camerano overpass failure, recently raised concerns in Italy towards the degradation of concrete infrastructure. Other recent failures of long-span structures in Europe, such as the collapses of the Troja footbridge in Prague in 2017 and of the Pont de Mirepoix-sur-Tarn in France in 2019, have led researchers to consider the role of corrosion and deterioration, among other causes of collapse. The sudden and significantly fragile characteristics of the Polcevera and Albiano Magra collapse kinematics have led to the following hypotheses: (1) a possible role of steel corrosion and concrete deterioration among the failure causes; (2) the need to reconsider the expected useful life of similar infrastructures in reinforced concrete (RC) that were built within the first half and the middle of the past century; and (3) the need to reconsider the predictive ability of diagnostic practices that are commonly employed in civil engineering.
With a view towards a critical review of the reliability of some practices used today that are available for the diagnosis of degradation and the prediction of the serviceability life of RC infrastructures and buildings, this paper reports an experimental campaign carried out at the Department of Architecture and Industrial Design of the University of Campania “Luigi Vanvitelli” on a group of long-span precast concrete elements.
These elements were never put into service after prefabrication, which occurred between 2000 and 2006, and were exposed to weathering during their storage period in an outdoor area of the precast concrete plant “Sviluppo Silicalcite” in Caiazzo, in the north of Campania, in the south of Italy. The elements consist of RC precast columns, prestressed omega beams and a “T” shaped beam. The prefabrication industry made them available for scientific and engineering investigations, even for destructive testing, as they were previously scheduled for disposal, despite not being affected by any quality issues.
The recognition of more or less recent scientific and engineering documents that provide direct or indirect guidelines, recommendations, and regulations for the assessment of corrosion-related degradation in prestressed RC elements preceded the analysis of experimental results. Indeed, the comparison between the past and present paradigms on carbonation and nondestructive testing selection criteria is of particular interest in this type of study. A brief survey of the reported cases of concrete bridge failures and collapses due to corrosion is also reported. The subsequent sections report the Materials and Methods, as well as the experimental results. An overall global, diagnostic view of the investigated elements is elaborated on, based on the results. Finally, the evidence gained in this case study allowed for considerations on the hierarchy of reliability in the employed diagnostic methodologies.

Research Aim

The present research is aimed at finding a compromise between scientific research and engineering practice adopted during on-site tests for the assessment of the degradation of concrete structures and of their residual service life. The procedure for the inspection of prestressed bridges recommended by the US National Highway Research Programs [1,2] was accordingly accounted for.
Non-destructive measurements and partially destructive sampling supplemented the visual inspections in order to gain a suitable level of structural knowledge. Nondestructive tests also permit the combination of methodologies that differ by reliability and invasiveness, as well as allow a reciprocal assessment and a possible corroboration of test results that are garnered from different methodologies.
In consideration of available expertise and instrumentation, potential mapping field measurements were chosen as non-destructive measurements. Extraction of drilling powders, concrete cores sampling, and cutting of reinforcing bar samples were included as partially destructive tests. According to common practice by owners of RC infrastructures, two core samples for each structural element were performed. The uncommon opportunity of being able to cut rebars samples was possible due to the fortunate circumstance that the structural elements were not put into service. This requirement is highly valuable for scientific research.

2. Concrete Bridge Failures and Collapses Due to Corrosion

Only one serious case of corrosion in a prestressed bridge (the Hood canal bridge in the state of Washington) was found by analyzing reports of failures and collapses in prestressed concrete bridges that have occurred in the United States (US); no cases of catastrophic failure of prestressed bridges were reported up to 1970 in the US [1].
The failures of 823 US bridges in the period 1950–1991 are reported in [3], but only 36 were due to deterioration. A study of US bridge failures between 1980 and 2012 [4] reported 71 bridge collapses that were ascribable to environmental degradation, which amounted to 6.7% of all examined failures.
An analysis of over 500 bridge structures failures in the US between 1989 and 2000 [5], based on information collected by the New York Department of Transportation, reported 43 collapses attributed to deterioration, 14 to degradation of the bridges’ steel components and 6 cases that were directly related to steel corrosion. Notably, among those failures attributed to deterioration, only one case was reported as “concrete-corrosion”.

3. Guidelines for Assessing the Concrete Degradation in Prestressed Elements

Most research on the deterioration of RC structures focuses on cast-in-situ concrete, with minor attention to precast structures [6]. Several international standard codes provide indications on the tests to be performed and guidelines for monitoring, but few specifically deal with corrosion in precast and prestressed concrete structures. Although quite dated, a fundamental study is the NCHRP Report 90, which summarizes the large amount of scientific and engineering knowledge accumulated up until 1970 [1]. This report indicated that the designed campaign for degradation assessment in prestressed concrete should include a visual inspection in search for rust staining of concrete, longitudinal and transverse cracks, and for deterioration symptoms.
The NCHRP “Report 140” on the durability of prestressed concrete for highway structures [2] comprehensively scrutinized many available methods for detecting deterioration and recommends careful visual inspection by trained observers as the most cost-effective activity. Selective coring and impact hammer readings are recommended for concrete strength measurement. Among several test methods, the employment of potential measures on a small grid is suggested, considering their inexpensiveness and reliability. Direct observation and interpretation of the potential measure by exposing the prestressing steel at carefully selected locations are finally recommended. For completeness, it has to be highlighted that reliability of half-cell potential measurements is not unanimously agreed upon. For instance, fluctuations of potentials between active and passive levels have been observed over weeks, as reported in [7].
A recent US document is ACI 562-16 (code requirements for the assessment, repair, and rehabilitation of existing concrete structures) [8]. It specifies that structural evaluations should include visual observations, as well as destructive and nondestructive testing (NDT). It also specifies: “the licensed design professional should determine the appropriate number and type of testing needed to evaluate the existing conditions”, following ASTM C42 [9] and ASTM C823 [10]. The availability of the original structural design, the type of structural system, the desired accuracy, and the quality and condition of the in-place structural material influence the minimum number of tests. ACI 222.2R-14 [11] for the corrosion of prestressed steel and ACI 364.1R-07 [12] for the evaluation of concrete structures before rehabilitation are referenced.
Part 3 of Eurocode 8 (EC8-3) [13] specifically concerns the assessment and retrofitting of existing buildings, dealing with the design of structures for earthquake resistance. It contains no specific consideration of corrosion apart from a single mention of the necessity of carefully examining for steel corrosion. The code defines the minimum requirements for different levels of inspection and testing. Such minimums are disconnected from the structure peculiarity, but the code indicates two material samples per floor as a number sufficient to achieve “an extended level of inspection and testing”. EC8-3 also specifies that three cored samples allow the achievement of a “full knowledge” level (KL3). ANAS Italian guidelines report similar indications, under the condition that the strength coefficient of variation is lower than 10% [14]. In the presence of deicing salts, or when the distance from the marine coast is less than 5 km, ANAS guidelines recommend the measure of chloride content.
The Italian Building Code [15] introduces a service limit state of corrosion directly related to environmental exposure. Prestressed reinforcement is defined as a corrosion-sensitive reinforcement, while ordinary reinforcement is defined as a low corrosion-sensitive reinforcement. The corrosion of steel reinforcement is related to the class of environmental exposure, irrespective of any other factor, such as concrete quality. For concrete durability, tests to evaluate the resistance to penetration of carbon dioxide and chlorides are mentioned before water penetration tests. Pressurized water tests (UNI EN 12390-8 [16]) are indicated as an option. The possibility of resorting to imbibition tests in the absence of pressure is not mentioned. No noteworthy specific strategy for the inspection of corrosion in concrete structural elements is reported.
The Guidelines and Technical Instructions issued by the Italian Higher Council of Public Works [17] attribute higher reliability to strength measurements obtained from core sample tests, since the direct measure of strength does not require a correlation for data interpretation. A similar consideration applies to the detection and measurement of possible deterioration and oxidation signs. Direct visual inspection of cored concrete internal surfaces and cut steel rebar cross-sections are awarded the credit of golden standard in the measurement of possible deterioration and oxidation signs, i.e., are assumed to be primary source of evidence for engineering and scientific appraisal of deterioration (hierarchically, in the set of measures). The guidelines introduce a range in the number of core samples needed for the determination of structural strength, which does not depend on the volume of cast concrete of the inspected structure.

4. Causes of RC Structures Deterioration

4.1. Some Divergencies between Past and Present on RC Durability

In the middle of the last century, the most common perspective was that corrosion protection could be achieved and that significant long-term structural problems were not expected for properly designed and cast concrete (with an adequate chemical composition). This general opinion is supported, for unreinforced concrete structures, by the state of conservation of ancient Roman constructions such as the Pantheon [18]. For RC structures, this perspective has been supported by research on the long-term prediction of the engineering life of underground structures for the storage of nuclear waste [19,20]. The worst projection by Atkinson et al. (1985), for the engineering service life of a 1 m thick RC section made of ordinary Portland concrete, is longer than 180 years, under considerably severe exposure to sulphate attack by underground waters. The engineering service life is defined by this author as the timeframe in which the condition of load-bearing capacity is reduced by a factor of two. For sulphate-resisting cement, the same authors estimate this lifetime prediction to increase to 700 years. A remarkably high lifetime, ranging between 900 and 3000 years, is also reported for protection against rebar corrosion, although the much lower presence of oxygen in underground conditions should be considered [19].
Field observations in the USA of existing marine aboveground structures subject to environmental exposure to oxygen, carbon dioxide, and chlorides, as well as a three-year experimental campaign by the Texas Highway Department, carried out in the past century, clarified that the ability of concrete to inhibit steel corrosion is essentially granted by its water-tightness and its ability to hinder oxygen penetration [1,21,22]. In particular, concerning exposure to chlorides, a complete protection against corrosion after a three-year-long exposure to daily spraying with a 3% NaCl solution was shown in [22] for concretes having a low water/cement ratio, appropriate consistency, and enough concrete cover. This perspective is also confirmed in pre-1980 reviews and manuals in the European Community on concrete technology and applications (see, e.g., [23,24]). In a 1973 publication by the “Commision Belge du Béton Armé” [24] it can be reassuringly read, for instance, “L’expérience prouve qu’il n’est pas difficile de protéger les armatures de la corrosion par l’eau de mer”.
The NCHRP report [1] demonstrates that the complete absence of corrosion is highly probable for bridges in service of 50 to 100 years in chloride-free situations (e.g., in non-coastal areas and where de-icing salts are not used). Even in situations of chloride exposure, the excellent condition of a steel fragment in a pile that was exposed for 14 years to twice-daily immersion in water with a high chloride concentration demonstrates that long-term protection is possible. Although the chlorides eventually reach the steel, interesting empirical evidence shows that the corrosion will not occur if oxygen does not reach the surface of the steel. Voids, cracks, or local differences in concrete permeability to oxygen are key corrosion-promoting factors. Therefore, in [1] it was concluded that even in a chloride environment, long-time corrosion-free service should be attained for prestressed concrete bridges and that highway bridges were expected to have a service life of 75 years or more.
A 20% increment of concrete compressive strength was found by destructive testing on samples that were extracted from two bridges in Italy built between the First and the Second World War: the Cardè Bridge (notably, the first RC bridge crossing the Po river), and the bridge of Montaldo Roero [25]. Such an increment can be customarily explained by extrapolating the strength vs. time measurements obtained during the first 28 days after concrete casting.
However, when this perspective of achievable protection against corrosion and concrete degradation (emerging from the above-quoted studies of the seventies and the eighties of the past century) is compared with the statements that are reported in several works published after 1980, a controversial picture is gained. Post-1980 scientific reports and technical documents [26,27,28] give a great emphasis to the reduced service life of RC structures in relation to bar corrosion and carbonation. In several papers, carbonation is regarded among the primary detrimental factors responsible for the corrosion of bars and the reduction of the service life of concrete structures [29,30,31,32], while many others investigated the reduction of the strength capacity of RC structures due to corrosion (see, e.g., [33,34,35,36]).
Such a post-1980 increased attention towards the role of carbonation as a significant corrosion-promoting factor conflicts, however, with the past view of a relatively marginal concern towards carbonation. Even more recently, Collepardi [37] observed that: “the carbonation process in the total absence of chlorides appears to be only a necessary, yet not sufficient, condition to trigger the corrosion process in concrete steel reinforcement. Corrosion appears to be instead strongly affected by environmental humidity beside oxygen availability”.

4.2. Considerations on the Reliability of Nondestructive Techniques for Corrosion Measurement in Concrete-Embedded Steel Bars

Controversies between present and past research trends can also be found concerning the techniques that are preferably selected for measuring corrosion in embedded steel reinforcement. After 1980, resorting to indirect non-destructive measurements of corrosion rates by electrochemical methods, such as half-cell potential and linear polarization measurements [38,39,40], has increasingly replaced other inspective methods that have been recommended in the past. Concerning corrosion detection by electrochemical methods, the risk that emerged in early laboratory studies, which have shown that limitations exist in the employment of electrochemical techniques, when they are not supported by other measures and observations [41], deserves to be mentioned. The Authors of this study warn that even in a highly electronically controlled laboratory set-up, experimental error and uncertainties that affect electrochemical methods can lead to the rejection of a material which is capable of fulfilling its engineering service life. This consideration may raise concerns about the reliability of on-site electrochemical measurements, which, as a norm, are performed under significantly less-controlled conditions, as well as changing environmental factors.

5. Materials and Methods

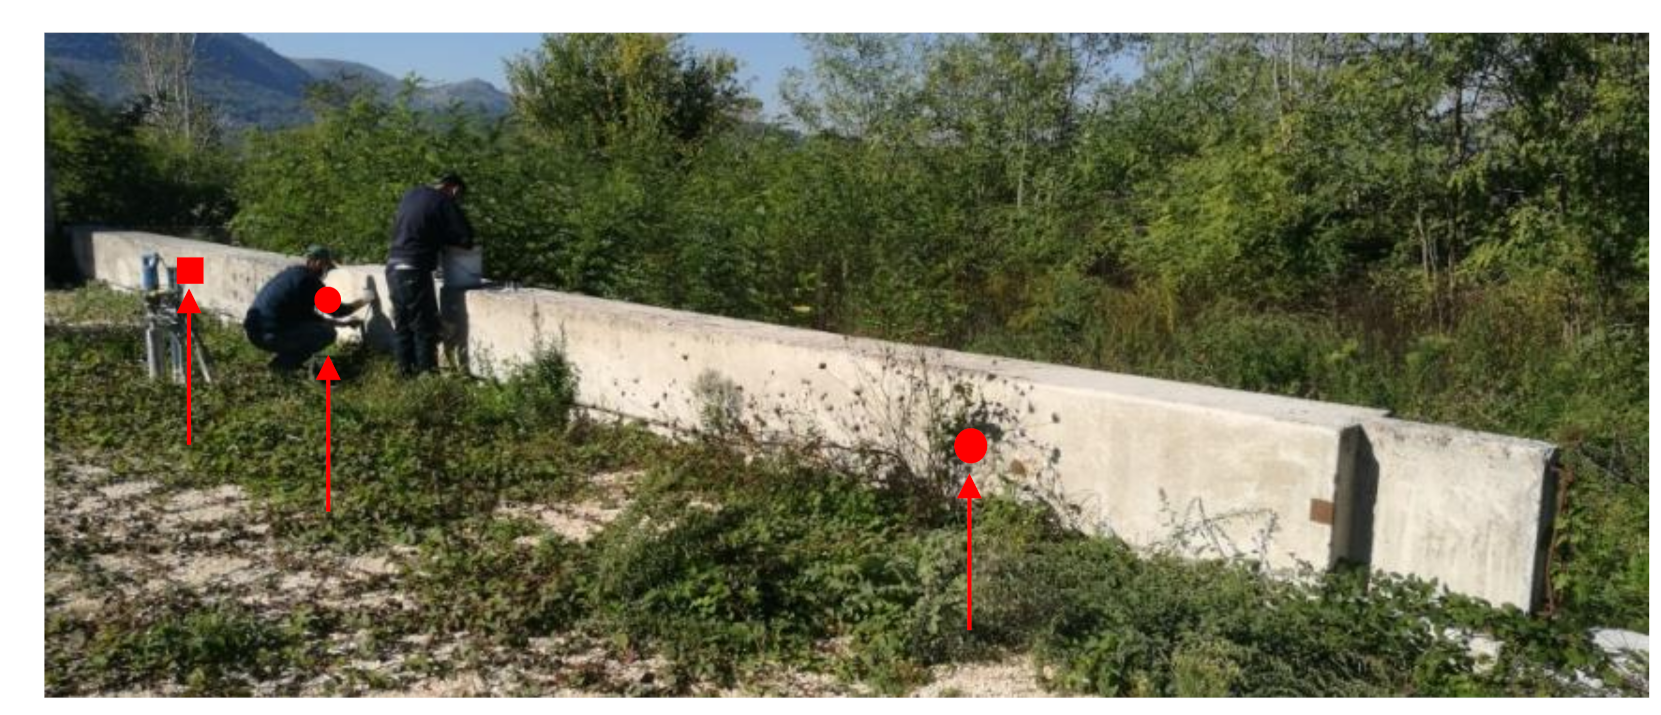
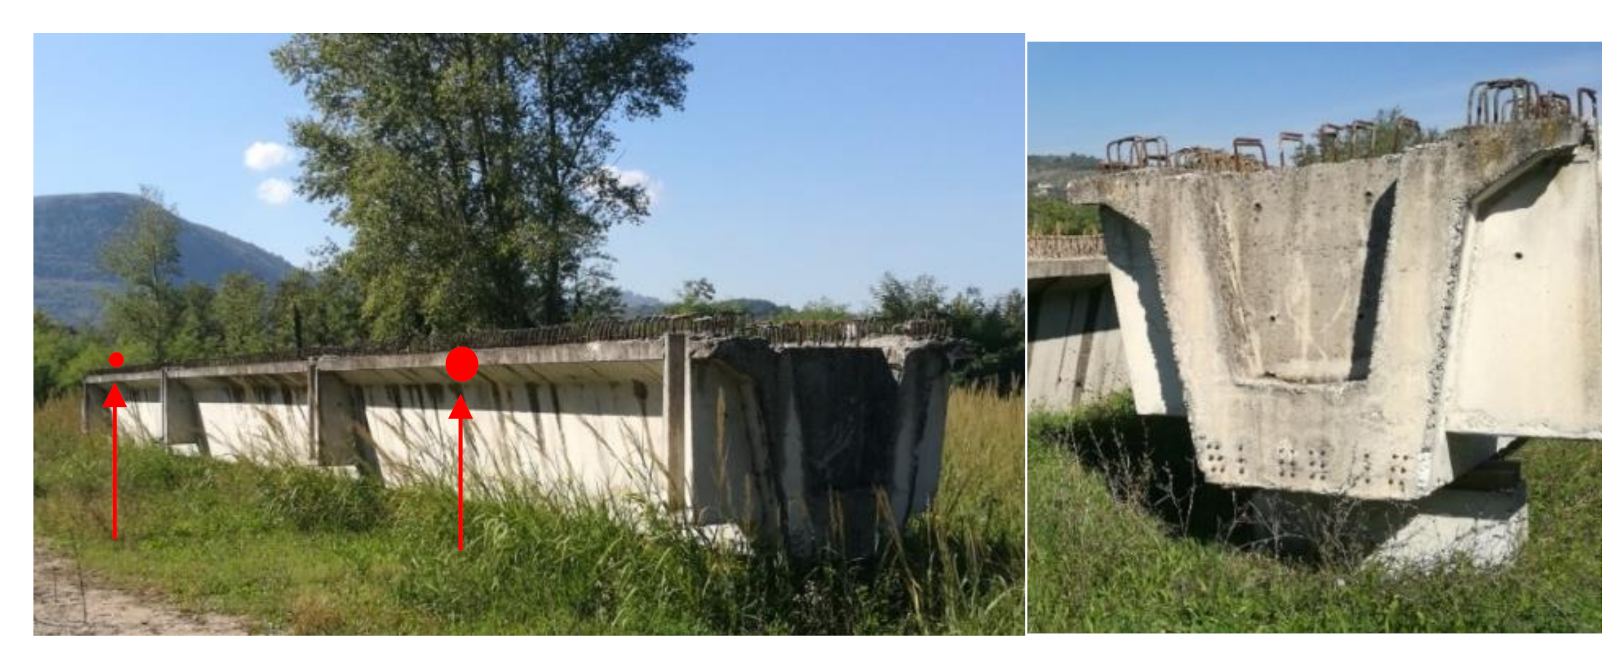
5.1. Tested Elements

The close-up inspection of three precast RC elements was carried out, together with partially destructive and non-destructive tests. The elements were selected from lots of different structural typology: one squared cross-section column (labeled “C” and shown in Figure 1), one prestressed omega beam (labeled “B1” and shown in Figure 2), and one prestressed T-beam (shown in Figure 3 and labeled “B2”).
The elements belong to undelivered lots that were stored in the open air during a period ranging between 14 and 20 years. Data on the design concrete strengths (Rc) and years of casting are reported in Table 1.

5.2. Site Environmental Conditions

The structural elements were stored outside the prefabrication plant. The plant is aside the northern bank of the Volturno River, in front of Alifano peak in Caiazzo. Columns “C” and beam “B1” were on the northwest side of the plant, while beam “B2” was on the southeast side.
Pluviometric and temperature records for the Caiazzo site, as well as other weather parameters, recorded from 2000 to the date of inspection to the site were found to fall within regional averages. The average precipitation recorded is 850–900 mm, with precipitation concentrated during the winter season. The prefabrication plant is in an area where, apart from one proximal heavy truck-parking site, no significant pollution factors or CO2 emissions of industrial or urban origin are found. In consideration of the pluviometry data, of the condition of the elements of being directly exposed to weathering actions with bottom surfaces lying in direct contact with the ground, and in consideration of the absence of knowledge of possible chloride sources, the attributable exposure class, as presumable before inspection, according to Eurocode 2, Part 1, [42] is to be selected among the exposure class XC0 (reinforced concrete in very dry conditions) and the exposure classes XC1-XC4 which EC2 relates to a presumable risk of corrosion induced by carbonation.

5.3. Testing Methods

The activities carried out comprised:
  • visual inspection of the elements, with an appraisal of concrete cover depths;
  • assessment of the deterioration of concrete and steel;
  • extraction of concrete core samples, according to [43];
  • visual inspection of the drilled surfaces;
  • visual inspection of the core samples and possible oxidation evidence;
  • phenolphthalein assays over core external surfaces according to [44,45] by spraying 1% ethanol solution;
  • additional phenolphthalein assay over the concrete cover surfaces, obtained by chisel splitting of a parallelepiped-shaped diamond-cut sample, according to [44,45];
  • phenolphthalein assay of powder samples, obtained by drilling, according to Carbontest® method [46,47,48];
  • compressive strength tests carried out in a certified laboratory, according to [49,50];
  • corrosion rate mapping performed by a half-cell potential method, using a CU/CUSO4 counter electrode, according to [51,52].

6. Tests and Results

6.1. Visual Inspections
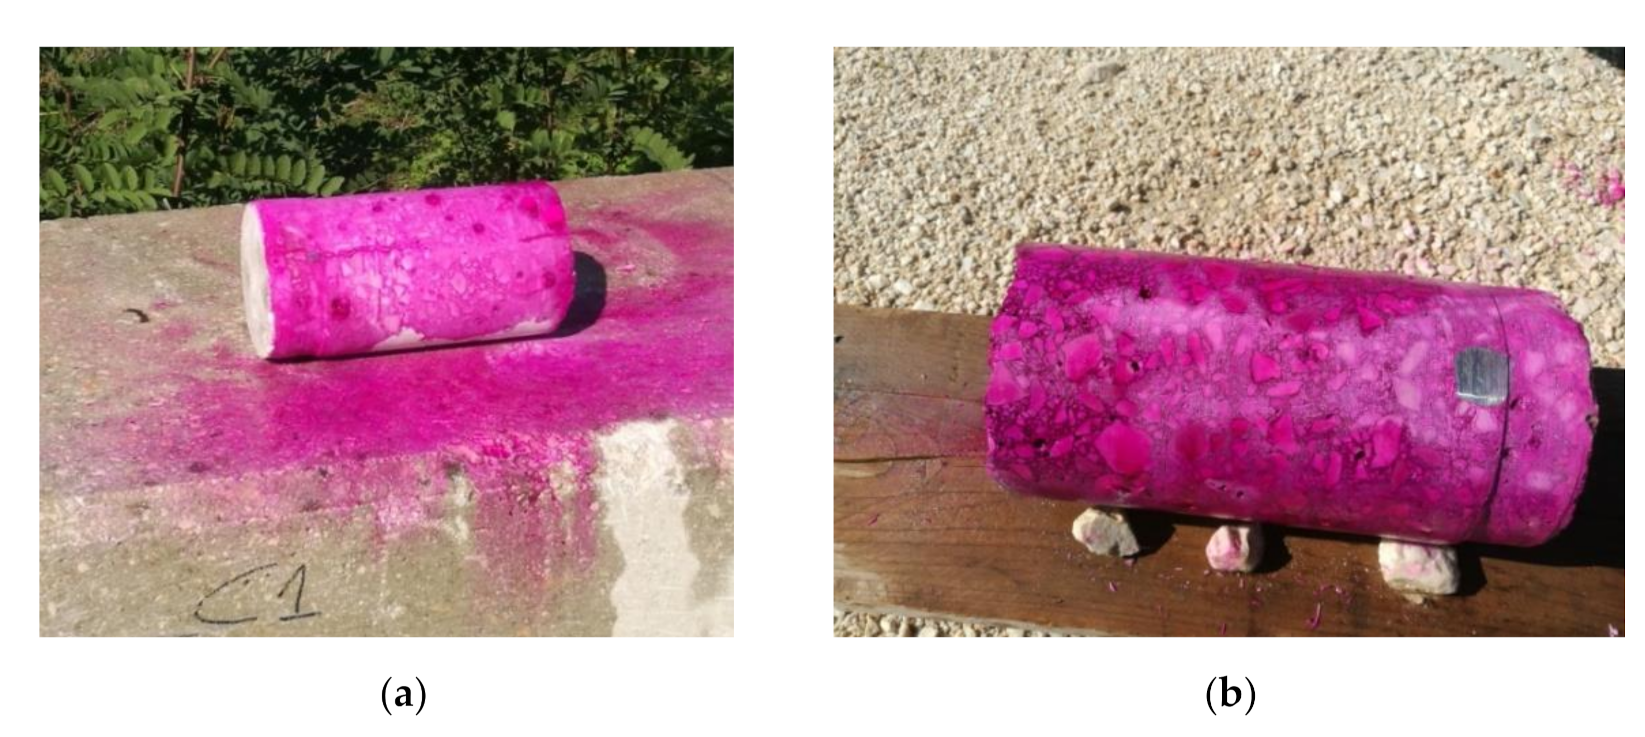
The tested elements were in a good state of conservation, except for expectable brownish signs of oxidation visible over the steel surfaces which were directly exposed to atmospheric agents. Cracks, which revealed concrete spalling and delamination, were visible in very circumscribed regions of the tested elements. The limited extent of spalling was verified in one of these regions by hammer blows that produced forced concrete cover delamination (see Figure 4a). The percentage of surface extension of the degraded regions over the total area of visible exposed surfaces was assumed, with a reasonable safety margin, lower than 2% (see Figure 1 and Figure 4a). The resulting debris (as shown in Figure 4b) revealed a concrete cover about 1 cm thick. After the first visual inspection alone and based upon on-site environmental conditions, the concrete surface of the elements was deemed to be classifiable into either the EC2 exposure class X0 (falling within the denomination “No risk of corrosion or attack—concrete with reinforcement or embedded metal: very dry”) or into any of classes XC1-XC4 (falling within the denomination “Corrosion induced by carbonation”).

6.2. Core Sampling

Core sampling was performed in compliance with the Italian standards UNI EN 12504-1/2002 [43]. The size of the samples was selected, as recommended, in due consideration of the aggregates’ size and structural element geometry. Core samples of diameter 10.4 cm were extracted from column “C” and beam “B2”, while a sample of diameter 7.0 cm was extracted from the beam “B1”. The cored length was 14 cm or longer. From each structural element, two cores were extracted. Figure 1, Figure 2 and Figure 3 show the position of the extracted cores by red arrows and dots.
Figure 5a shows the core-drilling device. Each core was labeled after extraction with a univocal code: C1 and C2 for column C, B1_1 and B1_2 for beam B1, and B2_1 and B2_2 for the second beam. Each specimen was photographed next to the relevant extraction site; Figure 5b shows sample C2.
The lateral surfaces of the cored samples showed uniform concrete compaction and a well-sorted grain size distribution. Remarkably, no visually perceivable corrosion was detected across the cut surfaces of the bars in all the extracted samples, as Figure 5c shows for a core sample from column C.

6.3. Mechanical Tests

The cylindrical samples were cut and ground into smaller specimens of height-to-diameter ratio H/D equal to 1. The compressive tests were performed according to UNI EN 12504-1/2002 [43]. The compressive strength was subsequently determined following the British Standard EN 12504-1, 2009 (BS), the Italian National Building Code, 2018 (NTC), the American Concrete Institute 214.4R-10, 2010 (ACI), the UNI EN 13791, 2007 (UNI EN), and the Concrete Society, 1987 (CS) [15,53,54,55,56].
Table 2 reports the raw data from the compressive strength tests (diameter ϕ, height H, and density ρ). The density of the B1 and B2 concrete is slightly different and the variability characterizing the properties of concrete can explain such a difference due to differences in the aggregates (type and grain size), even with the same compressive strength.
Table 3 reports the cubic strength values resulting from the data of Table 2, as processed according to the five considered standards. Cores from beam B2 provided lower and more dispersed results, but these were within the variability that usually characterizes the strength of cores that are extracted from existing structures [17,57].
Table 4 compares the mean cubic strength that is provided by core samplings (computed as the average of the ten concrete strengths as provided by the five standard codes for every structural element) with the design cubic strength (retrieved from the technical documentation of the prefabrication lot). The coefficient δ of Table 4 is the percentage variation between the mean strength from testing and the design strength.
Table 4 shows, only for beam B2, a negative percentage variation between the strength values obtained from testing and the design strength. In addition, the compressive strength of beam B1 shows a certain increment, despite the smaller diameter of the specimen. If general conclusions are to be sought, to the authors’ advice, the data and evidence gained only permit the exclusion of quality issues for the concretes of column C and beam B1. The number of strength tests performed is deemed insufficient to assess, with suitable confidence, the existence of a quality issue related to the concrete mix of beam B3 or to conclude a possible appreciable size effect of the core dimensions on compressive strength. It should be also remarked that controversial statements can be found in the literature concerning a favorable [58,59], unfavorable [60,61], or irrelevant [62,63] effect of core specimen size over strength. ACI 214 2010 [54] recommends the careful alignment of the specimen in the testing machine when cores of smaller diameters are tested.

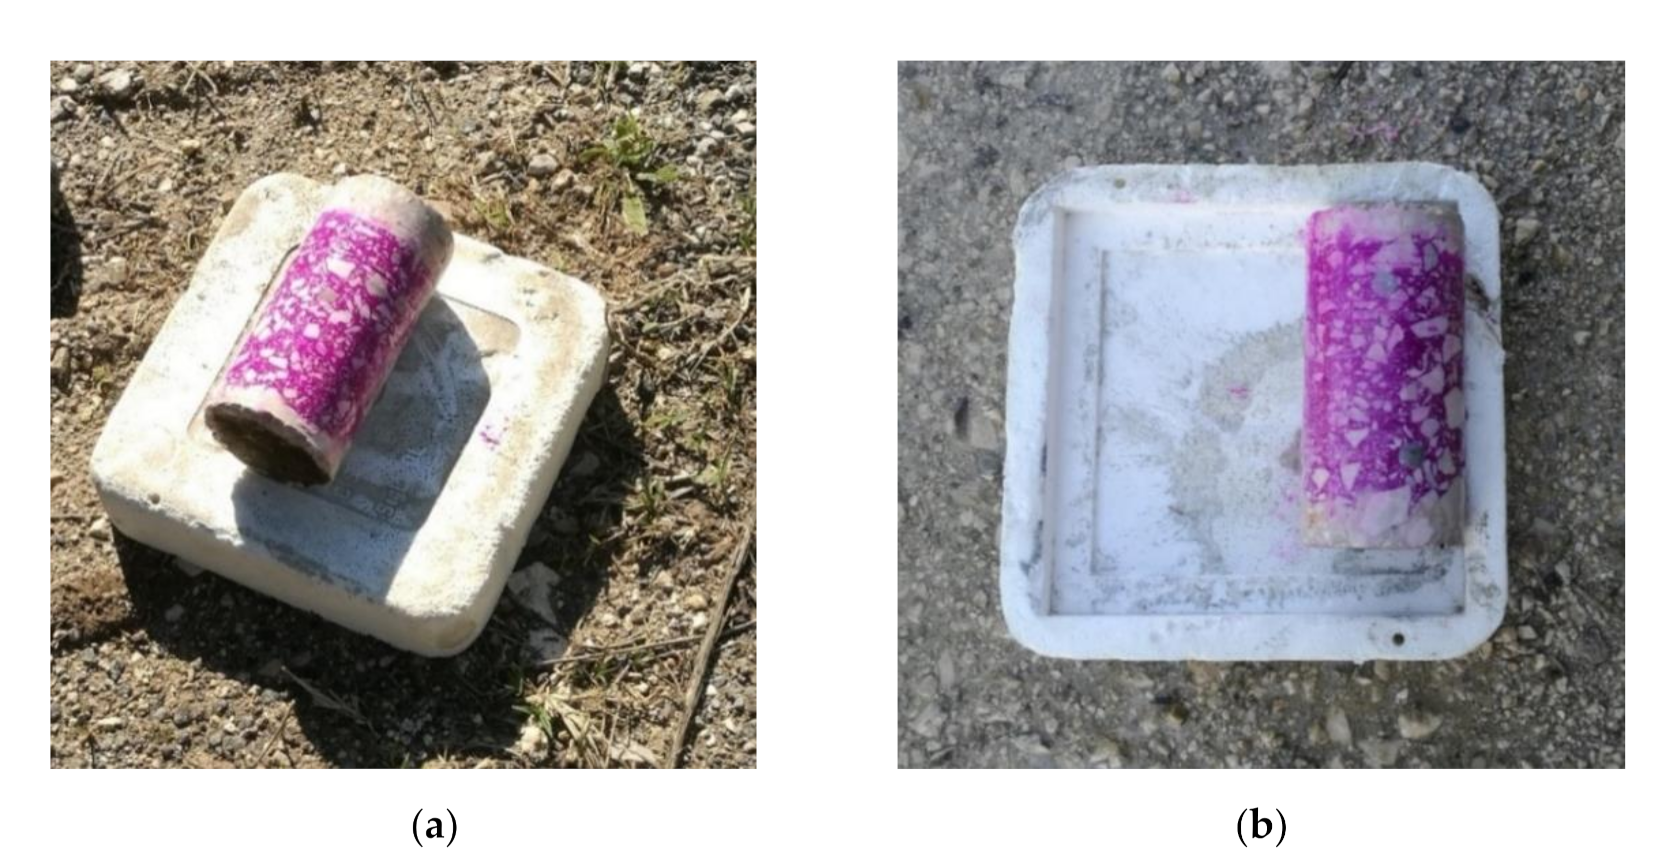
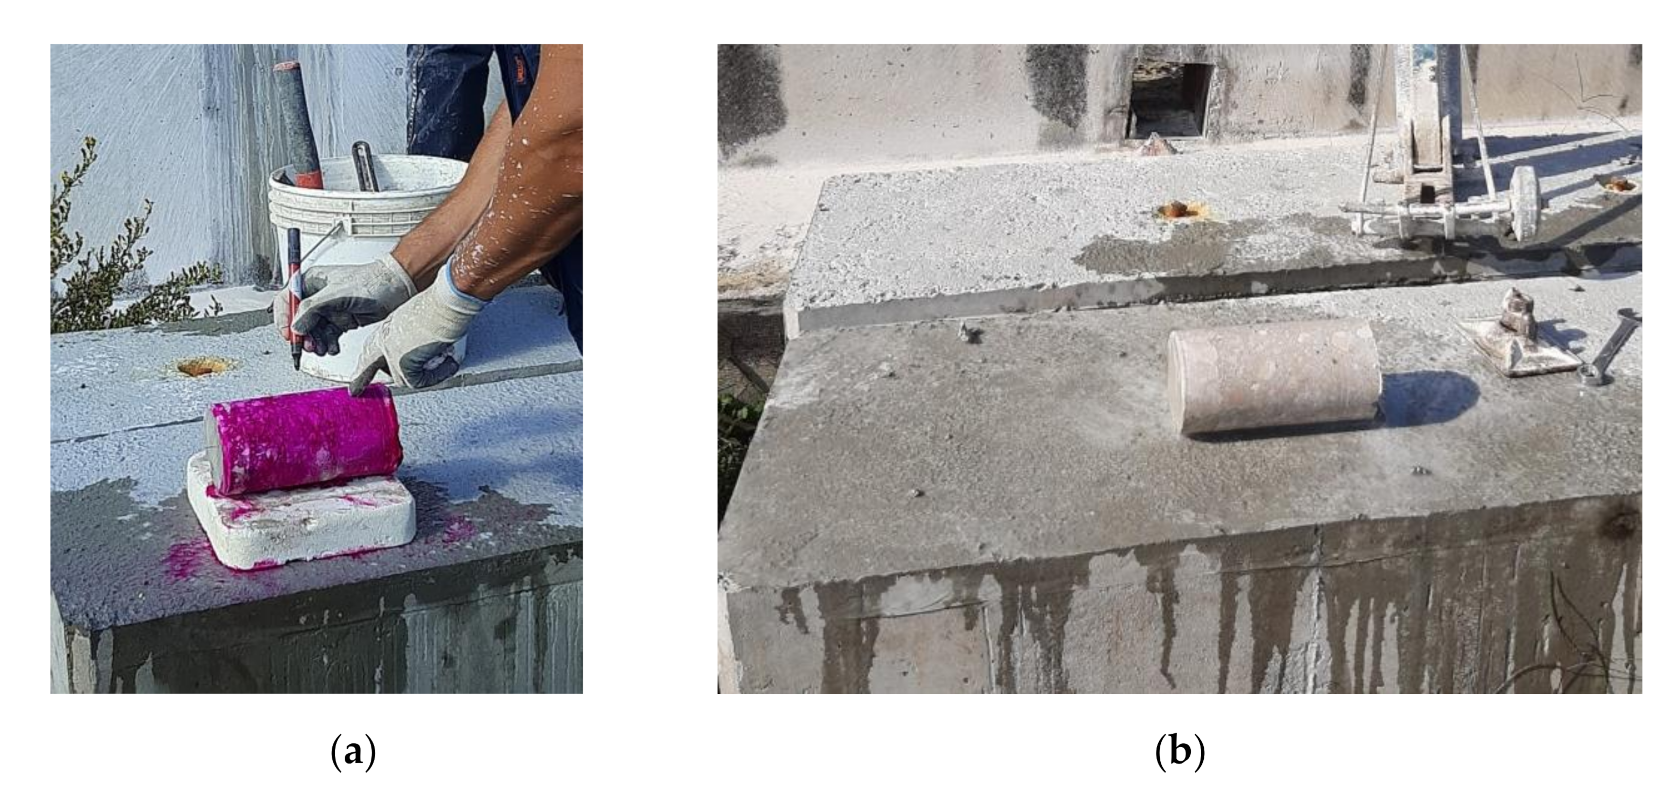
6.4. Carbonation Tests

Measurements of carbonation depth are obtained through colorimetric assays for detecting whether, in some areas of the specimen, pH has eventually dropped below a threshold of 9.2, over the years. These tests were carried out immediately after coring, on each one of the six core samples, by spraying a nebulized 1% phenolphthalein solution in ethanol over the sample surfaces (phenolphthalein test).
Figure 6, Figure 7 and Figure 8 contain photographs of the core samples before and after phenolphthalein spraying. In four out of the six sprayed cores, the assays failed to detect a neutralization front. Only two samples (B1_1 and B1_2 extracted from the prestressed omega beam) showed neutralization with carbonation depth (at pH approximately below 9.2) ranging between 10 mm and 20 mm.
In the first stage of the experimental campaign, the absence of the detection of the carbonation front in four samples was explained by the relatively short life of the selected structural elements. Two possible additional hypotheses were the following:
the storage area of the beams is located near the bank of the Volturno river and is a considerably humid site; therefore, since the higher the humidity, the slower the transport of gaseous CO2, due to the saturation of the pores by water [64], humidity may have slowed the penetration of CO2 through the concrete cover [65].
although beam B1 is younger, it could have been cast with a concrete composition that may have favored carbonation.
In a second phase, a further test according to the UNI 9944 standard was considered necessary. A sample C3 of approximately parallelepiped shape and with the approximate dimensions of 11 × 12 × 5 cm was extracted from column C at one of its upper lateral edges by making four planar surface cuts, using a rotating diamond disc, as shown in Figure 9a,b. Under the UNI 9944 standard, the sample was then divided into two halves using a chisel and hammer, after having made a superficial incision on the face of the sample that was opposite to the upper face exposed to atmospheric agents. The split surface thus produced was substantially free of dust and, with good approximation, was orthogonal to the surface of the concrete cover, therefore, the phenolphthalein test was carried out. After 1% phenolphthalein spraying on these surfaces, the appearance of a neutralization front was observed, which delimits the pH 9.2 limit between purple shades and the absence of visible shades. It was carefully verified that this front did not belong to the pilot cut surface, and was quite far from it. It was also verified that the surface areas containing this face were all free from any deposits of cement dust that resulted from the diamond cuts. As shown in Figure 9c, the neutralization strip was substantially parallel to the surface of the concrete cover. The average measured depth of this zone was d k = 6 mm, and its maximum value was d k   m a x = 9 mm. This last test is preferable to the previous ones, since it offered a less disturbed testing surface, although very often the number of cores/specimens that can be extracted from the same structural element is limited.
Finally, two additional neutralization phenolphthalein assays of the concrete powders, flowing out from two sample percussion drillings made on column C, were collected into test tubes, and were performed according to the Carbontest® method, employing the specific commercially available instrumentation [39,40]. The device comprises an annular head with a circular brush, fitted with a funnel that directs the powder coming out during perforation down into a vertical, transparent test tube. The test tube is devised to facilitate the infiltration of the collected powder by phenolphthalein solutions for neutralization assays. Measured drilling depths were: p p o w d , 1 = 40 mm for the first sampling and p p o w d , 2 = 35 mm for the second one. The respective depths of the dust layers deposited in the test tubes were h p o w d , 1 = 30 mm and h p o w d , 2 = 25 mm. The tests on the CLS powder samples were carried out by adding the same phenolphthalein reagent solution into the two test tubes and then waiting for the time required for the complete imbibition of the dust layers. The measured depths of the carbonation front in the two dust samples were d k   p o w d , 1 = 17 mm and d k   p o w d , 1 = 15 mm. Figure 9c shows altogether the pH 9.2 neutralization fronts in both the split specimens and the two test tubes. Notice that the vertical support base of the test tubes is placed 7 mm below the bottom of the powder container.
The first three columns of Table 5 collect all measures related to the powder assays. The fourth column reports the ratio d k   p o w d / d k , confronting the depth of the neutralization front, which was measured from powders, against the golden standard depth d k , measured on the split specimen C3. The fifth column reports the quantity d k   e s t . p o w d d k = d k   p o w d h p o w d × p p o w d d k , where d k   e s t . p o w d is the estimate of the neutralization depth in sample C3, as presumed from the data on the powders, assuming a linear correlation factor between the powder stratigraphy and the corresponding stratigraphy in the concrete solid material.
The integrative tests on sample C3 suggest that the failure to detect a neutralization front in cores C1 and C2 may be explained by an alteration in the external surface of these cores, due to the deposition of concrete powder ensuing from coring. The neutralization assays on the drilling powders by the Carbontest method provide further evidence of the presence of a carbonation front; however, it has to be emphasized that with this latter, indirect method, the brute depths of the carbonation fronts in the two dust samples (where brute refers to the absence of the application of corrective correlation factors) are in ratios of 283% and 250% with the golden standard measure d k of the neutralization front which was directly observed on sample C3, therefore, an overestimation by a factor greater than 2.5 should be taken into account. A magnification by an approximate factor of 2 between the real thickness and the powder thickness has been also indicated in [39,40], concerning the instrumentation and measurement parameters therein employed.

6.5. Corrosion Potential Mapping

Corrosion potential mappings were performed according to ASTM C 876-15 [51], and the recommendations in [38], using a copper/sulphate copper [Cu/CuSO4] electrode. This non-destructive test comprises measurements of the potential difference between a reinforcing bar within concrete and the reference electrode placed on the concrete’s surface.
Figure 10 shows the values of the measured corrosion potential over the three analyzed structural elements. Background colors emphasize data according to the following chromatic scale: colors from light green to red highlight potential values in the range from −200 mV to −350 mV (vs. Cu/CuSO4), green shades emphasize values higher than −200 mV, while colors increasingly shading to red concern values lower than −350 mV. These data are interpreted as follows: values higher than −200 mV denote an absence of corrosion, values in the range (−200 mV, −350 mV) indicate an increased probability of corrosion initiation, while values lower than −350 mV are representative of corrosion initiation.
According to these criteria, the five measured values can be interpreted as indicative of minor corrosion initiation processes. Measured potentials were affected by variations in the concrete cover thickness. It is remarked that some degree of arbitrariness is found in the literature concerning the precise definition of the thresholds of the criteria.

7. Discussion

The elements of evidence gained in the present campaign contribute to the discussion of two main issues concerning the assessment of degradation and the service life of precast concrete elements: (a) the hierarchy of the diagnostic reliability of the testing and inspection activities deployed by the campaign; (b) the ability of concrete structures to comply with their design service life, against some elements of divergence highlighted in Section 4.

7.1. Reliability Hierarchy of Testing and Inspection Activities

The main conclusion is that core sampling, with a visual inspection of embedded bars, can be identified as a diriment golden standard for the diagnosis of degradation in concrete and steel reinforcement. In the absence of core sampling, a reliable assessment of the durability and expected service life would be much more difficult and affected by controversial elements for their judgment. Besides, the proper calibration of the methods employed which have lower invasiveness, such as powder neutralization assays, would not be possible. As shown by the data in Section 6.4, in the absence of visual inspection and direct determination of the depth of neutralization in chisel-cracked surfaces, there would have been an average overestimation of 300% of the presumed carbonation depth from the dust assays alone. According to the common misconceptions that corrosion is only caused by carbonation, this last condition would have led to the conclusion of probable corrosion of the reinforcements and, therefore, is an unrealistic forecast of advanced degradation.
A similar consideration can be drawn, regarding potential measurements by half-cell methods, for the recognition of the existence of some arbitrariness factors, in the light of studies reported in [1,2,9]. The NHCRP 140 report warns that “none of the non-destructive methods are suitable for identifying corrosion” [2] and the risk of discarding a material, capable of functioning for its entire engineering useful life, has been emphasized in [41] when only electrochemical measurements are performed in a test campaign.
Consequently, potential measurements should be employed in a diagnostic campaign on RC durability only if they are combined with inspection and testing techniques of a superior degree of diagnostic insight. Under this provision, electrochemical measurements are recommended in [2] as a rather inexpensive tool for structural anamnesis and degradation diagnoses when employed by trained experts for locating possible anodic and cathodic areas, as previously shown, for instance, in 1957 when discriminating among possible factors that caused corrosion in the San Mateo-Hayward Bridge [66].

7.2. Service Life: Past and Present

Based on the evidence garnered on the state of conservation of the materials and structures that were investigated in this study, and on previous experience with the durability of real concrete structures, accelerated laboratory tests, and field experiments [22,67], a simple preliminary quantitative verification is hereafter proposed of the ability of structural elements to comply with a conventional presumable design service life of 75 years.
This verification identifies the useful engineering service life as the time required to reduce the original load-bearing capacity to 50%, following conventional methodologies that have already been employed for considerably more extended time projections, in the service of nuclear waste repositories [19]. The extended time-window for the verification of 75 years was selected, since it appears as a lower bound of the expected useful service life for highway bridges, as mentioned in the NCHRP Report 90 [1]. The rationale behind this 75-year threshold is not exposed in the NCHRP 90, although it appears to be customarily accepted, as a lower bound. Furthermore, an empirically estimated 70-year lower-bound value for the deterioration of concrete bridge substructures can be traced back to Beaton and Stratfull [68] who associated it with the minimal presence of environmental chlorides.
The element selected for the verification is column C. The absence of appreciable damage on the longitudinal steel reinforcement, as well as the detection of only a very limited reduction in cross-section (due to concrete spalling), lead to the choice of computing the cross-section resistance in consideration of only the geometrical reduction of the concrete cross-section.
The column has a square section of side l 0 = 50 cm. Bending resistance modulus and inertia moment at initial service conditions are denoted by zero subscripts: W 0 = l 0 3 / 6 and I 0 = l 0 4 / 12 . The 2% upper bound of extension of the damaged cover is examined. An upper bound of the linear extension of such delaminated regions onto the perimeter of the cross-section of the column can be conservatively set to 5%. Moreover, conservatively arguing that the ground face of the column, which was the only uninspected face, has the same degree of damage, a 10% aliquot of damaged cross-section perimeter is obtained. A further strong conservative assumption implicitly introduced in this 10% reduction is that such a 10% reduction of concrete cover characterizes the entire length of the column.
The flexural performance of the column at time zero can be measured by the initial working-stress moment, M 0 = W 0 σ c 0 , with σ c 0 being the design working stress. The strength parameter measuring the axial load performance which is mostly affected by the cross-sectional reduction is the Eulerian critical buckling load, whose time zero value is denoted by the symbol N c 0 . The specific constraint conditions of the column can be disregarded, expressing the dependence of N c 0 upon the square section geometry through a proportionality to the initial moment of inertia I 0 . This proportionality, as well-known, is provided by N c 0 E c 0 I 0 = E c 0 l 0 4 / 12 , and entails dependence on the fourth power of the side length. Moreover, the absence of quality issues in the column concrete ( f c o r e shows a 1.44% increase, see Table 4) allows one to conservatively adopt an unaltered value over time for the working stress, σ c = σ c 0 , and the Young modulus, E c = E c 0 .
Based on the largely conservative hypotheses introduced above (resulting in a 10% incidence of the damaged subset of the section perimeter), and on the upper bound of 1.5 cm for the concrete cover depth lost due to delamination, a “smeared”, conservative lower bound of the edge length l 20 of the damaged cross-section at the time of inspection (20 years) is computed as:
l 20 , u n l . = 2 × 0.9 × l 0 2 + 0.1 × l 0 2 1.5 = 49.7   cm .
Subscript unl is added in (1), and hereafter, to denote quantities relevant to the unloaded condition, actually experienced by the column. This conservative estimate allows the computing of the following moment ratio for the unloaded column:
M 20 , u n l . M 0 = W 20 , u n l . σ c 20 W 0 σ c 0 > l 20 , u n l . l 0 3 = 98.2 %
Under the realistic assumption E c 20 > E c 0 , the computation of buckling load leads to:
N c 20 , u n l . N c 0 = E c 20 E c 0 l 20 , u n l . l 0 4 > l 20 , u n l . l 0 4 = 97.6 %
The projection to 75 years is thus obtained considering a power-law extrapolation:
N c 75 , u n l . N c 0 = N c 20 , u n l . N c 0 75 / 20 > 0.976 3.75 = 91.29 %
To extend the condition of the 20-year-old specimens, left on the ground, to an equivalent precast element that is additionally subjected to dead and live loads, experience with the durability of real concrete structures, accelerated laboratory tests, and field experiments recorded in NCHRP 101 [67] and by the Texas Highway Department [22] can be employed.
The effect of static and cyclic bending loading on the freeze–thaw and corrosion durability of concrete bridge decks (which were replicas of portions of actual bridge deck slabs) was observed and quantified in [67] in terms of dimensionless damage ratings. These damage ratings are compared with the corresponding ratings attributed to unstressed structures. The comparison of loaded and unloaded specimens revealed that, although stress affects freeze–thaw durability and has a certain influence on the scaling of surface mortar, its effect is not dominant.
It should also be noted that the observed differences in the behavior of some sub-series prevented the use of statistical methods of data analysis. Furthermore, the survey could not observe significant corrosion during the observation period (three winters) when the elements were exposed outdoors. However, the study could explain important issues regarding the contribution of load during the damage assessment, such as the tendency of static tensile stresses to accelerate the scaling rate, and the propensity of compressive and biaxial static stresses to slightly retard the scaling development.
The main conclusions of NCHRP 101 are the statement: “although stress appears to influence somewhat the rate of development of surface scaling, it is not a primary factor”, as well as indicating the identification of the physical characteristics of surface mortar and aggregates as the primary influential factors for deterioration [67].
To extend the conservative lower limit determinations of Equations (1) and (2) to loaded samples, an upper limit worst-case pejorative coefficient can be extracted from the full set of 80 detailed damage records reported in [67]. These data are presented in terms of damage parameters plotted vs. the number of freeze–thaw cycles (see Figures 23–102) of [67]) under different loading conditions (cyclic/static, tensile/compressive, uniaxial/flexural/torsional).
The highest possible damage amplification coefficient, α_load, retrievable from the full data set, relevant to the repercussion of loading addition on the damage ratings, is obtained from the sub-series “B8—uniaxial stress” (see Figure 30 of [67]), and corresponds to the value α_load = 5.2. Such a highest penalty factor conservatively bounds the effect of any loading, in terms of the percentage of concrete cover loss. The extremely conservative upper-bound rationale, in the adoption of the value α_load = 5.2, disregards the consideration of any further reassuring evidence which also emerged from the campaign reported in [68]: in this paper, only 52% of the static tension tests showed ratings of scaling higher than those of the unstressed specimens. This implies that, in 48% of the comparisons between the extent of damage relevant to the loaded conditions and in the unloaded conditions, the damage level was either unaltered or even obtained a beneficial effect by loading.
These data are supplemented by the records of [22], which concern the role of loading in the corrosion of RC structures. The four-year accelerated corrosion research program investigated the effect on both loaded beams and unfilled slab samples, using relatively severe salt spray exposure to promote corrosion in many samples. A wide range of experimental parameters were considered, such as the concrete quality, the level of steel stress, concrete cracking and prestressing, the location of steel and concrete, exposure, and the loading conditions. The conclusion of the program was: “in general, only slightly more corrosion occurred on the stressed bars as compared to the unstressed bars of flexural beams” [22]. Furthermore, as far as the effect on corrosion is concerned, even at very high steel stresses of 248 MPa, minor importance can be attributed to the role of loading in the enhancement of corrosion; they report indeed: “Only a slight increase in corrosion resulted as a consequence of stressing the beam reinforcement through flexural loading. These observations indicate that the existence of stresses in the reinforcing bars (up to 36 ksi) and the flexural cracks produced by these stresses were of less importance as corrosion accelerating hazards than had been expected” [22].
The considerations above, with the retrieval of the amplification factor α l o a d = 5.2 , lead to the following computation of an upper bound of the concrete cover loss after 20 years, in the presence of loading and freeze–thaw conditions, expressed in the smeared form of an equivalent square section length l 20 , l . :
l 20 , l = 2 × 1 α l o a d × 0.1 × l 0 2 + α l o a d × 0.1 × l 0 2 1.5 = 2 × 0.48 × l 0 2 + 0.52 × l 0 2 1.5 = 48.44   cm .
From this upper-bound determination l 20 , l = 48.44   cm , the flexural performance reduction results to be:
M 20 , l M 0 = W 20 , l σ c 20 W 0 σ c 0 > l 20 , l l 0 3 = 48.44 50.0 3 = 90.93 %
and the corresponding performance reduction in terms of buckling axial load is:
N c 20 , l N c 0 = E c 20 E c 0 l 20 , l l 0 4 > l 20 , l l 0 4 = 48.44 50.0 4 = 88.1 % ,
Extrapolation of Equation (5) from 20 to 75 years leads to:
N c 75 , l N c 0 = N c 20 , l N c 0 75 / 20 > 0.881 3.75 = 62.18 % > 50 %
Despite its exceedingly conservative character, inequality (6) constitutes a formal engineering verification, in terms of upper bounds, of the property that the engineering service life of the column exceeds 75 years.
It is promptly understood that a fundamental engineering constraint for the outcome of the verification that is exemplified above for the column is the possibility of considering σ c 0 as a lower bound of the strength σ c developed along with the service life of the investigated element. The presence of a quality issue, such as the 20% decrease that emerged for concrete strength of beam B3, may preclude a positive outcome of the verification. This final consideration is ultimately a reaffirmation of the importance of the absence of quality issues in the concrete mix design

8. Conclusions

The main research conclusions are the following:
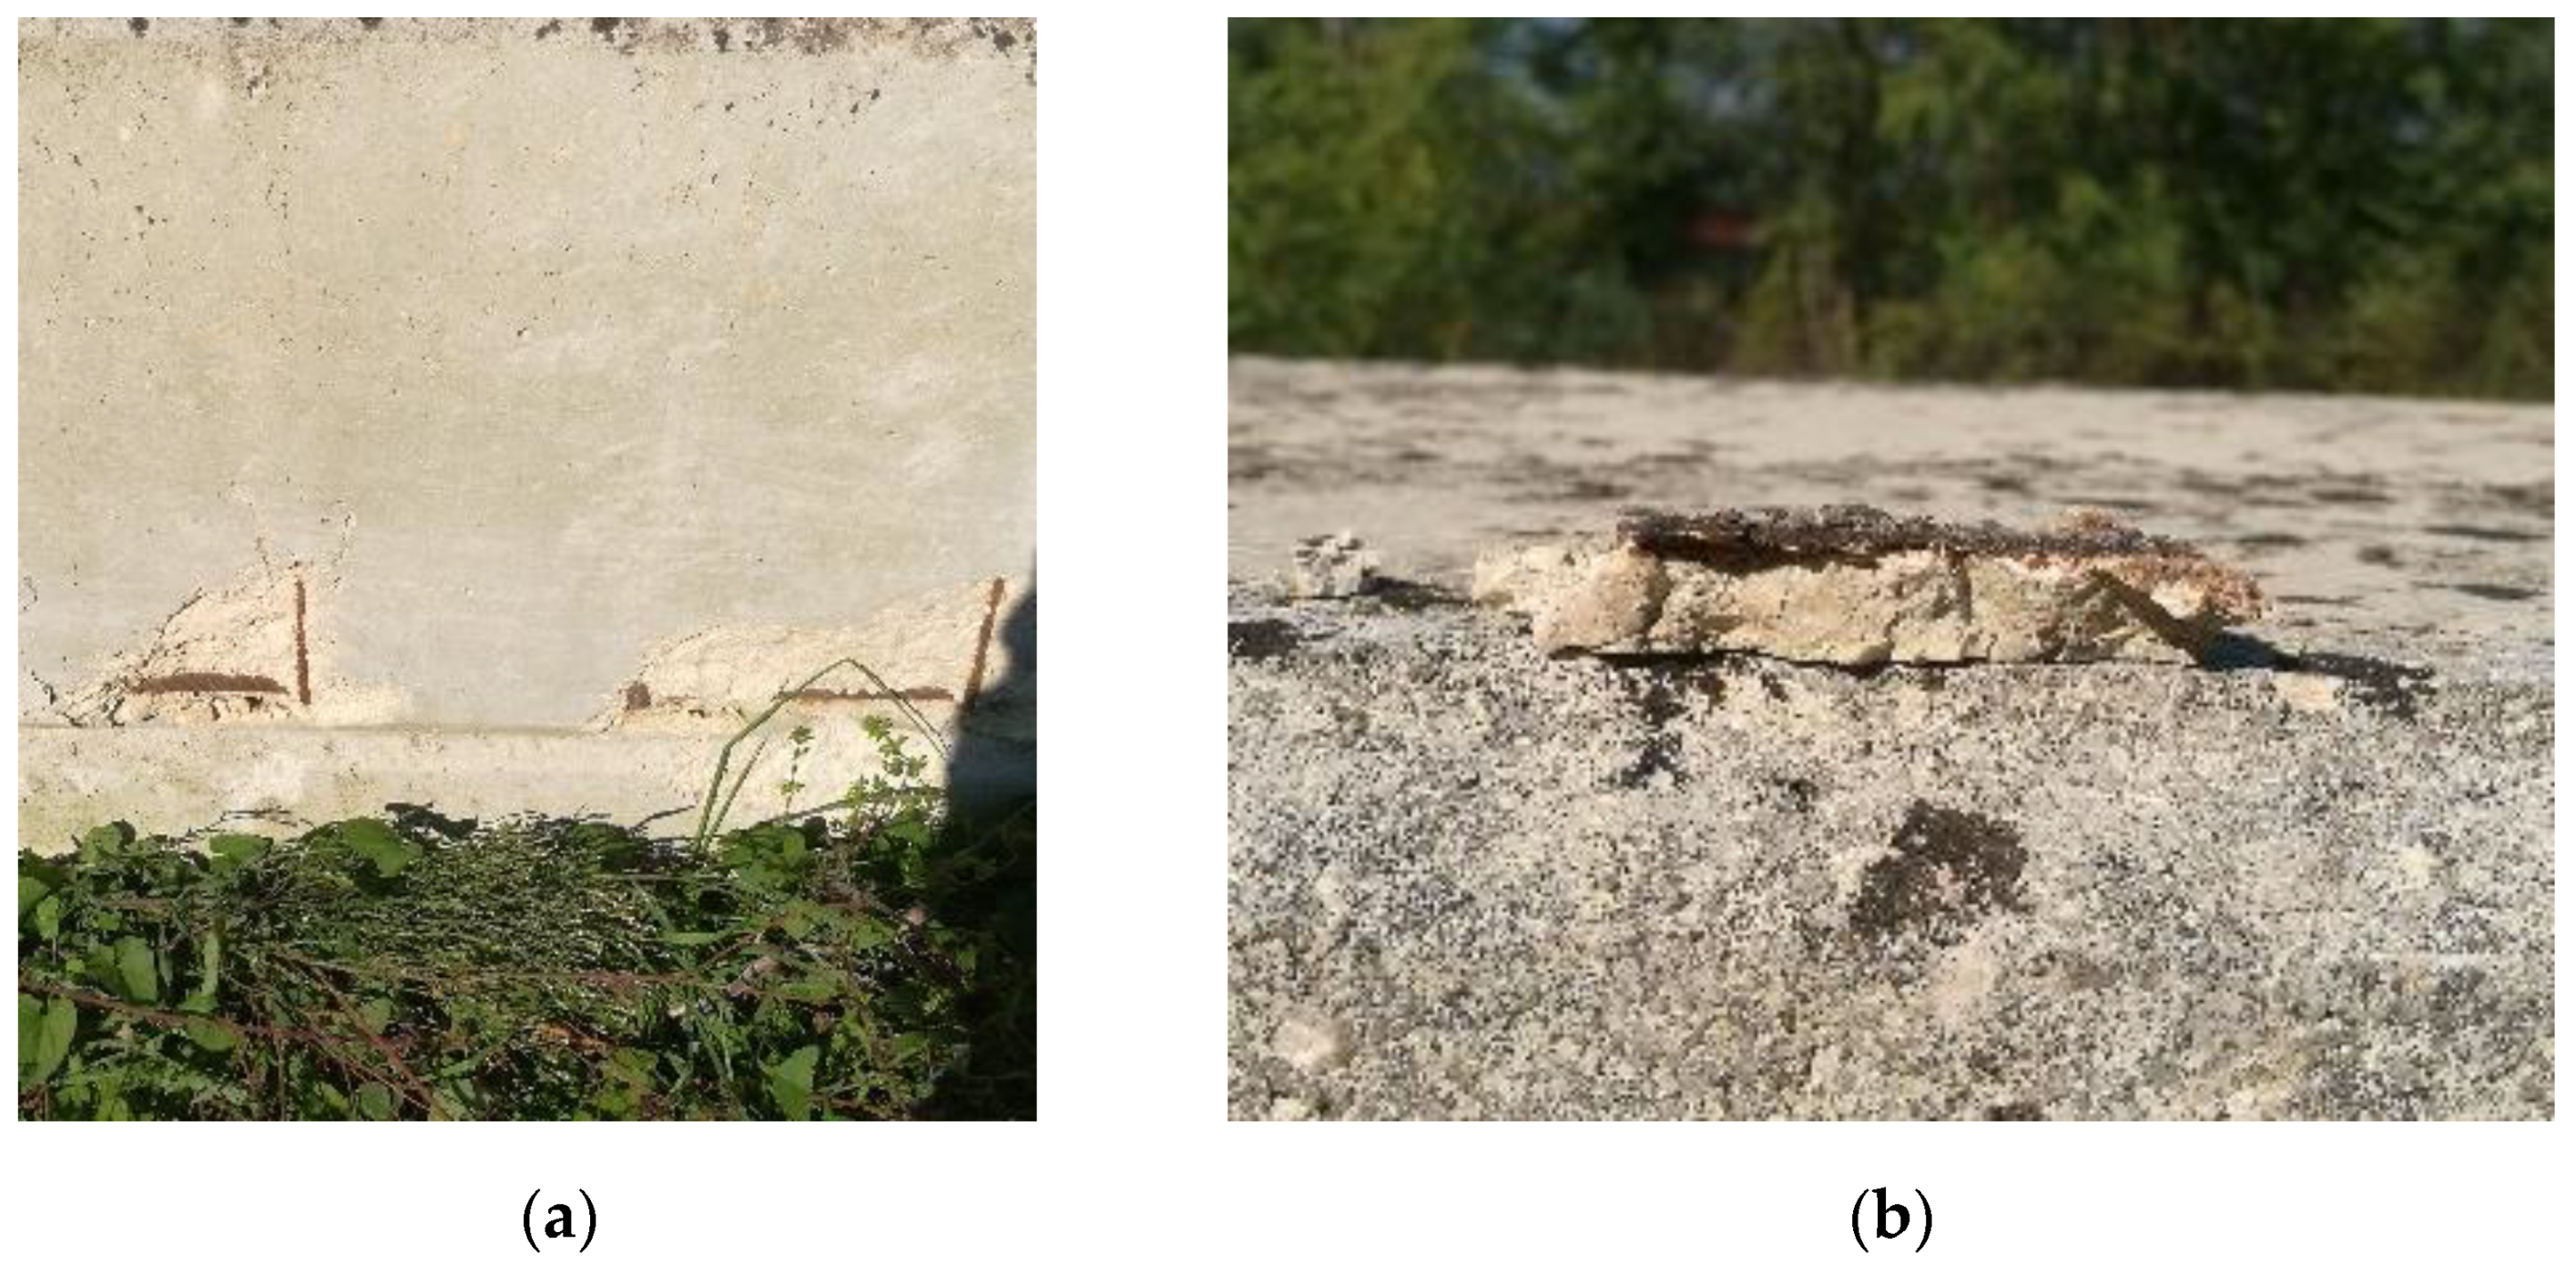
A close visual inspection of the structural elements showed what could be expected for prefabricated structures of twenty years of age. Only the steel surfaces directly exposed to the atmosphere showed generalized superficial corrosion. The same corrosion was detected in limited superficial regions with an insufficient thickness of concrete, or where cracks were present. As reported, a conservative upper bound of the percentage of surface extension of these degraded regions over the total area of the visible exposed surfaces can be reasonably set to 2%, while an upper bound of the thickness of the delaminated cover in these regions (see Figure 4b) can be set to 1.5 cm.
The concrete surfaces of the cores showed a well-sorted grain size distribution and adequate concrete compaction, demonstrating evidence of the good quality of the concrete manufacturing, coherent with the higher quality in prefabricated concretes.
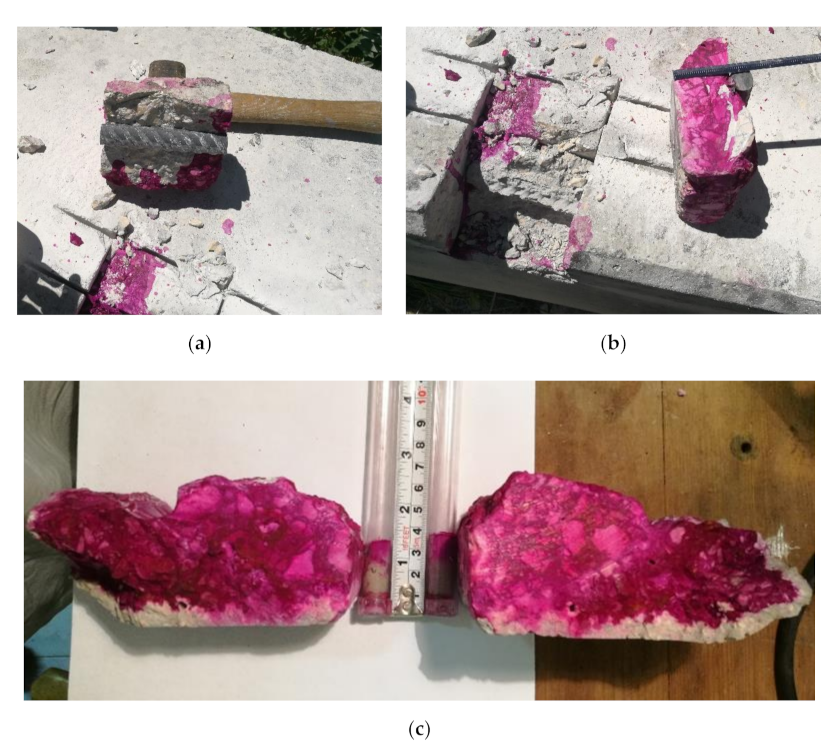
No visually detectable corrosion was found in any of the sampled bar segments.
Altogether, the neutralization assays showed that the pH 9.2 threshold is far below the concrete cover thickness, so that the condition of pH lowering, deemed to be a necessary condition for bar corrosion, is not achieved. Such evidence is coherent with the big picture that came from the direct visual inspection of exposed concrete and bar surfaces.
The high compressive strength of the concrete can be considered indicative of an adequate design of the concrete mix and of the adoption of a sufficiently low water/cement ratio, capable of granting low porosity and, consequently, water tightness. For beam B2, the concrete compressive strengths were 21% lower than the design value that was retrievable from the available technical documentation. Even in this beam of presumably lower concrete quality, however, no evidence of oxidation was found across the sampled steel bars.
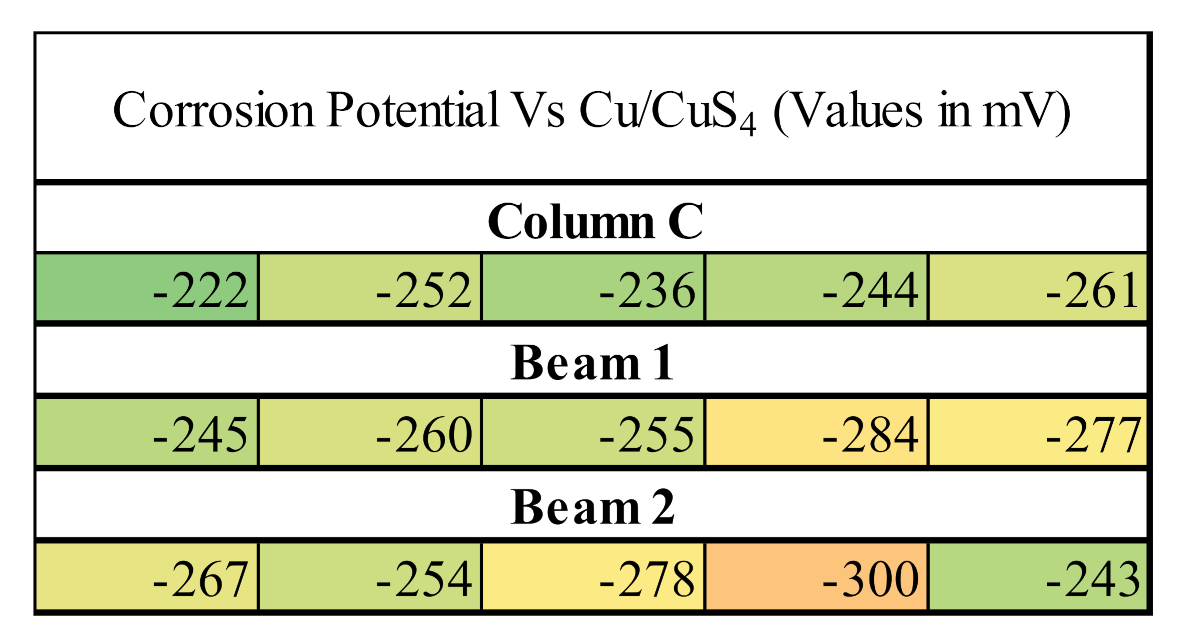
Half-cell measurements led to estimating the absence of interior zones where the corrosion process may be initiated. The measured potentials were affected by variations in the concrete cover thickness. The existence of some arbitrariness was recognized in interpreting these measures.
Neutralization assays of drilling powders have proven to be a much less invasive alternative when compared to neutralization assays performed on sampled cores. The importance of calibrating suitable corrective correlation factors, to avoid the overestimation of neutralization depths, was shown. Such a calibration was made possible by the availability of sampled cores.
Core sampling with a visual inspection of embedded bars can be assumed to be a diriment golden standard for the diagnosis of degradation in concrete and steel reinforcement. None of the non-destructive methods is reliable enough for corrosion estimation.
Altogether, the performed experimental research confirms a considerable amount of pre-1980 knowledge: adequate design and manufacturing of concrete cover and concrete mixture ordinarily lead to concrete infrastructures able to fulfill a design engineering service life conventionally established in 75 years.

Author Contributions

Conceptualization, G.F. (Giuseppe Faella) and G.F. (Giorgio Frunzio); methodology, G.F. (Giuseppe Faella), G.F. (Giorgio Frunzio), A.B., M.G. and R.S.; validation, G.F. (Giuseppe Faella) and G.F. (Giorgio Frunzio); resources, G.F. (Giuseppe Faella), A.B. and R.S.; data curation, A.B., M.G. and R.S.; writing—original draft preparation, R.S. and M.G.; writing—review and editing, G.F. (Giuseppe Faella) and R.S. All authors have read and agreed to the published version of the manuscript.

Funding

This research received no external funding.

Institutional Review Board Statement

Not applicable.

Informed Consent Statement

Not applicable.

Data Availability Statement

All data models, and code generated or used during the study appear in the submitted article.

Acknowledgments

The contribution of the Ministry of Education, University, and Research is gratefully acknowledged. Sviluppo Silicalcite Sas is gratefully acknowledged for making available the precast structural elements. Investigations were performed with equipment kindly provided by Tecnolab S.r.l. Testing support provided by Tecnolab S.r.l. is also gratefully acknowledged. The contribution of Arch. Ersilia Biondi is acknowledged for collection of data from the Civil Defence of Caiazzo.

Conflicts of Interest

The authors declare no conflict of interest.

References

  1. Moore, G.; Klodt, D.T.; Hensen, R.D. Protection of Steel in Prestressed Concrete Bridges; Report 90; National Cooperative Highway Research Program (NCHRP): Washington, DC, USA, 1970. [Google Scholar]
  2. Manning, G. Durability of Prestressed Concrete Highway Structures; Report 140; National Cooperative Highway Research Program (NCHRP): Washington, DC, USA, 1988. [Google Scholar]
  3. Shirole, A.M.; Holt, R.C. Planning for a comprehensive bridge safety assurance program. Transportation Research Record, No. 1290. In Proceedings of the Third Bridge Engineering Conference, Denver, CO, USA, 10–13 March 1991; Volume 1. [Google Scholar]
  4. Lee, G.C.; Mohan, S.B.; Huang, C.; Fard, B.N. A Study of US Bridge Failures (1980–2012). Technical Report MCEER-13-0008. 2013. Available online: https://ubir.buffalo.edu/xmlui/handle/10477/29474 (accessed on 8 November 2021).
  5. Wardhana, K.; Hadipriono, F.C. Analysis of Recent Bridge Failures in the United States. J. Perform. Constr. Facil. 2003, 17, 144–150. [Google Scholar] [CrossRef] [Green Version]
  6. Ravasini, S.; Scalvenzi, M.; Parisi, F.; Belletti, B.; Gasperi, A. Role of structural details in progressive collapse of precast RC structures. In Proceedings of the Italian Concrete Days, Naples, Italy, 14–16 April 2021. [Google Scholar]
  7. Kusenberger, F.N.; Barton, J.R. Detection of Flaws in Reinforcing Steel in Prestressed Concrete Bridge Members; Report No. FHWA/RD-81/087; Southwest Research Institute Division of Instrumentation; Federal Highway Administration: Washington, DC, USA, 1981. [Google Scholar]
  8. American Concrete Institute ACI 562-16. Code Requirements for Assessment, Repair, and Rehabilitation of Existing Concrete Structures and Commentary. 2018. Available online: www.concrete.org (accessed on 8 November 2021).
  9. ASTM C42/C42M-20, Standard Test Method for Obtaining and Testing Drilled Cores and Sawed Beams of Concrete; ASTM International: West Conshohocken, PA, USA, 2020.
  10. ASTM C823/C823M-12(2017), Standard Practice for Examination and Sampling of Hardened Concrete in Constructions; ASTM International: West Conshohocken, PA, USA, 2017.
  11. American Concrete Institute 222.2R-14. Report on Corrosion of Prestressing Steels; ACI Committee: Farmington Hills, MI, USA, 2014; Available online: http://civilwares.free.fr/ACI/MCP04/2222r_01.pdf (accessed on 8 November 2021).
  12. American Concrete Institute ACI 364.1R-07. Guide for Evaluation of Concrete Structures before Rehabilitation; ACI Committee: Farmington Hills, MI, USA, 2007; Available online: http://civilwares.free.fr/ACI/MCP04/3641r_94.pdf (accessed on 8 November 2021).
  13. CEN European Committee for Standardization. Eurocode 8: Design of Structures for Earthquake Resistance—Part 3: Assessment and Retrofitting of Buildings. EN 1998-3; The European Union: Brussels, Belgium, 2005. [Google Scholar]
  14. ANAS—National Autonomous Company of Roads. Valutazione delle Caratteristiche Meccaniche del Calcestruzzo. Quaderni Tecnici per la Salvaguardia delle Strutture, 1. (In Italian). Available online: https://www.stradeanas.it/it/lazienda/attivit%C3%A0/documenti-tecnici (accessed on 8 November 2021).
  15. MIT Ministero delle Infrastrutture e dei Trasporti. Norme Tecniche Italiane per le Costruzioni, (2018). Gazzetta Ufficiale della Repubblica Italiana n. 42 del 20/02/2018. 2018. (In Italian). Available online: https://www.gazzettaufficiale.it/eli/gu/2018/02/20/42/so/8/sg/pdf (accessed on 8 November 2021).
  16. UNI EN 12390-8:2019. Prove sul Calcestruzzo Indurito—Parte 8: Profondità di Penetrazione dell’acqua sotto Pressione. 2019. (In Italian). Available online: http://store.uni.com›catalogo›uni-en-12390-8-2019 (accessed on 8 November 2021).
  17. Servizio Tecnico Centrale del Consiglio Superiore dei Lavori Pubblici della Repubblica Italiana. Linee Guida per la Valutazione delle Caratteristiche del Calcestruzzo in Opera. 2017; (In Italian). Available online: https://trasparenza.mit.gov.it/pagina782_linee-guida-per-la-valutazione.html (accessed on 8 November 2021).
  18. Cowan, H. A history of masonry and concrete domes in building construction. Build. Environ. 1977, 12, 1–24. [Google Scholar] [CrossRef]
  19. Atkinson, A.; Goult, D.J.; Hearne, J.A. An Assessment of the Long-Term Durability of Concrete in Radioactive Waste Repositories. Materials Research Society, Symposium STOCKHOLM—Scientific Basis for Nuclear Waste Management IX, 239, MRS Online Proceedings Library (OPL). 1985, Volume 50, pp. 239–246. Available online: https://www.researchgate.net/publication/231768748 (accessed on 8 November 2021).
  20. Clifton, J.R.; Knab, L.I. Service Life of Concrete. No. NUREG/CR—5466; Prepared for United States Nuclear Regulatory Commission. Div. of Engineering; National Technical Information Service: Springfield, VA, USA, 1989. Available online: https://www.nrc.gov/docs/ML0614/ML061430380.pdf (accessed on 8 November 2021).
  21. Mozer, J.D.; Bianchini, A.C.; Kesler, C.E. Corrosion of Reinfocing Bars in Concrete. J. Am. Concr. Inst. 1965, 62, 909–932. [Google Scholar]
  22. Houston, J.T.; Atimtay, E.; Ferguson, P.M. Corrosion of Reinforcing Steel Embedded in Structural Concrete; Research Report No. 112-1F; Research Project Number 3-5-68-112; Conducted for Texas Highway Department, Center for Highway Research, The University of Texas at Austin: Austin, TX, USA, 1972; Available online: https://www.researchgate.net/publication/271613669_Corrosion_behavior_of_reinforcing_steel_embedded_in_chloride_contaminated_concretes_with_and_without_metakaolin (accessed on 8 November 2021).
  23. Santarella, L. Il Cemento Armato. Volume I. La Tecnica e la Statica. 19a Edizione; Hoepli: Milan, Italy, 1975. [Google Scholar]
  24. Campus, F. Emploi du béton pour les ouvrages à la mer. Commission Belge du Béton Armé. Association Belge pour l’Etude l’Essai et l’Emploi des Materiaux ABEM. Publ. ABEM 1973, 398, 25–37. Available online: https://orbi.uliege.be/bitstream/2268/216030/1/ST_CAMPUS_169.pdf (accessed on 8 November 2021).
  25. Ferraro, E.; Fantilli, A. La Resistenza dei Calcestruzzi Confezionati nella prima metà del ’900 Ingenio-Web. 2020. Available online: https://www.ingenio-web.it/24328-la-resistenza-dei-calcestruzzi-confezionati-nella-prima-meta-del-900 (accessed on 8 November 2021).
  26. Rostam, S.; Bakker, R.F.M.; Beeby, A.W.; Hartl, G.; Van Neuwenburg, D.; Schiessl, P.; Sentler, L.; van Vugt, A.P.; CEB. Durable Concrete Structures. Bulletin d’information 183. Comité Européen du Béton. 1992. Available online: https://books.google.it/books?id=jB_wNOHAIR4C&printsec=frontcover#v=onepage&q&f=false (accessed on 8 November 2021).
  27. Beeby, A.W.; Hartl, G.; van Nieuwenburg, D.; Schiessl, P.; van Vugt, A.P.; CEB. Durability of Concrete Structures. CEB, Paris, State of the art Report, Bulletin Information 148. Comité Européen du Béton. 1982. Available online: https://books.google.it/books?id=qJOgDwAAQBAJ&pg=PP2#v=onepage&q&f=false (accessed on 8 November 2021).
  28. Tuutti, K. Corrosion of Steel in Concrete. Ph.D. Thesis, KTH Royal Institute of Technology, Stockholm, Sweden, 1982. [Google Scholar]
  29. Basile, A.; Frunzio, G.; Mattiello, G. Diagnosis of the critical state of concrete. In Proceedings of the XIII International Forum Le vie dei Mercanti-Heritage and Technology-Mind Knowledge Experience, Capri, Napoli, Italy, 11–13 June 2015; Scuola Pitagora Editore: Napoli, Italy, 2015; pp. 1783–1791. [Google Scholar]
  30. Biondi, E.; Frunzio, G. Analysis of Degradations for the Conservation of Reinforced Concrete; World Heritage and Legacy, Atti XVII Forum Gangemi Editore: Roma, Italy, 2019; pp. 943–952. [Google Scholar]
  31. Biondi, E.; Frunzio, G. Degradation of Concrete Resistance: Analysis of a Homogeneous Area. The City of Caserta. Lect. Notes Civ. Eng. 2021, 110, 31–48. [Google Scholar] [CrossRef]
  32. Bossio, A.; Lignola, G.P.; Prota, A. An overview of assessment and retrofit of corroded reinforced concrete structures. Procedia Struct. Integr. 2018, 11, 394–401. [Google Scholar] [CrossRef]
  33. Bossio, A.; Imperatore, S.; Kioumarsi, M. Ultimate Flexural Capacity of Reinforced Concrete Elements Damaged by Corrosion. Buildings 2019, 9, 160. [Google Scholar] [CrossRef] [Green Version]
  34. Imperatore, S.; Rinaldi, Z.; Spagnuolo, S. Experimental investigations on the effects of the steel rebar corrosion at structural level. Struct. Concr. 2019, 20, 2230–2241. [Google Scholar] [CrossRef]
  35. Tang, S.; Yao, Y.; Andrade, C.; Li, Z. Recent durability studies on concrete structure. Cem. Concr. Res. 2015, 78, 143–154. [Google Scholar] [CrossRef]
  36. Kioumarsi, M.; Benenato, A.; Ferracuti, B.; Imperatore, S. Residual Flexural Capacity of Corroded Prestressed Reinforced Concrete Beams. Metals 2021, 11, 442. [Google Scholar] [CrossRef]
  37. Collepardi, M.; Fratesi, R.; Moriconi, G.; Branca, C.; Simoncini, S. The Influence of Carbonation on the Steel Corrosion in Reinforced Concrete. Atti del Convegno AICAP’89, Napoli 4–6 Maggio 1989. Available online: https://www.encosrl.it/OLDSITE/pubblicazioni-scientifiche/armature.html (accessed on 8 November 2021).
  38. Elsener, B.; Andrade, C.; Gulikers, J.; Polder, R.; Raupach, M. RILEM TC 154 EMC: Electrochemical Techniques for Measuring Metallic Corrosion Half Cell Potential Measurements—Potential Mapping on Reinforced Concrete Structures. Mater. Struct. 2003, 36, 461–471. [Google Scholar] [CrossRef]
  39. Ebell, G.; Burkert, A.; Mietz, J. Detection of Reinforcement Corrosion in Reinforced Concrete Structures by Potential Mapping: Theory and Practice. Int. J. Corros. 2018, 2018, 1–6. [Google Scholar] [CrossRef]
  40. Andrade, C. Electrochemical methods for on-site corrosion detection. Struct. Concr. 2020, 21, 1385–1395. [Google Scholar] [CrossRef]
  41. Indig, M.E.; Groot, C. Some Limitations of the Linear Polarization Techniques in Evaluating Corrosion Behavior. Corrosion 1969, 25, 455–461. [Google Scholar] [CrossRef]
  42. CEN European Committee for Standardization. Eurocode 2: Design of Concrete Structures—Part 1-1: General Rules and Rules for Buildings; EN 1992-1-1; The European Union: Brussels, Belgium, 2004. [Google Scholar]
  43. UNI EN 12504-1/2002 Prove sul Calcestruzzo Nelle Strutture-Carote-Prelievo, Esame e Prova di Compressione. 2002. (In Italian). Available online: http://store.uni.com/catalogo/uni-en-12504-1-2002 (accessed on 8 November 2021).
  44. UNI 9944/1992 Corrosione e Protezione dell’armatura del Calcestruzzo. Determinazione della Profondità di Carbonatazione e del profilo di Penetrazione degli ioni Cloruro nel Calcestruzzo. 1992. (In Italian). Available online: http://store.uni.com/catalogo/uni-9944-1992 (accessed on 8 November 2021).
  45. UNI EN 14630:2007. Products and Systems for the Protection and Repair of Concrete Structures-Test Methods—Determination of Carbonation Depth in Hardened Concrete by the Phenolphthalein Method; BSI: London, UK, 2007. [Google Scholar]
  46. Felicetti, R. Strumenti inediti per l’analisi del degrado nelle strutture in calcestruzzo armato. In Proceedings of the 17th Italian Congress CTE (Collegio dei Tecnici della Industrializzazione Edilizia), Roma, Italy, 5–8 November 2008; Volume 1, p. 675. [Google Scholar]
  47. Felicetti, R. Analysis of sorted powder samples for the assessment of deteriorated concrete. In Proceedings of the 6th International Conference on Concrete under Severe Conditions: Environment and Loading (CONSEC’10), Merida, Yucatan, Mexico, 7–9 June 2010; Pedro Castro-Borges; Taylor & Francis: London, UK, 2010; pp. 1123–1129. [Google Scholar]
  48. Felicetti, R. Assessment of Deteriorated Concrete Cover by Combined While-Drilling Techniques. ASCE J. Infrastruct. Syst. 2012, 18, 25–33. [Google Scholar] [CrossRef]
  49. UNI EN 12390-1/2012 Testing Hardened Concrete—Part 1: Shape, Dimensions and Other Requirements for Specimens and Moulds. 2012. Available online: http://store.uni.com/catalogo/uni-en-12390-1-2012 (accessed on 8 November 2021).
  50. UNI EN 12390-3/2019 Testing Hardened Concrete—Part 3: Compressive Strength of Test Specimens. 2019. Available online: http://store.uni.com/catalogo/uni-en-12390-3-2019 (accessed on 8 November 2021).
  51. ASTM, C 876-15. Standard Test Method for Corrosion Potentials of Uncoated Reinforcing Steel in Concrete. 2015. Available online: https://www.astm.org/Standards/C876.htm (accessed on 8 November 2021).
  52. UNI 10174:2020 Istruzioni per l’ispezione Delle Strutture di Calcestruzzo Armato Esposte ad Ambienti Aggressivi Mediante Mappatura di Potenziale. 2020. (In Italian). Available online: http://store.uni.com/catalogo/uni-10174-2020 (accessed on 8 November 2021).
  53. British Standard EN 12504-1:2009. Testing Concrete in Structures. Cored Specimens. Taking, Examining, and Testing in Compression; BSI: London, UK, 2009. [Google Scholar]
  54. American Concrete Institute ACI 214. Obtaining Cores and Interpreting Compressive Strength Results; American Concrete Institute: Farmington Hills, MI, USA, 2010; Available online: https://www.concrete.org/portals/0/files/pdf/previews/214.4r-10web.pdf (accessed on 8 November 2021).
  55. UNI EN 13791:2007. Assessment of In-Situ Compressive Strength in Structures and Precast Concrete Components. 2007. Available online: http://store.uni.com/catalogo/en-13791-2007 (accessed on 8 November 2021).
  56. Concrete Society. Concrete Core Testing for Strength; Technical Report No. 11; The Concrete Society: London, UK, 1987; pp. 1–44. [Google Scholar]
  57. Soroka, I. On compressive strength variation in concrete. Mater. Struct. 1971, 4, 155–161. [Google Scholar] [CrossRef]
  58. Arioz, O.; Ramyar, K.; Tuncan, M.; Tuncan, A. Effect of Length-to-Diameter Ratio of Core Sample on Concrete Core Strength—Another Look. J. Test. Eval. 2008, 36, 1–4. [Google Scholar] [CrossRef]
  59. Khoury, S.; Aliabdo, A.A.-H.; Ghazy, A. Reliability of core test—Critical assessment and proposed new approach. Alex. Eng. J. 2014, 53, 169–184. [Google Scholar] [CrossRef] [Green Version]
  60. Bartlett, F.M.; MacGregor, J.G. Effect of Core Diameter on Concrete Core Strengths. ACI Mater. J. 1994, 91, 460–469. [Google Scholar]
  61. Bažant, Z.P.; Planas, J. Fracture and Size Effect in Concrete and Other Quasibrittle Materials; CRC Press: Boca Raton, FL, USA, 1997; Volume 16. [Google Scholar]
  62. Meininger, R.C. Effect of Core Diameter on Measured Concrete Strength. J. Mater. 1968, 3, 320–336. [Google Scholar]
  63. Lewis, R.K. Effect of Core Diameter on the Observed Strength of Concrete Cores; Commonwealth Scientific and Industrial Research Organization; Division of Building Research: Melbourne, Australia, 1976; No. 50, 13. [Google Scholar]
  64. Talukdar, S.; Banthia, N.; Grace, J. Carbonation in concrete infrastructure in the context of global climate change—Part 1: Experimental results and model development. Cem. Concr. Compos. 2012, 34, 924–930. [Google Scholar] [CrossRef]
  65. Coppola, L. Concretum; McGraw Hill: Milano, Italy, 2007; ISBN 978-88-386-6465-6. [Google Scholar]
  66. Tremper, B.; Benton, J.L.; Stratfull, R.F. Corrosion of reinforcing steel and repair of concrete in a marine environment, Part II: Fundamental factors causing corrosion. Highw. Res. Board Bull. 1958, 182, 18–41. [Google Scholar]
  67. NCHRP 101: Callahan, J.P.; Siess, C.P.; Kesler, C.E. Effect of Stress on Freeze-Thaw Durability of Concrete Bridge Decks, National Cooperative Highway Research Program Report 101; HBR Press: Washington, DC, USA, 1970. [Google Scholar]
  68. Beaton, J.L.; Stratfull, R.F. Environmental influence on corrosion of reinforcing in concrete bridge substructures. Highw. Res. Rec. 1963, 14, 60–78. [Google Scholar]
Figure 1. Precast RC squared column “C”; red circles show the location of coring sites; the red square shows the location of the extraction site of the parallelepiped-shaped diamond-cut sample.
Infrastructures 06 00164 g001
Figure 2. Prestressed RC omega-beam “B1”; red circles show the location of coring sites.
Infrastructures 06 00164 g002
Figure 3. Prestressed RC-T-beam “B2”; red circles show the location of coring sites.
Infrastructures 06 00164 g003
Figure 4. Spalling in column C after struck by hammer (a), detached cover due to hammer strike (b).
Infrastructures 06 00164 g004
Figure 5. Core drilling C1 (a); sample C2 (b); visual inspection of cores (c).
Infrastructures 06 00164 g005
Figure 6. Samples C1 (a) and C2 (b) after phenolphthalein spraying.
Infrastructures 06 00164 g006
Figure 7. Samples B1_1 (a) and B1_2 (b) after phenolphthalein spraying.
Infrastructures 06 00164 g007
Figure 8. Samples B2_1 after phenolphthalein spraying (a) and sample B2_2 before spraying (b).
Infrastructures 06 00164 g008
Figure 9. Additional neutralization assays in column C. (a) bottom view of specimen C3; (b) lateral view and extraction site; (c) neutralization fronts after phenolphthalein addition over the two split fragments of specimen C3 and across the drilling powder in test tubes.
Infrastructures 06 00164 g009
Figure 10. Potential values measured over the structural elements (meaning of background colors is described in the main text).
Infrastructures 06 00164 g010
Table 1. Year of casting and design concrete strength of the studied elements.
Element CodeElement DescriptionYear of CastingDesign Rc (MPa)
CPrecast RC Column200045
B1Prestressed RC Omega beam200645
B2Prestressed RC T-beam200445
Table 2. Data related to compressive strength measurements.
Specimenϕ
mm
H
mm
ρ
kg/m3
Breaking Load
kN
C11041042275326.49
C21041042259386.50
B1_170702487150.87
B1_270702613179.01
B2_11041042279302.10
B2_21041042257253.75
Table 3. Concrete strength according to international standard codes (MPa).
SpecimenfcoreBS [53]NTC [15]ACI [54]UNI EN [55]CS [56]
C138.4342.6040.7443.3845.2237.05
C245.5050.4348.2351.5353.5343.85
B1_139.2043.4541.5645.7946.1237.79
B1_246.5251.5649.3154.5254.7244.83
B2_135.5639.4237.7040.0841.8434.28
B2_229.8733.1131.6633.5835.1428.79
Table 4. Mean strength from core sampling vs. design strength.
Structural ElementMean Cubic Strength from Cores
MPa
Design Cubic Strength
MPa
δ
%
C45.6545+1.44
B146.9645+4.36
B235.5645−20.98
Table 5. Depth measures related to neutralization assays of drilling powder.
Test Tube p p o w d h p o w d d k   p o w d d k   p o w d d k d k   p o w d h p o w d × p p o w d d k
m m m m m m % %
1403017283%378%
2352515250%350%
Publisher’s Note: MDPI stays neutral with regard to jurisdictional claims in published maps and institutional affiliations.

