
Durability of Gerber Saddles in RC Bridges: Analyses and Applications (Musmeci Bridge, Italy)


School of Engineering, University of Basilicata, 85100 Potenza, Italy
*
Author to whom correspondence should be addressed.
Infrastructures 2021, 6(2), 25; https://0-doi-org.brum.beds.ac.uk/10.3390/infrastructures6020025
Submission received: 13 January 2021
/
Revised: 30 January 2021
/
Accepted: 1 February 2021
/
Published: 5 February 2021
(This article belongs to the Special Issue Structural Performances of Bridges)
Abstract
:Guaranteeing adequate safety levels in critical infrastructures such as bridges is essential to modern societies and their vital services. Bridges with reinforced concrete structures are subject to deterioration, especially due to corrosion effects. Gerber saddles are among the key components of bridges which are especially exposed to environmental actions due to their position and reduced possibility of inspection. In this paper, a framework for the durability analysis of these components is proposed, considering the simultaneous presence of permanent loads and environmental actions under the form of chloride ions. Nonlinear numerical simulations adopting the finite element code ATENA are performed, accounting for chloride ingress analyses. The presence of cracks (due to applied loads and/or design/construction defects) which may speed-up corrosion propagation, steel reinforcement loss, cracking and spalling, and their effects on the load-bearing capacity is considered. This framework has been applied to the Gerber saddles of a prominent reinforced concrete (RC) bridge, namely the Musmeci bridge in Potenza, Italy. Durability analyses made it possible to evaluate the saddles’ strength capacity (i) at the time of construction, (ii) after forty-five years since the construction, and (iii) at an extended time of fifty years. The results show that corrosion can influence both the ultimate load capacity and the collapse mechanism.
1. Introduction
The preservation of critical infrastructures such as hospitals, energy facilities and information and transportation infrastructures [1,2,3] is of paramount importance for the daily life, safety and security of modern communities. It is even more important when they work as part of a network where the loss of a single branch can lead to whole system failure. Regarding transportation infrastructures, the Morandi bridge collapse [4], with its 43 fatalities, brought a renewed awareness about the ageing and degradation of bridges to the Italian public opinion, politics and engineering community. Unfortunately, once again, such awareness sprang up only after a dramatic event. In some ways, the Morandi bridge collapse had a similar effect to the collapse of F. Jovine primary school at San Giuliano di Puglia, Italy, in the 2002 Molise earthquake [5], causing the death of 27 children and a teacher. Then, the tragedy highlighted the large seismic protection deficit of public buildings such as schools [6], as well as how the obsolete seismic rules in force should be upgraded to keep pace with increased knowledge in the field. Consequently, a new seismic code [7] was introduced and recently further updated [8]. Specifically, the provisions regarding existing structures in the current Italian technical code are mainly focused on buildings, while the commentary [9] provides some rules for the safety assessment of existing bridges under seismic actions but without indications on the assessment under service loads. In addition, current Eurocodes provide specific rules for newly designed bridges [10], while EC8-3 [11], specifically devoted to the assessment and retrofitting of existing structures, deals only with buildings, although the ongoing revision also includes bridge structures.
Given this general framework, in order to provide a minimum standardization of evaluation protocols related to existing bridges, the Superior Council of Public Works (as part of the Ministry of Infrastructure and Transportation) issued the Guidelines on risk classification and management, safety assessment and monitoring of existing bridges [12].
It is a robust guidance to road management bodies and engineers on how to manage the stock of more than 60,000 bridges all over the country, going from a territorial approach (classification and management) to the safety assessment and monitoring of individual bridge structures. The document provides a multilevel approach with general rules and criteria applicable to both road and railway bridges, although dealing particularly with the former.
Procedures for classification, management, and safety assessment are organized through five levels (going from 0 to 4), as follows:
- Classification and management (levels 0 to 2): levels 0 and 1 of analysis are devoted to collecting available information on each single bridge through design documents, results of periodic inspections (level 0) and specific site inspections to verify the current state of degradation and the presence of structural and non-structural components affected by significant defects (level 1). At level 2, using the information collected at levels 0 and 1, each road bridge is subjected to a procedure for the evaluation of the “class of attention” related to four different risk types: (i) structure and foundations, (ii) seismic, (iii) flooding and (iv) landslides. The logical combination of these four results in terms of class of attention leads to the whole class of attention of the bridge, which can have five levels of increasing risk: low, medium-low, medium, medium-high, high. Based on this result, the bridge owner must adopt the needed measures. In the case of an up to medium-low class of attention, the bridge can hold its serviceability undergoing the usual periodic inspections. If the class of attention is medium or medium-high, a preliminary safety evaluation whose result can call for a thorough evaluation (with detailed information about material, geometry, details, restraints and loads) must be carried out. In case of a high class of attention, a thorough evaluation is mandatory. Therefore, levels of analysis 0, 1 and 2 are devoted to prioritizing more thorough evaluations and/or interventions on bridges at territorial scale or for the bridge stock under the responsibility of a certain road management body.
- Preliminary and accurate assessment (levels 3 and 4): level 3 of the procedure consists of a preliminary assessment necessary when the class of attention result is medium or medium-high. This level of assessment foresees a more thorough assessment of defects and problems found at level 1 (inspections) and a simplified assessment based on technical standards used at the time of design. After verifying the absence of significant design mistakes, the strength resources of the bridge at hand can be assessed. The latter can be made through the comparison of stress levels on the main structural components caused by the design code loads (assumed at the time of construction) and those caused by the current code loads, which are generally larger. Based on this comparison and the in-depth evaluation of defects, the management body must decide the need for an accurate evaluation. Level 4 consists of the safety evaluation of bridges according to the current Italian technical standard [8]. This level of the procedure, described in chapter 6 of the Guidelines, is devoted to providing information on setting conceptual and operational methods of verification, starting from the phase aimed at the knowledge of the bridge (including in situ destructive and non-destructive tests), up to the final indications describing the necessary measures or interventions. In fact, based on the evaluation result, a bridge can be: (i) conforming, when the bridge satisfies safety verifications under the current design loads; (ii) operational, when the bridge satisfies safety verifications under the current design loads using reduced partial factors for loads and materials; (iii) passable, when the bridge is not conforming nor operational and needs a carriageway restriction or vehicle weight control in order to limit the traffic loads.
The last part of the Guidelines is related to monitoring. Specifically, it includes indications, criteria and minimum requirements of the procedures to be adopted by public and private transport management bodies on the Italian national territory to plan and carry out structural safety management activities (such as surveillance, control, inspection and monitoring) of existing bridges in a uniform manner.
Regarding level 1 of the Guidelines’ assessment procedure, local defects must be thoroughly evaluated and noted through defect forms devoted to specific bridge materials (steel, reinforced concrete, masonry, etc.) and components (pier, girder, deck, Gerber saddle, etc.). Some of these components, such as, for example, Gerber saddles, are identified as “critical” elements. Therefore, detecting any defect on a critical element of the bridge at hand leads to a high class of attention, with the consequent need for a detailed safety evaluation (level 4).
Accounting for the role of degradation effects due to steel corrosion in RC structures has a crucial importance. Therefore, setting up an approach to durability analysis of these elements, as well as of other bridge components, would be very helpful in road infrastructure management. Reinforcement corrosion in RC bridges can be mainly triggered by both carbonation and chloride ingress [13,14], even though it is recognized that carbonation can be important only in the case of high concentrations of CO2 corresponding to urban environments with high pollution levels. In all other situations, chloride ingress remains the principal cause of corrosion. This may occur on concrete structures reached by sea waves or spray (splash zone), or on structures where the wind brings salt aerosols [14]. Additionally, bridge decks exposed to de-icing salts can be subjected to chloride ingress. Another cause of chloride-induced corrosion may be the presence of ions in raw materials used to produce the concrete. For this reason, European standard EN 206 [15] prescribes limiting the amount of chloride content in the concrete mix in order to avoid self-induced chloride-corrosion. These limit values are expressed as the percentage of binder mass and are set equal to 0.2–0.4% for reinforced concrete and to 0.1–0.2% for prestressed concrete.
When the total chloride content at the steel surface exceeds a certain threshold, which depends on several parameters (e.g., surface chloride content), corrosion starts. Relatively low levels of chloride content are enough to induct corrosion when oxygen is available. Therefore, concrete structures in the atmosphere with alternate wet and dry conditions are in the “ideal conditions” for chloride ingress (wet conditions) and oxygen ingress (dry conditions). On the contrary, submerged structures, even in seawater, need much more chloride content to initiate corrosion [16]. Hence, road bridges in harsh climates (needing de-icing salts in wintertime) represent an example of structures prone to chloride-induced corrosion [17].
This paper first discusses corrosion problems related to Gerber saddles in concrete road bridges, then illustrates a methodology to model the interdependency of the nonlinear static response under service loads and corrosion induction and propagation due to chloride ingress. The adopted methodology [18,19] may be based on corrosion parameters collected through in-situ and/or laboratory tests (destructive and/or non-destructive) or derived from the literature. The procedure is applied to the Gerber saddles of the iconic Musmeci bridge located in Potenza, Italy, performing mechano-chemical analyses to predict corrosion progress and evaluate the saddles’ efficiency after certain periods.
2. Degradation of Gerber Saddles in Road Bridges
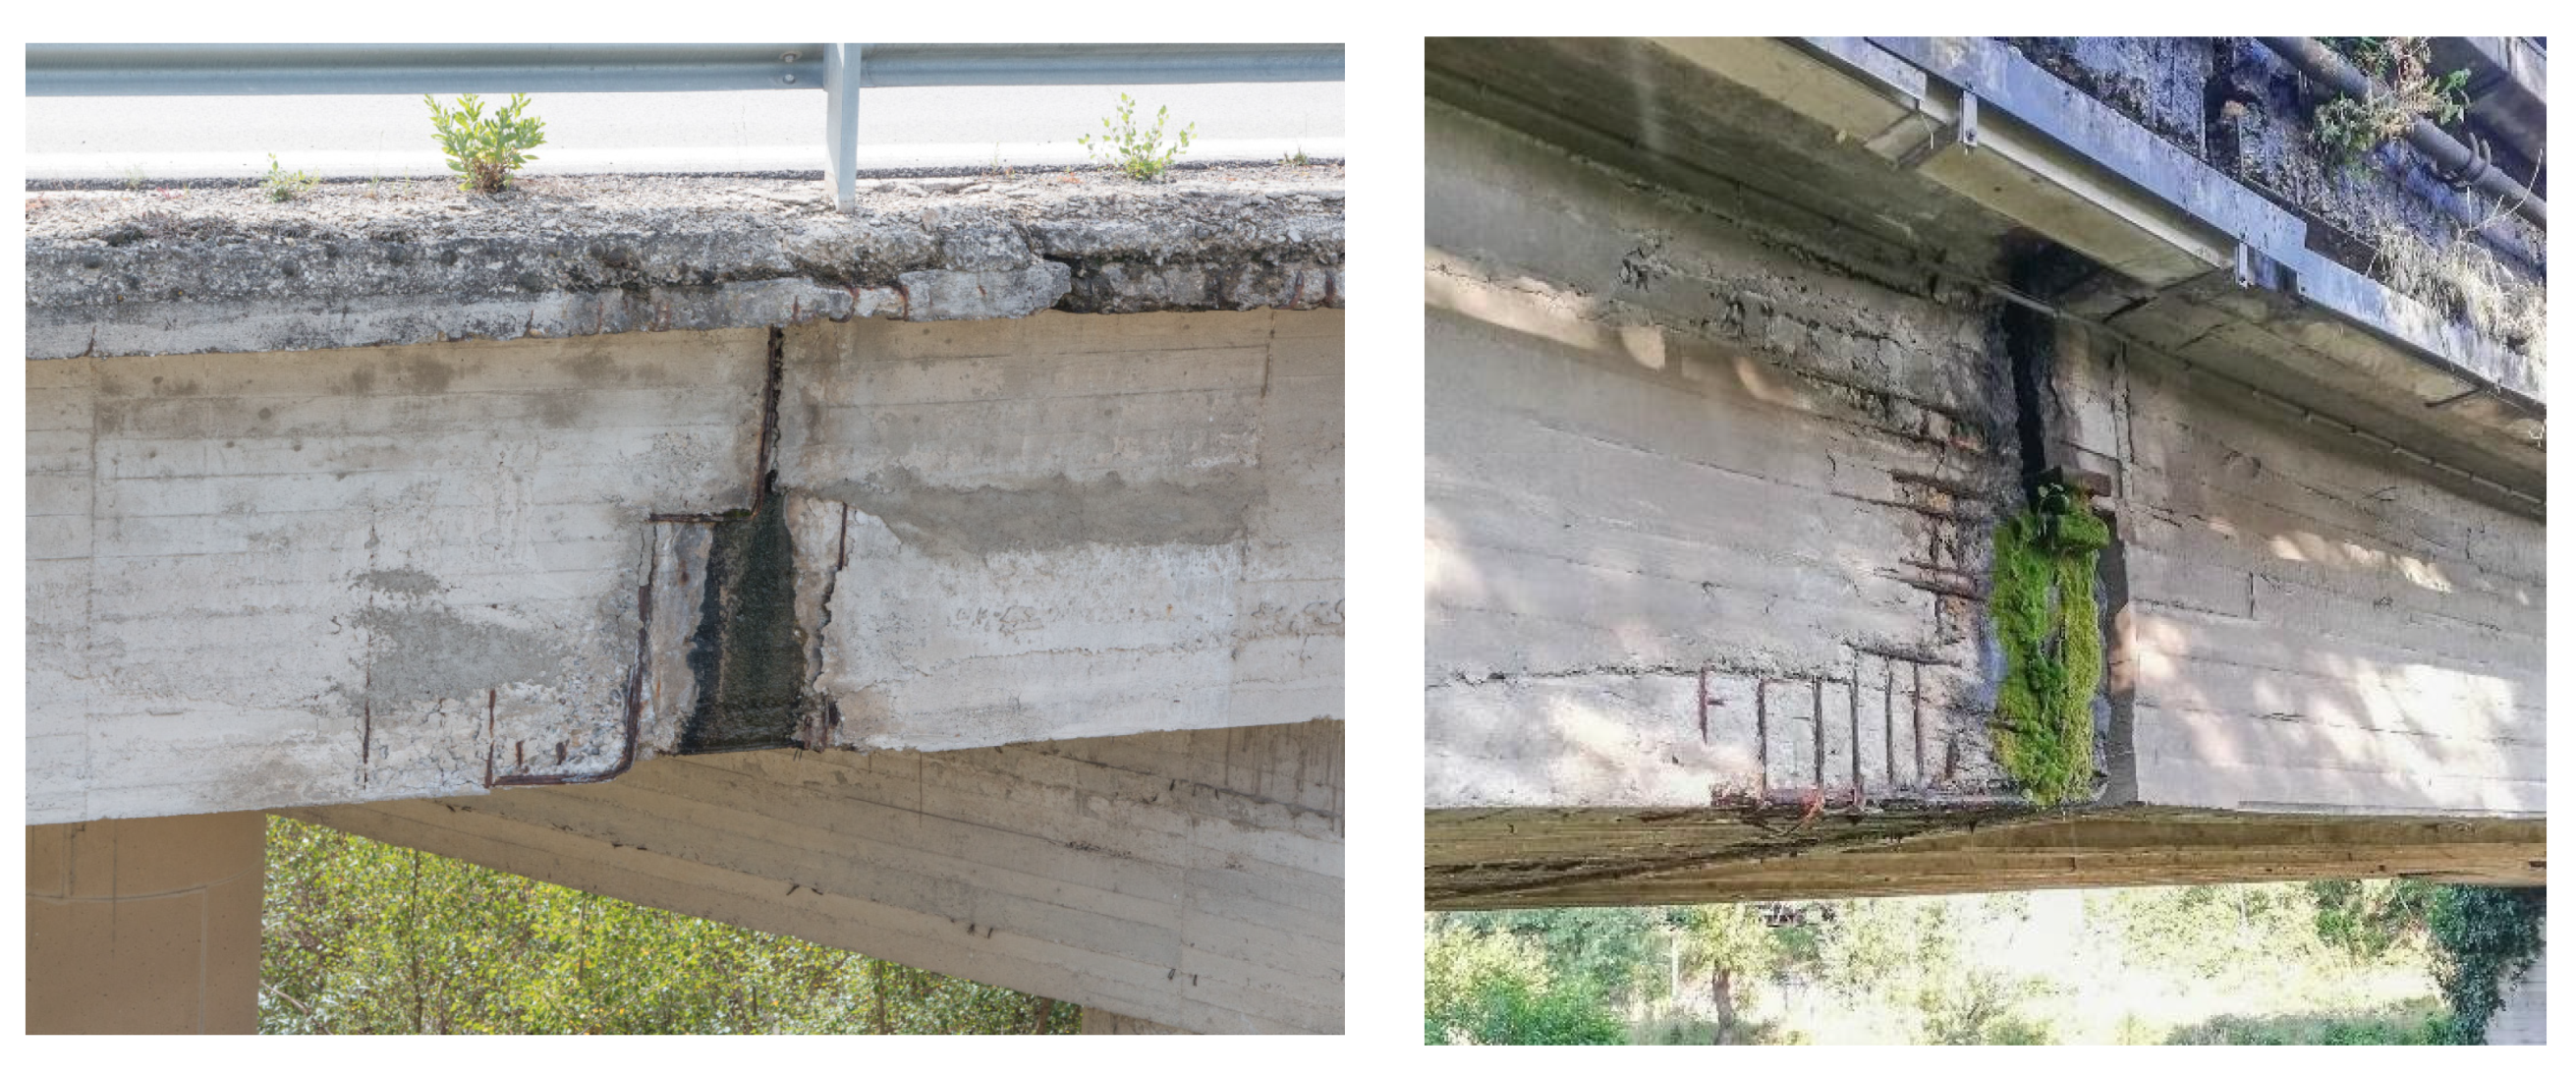
Traffic loads foreseen by codes of practice for the design of road bridges in Italy have been modified many times since the first rules were issued in 1933 [20]. Except for the current code (NTC2018 [8]), all bridge load regulations considered the possibility to design and build bridges of two (and sometimes three) categories depending on load values. Usually, the first category considered the higher load values while others prescribed lower values, being related to bridges on lower importance roads. Material degradation of bridges, due to insufficient maintenance and increasing traffic loads over time, caused many bridges to have reduced structural efficiency and safety compared to the current technical standard. This applies especially for older 2nd and 3rd category bridges, even more if they are placed in industrial areas subjected to expansion and development after the construction of bridges. These bridges were sometimes conceived according to a cantilever scheme needing the presence of Gerber saddles, which were originally thought for railway bridges, where there is no water accumulation on the deck. Road bridges should expel the deck water through side drains, while expansion joints across the Gerber saddles should be waterproof to avoid water seepage. Actually, lack of maintenance to drains and joint degradation systematically allow water seepage through them, inducing deterioration of the underlying structural elements, which is even heavier when the water contains de-icing salts (Figure 1).
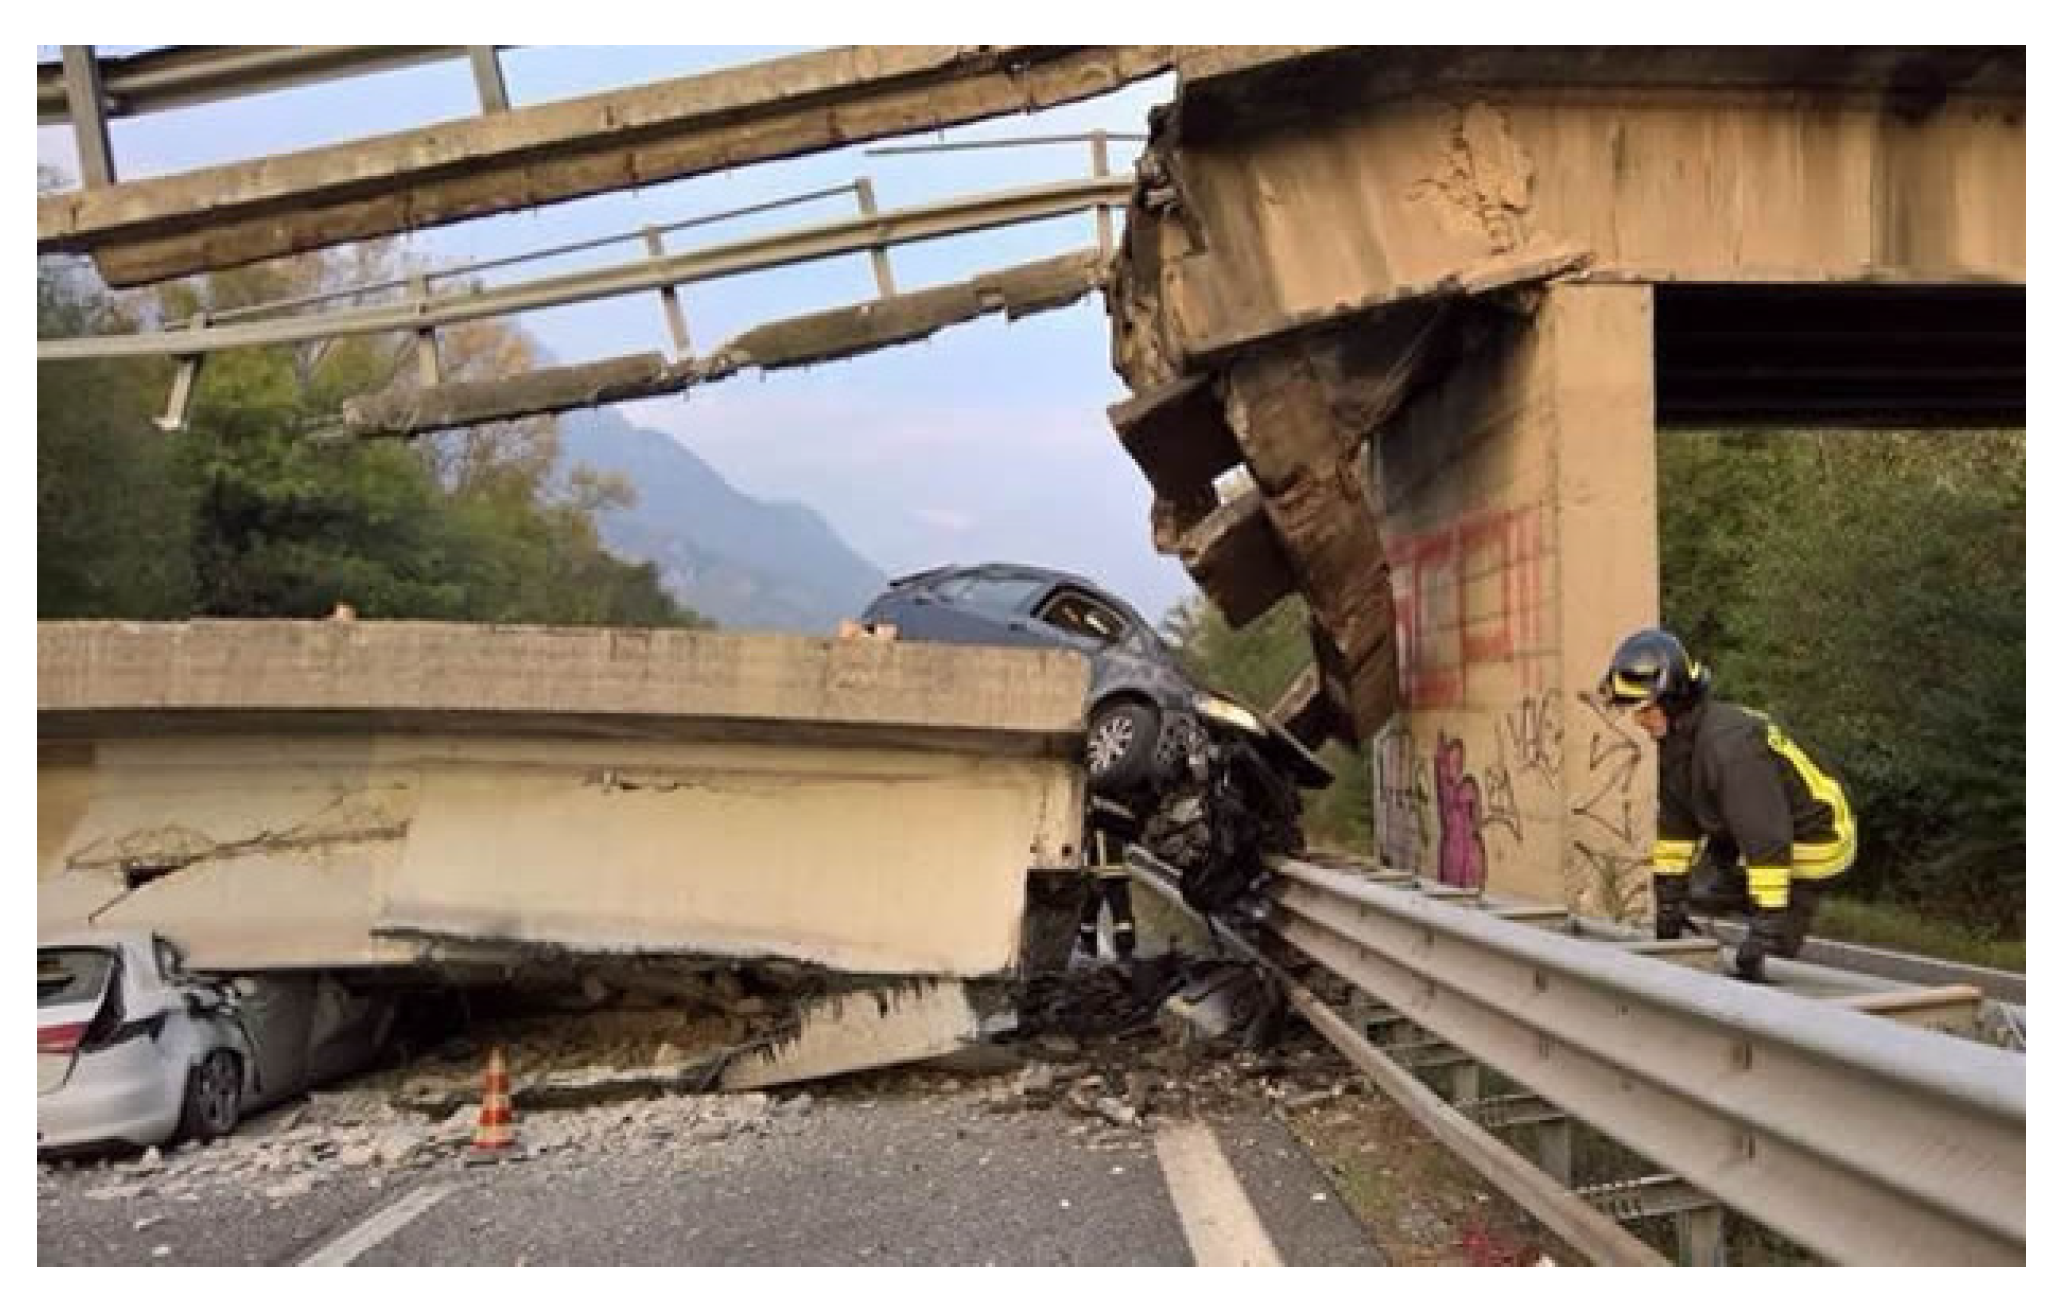
Exemplary of the joint effect of increased loads (with respect to design ones) and material degradation is the collapse of the Annone Brianza (Lecco, Italy) overpass in October 2016, which caused one fatality and three injuries [21]. The structure was designed as a 2nd category bridge according to the code Circolare 14 Febbraio 1962 n. 384 [22]. The collapse started in one of the Gerber saddles due to passage of an exceptional 1080 kN heavy convoy [21]. The external saddle’s collapse transferred the load to the others, which progressively collapsed too (Figure 2). Therefore, even local damage to a single Gerber saddle can cause severe consequences to the whole bridge structure.
It must also be considered that anchorage devices of post-tensioning cables of prestressed concrete suspended (between two consecutive saddles) girders are located close to Gerber saddles, which are mostly difficult to inspect during scheduled surveys due to their geometry. This represents an additional source of uncertainty related to their deterioration state. For these reasons, concerns related to key components such as Gerber saddles lead to the need for a detailed evaluation of the entire bridge according to the current technical standards [8]. If the safety verifications are not satisfied, the bridge must be geometrically restricted, or some transit limitation should be enforced based on vehicle weight [12]. Therefore, the availability of corrosion prediction methods for such structures is of paramount importance to perform an optimal serviceability evaluation, predicting structural performance over time.
3. Methods
The described methodology is devoted to modelling the interaction between effects of service loads (e.g., self-weight, traffic) and those of chloride ingress and consequent corrosion affecting steel reinforcement, causing cracking and spalling. This is made by an advanced software tool (ATENA [23]), which determines the structural response through the Nonlinear Fracture Mechanics (NLFM) able to evaluate carefully the cracking pattern due to applied loads. The same software incorporates a module able to perform diffusion analyses related to chloride ingress, utilizing a 1D transport model based on the second Fick’s law [24].
The structure’s geometry is modelled mainly by hexahedral (brick) linear (8-noded) finite elements. Steel plates used to model loading and constraint regions are modelled with tetrahedral finite elements with elastoplastic behaviour. Reinforcing bars are modelled by truss elements embedded in concrete capable of absorbing only axial loads and provided with the reinforcing steel constitutive law. The formulation of constitutive relations for concrete is considered a smeared crack approach in the crack band theory framework by Bazant and Oh [25] used to model the damage. Concrete softening in compression (when the compressive strength fc is reached) is displacement-based. At the local level, compressive displacement (shortening of concrete) is evaluated and compared to the critical compressive displacement wd, which is not dependent on the structure’s size as demonstrated in [25]. The behaviour of concrete in tension is linear until the tensile strength ft is achieved. Afterwards, a fictitious crack model based on a crack-opening law and fracture energy is used for modelling crack propagation in concrete. Among several crack opening laws available in ATENA, the exponential one was selected [23], as in other previous studies [26]. In this framework, significant importance is related to the fracture energy Gf being the necessary energy to open a crack of unit area, represented by the area under the crack opening law. Without experimental data, Gf can be evaluated by several analytical formulations [27,28]. More details about this approach can be found in [23].
As for the chloride transport process, the chloride ingress in concrete is modelled by the 2nd Fick’s law, providing the chloride concentration at a given time t and distance x from surface
where is the chloride concentration on the concrete surface (kg/m3), is the mean diffusion coefficient evaluated at time t (m2/s), x is the distance from the concrete surface (m), and represents an acceleration factor of diffusion process accounting for the crack width (expressed in mm), (Kwon et al., 2009 [29]):
D(t) is decreasing with time according to the following expression:
where m is the decreasing rate and m = 0 yields a constant value as proposed by Collepardi et al., 1972 [30]. This assumption is assumed to be too conservative since the diffusion process depends on the difference in chloride concentrations between the surface and a given point inside the concrete. Therefore, due to chloride ingress, this difference tends to decrease with time, slowing down the diffusion process. is the time when is measured and is obtained by averaging in the chloride exposure time:
where is the time when the diffusion coefficient can be considered constant, usually equal to 30 years.
It is worth noting that crack width w in Equation (2) is a result of the static nonlinear analysis under the applied loads. This latter represents the first aspect of the interaction between mechanical (static) and chemical (corrosion) analyses.
When becomes larger than the critical one near the steel surface, corrosion starts. Therefore, assumptions regarding are essential in determining the corrosion initiation, which influences the whole corrosion process, since the earlier induction occurs, the heavier the corrosion effects. is usually considered in the range of 0.4–1% of the cement content, which strongly influences corrosion initiation. Typical values range from 300 to 400 kg/m3. A higher cement content provides a lower chloride concentration at steel surface (if the same total chloride content is present) and, therefore, corrosion initiation will be delayed.
After initiation, the corrosion rate needs to be determined. This parameter indicates the radius decreasing of steel rebars over time. According to this modelling approach, the corrosion rate depends on the current density that is evaluated through the model of Liu and Weyer [31]. Steel consumption generates rust with a volume about six times compared to steel, causing pressure on the concrete cover.
Using the DuraCrete model [32], the critical steel consumption can be determined as the value able to generate concrete cover cracking. The latter depends on the initial bar diameter and concrete tensile strength. The model assumes that when the crack width reaches 1 mm, spalling occurs. More details related to corrosion modelling can be found in [23].
The selection of parameters related to chloride-induced corrosion is important to perform reliable predictions of degradation of steel reinforcement inside the studied structural components. The main parameters are: (i) surface chloride concentration , (ii) diffusion coefficient evaluated after years and (iii) critical chloride content . The optimal way to estimate them is by means of in-situ and laboratory destructive and non-destructive tests (NDTs). As for , both non-destructive and destructive tests are available. Among many available methods, the application of ion-selective electrodes or optical fibre sensors [33] are NDT methods while the Volhard method [34] is a widely used chemical technique needing samples of concrete to be taken from the structures. Several experimental methods are also available for the estimation of being of destructive type since concrete cores are necessary for laboratory testing. For example, methods based on electrical resistivity with measurement of ion migration under an applied voltage [35] can be used. Regarding the critical chloride content, the main method currently available is based on the measurement of the electrochemical potential on concrete samples including reinforcing bars (not yet corroded) taken from the structure and exposed to chlorides in a laboratory [36].
4. The Musmeci Bridge and Its Gerber Saddles
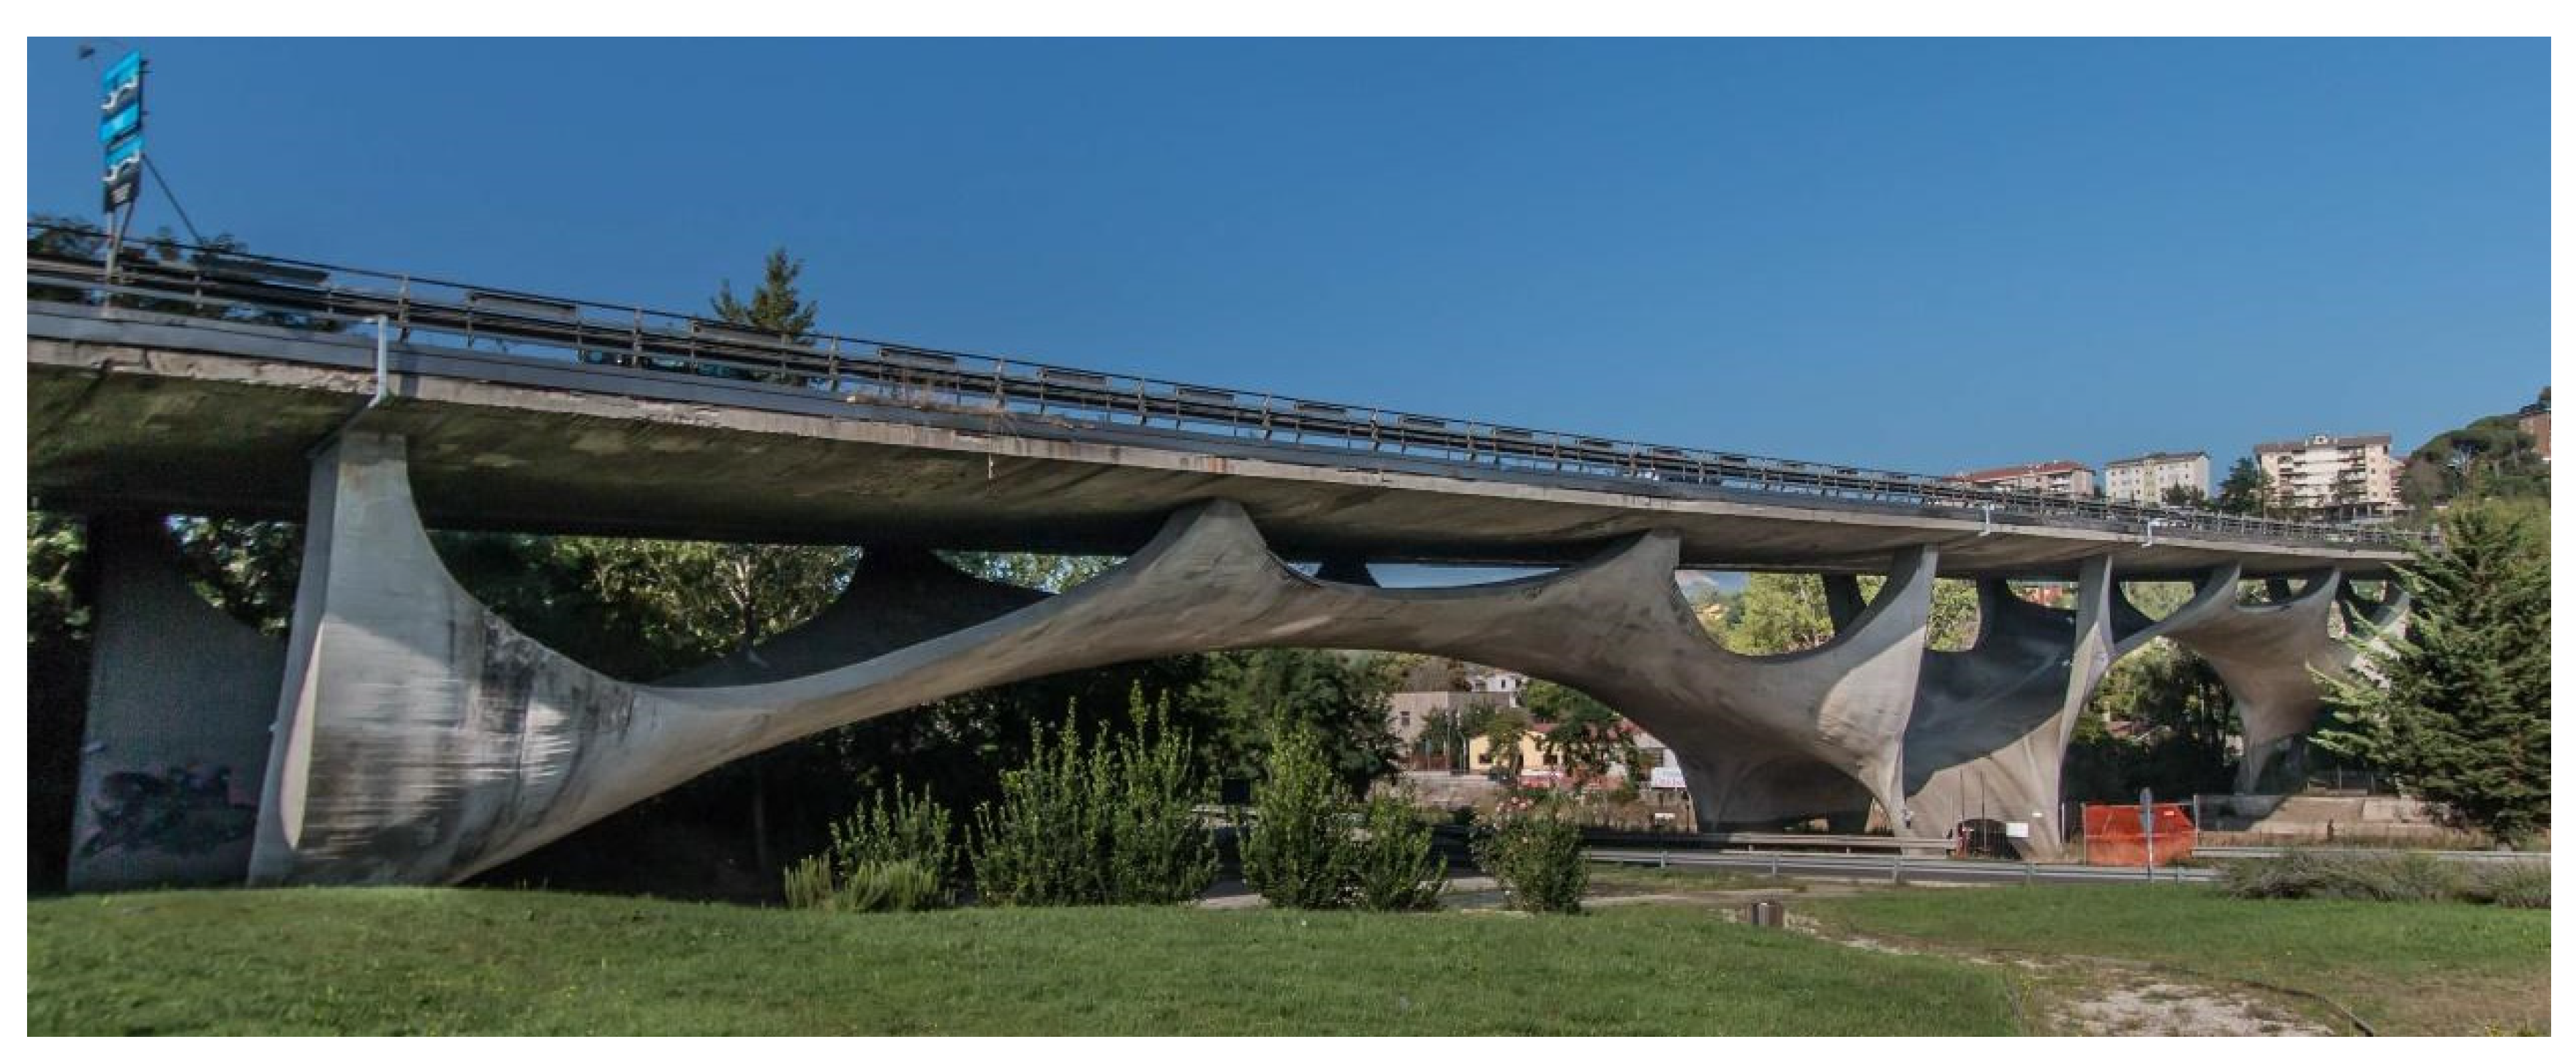
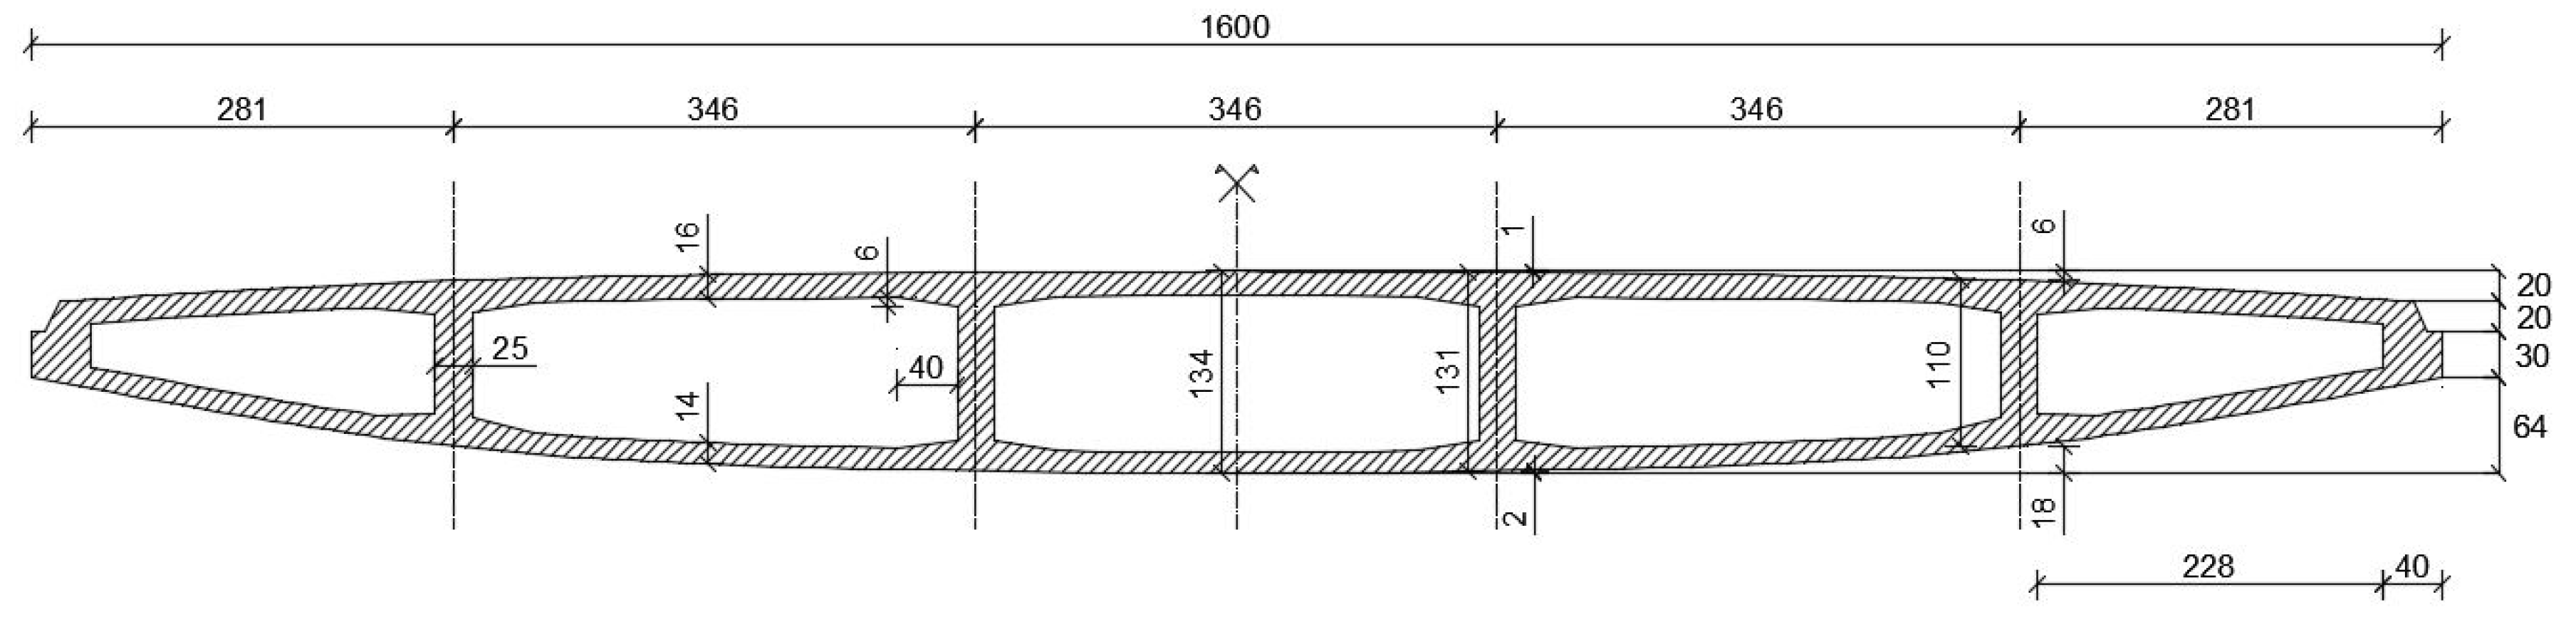
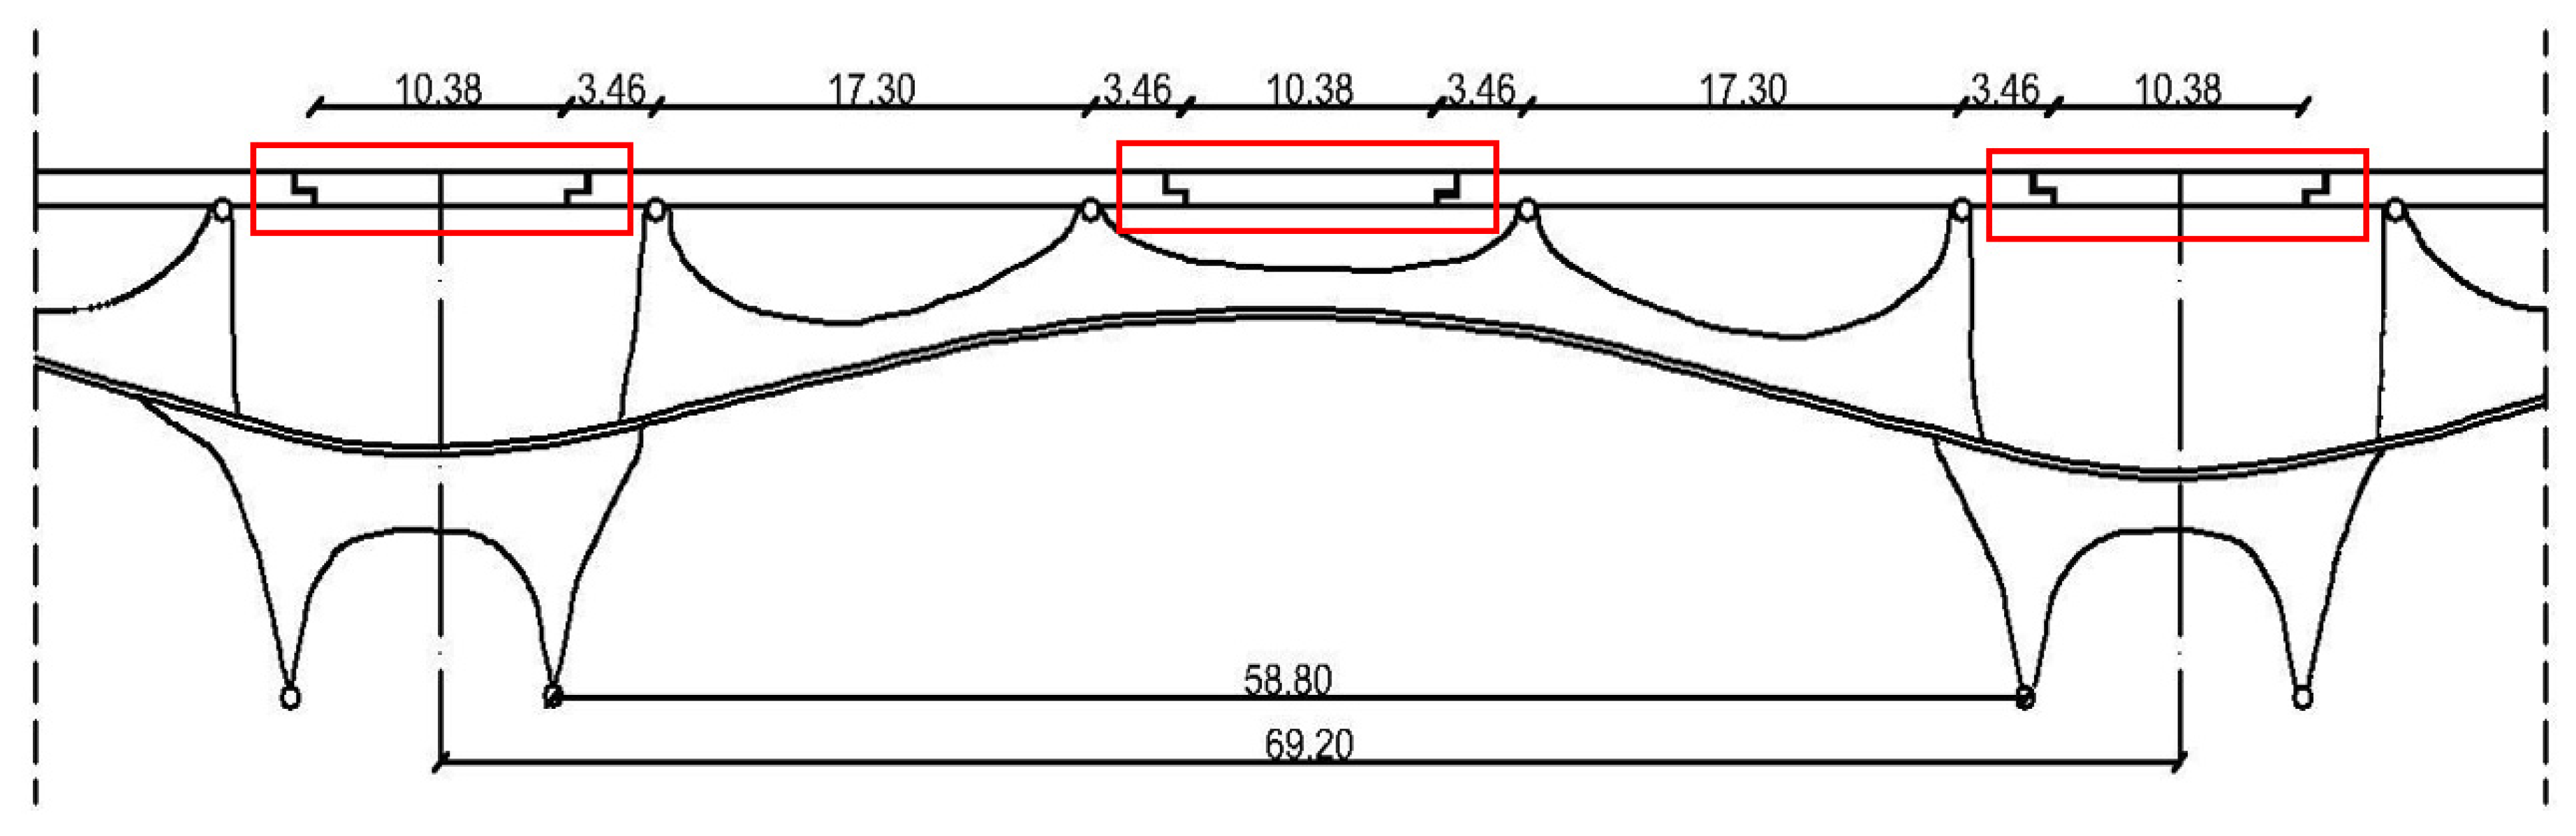
The bridge over the Basento river in Potenza, Italy, designed by Sergio Musmeci (today called Musmeci Bridge), is a unique example of form-finding in structural design and construction devoted to optimizing structural scheme and stress flows (Figure 3). It is supported by a continuous double-curvature RC membrane designed to reduce bending stresses as much as possible and exploit the excellent capacity of concrete to work in compression [37]. The vault is 0.30 m thick and forms four equal spans 69.20 m long and is provided with thicker ribs at joints with the deck. The RC box deck is 16 m wide and supported by the vault every 17.30 m for total length of 300 m (Figure 4). Moreover, the deck is interrupted by simply supported sections (10.38 m long) connected by Gerber saddles corresponding to the expansion joints (see Figure 5).
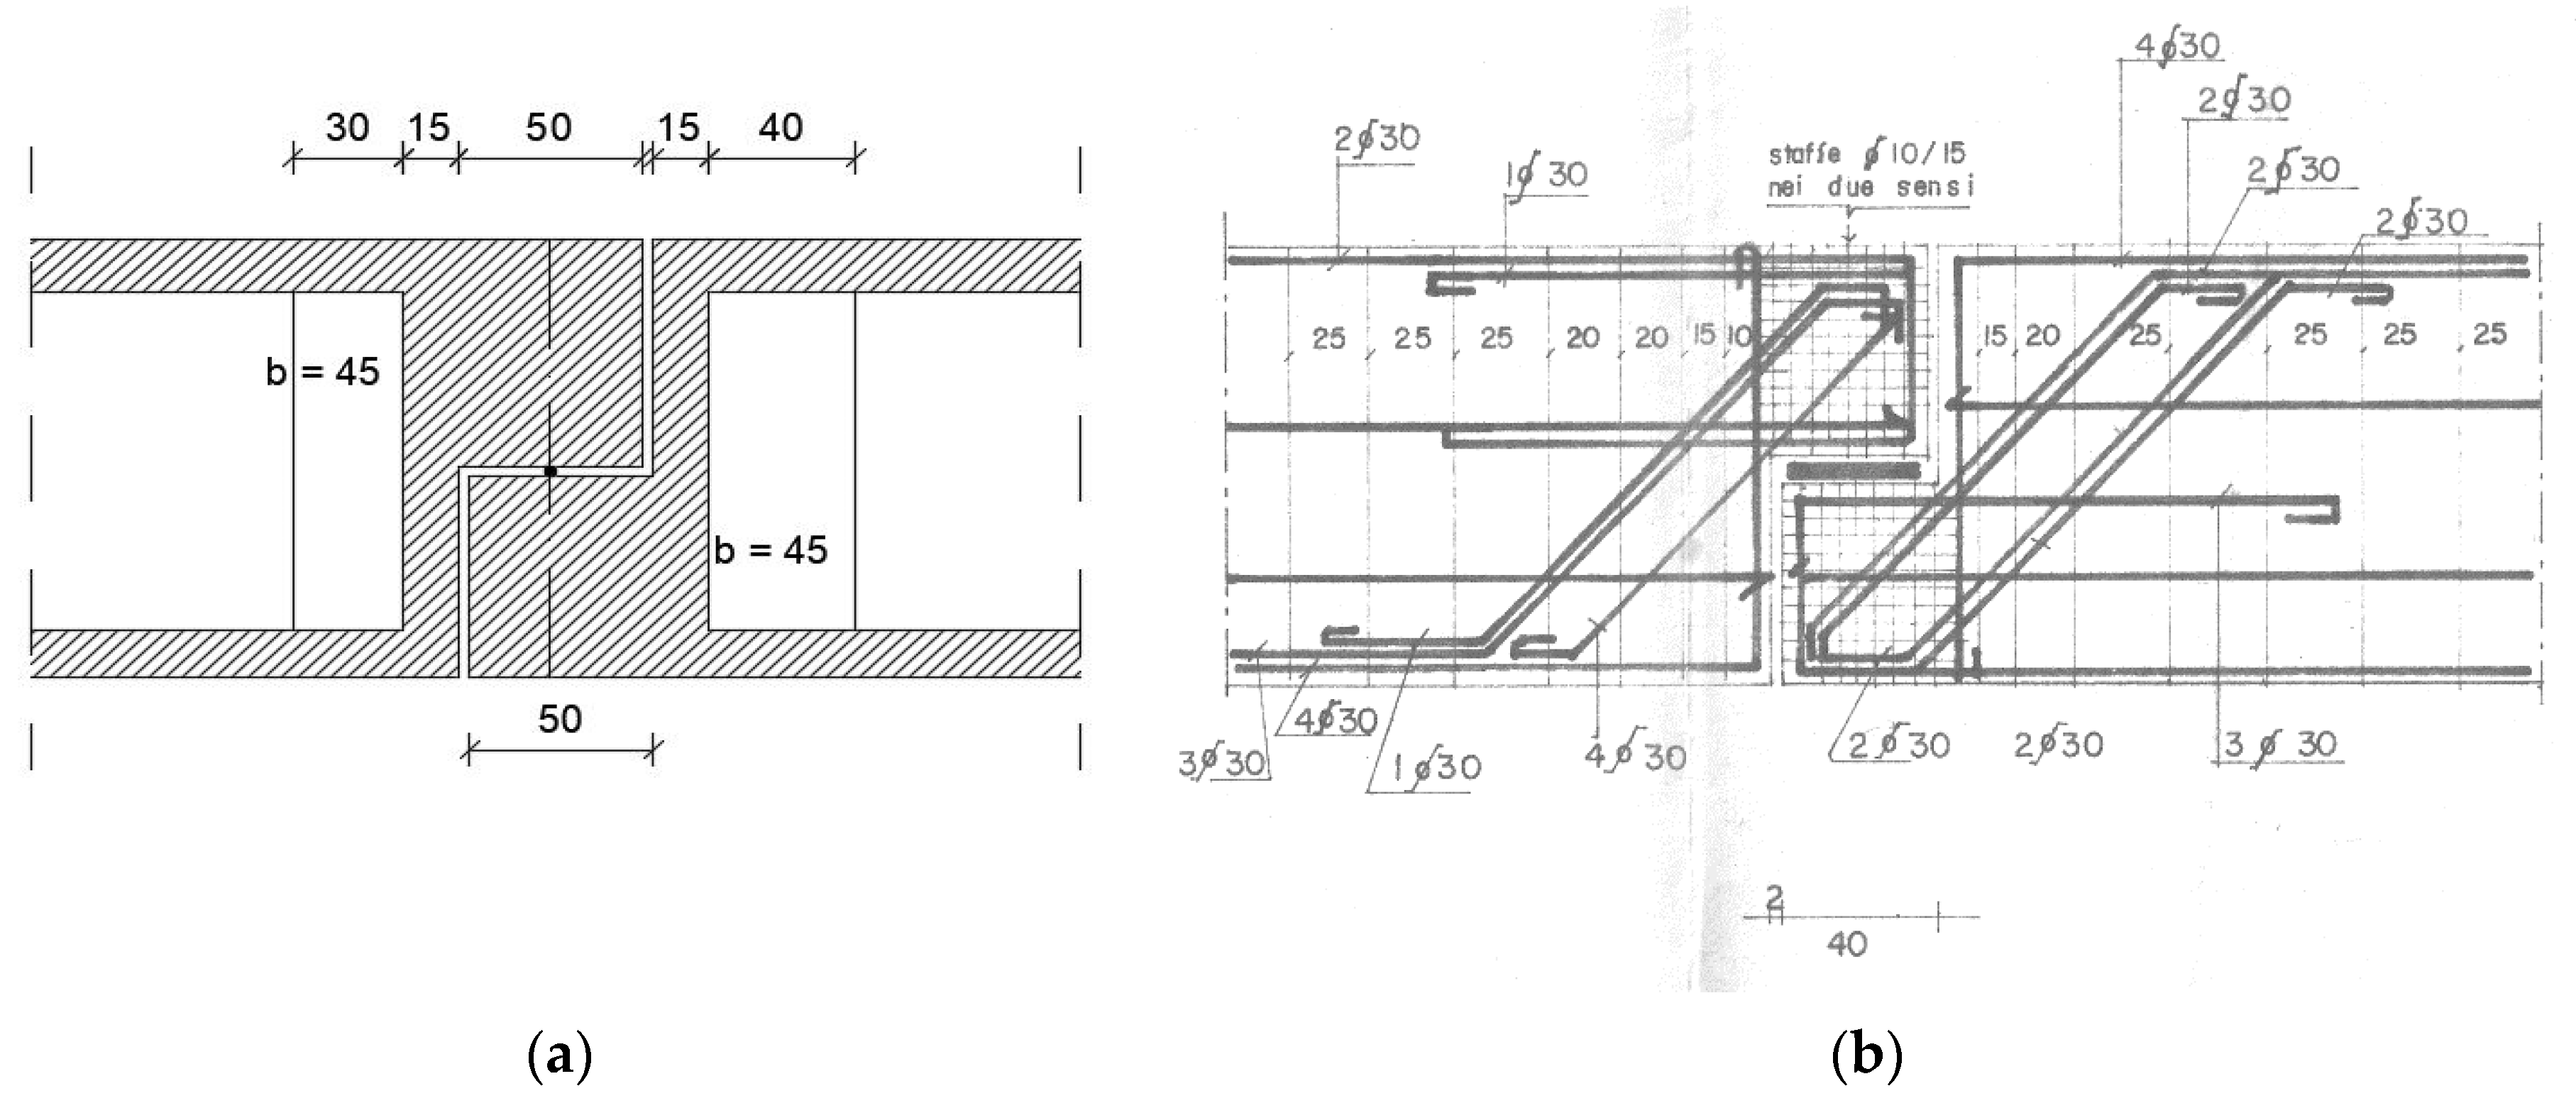
Structural details of Gerber saddles are shown in Figure 6. Diagonal and horizontal 30 mm diameter reinforcement bars are present along with 10 mm diameter stirrups with variable spacing. Further, the corbels are provided with 10 mm diameter confining hoops spaced 50 mm and placed in the two orthogonal directions with 20 mm cover. Horizontal rebars typically have 50 mm cover, while diagonal ones have 50 mm minimum cover near the corbel junction. More detailed schemes of reinforcement bars are shown in the following.
The bridge is strategic due to its function and location. It connects the city centre to the Basentana motorway and overpasses two urban roads and an important railway line: the Naples-Potenza-Taranto. Any structural problem on the bridge could cause severe consequences to the overpassed infrastructures and possible loss of human life. It was completed in 1975 after a complex design process that involved the realisation of reduced-scale models tested under static loads to verify the assigned structural shape. The construction was also very challenging due to the shape of the vault and required workmanship to produce complicated wooden formworks.
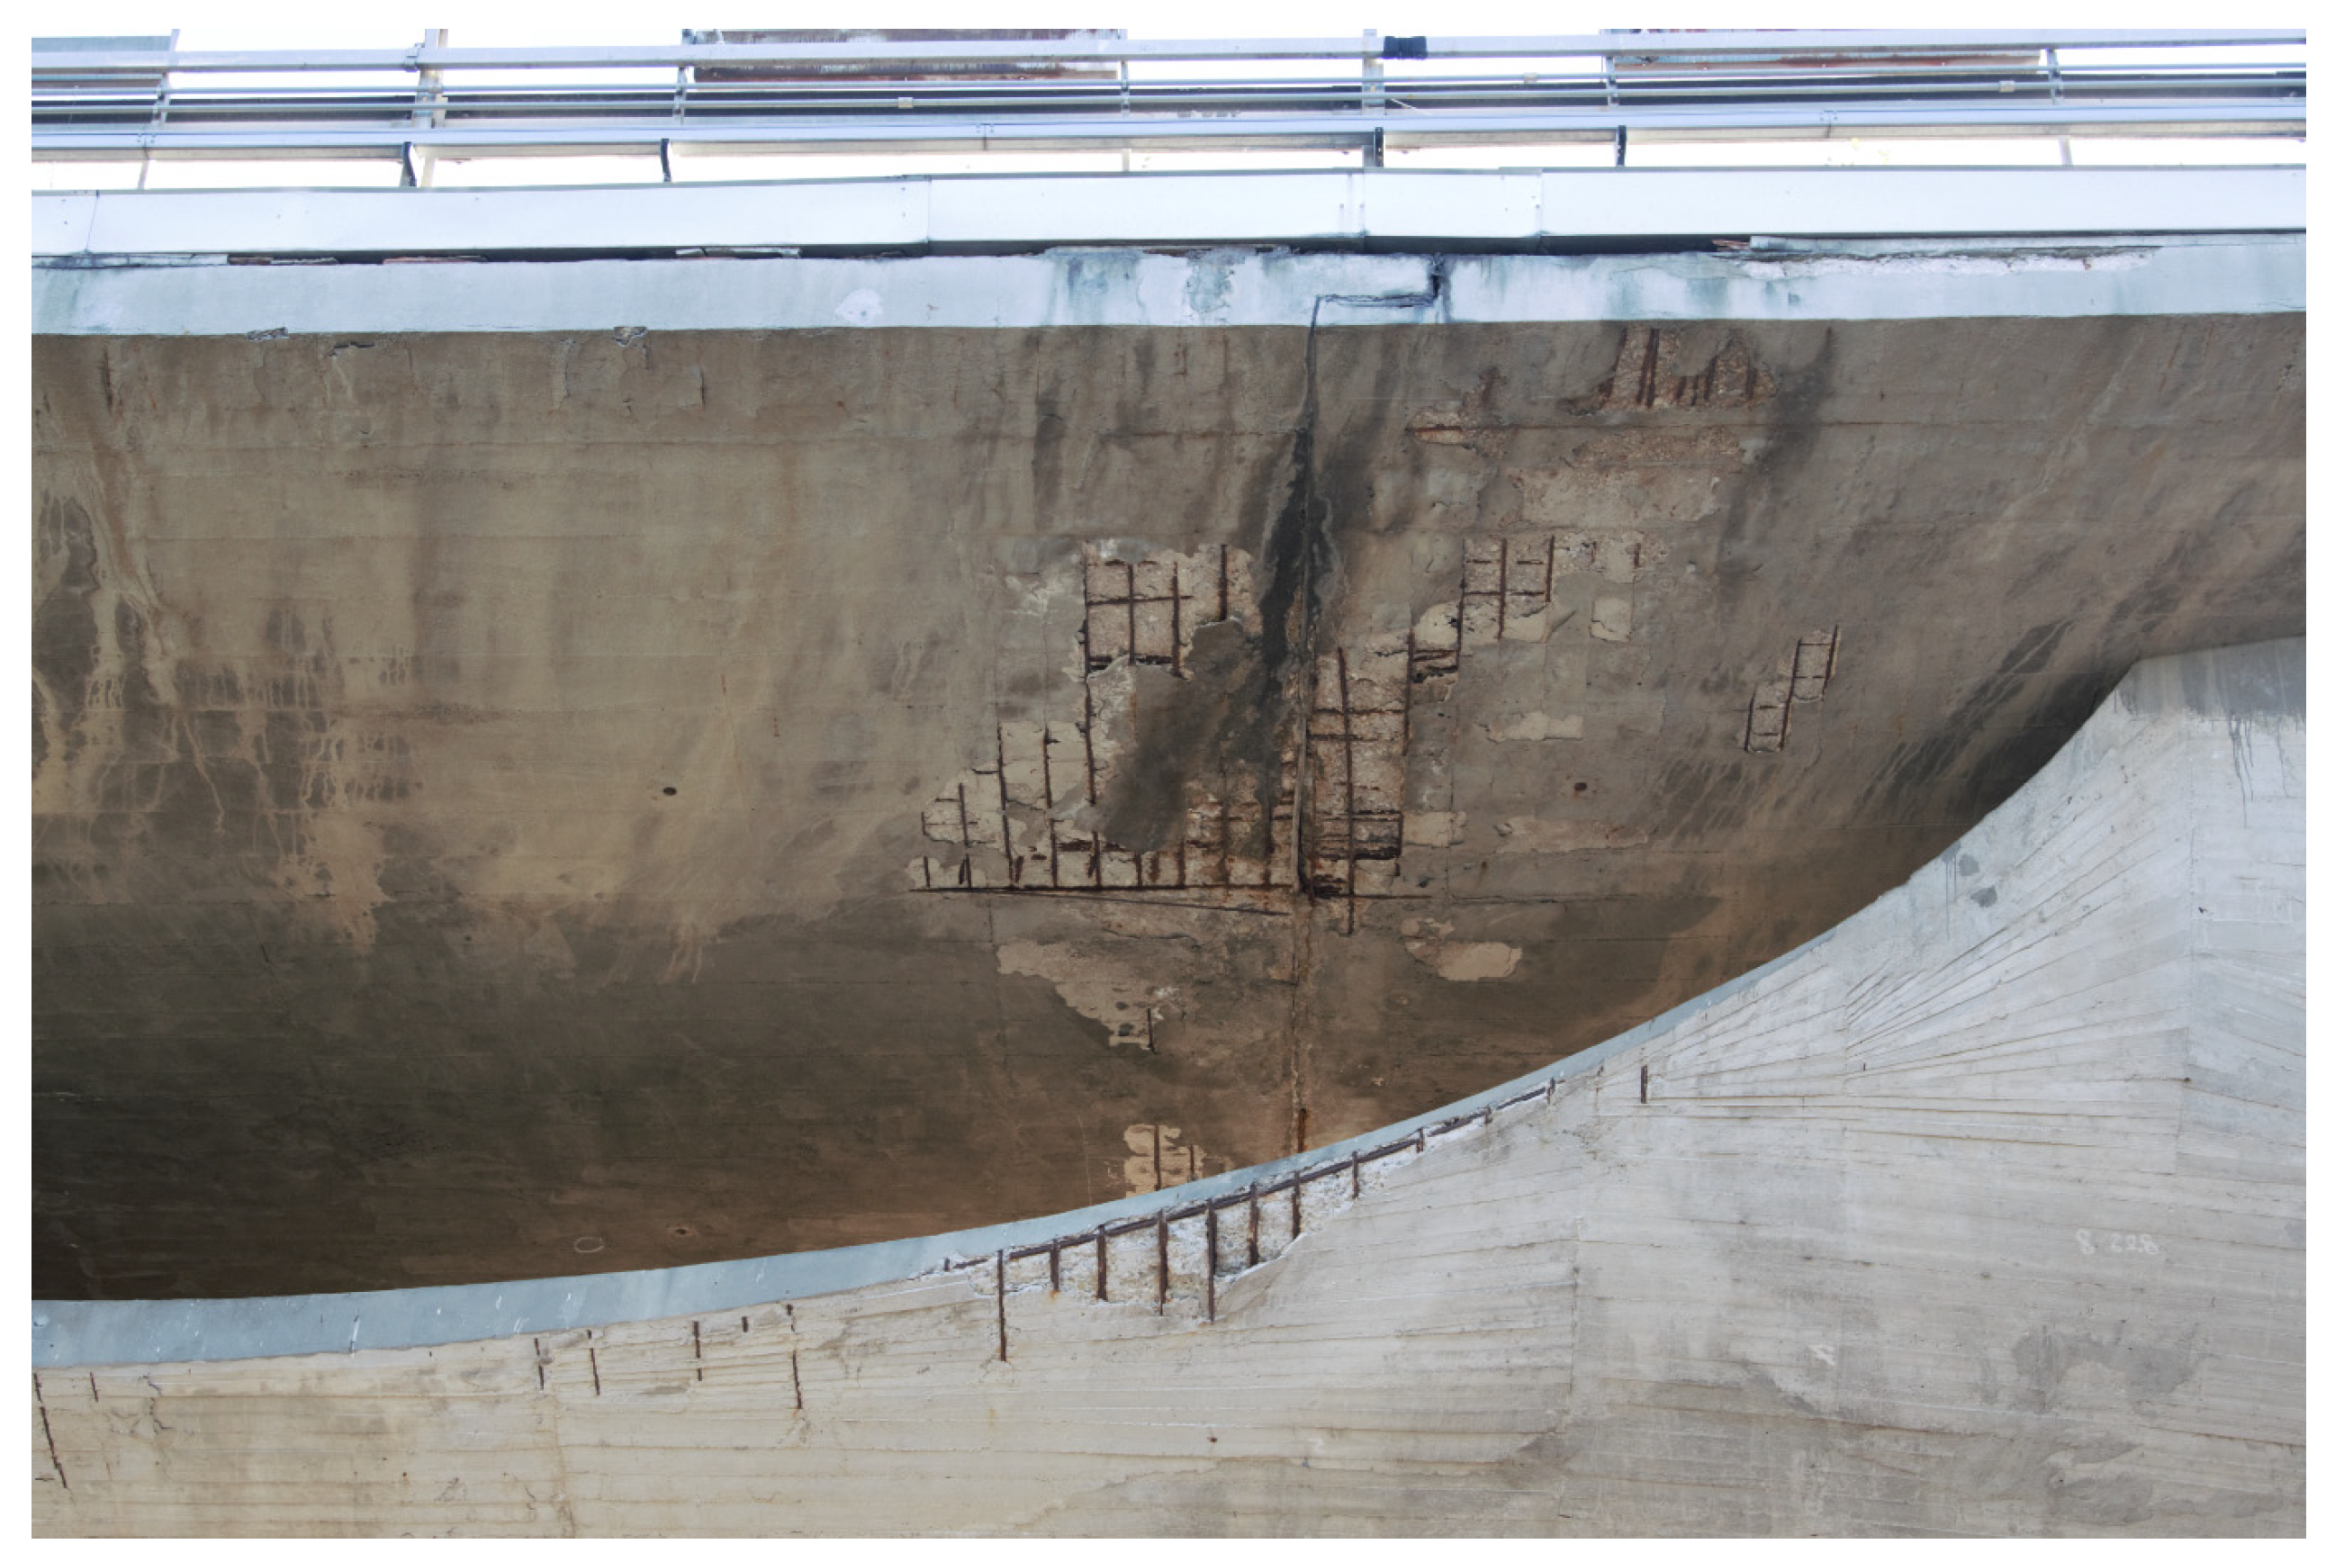
Today, the bridge is affected by a significant deterioration level especially near the Gerber saddles, where expansion joints are placed. The lack of maintenance on the water drainage system causes continuous seepage across the joints and Gerber saddles, causing evident corrosion which induces cracking and spalling, also to the underlying vault sections (Figure 7). The necessary restoring interventions are planned to be carried out in the next few years by the Municipality of Potenza. However, technical difficulties related to the bridge shape and structural scheme are amplified by the fact that the structure has now become a symbol known throughout Italy and abroad, being a modern artwork officially recognized by the Italian Ministry of Cultural Heritage and Activities and Tourism. Due to these reasons, the bridge cannot sustain traditional intervention techniques used for ordinary bridges, but advanced and low-impact techniques are needed for the preservation of its historic value. In summary, the Musmeci Bridge is an artwork supporting high traffic loads, and rehabilitation measures must respect the bridge aesthetic and spirit given by its designer, Sergio Musmeci.
Under these premises, an assessment of corrosion problems related to the Gerber saddles, also taking into account that most of them are not inspectable due to the box section of the deck, is necessary. This is made by mechano-chemical analyses through the software tool ATENA [23], evaluating the interaction between the effects of static loads and those of chloride-induced corrosion due to de-icing salts. In fact, Potenza is a mountain town located 800 m above sea level on the southern Apennines mountain range with many snow days per year.
To build a detailed model of the typical Gerber saddle and perform mechano-chemical analyses, information on material properties and structural details is necessary. From this point of view, valuable information was collected during the seismic assessment carried out by a research group from the University of Basilicata [38]. Additionally, a dynamic identification campaign was performed to study the seismic behaviour of the bridge and compare it with the results of a numerical model.
As for the Gerber saddles, the knowledge level was KL3 according to [39,40], i.e., the maximum, for which a confidence factor CF = 1.0 can be assumed. As known, the confidence factor is related to the evaluation of design values of material properties based on mean values. It is worth noting that the current Italian code for bridge assessment [12] suggests reaching the maximum knowledge level (i.e., KL3).
Table 1 summarises the properties of concrete related to cores drilled nearby Gerber saddles. It is worth noting that in subsequent nonlinear FE analyses, the design values were used in order to compute capacity values according to the Ultimate Limit State safety checks prescribed by the current code. The fracture energy of concrete has been computed according to Model Code 2010 [27]:
The experimental campaign on bridge materials did not include the extraction of rebars in order to minimize invasiveness. However, ribbed bars of class FeB38k were used in the construction. This steel grade is characterized by the following properties (Table 2) according to what reported by Verderame et al. in [41].
The evaluation of design values of material properties has been made according to [12], considering both the mean value and the characteristic one as follows:
In the absence of experimental tests on reinforcing steel, the mean value is unavailable, and the characteristic value has been used in Equation (7). This provides a design value equal to the characteristic value, being CF = 1. Regarding concrete, the mean value is available (see Table 1) from the experimental campaign based on cores’ extraction. Therefore, the design value is .
4.1. Selection of Parameters Influencing Chloride-Induced Corrosion
Experimental methods to determine parameters influencing the chloride-induced corrosion in concrete structures are often destructive, requiring samples of material (also reinforcing steel) to be taken from the structure and time to perform tests of chloride diffusion or chemical analyses. For these reasons, in the present study, only data from the literature are considered. Surface chloride concentration , diffusion coefficient evaluated after years and the critical chloride content are evaluated based on data reported for structures subjected to similar environmental conditions. This means that only data reported for bridges or other structures subjected to de-icing salts are considered. A literature review has been carried out to evaluate the ranges of the three main parameters (,, and ), identifying lower (L) and upper (H) limits as well as the median value (M). Using these values in different combinations could help in evaluating the influence of governing parameters on the extent of corrosion and their effects on structural behaviour.
Referring to studies in [14,42,43] related to environmental conditions of mountain roads with the use of de-icing salts, ranges between 1.5% and 2.8% of cement mass, while the median value can be assumed to be equal to 2.0%. According to [14], the critical chloride content value is in the range 0.4–1.0% of cement mass, while the median value can be assumed as equal to 0.6% as shown in [19]. Regarding the diffusion coefficient , the choice has been made from literature related cases where the concrete properties are similar to those of the Musmeci bridge (i.e., type of cement and w/b ratio). Data of corrosion governing parameters are summarised in Table 3. It is worth noting that and are usually assumed to be equal to 10 and 30 years, respectively, while is derived from a study based on the same approach [19]. These latter are reported in Table 4 along with the tensile strength of concrete and the cement mass used for concrete production.
4.2. Finite Element Modelling and Mechano-Chemical Analyses
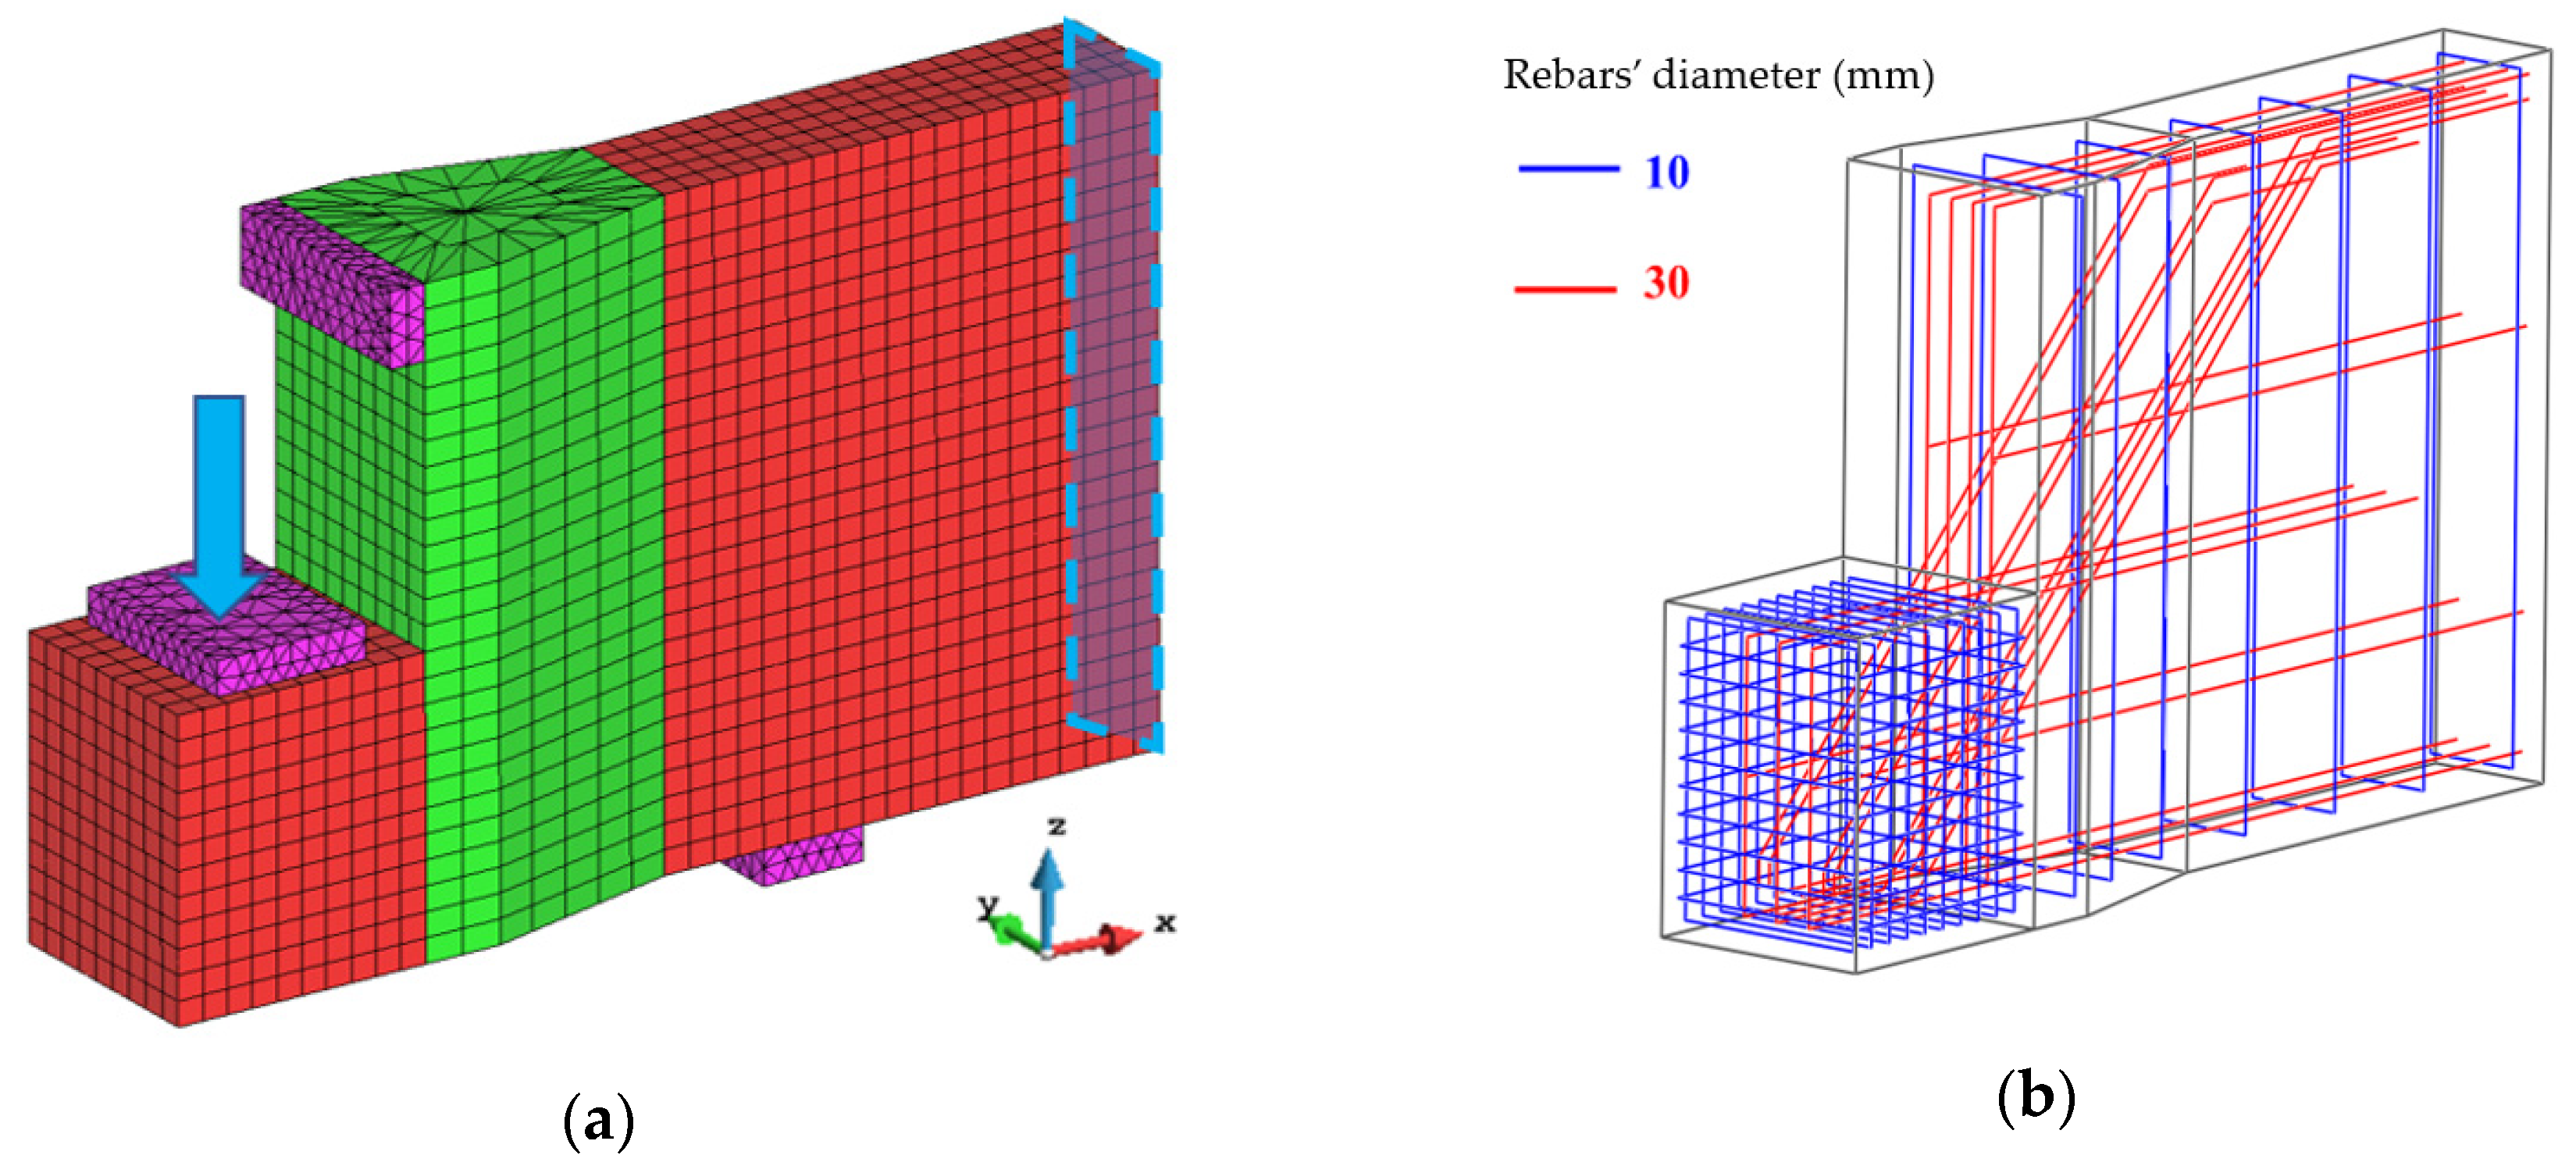
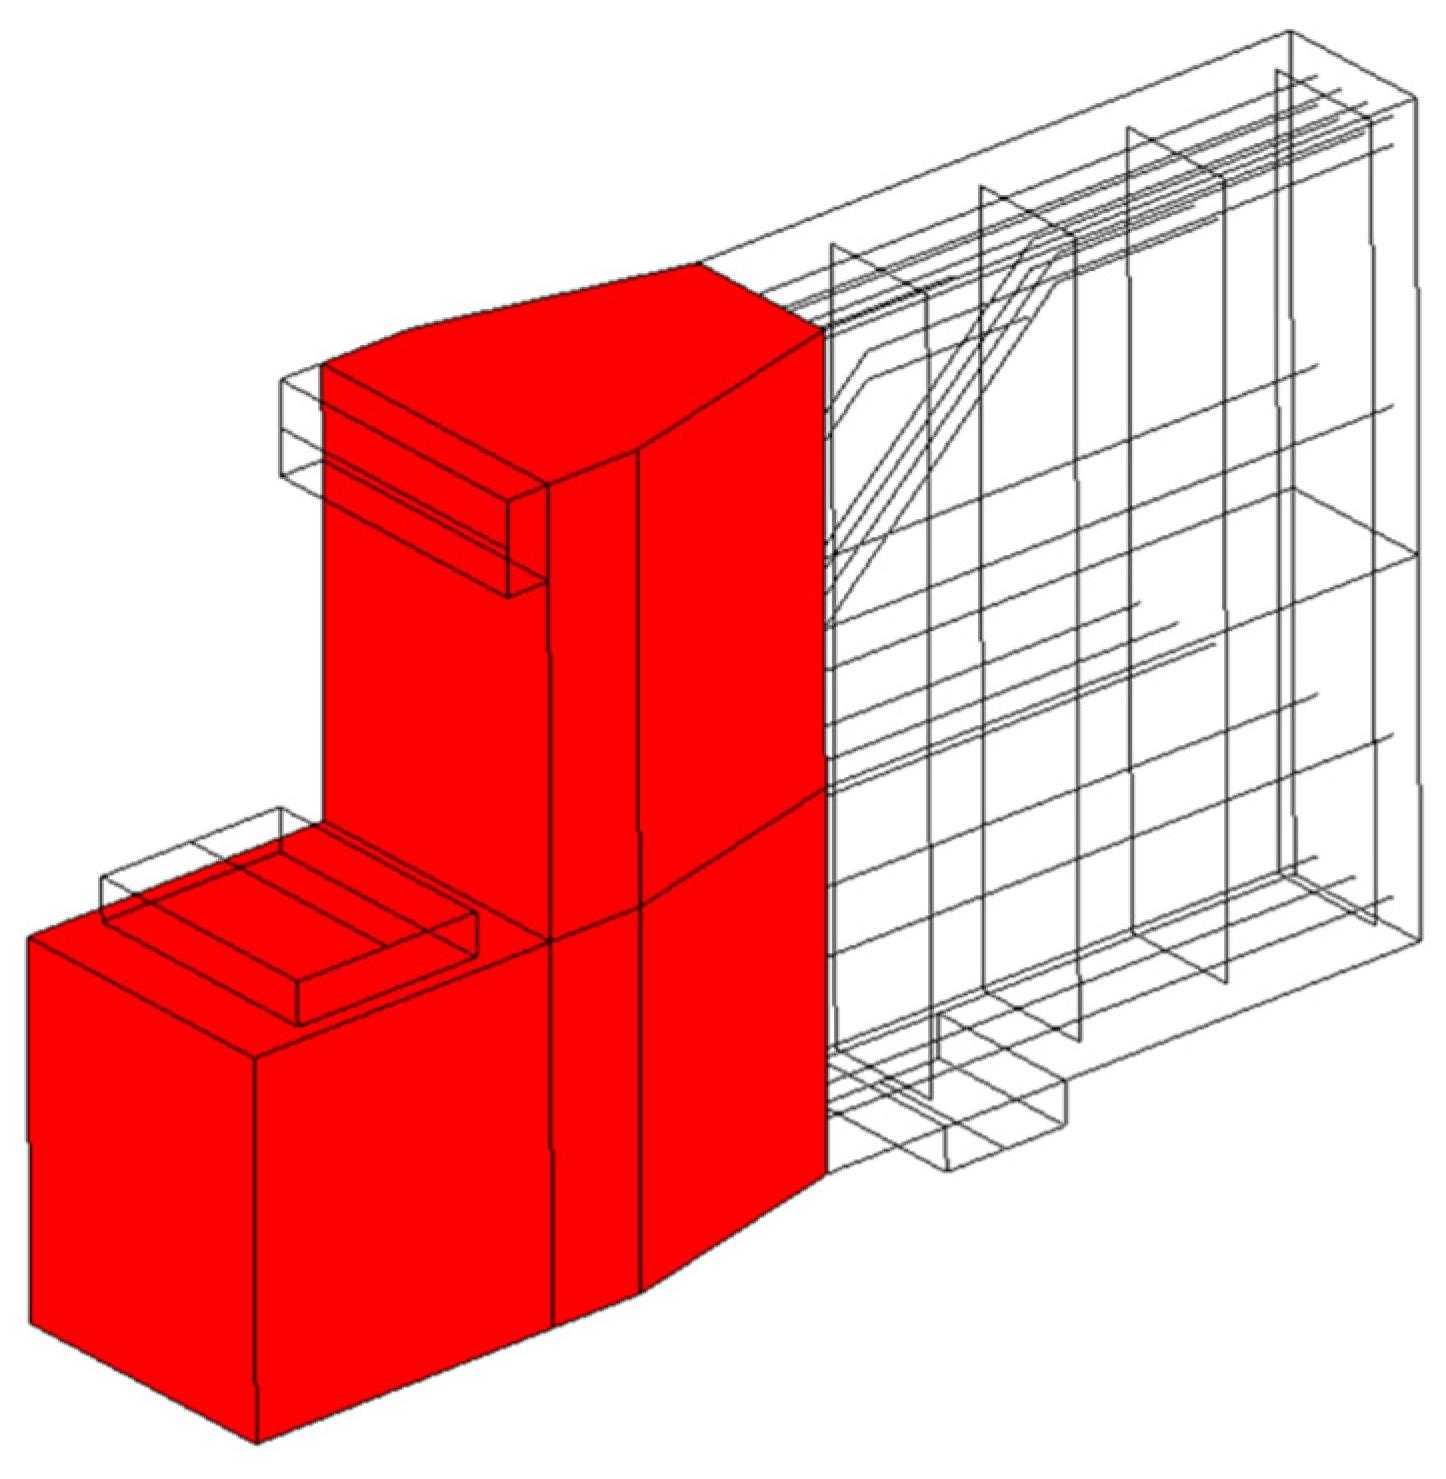
The finite element model is made of three main volumes. Figure 8 shows two volumes meshed with hexahedral elements (in red) and the connection volume meshed with prismatic elements (in green). Moreover, steel plates (purple coloured volumes in Figure 8a) have been used to reproduce boundary and loading regions. The plate placed on the corbel is devoted to the load application, while the two others are used to constrain the model. The bottom plate restrains z and y displacements, and the upper plate restrains only x-displacement. Finally, the rear vertical surface (blue dashed contour in Figure 8a) is restrained for rotation about the x-axis to simulate the continuity with the remaining part of the bridge girder. In total, the model has about 6500 volume elements representing concrete and 150 truss elements for reinforcement, with more than 25,000 nodes. Analyses for determination of the ultimate load were performed in displacement control (applied to the corbel centre, blue arrow in Figure 8a), monitoring the required force.
It is worth noting that boundary conditions have been selected in order to limit their influence on the damage and collapse mechanism. To this end, valuable indications based on previous experimental research have been found in ref. [21].
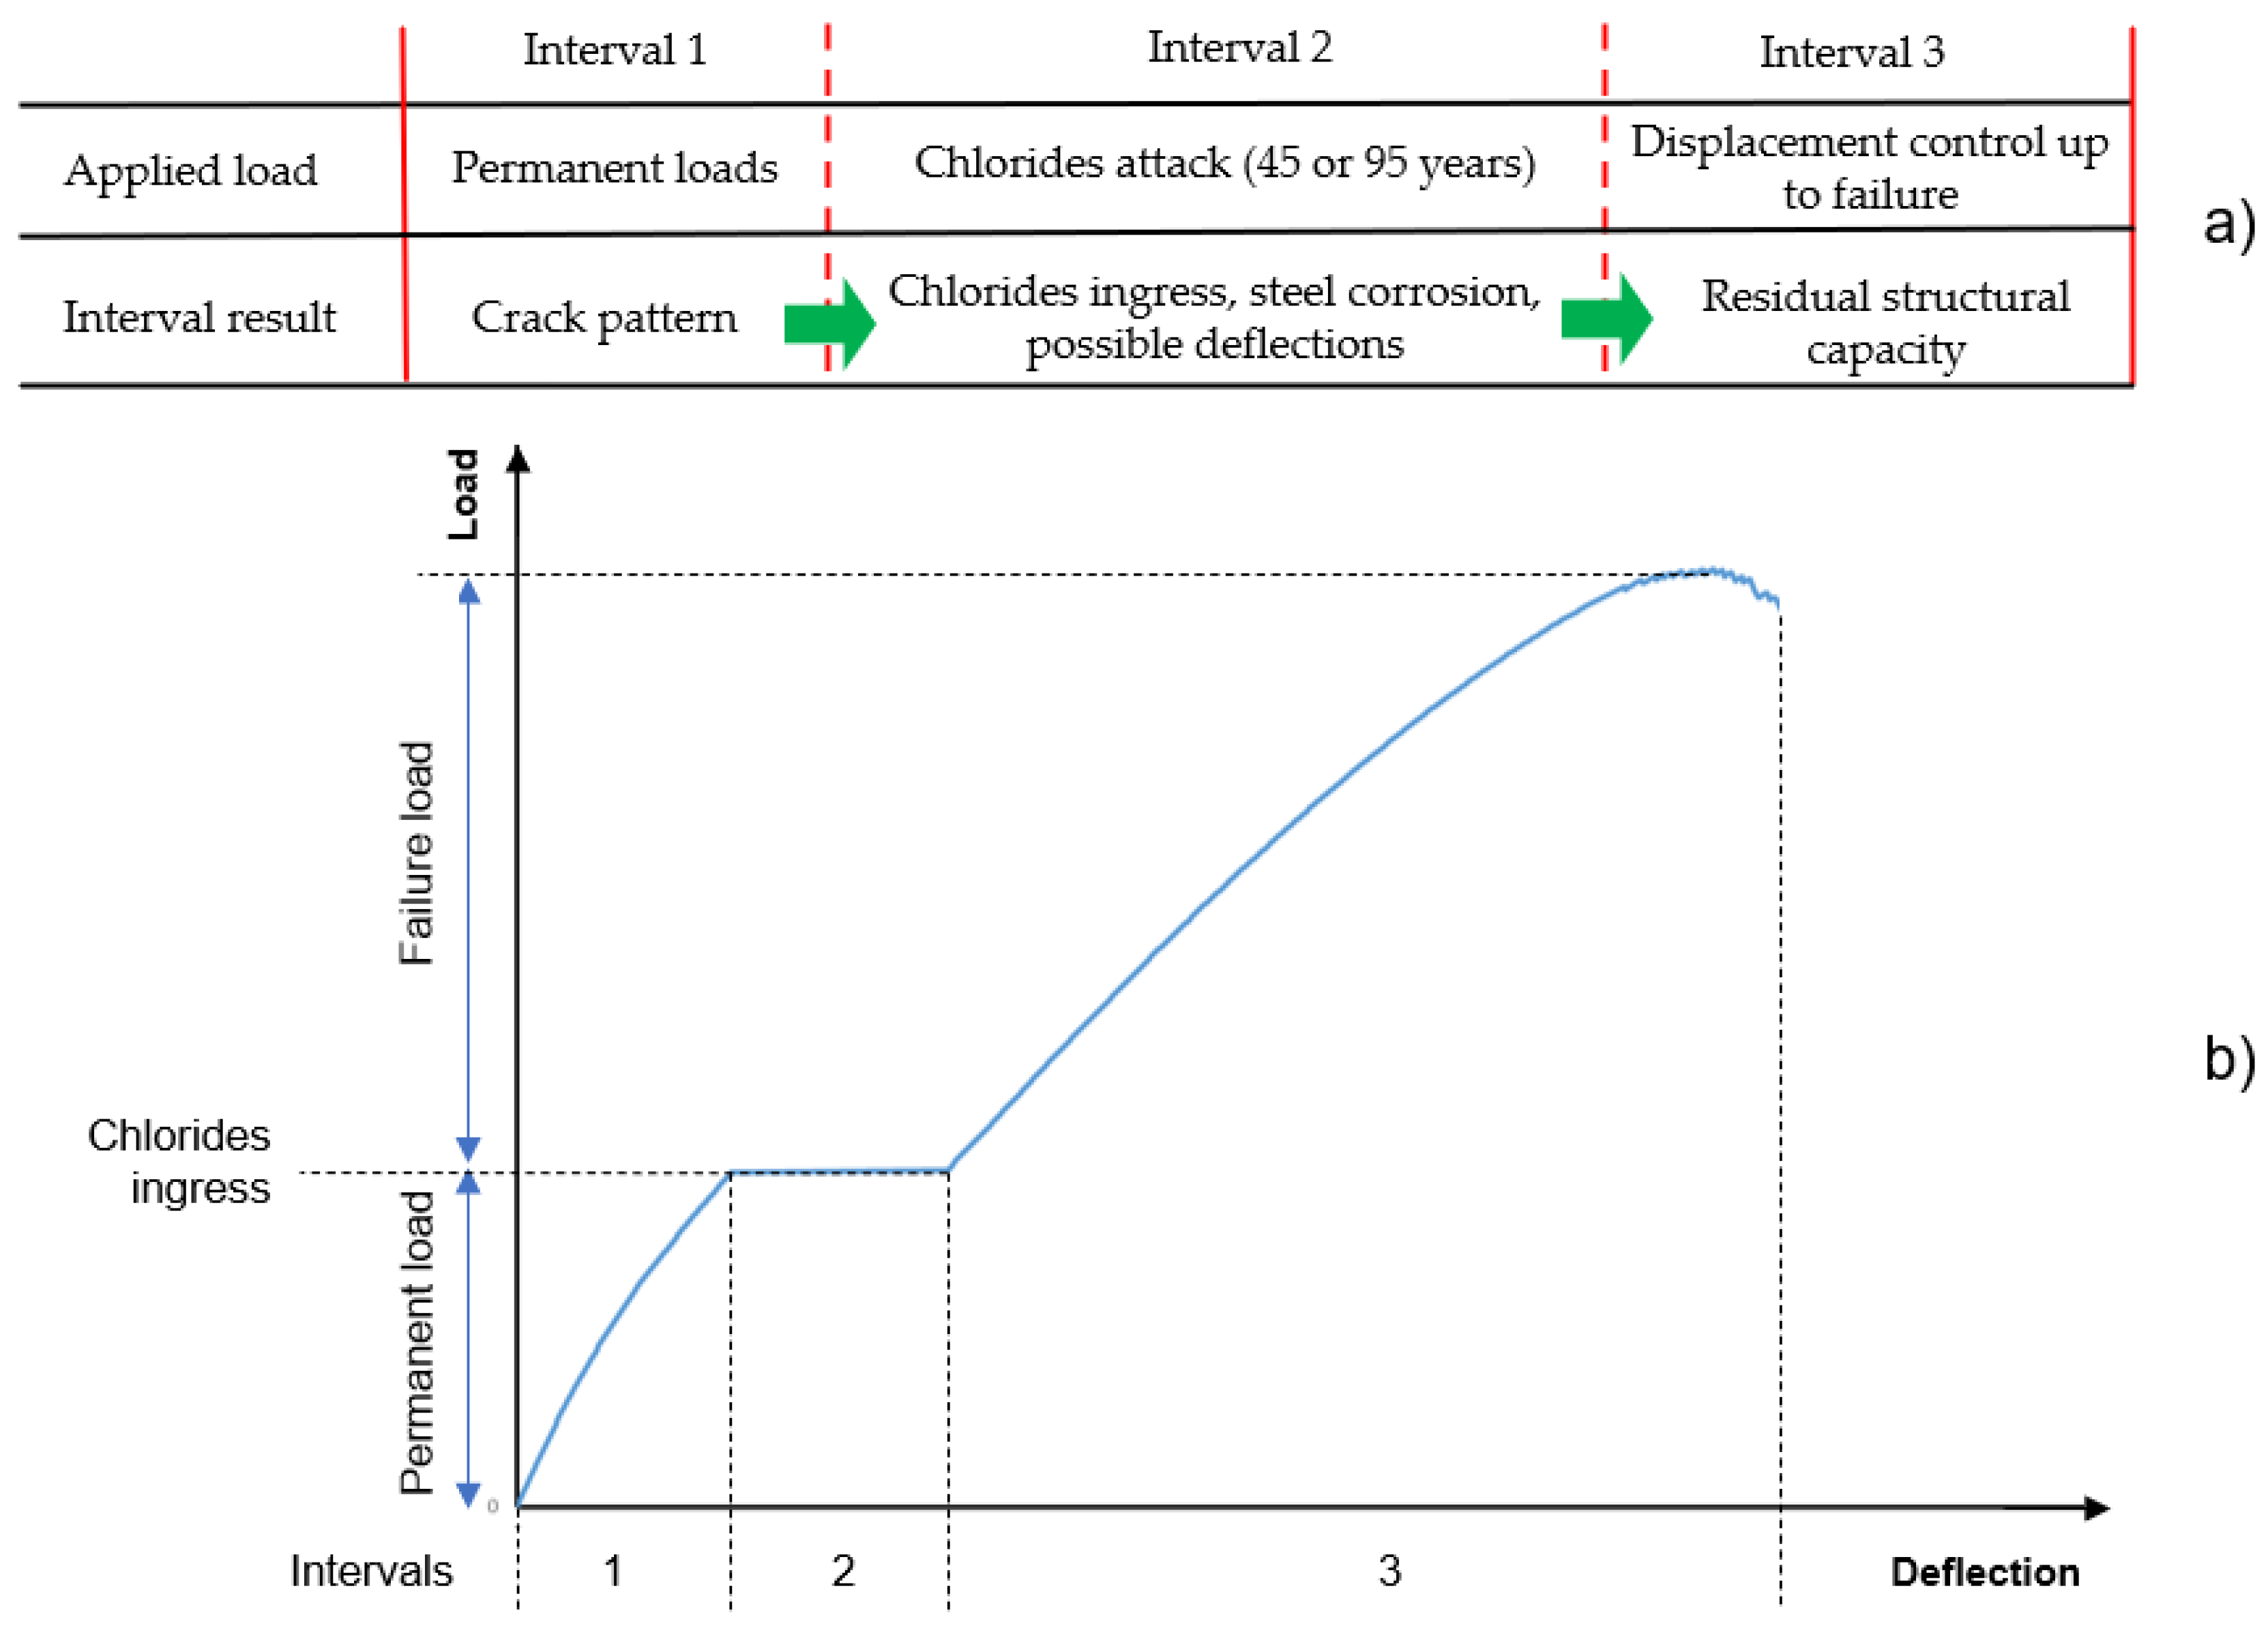
The performed mechano-chemical analyses included the following sub-analyses (intervals):
- Static nonlinear analysis under force control to obtain the structural response under permanent loads;
- Application of chloride-induced corrosion for a certain time (corrosion period) and with a given combination of the durability parameters;
- Static analysis to evaluate the ultimate capacity under displacement control.
As reported in Figure 9a, the results of interval 1 are used in interval 2 to perform the chloride ingress analysis, accounting for cracks generated by permanent loads. Chloride ingress analyses at interval 2 are able to account for chloride diffusion into the concrete volume, detecting the initiation and progress of reinforcing steel corrosion. Specifically, based on the 1D chloride diffusion model reported in Equations (1)–(5), chloride content in the concrete volume is computed as a function of time, monthly. When the chloride content near the rebars exceeds the critical one, corrosion starts with the consequent reduction in rebars’ cross sectional area. After each corrosion step (one month), based on the new structural configuration (the model is updated with the new values of steel rebars’ area), a new static equilibrium iteration is computed to determine possible variations of the displacements, stresses and crack pattern, which, in turn, may influence subsequent corrosion steps. The latter reflects on the static equilibrium condition because a reduction in steel area may increase deflection under a constant permanent load. Finally, in interval 3, accounting for the new crack pattern and steel corrosion, the structure is led to collapse, increasing the vertical displacement applied to the corbel. Therefore, interval 3 makes it possible to evaluate the structural capacity after a given corrosion period. It is worth noting that the deflection amplitude under constant load in interval 2 is often very small compared to those due to permanent and failure loads. Indeed, the representation of Figure 9b is only as an example.
In order to model the corrosion attack, red surfaces shown in Figure 10 were exposed to chlorides based on parameters summarised in Table 3 and Table 4. These surfaces were selected considering the water seepage from the platform containing chlorides due to de-icing salts.
The objectives of the performed analyses are: (i) evaluating the ultimate behaviour and verifying the most stressed components; (ii) assessing the influence of corrosion on the ultimate load-carrying capacity and on the collapse mechanism; and (iii) finding out the influence of the three main parameters related to the chloride-induced corrosion.
Regarding the latter, different corrosion analyses were carried out considering all possible combinations of the three parameters (, and ), assuming their low (L), median (M) and high (H) values as summarised in Table 3. In this way, the total number of performed analyses is 27 for each chloride attack duration (corrosion period). Specifically, two values of the corrosion period are investigated: (i) 45 years (t45), corresponding to the present time (the bridge construction ended in 1975) and (ii) 95 years (t95), being the current time plus a further 50 years of life span. Therefore, 27 mechano-chemical analyses for t45 and another 27 for t95 are carried out. Moreover, an analysis is needed in the absence of any chloride attack, being the case named “t0”, representing the structure condition just after the bridge construction was ended.
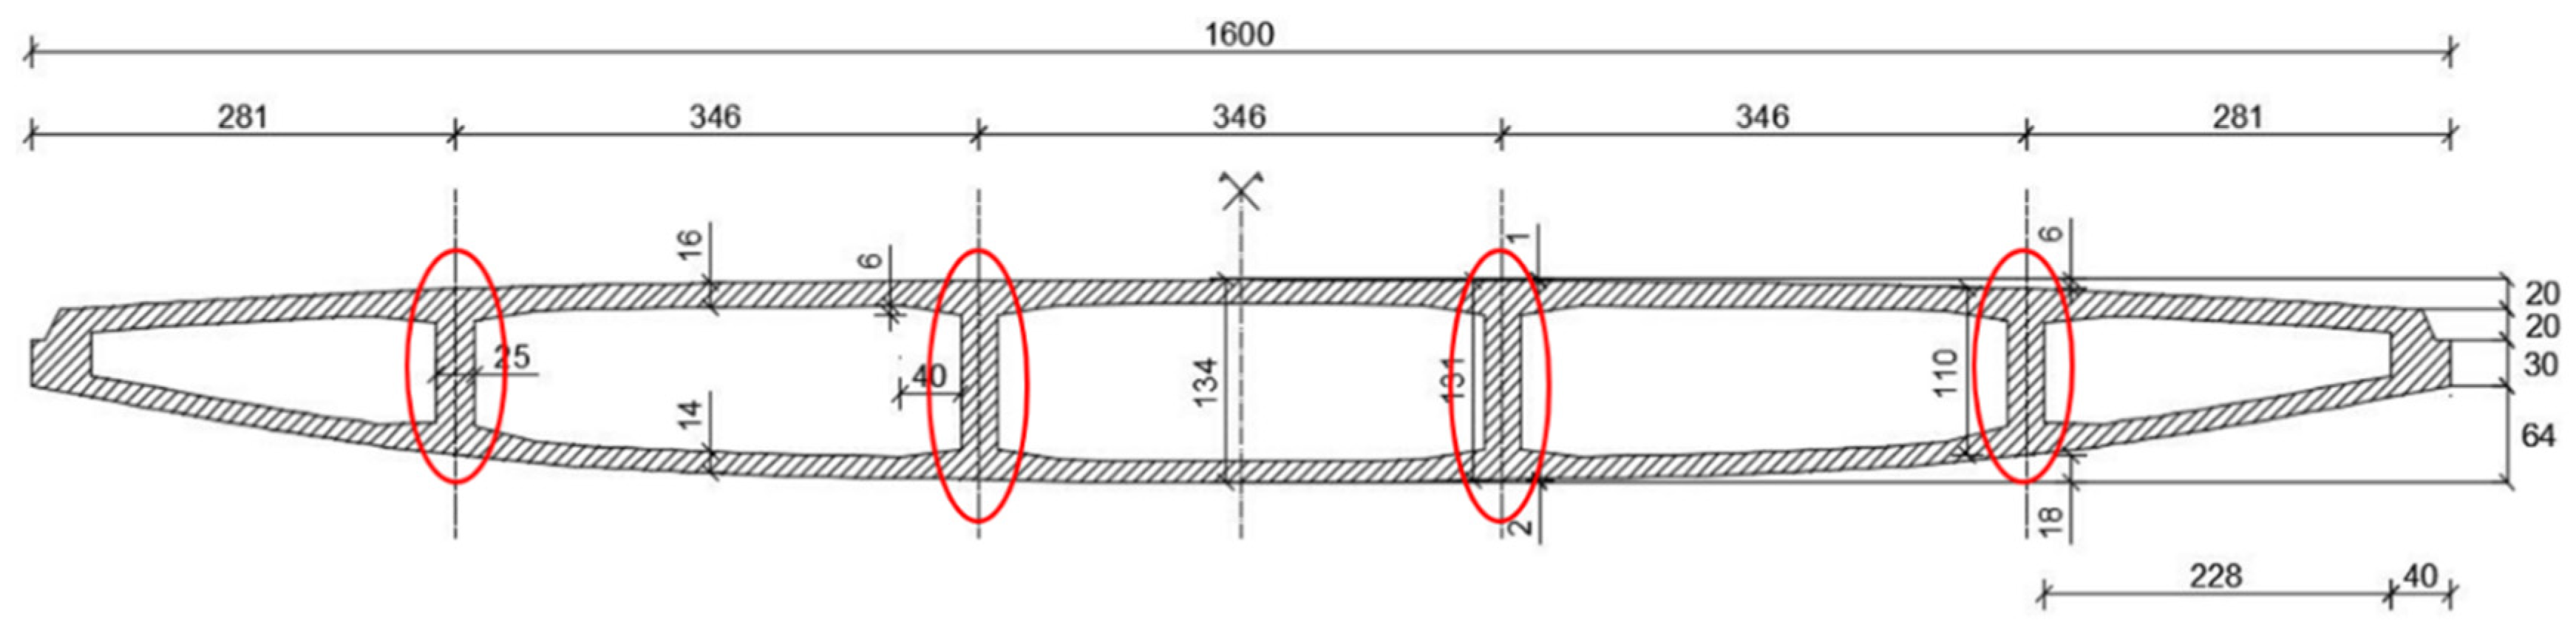
The crack pattern due to self-weight of the simply supported bridge span (interval 1) is considered in the chloride analysis. It is worth remembering that the effective Gerber saddles, according to the original design by Musmeci, are four, namely those highlighted in Figure 11. The most external ones cannot be considered effective due to their reduced depth. A single Gerber saddle’s reaction due to permanent gravity loads (self-weight of structural and non-structural deck components related to the single simply supported span: deck box section, road pavement, guard rails) is equal to RP = 270 kN.
The nomenclature of each one of the 27 corrosion parameter combinations is represented by the combination of the letters L, M or H. In particular, the first letter refers to the parameter, the second one to and the third one to . t45 and t95 give information on the applied corrosion period. For example, analysis “t95_M-H-L” provides information on the combined effect of 95 years of chloride-induced corrosion, considering the median value of , the higher one of and the lower one of , after the application of permanent loads in interval 1.
5. Results and Discussion
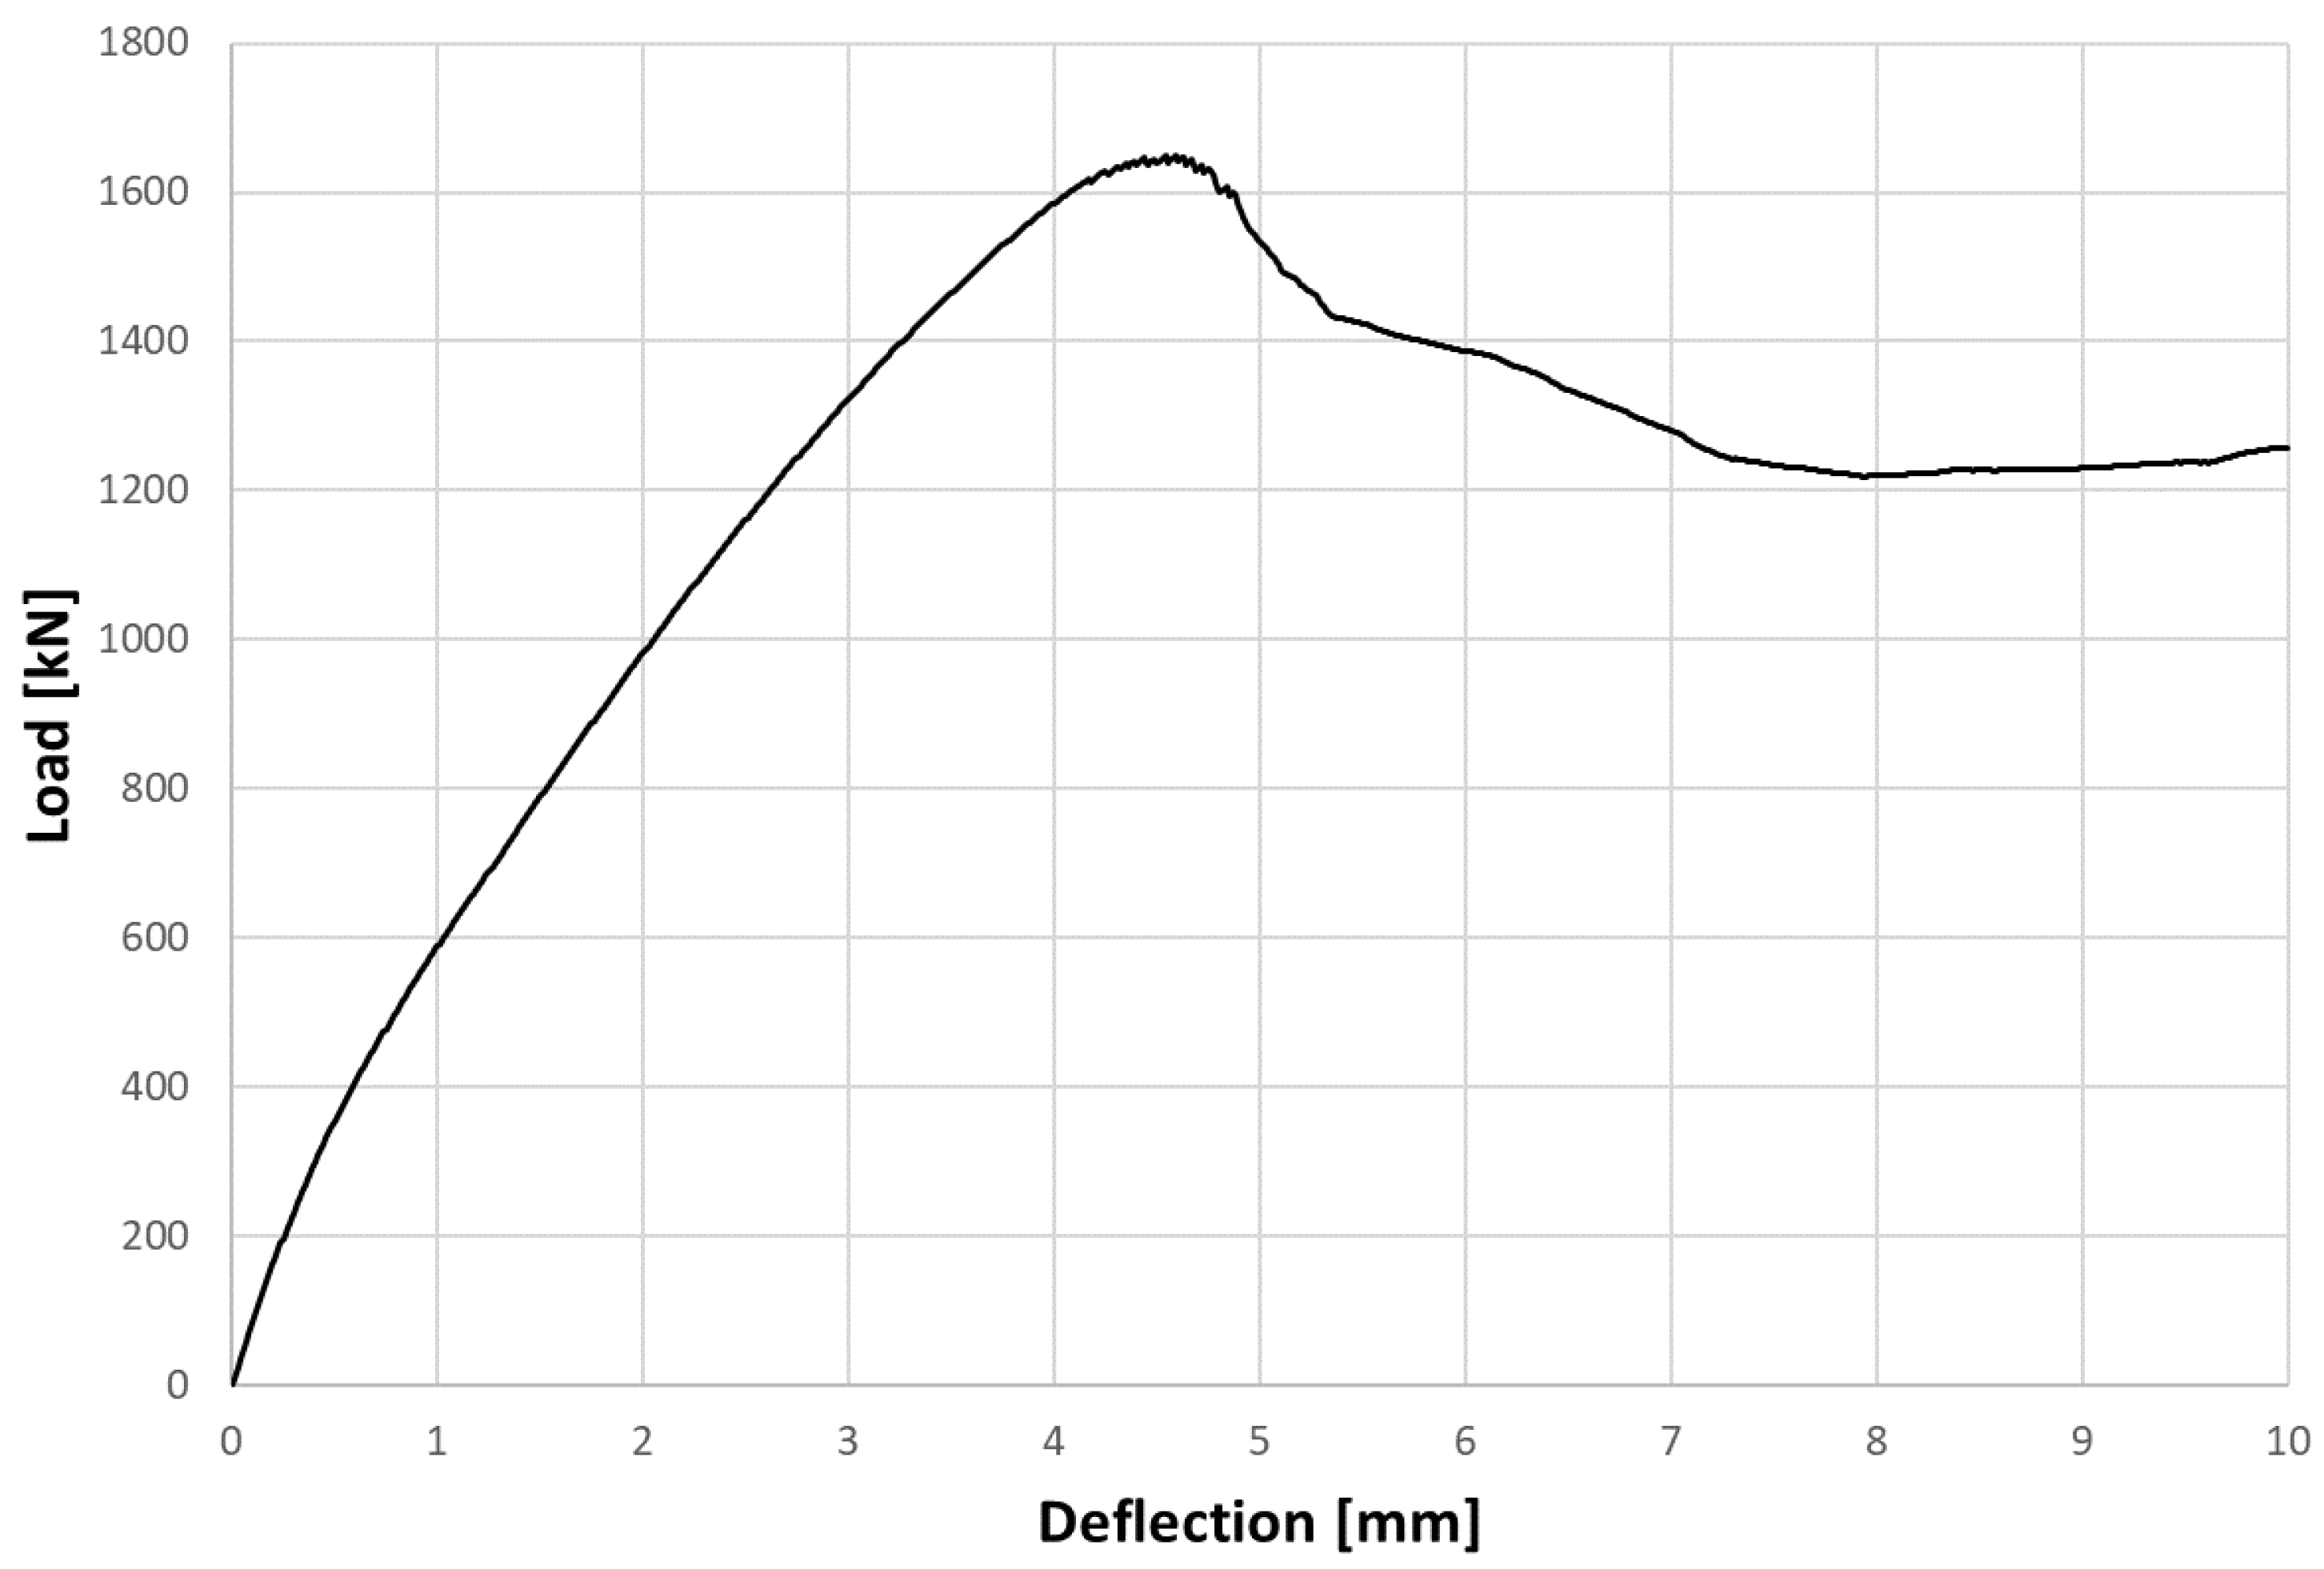
The saddle’s qualitative response is shown in Figure 12 with reference to analysis “t0”, in the absence of permanent loads and corrosion. As expected, the behaviour of such a type of element does not show a significant ductility, and collapse modalities are similar to those observed in other experimental research [21]. The peak load is equal to 1648 kN achieved at a deflection value of 4.6 mm (Figure 12). Then, a load drop leads the saddle capacity to about 1200 kN, at a deflection of about 8 mm, with a loss of 25%, meaning that the structural element is practically collapsed.
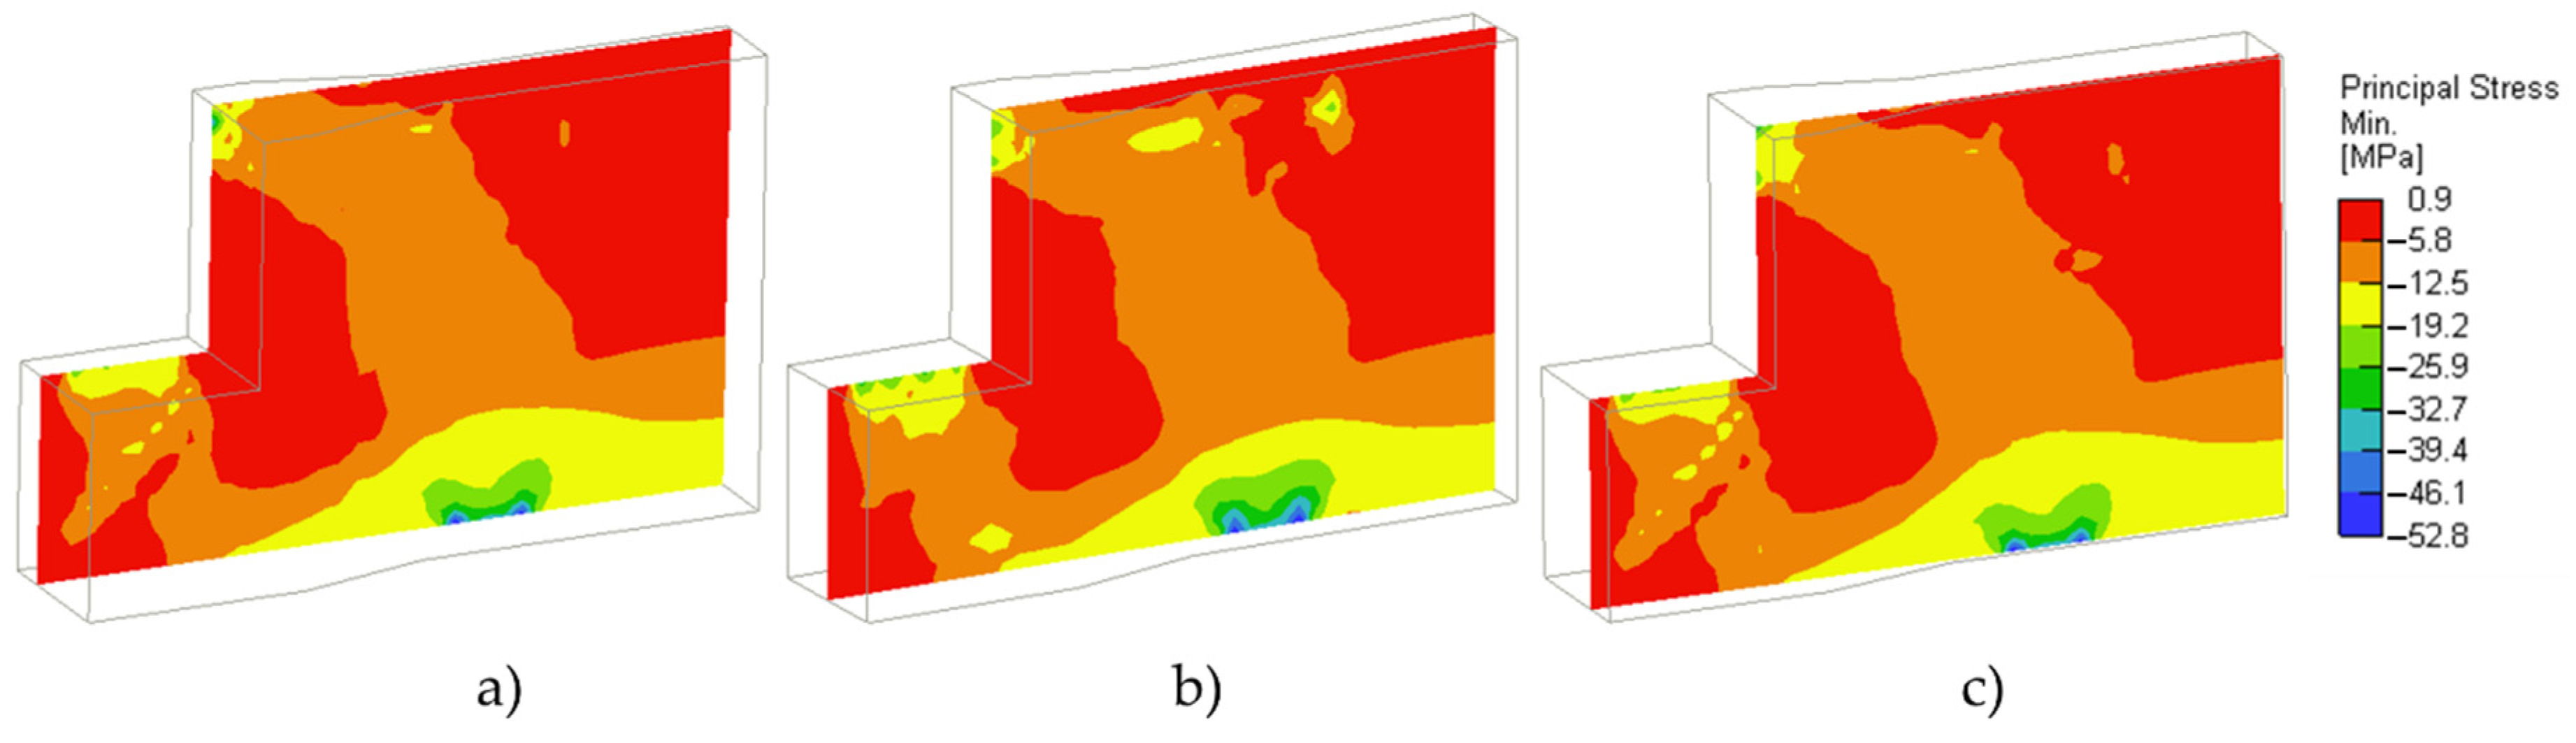
Analysis of principal stresses at peak load shows the saddle’s pronounced three-dimensional behaviour due to the variable width of the connection between corbel and girder. The latter is proved by the fact that an evident compression strut formed inside the corbel is subjected to higher stresses upon a section plane cutting the corbel at the centre (Figure 13b), while stress values decrease in section planes near to the sides, as shown in Figure 13a,c. This 3D effect cannot be considered when assessing this type of element with plane-stress approaches such as those based on strut-and-tie methods [44], highlighting the importance of 3D simulations.
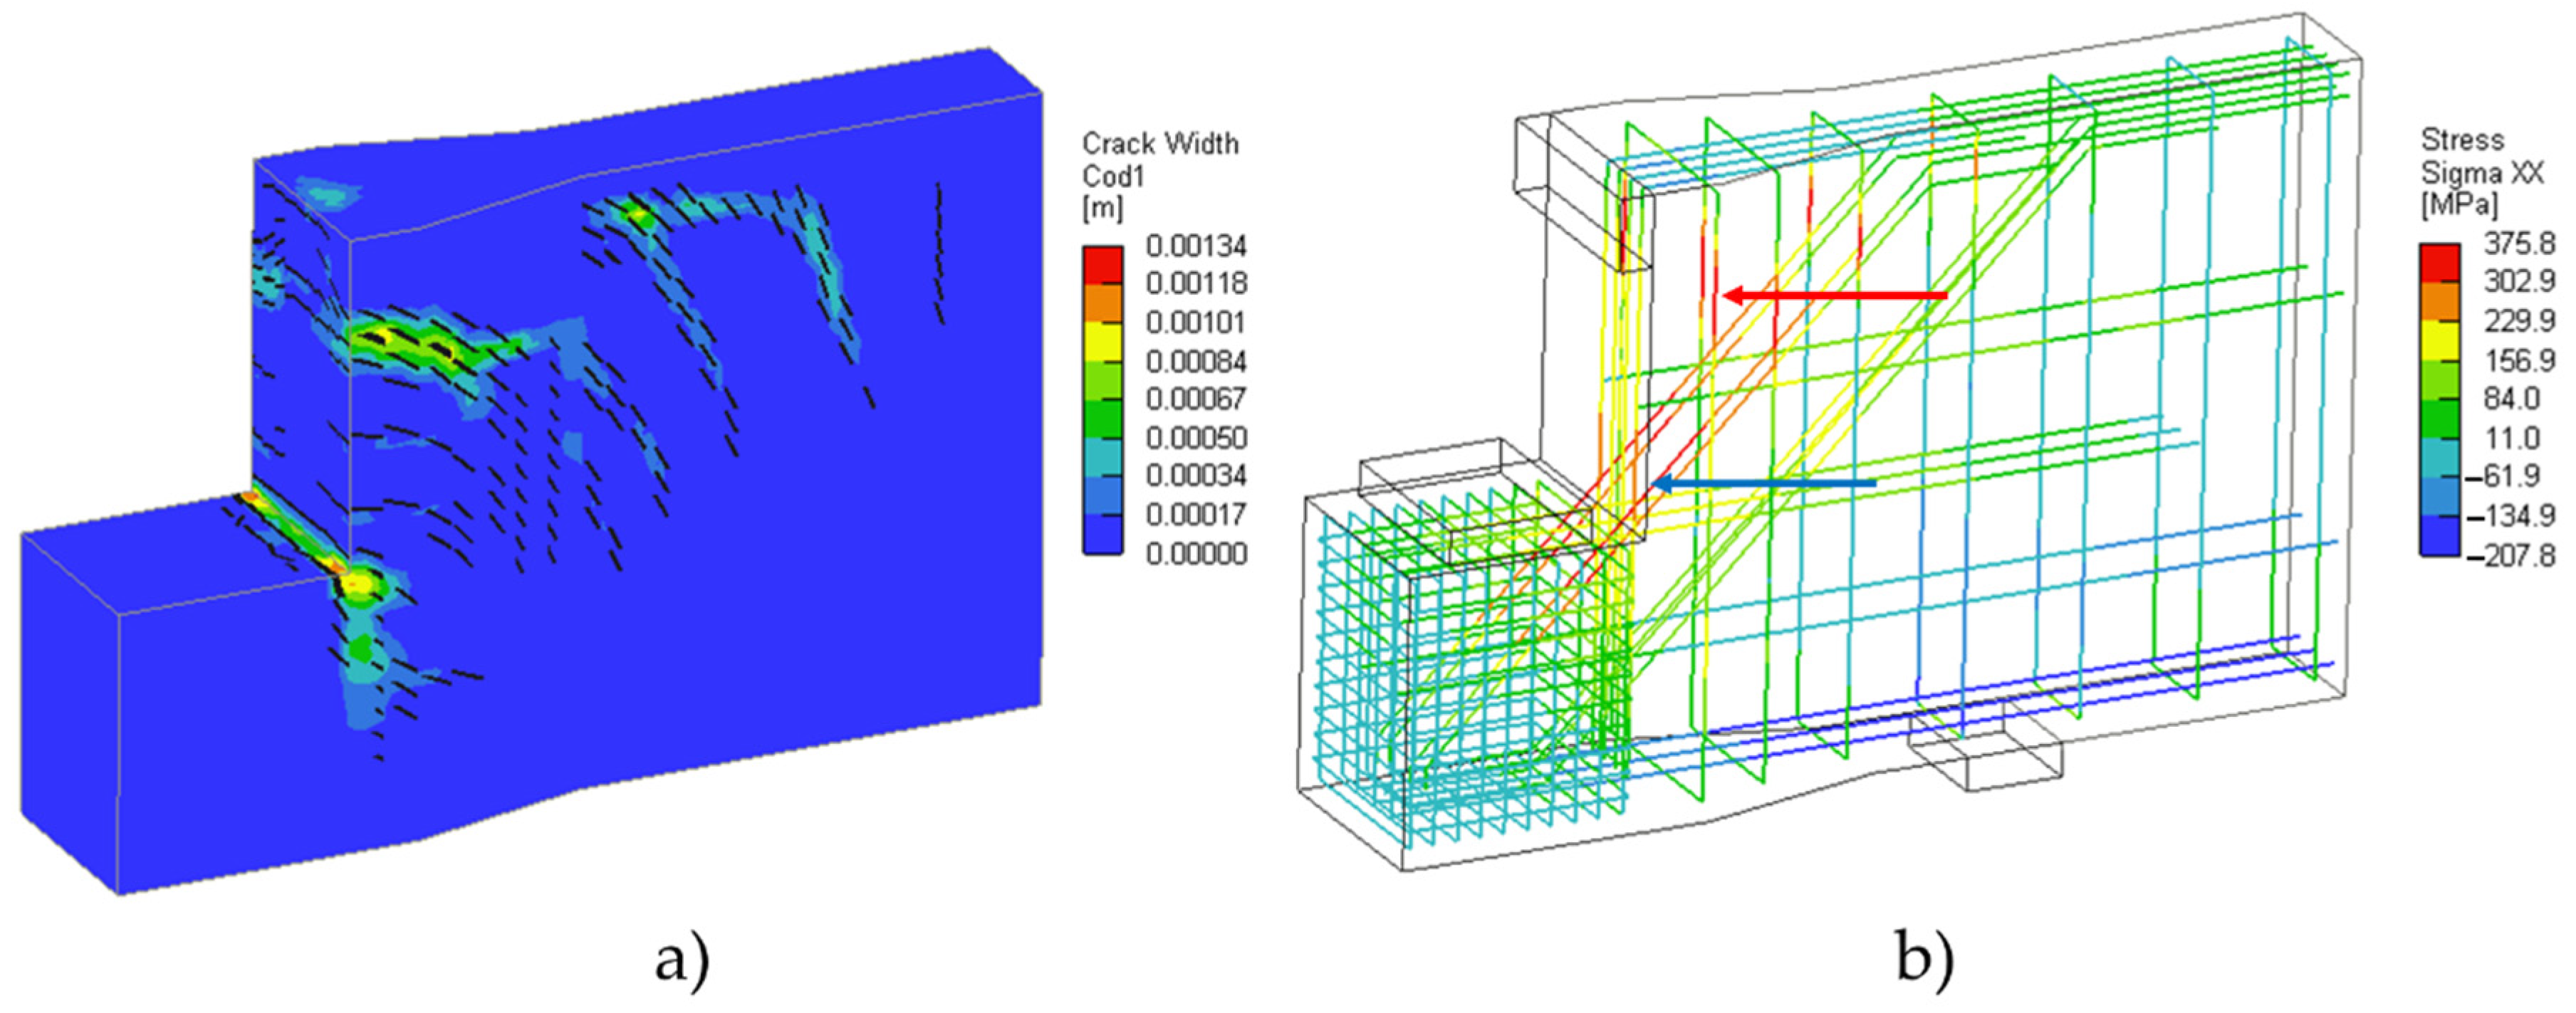
The damage pattern at peak load is represented by inclined cracks in the saddle’s upper part and cracks at the interface between the corbel and the saddle’s remaining part (Figure 14a). In that region, the maximum estimated crack width is about 1.3 mm, while in the upper part it is 0.8 mm.
The saddle behaviour is mainly influenced by concrete since, as shown in Figure 14b, the maximum stress in reinforcement is almost always less than the yielding value, fy = 375 MPa. In fact, the stress exceeds yielding only in the vertical stirrups located in the connection zone (red arrow, 375.8 MPa). Inclined rebars have stress values around 363 MPa (blue arrow).
Analyses with the combined effect of permanent loads and corrosion show a different reduction in the saddle load-bearing capacity that depends on the combination of durability parameters considered, showing a higher loss of resistance when high values of and and low values of are taken into account.
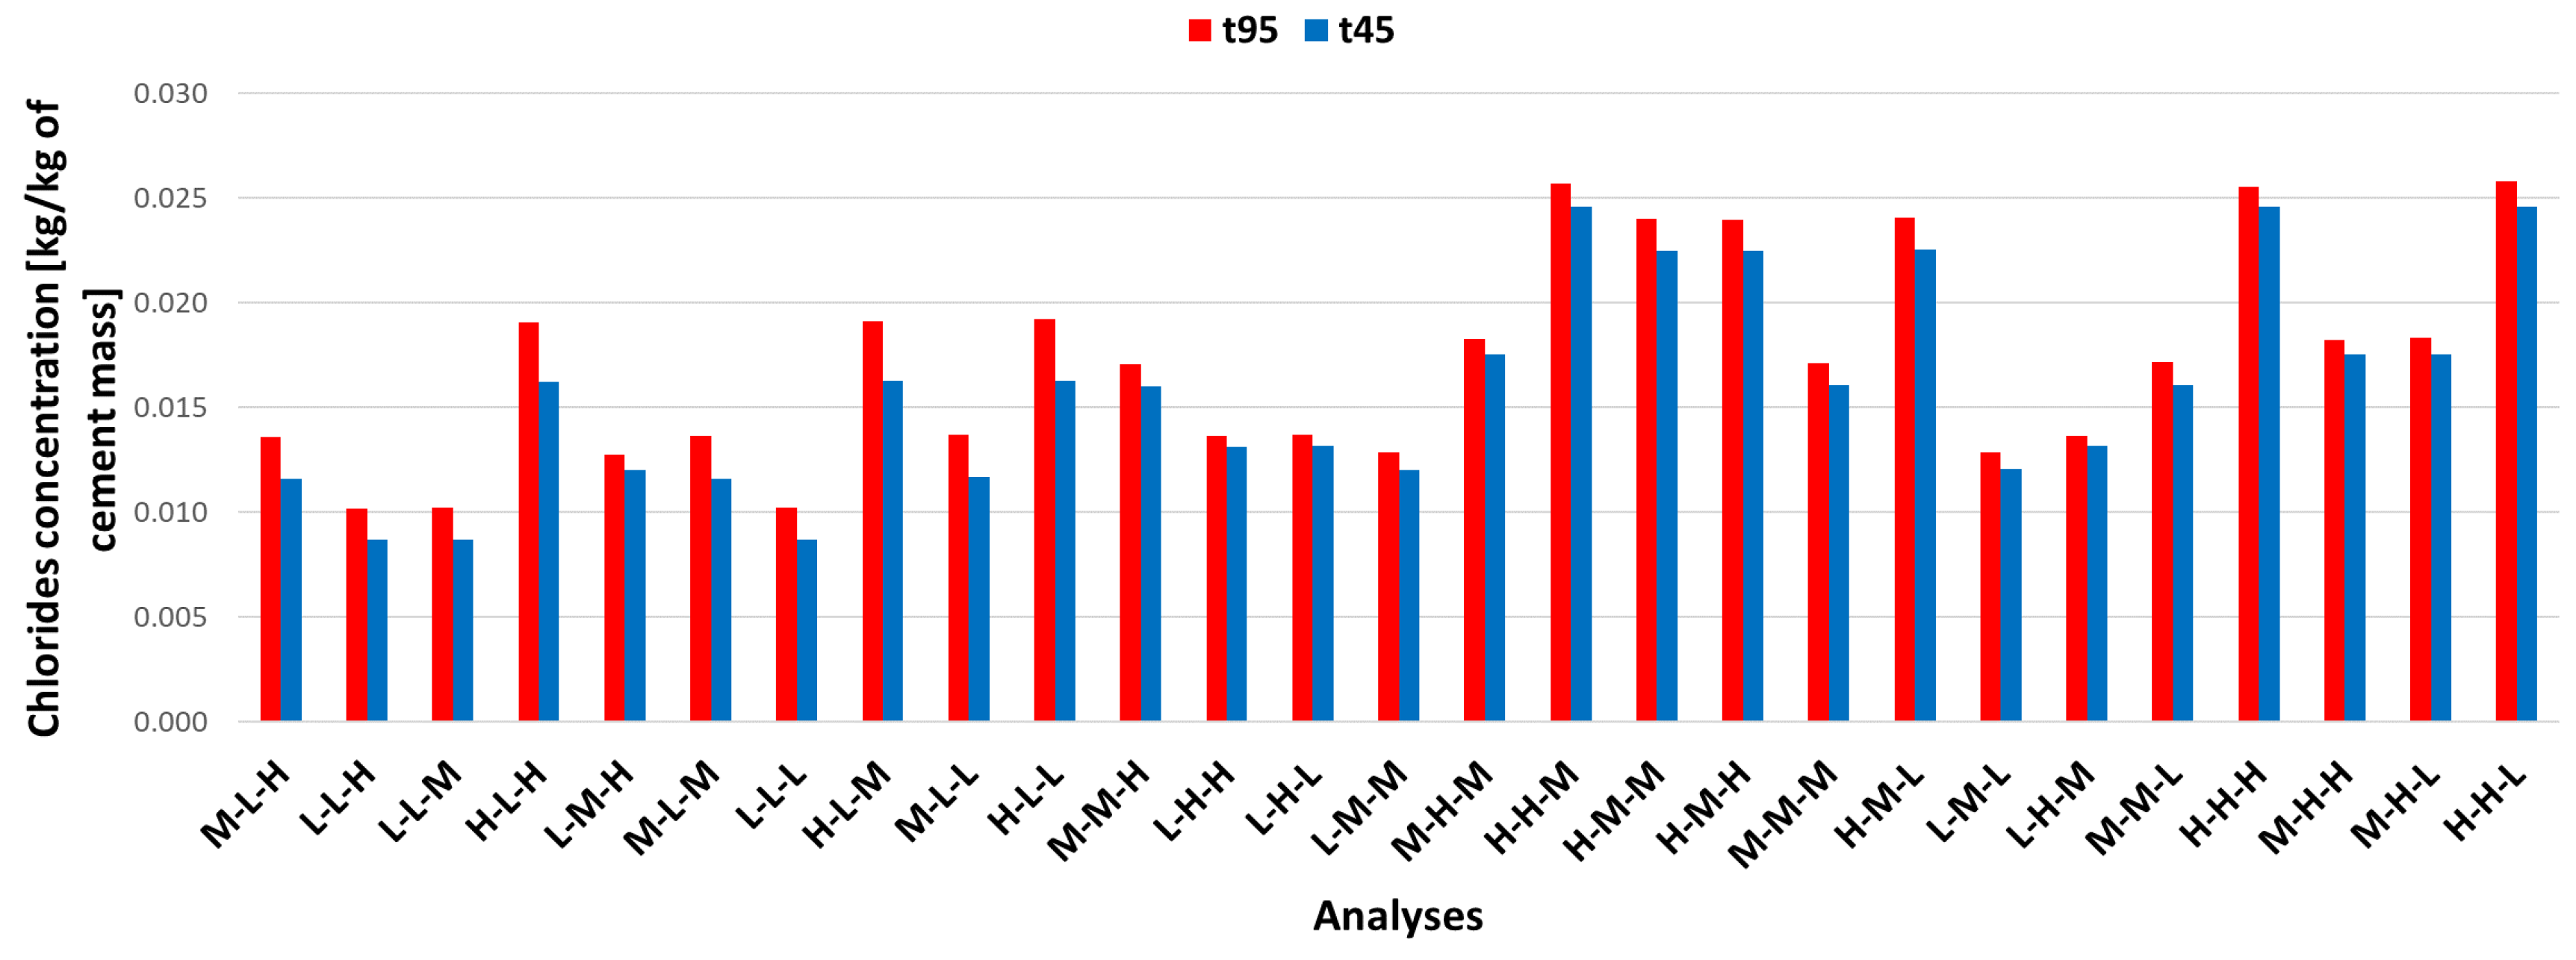
Different combinations of the three parameters also affect the amount of chloride presence inside concrete at a reference depth of 2 cm from the external surface. Figure 15 shows the amount of the detected chlorides according to the different analyses at 45 and at 95 years. As can be seen, analyses at 95 years, being subjected to longer chloride exposure, exhibit higher concentrations than analyses at 45 years, thus increasing the amount of reinforcement corrosion.
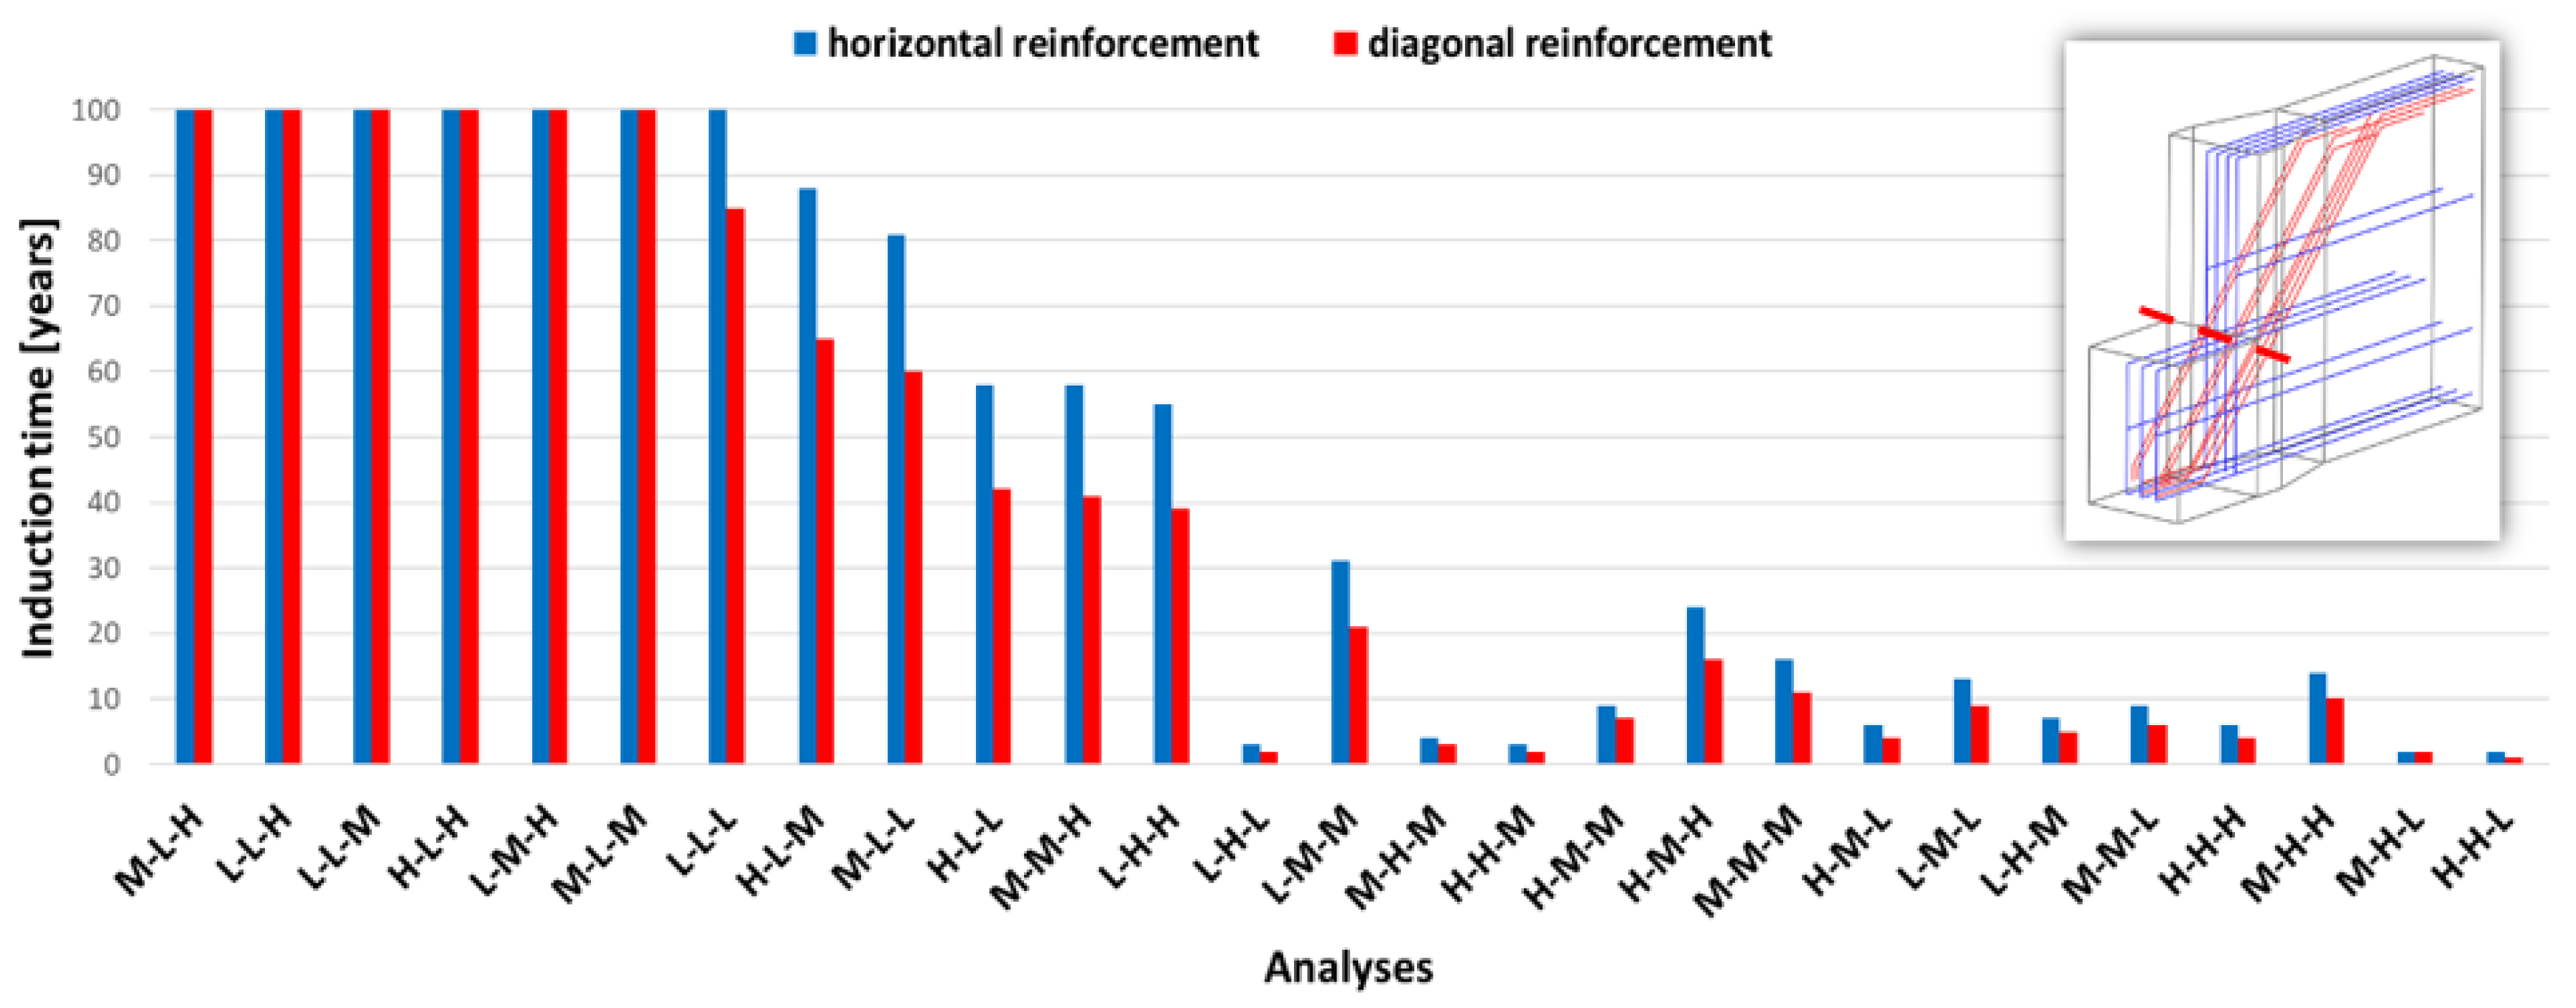
Further monitored data are the number of years necessary to exceed critical chloride concentration, , to start corrosion, namely the induction time, referred to diagonal and horizontal reinforcement. Figure 16 shows that for some combinations of durability parameters, even after 95 years of corrosion, no reinforcement corrosion is triggered. For these analyses, an initiation period of 100 years (i.e., >95 years) was indicated. On the contrary, other analyses exhibit a very low induction time due to high chloride attack and low values of the critical threshold.
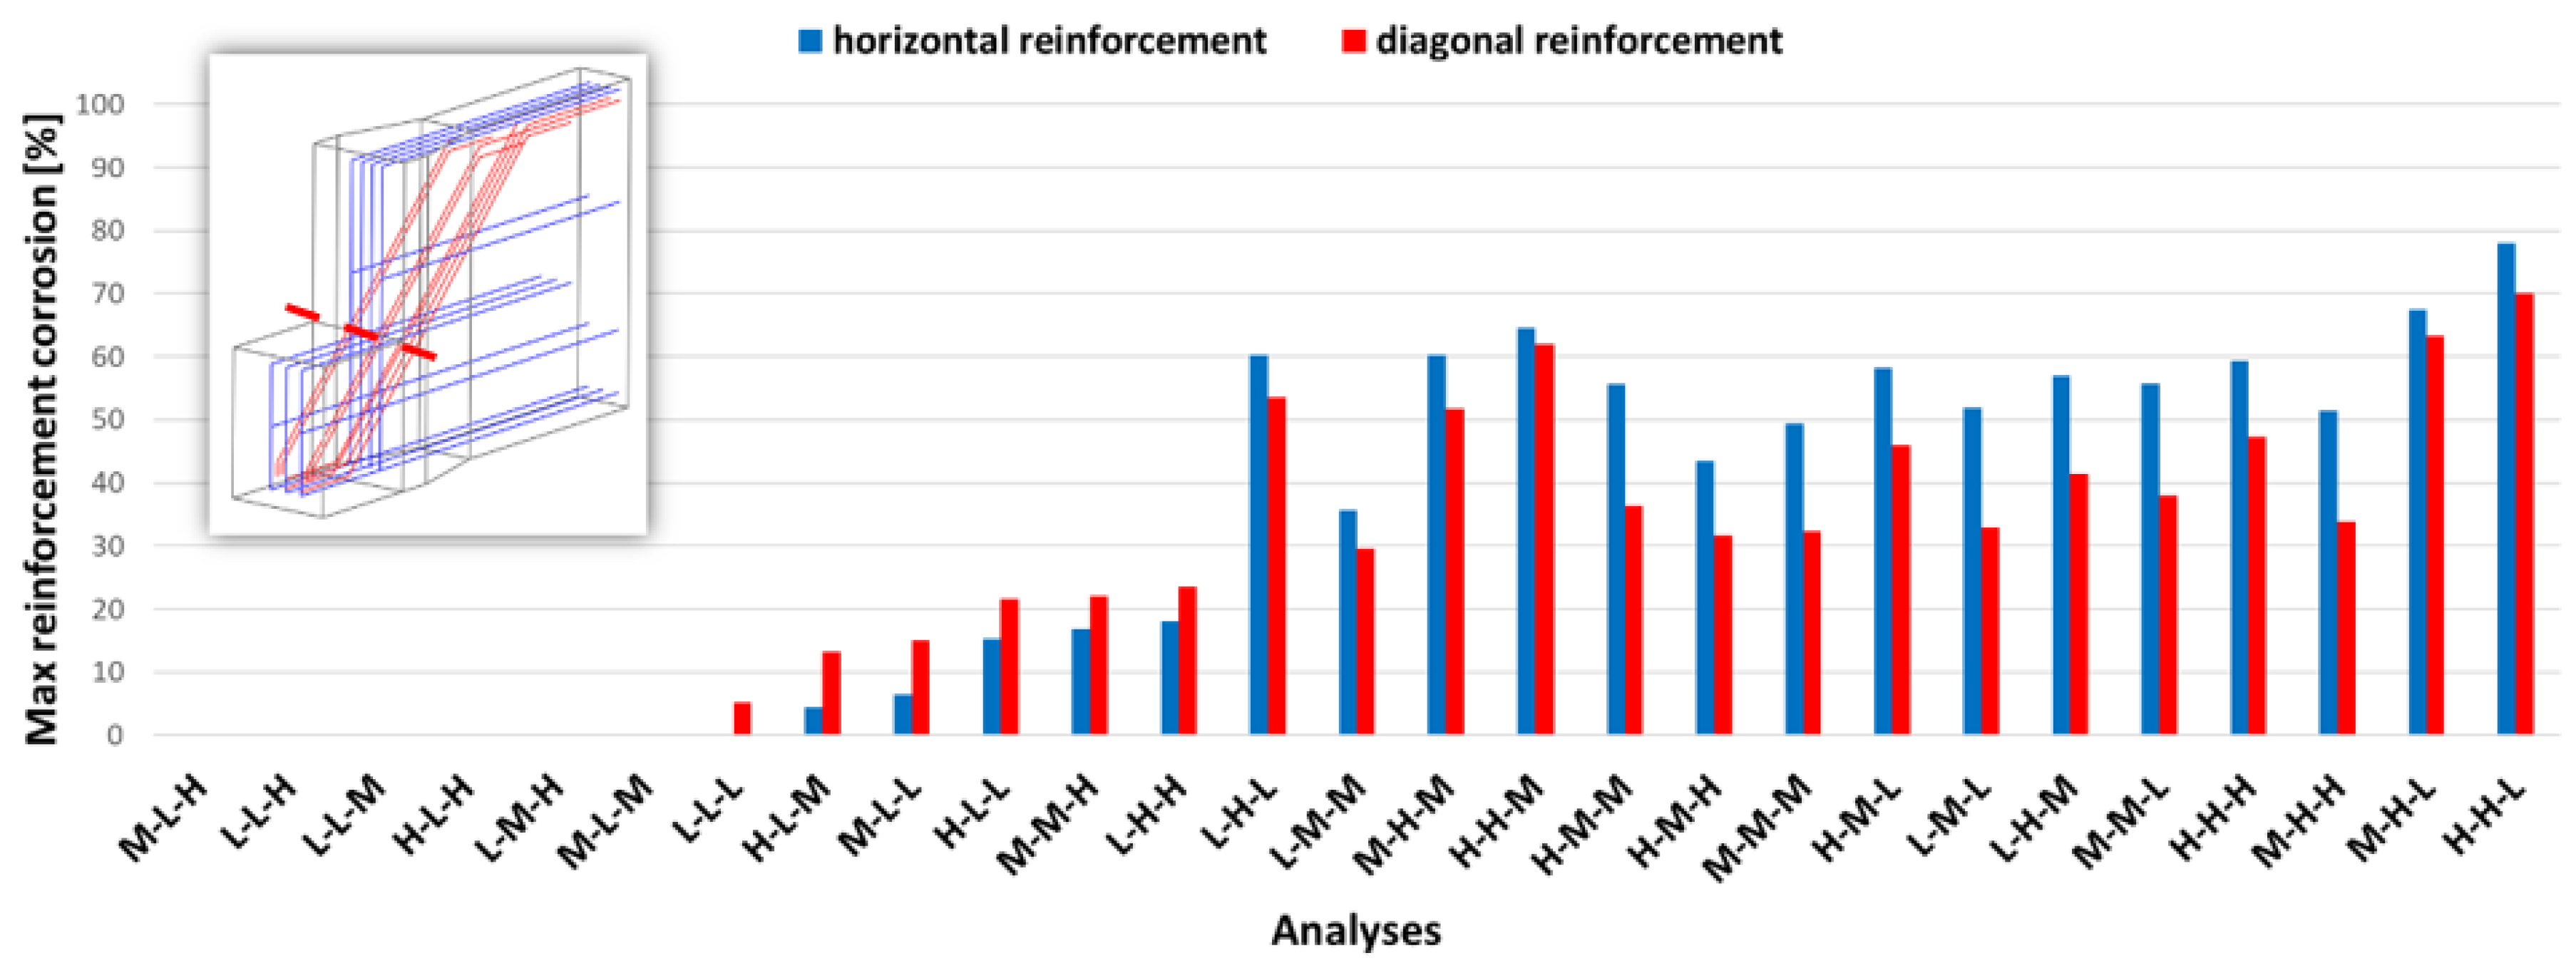
Figure 17 shows the maximum values of diagonal and horizontal reinforcement corrosion for t95 (t45 are negligible), confirming that the higher ones are obtained from the same analyses causing high values of chloride concentration and low values of induction time. Combinations with induction time larger than the corrosion period yield an absence of reinforcement corrosion. Further, horizontal reinforcement is subjected to higher corrosion, although it has a longer induction time. In fact, most of the horizontal rebars are parallel to the concrete surface from which chlorides enter. Diagonal rebars have a minimum distance from the concrete surface smaller than horizontal ones (corner between corbel horizontal surface and the vertical one, i.e., the red dashed line in schemes of Figure 16 and Figure 17) and for this reason, their induction time is smaller. The remaining part of them is rather far from the concrete surface, and therefore, corrosion propagation is slower.
It is worth noting that the choice of corrosion parameters in the absence of experimental data has paramount importance. The key role of critical chloride content is evident since, for example, corrosion for combination H-H-L is almost double compared to H-H-H. Therefore, in the case of an aggressive environment (i.e., a high value of ), the characterization of through suitable and reliable methods is important. Among these methods, the one proposed by Angst et al. (2016) [36], based on drilling concrete cores containing rebars not yet corroded and exposing them to chlorides in a laboratory to monitor corrosion initiation, is applicable.
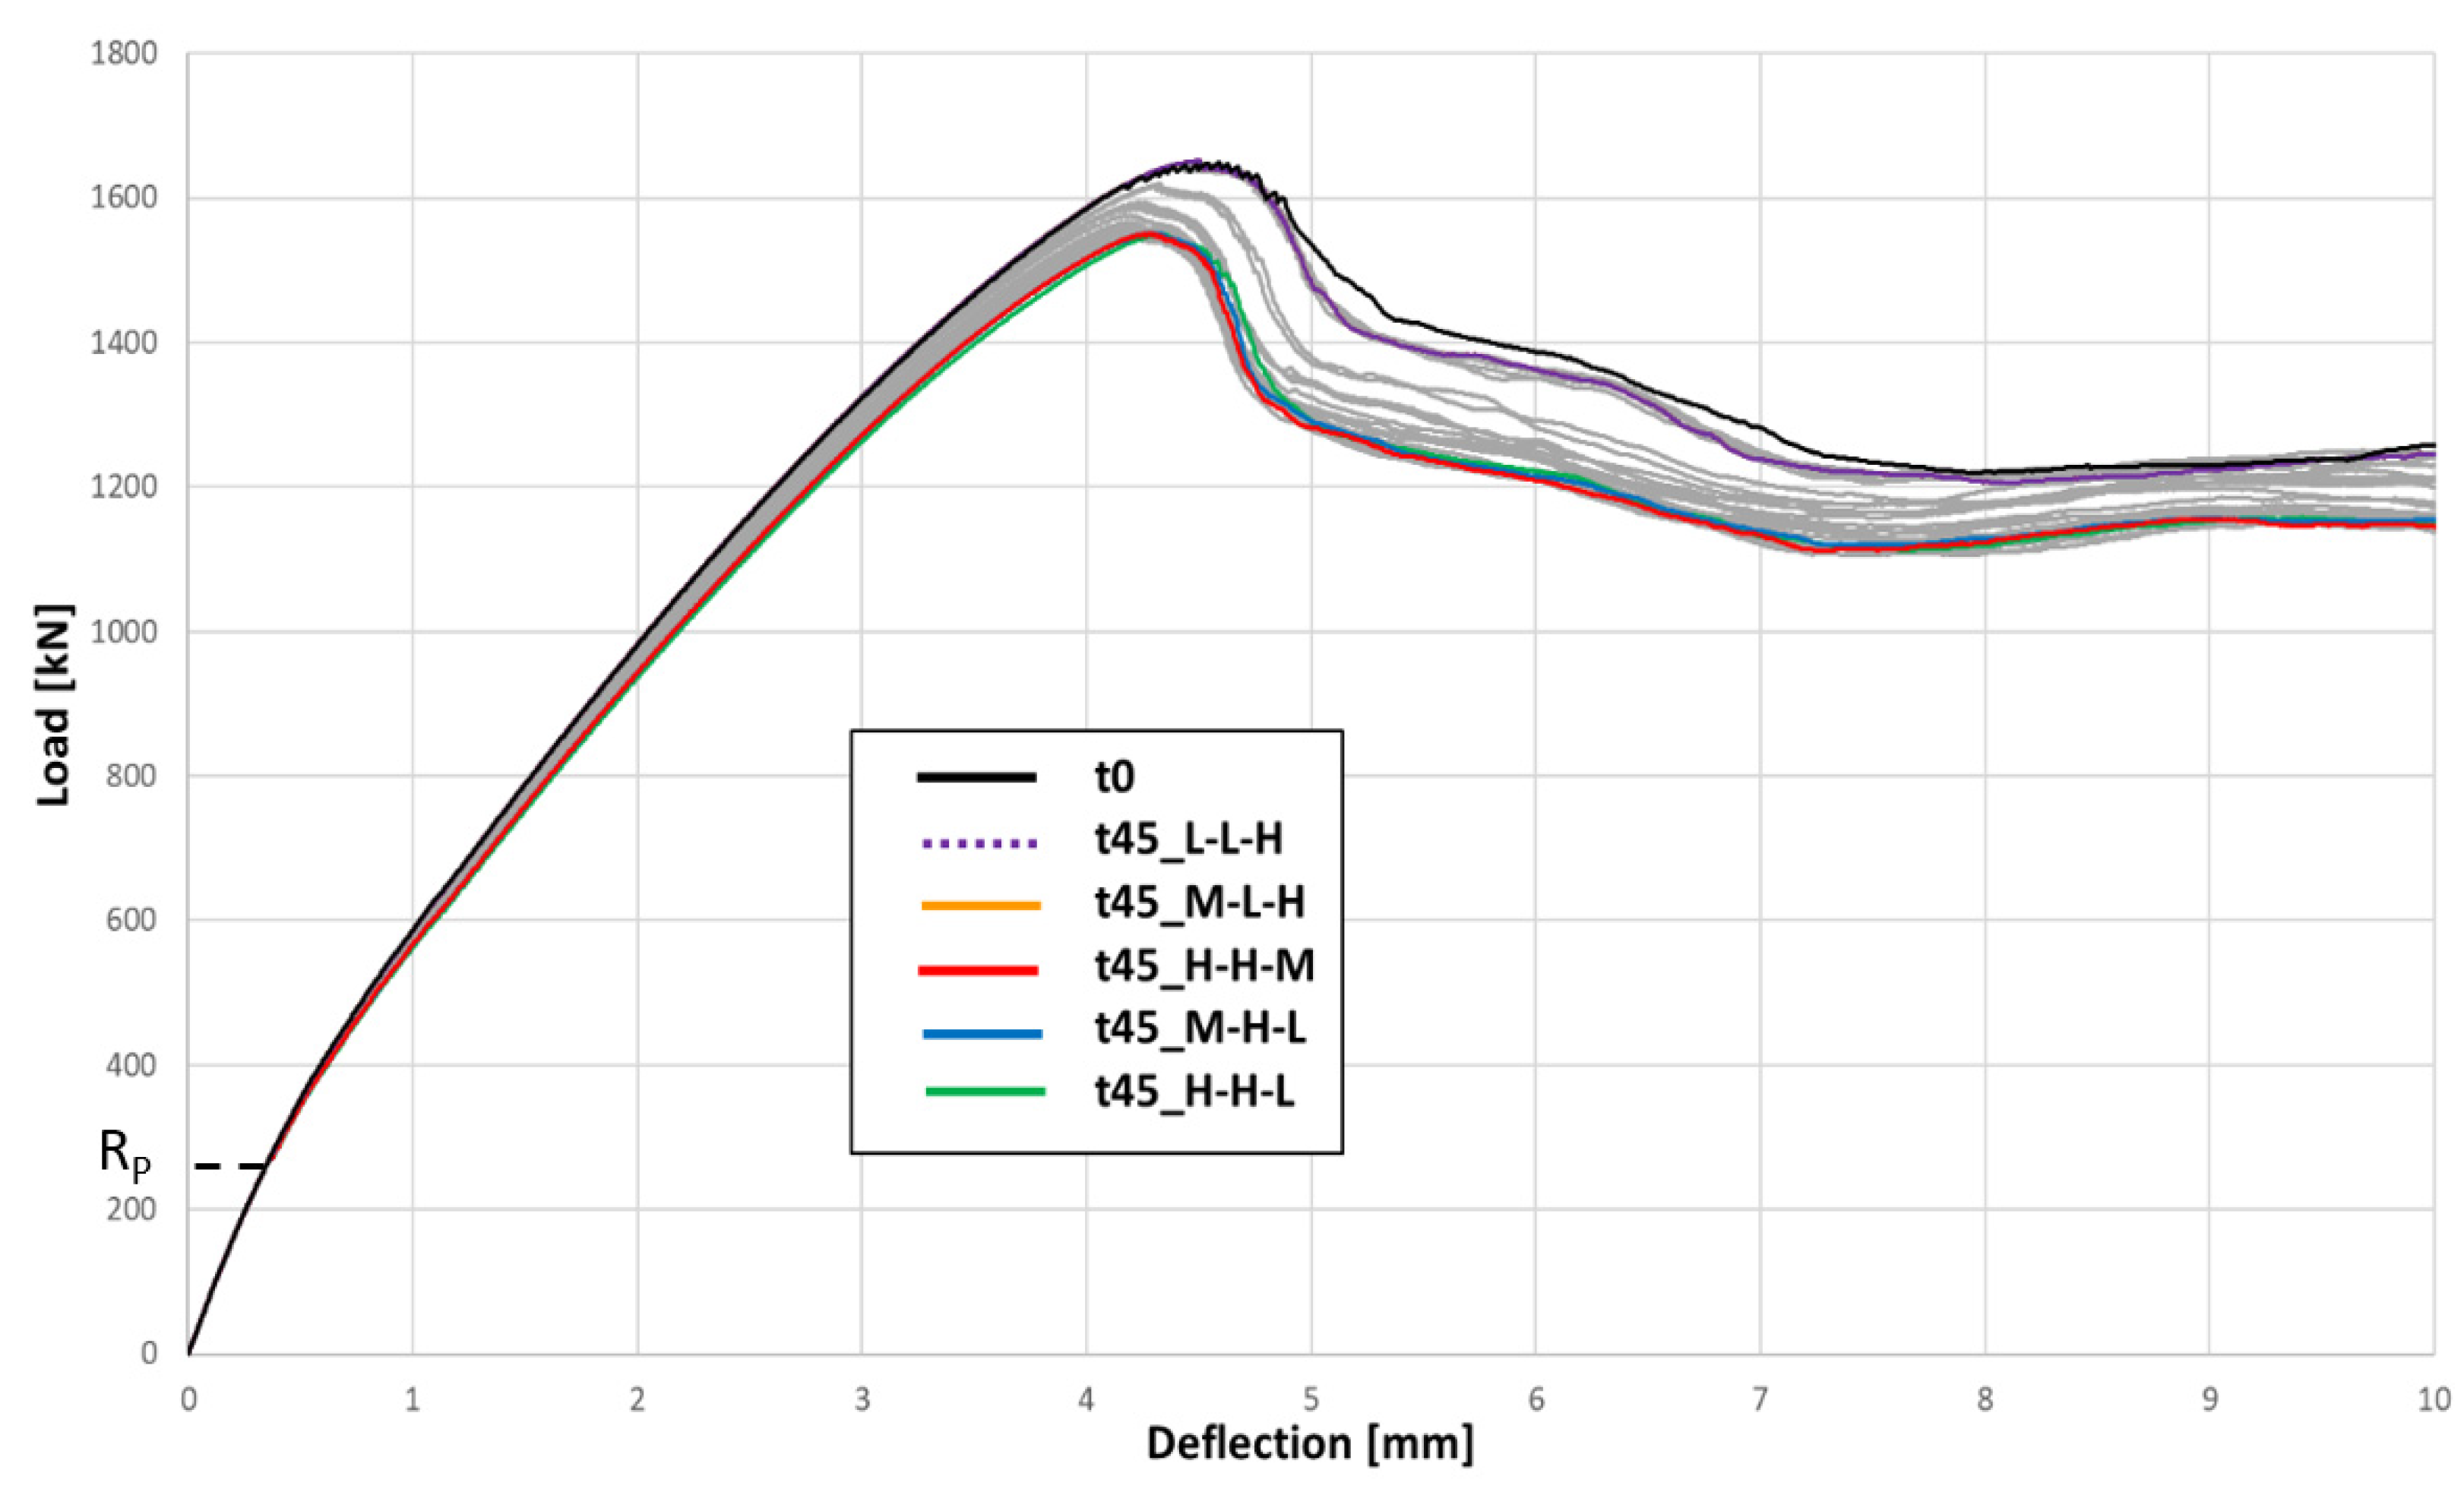
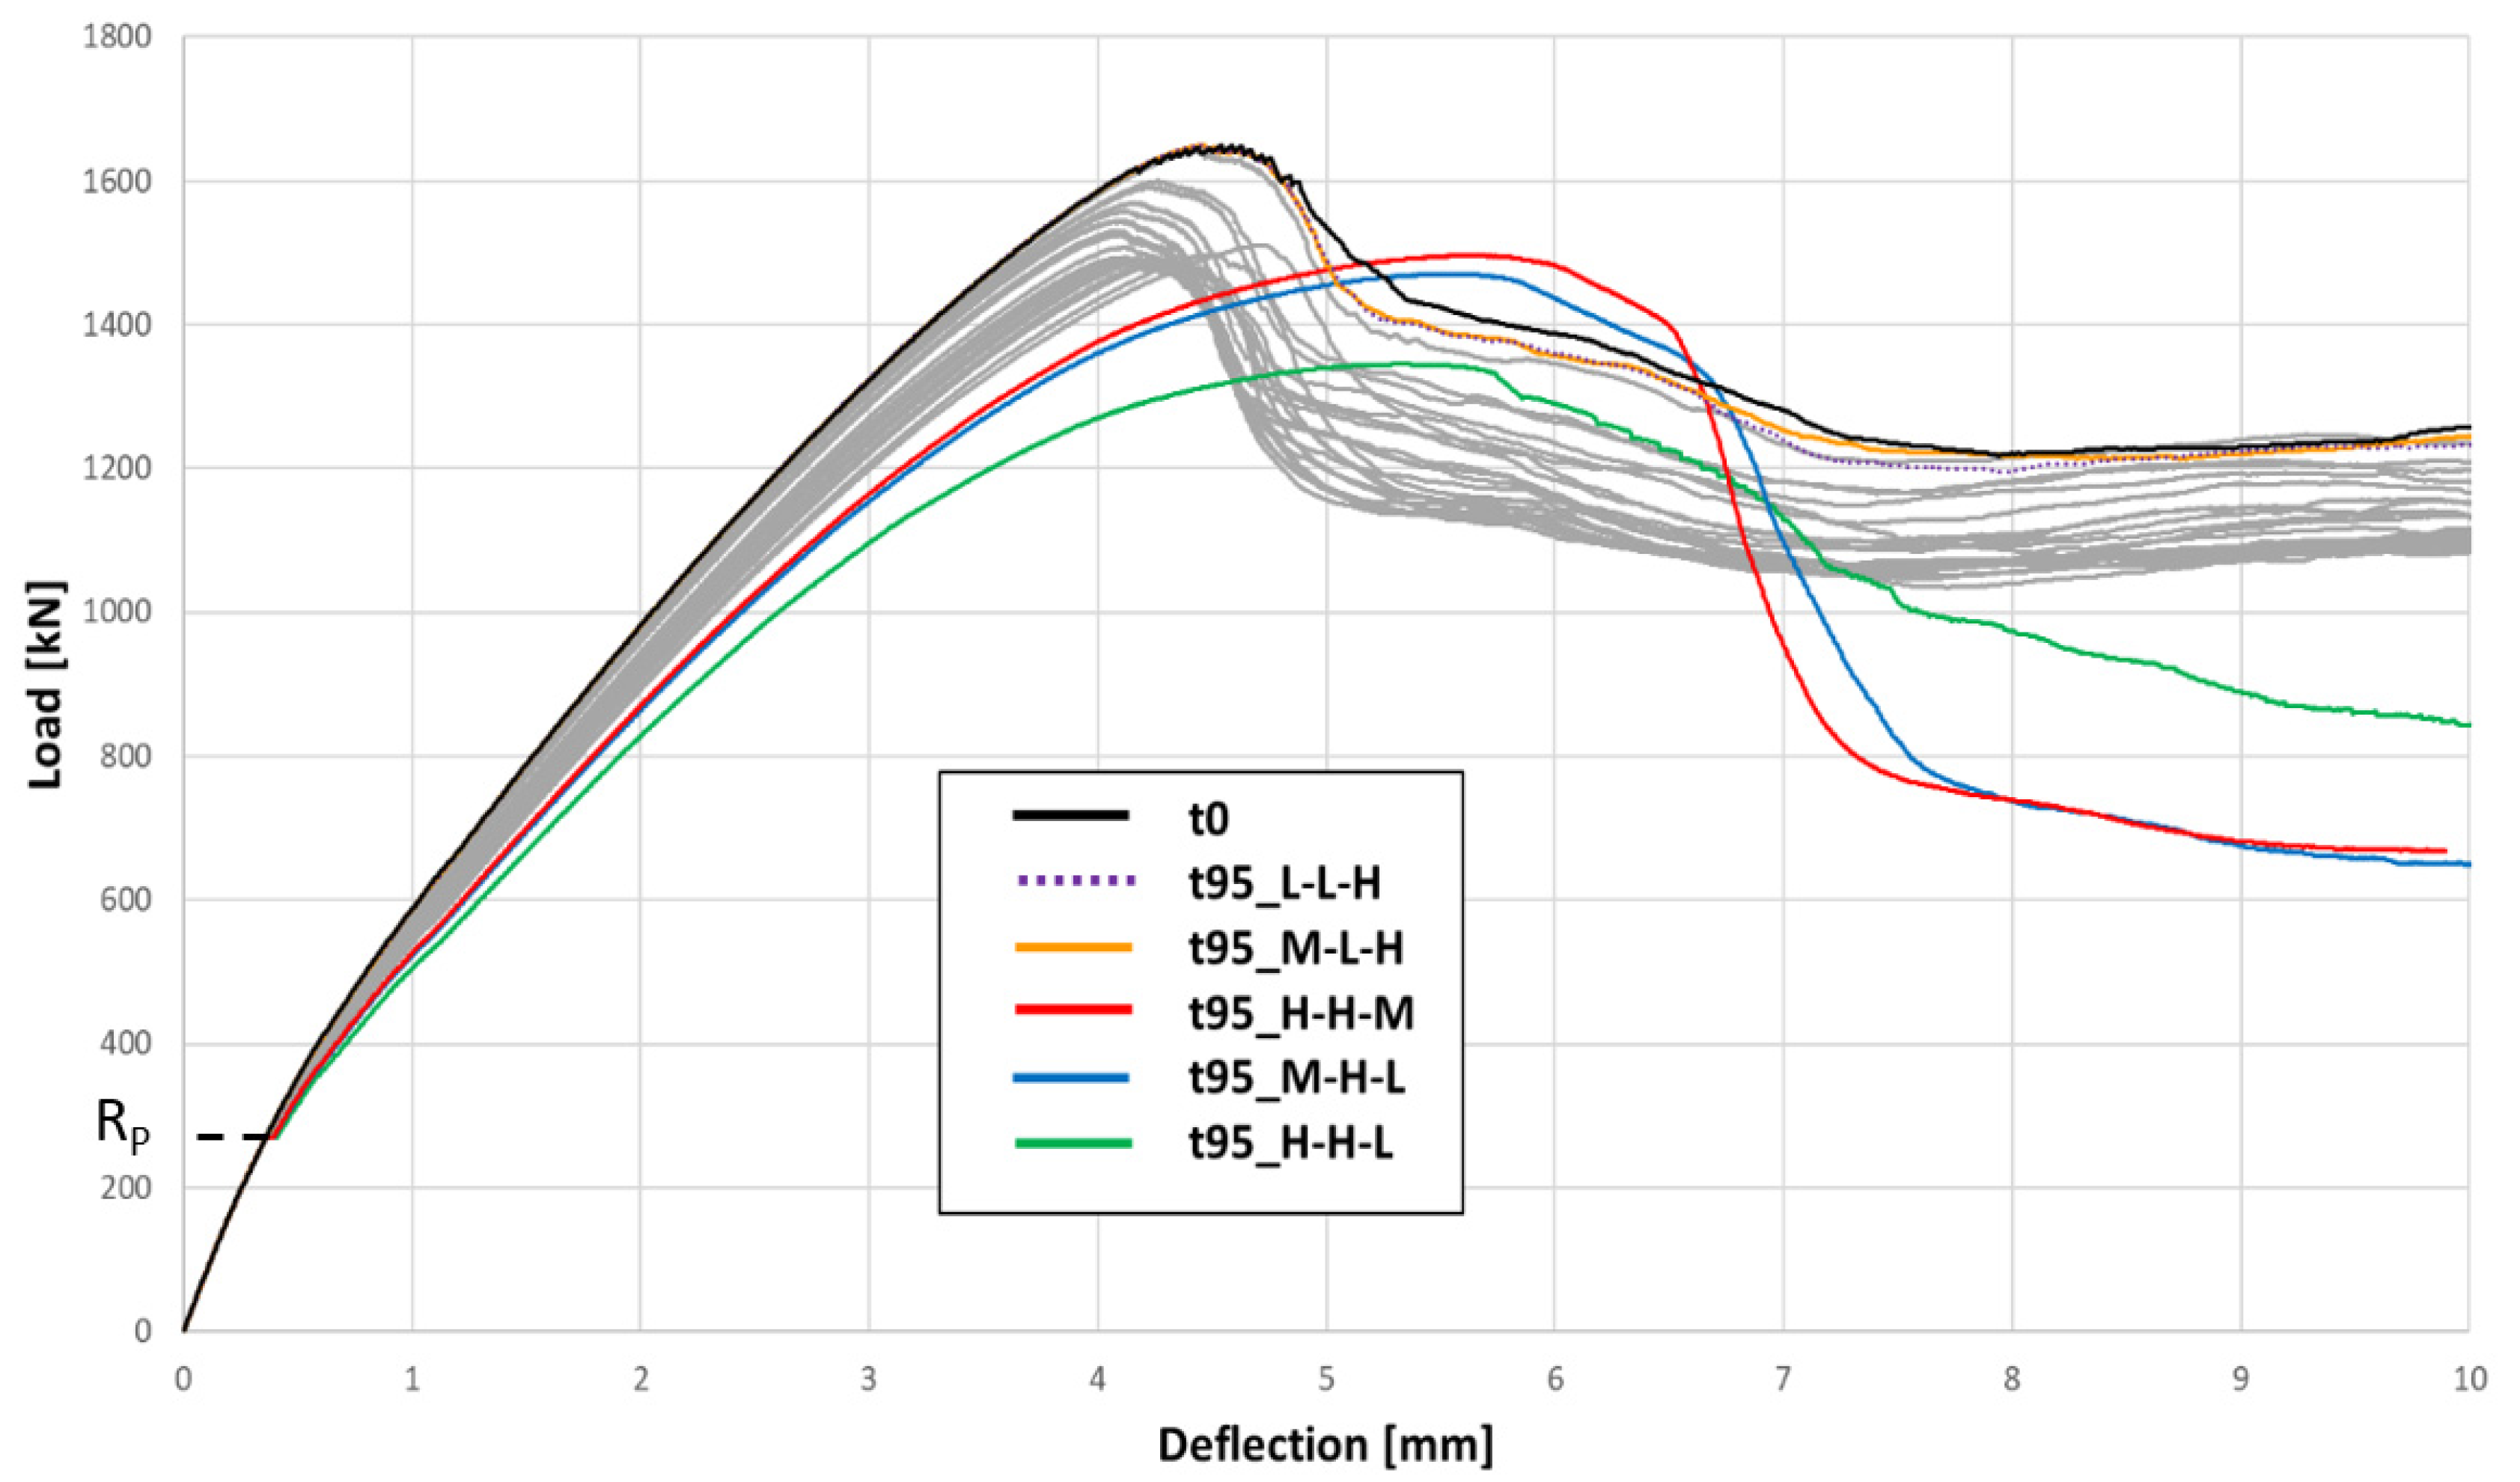
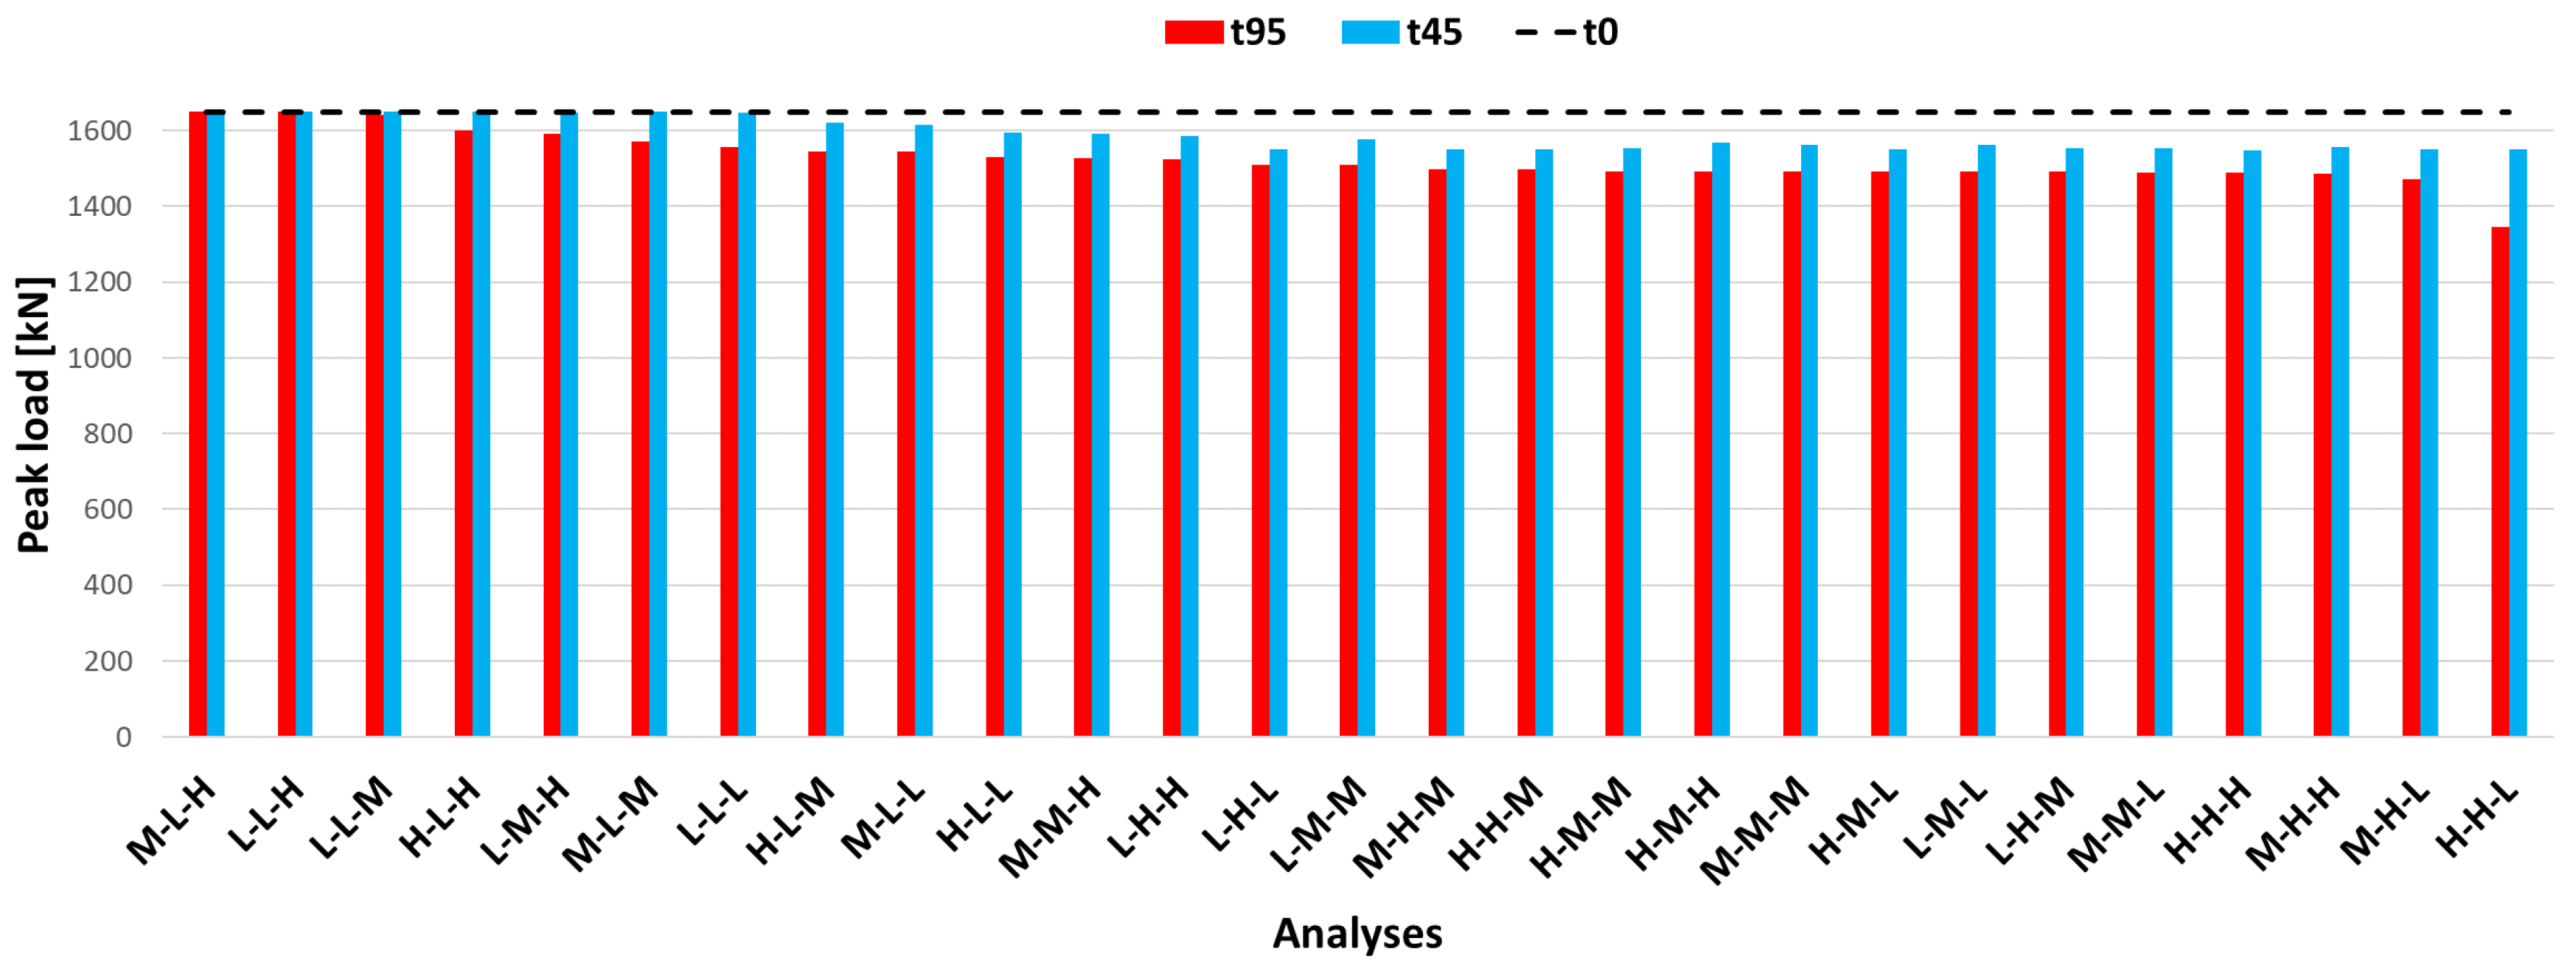
Figure 18 and Figure 19 show the envelope of load-displacement curves of t45 and t95 analyses, respectively, while Figure 20 shows peak load values for the different analyses. In both cases, the load-deflection curve for case t0 is reported to evaluate the loss of strength and behaviour differences due to corrosion. In these graphs, the coloured curves are related to the most (t45_H-H-M, M-H-L, and H-H-L) and the least (L-L-H and M-L-H) severe chloride parameter combinations. It is worth noting that the corrosion effects of these latter do not provide enough corrosion to cause a reduction in the load-bearing capacity of the saddle, even for a corrosion period of 95 years. Other intermediate load-deflection curves are shown in grey.
For t45 analyses, the larger loss of resistance is about 6% with an ultimate load of 1546 kN (compared to 1648 of case t0), while analysis t95 provides a maximum loss of 18% with a minimum strength value of 1344.9 kN.
Especially for t95 analyses, a significant stiffness reduction is observed in load-deflection curves. In fact, for load values higher than the permanent one (RP = 270 kN) corresponding to interval 3, the curves are less steep and, for the most severe chloride parameter combinations, they achieve the peak load for a deflection of about 6 mm instead of 4.5 mm. Moreover, in these cases, the post-peak behaviour is different, showing a faster strength degradation.
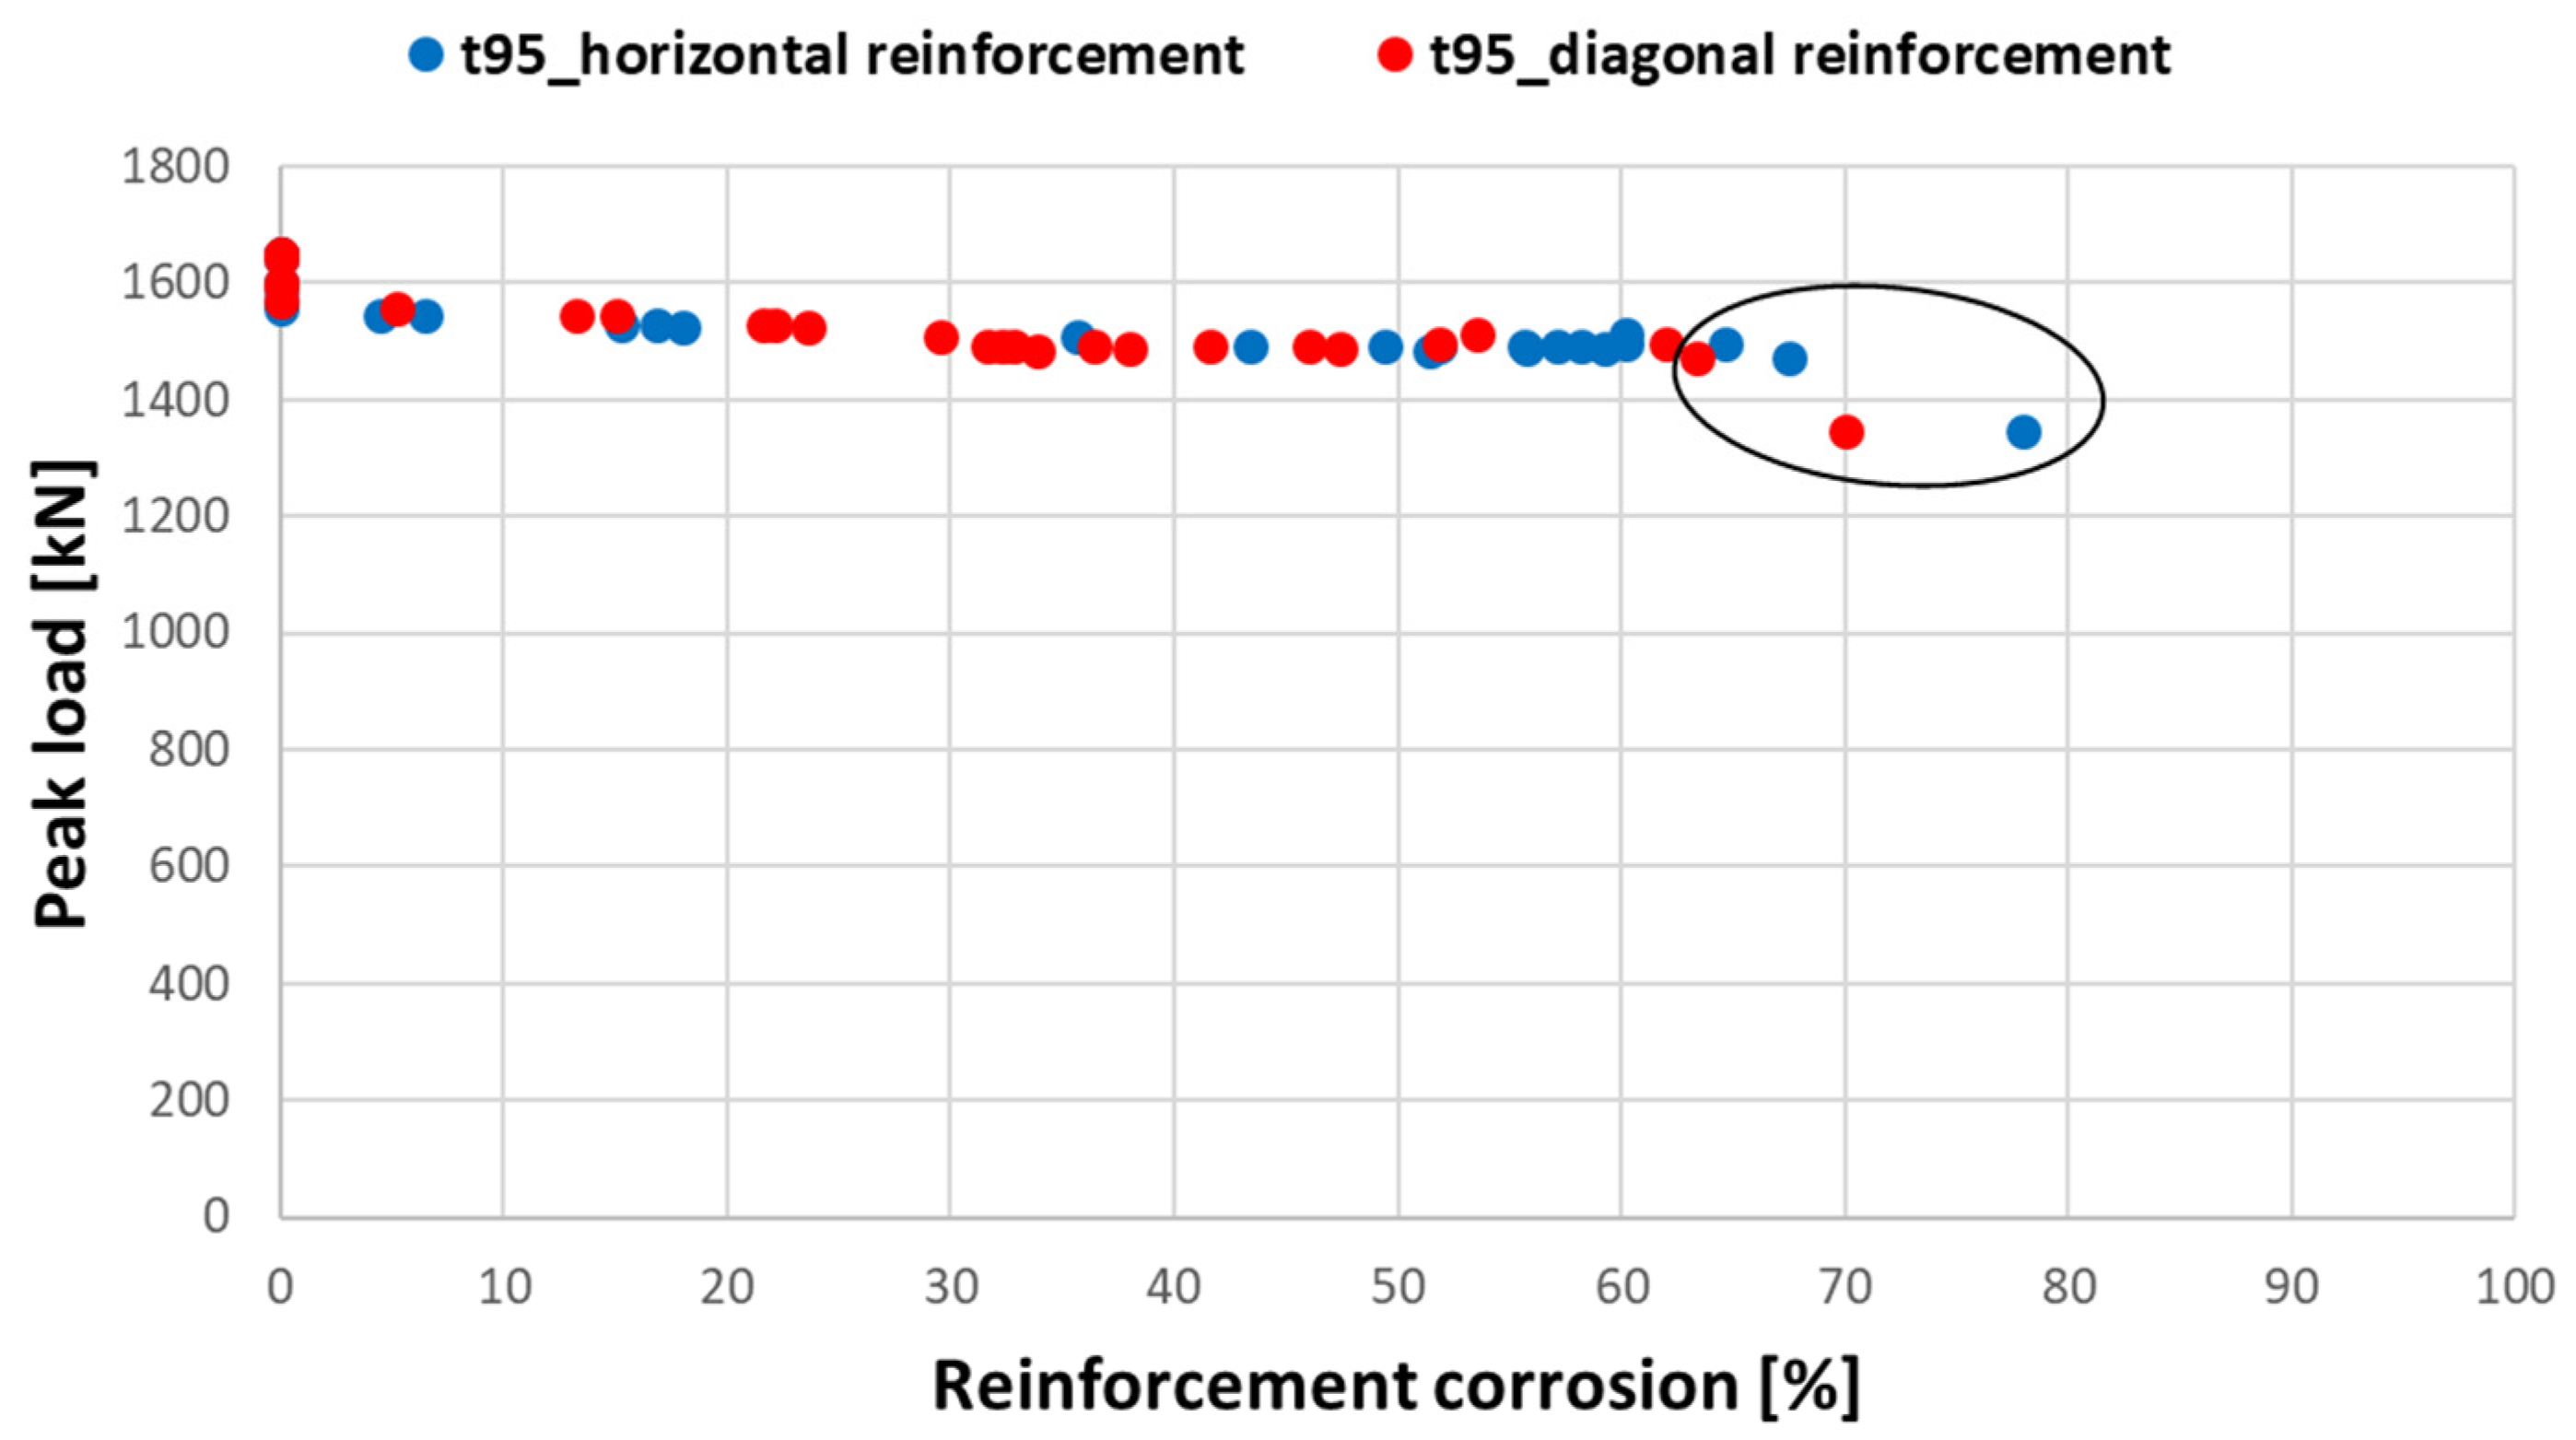
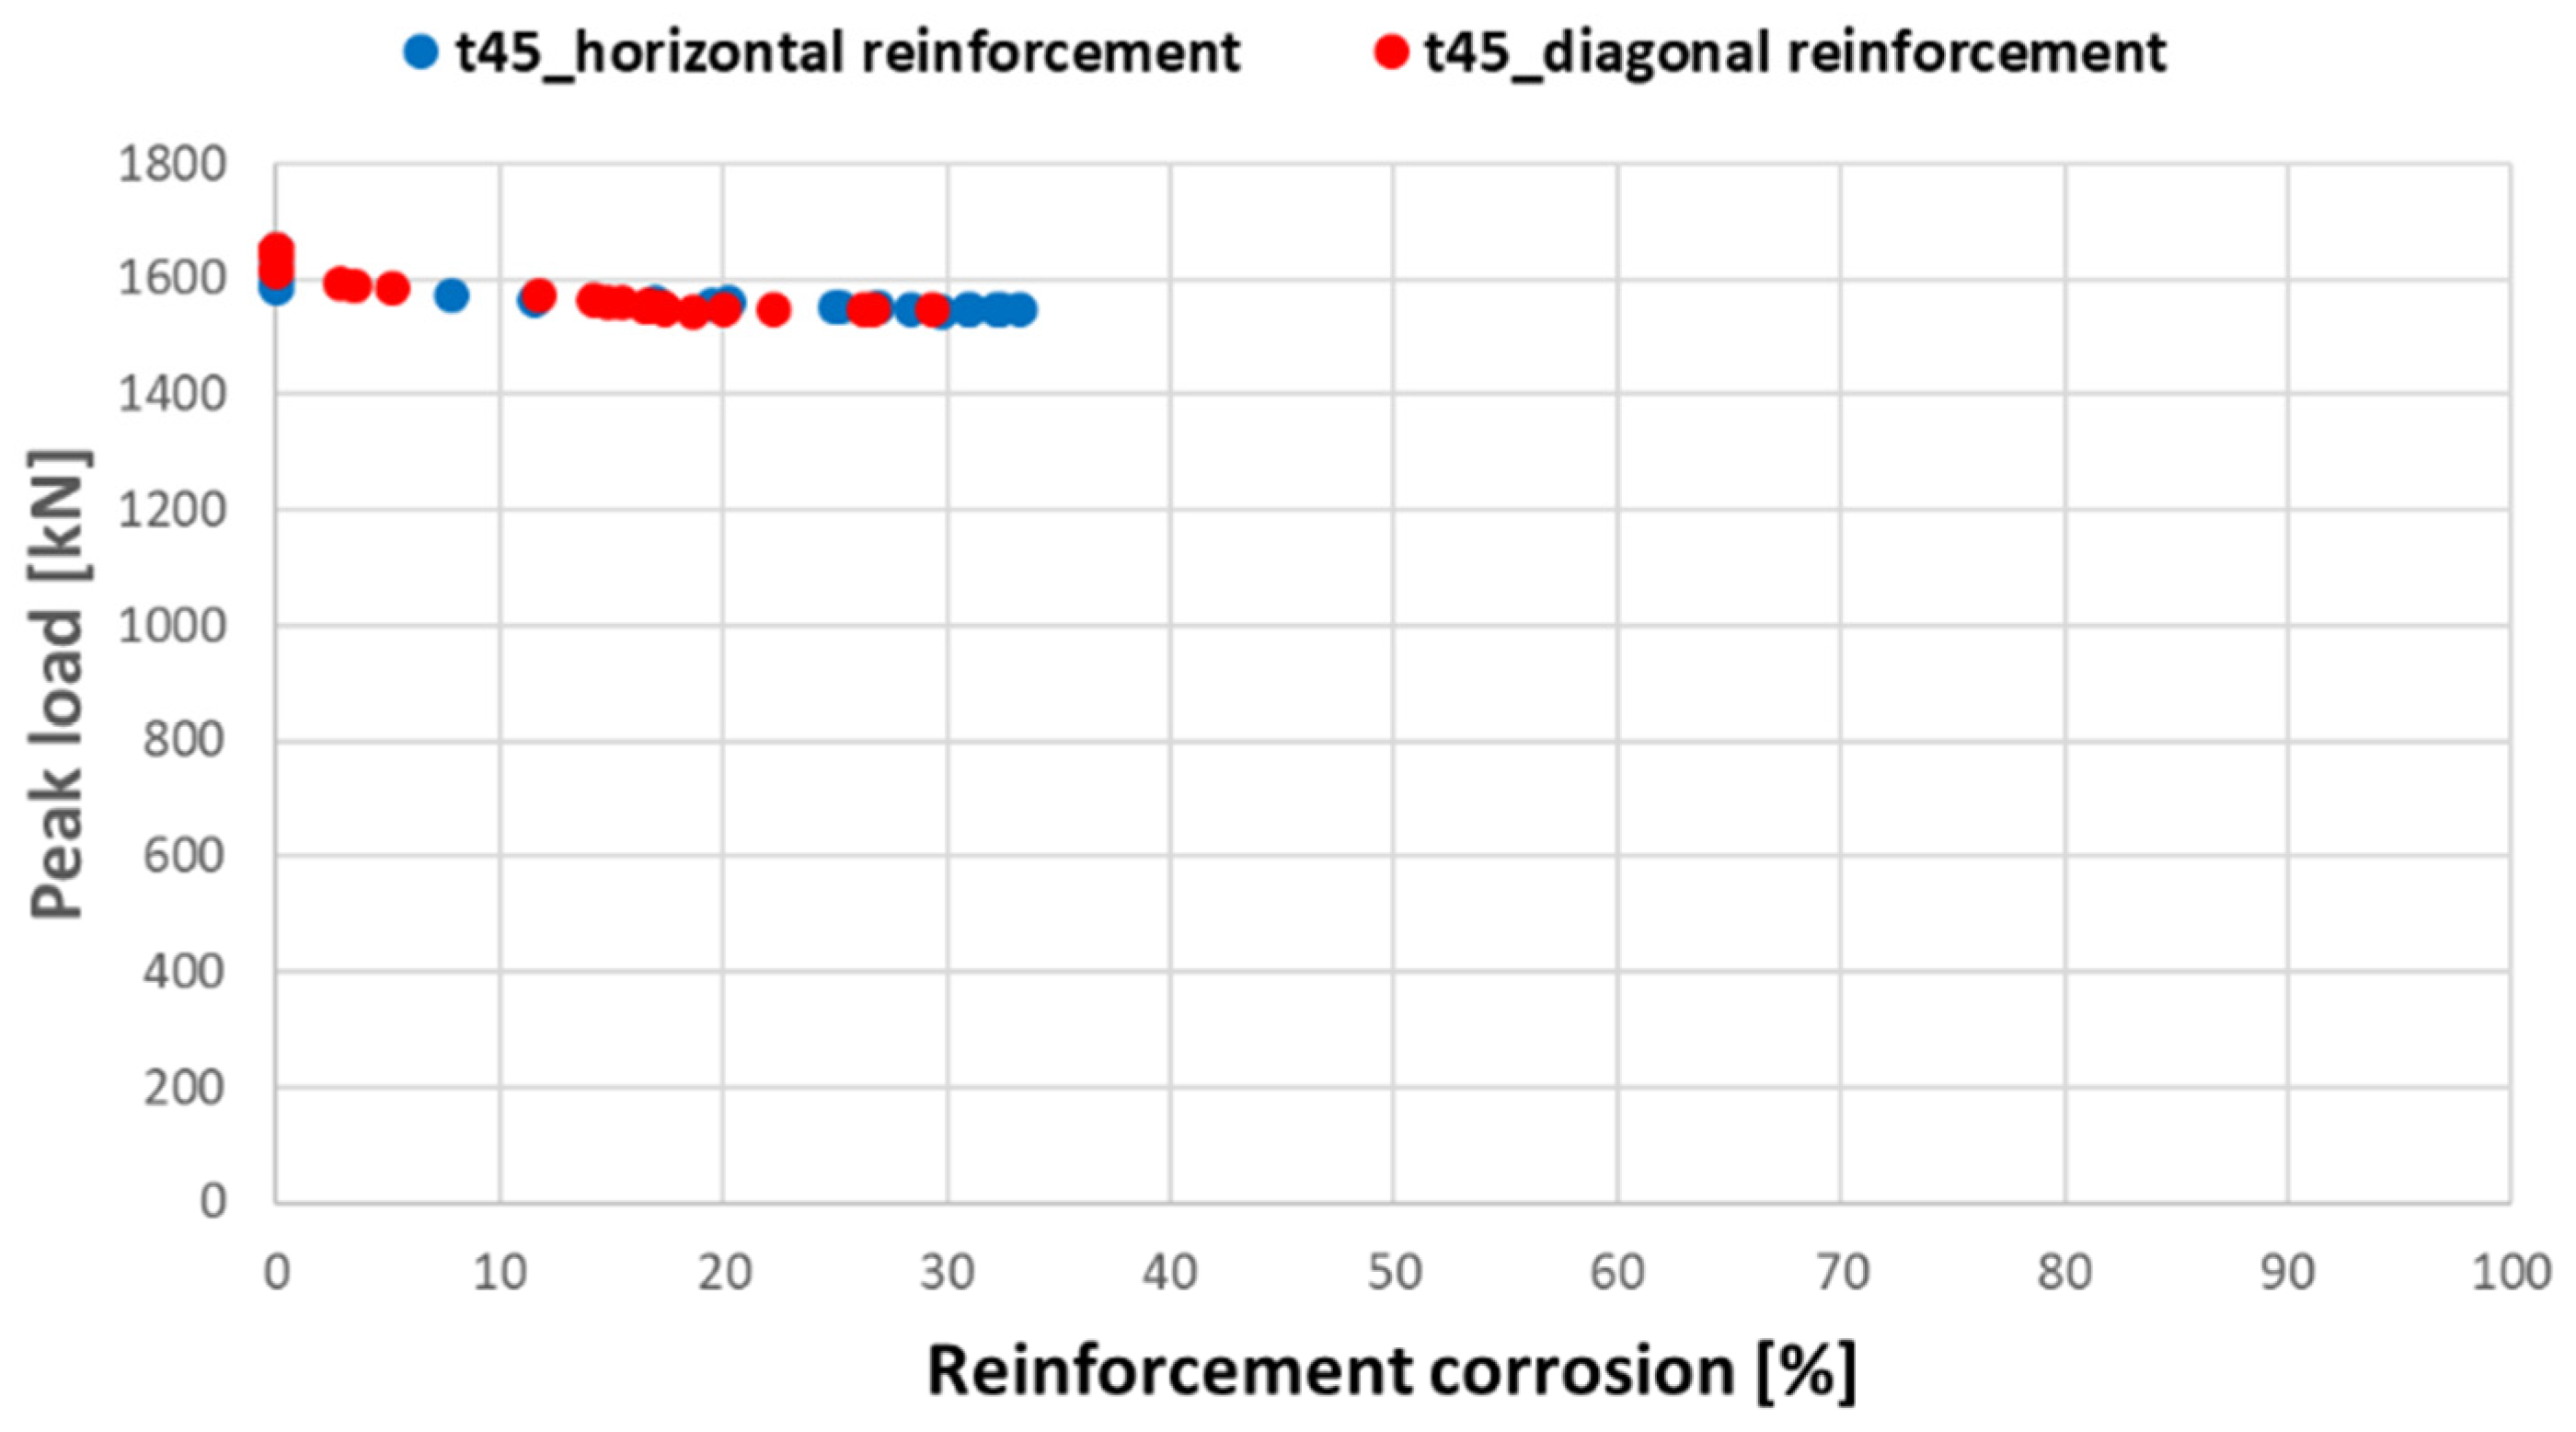
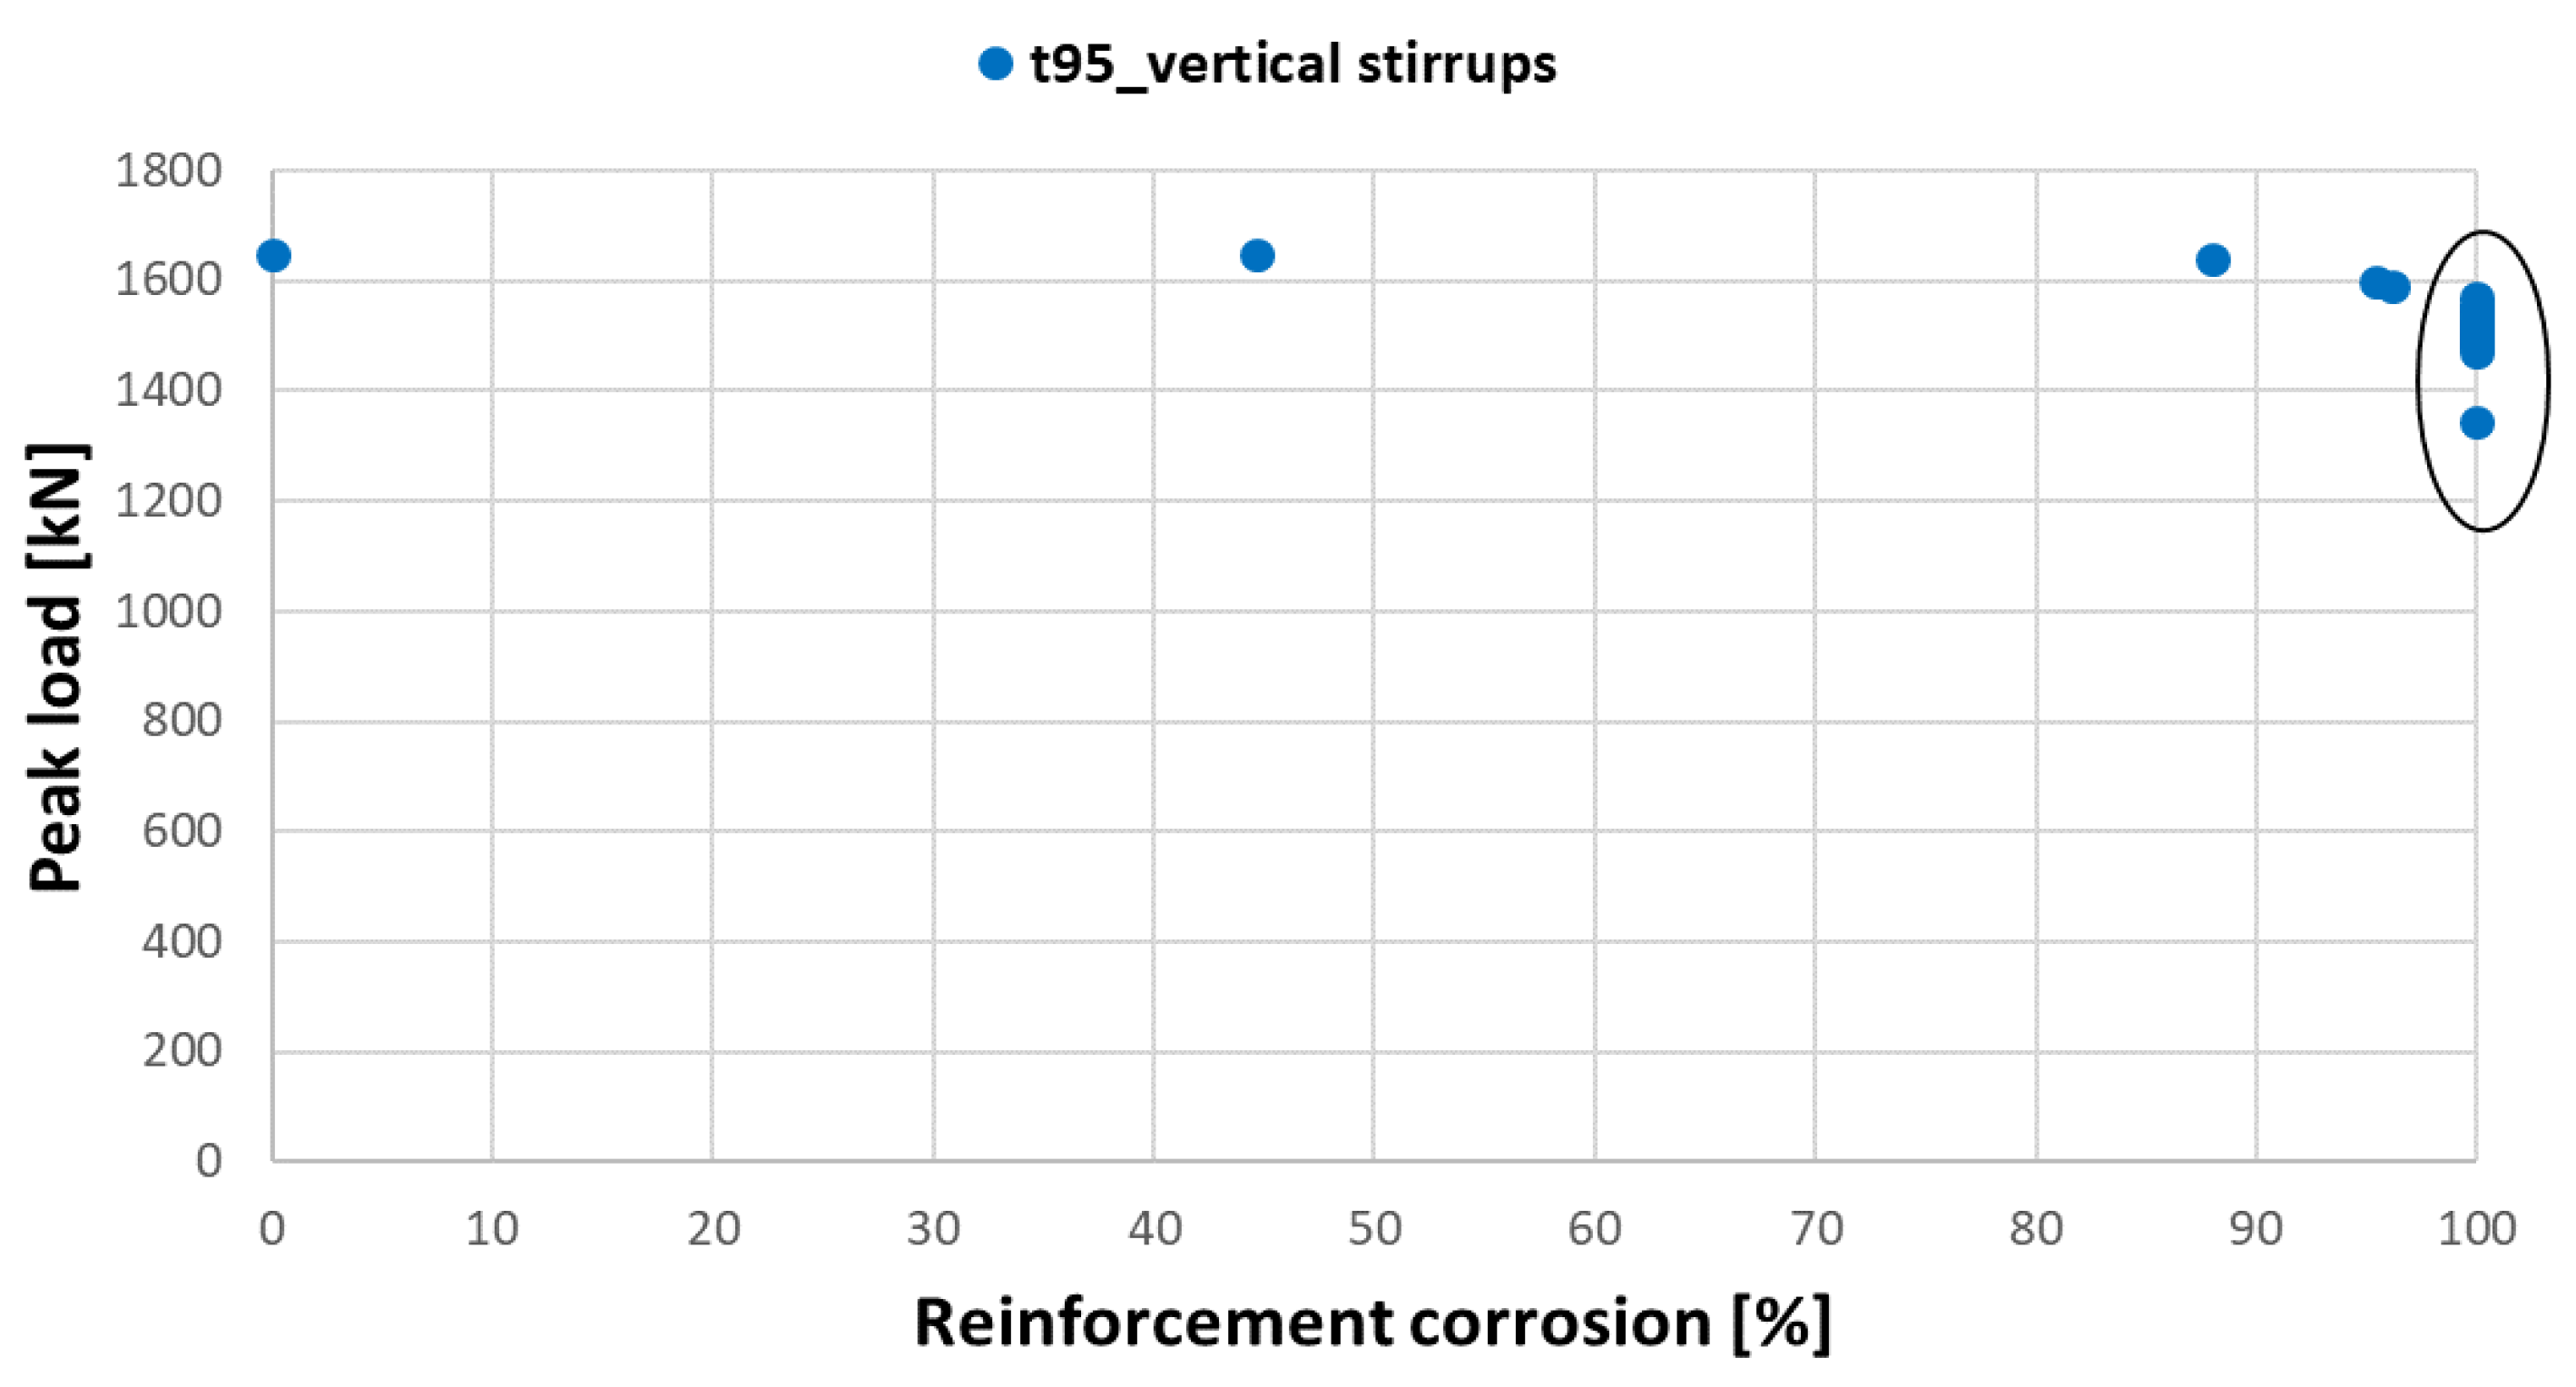
A more in-depth analysis of the collapse mechanism can be carried out, correlating the peak load for each chloride parameter combination and the reinforcement corrosion for both t45 and t95 cases. Figure 21 shows this correlation for horizontal and diagonal reinforcement at t95. When corrosion is under 60%, it has a low influence on the peak load value. Once this threshold is overcome, strength significantly reduces. For case t45 (see Figure 22), corrosion is not enough to trigger the same effect as for t95. Figure 23 shows that the influence of corrosion of vertical stirrups (reported only for the t95 case) is negligible since for 100% corrosion there is also a large variability of the peak load, which depends on the horizontal and diagonal steel rebars. This means that the saddle’s structural behaviour is mainly governed by phenomena specifically referred to concrete crushing effects in specific locations of the saddle.
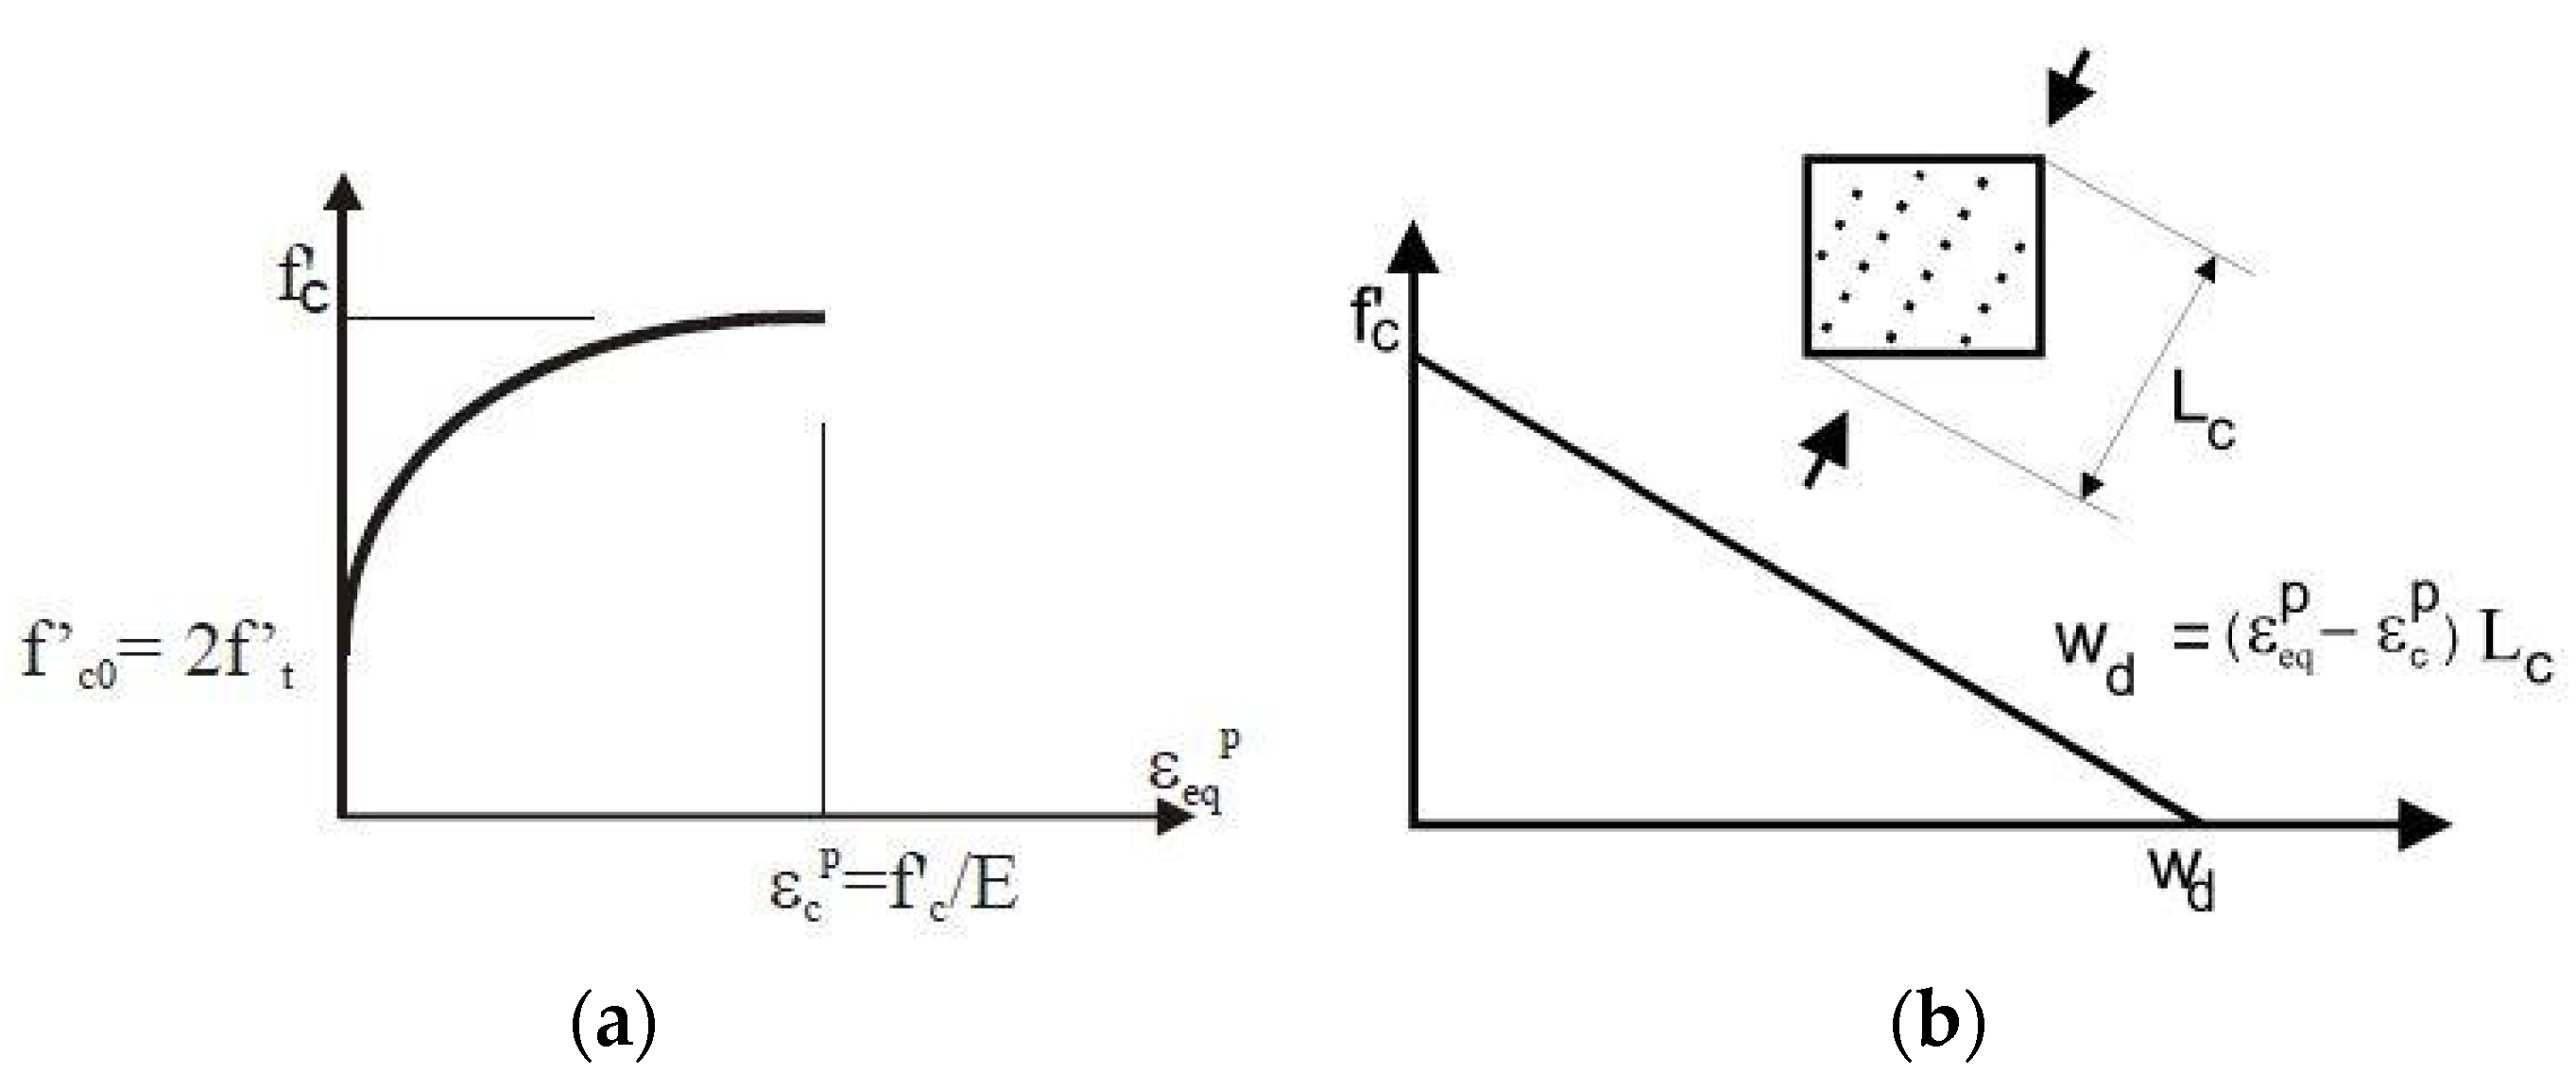
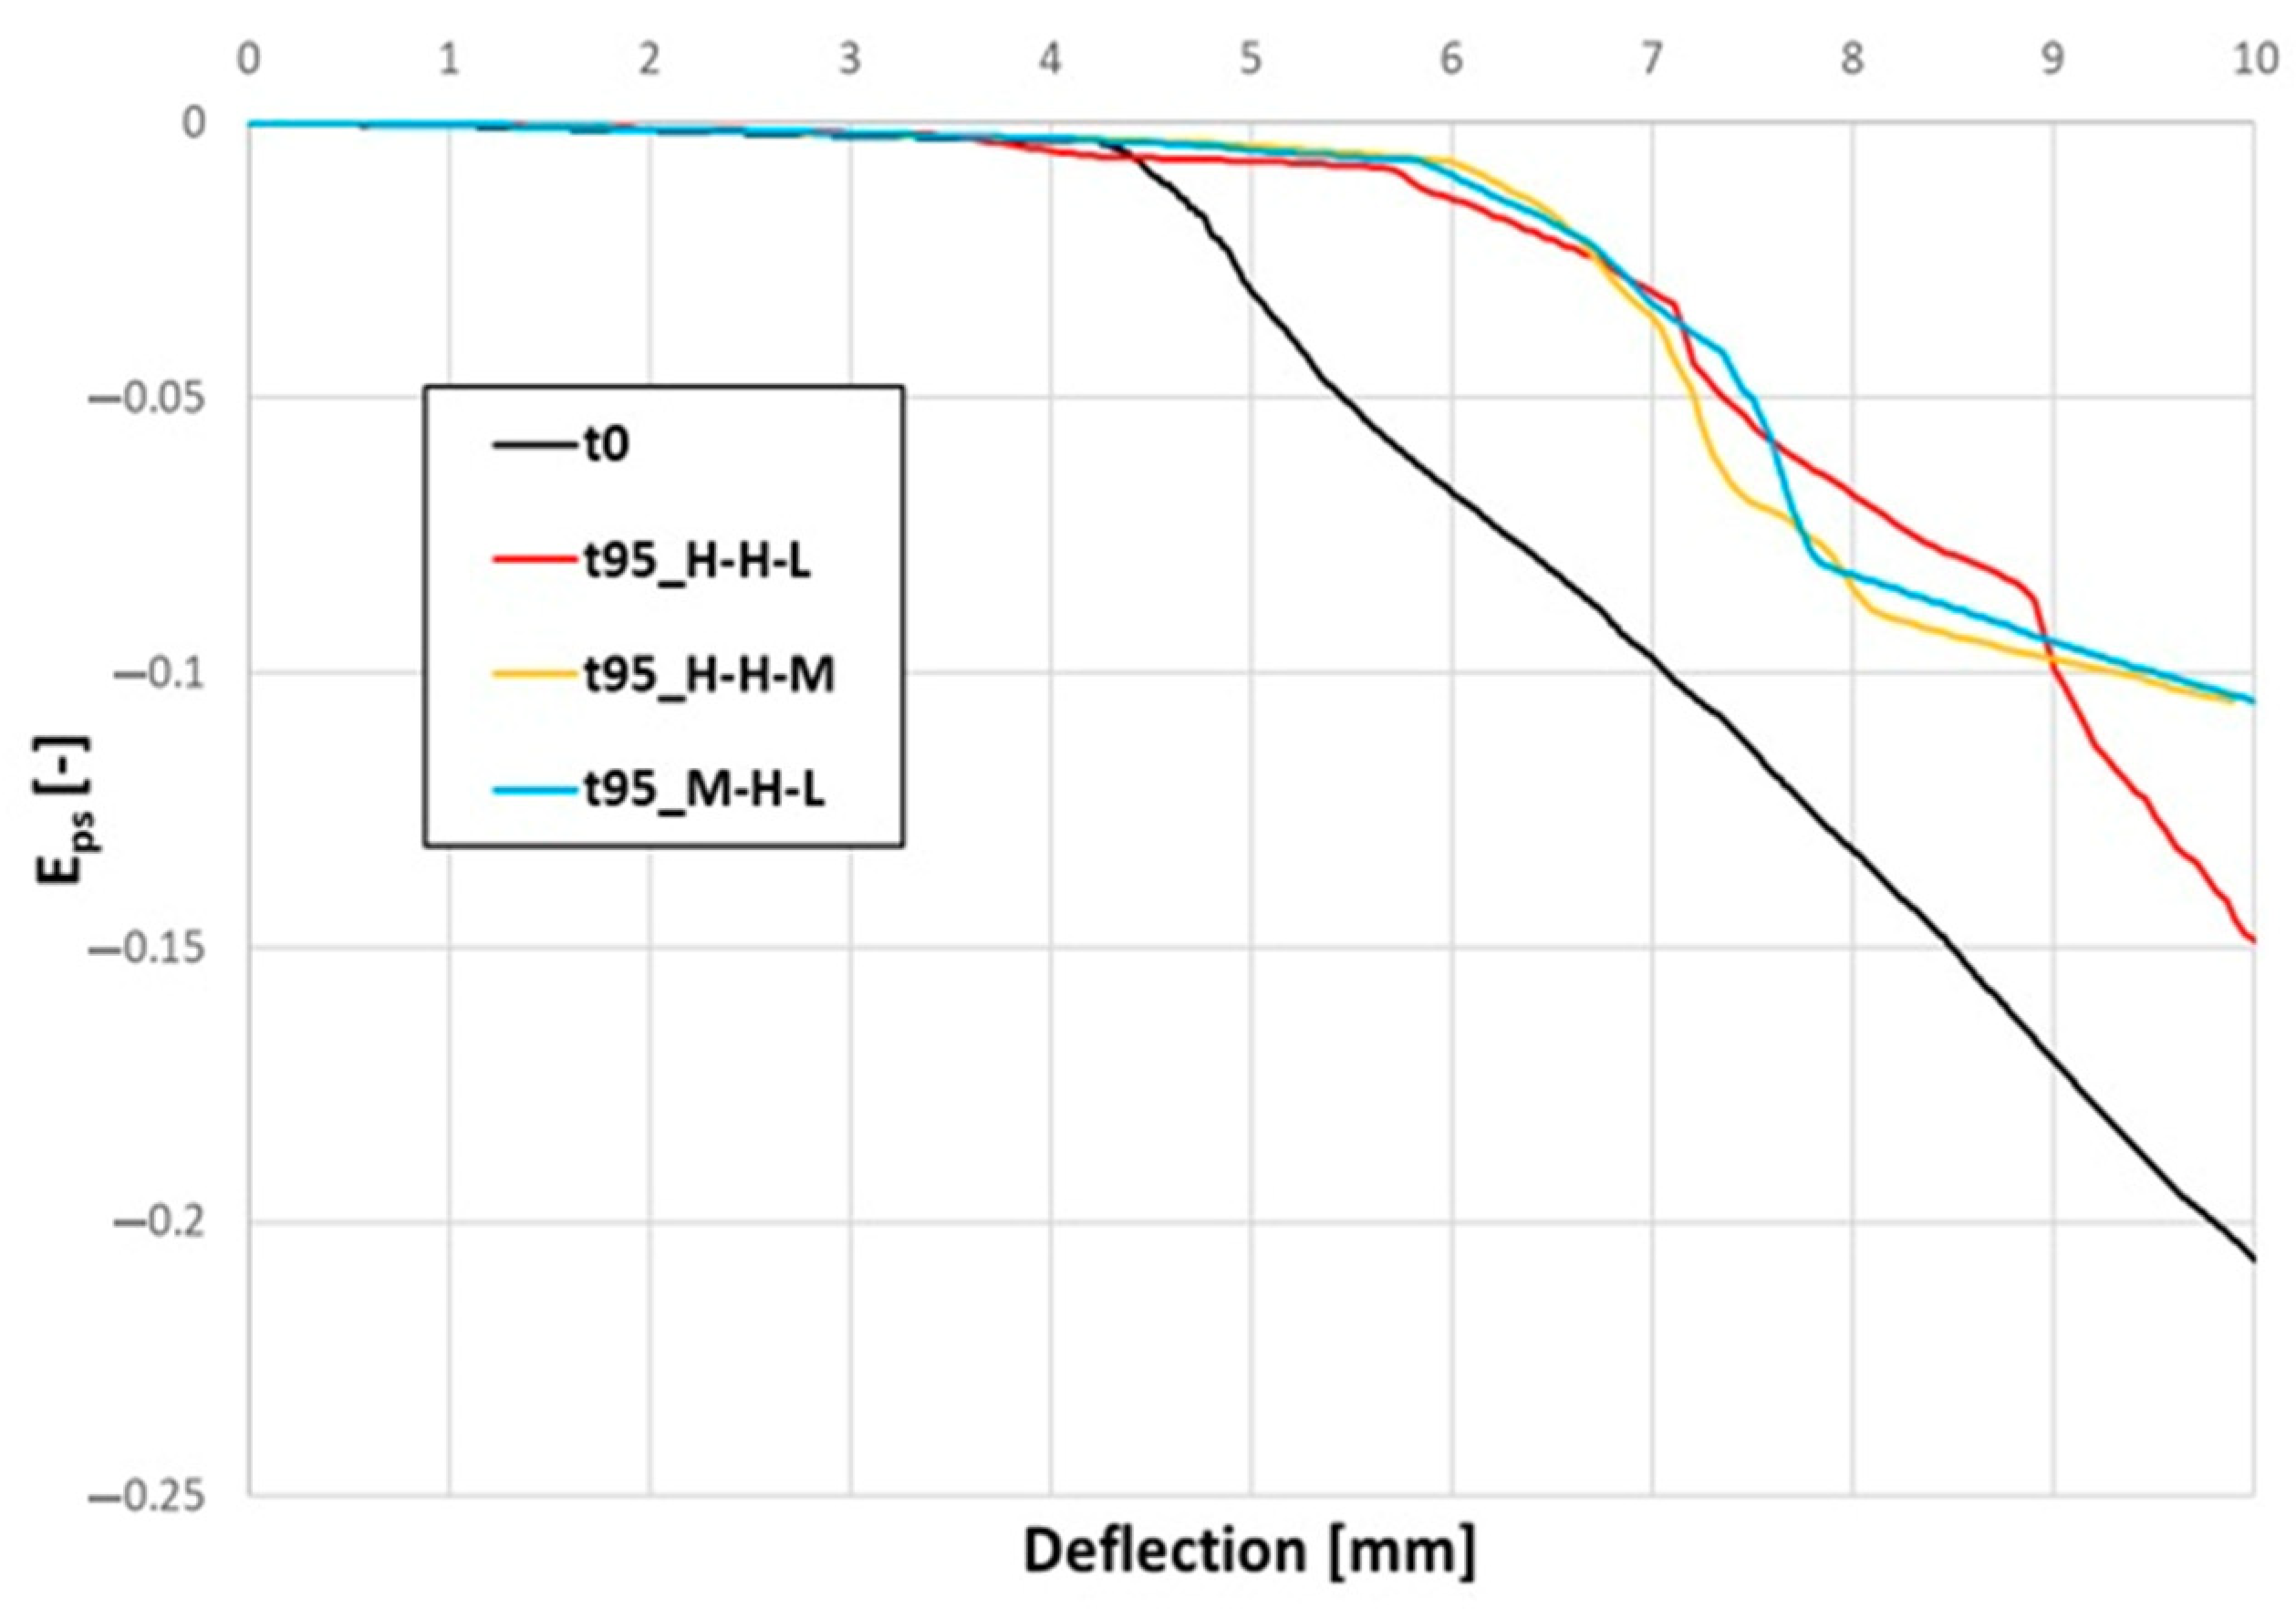
In order to show the above-mentioned concrete crushing effects, it is necessary to select a proper monitoring parameter, capable of describing the concrete strength degradation under compression. The equivalent plastic strain Eps, computed as the minimum value (compression is assumed to be negative), is selected among the different concrete strain components. The softening of concrete in compression can be identified by the condition , where is the plastic strain at peak stress (Figure 24a). When plastic strain exceeds , the softening branch of the concrete constitutive law starts according to a linear behaviour governed by displacements, ending at the critical compressive displacement wd (Figure 24b).
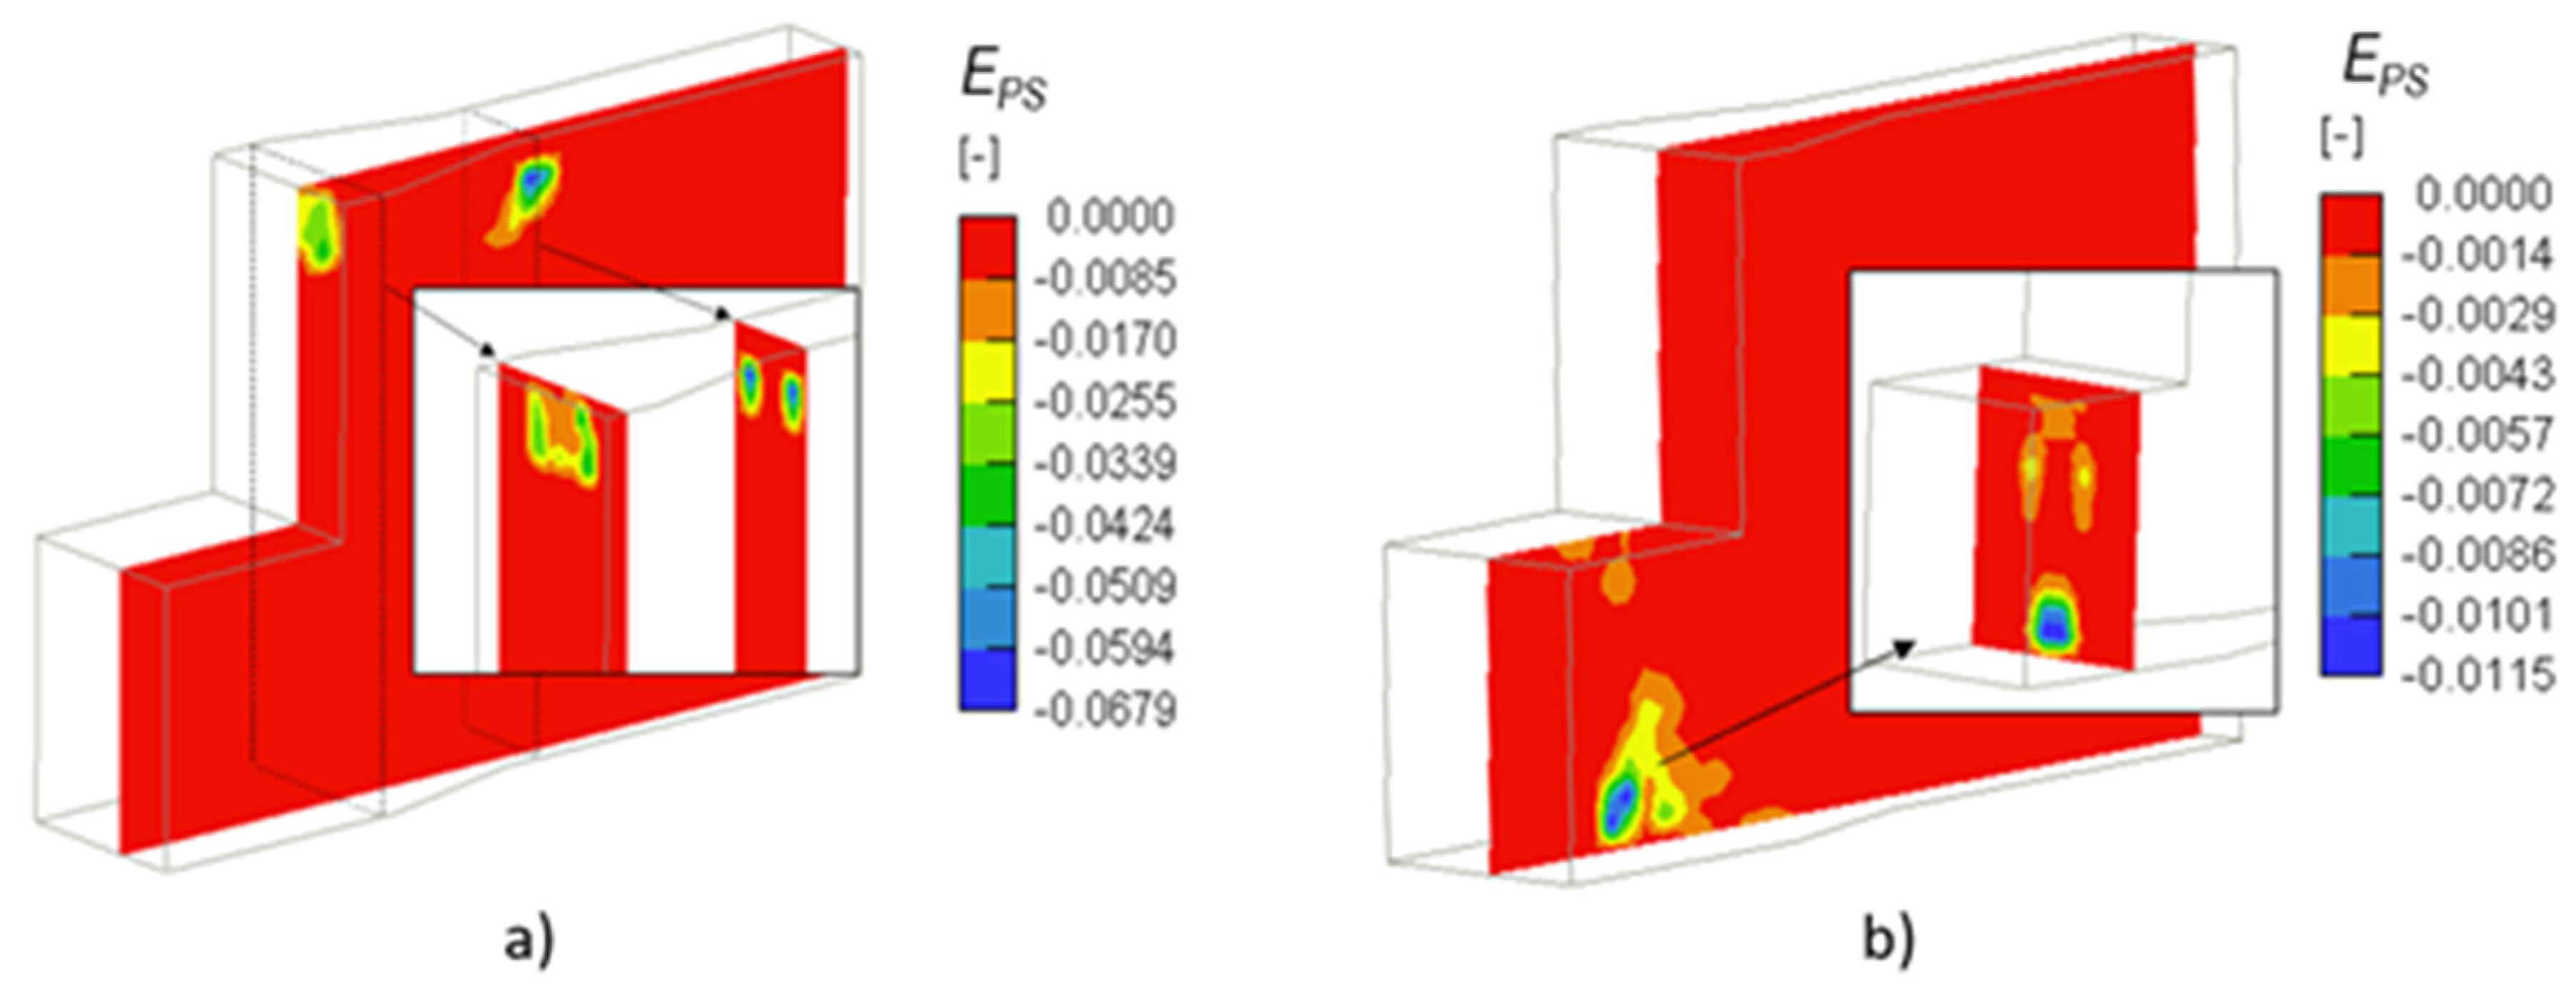
Keeping this in mind, the graphs of Figure 25 show variations in the minimum equivalent plastic strain of concrete, Eps, as functions of the applied deflection (and load) for case t0 (absence of corrosion) and for the most severe chloride parameter combinations (t95_H-H-L). Figure 26a,b shows the region of the saddle where this value is detected, i.e., the most damaged concrete zone under compression.
As reported in Figure 25, in the absence of corrosion (t0), Eps rapidly increases when deflection reaches a value of 4 mm, meaning that concrete is increasing its plastic deformation and then crushing phenomena occur. On the contrary, in the presence of huge corrosion (t95_H-H-L, H-H-M and M-H-L, which provide diagonal and horizontal corrosion above 60%), absolute values of Eps begin to increase at higher displacement values (i.e., about 6 mm). Further, the location where the maximum crushing effects are reached significantly differs from case t0 (Figure 26a) to case t95_H-H-L (Figure 26b). In fact, corrosion modifies the internal equilibrium of the saddle, moving the crushing zone from the junction between the girder and corbel (frame in Figure 26a) to the corbel strut (frame in Figure 26b).
6. Conclusions
In this paper, a mechano-chemical analysis framework has been applied to Gerber saddles in an RC bridge structure. The degradation agent was assumed to be represented by chloride ingress causing reinforcement corrosion. Due to the critical role of Gerber saddles in the global structural capacity of bridges, it is very important to accurately assess their state of deterioration at a given time and to quantify the effects of degradation related to reinforcement corrosion and the consequent reduction in ultimate capacity.
To this end, a procedure essentially based on the use of finite element software, ATENA, has been adopted. The latter is capable of simultaneously performing nonlinear mechanical analyses to assess the ultimate behaviour and chloride transport analyses to evaluate effects in terms of reinforcement corrosion.
After a brief description of the adopted properties to describe the mechanical behaviour of the constituent materials and the chloride ingress model in concrete, the procedure has been applied to the Gerber saddles of Musmeci RC bridge in Potenza. The procedure is based on three main steps which make it possible to determine the response under static loads, to simulate the chloride ingress and corrosion and, finally, to assess the residual load carrying capacity. The corrosion period was assumed to be equal to 45 years (present time) and 95 years (present time plus 50 years), while the chloride-induced corrosion parameters were retrieved from the literature, selecting max, min and median values and considering all their possible combinations.
The main results drawn from the performed analyses are as follows:
- The mechanical behaviour of the saddle is mainly governed by concrete crushing due to the shape of the element and the amount of reinforcement. Reinforcement would yield only when the peak load has already been reached and the saddle can be considered already collapsed.
- The collapse mode develops through the formation of diagonal cracks in the upper part of the saddle together with cracks at the interface between the corbel and the remaining part of the saddle. This is in good agreement with experimental results found in the literature.
- The analyses performed in the presence of the combined effect of permanent loads and corrosion show a reduction in the saddle’s strength with a maximum drop of peak load of about 6% and 18% after 45 and 95 years of simulation, respectively. Therefore, the saddles have suffered a very low strength decay to date, but this can significantly increase in the future.
- The choice of proper values/intervals of the corrosion parameters, in the absence of data specifically obtained on the structure at hand through in-situ and/or lab tests, has paramount importance on durability evaluations. Among others, the role of the critical chloride content Ccrit is clear, as the corrosion level for the combination H-H-L (lower value of Ccrit) is almost double compared to H-H-H (with higher values for all the three parameters). Therefore, in the case of an aggressive environment (i.e., high values of Cs), it is important to estimate Ccrit by means of proper experimental methods and investigations.
- The development of corrosion above a certain threshold modifies the failure mechanism of the saddle. This is especially shown by the reduction in the concrete equivalent plastic strain in the case of significant corrosion effects, meaning that the reduction in steel area changes the internal equilibrium between steel and concrete.
The results have also shown that further research activities on the durability of Gerber saddles should be developed. Particularly, additional numerical investigations should be performed to evaluate the effect of repeated load cycles due to traffic, being able to affect cracking patterns (note that in this study they were only related to permanent loads) and related chloride ingress phenomena. Even though the very specific analysis framework adopted in this study cannot be directly applied in design practice, it can contribute to a deeper qualitative knowledge of corrosion processes, thus helping the technicians in charge of inspections, maintenance, and possible repair of existing bridges. Further, additional studies may also provide useful tools for designers in defining the detailing of corrosion-prone structures.
Author Contributions
Regarding conceptualization, methodology, software, validation, formal analysis, investigation, resources, data curation, writing—original draft, preparation, writing—review and editing, visualization, supervision, project administration, and funding acquisition for this article, all authors have provided the same contribution. All authors have read and agreed to the published version of the manuscript.
Funding
This research received no external funding.
Institutional Review Board Statement
Not applicable.
Informed Consent Statement
Not applicable.
Data Availability Statement
Not applicable.
Acknowledgments
The authors would like to express their gratitude to the anonymous reviewers who have helped to improve the quality of this paper.
Conflicts of Interest
The authors declare no conflict of interest.
References
- Santarsiero, G.; Di Sarno, L.; Giovinazzi, S.; Masi, A.; Cosenza, E.; Biondi, S. Performance of the healthcare facilities during the 2016–2017 Central Italy seismic sequence. Bull. Earthq. Eng. 2019, 17, 5701–5727. [Google Scholar] [CrossRef]
- Medel-Vera, C.; Ji, T. Seismic risk control of nuclear power plants using seismic protection systems in stable continental regions: The UK case. Nucl. Eng. Des. 2016, 307, 377–391. [Google Scholar] [CrossRef]
- Poljanšek, K.; Casajus Valles, A.; Marin Ferrer, M.; De Jager, A.; Dottori, F.; Galbusera, L.; Garcia Puerta, B.; Giannopoulos, G.; Girgin, S.; Hernandez Ceballos, M.; et al. Recommendations for National Risk Assessment for Disaster Risk Management in EU, EUR 29557 EN; Publications Office of the European Union: Luxembourg, 2019; ISBN 978-92-79-98366-5. [Google Scholar] [CrossRef]
- Calvi, G.M.; Moratti, M.; O’Reilly, G.J.; Scattarreggia, N.; Monteiro, R.; Malomo, D.; Calvi, P.M.; Pinho, R. Once upon a Time in Italy: The Tale of the Morandi Bridge. Struct. Eng. Int. 2019, 29, 198–217. [Google Scholar] [CrossRef]
- Lanzo, G.; Pagliaroli, A. Numerical Modeling of Site Effects at San Giuliano di Puglia (Southern Italy) during the 2002 Molise Seismic Sequence. J. Geotech. Geoenviron. Eng. 2009, 135, 1295–1313. [Google Scholar] [CrossRef]
- Augenti, N.; Cosenza, E.; Dolce, M.; Manfredi, G.; Masi, A.; Samela, L. Performance of school buildings during the 2002 Molise, Italy, earthquake. Earthq. Spectra 2004, 20, S257–S270. [Google Scholar] [CrossRef]
- Presidenza del Consiglio dei Ministri. OPCM 3274 e s.m.i.-Allegato 2 Norme Tecniche per il Progetto, la Valutazione e L’adeguamento Sismico Degli Edifici; G.U. 8/5/2003; Presidenza del Consiglio dei Ministri: Roma, Italy, 2003. (In Italian) [Google Scholar]
- NTC2018—Ministry of Infrastructure, DM 17 gennaio 2018: Aggiornamento delle Norme tecniche per le costruzioni, Suppl. or. n.30 alla G.U.; n.29 del 4/2/2008; Ministry of Infrastructure: Roma, Italy, 2018. (In Italian)
- CIRCOLARE 21 Gennaio 2019, n. 7 C.S.LL.PP. Istruzioni per L’applicazione dell’«Aggiornamento Delle “Norme Tecniche per le Costruzioni”» di cui al Decreto Ministeriale 17 Gennaio 2018; Ministero delle Infrastrutture e dei Trasporti: Roma, Italy, 2018.
- European Committee for Standardization. EN 1998-2:2005 Eurocode 8: Design of Structures for Earthquake Resistance—Part 2: Bridges; European Committee for Standardization: Brussels, Belgium, 2005. [Google Scholar]
- European Committee for Standardization. EN 1998-3:2005 Eurocode 8: Design of Structures for Earthquake Resistance—Part 3: Assessment and Retrofitting of Buildings; European Committee for Standardization: Brussels, Belgium, 2005. [Google Scholar]
- Ministry of Infrastructure, CSLP. Guidelines on Risk Classification and Management, Safety Assessment and Monitoring of Existing Bridges; Ministry of Infrastructure: Rome, Italy, 2020. [Google Scholar]
- Gjørv, O.E. Durability Design of Concrete Structures in Severe Environments; Taylor & Francis: London, UK; New York, NY, USA, 2009. [Google Scholar]
- Bertolini, L.; Elsener, B.; Pedeferri, P.; Polder, R. Corrosion of Steel in Concrete, Prevention, Diagnosis, Repair; WILEY-VCH Verlag GmbH & Co. KGaA: Weinheim, Germany, 2004. [Google Scholar]
- UNI EN 206. Norma Europea; Calcestruzzo: Specificazione, Prestazione, Produzione e Conformità; UNI: Milano, Italy, 2014. [Google Scholar]
- Arup, H. The mechanisms of the protection of steel by concrete. In Corrosion of Reinforcement in Concrete Construction; Ellis Horwood Ltd.: Chichester, UK, 1983; pp. 151–157. [Google Scholar]
- Bernal, J.; Fenaux, M.; Moragues, A.; Reyes, E.; Gálvez, J.C. Study of chloride penetration in concretes exposed to high-mountain weather conditions with presence of deicing salts. Constr. Build. Mater. 2016, 127, 971–983. [Google Scholar] [CrossRef]
- Červenka, J.; Hajkova, K.; Jendele, L.; Sajdlova, T.; Smilauer, V. Durability assessment of reinforced concrete structures assisted by numerical simulation. In Proceedings of the 71st RILEM Annual Week & ICACMS 2017, Chennai, India, 3–8 September 2017. [Google Scholar]
- Hájková, K.; Šmilauer, V.; Jendele, L.; Červenka, J. Prediction of reinforcement corrosion due to chloride ingress and its effects on serviceability. Eng. Struct. 2018, 174, 768–777. [Google Scholar] [CrossRef]
- Buratti, G.; Cosentino, A.; Morelli, F.; Salvatore, W.; Bencivenga, P.; Zizi, M.; De Matteis, G. Alcune considerazioni sull’evoluzione normativa dei carichi da traffico nella progettazione dei ponti stradali in Italia. In Proceedings of the XVIII Convegno «L’ingegneria Sismica in Italia»; ANIDIS, Ascoli Piceno, Italy, 15–19 September 2019. [Google Scholar]
- Di Prisco, M.; Colombo, M.; Martinelli, P.; Coronelli, D. The technical causes of the collapse of Annone overpass on SS. 36. In Italian Concrete Days 2018; ITA: Lecco, Italy, 2018; pp. 1–16. [Google Scholar]
- Circolare n. 384 del 14 Febbraio 1962, Norme Relative ai Carichi per il Calcolo dei Ponti Stradali; Consiglio Superiore Ministero LL.PP.: Roma, Italy, 1962.
- Červenka, V.; Jendele, L.; Červenka, J. ATENA Program Documentation Part 1 Theory; Červenka Consulting: Prague, Czech Republic, 2020. [Google Scholar]
- Zhang, J.; Wang, J.; Kong, D. Chloride diffusivity analysis of existing concrete based on Fick’s second law. J. Wuhan Univ. Technol. 2010, 25, 142–146. [Google Scholar] [CrossRef]
- Bazant, Z.P.; Oh, B.H. Crack Band Theory for Fracture of Concrete. Mater. Struct. 1983, 16, 155–177. [Google Scholar]
- Santarsiero, G.; Masi, A. Analysis of slab action on the seismic behavior of external RC beam-column joints. J. Build. Eng. 2020, 32, 101608. [Google Scholar] [CrossRef]
- Fib, Fédération Internationale du Béton. Model Code 2010 First Complete Draft; Fib Bulletin n. 55; Fédération Internationale du Béton: Lausanne, Switzerland, 2010; Volume 1. [Google Scholar]
- Remmel, G. Zum Zug-Und Schubtragverhalten von Bauteilen aus Hochfestem Beton; DAfStb, Heft 444; Beuth Verlag: Berlin, Germany, 1994. [Google Scholar]
- Kwon, S.J.; Na, U.J.; Park, S.S.; Jung, S.H. Service Life Prediction of Concrete Wharves with Earlyaged Crack: Probabilistic Approach for Chloride Diffusion. Struct. Saf. 2009, 31, 75–83. [Google Scholar] [CrossRef]
- Collepardi, M.; Marcialis, A.; Turriziani, R. Penetration of Chloride Ions into Cement Pastes and Concrete. J. Am. Ceram. Soc. 1972, 55, 534–535. [Google Scholar] [CrossRef]
- Liu, Y.; Weyers, R.E. Modeling the Dynamic Corrosion Process in Chloride Contaminated Concrete Structures. Cem. Concr. Res. 1998, 28, 365–367. [Google Scholar] [CrossRef]
- Engelund, S.; Mohr, L.; Edvardsen, C. General Guidelines for Durability Design and Redesign: Duracrete, Probabilistic Performance Based Durability Design of Concrete Structures; CUR: Gouda, The Netherlands, 2000. [Google Scholar]
- Zambon, I.; Ariza, M.P.S.; Campos e Matos, J.; Strauss, A. Value of Information (VoI) for the Chloride Content in Reinforced Concrete Bridges. Appl. Sci. 2020, 10, 567. [Google Scholar] [CrossRef] [Green Version]
- Andrade, C. RILEM TC 178-TMC. Analysis of total chloride content in concrete. Mater. Struct. 2002, 35, 583–585. [Google Scholar]
- Chidiac, S.E.; Shafikhani, M. Electrical resistivity model for quantifying concrete chloride diffusion coefficient. Cem. Concr. Compos. 2020, 113, 103707. [Google Scholar] [CrossRef]
- Angst, U.; Wagner, M.; Elsener, B.; Leemann, A.; Nygaard, P.V. Method to Determine the Critical Chloride Content of Existing Reinforced Concrete Structures; Swiss Federal Roads Office: Berne, Switzerland, 2016. [Google Scholar]
- Marmo, F.; Demartino, C.; Candela, G.; Sulpizio, C.; Briseghella, B.; Spagnuolo, R.; Xiao, Y.; Vanzi, I.; Rosati, L. On the form of the Musmeci’s bridge over the Basento river. Eng. Struct. 2019, 191, 658–673. [Google Scholar] [CrossRef]
- Ponzo, F.C.; Di Cesare, A.; Dolce, M.; Moroni, C.; Nigro, D.; Auletta, G.; Ditommaso, R. Vulnerabilità Sismica del ponte “Musmeci” a Potenza. Progett. Sismica 2013, 4, 3. [Google Scholar]
- EN1998-1. Eurocode 8: Design of Structures for Earthquake Resistance. Part 1: General Rules, Seismic Actions and Rules for Buildings; European Committee for Standardization (CEN): Brussels, Belgium, 2004. [Google Scholar]
- NTC2008—Ministry of Infrastructure, DM 14 gennaio 2008: Norme tecniche per le costruzioni, Suppl. or. n.30 alla G.U.; n.29 del 4/2/2008; Ministry of Infrastructure: Roma, Italy, 2008. (In Italian)
- Verderame, G.M.; Ricci, P.; Esposito, M.; Sansiviero, F.C. Le Caratteristiche Meccaniche Degli Acciai Impiegati nelle Strutture in c.a. Realizzate dal 1950 al 1980; Dipartimento di Ingegneria Strutturale, Università degli Studi di Napoli Federico II: Naples, Italy, 2011. [Google Scholar]
- Van der Wegen, G.; Polder, R.B.; Van Breugel, K. Guideline for service life design of structural concrete—A performance based approach with regard to chloride induced corrosion. Heron 2012, 57, 153–168. [Google Scholar]
- Angst, U.M. Predicting the time to corrosion initiation in reinforced concrete structures exposed to chlorides. Cem. Concr. Res. 2019, 115, 559–567. [Google Scholar] [CrossRef]
- EN 1992-2. Eurocode 2: Design of Concrete Structures—Part 2: Concrete Bridges—Design and Detailing Rules European Committee for Standardization; European Committee for Standardization (CEN): Brussels, Belgium, 2005. [Google Scholar]
Figure 1.
Examples of deteriorated Gerber saddles in RC road bridges.

Figure 2.
The Annone Brianza overpass collapse.

Figure 3.
The Musmeci bridge at present.

Figure 4.
RC box deck cross-section of the Musmeci bridge.

Figure 5.
Scheme of a single bridge span and indication of simply supported sections (original sketch by Sergio Musmeci).
Figure 5.
Scheme of a single bridge span and indication of simply supported sections (original sketch by Sergio Musmeci).

Figure 6.
(a) Geometry and (b) structural details of Gerber saddles from the original design drawings by Sergio Musmeci (dimensions in cm).
Figure 6.
(a) Geometry and (b) structural details of Gerber saddles from the original design drawings by Sergio Musmeci (dimensions in cm).

Figure 7.
Deterioration of Gerber saddles and underlying vault.

Figure 8.
Finite element model: (a) concrete mesh and (b) reinforcing steel mesh.

Figure 9.
(a) Sequence of intervals in mechano-chemical analyses, (b) typical load-deflection curve in mechano-chemical analyses.
Figure 9.
(a) Sequence of intervals in mechano-chemical analyses, (b) typical load-deflection curve in mechano-chemical analyses.

Figure 10.
Surfaces exposed to chloride attack.

Figure 11.
The four effective Gerber saddles (dimensions in cm).

Figure 12.
Load-deflection curve of the saddle.

Figure 13.
Principal stress distribution in concrete at peak load (analysis “t0”) for side (a,c) and centre (b) cutting planes.
Figure 13.
Principal stress distribution in concrete at peak load (analysis “t0”) for side (a,c) and centre (b) cutting planes.

Figure 14.
(a) Crack pattern and (b) reinforcement stress distribution at peak load (analysis “t0”).
Figure 14.
(a) Crack pattern and (b) reinforcement stress distribution at peak load (analysis “t0”).

Figure 15.
Chloride concentration at reinforcement depth as a function of chloride parameter combination and corrosion period (t45 = 45 years, t95 = 95 years).
Figure 15.
Chloride concentration at reinforcement depth as a function of chloride parameter combination and corrosion period (t45 = 45 years, t95 = 95 years).

Figure 16.
Induction time as a function of the chloride parameter combination.

Figure 17.
Reinforcement corrosion as a function of chloride parameter combination for case t95.

Figure 18.
Envelope of load-deflection curves of chloride-induced corrosion analyses at 45 years.

Figure 19.
Envelope of load-deflection curves of chloride-induced corrosion analyses at 95 years.

Figure 20.
Load-carrying capacity of the saddle as a function of chloride parameter combination.

Figure 21.
Correlation between peak load and reinforcement corrosion (t95).

Figure 22.
Correlation between peak load and reinforcement corrosion (t45).

Figure 23.
Correlation between peak load and vertical stirrups corrosion (t95).

Figure 24.
(a) Compressive hardening and (b) softening concrete constitutive law [23].
Figure 24.
(a) Compressive hardening and (b) softening concrete constitutive law [23].

Figure 25.
Minimum equivalent plastic strain-deflection curves.

Figure 26.
Colormap of Eps for cases t0 (a) and t95_H-H-L (b).


Table 1.
Mechanical properties of concrete.
| Mean compressive strength | fcm = −25.85 MPa |
| Standard deviation of strength values | σ = 3.50 MPa |
| Coefficient of variation | CV = 11.3% |
| Design compressive strength | fcd = −17.24 MPa |
| Design tensile strength | fctd = 1.59 MPa |
| Young’s modulus | E = 29,253.88 MPa |
| Fracture energy | GF = 1.31 × 10⁻⁴ MN/m |
| Poisson’s coefficient | ν = 0.20 |
Table 2.
Mechanical properties of reinforcing steel.
| Young’s modulus | E = 200 GPa |
| Characteristic yielding stress | fyk = 375 MPa |
| Design yielding stress | fyd = 375 MPa |
| Failure stress | ft = 460 MPa |
| Failure strain | εt = 18% |
Table 3.
Main chloride-induced corrosion governing parameters.
| Parameter | Low | Median | High | |||
|---|---|---|---|---|---|---|
| Value | Ref. | Value | Ref. | Value | Ref. | |
| [% of cement mass] | 1.5 | [42] | 2 | [43] | 2.8 | [14] |
| [m2/s] | 0.27 × 10⁻¹² | [19] | 1.28 × 10⁻¹² | [22] | 3.28 × 10⁻¹² | [14] |
| [% of cement mass] | 0.4 | [14] | 0.6 | [19] | 1 | [14] |
Table 4.
Other chloride-induced corrosion parameters.
| Parameter | Value |
|---|---|
| tDref | 10 years |
| mcoeff | 0.37 |
| tmcoeff | 30 years |
| ft,ch | 1.67 MPa |
| Cement mass | 300 kg/m3 |
Publisher’s Note: MDPI stays neutral with regard to jurisdictional claims in published maps and institutional affiliations. |
© 2021 by the authors. Licensee MDPI, Basel, Switzerland. This article is an open access article distributed under the terms and conditions of the Creative Commons Attribution (CC BY) license (http://creativecommons.org/licenses/by/4.0/).
Share and Cite
MDPI and ACS Style
Santarsiero, G.; Masi, A.; Picciano, V. Durability of Gerber Saddles in RC Bridges: Analyses and Applications (Musmeci Bridge, Italy). Infrastructures 2021, 6, 25. https://0-doi-org.brum.beds.ac.uk/10.3390/infrastructures6020025
AMA Style
Santarsiero G, Masi A, Picciano V. Durability of Gerber Saddles in RC Bridges: Analyses and Applications (Musmeci Bridge, Italy). Infrastructures. 2021; 6(2):25. https://0-doi-org.brum.beds.ac.uk/10.3390/infrastructures6020025
Chicago/Turabian StyleSantarsiero, Giuseppe, Angelo Masi, and Valentina Picciano. 2021. "Durability of Gerber Saddles in RC Bridges: Analyses and Applications (Musmeci Bridge, Italy)" Infrastructures 6, no. 2: 25. https://0-doi-org.brum.beds.ac.uk/10.3390/infrastructures6020025