Cyclists at Roundabouts: Risk Analysis and Rational Criteria for Choosing Safer Layouts


1
Department of Civil, Constructional and Environmental Engineering, Sapienza University of Rome, Via Eudossiana 18, 00184 Rome, Italy
2
Department of Basic and Applied Sciences for Engineering, Sapienza University of Rome, Via Antonio Scarpa 16, 00161 Rome, Italy
*
Author to whom correspondence should be addressed.
Infrastructures 2021, 6(3), 34; https://0-doi-org.brum.beds.ac.uk/10.3390/infrastructures6030034
Submission received: 15 February 2021
/
Revised: 1 March 2021
/
Accepted: 1 March 2021
/
Published: 3 March 2021
Abstract
:Cycling for transportation is an important resource to reduce urban traffic congestion, enhance personal health, reduce energy consumption, and improve air quality, and the safety of cyclists in the cities is becoming a topic of growing interest. As shown in the literature, an important number of cyclist fatalities is due to road crashes occurring at urban intersections. This study combines a probabilistic and a damage model to perform a risk analysis for the collisions between motor vehicles and bicycles in the merging and diverging conflict points of a single-lane conventional roundabout with four arms, characterized by a permanent traffic flow. The probabilistic model is based on Poisson’s law and is aimed to measure the probability of a collision between bikes and motor vehicles within the elementary unit of exposure in each conflict point of the roundabout. The damage model exploits the reaction time of a road user to avoid a collision and has been built to develop a danger classification for the conflict points. The goal of this study is then to estimate the so-called risk of collision at the roundabout, to compare different possible layouts for various traffic volumes with increasing bike flows and geometric configurations, and to identify the most effective solutions to improve safety for cyclists. The results demonstrate the risk reduction given by a roundabike compared to a standard layout where cyclists and motor vehicles share the circulatory roadway. Therefore, the study here presented could help road managers to implement mitigation strategies taking into consideration both geometric and functional constraints.
1. Introduction
Biking is a paramount sustainable transport [1] in urban areas; it helps healthier lifestyles, lowers energy consumption and carbon emissions, and reduces motorized traffic. Nevertheless, cycling risk and discomfort cannot be overlooked [2] and recent studies investigate some parameters contributing to bicyclists’ vulnerability, such as, among others, relationships between bicyclist’s injury severity and roads, environment [3], vehicle and bicycle safety equipment [4], human demographic and behavior [5], speed and mass of motor vehicles [6,7], and road layouts [8,9,10,11,12].
In this framework, urban intersections are of particular interest, because over 70% of crashes involving bicyclists occur in these locations [13]. The leading causes of crashes depend on both the behavior of the road users, and on the configuration of the physical space where motor vehicles and bikes interact [14]. Indeed, cyclists travel unprotected, without tracks or lanes meant to improve their safety, to define a physical separation, or to employ limits on motor vehicle movements [15,16,17].
One of the main targets of this paper is to evaluate the so-called risk of collision of the roundabout. This problem deals with two main issues. On the one hand, it depends on the decisions of the road users, which are intrinsically random phenomena. On the other, the geometric layout of the roundabout imposes constraints on the randomness of the behavior of the users. It is thus natural to establish an approach which aims to combine these two aspects. Here, on the one hand, a probabilistic model based on Poisson’s law is built to address the randomness due to the perception and decision of road users at the intersections, like in other traffic engineering problems [18,19]. The Poisson distribution is a common tool to model the number of events occurring within a fixed time interval in a fixed space with a known constant mean rate, that is, the average number of events occurring during this time elapse, named intensity. Loosely speaking, after the identification of the most critical points in terms of the risk of a collision along the roundabout, the number of bikes and vehicles driving at this point in the given time interval are considered by Poisson random variables, whose intensities are estimated thanks to the traffic flows in the roundabout.
On the other hand, a damage model is here employed to deal with the interaction between motor vehicles and bicycles, as well as the geometric configuration of the roundabout. The operational conditions of at-grade intersections are based on the criterion that, given geometric and flow settings, all vehicles and all users vary their speed and direction (i.e., they perform maneuvers) to define their trajectories in the same space. To gain a better understanding of this issue, different geometric layouts of bicycle facilities at intersections have been considered to model the interaction between motor and not-motor vehicles [20,21] and to assess the risk of injured cyclists [22]. The geometry of the intersection layout plays a pivotal role in the risk management process [23,24] because it allows to reduce the number of the conflict points and to increase the reaction time available to a driver of a motor vehicle to avoid a collision. The installation of a signal, the retraction of the yield line, the institution of areas reserved for bicyclists (e.g., the bike box at the head of a traffic lane at a signalized intersection) are the most frequent and effective solutions. Moreover, converting a standard 4-arm intersection into a roundabout is currently the most adopted strategy to reduce the conflict points [25,26,27,28], because this conversion reduces the possible opportunities for a collision from 32 to 8 [29]. Moreover, their geometric layout influences the sustainability of road transportation, and the emergence of potentially dangerous situations [30]. Indeed, roundabouts and their perceived traffic safety are nowadays the object of investigations at an international level to investigate functions, capacities, and traffic safety characteristics [31,32,33,34].
Roundabouts with a cycle path (separated) or without a cycle facility (integrated) are investigated to analyze traffic conflicts, interactions, and yielding behavior [35]. Furthermore, several interventions to improve cycling mobility at roundabouts aim to reduce vehicular speed, to create greater deflection angles, to improve visibility of cyclists, and to minimize carriage width, with the purpose of avoiding overtaking and dispersion of trajectories [36]. As a straightforward consequence, their external diameter and configuration affect the subjective safety of all the vulnerable road users, both cyclists and pedestrians. The Italian standard to design road intersections [37] defines three sizes of roundabouts:
- “conventional”, with an external diameter between 40 and 50 m;
- “compact”, with an external diameter between 25 and 40 m;
- “mini”, with an external diameter between 14 and 25 m.
The aim of this paper is to assess the risk of crashes between bicyclists and motor vehicles in a symmetrical 4-arm urban conventional roundabout designed according to the Italian standards about roundabouts and cycling mobility [37,38]. The risk level of the current geometric and functional configuration has been compared to that of different configurations in terms of cyclist traffic flows and the layout of the intersection. The before–after analysis allowed assessment and comparison of the safety levels of each examined layout and identification of the best strategies to reduce the exposure to the risk of collision between bikes and motor vehicles.
The paper is organized in the following way: Section 2 presents the applied methodology in the context of this research and provides the input geometric and traffic data. Section 3 provides the results of the risk analysis for different geometric and functional layouts, while Section 4 discusses the results and emphasizes the best strategies to manage the risk of collision between bikes and motor vehicles.
2. Data and Methods
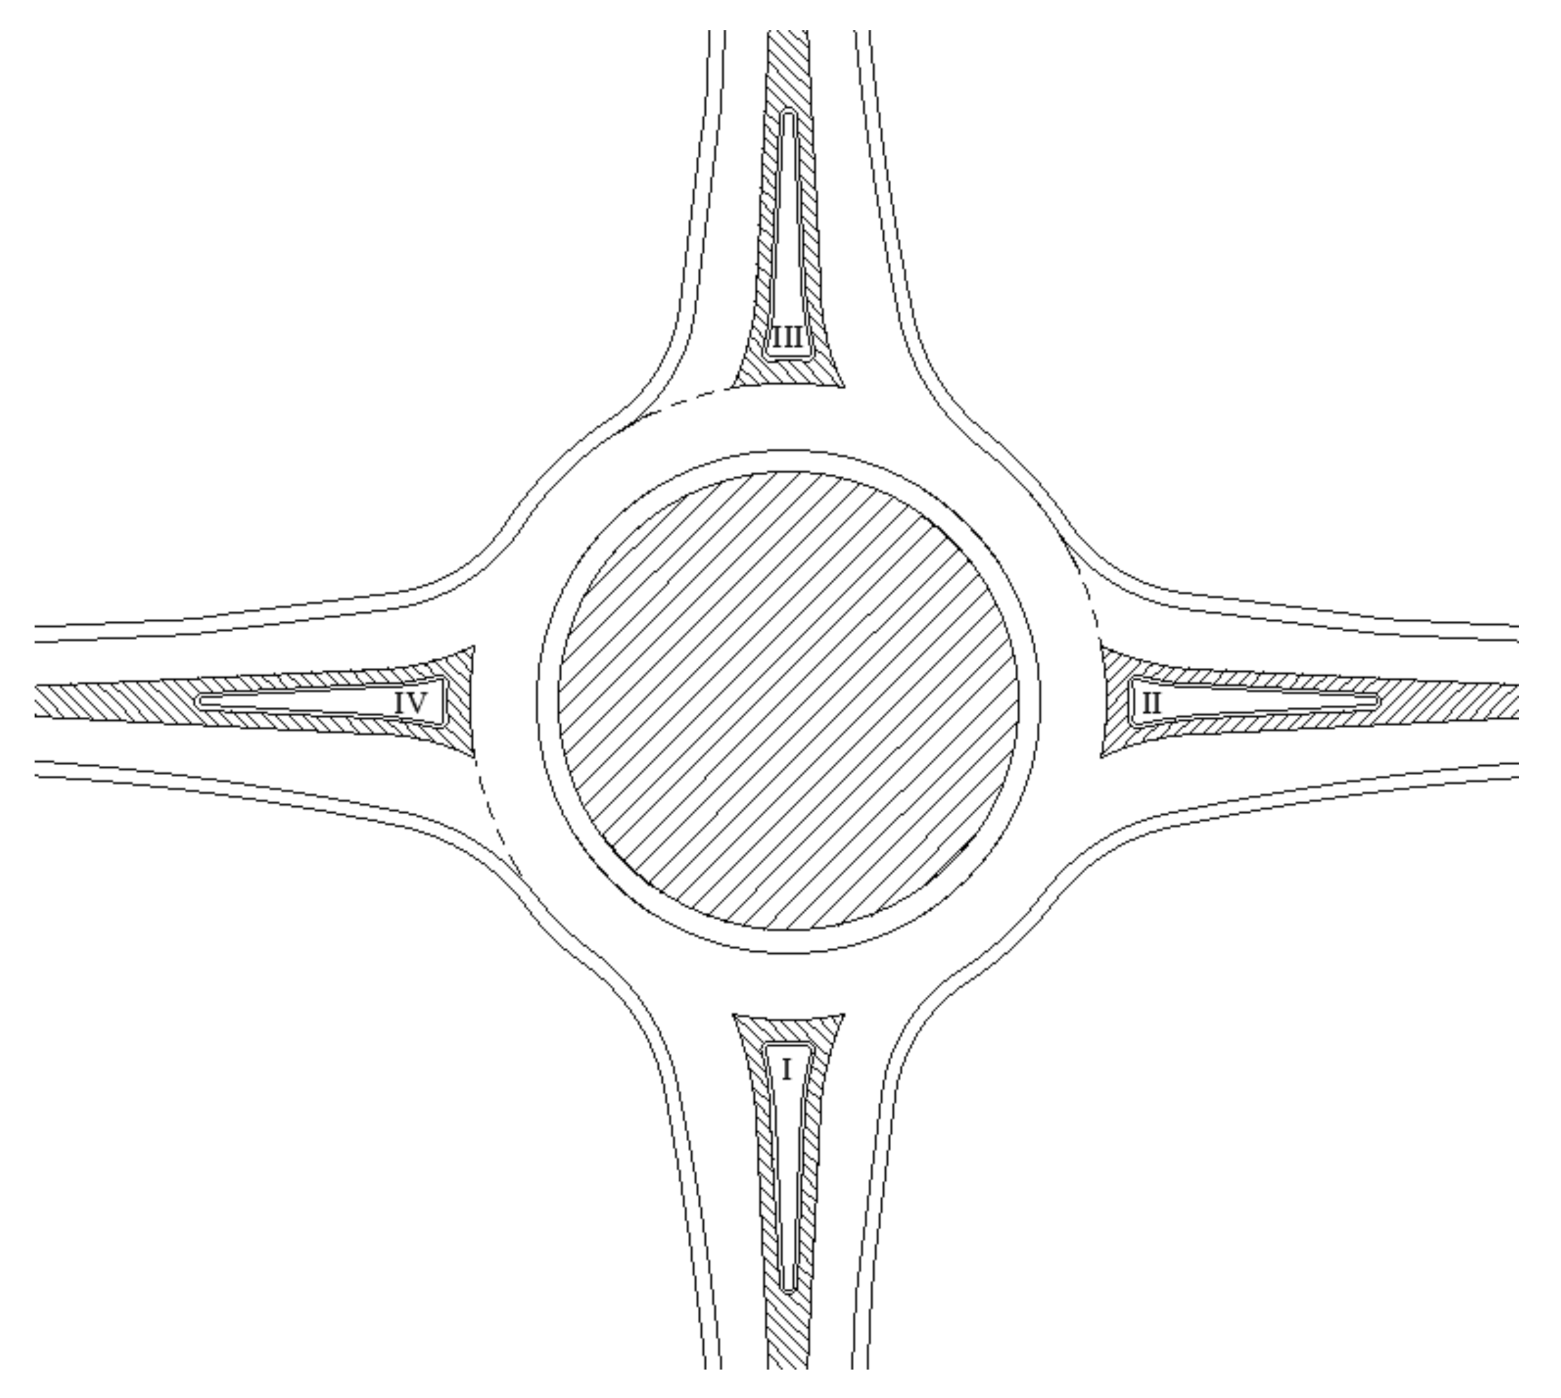
The geometrical layout of the 4-arm urban roundabout considered in this study is given in Figure 1. In the examined junction, the four approaches are labeled with Roman numbers from I to IV in a counter-clockwise direction from the southern arm.
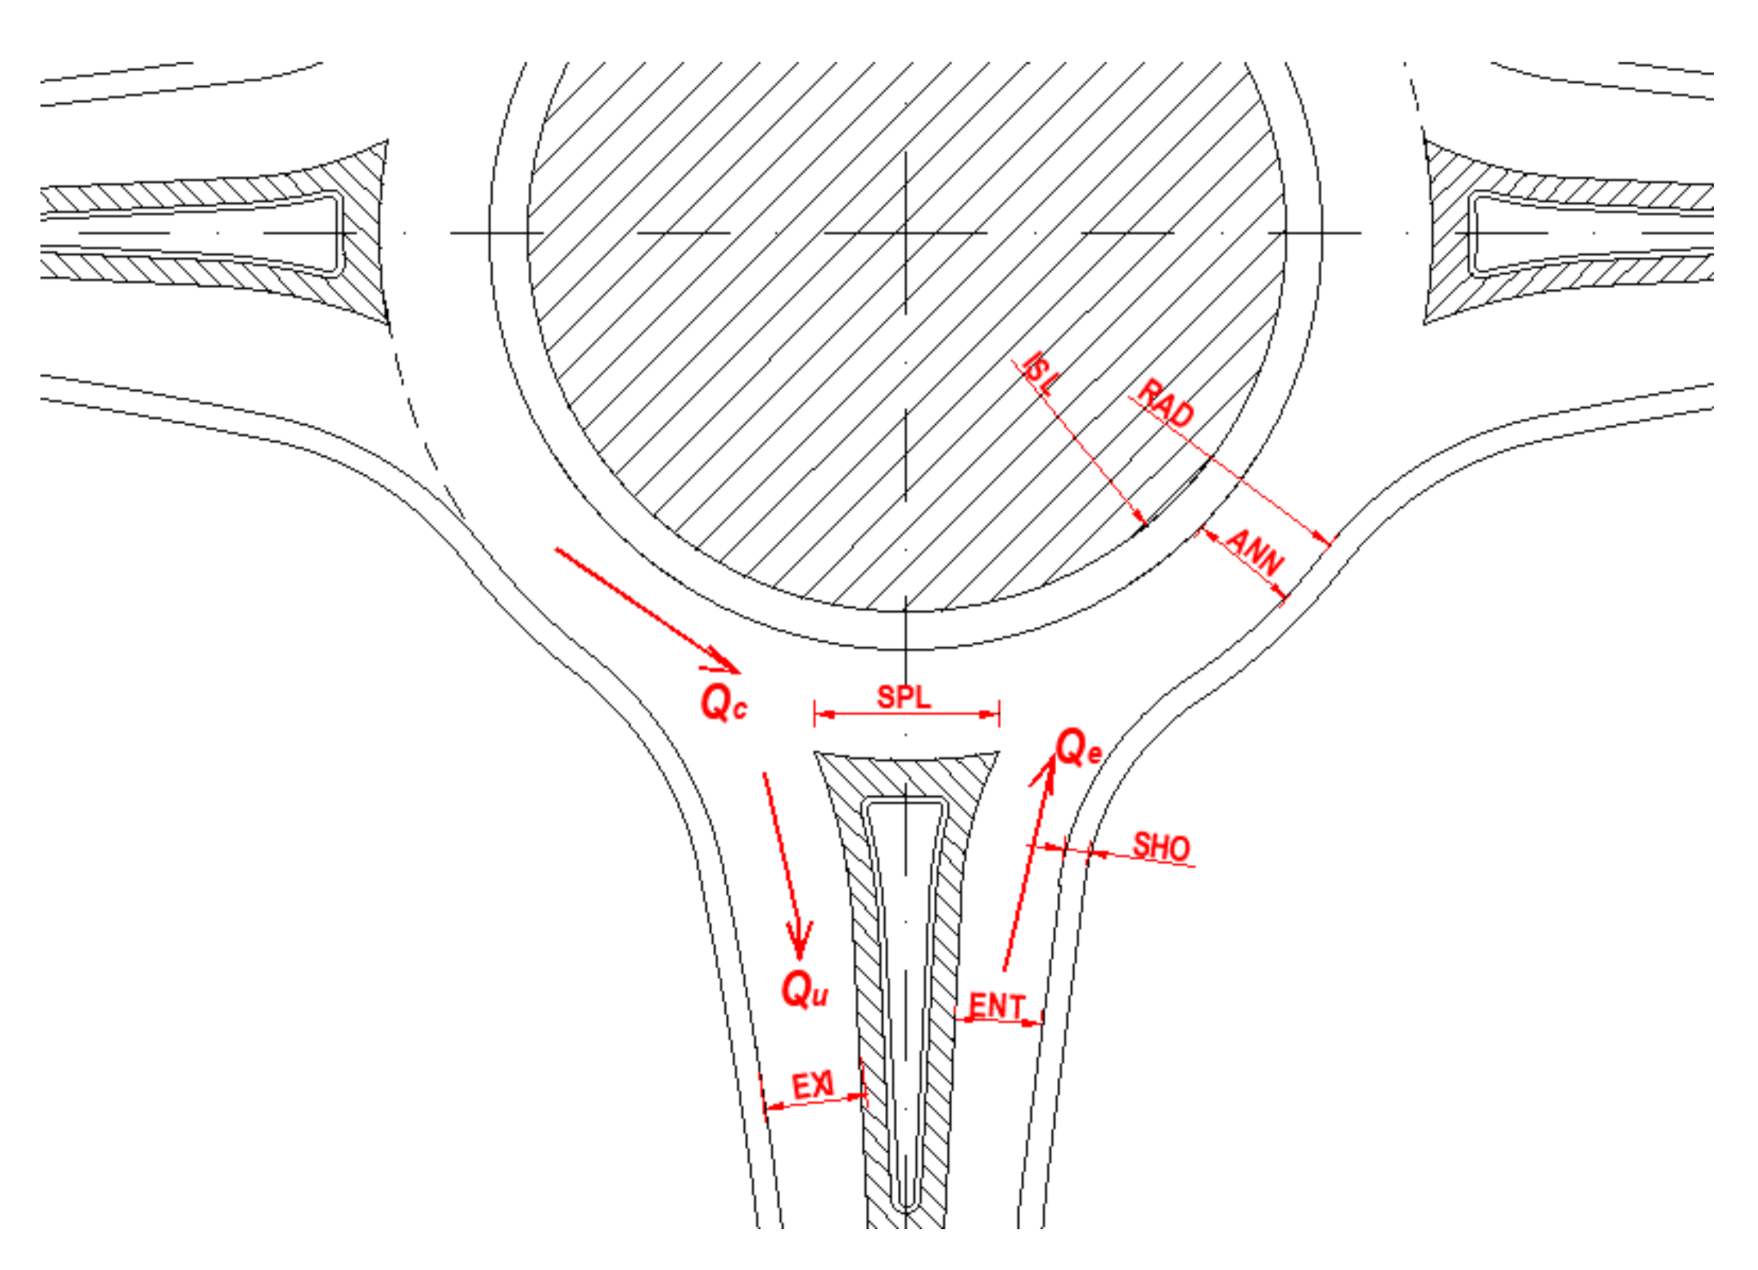
Geometrical characteristics of the examined symmetrical single-lane roundabout are listed in Table 1 according to the nomenclature in Figure 2.
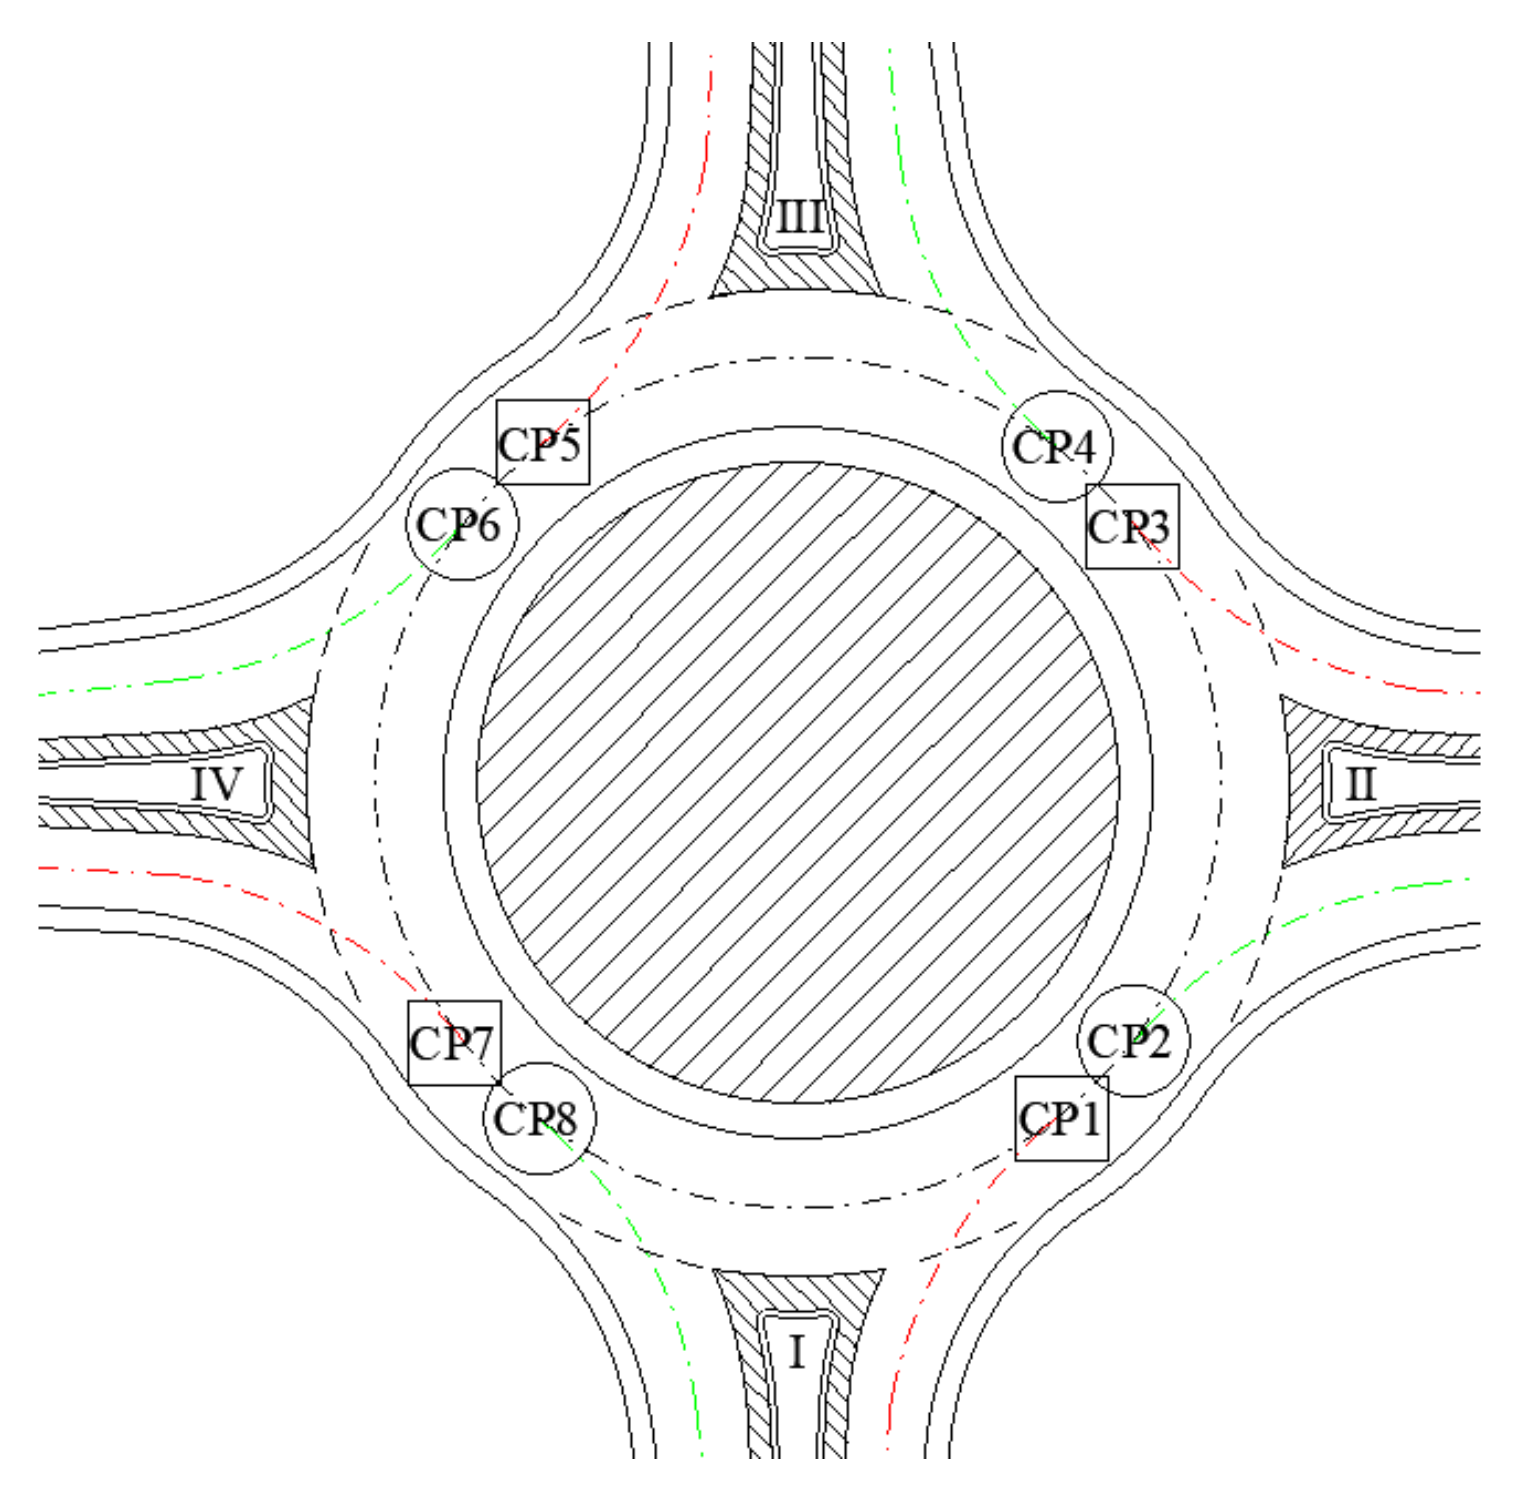
Vehicles and bicycles can perform three maneuvers in all the layouts taken into account: straight ahead, right turn, and left turn [29]. All the trajectories of users start when the head of the vehicle is at the yield line of the entry arm (entrance stage) and end when the rear of the vehicle leaves the circulatory roadway (exit stage). In this study, the authors assume that all the vehicles move as a geometric point (i.e., their center of gravity) in the center of the lane [27], along both the arms and the circulatory roadway. Cyclists share the same driving spaces of the motor vehicles because the circulatory roadway and the carriage width do not permit a safe circulation on parallel alignments. In a single-lane roundabout, each arm is characterized by a pair of conflict vehicle-to-vehicle points (), identified as the common point of both bike and motor vehicle trajectories. One of these points is related to the merging trajectories (), while the other refers to the diverging ones (). Obviously, each roundabout has in total eight . In Figure 3, the four merging are identified by squares in the circulatory roadway, while the four diverging ones are labeled by circles.
From now on, each conflict point will be labeled by three indices:
- -
- the index i, running from 1 to 8, to define the position of the in the roundabout;
- -
- the index , to identify the arm of the roundabout whose traffic flows affect the risk of accident in the considered ;
- -
- the categorical index k, taking as values m or d, for merging and diverging points, respectively.
In more detail, if the generic i-th CP is merging and is related to the j-th arm, it will be labelled by . If the i-th CP is diverging and is related to the j-th arm, it will instead by denoted by.
Given the urban context, all users cross the intersection at a constant speed: 10 km/h for bicyclists and 30 km/h for motor vehicles. Moreover, it is assumed that all road users are not affected by critical physical or psychological characteristics, and that they respect the road signs according to the geometrical and functional layout of the intersection [39].
Under such conditions, the adopted method for risk assessment is obtained by the combination of two models:
- -
- a probability model, which takes into account the randomness related to the perception and the decisions of the road users at intersection and the consequential strategies;
- -
- a damage model, which is concerned with the fact that both motor vehicles and bicycles occupy the same spaces and, at the same time, vary their speed and direction while performing their trajectories.
As already mentioned, the Poisson distribution [40] is assumed to describe the flow of arriving, circulating, or exiting vehicles at the i-th CP of the intersection. Poisson’s law is a very popular discrete probability distribution, commonly used to characterize independent random phenomena occurring within a given time interval, under the assumptions that these events occur with an established constant mean rate, named intensity [40]. In more detail, a random variable X is said to have a Poisson distribution with intensity λ if, for , the probability mass function of X is given by Equation (1):
where n is the number of occurring events. The probability that at least an event occurs follows easily from Equation (1) and is given by Equation (2)
Here, the behavior of each vehicle is assumed to be independent from each other when the traffic volume is far from the roundabout capacity [41], while the elementary unit of exposure is assumed to be equal to 1 s [42]. From now on, the labels B and V will denote bicycles and motor vehicles respectively. The object of interest here is the probability, p, that at least a bike and at least a motor vehicle driving around the roundabout are simultaneously in the considered CP and within the elementary unit of exposure. Following the assumption of independence, it results as the product given by Equation (3):
where pV and pB are the probabilities that at least a motor vehicle (namely, a bike) driving round the roundabout is in the considered CP within the elementary unit of exposure, as described by Equation (2), and the intensities λV and λB are thus defined as the values of the average number of events per given arm and elementary unit of exposure calculated for motor vehicles and bikes, respectively; further details on the estimation of the intensity will be provided below.
Now, this general argument has to be properly adapted to each CP, considering the following:
- -
- two categories of CP, that are merging or diverging, denoted by the categorical index (cf. Figure 3);
- -
- the traffic flow distributions in the roundabout characterizing each type of CP.
In a merging CP, collisions involve entering motor vehicles and circulating bikes, or circulating motor vehicles and entering bikes, while in a diverging CP collisions regard exiting motor vehicles and circulating bikes, or circulating motor vehicles and exiting bikes. Thus, the probability of a collision between a motor vehicle and a bike in is given by Equation (4)
where
- -
- is the probability of having at least a circulating vehicle within the elementary unit of exposure. The intensity depends on Qj;V,C, the number of circulating vehicles per hour related to the -th arm;
- -
- is the probability of having at least a circulating bike within the elementary unit of exposure. The intensity depends on Qj;B,C, the number of circulating bikes per hour related to the -th arm;
- -
- is the probability of having at least an entering vehicle within the elementary unit of exposure. The intensity depends on Qj;V,e, the number of vehicles entering the roundabout per hour related to the -th arm;
- -
- is the probability of having at least an entering vehicle within the elementary unit of exposure. The intensity depends on Qj;B,e, the number of vehicles entering the roundabout per hour related to the -th arm.
The probability of a collision between a motor vehicle and a bike in is given by Equation (5)
where:
- -
- and have been discussed above;
- -
- is the probability to have at least a vehicle leaving the roundabout at the -th point, within the elementary unit of exposure. The intensity depends on Qj;V,o, the number of vehicles exiting the roundabout per hour at the -th arm.
- -
- is the probability of having at least a bike leaving the roundabout at the -th point within the elementary unit of exposure. The intensity depends on Qj;B,o, the number of bikes exiting the roundabout per hour at the -th arm.
Note that in both Equations (4) and (5) a simplified notation is introduced, omitting the category and arm for the sake of simplicity and clarity, that is instead of . The simplified notation will be useful to define the risk of collision; even if the probability of collision at the -th critical point depends clearly on its category and is computed using the traffic flow related to the corresponding arm.
Finally, the relation that ties each flow Q, measured per hour, to the corresponding intensity . is given by Equation (6)
where 3600 is the amount of seconds in one hour.
Having regard for the damage model, the danger classification depends on the balance between two reaction times: the one available to a road user to avoid a collision in a (ART) and the so-called required reaction time (RRT), assumed to be equal to 3 s, according to the Italian standards [37,43]. ART includes time for perception, reflection, reaction, and implementation of maneuvers and it can be viewed as the time spent by a user approaching a given along the available reaction distance (ARD). The distance ARD involves both the speed values of road users and the required sight distance to operate safely. In view of these considerations, the minimum safety condition is given by Equation (7) as follows:
that is, the time available to a road user to avoid a collision in a is not smaller than the required reaction time. Comparing ART and RRT allows us to estimate the expected damage on bikers when an interaction with a motor vehicle occurs in a CP. Equation (8) describes the condition proposed in [9] to compute the damage D when vehicles and bikes interact:
Table 2 lists the danger classification adopted in this study: it complies with the one proposed in [9].
According to the defined probability and damage models, the risk of collision Ri for the critical point is given by Equation (9)
where and are the probability of a collision and the damage in respectively.
The risk of collision between bikes and motor vehicles all over the roundabout ( (defined as “risk of collision”) is given by the following Equation (10):
where Di is the expected damage calculated for the i-th CP, while the index i covers all the potential CPs. As aforementioned, for each i, Di depends only on the geometric configuration of CPi, while the corresponding pi takes into account also the type of CPs, that is, merging (m) or diverging (d), and the related arm of the roundabout.
Finally, the average value of the damage () has been compared to Di of each CPi to evaluate how it depends on the geometrical layout of the intersection (Equation (11)):
With regard to the traffic input data, the values of the traffic flows for motor vehicles and bikes were obtained before the pandemic crisis from a 15 min-long survey of the traffic according to the Highway Capacity Manual [44]. The entry flows for the i-th arm Qi;V,e and Qi;B,e, for motor vehicles and bikes respectively, are collected in Table 3.
Table 4 and Table 5 list the distribution matrices for motor vehicles and bicycles, respectively. The entries and , corresponding to the x-th row and the y-th column, describe the percentage of motor vehicles and bikes respectively, entering from the x-th arm and leaving the roundabout from the y-th arm.
Data in Table 3, Table 4 and Table 5 allowed calculation of the exit flows Qj;V,o for motor vehicles and Qj;B,o for bicycles (Table 6 and Table 7, respectively).
For each , the traffic flow circulating in front of the j-th arm of the roundabout depends on flows entering and exiting from the previous left arms (Table 8 for motor vehicles, Table 9 for bicycles), as follows from Equation (12) to (15):
where describes the percentage of vehicles entering from the i-th arm and leaving the roundabout using the j-th arm.
The proposed model was implemented to assess for the current layout (L0) and other modified ones. Both geometric and functional modifications have been investigated in order to identify the best option to improve the safety level for cyclists:
- Layout 1 (L1) has an external roundabout for cyclists (named roundabike by the authors). Therefore, a single-lane rotatory bike path has been added to the starting layout: it requires large urbanistic spaces; no cycle paths are in the approaching arms;
- Layout 2 (L2) has a roundabike whose external circumference coincides with that of the current roundabout: it implies a reduction of the current RAD to maintain the intersection in the current spaces; no cycle paths are in the approaching arms;
- Layout 3 (L3) differs from L1 for the presence of a cycle path in all the approaching arms;
- Layout 4 (L4) differs from L2 for the presence of a cycle path in all the approaching arms;
- Layouts 5 to 9 (L5 to L9) have the same geometrical configuration of L0 to L4, but they differ from L0 to L4 for the cyclists traffic volume (+10% volume surveyed during the current pandemic crisis);
- Layouts 10 to 14 (L10 to L14) have the same geometrical configuration of L0 to L4, but they differ from L5 to L9 for the cyclists traffic volume (+30% volume expected as consequence of the current pandemic crisis).
3. Results
Having regarded the starting layout in Figure 4 and its geometrical characteristics in Table 1, Figure 4 represents the position of each examined CPi (CP1 to CP8). The entry maneuvers are red, the exit maneuvers are in green and the circulating trajectories are in black.
The implementation of the adopted methodology allows us to calculate the value of pi for each CPi (Equation (1) to (5)) (Table 10).
Values of ART depend on the CP type (Figure 3) and its available reaction distance calculated along the trajectories of road users:
- -
- for merging CPs, ART depends on the available distance for the reaction calculated along the trajectory of merging vehicles from 15 m before the yielding line to the identified merging CP. ARD is 22.8 m; ART is 2.74 s for motor vehicles and 8.22 s for bikes;
- -
- for diversion CPi, ART depends on the available distance for reaction calculated along the trajectory of vehicles in the circulatory roadway from the past splitter island before the exit arm to the identified diversion CP. Indeed, according to [45], drivers should use a right turn signal when passing the exit before the one to be taken. ARD is 16.9 m; ART is 2.02 s for motor vehicles and 6.08 s for bikes.
- -
- Table 11 lists the results of the damage analysis.
Data listed in Table 11 highlight that the low speed of bikers (i.e., 10 km/h) ensures them enough ART to avoid collision with motor vehicles; on the other hand, Di values related to maneuvers of motor vehicles reveal a dangerous interaction between the two types of road users (i.e., 0.586 for diverging and 0.824 for the merging ones). Therefore, only maneuvering flows of motor vehicles contribute to the assessment of the Ri values (Table 12).
Therefore, in L0, is equal to 2.87 × 10⁻² according to Equation (10).
The proposed probabilistic approach has been implemented to roundabouts whose geometrical and functional layouts differ from L0.
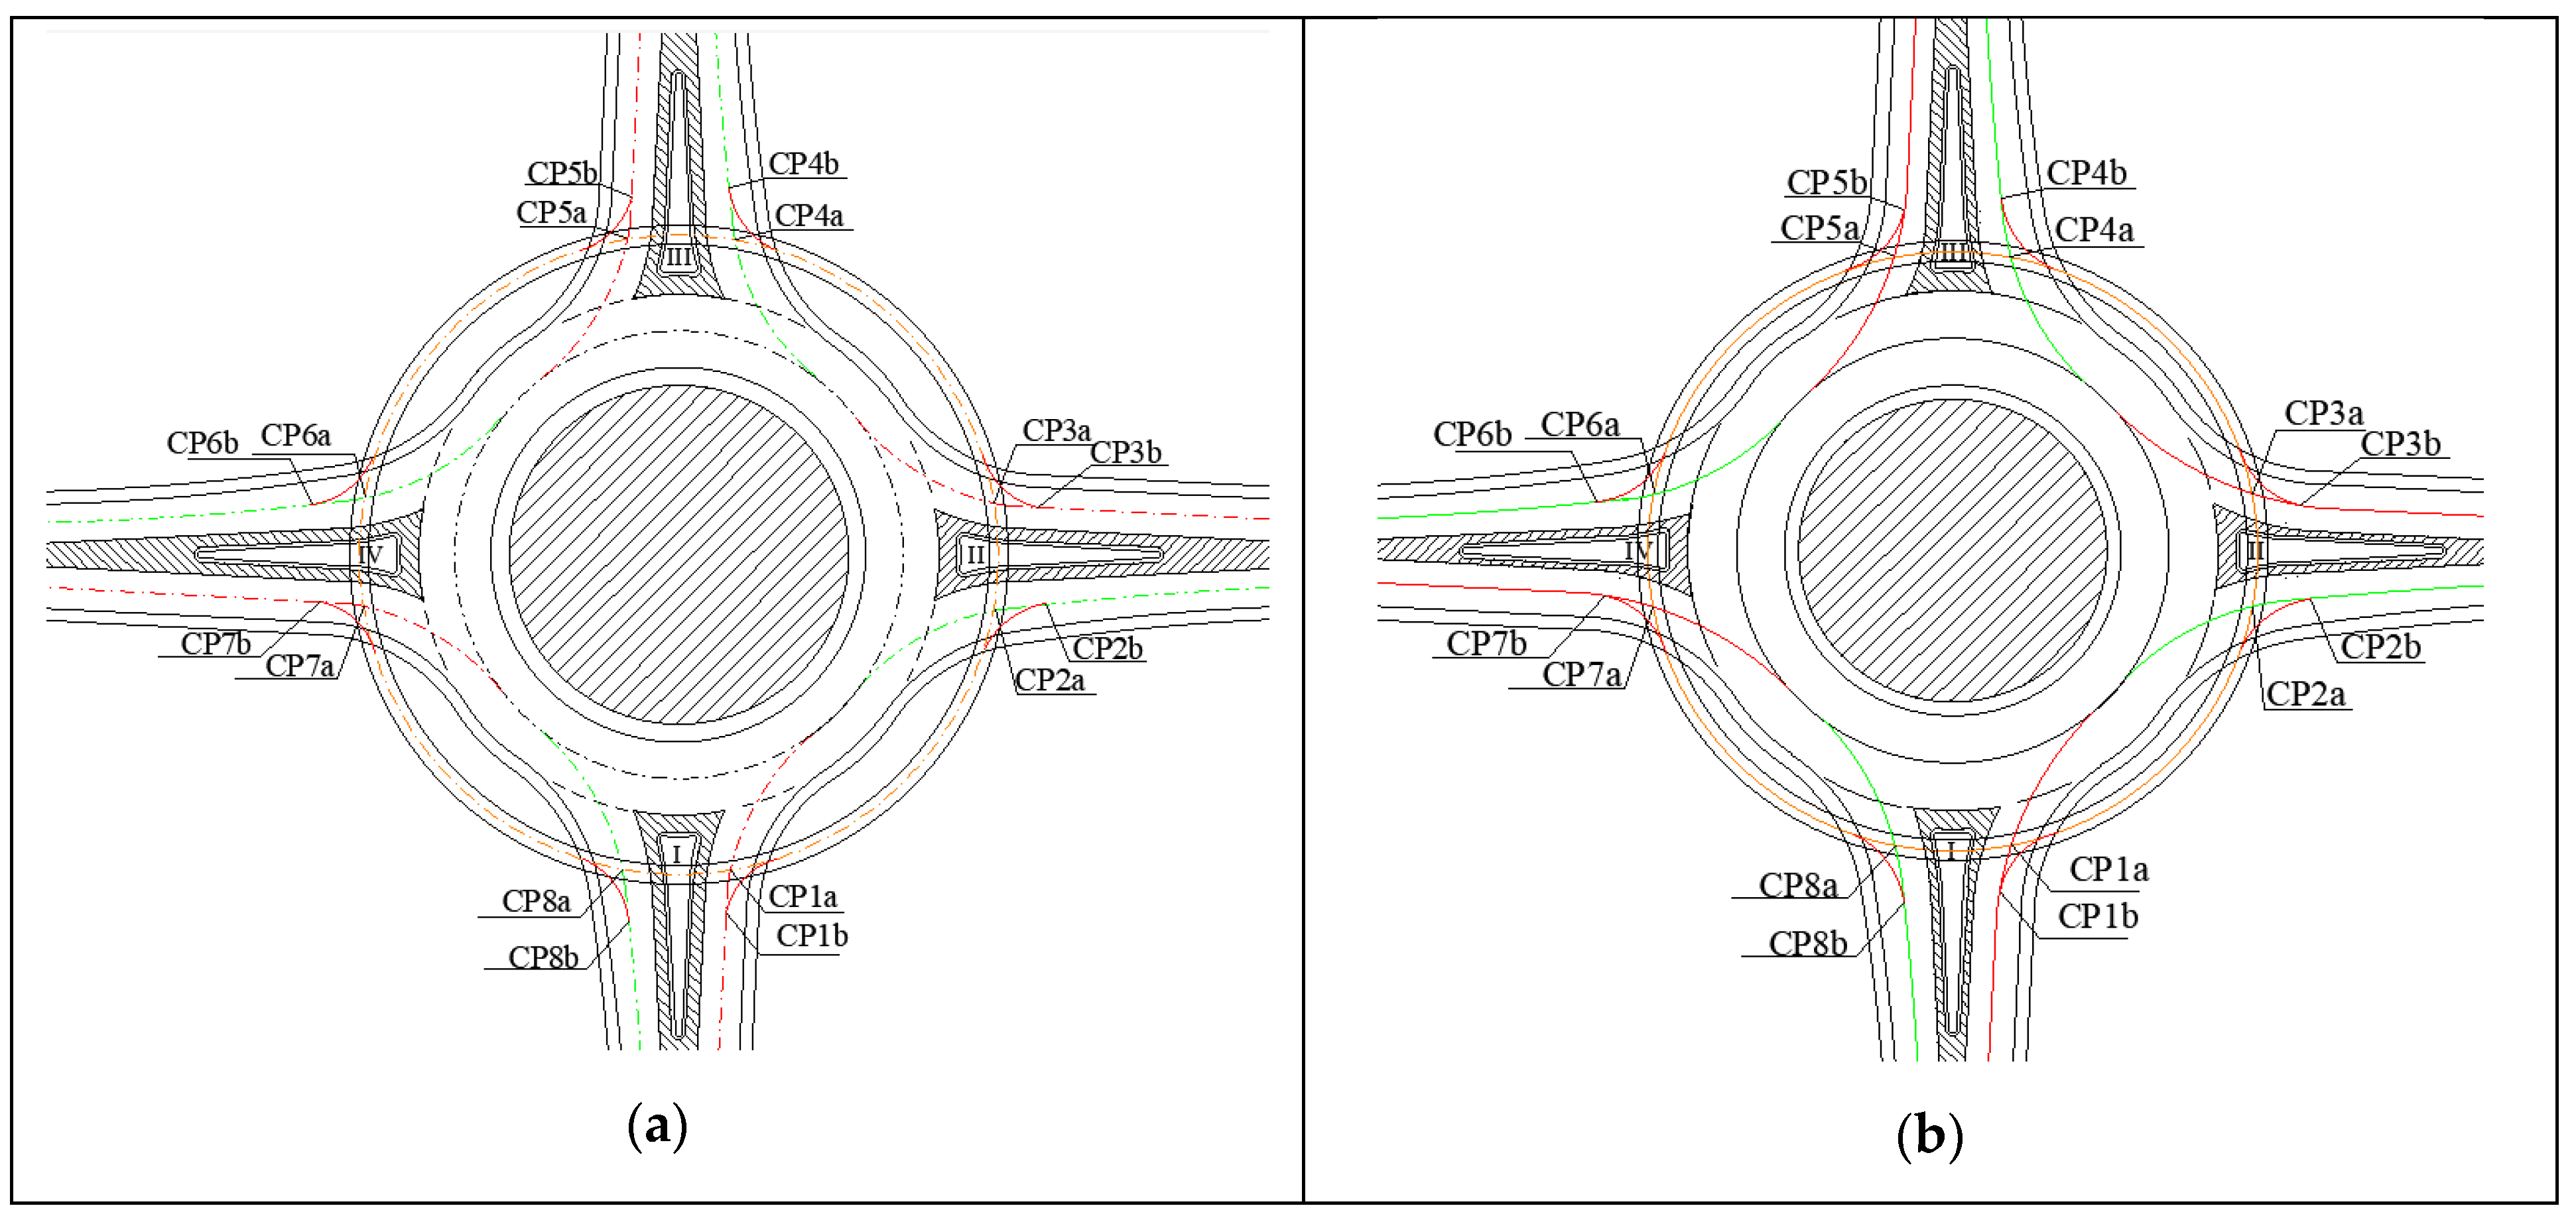
In L1 and L2 cyclists do not run on the rotatory carriageway, but a roundabike is reserved for their movement. Merging/diverging CPi turn into crossing CPi and move their position outwards from the roundabout both in L1 (Figure 5a) and in L2 (Figure 5b).
The modified configurations imply both geometrical and functional modification:
- RAD in L2 is 15.80 m (23 m in L0): the new roundabout is compact instead of conventional. It implies modification of ANN: it is 7 m (6 m in L0);
- radii of trajectories vary (rotatory radius of motor vehicles decreases in L2 compared to L1 and L0, rotatory radius of bikes increases from L2 −22.25 m- to L1 −26.50 m- compared to L0 −18.50 m);
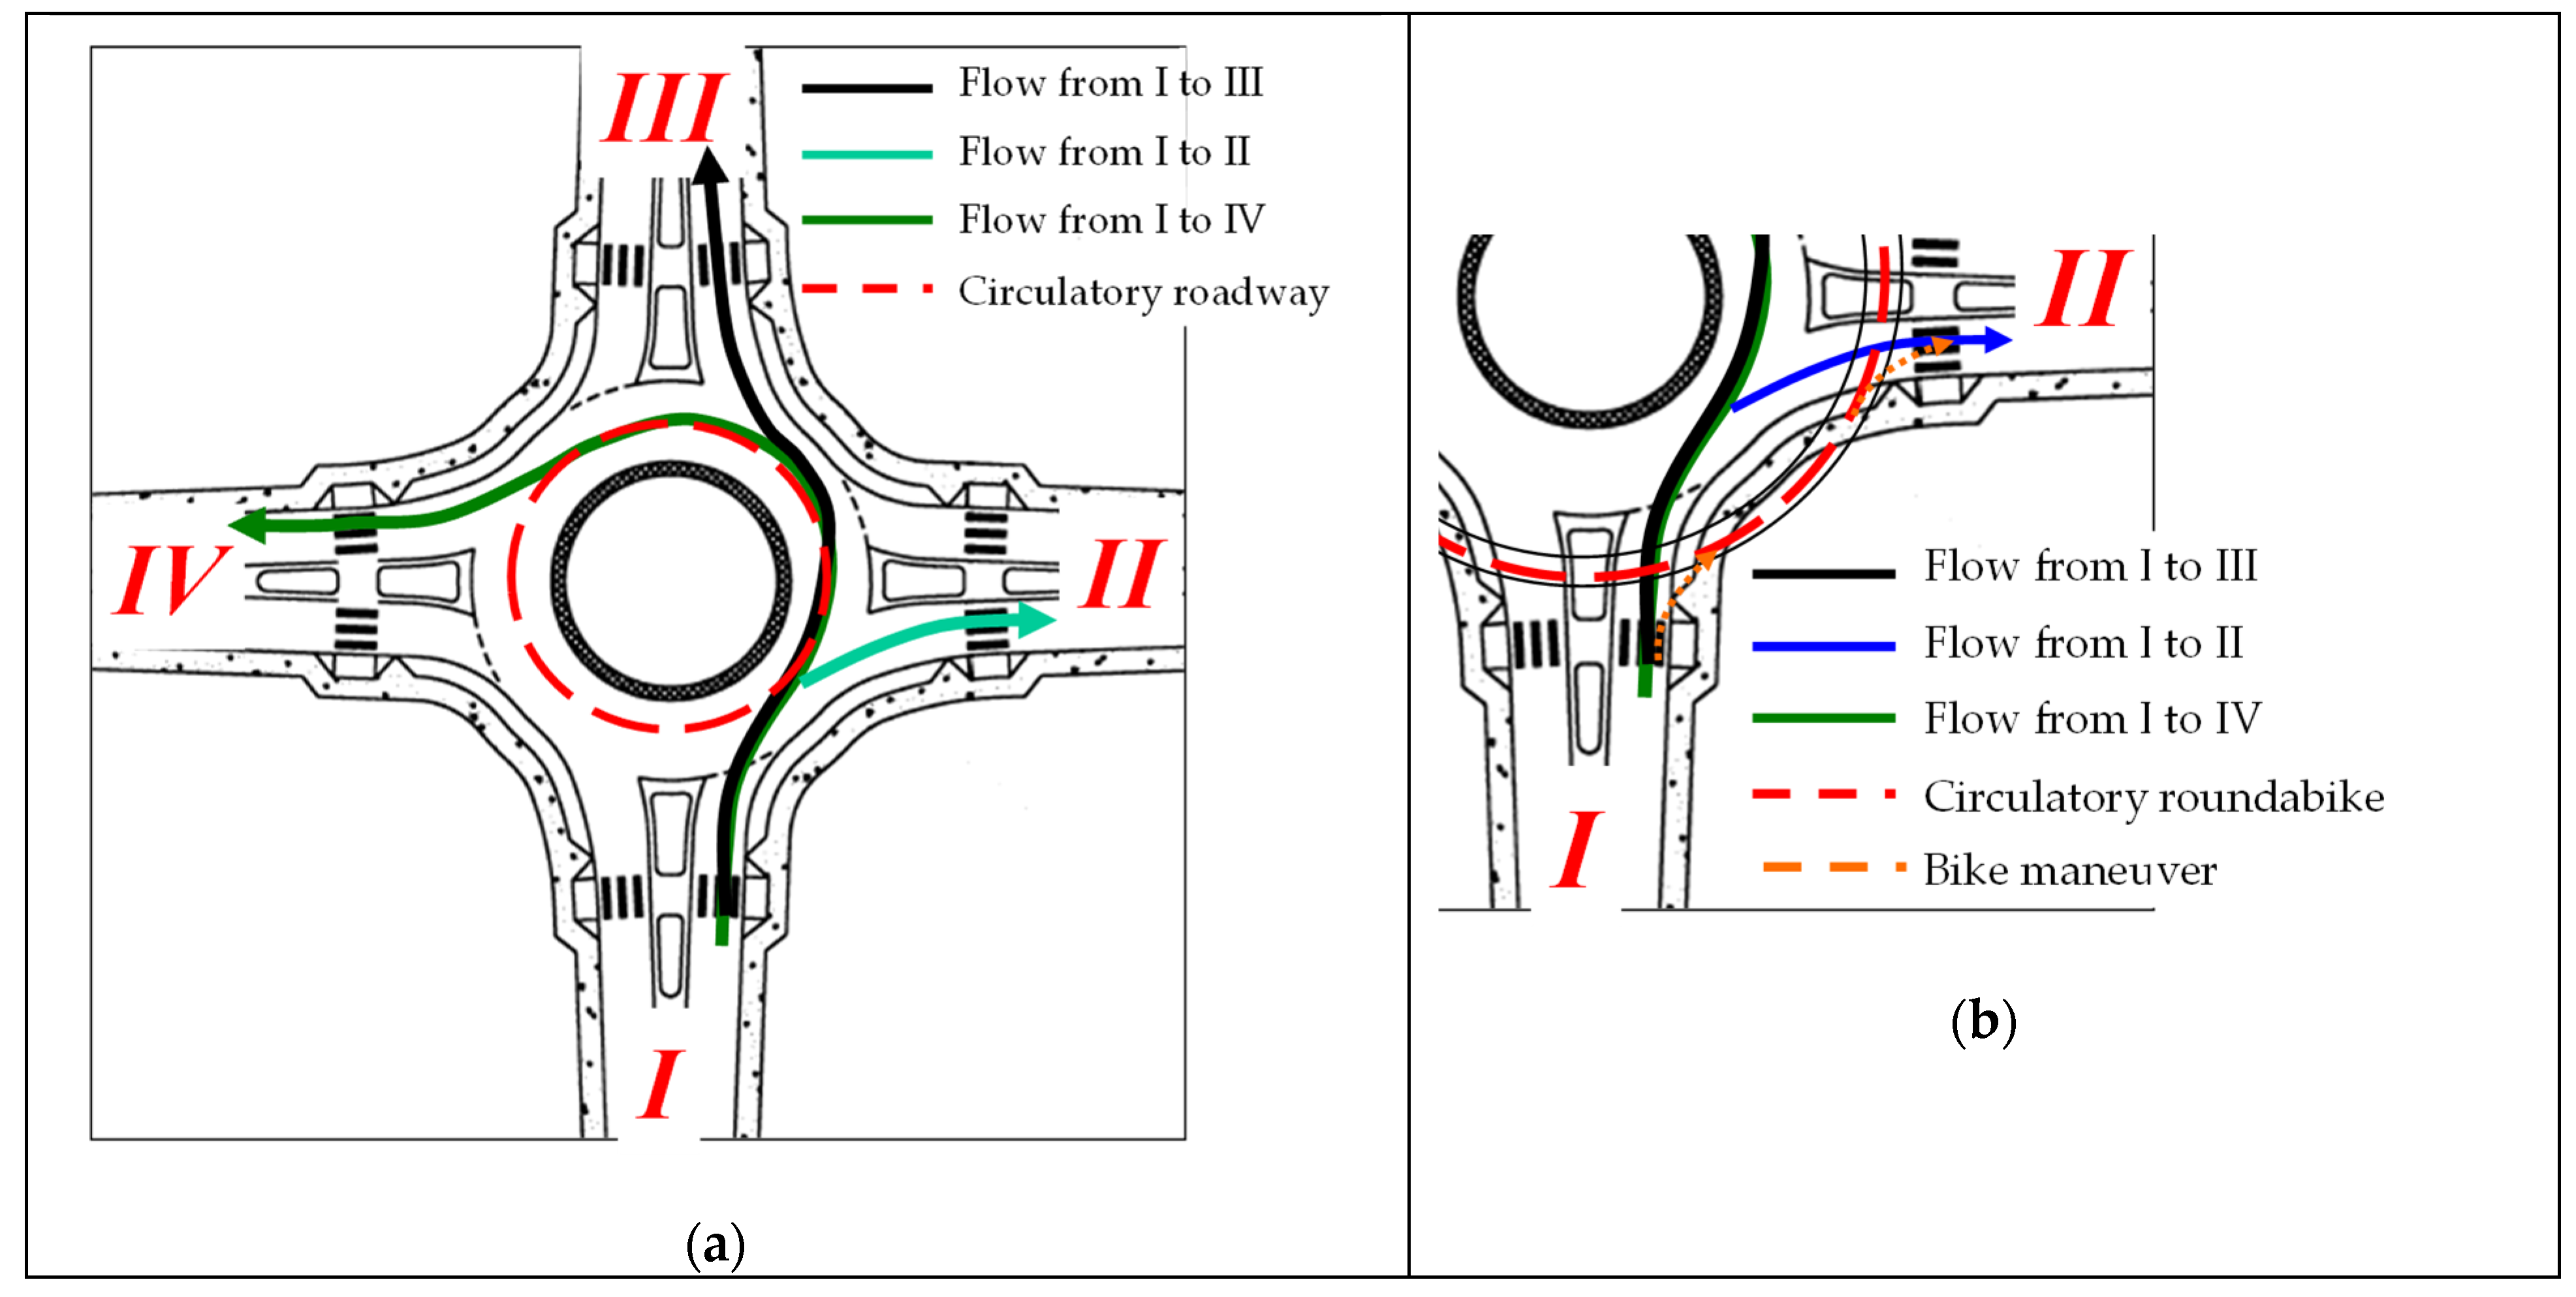
- flows in CPi vary: in L0 they refer to a circulating flow (both motor vehicles and bikes) that is represented by the red-dotted circle in Figure 6a and a maneuvering flow (in Figure 6a only the maneuver trajectories from I are represented), while in L1 and L2 they respectively refer to both the bike circulating flow and a motor vehicle maneuvering flow (e.g., intersection between the red dotted circle and the blue-red-black motor vehicle trajectories in Figure 6b), and a bike maneuvering flow and the motor vehicle trajectories (e.g., conflicts between the orange maneuvers of bikes and the black and blue trajectories of motor vehicles along I and II, respectively, in Figure 6b).
- Both in L1 and L2 the roundabout features priority crossings for cycles flow.
Moreover, L1 and L2 imply a modification of the CPs number, position, and type compared to L0.
- In L1 and L2 there are 16 CPi (Figure 5a,b, respectively);
- CPi are in the arms instead of in the rotatory carriageway;
- eight CPi are crossing ones (i.e., CPia: drivers reduce their speed and give way to cyclists), four are diversion ones (i.e., CP1b, CP3b, CP5b, and CP7b), and four are merging ones (i.e., CP2b, CP4b, CP6b, and CP8b: drivers should give way on the exit of the roundabout).
In relation to the odd crossing CPia (i.e., when motor vehicles approaching the roundabout could impact the cyclists on the roundabike) the authors verified the clear sight triangle using the assumed speed values for cyclists and motor vehicles. More specifically, the authors assumed that the sight triangle on the left of the motor vehicles approaching the roundabout was unobstructed by structures and visual obstacles between 30 inches and 7 feet [46] and that the sight line was a tangent to the first potential obstruction, at the intersection between the external side of the cycle path and the exit arm. Therefore, the decision point for CP1a, CP3a, CP5a, and CP7a is for L1 at 35.3 m from the yield line and for L2 at 36.4 m for the yield line. In relation to the even crossing CPia (i.e., when motor vehicles are exiting the roundabout and could impact the cyclists on the roundabike), the sight triangle on the right of the motor vehicles has got the sight line between the merging conflict point of the previous arm and the intersection between motor vehicles and bike trajectories in the next arm. Therefore, the decision point for CP2a, CP4a, CP6a, and CP8a is at 17.9 m and 14.48 before the yield line of the exit arm for L1 and L2, respectively. For merging CPi (i.e., CP2b, CP4b, CP6b, and CP8b), the sight triangle on the right of the motor vehicles has got the sight line between the merging conflict point between motor vehicles of the previous arm and the CP between motor vehicles and bike trajectories in the next arm. Therefore, the CP point is 21.7 m and 18.2 m after the merging conflict point of the previous arm for L1 and L2, respectively. For diverging CPi (i.e., CP1b, CP3b, CP5b, and CP7b), the straight arm ensures enough visibility to drivers of motor vehicles and the single-lane in the carriageway forces all users to maintain the lowest speed between theirs (i.e., 10 km/h): such conditions permit the avoidance of a collision between motor vehicles and bikes. In the model, the decision point has been assumed as 15 m before the diverging conflict point both in L1 and L2.
Table 13 summarizes the results of the risk analysis for L1 and L2: pi values depend on the volume traffic flows on the examined arm, while ART and Di depend on the roundabout geometry and vehicles’ trajectories: they are the same for each identified CPi type.
Given the traffic flows and their distribution over the arms, which do not depend on the layout, the risk level values depend on the roundabout geometry. The roundabike in L1 and L2 significantly reduces the risk of collision between bikes and motor vehicles ( of L0 is 2.87 × 10⁻²). Particularly, L1 is safer than L2: according to Equation (10), is 1.52 × 10⁻² and 1.80 × 10⁻² for L1 and L2, respectively. The best safety performances of L1 are due to the higher radius of the intersection that implies longer trajectories of motor vehicles approaching to crossing and merging conflict points at exit arms. The maximum value of the risk is in CP8a (crossing conflict point in the exit arm I) both in L1 (2.31 × 10⁻³) and in L2 (2.75 × 10⁻³); the diverging conflict points (i.e., CP1b, CP3b, CP5b, CP7b) are solved by the single-lane configuration of the approaching arm: all vehicles, both motor and non-motor) move at a safe distance at the same speed without the opportunity to overtake. The crossing conflict points CP5a and CP3a are the less hazardous ones: Ri is 6.02 × 10⁻⁵ and 9.61 × 10⁻⁵ in L2, and 1.20 × 10⁻⁴ and 1.92 × 10⁻⁴ in L1, respectively.
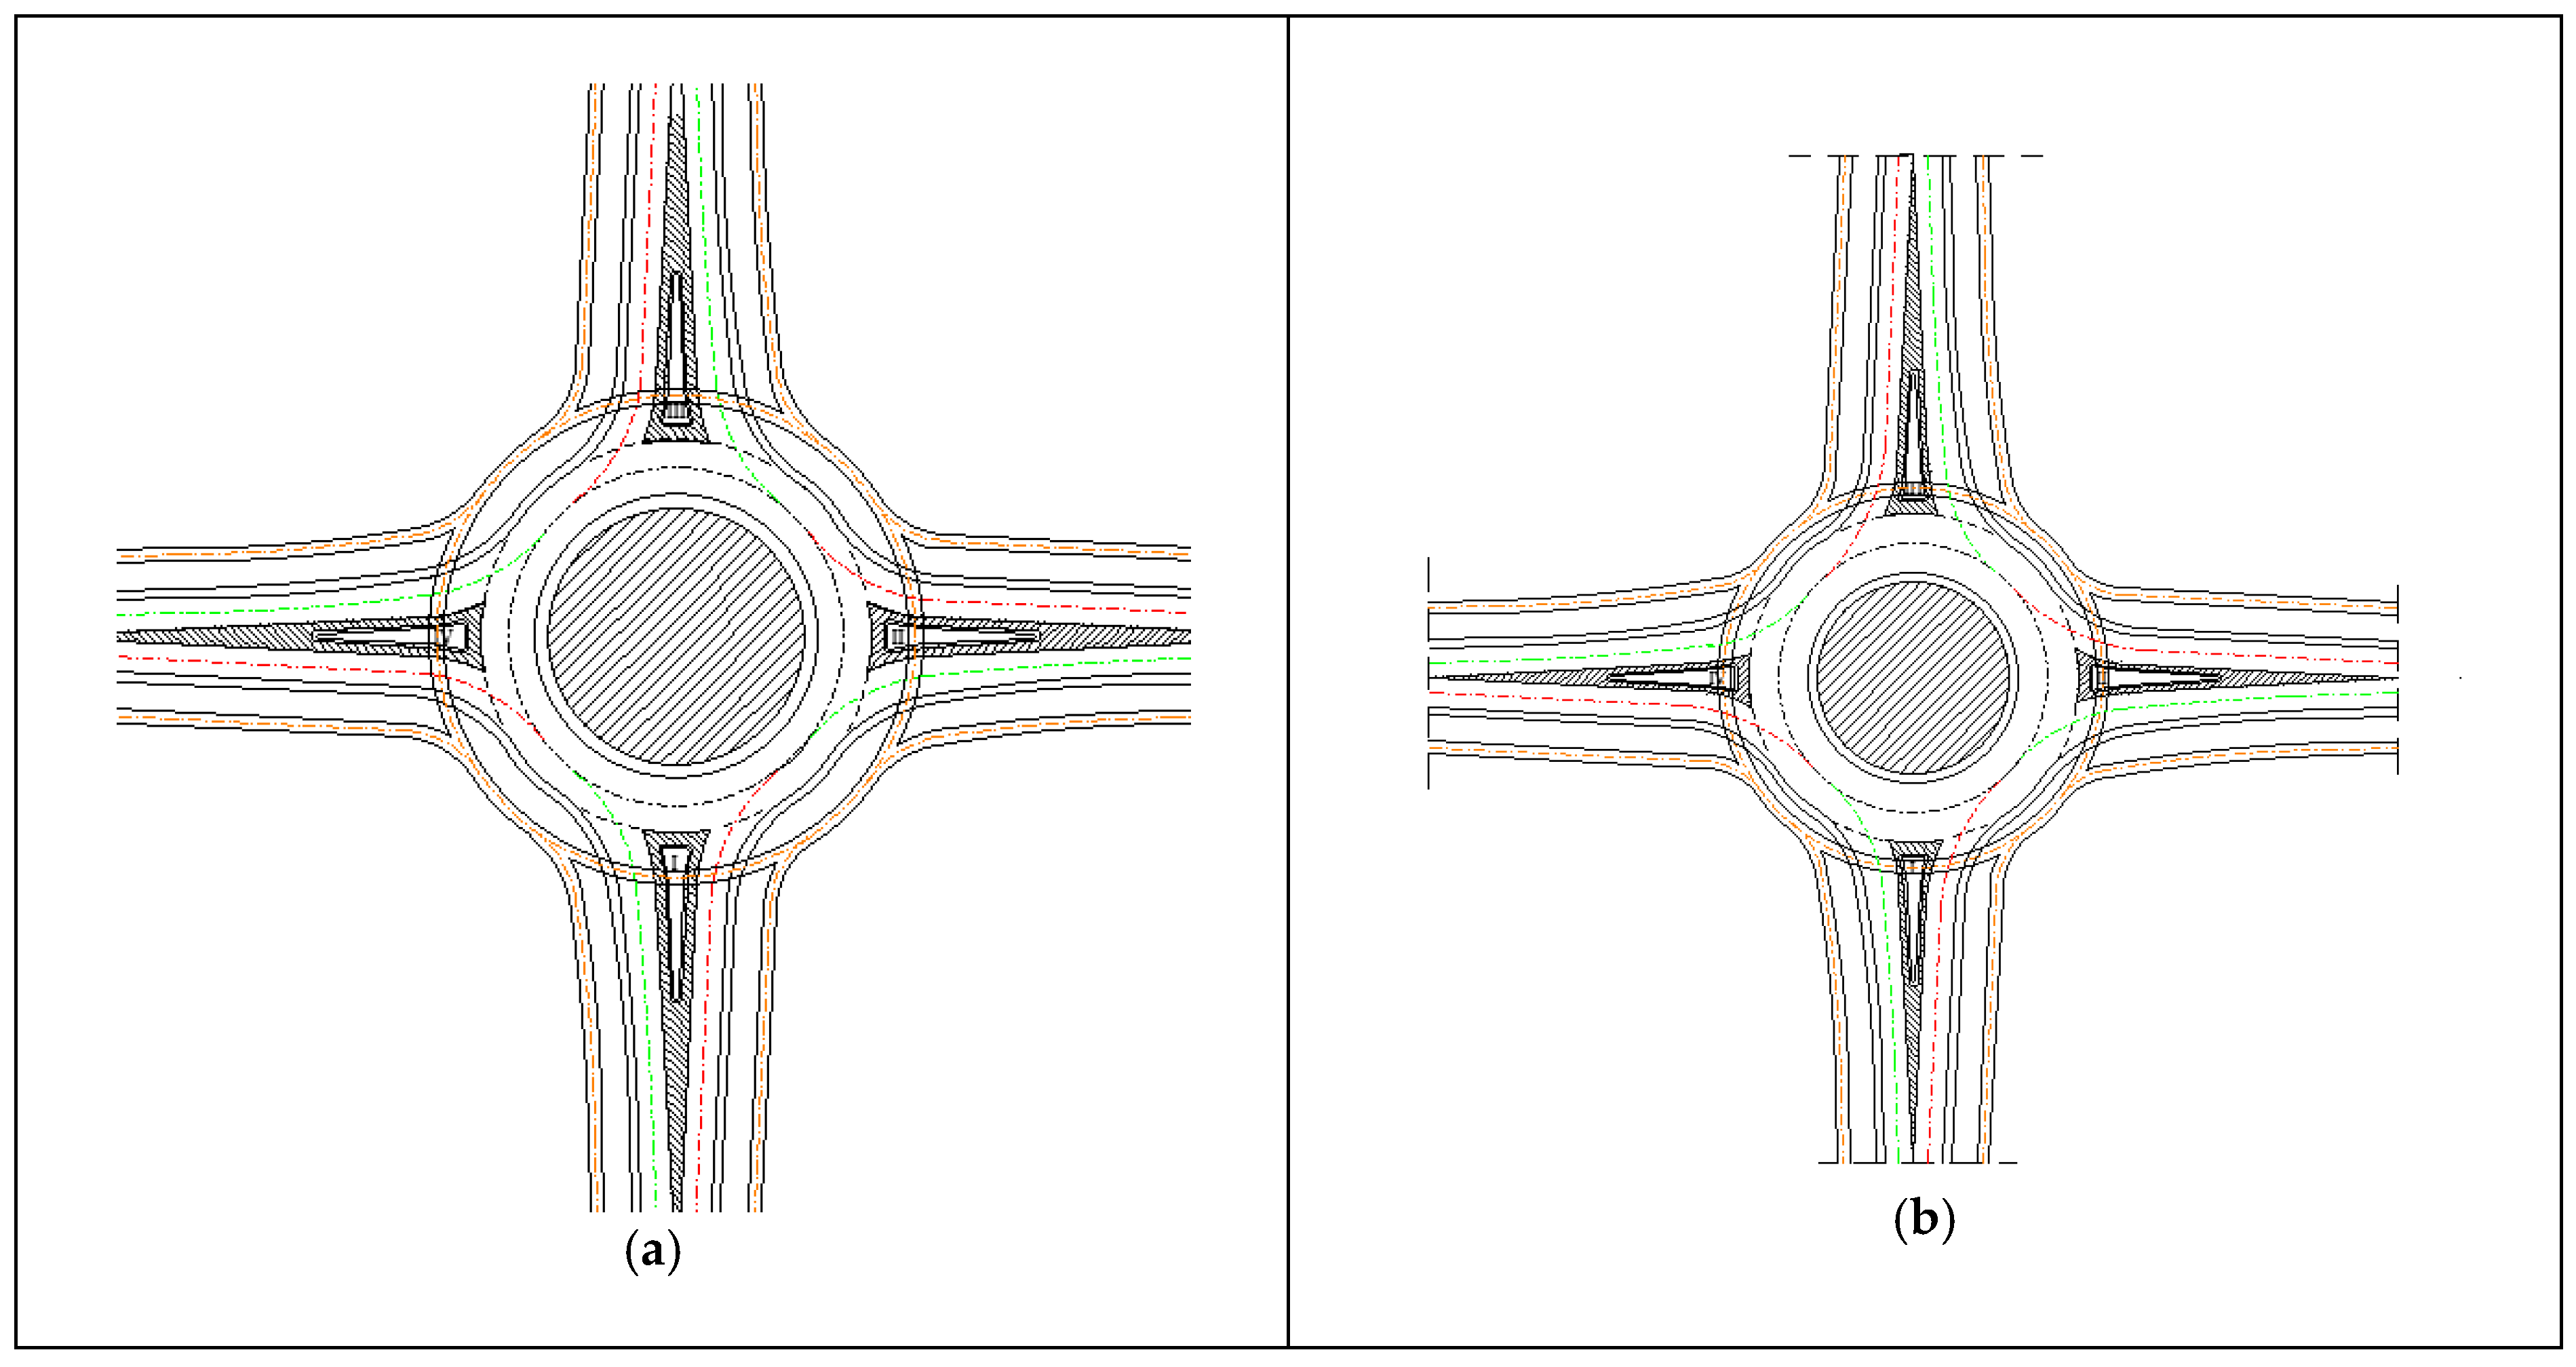
The same approach has been implemented to layouts L3 and L4 (Figure 7a,b, respectively). In such layouts, the probability of collision does not depend on the examined configuration, therefore the pi values in L3 and L4 coincide with those in L1 and L2, respectively. Moreover, all merging and diverging conflict points (i.e., CPib) in L1 and L2 are not more than in L3 and L4. Therefore, the examined conflict points are the only crossing ones (i.e., CPia with i ranging between 1 and 8): is 9.09 × 10⁻³ and 1.01 × 10⁻³ for L3 and L4, respectively.
Finally, the proposed model has been implemented to the examined layouts, modifying their traffic flow according to the observed modal shift from public mass transport to light private transport as a consequence of the current pandemic crisis [47] or in agreement with the strategic policies of city managers and urban planners [48]. Table 14 lists the input data: layouts L5 to L9 and L10 to L14 have the geometrical configuration of L0 to L5, respectively. With regard to the traffic flows, they are distributed according to Table 3 and Table 4. Bike volumes in L5 to L9 and L10 to L14 is 10% and 30% more than QB,e in Table 3, respectively.
The values of Di in Table 15 highlight that in all the examined layouts there are CPi whose ART is enough to avoid interaction between motor vehicles and bikes. The maximum damage of each Li is seriously affected by the geometrical layout of the counter-clockwise circulation. The roundabike external to the current roundabout (i.e., in L1 and L3) reduces max Di compared to the current condition (i.e., L0), while the reduction of RAD to have the external roundabike within the area of the current roundabout (i.e., in L2 and L4) has a detrimental effect on max Di. The presence of a cycle path in both approaching and exiting arms does not affect the damage values. The same applies to the traffic volume, according to Equation (8).
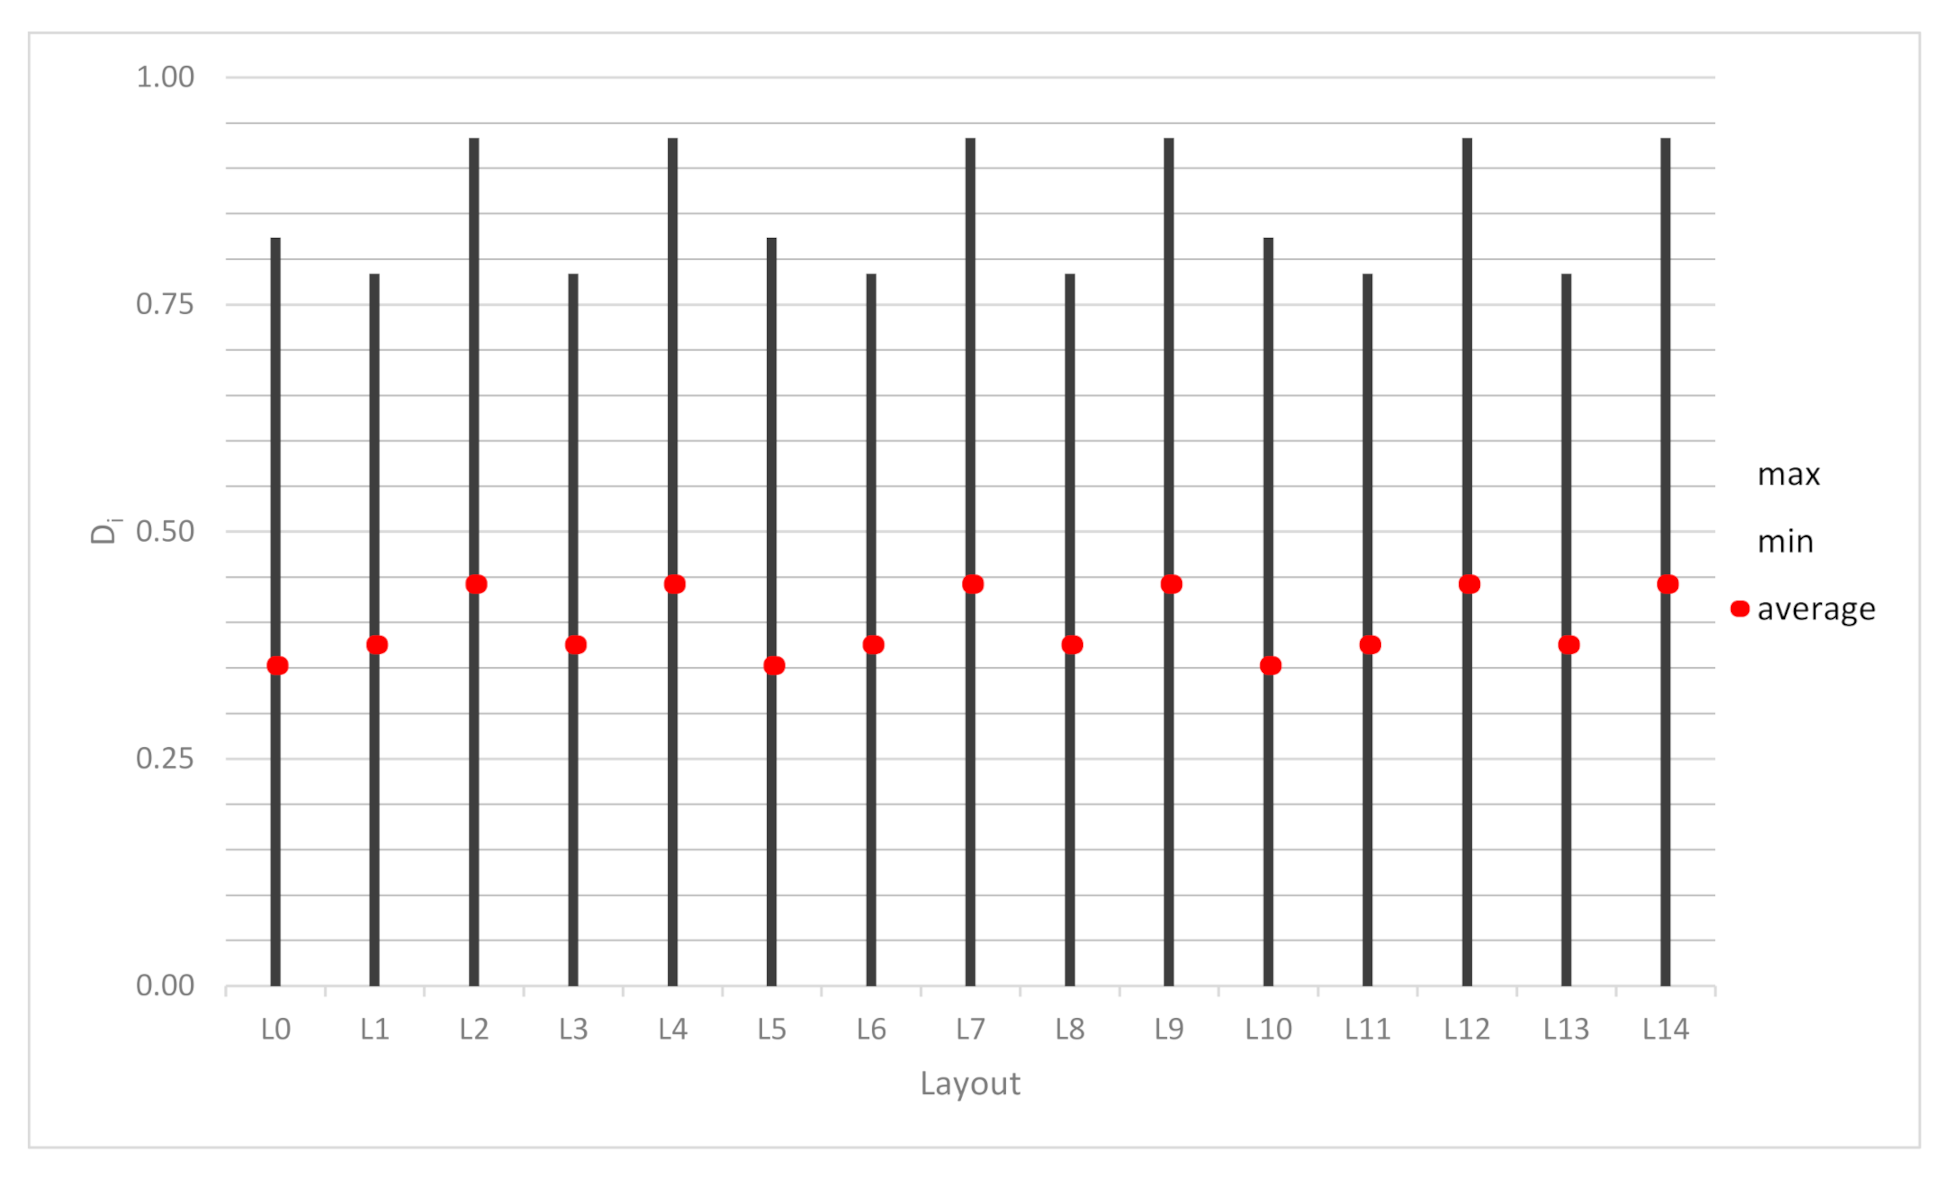
The values of in Table 15 are represented by red points in Figure 8, where it is possible to evaluate the variability of Di for each examined layout: the black lines in the average-maximum-minimum chart show the spread of the calculated Di values for each Li.
Therefore, the values of in Table 15 highlight the positive effects of the investigated geometric layouts to reduce the risk of collision. The most effective solutions have both the roundabike and cycle paths in all the approaching arms (in L3 and L4 is respectively 32% and 35% of that in L0). However, the roundabike without cycle paths in the approaching arms ensures a significative reduction of : in L1 and L2 it is respectively 54% and 63% of that in L0. The same percentage differences have been obtained comparing each set of five layouts with increased bike traffic.
According to Table 15, it is possible to claim that:
- L0, L5, and L10 are the less-safe layouts: their values (2.87 × 10⁻², 3.15 × 10⁻², and 3.71 × 10⁻², respectively) are higher than those of other layouts for given bike flow volumes;
- the geometric configuration of the examined layout significantly affects the range of Ri and its average value between the minimum and maximum values. With regard to a traffic volume, Equation (16) gives the percentage variability of the Ri values (VARRi):where i ranges between 0 and 4.
VARR is 123%, 1820%, and 4470% for L0, L1, and L2, respectively. The results of L1 and L2 coincide with those of L3 and L4. Therefore, with regard to a given bikes flow volume, the roundabike external to the current carriageway reduces the range of variability of Ri (e.g., VARR1 is 1820%); the opposite occurs when the roundabike whose external circumference coincides with that of L0 (e.g., VARR2 is 4470%). Moreover, the presence of a cycle path in all the approaching arms does not affect VARRi (i.e., VARR1 and VARR3 coincide with VARR2 and VARR4, respectively).
4. Discussion
Road design cannot overlook the traffic safety, in particular when different types of users interact and share the space. The on-going pandemic emergency is modifying the modal choice of road users, and it is possible to observe a significant modal shift from public mass transport to light private transport. The increasing cycling mobility requires attention to answer the need and to re-design infrastructures where there are the most hazardous interactions. At-grade urban intersections are among the most hazardous road branches, because users interact with variable trajectories to make maneuvers.
The present study proposes a quantitative risk analysis to assess the risk of collision between motor vehicles and bikes at a 4-arm roundabout whose traffic had been monitored by the authors before the pandemic crisis. The proposed approach combines a probability and a damage model, which could be implemented in different roundabouts (e.g., with or without cycle paths at approaching arms, with or without a “roundabike”) where cyclists have priority over motor vehicles. In addition to the current geometric layout, the risk of collision values of four different configurations with an external roundabike and cycle paths at all the approaching arms, have been compared to the current layout. Moreover, given the increasing cycling mobility, the risk analysis involved with different bikes traffic flows: two five set of layouts with 10% and 30% more bikes volumes, have been analyzed. Therefore, the risk of 15 intersection layouts have been assessed to identify the best strategies to mitigate the risk of collision. The obtained results show the risk reduction given by a roundabike compared to the current layout. Indeed, despite it implying a modification of the CPs number (they increase, from 8 to 16), position (CPi are in the arms instead of in the rotatory carriageway), and type (8 crossing CPi, 4 merging CPi, and 4 diversion CPi instead of 4 merging CPi, and 4 diversion CPi), the risk of collision is lower than that assessed without a roundabike. However, the most effective solution consists of both the roundabike and cycle paths at all the arms: in this configuration the risk of collision is about one third of that in the simple roundabout without cycle paths. Thus, the most effective and high-impact geometric layout could be properly implemented when the bike volume is very important.
The obtained results highlight the urgent necessity to optimize the road spaces to improve the safety level of urban intersections implementing strategic priorities concerning geometric and functional modifications. The counter-clockwise circulation of bicyclists in the roundabike is the most effective solution to mitigate the risk of collision, but it requires proper feasibility studies that consider the constraints of the site and the specific needs of the real traffic conditions.
Author Contributions
Conceptualization, G.C.; Data curation, G.C. and L.M.; Formal analysis, C.D. and L.M.; Investigation, G.C.; Methodology, C.D., G.C. and L.M.; Writing—original draft, C.D., G.C. and L.M.; Writing—review and editing, C.D., G.C. and L.M. All authors have read and agreed to the published version of the manuscript.
Funding
This research received no external funding.
Institutional Review Board Statement
Not applicable.
Informed Consent Statement
Not applicable.
Data Availability Statement
Data is contained within the article.
Conflicts of Interest
The authors declare no conflict of interest.
References
- Nordback, K. Measuring Traffic Reduction form Bicycle Commuting. Transp. Res. Rec. J. Transp. Res. Board 2014, 2468, 98–99. [Google Scholar] [CrossRef]
- Castells-Graells, D.; Salahub, C.; Pournaras, E. On cycling risk and discomfort: Urban safety mapping and bike route recommendations. Computing 2020, 102, 1259–1274. [Google Scholar] [CrossRef] [Green Version]
- Arroyo, R.; Mars, L.; Ruiz, T. Perceptions of pedestrian and cyclist environments, travel behaviors, and social networks. Sustainability 2018, 10, 3241. [Google Scholar] [CrossRef] [Green Version]
- Gao, Y.; Schwebel, D.C.; Zhang, L.; Xiao, W.; Hu, G. Unsafe bicycling behavior in Changsha, China: A video-based observational study. Int. J. Environ. Res. Public Health 2020, 17, 3256. [Google Scholar] [CrossRef]
- Ferraro, O.; Orsi, C.; Popa, I.; Montomoli, C.; Morandi, A. Avoiding bicycle collisions: Experience on safety bike behavior among Italian bicycle users, individual and conspicuity characteristics. J. Transp. Saf. Secur. 2020, 12, 653–670. [Google Scholar] [CrossRef]
- Bahrololoom, S.; Young, W.; Logan, D. Modelling injury severity of bicyclists in bicycle-car crashes at intersections. Accid. Anal. Prev. 2020, 144, 105597. [Google Scholar] [CrossRef] [PubMed]
- Bella, F.; Silvestri, M. Interaction driver–bicyclist on rural roads: Effects of cross-sections and road geometric elements. Accid. Anal. Prev. 2017, 102, 191–201. [Google Scholar] [CrossRef] [PubMed]
- Hull, A.; O’Holleran, C. Bicycle infrastructure: Can good design encourage cycling? Urban Plan. Transp. Res. 2014, 2, 369–406. [Google Scholar] [CrossRef] [Green Version]
- Cantisani, G.; De Andrade Barbosa, Y.; Moretti, L. Safety problems in urban cycling mobility: A quantitative risk analysis at urban intersections. Safety 2019, 5, 6. [Google Scholar] [CrossRef] [Green Version]
- Cantisani, G.; De Andrade Barbosa, Y.; Moretti, L. Risk Analysis and Safer Layout Design Solutions for Bicycles in Four-Leg Urban Intersections. Safety 2019, 5, 24. [Google Scholar] [CrossRef] [Green Version]
- Demasi, F.; Loprencipe, G.; Moretti, L. Road safety analysis of urban roads: Case study of an Italian municipality. Safety 2018, 4, 58. [Google Scholar] [CrossRef] [Green Version]
- Cantisani, G.; Loprencipe, G.; Primieri, F. The integrated design of urban road intersections: A case study. In ICSDC 2011: Integrating Sustainability Practices in the Construction Industry, Proceedings of the International Conference on Sustainable Design and Construction, Kansas City, MO, USA, 23–25 March 2011; American Society of Civil Engineers: Reston, VA, USA, 2012; pp. 722–728. [Google Scholar]
- Isaksson-Hellman, I.; Werneke, J. Detailed description of bicycle and passenger car collisions based on insurance claims. Saf. Sci. 2017, 92, 330–337. [Google Scholar] [CrossRef]
- Moretti, L.; Palazzi, F.; Cantisani, G. Operating times and users’ behavior at Urban road intersections. Sustainability 2020, 12, 4120. [Google Scholar] [CrossRef]
- Di Mascio, P.; Fusco, G.; Grappasonni, G.; Moretti, L.; Ragnoli, A. Geometrical and functional criteria as a methodological approach to implement a new cycle path in an existing urban road network: A case study in Rome. Sustainability 2018, 10, 2951. [Google Scholar] [CrossRef] [Green Version]
- Madsen, T.K.O.; Lahrmann, H. Comparison of five bicycle facility designs in signalized intersections using traffic conflict studies. Transp. Res. Part F 2016, 46, 438–450. [Google Scholar] [CrossRef] [Green Version]
- Liu, Q.; Sun, J.; Tian, Y.; Ni, Y.; Yu, S. Modeling and Simulation of Nonmotorized Vehicles’ Dispersion at Mixed Flow Intersections. J. Adv. Transp. 2019, 2019, 9127062. [Google Scholar] [CrossRef]
- Cantisani, G.; Del Serrone, G.; Di Biagio, G. Results of Micro-Simulation Model for Exploring Drivers’ Behavior on Acceleration Lanes. Eur. Transp. 2020, 77, 1–10. [Google Scholar]
- Cantisani, G.; Del Serrone, G.; Di Biagio, G. Calibration and validation of and results from a micro-simulation model to explore drivers’ actual use of acceleration lanes. Simul. Model. Pract. Theory 2018, 89, 82–99. [Google Scholar] [CrossRef]
- Luo, Y.; Jia, B.; Liu, J.; Lam, W.H.K.; Li, X.; Gao, Z. Modeling the interactions between car and bicycle in heterogeneous traffic. J. Adv. Transp. 2013, 49, 29–47. [Google Scholar] [CrossRef]
- Silvano, A.P.; Koutsopoulos, H.N.; Ma, X. Analysis of vehicle-bicycle interactions at unsignalized crossings: A probabilistic approach and application. Accid. Anal. Prev. 2016, 97, 38–48. [Google Scholar] [CrossRef] [PubMed]
- Strauss, J.; Miranda-Moreno, L.F.; Morency, P. Cyclist activity and injury risk analysis at signalized intersections: A Bayesian modelling approach. Accid. Anal. Prev. 2013, 59, 9–17. [Google Scholar] [CrossRef] [PubMed]
- Asgarzadeh, M.; Verma, S.; Mekary, R.A.; Courtney, T.K.; Christiani, D.C. The role of intersection and street design on severity of bicycle-motor vehicle crashes. Inj. Prev. 2017, 23, 179–185. [Google Scholar] [CrossRef] [Green Version]
- Cantisani, G.; Del Serrone, G. Procedure for the Identification of Existing Roads Alignment from Georeferenced Points Database. Infrastructures 2021, 6, 2. [Google Scholar] [CrossRef]
- Jensen, S.U. Safety Effects of Converting Intersections to Roundabouts. Transp. Res. Rec. J. Transp. Res. Board 2013, 2389, 22–29. [Google Scholar] [CrossRef] [Green Version]
- Di Mascio, P.; Loprencipe, G.; Moretti, L.; Corazza, M.V.; Vivaldi, S.; Vincenti, G. Design of the First Italian Roundabout with Jointed Plain Concrete Pavement. Appl. Sci. 2018, 8, 283. [Google Scholar] [CrossRef] [Green Version]
- Jensen, S.U. Safe roundabouts for cyclists. Accid. Anal. Prev. 2017, 105, 30–37. [Google Scholar] [CrossRef] [PubMed]
- Gross, F.; Lyon, C.; Persaud, B.; Srinivasan, R. Safety effectiveness of converting signalized intersections to roundabouts. Accid. Anal. Prev. 2012, 50, 234–241. [Google Scholar] [CrossRef] [PubMed]
- Berthaume, A.; Knodler, M.A. Hazardous Bicycle Maneuvers at Single-Lane Roundabouts in Massachusetts: A Conflict and Events Study. In Proceedings of the 92nd Annual Meeting of the Transportation Research Board, Washington, DC, USA, 13–17 January 2013; Available online: https://trid.trb.org/view/1242451 (accessed on 25 January 2021).
- Petru, J.; Krivda, V. An Analysis of Turbo Roundabouts from the Perspective of Sustainability of Road Transportation. Sustainability 2021, 13, 2119. [Google Scholar] [CrossRef]
- Rasanen, M.; Summala, H. Car Drivers’ Adjustments to Cyclists at Roundabouts. Transp. Hum. Factors 2000, 2, 1–17. [Google Scholar] [CrossRef]
- Macioszek, E.; Kurek, A. Roundabout users subjective safety—Case study from Upper Silesian and Masovian Voivodeships (Poland). Trans. Transp. Sci. 2020, 11, 39–50. [Google Scholar] [CrossRef]
- Macioszek, E. Roundabout Entry Capacity Calculation—A Case Study Based on Roundabouts in Tokyo, Japan, and Tokyo Surroundings. Sustainability 2020, 12, 1533. [Google Scholar] [CrossRef] [Green Version]
- Tollazzi, T.; Guerrieri, M.; Jovanović, G.; Renčelj, M. Functions, Capacities, and Traffic Safety Characteristics of Some Types of Two-Level Roundabouts. Sustainability 2020, 12, 6914. [Google Scholar] [CrossRef]
- Sakshaug, L.; Laureshyn, A.; Svensson, Å.; Hydén, C. Cyclists in roundabouts—Different design solutions. Accid. Anal. Prev. 2010, 42, 1338–1351. [Google Scholar] [CrossRef] [PubMed]
- Transport for London. London Cycling Design Standards; Transport for London: London, UK, 2014. [Google Scholar]
- Ministero delle Infrastrutture e dei Trasporti. Norme Funzionali e Geometriche per la Costruzione delle Intersezioni Stradali [Functional and Geometrical Standards for Road Constructions]; Ministero delle Infrastrutture e dei Trasporti: Rome, Italy, 2006. [Google Scholar]
- Ministero dei Lavori Pubblici. Regolamento Recante Norme per la Definizione Delle Caratteristiche Tecniche Delle Piste Ciclabili [Standard for Technical Characteristics of Cyle Paths]; Ministero dei Lavori Pubblici: Rome, Italy, 1999. [Google Scholar]
- Bates, L.J.; Davey, J.; Watson, B.; King, M.J.; Armstrong, K. Factors Contributing to Crashes among Young Drivers. Sultan Qabos Univ. Med. J. 2014, 14, 297–305. [Google Scholar]
- Rohatgi, V.K.; Saleh, A.M.E. An Introduction to Probability and Statistics; Wiley Series in Probability and Statistics; John Wiley & Sons: Hoboken, NJ, USA, 2015. [Google Scholar]
- Mauro, R. Calculation of Roundabouts: Capacity, Waiting Phenomena and Reliability; Springer Science & Business Media: Cham, Switzerland, 2010. [Google Scholar]
- Elvik, R.; Erke, A.; Christensen, P. Elementary Units of Exposure. J. Transp. Res. Board 2009, 2103, 25–31. [Google Scholar] [CrossRef] [Green Version]
- Ministero delle Infrastrutture e dei Trasporti. Norme Funzionali e Geometriche per la Costruzione delle Strade [Functional and Geometrical Standards for Road Construction]; Ministero delle Infrastrutture e dei Trasporti: Rome, Italy, 2001. [Google Scholar]
- Transportation Research Board. Highway Capacity Manual 6th Edition: A Guide for Multimodal Mobility Analysis; The National Academies Press: Washington, DC, USA, 2016. [Google Scholar]
- Ministero delle Infrastrutture e dei Trasporti. Procedure Amministrative per il Conseguimento della Patente di Guida della Categoria B [Procedures to Obtaine Driving Licence]; Ministero delle Infrastrutture e dei Trasporti: Rome, Italy, 2017. [Google Scholar]
- Corpus, C. TX Unified Development Code. Available online: http://online.encodeplus.com/regs/corpuschristi-tx/doc-viewer.aspx?secid=584#secid-584 (accessed on 21 January 2021).
- Abdullah, M.; Dias, C.; Muley, D.; Shahin, M. Exploring the impacts of COVID-19 on travel behavior and mode preferences. Transp. Res. Interdiscip. Perspect. 2020, 8, 100255. [Google Scholar] [CrossRef]
- United Nations Economic Commission for Europe. Sustainable Urban Mobility and Public Transport in UNECE capitals. 2015. Available online: https://unece.org/fileadmin/DAM/trans/main/wp5/publications/Sustainable_Urban_Mobility_and_Public_Transport_FINAL.pdf (accessed on 21 January 2021).
Figure 1.
Study scheme of the examined four-arm roundabout.

Figure 2.
Geometrical characteristics of the examined roundabout.

Figure 3.
CP in a single-lane 4-arm symmetric roundabout.

Figure 4.
CP in a single-lane 4-arm symmetric roundabout—L0.

Figure 5.
CPi in (a) L1 and (b) L2.

Figure 6.
Flows in CPi (a) in L1 and (b) in L2.

Figure 7.
L3 (a) and L4 (b) layout.

Figure 8.
Average-maximum-minimum chart of Di values.


Table 1.
Geometrical characteristics of the examined roundabout.
| Variable | Symbol | Value | Unit |
|---|---|---|---|
| Inscribed circle radius | RAD | 23 | m |
| Central island radius | ISL | 12.5 | m |
| Circulatory roadway width | ANN | 6 | m |
| Entry width | ENT | 3.5 | m |
| Exit width | EXI | 4.5 | m |
| Splitter island width | SPL | 15 | m |
| Shoulder width | SHO | 1 | m |
Table 2.
Danger classification. ART: available reaction time.
| ART (s) | Level of Damage | D | Chromatic Categorization |
|---|---|---|---|
| 0 < ART ≤ 1.5 | Very dangerous interaction | 1 < D ≤ 1.5 | ● |
| 1.5 < ART ≤ 3 | Dangerous interaction | 0.5 < D ≤ 1 | ● |
| 3 < ART ≤ 4.5 | Slight interaction | 0 < D ≤ 0.5 | ● |
| ART > 4.5 | No interaction | - | ● |
Table 3.
Entry flows.
| Entry Arm | Entry Flows | |||
|---|---|---|---|---|
| QV,e (Veh./h) | QB,e (Veh./h) | |||
| I | QI;V,e | 700 | QI;B,e | 40 |
| II | QII;V,e | 525 | QII;B,e | 70 |
| III | QIII;V,e | 310 | QIII;B,e | 60 |
| IV | QIV;V,e | 430 | QIV;B,e | 120 |
Table 4.
Distribution matrix for motor vehicles.
| Entry Arm | Exit Arm | |||
|---|---|---|---|---|
| 1 | 2 | 3 | 4 | |
| 1 | 0.00 | 0.18 | 0.65 | 0.17 |
| 2 | 0.20 | 0.00 | 0.21 | 0.59 |
| 3 | 0.72 | 0.10 | 0.00 | 0.18 |
| 4 | 0.20 | 0.70 | 0.10 | 0.00 |
Table 5.
Distribution matrix for bicycles.
| Entry Arm | Exit Arm | |||
|---|---|---|---|---|
| 1 | 2 | 3 | 4 | |
| 1 | 0.00 | 0.20 | 0.45 | 0.35 |
| 2 | 0.56 | 0.00 | 0.34 | 0.10 |
| 3 | 0.46 | 0.29 | 0.00 | 0.25 |
| 4 | 0.32 | 0.46 | 0.22 | 0.00 |
Table 6.
Exit flow of motor vehicles.
| Exit Arm | |||
|---|---|---|---|
| I | II | III | IV |
| QI;V,o | QII;V,o | QIII;V,o | QIV;V,o |
| 414 | 458 | 608 | 485 |
Table 7.
Exit flow of bicycles.
| Exit Arm | |||
|---|---|---|---|
| I | II | III | IV |
| QI;B,o | QII;B,o | QIII;B,o | QIV;B,o |
| 105 | 81 | 68 | 36 |
Table 8.
Circulating flow of motor vehicles.
| Arm | |||
|---|---|---|---|
| I | II | III | IV |
| QI;V,c | QII;V,c | QIII;V,c | QIV;V,c |
| 375 | 617 | 534 | 359 |
Table 9.
Circulating flow of bicycles.
| Arm | |||
|---|---|---|---|
| I | II | III | IV |
| QI;B,c | QII;B,c | QIII;B,c | QIV;B,c |
| 99 | 58 | 60 | 84 |
Table 10.
Circulating flow of bicycles.
| CPi | pi |
|---|---|
| CP1 = CP1,I;m | p1 = 5.89 × 10⁻³ |
| CP3 = CP3,II;m | p3 = 5.22 × 10⁻³ |
| CP5 = CP5,III;m | p5 = 3.65 × 10⁻³ |
| CP7 = CP7,IV;m | p7 = 5.72 × 10⁻³ |
| CP2 = CP2,I;d | p2 = 5.41 × 10⁻³ |
| CP4 = CP4,II;m | p6 = 5.16 × 10⁻³ |
| CP6 = CP6,III;m | P6 = 3.86 × 10⁻³ |
| CP8 = CP8,IV;m | p8 = 5.80 × 10⁻³ |
Table 11.
Results of the damage analysis.
| Examined Maneuvering Flow | QV,e | QB,e | QV,o | QB,o |
|---|---|---|---|---|
| CPi | Di | |||
| CP1, CP3, CP5, CP7 | 0.586 | 0 | - | - |
| CP2, CP4, CP6, CP8 | - | - | 0.824 | 0 |
Table 12.
Results of the risk analysis.
| CPi | Ri |
|---|---|
| CP1 | 3.45 × 10⁻³ |
| CP3 | 4.46 × 10⁻³ |
| CP5 | 3.06 × 10⁻³ |
| CP7 | 4.26 × 10⁻³ |
| CP2 | 2.14 × 10⁻³ |
| CP4 | 3.18 × 10⁻³ |
| CP6 | 3.35 × 10⁻³ |
| CP8 | 4.78 × 10⁻³ |
Table 13.
Results of the risk analysis—L1 and L2.
| CPi | pi(-) | ART(s) | Di(-) | Ri | |||
|---|---|---|---|---|---|---|---|
| L1 and L2 | L1 | L2 | L1 | L2 | L1 | L2 | |
| CP1a | 4.79 × 10⁻³ | 4.236 | 4.368 | 0.088 | 0.044 | 2.11 × 10⁻⁴ | 2.11 × 10⁻⁴ |
| CP1b | 1.95 × 10⁻³ | 5.400 | 5.400 | 0 | 0 | - | - |
| CP2a | 1.92 × 10⁻³ | 2.148 | 1.738 | 0.784 | 0.921 | 1.51 × 10⁻³ | 1.79× 10⁻³ |
| CP2b | 2.64 × 10⁻³ | 2.611 | 2.189 | 0.630 | 0.770 | 1.67 × 10⁻³ | 2.09 × 10⁻³ |
| CP3a | 2.18 × 10⁻³ | 4.236 | 4.368 | 0.088 | 0.044 | 1.92 × 10⁻⁴ | 9.61 × 10⁻⁵ |
| CP3b | 2.61 × 10⁻³ | 5.400 | 5.400 | 0 | 0 | - | - |
| CP4a | 2.58 × 10⁻³ | 2.148 | 1.738 | 0.784 | 0.921 | 2.02 × 10⁻³ | 2.41 × 10⁻³ |
| CP4b | 2.92 × 10⁻³ | 2.611 | 2.189 | 0.630 | 0.770 | 1.84 × 10⁻³ | 2.31 × 10⁻³ |
| CP5a | 1.37 × 10⁻³ | 4.236 | 4.368 | 0.088 | 0.044 | 1.20 × 10⁻⁴ | 6.02 × 10⁻⁵ |
| CP5b | 1.36 × 10⁻³ | 5.400 | 5.400 | 0 | 0 | - | - |
| CP6a | 2.91 × 10⁻³ | 2.148 | 1.738 | 0.784 | 0.921 | 2.28 × 10⁻³ | 2.72 × 10⁻³ |
| CP6b | 1.25 × 10⁻³ | 2.611 | 2.189 | 0.630 | 0.770 | 7.89 × 10⁻⁴ | 9.90 × 10⁻⁴ |
| CP7a | 2.60 × 10⁻³ | 4.236 | 4.368 | 0.088 | 0.044 | 2.29 × 10⁻⁴ | 1.15 × 10⁻⁴ |
| CP7b | 3.69 × 10⁻³ | 5.400 | 5.400 | 0 | 0 | - | - |
| CP8a | 2.95 × 10⁻³ | 2.148 | 1.738 | 0.784 | 0.921 | 2.31 × 10⁻³ | 2.75 × 10⁻³ |
| CP8b | 3.13 × 10⁻³ | 2.611 | 2.189 | 0.630 | 0.770 | 1.97 × 10⁻³ | 2.47 × 10⁻⁴ |
| 1.52 × 10⁻² | 1.80 × 10⁻² | ||||||
Table 14.
Input data—L5 to L14.
| Layout | Geometrical Configuration | Flows on Entry Arm (veh/h) | Flows on Exit Arm (veh/h) | ||
|---|---|---|---|---|---|
| Motor Vehicles | Bicycles | Motor Vehicles | Bicycles | ||
| L5 | L0 | cf. QV,e in Table 3 | QI;B,e = 44 QII;B,e = 77 QIII;B,e = 66 QIV;B,e = 132 | cf. Table 6 | QI;B,o = 115 QII;B,o = 89 QIII;B,o = 75 QIV;B,o = 40 |
| L6 | L1 | ||||
| L7 | L2 | ||||
| L8 | L3 | ||||
| L9 | L4 | ||||
| L10 | L0 | cf. QV,e in Table 3 | QI;B,e = 52 QII;B,e = 91 QIII;B,e = 78 QIV;B,e = 156 | cf. Table 6 | QI;B,o = 137 QII;B,o = 105 QIII;B,o = 88 QIV;B,o = 47 |
| L11 | L1 | ||||
| L12 | L2 | ||||
| L13 | L3 | ||||
| L14 | L4 | ||||
Table 15.
Level of risk—L5 to L14.
| Layout | maxDi | minDi | maxRi | minRi | ||
|---|---|---|---|---|---|---|
| L0 | 0.35 | 0.82 | 0.00 | 2.87 × 10⁻² | 4.78 × 10⁻³ | 2.14 × 10⁻³ |
| L1 | 0.38 | 0.78 | 0.00 | 1.53 × 10⁻² | 2.31 × 10⁻³ | 1.20 × 10⁻⁴ |
| L2 | 0.44 | 0.93 | 0.00 | 1.80 × 10⁻² | 2.75 × 10⁻³ | 6.02 × 10⁻⁵ |
| L3 | 0.38 | 0.78 | 0.00 | 9.09 × 10⁻³ | 2.31 × 10⁻³ | 1.20 × 10⁻⁴ |
| L4 | 0.44 | 0.93 | 0.00 | 1.01 × 10⁻² | 2.75 × 10⁻³ | 6.02 × 10⁻⁵ |
| L5 | 0.35 | 0.82 | 0.00 | 3.15 × 10⁻² | 5.25 × 10⁻³ | 2.35 × 10⁻³ |
| L6 | 0.38 | 0.78 | 0.00 | 1.69 × 10⁻² | 2.54 × 10⁻³ | 1.32 × 10⁻⁴ |
| L7 | 0.44 | 0.93 | 0.00 | 1.98 × 10⁻² | 3.02 × 10⁻³ | 6.62 × 10⁻⁵ |
| L8 | 0.38 | 0.78 | 0.00 | 9.98 × 10⁻³ | 2.54 × 10⁻³ | 1.32 × 10⁻⁴ |
| L9 | 0.44 | 0.93 | 0.00 | 1.12 × 10⁻² | 3.02 × 10⁻³ | 6.62 × 10⁻⁵ |
| L10 | 0.35 | 0.82 | 0.00 | 3.71 × 10⁻² | 6.18 × 10⁻³ | 2.77 × 10⁻³ |
| L11 | 0.38 | 0.78 | 0.00 | 1.99 × 10⁻² | 2.99 × 10⁻³ | 1.56 × 10⁻⁴ |
| L12 | 0.44 | 0.93 | 0.00 | 2.33 × 10⁻² | 3.56 × 10⁻³ | 7.81 × 10⁻⁵ |
| L13 | 0.38 | 0.78 | 0.00 | 1.18 × 10⁻² | 2.99 × 10⁻³ | 1.56 × 10⁻⁴ |
| L14 | 0.44 | 0.93 | 0.00 | 1.32 × 10⁻² | 3.56 × 10⁻³ | 7.81 × 10⁻⁵ |
Publisher’s Note: MDPI stays neutral with regard to jurisdictional claims in published maps and institutional affiliations. |
© 2021 by the authors. Licensee MDPI, Basel, Switzerland. This article is an open access article distributed under the terms and conditions of the Creative Commons Attribution (CC BY) license (http://creativecommons.org/licenses/by/4.0/).
Share and Cite
MDPI and ACS Style
Cantisani, G.; Durastanti, C.; Moretti, L. Cyclists at Roundabouts: Risk Analysis and Rational Criteria for Choosing Safer Layouts. Infrastructures 2021, 6, 34. https://0-doi-org.brum.beds.ac.uk/10.3390/infrastructures6030034
AMA Style
Cantisani G, Durastanti C, Moretti L. Cyclists at Roundabouts: Risk Analysis and Rational Criteria for Choosing Safer Layouts. Infrastructures. 2021; 6(3):34. https://0-doi-org.brum.beds.ac.uk/10.3390/infrastructures6030034
Chicago/Turabian StyleCantisani, Giuseppe, Claudio Durastanti, and Laura Moretti. 2021. "Cyclists at Roundabouts: Risk Analysis and Rational Criteria for Choosing Safer Layouts" Infrastructures 6, no. 3: 34. https://0-doi-org.brum.beds.ac.uk/10.3390/infrastructures6030034