Article

Evaluation of Microsimulation Models for Roadway Segments with Different Functional Classifications in Northern Iran

by
Amir Masoud Rahimi
1,
Maxim A. Dulebenets
2,* and
Arash Mazaheri
1
1
Department of Civil Engineering, University of Zanjan, University Blvd., P.O. Box 313, Zanjan 45371-38791, Iran
2
Department of Civil & Environmental Engineering, Florida A&M University-Florida State University, 2525 Pottsdamer Street, Building A, Suite A124, Tallahassee, FL 32310-6046, USA
*
Author to whom correspondence should be addressed.
Submission received: 28 January 2021 / Revised: 9 March 2021 / Accepted: 10 March 2021 / Published: 15 March 2021
(This article belongs to the Special Issue Transport Systems: Safety Modeling, Visions and Strategies)

Abstract

:
Industrialization, urban development, and population growth in the last decades caused a significant increase in congestion of transportation networks across the world. Increasing congestion of transportation networks and limitations of the traditional methods in analyzing and evaluating the congestion mitigation strategies led many transportation professionals to the use of traffic simulation techniques. Nowadays, traffic simulation is heavily used in a variety of applications, including the design of transportation facilities, traffic flow management, and intelligent transportation systems. The literature review, conducted as a part of this study, shows that many different traffic simulation packages with various features have been developed to date. The present study specifically focuses on a comprehensive comparative analysis of the advanced interactive microscopic simulator for urban and non-urban networks (AIMSUN) and SimTraffic microsimulation models, which have been widely used in the literature and practice. The evaluation of microsimulation models is performed for the four roadway sections with different functional classifications, which are located in the northern part of Iran. The SimTraffic and AIMSUN microsimulation models are compared in terms of the major transportation network performance indicators. The results from the conducted analysis indicate that AIMSUN returned smaller errors for the vehicle flow, travel speed, and total travel distance. On the other hand, SimTraffic provided more accurate values of the travel time. Both microsimulation models were able to effectively identify traffic bottlenecks. Findings from this study will be useful for the researchers and practitioners, who heavily rely on microsimulation models in transportation planning.

1. Introduction

Roadway density and traffic congestion substantially increased over the last years across the world, especially near large metropolitan areas, primarily due to rapid industrialization, fast population growth, urban development, and increasing demand for passenger and freight transport [1,2,3,4]. The congestion mitigation alternatives (e.g., adding another lane to a given roadway segment, adjust cycles of traffic signals, build an interchange, implement some of the access management approaches, and others) must be implemented in order to alleviate the increasing congestion issues and serve communities. Transportation planners must evaluate various congestion mitigation alternatives, and the most promising alternative should be recommended for implementation. Nowadays, transportation planners often tend to use traffic simulation software packages for comparison of various congestion mitigation alternatives. The increasing application of traffic simulation software packages is supported by numerous advancements in computer and software sciences.
A simulation analysis of traffic flow is based on specific indices and parameters that must be set within a given software package. The major traffic flow parameters within simulation models must be established based on the data collected as a result of field studies and surveys. Then, the transportation network performance indicators (e.g., travel time, travel speed, travel delay), produced by the traffic simulation model, can be compared to the actual values collected from the field. Based on a comparative analysis against the field data, the required modifications should be applied within the traffic simulation model to ensure that it will replicate realistic travel conditions, which are observed for a given transportation network, with an acceptable degree of error. Once parameters of the given traffic simulation model are calibrated, the model can be executed to estimate the values of transportation network performance indicators for different congestion mitigation alternatives. Upon completion of the simulation analysis, transportation planners will be able to determine the most promising congestion mitigation alternative (i.e., the alternative, which will yield the most favorable impact on the travel conditions). One of the major advantages of using traffic simulation consists in the fact that the traffic simulation models allow visualizing the study area, identification of the roadway sections that experience bottlenecks and require future improvements, and efficient scenario analysis (e.g., evaluation of different congestion mitigation alternatives) [5].
Traffic simulation models can be categorized into three types [5,6,7,8,9]: (1) macroscopic, (2) microscopic, and (3) mesoscopic. Some of the principles used within macroscopic simulation models are adopted from fluid dynamics. Simulation of the traffic flow is performed for a given roadway section of the transportation network without considering interactions among the roadway users. Macroscopic simulation models primarily rely on such parameters as traffic volume, average speed, and density. Transportation planners use macroscopic simulation models for the analysis of the level of service and demand, as well as evaluation of regional plans and comprehensive transport programs.
As for microscopic simulation models, they rely on the car-following theory and the concepts of lane-changing, gap-acceptance and route choice in order to simulate the traffic behavior of each vehicle in a given transportation network. The car-following parameters determine the acceleration of vehicles, their interaction with other roadway users. Lane-changing allows the vehicles to shift from one lane to another based on the driver’s objectives and surrounding vehicles. The gap-acceptance parameters determine the synthetic links of vehicles to the traffic flow on the route. The route choice parameters determine the selection of specific routes of a given transportation network for each driver. Microscopic simulation produces more detailed outputs as compared to macroscopic simulation and, therefore, is generally applied for a comprehensive evaluation of a given transportation network. However, microscopic simulation models require more input parameters as opposed to macroscopic simulation models. Moreover, it is quite difficult to determine the accurate values of the microsimulation model parameters due to challenges associated with modeling the driver behavior along the roadways [5,6].
On the other hand, mesoscopic simulation models combine features of macroscopic and microscopic simulation models [8,9]. Mesoscopic simulation models allow a detailed emulation of the vehicle platoon dispersion (e.g., a platoon of vehicles is moving along a roadway segment, and the dispersion occurs due to the differences in vehicle speeds). Furthermore, mesoscopic simulation models allow emulation of the vehicle platoon behavior (e.g., a platoon of vehicles is moving along a roadway segment with similar speeds and a short headway). A detailed platoon modeling allows accurate computation of travel times of vehicles. The total number of vehicles in a platoon, vehicle speeds in a platoon, and distribution of speeds in a platoon are some of the major characteristics required for modeling vehicle platoons in mesoscopic simulation models.
The selection of the appropriate traffic simulation package is critical for roadway improvement projects. In particular, the appropriate traffic simulation model will allow accurate estimation of the major transportation network performance indicators before and after implementation of various roadway improvement projects (therefore, the efficiency of potential roadway improvement projects could be accurately assessed). Generally, microscopic simulation models (e.g., AIMSUN, VISSIM, CORSIM, CUBE, SimTraffic, and PARAMICS) are used for the analysis of the major roadway segments, which have large traffic volumes and experience significant delays. Considering increasing congestion issues near large metropolitan areas of Iran [6], this study focuses on the application of microsimulation for the analysis of the transportation network located in the northern part of Iran. The AIMSUN and SimTraffic microsimulation models, which have been widely used for the analysis of the transportation networks in Iran [5,10,11], are compared in terms of the accuracy in estimating the major transportation network performance indicators, including travel time, travel speed, vehicle flow, fuel consumption, and total travel distance. The values of performance indicators, suggested by both microsimulation models, are compared to the actual field data. Findings from this research will be valuable for transportation planners and will assist with the selection of the appropriate microsimulation model for the analysis of the transportation networks in Iran.
The remaining sections of the manuscript are organized in the following order. The next section presents a review of the relevant literature with a focus on the implementation of various microsimulation models for the analysis of transportation networks. The third section presents some background information for the AIMSUN and SimTraffic microsimulation models. Furthermore, the third section describes the major transportation network performance indicators, which will be considered in this study and estimated using AIMSUN and SimTraffic. The fourth section discusses the adopted research methodology along with data collection and provides a detailed analysis of the collected data. The fifth section presents the description of numerical experiments, which were conducted to evaluate the AIMSUN and SimTraffic microsimulation models, while the last section summarizes the findings of this research and outlines potential future research extensions.

2. Literature Review

As mentioned in the introduction section of the manuscript, different traffic simulation models have been widely used for the evaluation of transportation networks. There are many advantages of using traffic simulation; however, there exist some drawbacks associated with traffic simulation as well. The highway capacity manual of the Transportation Research Board [12] provides a detailed discussion of the traffic simulation advantages and disadvantages. The advantages of using traffic simulation include the following [12]: (1) simulated methods are appropriate where analytical studies cannot be administered; (2) simulation models allow comprehensive understanding of the transportation network parameters and their relative interactions; (3) simulation models provide the outputs that can be used for the statistical analysis of the spatial and temporal data; (4) simulation models can be used to evaluate and compare the status of network options; (5) simulation models can be used to analyze modifications in the network efficiency; and (6) simulation models consider the distinctive demands of the network parameters.
The disadvantages of using traffic simulation include the following [12]: (1) simulation models are sophisticated and could provide simpler administrative procedures; (2) simulation models should be analyzed, calibrated, and validated; (3) any shortcoming in the implementation of the latter procedures can make the results unreliable and inefficient; and (4) some users apply simulation models without being aware of its limitations and modalities. This section of the manuscript focuses on a review of the relevant previously conducted studies, which applied traffic simulation models for the analysis of transportation networks, assessed their accuracy in estimating various transportation network performance indicators, and discussed the advantages and disadvantages of using traffic simulation. A more comprehensive review of the state-of-the-art on various traffic simulation models can be found in Pell et al. [7], Azlan and Rohani [8], and Gora et al. [9].

2.1. Detailed Review of the Collected Studies

Many previous research efforts have aimed to compare different microsimulation models. For example, Bloomberg and Dale [13] focused on the comparison of the VISSIM and CORSIM microsimulation models in terms of the network coding structure, car-following logic, gap acceptance model, and other attributes. The analysis results indicated that the differences among the considered microsimulation models were minimal, and the selection of the appropriate microsimulation model was primarily affected by the user needs and project requirements. Furthermore, it was found that CORSIM generally provided greater travel time as compared to VISSIM. Shaw and Nam [14] performed a comparative analysis of the VISSIM, PARAMICS, and CORSIM microsimulation models for the Southeast Wisconsin freeway system. The microsimulation models were compared based on the following aspects: (1) model capabilities; (2) ease of use; and (3) freeway system operational assessment application requirements. As a result of a detailed analysis, PARAMICS was found to be the most appropriate microsimulation model.
Tian et al. [15] studied the differences between the VISSIM, SimTraffic, and CORSIM microsimulation models. Based on the conducted numerical experiments, CORSIM produced the lowest variations in vehicle delays and throughput flow rates, while SimTraffic returned the highest variations. Moreover, it was noticed that higher variations were generally recorded for the scenarios where the capacity conditions were reached. Jones et al. [16] performed a comprehensive comparative analysis of the AIMSUN, SimTraffic, and CORSIM microsimulation models based on different criteria (i.e., software requirements, ease of network coding, data requirements, appropriateness of the default parameter values, etc.). SimTraffic was reported to have the most user-friendly interface, while CORSIM was more efficient for modeling complex transportation networks. Furthermore, the study recommended that the microsimulation model selection should be based on the user needs and project requirements/expectations. In some cases, the synthesis of microsimulation models might be encouraged.
Fang and Elefteriadou [17] assessed the performance of the CORSIM, VISSIM, and AIMSUN microsimulation models for two interchanges in Arizona. The following factors were identified to be the most critical ones in the selection of the appropriate microsimulation model: (1) capability of representation of certain geometric characteristics; (2) capability of emulating certain signal control plans; (3) calibration process and comparison against the field conditions; and (4) extraction of certain performance indicators. Xiao et al. [18] proposed a comprehensive approach for the identification of the appropriate microsimulation model using quantitative and qualitative criteria. The quantitative evaluation criteria included calibration testing, while the qualitative evaluation criteria consisted of functional capabilities, service quality, input/output features, and ease of use. A case study was conducted for the AIMSUN and VISSIM microsimulation models. It was found that preferences to use a specific microsimulation model were primarily determined by the type of user. Shariat and Babaie [19] compared the car-following models adopted within the VISSIM and AIMSUN microsimulation models. Although the Gipps car-following model (used in AIMSUN) was simpler and generally emulated the traffic flow faster, the Whiteman–Ritter car-following model (used in VISSIM) was found to be more logical and typically yielded more accurate results.
Shariat [5] focused on the calibration of the AIMSUN, VISSIM, and SimTraffic microsimulation models for the Tehran metropolitan area. It was found that AIMSUN was superior to VISSIM and SimTraffic in terms of knowledge management, user-friendliness, software cost, and current application by various organizations in Iran. Pourreza et al. [20] evaluated the performance of CORSIM, AIMSUN, INTEGRATION, PARAMICS, and VISSIM for the analysis of transportation networks. The following aspects were considered: (1) expected application of the model; (2) model capabilities; (3) previous software implementation; (4) software support; (5) software costs; and (6) user-friendliness, graphics, and interface. CORSIM was found to be the most advantageous microsimulation model based on the considered performance indicators. Da Rocha et al. [21] conducted a study aiming to assess the accuracy of traffic microsimulation models in estimating fuel consumption and emissions. The researchers examined the Gipps and Newell car-following models. It was found that the Gipps car-following model demonstrated higher accuracy in terms of the simulated vehicle trajectories. The analysis results showed that the selection of the non-optimal parameters substantially increased the variance of the model outputs.
Ibrahim and Far [22] undertook a simulation-based analysis to determine potential benefits from the implementation of pattern recognition in intelligent transportation systems. The AIMSUN microsimulation model was developed using real-life operational data. The numerical experiments demonstrated that AIMSUN was able to reduce the travel time by ~5–30%, while the congestion duration was decreased by ~8–41%. Praticò et al. [23] performed a study aiming to assess the accuracy in estimating vehicle travel speed on roundabouts. The VISSIM microsimulation model was used to emulate the traffic flow. The computational experiments showed that the proposed microsimulation model could provide accurate travel speed estimates if the microsimulation model parameters were carefully calibrated. Shaaban and Kim [24] focused on modeling two-lane and three-lane roundabouts in the VISSIM and SimTraffic environments. The microsimulation models were compared in terms of the estimated traffic delay values. It was found that, for the high-traffic flow scenarios, VISSIM provided higher delay values as compared to SimTraffic. However, no significant differences between the delay values were observed for the low-traffic flow scenarios.
Essa and Sayed [25] performed a comparative analysis of the PARAMICS and VISSIM microsimulation models. The numerical experiments showed that the default model parameters gave poor correlation with the field-measured data. Furthermore, it was found that both microsimulation models could not estimate traffic conflicts accurately without proper calibration. However, a good correlation between the field-measured conflicts and the simulated conflicts was achieved after calibration for both PARAMICS and VISSIM models. Astarita et al. [26] aimed to assess intersection safety by means of different traffic simulation models. The following types of intersections were considered: (1) a roundabout; (2) an intersection regulated with a traffic light; and (3) an unregulated intersection. AIMSUN, VISSIM, and different versions of Tritone were used for simulating the intersection traffic flows. The experiments showed some variations in the simulation outputs. However, the roundabout intersection generally had the largest number of conflicts. Kan et al. [27] studied freeway corridors that had dedicated lanes and periodically experienced congestion. Two driving behavior models were proposed and implemented in AIMSUN and MOTUS. The experiments demonstrated the high accuracy of the developed models and provided some insights into driver behavior on freeways.
Shaaban et al. [28] aimed to evaluate potential impacts from converting roundabouts into traffic signals at one of the urban arterial corridors in Qatar. A microscopic simulation approach based on VISSIM and MOVES (module for estimating emissions) was developed in the study. It was found that the replacement of roundabouts with traffic signals could reduce emissions by 37%−43%. Granà et al. [29] used AIMSUN to determine passenger car equivalent units for two-lane and turbo roundabouts. The results showed that the operational performance of roundabouts could be significantly affected by the percentage of heavy vehicles. Kim et al. [30] proposed a systematic guideline that could be used for calibrating reliable microscale estimates of vehicle emissions. The VISSIM environment was used to simulate the traffic flow. The proposed methodology demonstrated its effectiveness based on the available traffic data.
Song et al. [31] investigated the accuracy of TransModeler and VISSIM for the estimation of nontraffic performance indicators, including emissions, fuel consumption, and safety. The experiments showed that, even after calibration, both microsimulation models had significant errors when comparing to the actual values. Van Beinum et al. [32] examined the VISSIM and MOTUS traffic simulation models in their ability to emulate merging situations in high-traffic scenarios. It was found that the considered simulation packages were not able to accurately emulate turbulent traffic flows in terms of the headway distribution and lane-changing locations. However, the emulated gap acceptance distributions seemed to be appropriate.
A number of studies conducted a detailed review of different traffic simulation models. For example, Pell et al. [7] conducted a detailed analysis of 17 simulation packages, mostly focusing on the adaptability of simulation models to heterogeneous traffic and roadways networks. It was found that many software packages still have a significant number of drawbacks in modeling capabilities. Azlan and Rohani [8] provided a comprehensive overview of microscopic, mesoscopic, and macroscopic traffic simulation models. The models were overviewed in terms of their main purpose and the key parameters used. The study highlighted that the selection of the appropriate traffic simulation software is directly interrelated with the project needs. Gora et al. [9] studied the existing literature on the applications of microscopic traffic simulation for modeling connected and autonomous vehicles. A large variety of different traffic modeling approaches were discussed, including car-following models (e.g., Gipps model, Wiedemann model, Nagel–Schreckenberg model, intelligent driver model), lane-changing models, and software packages (e.g., VISSIM, SUMO).

2.2. Literature Summary and Contribution

A summary of the conducted literature review is presented in Table 1, including the following data: (a) author(s); (b) year; (c) software used; and (d) key findings and important notes. A review of the literature indicates that different microsimulation models have been widely used by researchers in the past. The selection of the appropriate microsimulation software package is generally dependent on a number of factors, which may include, but are not limited to [5,14,16,17,20]: (1) software capabilities; (2) ease of use; (3) user interface/graphics; (4) software cost; (5) hardware/software requirements; (6) capability of emulating certain operations features; (7) previous software implementation; (8) accuracy in estimating various transportation network performance indicators (e.g., travel speed, travel time, vehicle delay, vehicle flow, and others); (8) user needs; (9) objectives of the project; and others. This study extends the work conducted by Shariat [5] and Shariat and Babaie [
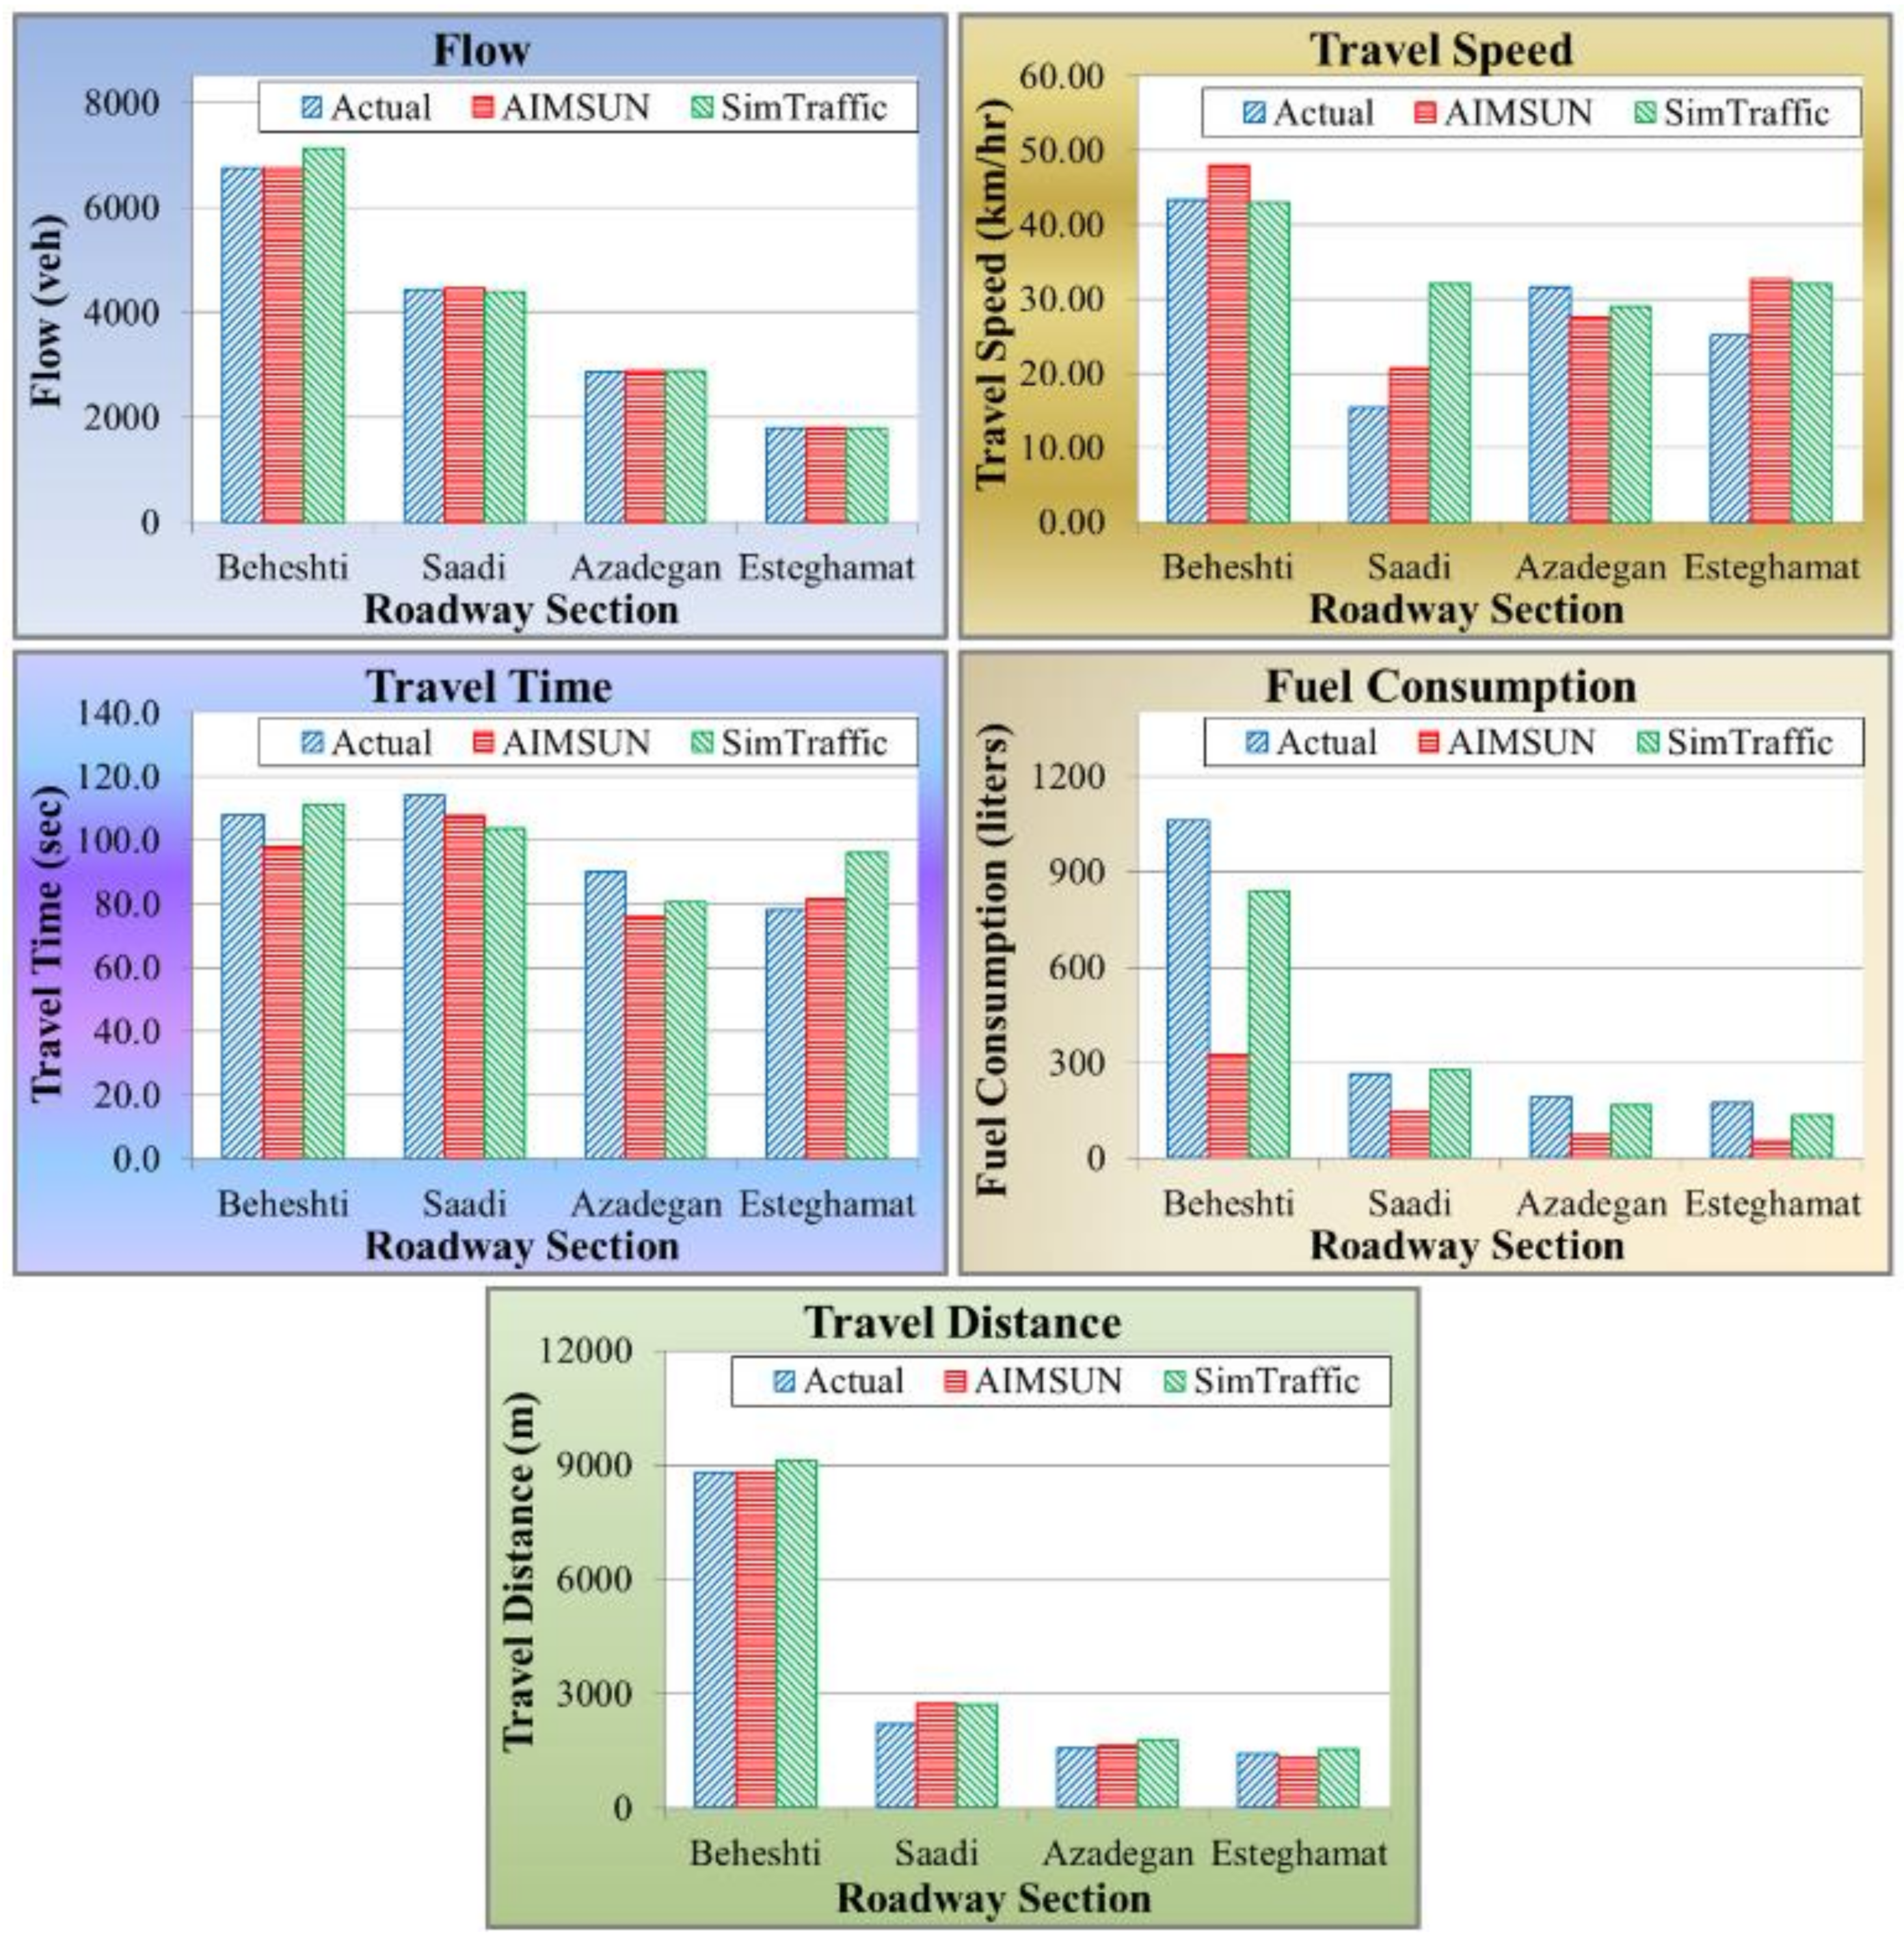
19] and focuses on the selection of the appropriate microsimulation software package for modeling the traffic movements in the northern part of Iran. The AIMSUN and SimTraffic microsimulation models are evaluated for the roadway sections with different functional classifications in terms of various performance indicators, including travel time, travel speed, vehicle flow, fuel consumption, and total travel distance.
AIMSUN and SimTraffic have been widely used for the analysis of the transportation networks in Iran [5,10,11], and such a tendency can be explained by several reasons. First, both AIMSUN and SimTraffic are user-friendly in simulating traffic flow as compared to other microsimulation software packages (e.g., VISSIM). Second, AIMSUN and SimTraffic are quite popular microsimulation software packages and have been adopted by many consulting companies in Iran. Third, the cost of AIMSUN and SimTraffic is more affordable as compared to other microsimulation software packages (e.g., VISSIM). Fourth, the calibration process for AIMSUN and SimTraffic is less complicated when comparing to other microsimulation software packages. Last, but not least, AIMSUN and SimTraffic were found to be efficient in terms of replicating typical traffic conditions in Iran [5]. Findings from the present study are expected to provide more insights regarding the performance of AIMSUN and SimTraffic in terms of the modeling accuracy of the traffic movements in the northern part of Iran. These insights will be valuable for transportation planners and will assist with the selection of the appropriate microsimulation model for the analysis of the transportation networks in Iran.

3. Basic Background Information for AIMSUN and SimTraffic

This section of the manuscript focuses on the description of the background information for the AIMSUN and SimTraffic microsimulation models. Furthermore, this section of the manuscript provides a detailed description of how the key transportation network performance indicators are calculated within the AIMSUN and SimTraffic microsimulation models.

3.1. AIMSUN

The advanced interactive microscopic simulator for urban and non-urban networks (AIMSUN2), the AIMSUN’s prototype, was developed by the members of the former Simulation and Operations Research Laboratory (LIOS), located at the Polytechnic University of Catalonia [33] in 1989. In 1997, the Transport Simulation Systems (TSS) company was founded. Technical developments continued at the Polytechnic University of Catalonia, while TSS was commercializing the AIMSUN microsimulation software package. AIMSUN includes two components that enable a dynamic simulation, including the microscopic simulator and the mesoscopic simulator. AIMSUN can be applied for modeling roadways of different classifications, including urban networks, highways, freeways, arterials, ring roads, and their combinations. Its comprehensive graphic environment allows modeling different levels of travel demand. Furthermore, AIMSUN allows efficient correspondence with monitoring and signal mechanisms. The AIMSUN microsimulation software package can be used to administer maintenance mechanisms of the transportation corridors, facilitate transport security, and evaluate intelligent transport systems, toll mechanisms, and pricing procedures.
The AIMSUN microscopic simulator is a combined discrete/continuous simulator, where for certain elements of the system (e.g., detectors, vehicles), states alter continuously over the given simulated time, which is separated into fairly short, fixed-time intervals that are called simulation steps or cycles. AIMSUN contains some other important elements (e.g., entrance points, traffic signals), for which states alter discretely at specific points over the given simulation time. AIMSUN has many modeling capabilities, including detailed modeling of the traffic network, different types of drivers and vehicles, a wide range of the network geometric layouts, traffic incidents, conflicting maneuvers, and others. Along with traffic lights and traffic detectors, AIMSUN allows emulating variable message signs (VMS) and ramp metering devices. In order to design a simulation scenario, AIMSUN requires certain input data, which can be categorized into four classes: (1) network description; (2) traffic control plans; (3) traffic demand data; and (4) public transport plans. Some of the input parameters are primarily related to the simulation scenario features (e.g., warm-up time, simulation time), while some parameters characterize the nature of the traffic flow and transportation network and must be calibrated (e.g., reaction times, lane-changing zones). The AIMSUN microsimulation software package allows producing a graphical representation of the transportation network in both 2D and 3D formats, statistical data output (journey times, flow, delays, speed, stops), and the data, which were gathered by the simulated detectors (occupancy, counts, speed).
AIMSUN relies on the car-following, lane-changing, and gap-acceptance models. The car-following model determines changes in the velocity of a given vehicle, depending on its position and the positions of the surrounding vehicles. AIMSUN relies on the Gipps car-following model, which is based on the physical probability of lane-changing patterns, location of permanent traffic barriers, express routes, the future driver turns, and the existence of heavy vehicles. The lane-changing model triggers the vehicle movement from one lane to another. Generally, lane changes occur due to alterations in the traffic flow, connecting the origin and the destination, and driver routes. The vehicle lane changes are classified into discretionary and urgent lane changes. The gap-acceptance model allows defining whether the available gap will be accepted by a given driver to maneuver.

3.2. SimTraffic

SimTraffic is a microsimulation module, which is available within the Synchro Studio software. The Synchro Studio was developed by Trafficware, Inc., which was acquired by Naztec in 2005 [34]. Along with SimTraffic, the Synchro Studio has another module (Synchro), which is primarily used for optimizing the timing schemes at signalized intersections and for traffic signal coordination. The Synchro Studio is widely used for different traffic projects and studies on public transport. Synchro optimizes the cycle length, offsets, split times, and phase sequences, aiming to minimize the driver stops and delay. SimTraffic utilizes the information regarding the optimized signal timing provided by Synchro in order to execute microsimulation and emulate the traffic flows. Although the Synchro Studio is heavily used for improving the efficiency of traffic signals, the availability of the SimTraffic module extends its application for the analysis of congested transportation networks. SimTraffic allows modeling individual vehicles traveling along the predefined transportation network. Different types of vehicles can be modeled using SimTraffic, including trucks, passenger cars, and busses.
Unlike a number of other microsimulation software packages, SimTraffic displays animation while the simulation is being executed. The input data, assigned within Synchro (e.g., traffic flows, intersection cycle length, network geometric characteristics), are transferred automatically in the SimTraffic module. The driver and vehicle parameters, including yellow reaction time, green reaction time, gap-acceptance factor, vehicle acceleration, vehicle length, vehicle width, and occupancy, are adopted based on the values that are recommended by the Federal Highway Administration (FHWA). The trip generation and the route assignment are determined based on the traffic flows, which are assigned to each roadway segment. The traffic flows can be adjusted using growth factors, peak hour factor (PHF), or percentile adjustments. SimTraffic assumes that each vehicle will travel at its cruise speed if there are no impediments (i.e., in case there are no obstacles on a given roadway segment, each vehicle will travel at its cruise speed). The cruise speed is estimated based on the assigned link speed and the speed factor, which is dependent on the driver type. The speed factors may range from 0.85 to 1.15 based on the driver type. Similar to the AIMSUN microsimulation software package, SimTraffic allows changing the driver characteristics within the simulation environment.

3.3. Network Traffic Generation

In AIMSUN, the user is able to select one of the following headway models for generating the network traffic [35]: (1) exponential; (2) uniform; (3) normal; (4) constant; (5) “ASAP”; and (6) external. The exponential headway model is the default, where vehicles are assumed to enter the network, following an exponentially distributed vehicle arrival pattern. As for the uniform headway model, the mean time headway values are sampled from the uniform distribution. The normal headway model generates the vehicles, entering the network based on the truncated normal distribution. The constant headway model assumes the time interval between two consecutive vehicles to be constant ( t = 1 / λ , where t —the headway (sec), and λ —the mean input flow (vehicles/sec)). The “ASAP” headway model allows the vehicle to enter the network “as soon as possible” (i.e., once the space becomes available). The ASAP model allows increasing utilization of the available transportation network space. The external headway model generates the entering network traffic using an external user-defined program.
In SimTraffic, the flows are generated at the network entry points based on the volume counts at the downstream intersection [36]. Trips can also be added to the midblock traffic if the midblock traffic is specified or a volume source is required to balance the traffic. If both balancing and midblock sources exist, the midblock traffic will be computed as the maximum of these two sources. The vehicle arrivals generally follow the Poisson distribution. The link flows are computed independently for heavy vehicles and passenger cars. The heavy vehicle volume is estimated as a product of the adjusted vehicle volume and the percentage of heavy vehicles, while the passenger car volume will be equal to the remaining vehicle volume. The user is able to assign two types of heavy vehicles, including: (a) trucks and (b) busses. The entering passenger cars can be assigned as standard passenger cars or carpool passenger cars.

3.4. Car-Following Models

AIMSUN relies on the car-following model, which is based on the Gipps experimental model [35]. The AIMSUN car-following model can be considered as an ad hoc model, where the model parameters are not set to be global and can be adjusted depending on the values of local parameters (e.g., type of driver, the geometry of the roadway section, the influence of vehicles on the adjacent lanes, etc.). The model is based on the two major components, including the following: (a) acceleration; and (b) deceleration. Acceleration represents an intention of a given vehicle to achieve a certain speed. On the other hand, deceleration occurs as a result of the following vehicle driving at a speed that is lower than the desired speed. Based on the AIMSUN car-following model, the maximum speed V a n , t + T to which vehicle n is able to accelerate at the time t + T can be calculated as follows [35]:
V a n , t + T = V n , t + 2.5 · a n · T · 1 V n , t V * n · 0.025 + V n , t V * n
where:
  • V n , t —the speed of vehicle n at time t (m/sec);
  • V * n —the desired speed of vehicle n for a given roadway section (m/sec);
  • a n —the maximum acceleration of vehicle n (m/sec2);
  • T —the reaction time (sec).
The maximum speed V b n , t + T to which vehicle n is able to accelerate at the time t + T , taking into account the vehicle characteristics and the limitations that are imposed by preceding vehicle n 1 , can be computed using the following equation [35]:
V b n , t + T = d n · T + d n 2 · T 2 d n · [ 2 · x n 1 , t s n 1 x n , t V n , t · T V n 1 , t 2 d ´ n 1 ]
where:
  • d n —the maximum deceleration desired by vehicle n (m/sec2);
  • x n , t —the position of vehicle n at time t (m);
  • x n 1 , t —the position of the preceding vehicle n 1 at time t (m);
  • s n 1 —the effective length of the preceding vehicle n 1 (m);
  • d ´ n 1 —the deceleration desired by the preceding vehicle n 1 (m/sec2)
Based on Equations (1) and (2), the definitive speed of vehicle n for a time interval t , t + T can be calculated as follows [35]:
V n , t + T = m i n V a n , t + T , V b n , t + T
SimTraffic relies on two car-following models: (a) fast following model and (b) slow following model. The fast following model is used for the cases when the leading vehicle speed is above 0.6 m/sec. On the other hand, the slow following model is applied for the slow-moving or stopped leading vehicle. The distance between vehicles or distance to the stopping point ( D ) can be calculated based on the following relationship [36]:
D = X L L L D B X S
where:
  • X L —the position of the lead vehicle or stopping point (m);
  • L L —the length of the lead vehicle (m; 0 for stopping point);
  • D B —the distance between (assumed to be 1.5 m);
  • X S —the position of the subject vehicle (m).
In SimTraffic, the stopped vehicles will not start moving until the distance to the leading vehicle reaches 1.5 m. The latter creates a startup reaction time of approximately 1.0 sec per vehicle [36]. For example, the 10th vehicle will not enter the network after approximately 10.0 sec the first vehicle entered the network. The following formula is used by SimTraffic to estimate the distance between vehicles, adjusted for the speed differential and reduced by the traveling vehicle’s desired headway ( D S a f e , m) [36]:
D S a f e = D + min ( S L ) 2 ( S S ) 2 ; 0 2 · a S S · H
where:
  • S L —the speed of the leading vehicle (m/sec);
  • S S —the speed of the subject vehicle (m/sec);
  • a —the vehicle deceleration (assumed to be 1.2 m/sec2);
  • H —the desired headway (sec).

3.5. Travel Time Models

Travel time is one of the major performance indicators, which must be considered in the evaluation of transportation networks. The total vehicle travel time ( T T A I M S U N , sec) is calculated within AIMSUN based on the network entrance and exit times of all vehicles as follows [35]:
T T A I M S U N = i = 1 N s y s T E X i T E N i
where:
  • T E N i —the entrance time of vehicle i in the network (sec);
  • T E X i —the exit time of vehicle i from the network (sec);
  • N s y s —the number of vehicles that cross the system during the considered time period (vehicles).
The total vehicle travel time ( T T S i m T r a f f i c , sec) on a given network segment is calculated within SimTraffic based on the total time spent by each vehicle on that segment and the total waiting time by each vehicle to enter that segment as follows [36]:
T T S i m T r a f f i c = i = 1 N s y s t i + w i
where:
  • t i —the time spent by vehicle i on a given network segment (sec);
  • w i —the waiting time spent by vehicle i to enter a given network segment (sec).

3.6. Average Speed Models

In AIMSUN, the average speed per vehicle ( S A I M S U N , m/sec) is computed based on the following relationship [35]:
S A I M S U N = i = 1 N s y s S i N s y s
where:
  • S i —the average speed of vehicle i (m/sec).
The average speed of vehicle i is estimated as follows [35]:
S i = D i T E X i T E N i
where:
  • D i —the total distance traveled by vehicle i in the network (m).
In SimTraffic, the average speed per vehicle is computed by dividing the total distance by the total travel time [36]. The average speed is weighted by the vehicle flow and includes the stopped time and denied entry time.

3.7. Travel Distance Models

Both AIMSUN and SimTraffic estimate the total travel distance ( d t o t , m) as a summation of the distances traveled by each vehicle in the network, based on the following formula:
d t o t = i = 1 N s y s D i

3.8. Fuel Consumption Estimation Models

AIMSUN estimates the fuel consumption of a vehicle based on the vehicle state (i.e., idling, cruising at a constant speed, deceleration, or acceleration). For the vehicles in a decelerating or idling state, the fuel consumption rate is assumed to be constant. The default fuel consumption rate is set to F A I M S U N d e c = 0.530 mL/sec and F A I M S U N i d l e = 0.330 mL/sec for decelerating and idling states, respectively [35]. However, the aforementioned values can be modified by the user as needed. For the vehicles in an accelerating state, the fuel consumption rate ( F A I M S U N a c c , mL/sec) can be estimated as follows [35]:
F A I M S U N a c c = c 1 + c 2 · a · V
where:
  • c 1 , c 2 —the model constants specified by the user;
  • a —the acceleration rate of a vehicle (m/sec2);
  • V —the speed of a vehicle (m/sec).
For the vehicles traveling at a cruising speed, the fuel consumption rate ( F A I M S U N c r u , mL/sec) can be estimated as follows [35]:
F A I M S U N c r u = k 1 a · 1 + V 2 · V m 3 + k 2 a · V
where:
  • k 1 a , k 2 a —the model constants empirically determined for the considered vehicles;
  • V m —the speed of a vehicle at which the fuel consumption is minimal (m/sec);
  • V —the speed of a vehicle (m/sec).
SimTraffic, on the other hand, estimates the fuel consumption as follows [36]:
F S i m T r a f f i c = k 1 s · T o t T + k 2 s · T o t D + k 3 s · S t o p s
where:
  • F S i m T r a f f i c —the fuel consumption of a vehicle estimated in gallons (should be multiplied by 3.785 in order to convert to liters);
  • k 1 s = 0.075283 0.0015892 · V + 0.000015066 · V 2 ;
  • k 2 s = 0.7329 ;
  • k 3 s = 0.0000061411 · V 2 ;
  • V —the speed of a vehicle provided in mph (1 m/sec is 2.237 mph);
  • T o t T —the travel distance provided in miles (1 mile has 1609.34 meters);
  • T o t D —the total signal delay provided in hours;
  • S t o p s —the total number of vehicle stops per hour.

4. Research Methodology and Data Collection

In order to assess the performance of the considered microsimulation software packages, the field data were collected for the selected roadway sections located in the northern part of Iran. The available field data were refined, and the travel time-flow functions were calibrated using the SPSS statistical software for each one of the considered roadway sections. After processing the collected field data, the major transportation network performance indicators were estimated. Then, the considered roadway sections were modeled within the AIMSUN environment and the SimTraffic environment using the same geometric and physical characteristics. The network performance indicators, estimated using the microsimulation models, were compared to the ones, which were computed based on the collected field data. This section provides details on the field data collection and processing.

4.1. Roadway Sections Selected for the Field Survey

The entire map of Rasht (one of the largest cities in the northern part of Iran and the capital city of Gilan province, located near the Caspian Sea, with a population of approximately 1.2 million, including students, workers, and other commuters [37]) was studied in order to select the roadway sections for further evaluation. A total of four roadway sections with different functional classifications were selected for a detailed analysis, including one major arterial roadway, two minor arterial roadways, and one collector-distributer (C–D) roadway. Note that the classification of roadway sections was adopted based on the Iran urban roadway design code [38]. In particular, the major arterial roadway is classified as a two-lane 2-way suburban roadway, generally passing through the small- and medium-sized cities. On the other hand, the minor arterial roadway is designed to facilitate mobility and accessibility of vehicles. The pedestrian traffic is controlled at intersections using the traffic control signals. The minor arterial roadways generally pass through the large-sized cities. Furthermore, the C-D roadways establish connections between the local and minor arterial streets. The C-D roadways typically have at least two lanes in each direction and an allowable travel speed of 40 km/h.
As stated earlier, a total of four roadway sections were selected for a detailed evaluation, including the following: (1) Beheshti Street; (2) Saadi Street; (3) Azadegan Street; and (4) Esteghamat Street. More information (i.e., classification and basic geometric characteristics) regarding the considered roadway sections is presented in Table 2. Furthermore, the satellite images of the selected roadway sections are presented in Figure 1. All the investigated roadway sections have 2 lanes in each direction. The lane width varies from 3.25 m (Azadegan Street) to 3.75 m (Saadi Street). Moreover, the surveyed section on the Beheshti Street was the longest (i.e., 1300 m), while the surveyed section on the Saadi Street was the shortest (i.e., 490 m). Note that none of the considered roadway sections had any junctions (i.e., the traffic flow along the considered roadway sections was not interrupted due to the presence of junctions).
There exist different approaches for collecting the traffic data (e.g., counts, video recording). In this study, the field data were collected using the traffic counts. The total number of passing vehicles was recorded over 5-min time intervals for each one of the selected roadway sections. The data were collected from 8:00 am until 1:00 pm in five days during weekdays (from Saturday to Wednesday). Note that weekdays in Iran are from Saturday to Thursday. The Thursday data were not considered in the analysis, as the Thursday traffic flow patterns substantially differ from other weekdays for the considered study areas. Throughout the data collection, the weather was clear. Two vehicle plate registration stations were located at each one of the considered roadway sections (one station was located at the beginning of each roadway section, while the other station was located at the end of each roadway section). The following data were collected at the vehicle plate registration stations by the observers: (a) the vehicle entrance time; (b) the last three digits of the vehicle plate; and (c) vehicle type.
The data collected from the vehicle plate registration stations were stored on specific worksheets. Based on the vehicle entrance time at each vehicle plate registration station, the research team was able to determine the time when each vehicle entered and exited a given roadway section. The travel time along a given roadway section was estimated as a difference between the exit and entrance times for each vehicle. The last three digits of the vehicle plate were used as the vehicle’s unique identifiers throughout this study. During the data collection, it was noticed that the travel time was relatively large for certain vehicles on some of the considered roadway sections. The latter can be explained by the fact that those vehicles could make stops along a given roadway section (e.g., to pick or drop-off passengers or cargo), which significantly increased the travel time. However, the number of vehicles with the abnormal travel time can be considered as insignificant as compared to the total number of vehicles, which were passing a given roadway section. In particular, over 17,000 records were collected for the considered roadway sections throughout this study, and less than 2% were eliminated from the analysis due to abnormal travel times.
Once the field data were collected, all registered vehicles were converted to the passenger car units (PCUs) using the standard PCU coefficients, which are presented in Table 3. Note that the adopted PCU coefficients have been widely used in the transportation planning of different networks in Iran [39,40,41]. Bikes and motorcycles are generally assumed to have the same PCU value (i.e., PCU = 0.3) since bikes are not very popular in Iran (i.e., installation of bike lanes is not desirable by the city authorities, as these bike lanes may occupy a substantial portion of urban streets). As for other types of vehicles, mid-size trucks and large-size trucks fall under the category “other types of vehicles”. Mid-size trucks and large-size trucks may substantially impact the traffic flows during the day; however, their percentage was insignificant for the considered roadway sections.

4.2. Data Processing

Once the data collection was completed, the research team started the analysis of the worksheets, which contained the information gathered from the vehicle plate registration stations. The first step in processing the collected data was to identify the timestamps on the entry vehicle plate registration station and the exit vehicle plate registration station for each vehicle. The corresponding time stamps were retrieved using the vehicle plate information. The timestamp values were further used in estimating the total vehicle travel time for each one of the considered roadway sections. In the second step, the estimated travel time observations were analyzed, and the observations with abnormal travel time values were removed from the dataset (as discussed earlier, certain vehicles could make additional stops at a given roadway segment, which substantially increased the total travel time, as compared to the total travel time of the vehicles that did not make any stops). Elimination of the observations with abnormal travel time values was critical in order to ensure that the transportation network performance indicators would be calculated accurately. In the third step, the hourly vehicle flows were estimated for the time periods between 8:00 am and 1:00 pm. Note that the hourly vehicle flows were calculated using the PCU coefficients, which were applied to different types of vehicles. In the fourth step, the hourly travel time values were estimated for the time periods between 8:00 am and 1:00 pm in order to develop the functions, describing the relationship between the travel time and the hourly flow for each one of the considered roadway sections. The travel time and vehicle flow values were entered in the SPSS statistical software.
The SPSS statistical software was further used for the calibration of the travel time-flow functions for each roadway section. The Bureau of Public Roads (BPR) formula was adopted as a foundation throughout the analysis. The BPR formula can be expressed using the following relationship [42]:
t i = t i 0 · 1 + 0.15 · v i c i 4   i I
where:
I —the set of links in the transportation network;
t i —the congested travel time on link i (min);
t i 0 —the free-flow travel time on link i (min);
v i —the vehicle flow on link i (vehicles/h);
c i —the capacity of link i (vehicle/h).
Based on the BPR formula, the congested travel time on a given link is defined based on the free-flow travel time on that link, the vehicle flow, and the link capacity. Increasing the flow of vehicles on a given link causes an increase in travel time. Once the link capacity is reached, the travel time will oscillate. The SPSS statistical software was used to estimate the free-flow travel time and capacity for each one of the considered roadway sections based on the collected data. The basic statistical information for the collected travel time data that were used for the development of BPR functions is presented in Table 4 (including the number of observations, minimum travel time, maximum travel time, average travel time, travel time standard deviation, and median travel time). Note that the collected number of observations used in developing the BPR function for each roadway section was found to be sufficient in order to obtain an acceptable degree of accuracy (i.e., the errors did not exceed 10−8 for the considered roadway sections).

4.3. BPR Functions

Based on the results obtained from the SPSS statistical software, the following BPR functions were obtained for the Beheshti ( t b e h ), Saadi ( t s a a d ), Azadegan ( t a z a d ), and Esteghamat ( t e s t ) roadway sections:
t b e h = 0.80 · 1 + 0.15 · v 260 4
t s a a d = 0.96 · 1 + 0.15 · v 215 4
t a z a d = 1.00 · 1 + 0.15 · v 232 4
t e s t = 1.37 · 1 + 0.15 · v 170 4
The calibrated BPR functions are illustrated in Figure 2 for all the considered roadway sections. Since the length of the considered roadway sections is different, the absolute travel time values were converted into the relative travel time values (i.e., travel time per kilometer) in Table 4 and Figure 2, as this ratio would provide more insights into the travel conditions at the considered roadway sections. It can be observed that the travel time at the Esteghamat roadway section increases much faster with the increasing flow as compared to the other roadway sections.

4.4. Peak Hour Indicators

Based on the analysis of the collected data, the peak hour for the selected roadway sections was found to be 8 am—9 am. The average travel time for the peak hour was calculated based on the available travel time observations collected over the 8 am—9 am peak period. Furthermore, based on the roadway section length and the timestamps recorded at the vehicle plate registration stations, the average speed of vehicles was calculated for each direction of a given roadway section. Details regarding the peak hour indicators are presented in Table 5 for each one of the considered roadway sections, including the following: (1) section name; (2) section main direction; (3) vehicle flow in the main direction— v m a i n ; (4) vehicle flow in the opposite direction— v o p p ; (5) average travel time— t a v e ; (6) average travel speed— s a v e ; and (7) total distance traveled by all the vehicles— d t o t . Note that the main direction was determined based on the police reports and confirmed during the field survey that was conducted as a part of this study for each one of the considered roadway sections.
The highest vehicle volume was recorded for the Beheshti roadway section, while the lowest vehicle flow was observed on the Esteghamat roadway section. The greatest travel time (≈1.9 min) was estimated for the Saadi roadway section, where the vehicles were traveling with an average travel speed of less than 20 km/h. On the other hand, the greatest average travel speed (≈43.32 km/h) was recorded for the Beheshti roadway section. In addition, based on the analysis of the collected data, the greatest vehicle travel distance was calculated for the Beheshti roadway section.

5. Numerical Experiments

Based on the existing physical and traffic characteristics, the selected roadway segments were simulated within the AIMSUN and SimTraffic environments. The major model parameters, such as vehicle specifications (e.g., length, width, maximum speed, acceleration, and others), driver behavior parameters (e.g., reaction time), lane-changing distance in ramp and weaving areas, and others, were calibrated for the travel conditions, observed in the northern part of Iran. The calibration of the major microsimulation model parameters (which are primarily used by the car-following models) was performed based on the field surveys, which were conducted by Shariat [5]. Specifically, Shariat [5] gathered the data for the representative roadway sections, passing through the Tehran metropolitan area. A number of professional Z series SONY cameras were installed along the roadway sections in order to collect the data. The speed and acceleration of passing vehicles were recorded with a time interval of less than 1.0 sec. Each one of the installed cameras could cover an area of up to 100 m in length. The videos created by each camera were overlapped. Then, the collected data were analyzed, and the required car-following model parameters were calculated. Although the study was conducted by Shariat [5] for the Tehran metropolitan area, the obtained results can be applied to this study due to similarities in the traffic flow patterns observed in the Tehran metropolitan area and the northern part of Iran (where the four roadway sections, selected for a detailed analysis in this study, are located).
Furthermore, some additional procedures were performed before adopting the calibration results from the previously conducted study. In particular, the validity of calibrated results (obtained for the Tehran metropolitan area) were verified using the field data that were collected for the considered roadway sections, located in the City of Rasht, based on the GEH formula, proposed by Geoffrey E. Havers [43]:
G E H = 2 · v v ¯ 2 v + v ¯
where:
v —the traffic volume obtained from the microsimulation model (vehicles);
v ¯ —the actual traffic volume obtained from the field observations (vehicles).
As a result of the conducted analysis, it was found that the GEH values did not exceed 4.3 for the considered roadway sections, which shows a high accuracy level of the calibrated data for the car-following models that were adopted in this study. Additional field surveys were conducted in order to calibrate the physical and technical characteristics of a PCU in Iran [39,40,41]. More than 8800 vehicles of different types were analyzed in terms of the following parameters: (1) length; (2) width; (3) weight; (4) maximum speed (i.e., the maximum speed that a vehicle can achieve in a free flow traffic condition on a straight roadway section, assuming no speed limits and obstacles); and (5) maximum acceleration. The analysis results are summarized in Table 6. Based on the estimated PCU specifications and the report published by the Iran standard and quality inspection company [44], the PCU fuel consumption was set equal to 12.1 liters of fuel per 100 kilometers for the urban travel conditions. Using the data collected as a result of the field survey, the estimated driver reaction time comprised approximately 0.90 sec.
Certain microsimulation software packages (e.g., AIMSUN) require setting additional parameters for the lane-changing model. The latter set of parameters were estimated based on the available field observations and is presented in Table 7. In zone 1, the lane-changing decisions are primarily affected by the travel conditions on the lanes involved. The following factors are considered when assessing the improvement in driving conditions from changing lanes [35]: travel speed, desired speed, distance to the preceding vehicle, speed of the preceding vehicle, and others. The lane-changing model is typically implemented in zone 1 for overtaking maneuvers. As for zone 2, it is generally occupied by vehicles, which are not driving in the desirable lanes (i.e., the vehicles aim to move to alternative lanes in order to make turning maneuvers). Once the gap becomes acceptable, the vehicles within zone 2 will be moving closer to the desired lane. Note that the distances to zone 1 and zone 2 are given in seconds (Table 7) but can be converted to meters based on the vehicle travel speed. The on-ramp distance is used by the lane-changing model in the vicinity of ramps (e.g., certain vehicles will be switching lanes in order to get closer to the ramp).
The aforementioned calibrated parameters were assigned within both AIMSUN and SimTraffic microsimulation models in order to conduct the numerical experiments. The next sections of the manuscript elaborate on the evaluation of the considered microsimulation models for the selected roadway sections in terms of the major transportation network performance indicators.

5.1. Evaluation of the Microsimulation Models

Both AIMSUN and SimTraffic microsimulation models use statistical distributions in modeling the traffic flow, which causes differences in terms of the values of transportation network performance indicators from one replication to another. Therefore, multiple replications are required in order to obtain the average values of the performance indicators. A total of ten replications were used to calculate the average values of the performance indicators within the AIMSUN and SimTraffic microsimulation models in this study. Ten replications were found to be sufficient, as the coefficient of variation did not exceed 2.0% for the considered transportation network performance indicators (which will be presented in the following sections of the manuscript). Furthermore, the developed microsimulation models start each replication with an empty transportation network. In order to avoid significant variations in the performance indicators throughout the simulation run, a warm-up time of 15 min was assigned for both AIMSUN and SimTraffic. The peak hour volume was used in modeling the traffic flow for each one of the selected roadway sections. Based on the existing speed limits, the maximum allowable speed was set to 55 km/h for each roadway section.

5.2. Transportation Network Performance Indicators

The major transportation network performance indicators, estimated using the AIMSUN and SimTraffic microsimulation models, are presented in Table 8 and Table 9. Table 8 and Table 9 provide the following information: (1) section name; (2) input vehicle flow— v ; (3) total travel time by all vehicles— t t o t ; (4) average travel speed— s a v e ; (5) average total travel time per vehicle— t v e h ; (6) total fuel consumption by all the vehicles— f t o t ; and (7) total distance traveled by all the vehicles— d t o t . The transportation network performance indicators, calculated using the AIMSUN and SimTraffic microsimulation models, were compared to the actual ones, which were calculated based on the collected field data. The actual input vehicle flow, average travel speed, average total travel time per vehicle, total fuel consumption by all the vehicles, and total distance traveled by all the vehicles, which were computed based on the collected field data, are presented in Table 10. Figure 3 presents the values of all the considered transportation network performance indicators obtained by different approaches (actual vs. AIMSUN vs. SimTraffic) for the selected roadway sections.
The numerical experiments indicate that AIMSUN overestimated the vehicle flow on average by 0.13%, while SimTraffic overestimated the vehicle flow on average by 2.22% over the selected roadway sections. As for the average travel speed, both microsimulation models also overestimated the average travel speed as compared to the actual values, estimated based on the collected field data. Specifically, the average travel speed, suggested by the AIMSUN and SimTraffic microsimulation models, was greater on average by 11.59% and 17.75%, respectively, as compared to the actual average travel speed. It was found that AIMSUN underestimated the actual average total travel time per vehicle on average by 6.91%, while SimTraffic overestimated the average total travel time per vehicle on average by 0.42%.
As for the fuel consumption, both AIMSUN and SimTraffic microsimulation models underestimated the total fuel consumption by vehicles on average by 64.83% and 16.33%, respectively, as compared to the actual fuel consumption, calculated based on the Iran standard and quality inspection company guidelines (i.e., 12.1 liters of fuel per 100 kilometers). Such a significant difference in the fuel consumption, suggested by the microsimulation models, and the actual fuel consumption can be explained by the fact that both AIMSUN and SimTraffic deploy specific fuel consumption models, which are not just simply based on the total travel distance. Specifically, the AIMSUN fuel consumption model uses different equations for estimating the fuel consumption depending on the vehicle state (e.g., “idle” vs. “deceleration” vs. “traveling at the cruising speed” vs. “acceleration”) and takes into consideration the vehicle speed, acceleration/deceleration rates, and different fuel consumption rates (which vary depending on the vehicle state) [35].
On the other hand, the SimTraffic fuel consumption model calculates the fuel consumption based on a nonlinear function, which includes the vehicle cruising speed, total travel distance, total delay caused by traffic signals, and total number of stops [36]. Therefore, based on the analysis results, it can be concluded that the current Iran standard and quality inspection company guidelines require some revisions in order to more accurately estimate fuel consumption. Other variables should be considered (e.g., vehicle state, vehicle speed, acceleration/deceleration rates, total delay caused by traffic signals, total number of stops)—not just the total travel distance. The numerical experiments also indicate that the total distance traveled by all the vehicles, suggested by the AIMSUN and SimTraffic microsimulation models, was greater on average by 3.58% and 8.34%, respectively, as compared to the actual total distance traveled by all the vehicles.

5.3. Discussion

The conducted numerical experiments provided some insights regarding the performance of the AIMSUN and SimTraffic microsimulation models for the selected roadway sections in the northern part of Iran. AIMSUN returned smaller errors for the vehicle flow, travel speed, and total travel distance, while SimTraffic provided more accurate values of the travel time. The errors of the microsimulation models in estimating various transportation network performance indicators can be justified by different issues that include, but are not limited to, the following: (1) capability of the adopted car-following models to replicate realistic traffic flow behavior; (2) capability of the adopted lane-changing models to replicate realistic lane-changing maneuvers; (3) network traffic generation accuracy; (4) errors that are associated with the calibration of BPR functions for the considered roadway sections; (5) errors that are associated with the calibration of physical and technical characteristics of a standard passenger car unit; and (6) errors that are associated with the field data collection and estimation of the actual values of the transportation network performance indicators. Addressing the aforementioned challenges is expected to improve the accuracy of both AIMSUN and SimTraffic microsimulation models.
The fuel consumption, suggested by both microsimulation models, was significantly different from the fuel consumption values, calculated based on the Iran standard and quality inspection company guidelines (where the fuel consumption is proportional to the total travel distance only). The latter finding can be justified by the fact that both AIMSUN and SimTraffic microsimulation models deploy more advanced fuel consumption models, which account not only for the travel distance but also for the other important factors (e.g., acceleration/deceleration rates, travel speed, vehicle state, number of stops, etc.). Despite the difference in terms of the computed fuel consumption values, both AIMSUN and SimTraffic microsimulation models were able to replicate the existing travel conditions on the considered roadway sections with a high degree of accuracy and identify bottlenecks for certain roadway sections. For example, both AIMSUN and SimTraffic were able to identify congestion on the Saadi roadway section, which is in line with the existing travel conditions (Figure 4). In particular, the AIMSUN and SimTraffic microsimulation models suggested the average travel speeds of 20.58 km/h and 32.00 km/h, respectively (Table 8 and Table 9). Such values are significantly lower than the actual speed limit on the Saadi roadway section (55 km/h) and indicate moderate traffic congestion.
The entire section of the Saadi Street (i.e., 490-m roadway segment) experienced traffic congestion during peak hours primarily due to lack of capacity. The existing traffic demand in the area substantially exceeds the available capacity of the Saadi roadway section. Furthermore, throughout the field survey, it was noticed that many vehicles could make stops along the Saadi roadway section (e.g., to pick or drop-off passengers or cargo), which is another reason for the congestion and low travel speeds. Note that the travel speed estimation accuracy could be improved even further by enhancing the quality and quantity of the data that were used for the calibration of the AIMSUN and SimTraffic microsimulation models.
Despite the effectiveness of both microsimulation models in terms of the identification of bottlenecks, AIMSUN is recommended to be further used by transportation planners in northern Iran, as it outperformed SimTraffic in terms of the major transportation network performance indicators (i.e., vehicle flow, travel speed, and total travel distance).

6. Concluding Remarks and Future Research

The demand for passenger and freight transport has significantly increased over the last decades due to a number of reasons, including urban development, industrialization, and population growth. Some of the existing transportation networks are not able to serve the growing demand, which causes severe congestion. Different traffic simulation software packages have been widely used by transportation planners across the world, aiming to identify the appropriate congestion mitigation alternatives and eliminate recurring bottlenecks. Microsimulation models (e.g., VISSIM, CORSIM, PARAMICS, AIMSUN, and SimTraffic) have been commonly used for a detailed evaluation of transportation networks. A number of studies conducted in the past aimed to evaluate certain microsimulation packages. Most of those studies concluded that the selection of the appropriate microsimulation software package could be affected by the software capabilities, ease of use, user interface/graphics, accuracy in estimating various transportation network performance indicators, user needs, objectives of the project and other factors. Furthermore, the selection of the appropriate microsimulation model directly depends on the study area characteristics.
Taking into consideration the existing congestion issues in metropolitan areas of Iran, this study aimed to estimate the major transportation network performance indicators for the four roadway sections with different functional classifications located in the northern part of Iran. The AIMSUN and SimTraffic microsimulation models were developed for the selected roadway selections. The collected field data and the data from a previously conducted study for the Tehran metropolitan area were used for the calibration of microsimulation model parameters. The calibration of car-following models was performed using the previously conducted study for the Tehran metropolitan area, as it has similarities in the traffic flow patterns with the considered study areas. The AIMSUN and SimTraffic microsimulation models with calibrated parameters were used to estimate the major transportation network performance indicators, including travel time, travel speed, vehicle flow, fuel consumption, and total travel distance.
The numerical experiments indicated that AIMSUN returned smaller errors for the vehicle flow, travel speed, and total travel distance. On the other hand, SimTraffic provided more accurate values of the travel time. Significant variations were observed for the fuel consumption estimates, which could be explained by the fact that both microsimulation models had their own approaches for the calculation of fuel consumption. However, both AIMSUN and SimTraffic were able to accurately replicate the existing travel conditions and effectively identify congestion on the selected roadway sections. Despite the effectiveness of both microsimulation models in terms of the identification of bottlenecks, AIMSUN is recommended to be further used by transportation planners in northern Iran, as it outperformed SimTraffic in terms of the major transportation network performance indicators (i.e., vehicle flow, travel speed, and total travel distance). Moreover, findings from this study will be useful for the researchers and practitioners, who heavily rely on microsimulation models in transportation planning.
The scope of future research for this study may focus on the following extensions: (1) compare the AIMSUN and SimTraffic microsimulation models against other microsimulation models (e.g., VISSIM, CORSIM, and PARAMICS), which are widely used in transportation planning: (2) evaluate performance of the AIMSUN and SimTraffic microsimulation software packages for other congested roadway sections in Iran; (3) compare different congestion mitigation alternatives using the developed microsimulation models; (4) assess the effects from deployment of intelligent transportation systems for the considered roadway sections using the developed microsimulation models; (5) conduct an additional field survey and collect the data not only for the morning peak hour, but also for the evening peak hour (the developed microsimulation models could be evaluated using a larger data sample to improve the accuracy of results); (6) apply alternative methods for improving the transportation process (e.g., exact optimization, heuristic algorithms, and metaheuristic algorithms [45,46,47]); (7) compare vehicle trajectories proposed by AIMSUN and SimTraffic throughout the safety analysis (e.g., estimation of crash angles); and (8) collect additional field data to calibrate the parameters of car-following models for the considered roadway sections.

Author Contributions

The authors confirm contribution to the paper as follows: study conception and design: A.M.R., M.A.D., A.M.; data collection: A.M.R., A.M.; analysis and interpretation of results: A.M.R., M.A.D., A.M.; draft manuscript preparation: A.M.R., M.A.D., A.M. All authors have read and agreed to the published version of the manuscript.

Funding

This research received no external funding.

Institutional Review Board Statement

Not Applicable.

Informed Consent Statement

Not Applicable.

Data Availability Statement

The data that were used in this study can be requested by contacting the corresponding author.

Conflicts of Interest

The authors declare no conflict of interest.

References

  1. Markvica, K.; Hu, B.; Prandtstetter, M.; Ritzinger, U.; Zajicek, J.; Berkowitsch, C.; Hauger, G.; Pfoser, S.; Berger, T.; Eitler, S.; et al. On the development of a sustainable and fit-for-the-future transportation network. Infrastructures 2018, 3, 23. [Google Scholar]
  2. Arena, F.; Pau, G.; Severino, A. An overview on the current status and future perspectives of smart cars. Infrastructures 2020, 5, 53. [Google Scholar]
  3. Dulebenets, M.A. A comprehensive multi-objective optimization model for the vessel scheduling problem in liner shipping. Int. J. Prod. Econ. 2018, 196, 293–318. [Google Scholar]
  4. De Carvalho, N.L.; Vieira, J.G.V.; da Fonseca, P.N.; Dulebenets, M.A. A multi-criteria structure for sustainable implementation of urban distribution centers in historical cities. Sustainability 2020, 12, 5538. [Google Scholar]
  5. Shariat, A. Calibration Of Traffic Engineering Software Based On Tehran’s Traffic Condition; A report prepared for the Tehran’s municipality; Tehran, Iran, 2011. [Google Scholar]
  6. Dulebenets, M.A.; Rahimi, A.M.; Mazaheri, A. Assessing the Effects of Indirect Left Turn on a Signalized Intersection Performance: A Case Study for the Tehran Metropolitan Area. Open J. Appl. Sci. 2017, 7, 617–634. [Google Scholar]
  7. Pell, A.; Meingast, A.; Schauer, O. Trends in real-time traffic simulation. Transp. Res. Procedia 2017, 25, 1477–1484. [Google Scholar]
  8. Azlan, N.N.N.; Rohani, M.M. Overview of application of traffic simulation model. In Proceedings of the MATEC Web of Conferences, Penang, Malaysia, 6–7 December 2017; EDP Sciences: Paris, France; Volume 150, p. 03006. [Google Scholar]
  9. Gora, P.; Katrakazas, C.; Drabicki, A.; Islam, F.; Ostaszewski, P. Microscopic traffic simulation models for connected and automated vehicles (CAVs)—State-of-the-art. Procedia Comput. Sci. 2020, 170, 474–481. [Google Scholar]
  10. Ahadi, M.R.; Salahi Moghadam, A.; Gholamin, P.; Nasrollahi, M. Modeling Vehicles Delay in WorkZone using Microscopic Simulation for Two-Lane Freeways. J. Transp. Res. 2017, 14, 1–8. [Google Scholar]
  11. Rahimi, A.M.; Rahimi, F. Traffic Evaluation of SPUI and TUDI Interchanges Based on Traffic Conditions in Tehran with Aimsun and Synchro Software. Iran. J. Sci. Technol. 2019, 44, 1323–1334. [Google Scholar]
  12. Transportation Research Board. Highway Capacity Manual, 5th ed.; National Academy of Sciences, Transportation Research Board; Washington, DC, USA, 2010. [Google Scholar]
  13. Bloomberg, L.; Dale, J. Comparison of VISSIM and CORSIM simulation models on a congested network. Transp. Res. Rec. 2000, 1727, 52–60. [Google Scholar]
  14. Shaw, J.W.; Nam, D.H. Microsimulation, freeway system operational assessment, and project selection in southeastern Wisconsin: Expanding the vision. In Proceedings of the 81st Annual Meeting of the Transportation Research Board, Washington, DC, USA, 13–17 January 2002. [Google Scholar]
  15. Tian, Z.; Urbanik, T.; Engelbrecht, R.; Balke, K. Variations in capacity and delay estimates from microscopic traffic simulation models. Transp. Res. Rec. 2002, 1802, 23–31. [Google Scholar]
  16. Jones, S.L.; Sullivan, A.J.; Cheekoti, N.; Anderson, M.D.; Malave, D. Traffic Simulation Software Comparison Study; A Report Prepared by the University Transportation Center of Alabama; Huntsville, AL, USA, 2004. [Google Scholar]
  17. Fang, F.C.; Elefteriadou, L. Some guidelines for selecting microsimulation models for interchange traffic operational analysis. J. Transp. Eng. 2005, 131, 535–543. [Google Scholar]
  18. Xiao, H.; Ambadipudi, R.; Hourdakis, J.; Michalopoulos, P. Methodology for Selecting Microscopic Simulators: Comparative Evaluation of AIMSUN and VISSIM; Report no. CTS 05-05; University of Minnesota: Minneapolis, MN, USA, 2005. [Google Scholar]
  19. Shariat, A.; Babaie, M. An evaluation of car following models in microsimulations. In Proceedings of the 7th International Civil Engineering Congress, Tehran, Iran, 8–10 May 2006. [Google Scholar]
  20. Pourreza, M.; Mirza Broujerdian, A.; Dindar, M. An evaluation of transport simulation models and choosing best microsimulation for traffic study. In Proceedings of the 9th International Conference on Traffic and Transportation Engineering, Tehran, Iran, 25 February 2011. [Google Scholar]
  21. Da Rocha, T.V.; Leclercq, L.; Montanino, M.; Parzani, C.; Punzo, V.; Ciuffo, B.; Villegas, D. Does traffic-related calibration of car-following models provide accurate estimations of vehicle emissions? Transp. Res. Part D Transp. Environ. 2015, 34, 267–280. [Google Scholar]
  22. Ibrahim, H.; Far, B.H. Simulation-based benefit analysis of pattern recognition application in intelligent transportation systems. In Proceedings of the IEEE 28th Canadian Conference on Electrical and Computer Engineering (CCECE), Halifax, NS, Canada, 3–6 May 2015. [Google Scholar]
  23. Praticò, F.G.; Vaiana, R.; Gallelli, V. Micro-simulation effectiveness in predicting operating speed profiles in a roundabout. Adv. Transp. Stud. 2015, 37, 5–14. [Google Scholar]
  24. Shaaban, K.; Kim, I. Comparison of SimTraffic and VISSIM microscopic traffic simulation tools in modeling roundabouts. Procedia Comput. Sci. 2015, 52, 43–50. [Google Scholar]
  25. Essa, M.; Sayed, T. A comparison between PARAMICS and VISSIM in estimating automated field-measured traffic conflicts at signalized intersections. J. Adv. Transp. 2016, 50, 897–917. [Google Scholar]
  26. Astarita, V.; Festa, D.C.; Giofrè, V.P.; Guido, G. Surrogate safety measures from traffic simulation models a comparison of different models for intersection safety evaluation. Transp. Res. Procedia 2019, 37, 219–226. [Google Scholar]
  27. Kan, X.D.; Xiao, L.; Liu, H.; Wang, M.; Schakel, W.J.; Lu, X.Y.; van Arem, B.; Shladover, S.E.; Ferlis, R.A. Cross-comparison and calibration of two microscopic traffic simulation models for complex freeway corridors with dedicated lanes. J. Adv. Transp. 2019, 1–15. [Google Scholar]
  28. Shaaban, K.; Abou-Senna, H.; Elnashar, D.; Radwan, E. Assessing the impact of converting roundabouts to traffic signals on vehicle emissions along an urban arterial corridor in Qatar. J. Air Waste Manag. Assoc. 2019, 69, 178–191. [Google Scholar]
  29. Granà, A.; Giuffrè, T.; Macioszek, E.; Acuto, F. Estimation of Passenger Car Equivalents for two-lane and turbo roundabouts using AIMSUN. Front. Built Environ. 2020, 6, 86. [Google Scholar]
  30. Kim, J.; Kim, J.H.; Lee, G.; Shin, H.J.; Park, J.H. Microscopic traffic simulation calibration level for reliable estimation of vehicle emissions. J. Adv. Transp. 2020, 1–13. [Google Scholar]
  31. Song, Z.; Wang, H.; Sun, J.; Tian, Y. Experimental findings with VISSIM and TransModeler for evaluating environmental and safety impacts using micro-simulations. Transp. Res. Rec. 2020, 2674, 566–580. [Google Scholar]
  32. Van Beinum, A.; Broekman, E.; Farah, H.; Schakel, W.; Wegman, F.; Hoogendoorn, S. Critical assessment of microscopic simulation models for simulating turbulence around motorway ramps. J. Transp. Eng. Part A Syst. 2020, 146, 04019066. [Google Scholar]
  33. TSS-Transport Simulation Systems. Aimsun. Available online: https://www.aimsun.com (accessed on 15 January 2020).
  34. Trafficware. Synchro Studio 8.0—Planning & Analysis Software. Available online: http://www.trafficware.com/synchro-studio.html (accessed on 15 January 2020).
  35. AIMSUN. Aimsun 8 Dynamic Simulators Users’ Manual; AIMSUN: Barcelona, Spain, 2014. [Google Scholar]
  36. Synchro Studio 8.0User Guide; Trafficware: Sugar Land, TX, USA, 2017.
  37. Mahyar, F. Analysis of the Bus Network of Rasht (Iran) and Description of Some Proposals to Improve the Service. Master’s Thesis, Politecnico di Torino, Turin, Italy, 2019. [Google Scholar]
  38. Islamic Republic of Iran. Vice Presidency for Strategic Planning and Supervision. In Highway Geometric Design Code; No. 415, Office of Deputy for Strategic Supervision, Department of Technical Affairs; Tehran, Iran, 2012. [Google Scholar]
  39. Mazaheri, A. Determination of Appropriate Location of U-Turn at Urban Signalized Intersection. Master’s Thesis, Islamic Azad University, Zanjan, Iran, 2014. [Google Scholar]
  40. Mazaheri, A.; Rahimi, A.M. Determining a suitable position for U-turns near signal-controlled road junctions. Proc. Inst. Civ. Eng. Transp. 2017, 170, 1–9. [Google Scholar] [CrossRef]
  41. Mazaheri, A.; Akbarzadeh, A.; Rahimi, A.M.; Akbarzadeh, M. Estimation of critical gap of U-turns at uncontrolled median openings considering Iran’s driver behavior. Transp. Lett. 2020, 1–13. [Google Scholar] [CrossRef]
  42. Ortúzar, J.; Willumsen, L. Modelling Transport, 4th ed.; Wiley: Hoboken, NJ, USA, 2011. [Google Scholar]
  43. Chitturi, M.V.; Shaw, J.W.; Campbell IV, J.R.; Noyce, D.A. Validation of origin–destination data from bluetooth reidentification and aerial observation. Transp. Res. Rec. 2014, 2430, 116–123. [Google Scholar]
  44. Mahdinejad, M.; Jafari, H.; Nourani, M. Iran’s Vehicle Fuel Consumption Guide; A Report Prepared by the Iranian Fuel Conservation Company; Tehran, Iran, 2016. [Google Scholar]
  45. Pasha, J.; Dulebenets, M.A.; Kavoosi, M.; Abioye, O.F.; Theophilus, O.; Wang, H.; Kampmann, R.; Guo, W. Holistic tactical-level planning in liner shipping: An exact optimization approach. J. Ship. Trade 2020, 5, 1–35. [Google Scholar]
  46. Dulebenets, M.A. A Delayed Start Parallel Evolutionary Algorithm for just-in-time truck scheduling at a cross-docking facility. Int. J. Prod. Econ. 2019, 212, 236–258. [Google Scholar]
  47. Kavoosi, M.; Dulebenets, M.A.; Abioye, O.; Pasha, J.; Theophilus, O.; Wang, H.; Kampmann, R.; Mikijeljević, M. Berth scheduling at marine container terminals: A universal island-based metaheuristic approach. Mar. Bus. Rev. 2020, 5, 30–66. [Google Scholar]
Figure 1. Satellite images of the selected roadway sections.
Infrastructures 06 00046 g001
Figure 2. Calibrated Bureau of Public Roads (BPR) functions for the selected roadway sections.
Infrastructures 06 00046 g002
Figure 3. Transportation network performance indicators: actual vs. AIMSUN vs. SimTraffic.
Infrastructures 06 00046 g003
Figure 4. Congestion on the Saadi roadway section.
Infrastructures 06 00046 g004
Table 1. Literature review summary.
Author(s)YearSoftware UsedKey Findings and Important Notes
Bloomberg and Dale [13]2000CORSIM; VISSIMThe differences among the considered microsimulation models were minimal, and the selection of the appropriate microsimulation model was primarily affected by the user needs.
Shaw and Nam [14]2002CORSIM; PARAMICS; VISSIMPARAMICS was found to be the most appropriate model for the Southeast Wisconsin freeway system based on the model capabilities, ease of use, and application requirements.
Tian et al. [15]2002CORSIM; SimTraffic;
VISSIM
CORSIM produced the lowest variations in both vehicle delays and throughput flow rates, while SimTraffic returned the highest variations.
Jones et al. [16]2004AIMSUN; CORSIM;
SimTraffic
SimTraffic was reported to have the most user-friendly graphical interface, while CORSIM was found to be more efficient for modeling complex transportation networks.
Fang and Elefteriadou [17]2005AIMSUN; CORSIM; VISSIMIdentified the most critical factors that should be considered in the selection of the appropriate microsimulation model. Familiarity with the facility was found to be one of the main factors that could improve the modeling accuracy.
Xiao et al. [18]2005AIMSUN; VISSIMThe models were evaluated based on the functional capabilities, service quality, and ease of use. Preferences to use a specific model were primarily determined by the type of user.
Shariat and Babaie [19]2006AIMSUN; VISSIMThe Whiteman–Ritter car-following model (used in VISSIM) was found to be more logical and typically yielded more accurate results.
Shariat [5]2011AIMSUN; SimTraffic; VISSIMAIMSUN was superior to VISSIM and SimTraffic in terms of knowledge management, user-friendliness, software cost, and popularity among organizations.
Pourreza et al. [20]2011AIMSUN; CORSIM; INTEGRATION; PARAMICS; VISSIMCORSIM was found to be the most advantageous microsimulation model based on the considered performance indicators (i.e., model capabilities, previous software implementation, software support, software costs, user-friendliness, graphics, and interface).
Da Rocha et al. [21]2015N/AThe Gipps and Newell car-following models were studied. The Gipps car-following model demonstrated higher accuracy in terms of the simulated vehicle trajectories. The selection of the non-optimal parameters substantially increased the variance of the model outputs.
Ibrahim and Far [22]2015AIMSUNThe numerical experiments demonstrated that the AIMSUN microsimulation model was able to reduce the travel time by ~5–30%, while the congestion duration was decreased by ~8–41%.
Praticò et al. [23]2015VISSIMAimed to estimate vehicle travel speeds on roundabouts. The accurate travel speed estimates could be provided when the model parameters were carefully calibrated.
Shaaban and Kim [24]2015SimTraffic; VISSIMFor the high traffic flow scenarios, VISSIM provided higher delay values as compared to SimTraffic.
Essa and Sayed [25]2016PARAMICS; VISSIMDefault model parameters gave poor correlation with the field-measured data. Both microsimulation models could not estimate conflicts accurately without proper calibration.
Astarita et al. [26]2019AIMSUN; Tritone; VISSIMThe experiments showed some variations in the simulation outputs. However, the roundabout intersection generally had the largest number of conflicts.
Kan et al. [27]2019AIMSUN; MOTUSStudied freeway corridors that had dedicated lanes and experienced congestion. The experiments provided some insights into driver behavior on freeways.
Shaaban et al. [28]2019VISSIMIt was found that the replacement of roundabouts with traffic signals could reduce emissions by 37%−43% at one of the urban arterial corridors in Qatar.
Granà et al. [29]2020AIMSUNThe results showed that the operational performance of roundabouts could be significantly affected by the percentage of heavy vehicles.
Kim et al. [30]2020VISSIMThe study proposed a systematic guideline that could be used for calibrating reliable microscale estimates of vehicle emissions.
Song et al. [31]2020TransModeler; VISSIMThe experiments showed that, even after calibration, both microsimulation models had significant errors in some performance indicators when comparing to the actual values.
Van Beinum et al. [32]2020MOTUS; VISSIMThe considered models were not able to accurately emulate turbulent traffic flows in terms of the headway distribution and lane-changing locations.
Pell et al. [7]2017Survey studyConducted a detailed analysis of 17 simulation packages. It was found that many software packages have a significant number of drawbacks in modeling capabilities.
Azlan and Rohani [8]2018Survey studyProvided a comprehensive overview of microscopic, mesoscopic, and macroscopic traffic simulation models. The study highlighted that the project needs mostly affect the final selection of the appropriate traffic simulation model.
Gora et al. [9]2020Survey studyStudied the existing literature on the applications of microscopic traffic simulation for modeling connected and autonomous vehicles. It was highlighted that new algorithms should be developed to better capture the travel behavior of vehicles.
Table 2. Geometric and physical characteristics of the selected roadway sections.
Section NameSection TypeLanes in Each DirectionLane Width (m)Survey Length (m)
BeheshtiMajor arterial23.501300
SaadiMinor arterial23.75490
AzadeganMinor arterial23.25546
EsteghamatC-D23.50790
Table 3. Adopted passenger car units (PCU) coefficients.
Vehicle TypesPassenger CarTaxiVanPickupMiddle BusUrban BusIntercity BusBikeOther Types of Vehicles
PCU coefficient1.01.51.02.02.55.03.00.33.0
Table 4. Statistical information for the collected travel time data.
StatisticSection Name
BeheshtiSaadiAzadeganEsteghamat
Number of observations1711777352152348
Minimum travel time (min/km)0.80020.96041.00031.3715
Maximum travel time (min/km)2.44125.17204.236116.7479
Average travel time (min/km)1.19011.96131.76935.0256
Travel time standard deviation (min/km)0.50171.28750.98924.7005
Median travel time (min/km)0.95021.34541.29612.7772
Table 5. The peak hour indicators for the selected roadway sections.
Section NameDirection v m a i n   ( veh ) v o p p   ( veh ) t a v e   ( min ) s a v e   ( km / h ) d t o t   ( km )
BeheshtiEast to West298637641.843.328775.0
SaadiNorth to South265417891.915.422177.1
AzadeganEast to West167711811.531.561560.5
EsteghamatEast to West8878981.325.201410.2
Table 6. Calibrated physical characteristics of a standard passenger car unit.
ParameterLength (mm)Width (mm)Weight (kg)Maximum Speed (km/h)Maximum Acceleration (m/sec2)
Mean4141.81656.91044.6164.51.93
Minimum3838.01605.0934.0140.01.46
Maximum4524.01755.01264.0200.02.72
Standard deviation280.747.0104.121.50.41
Coefficient of variation0.0680.0280.1000.1310.212
Table 7. Calibrated lane-changing parameters.
Lane-Changing ParametersMean Value (sec)
Distance to zone 113.74
Distance to zone 24.40
On-ramp distance7.10
Table 8. AIMSUN performance indicators for the selected roadway sections.
Section Name v (veh) t t o t (h) s a v e (km/h) t v e h (sec) f t o t (liters) d t o t (km)
Beheshti6745183.748.0298.03321.68773.6
Saadi4447133.020.58107.7145.02729.2
Azadegan287660.627.6775.7972.71603.3
Esteghamat178940.532.6281.5553.21315.1
Table 9. SimTraffic performance indicators for the selected roadway sections.
Section Name v (veh) t t o t   ( h ) s a v e   ( km / h ) t v e h   ( sec ) f t o t   ( liters ) d t o t   ( km )
Beheshti7129220.043.00111.09836.99114.0
Saadi4394126.732.00103.80275.02701.5
Azadegan287464.429.0080.66165.91763.0
Esteghamat179147.832.0096.08131.71505.1
Table 10. Actual values of the performance indicators for the selected roadway sections.
Section Name v (veh) s a v e   ( km / h ) t v e h   ( sec ) f t o t   ( liters ) d t o t   ( km )
Beheshti675043.32108.001061.88775.0
Saadi444315.42114.00263.42177.1
Azadegan285831.5690.00188.81560.5
Esteghamat178525.2078.00170.61410.2
Publisher’s Note: MDPI stays neutral with regard to jurisdictional claims in published maps and institutional affiliations.

