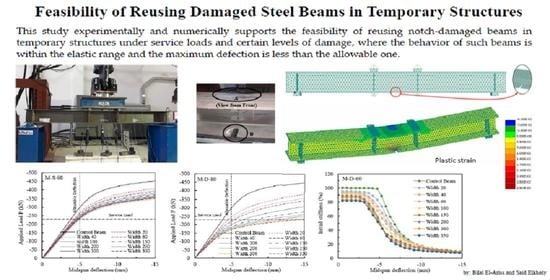
Feasibility of Reusing Damaged Steel Beams in Temporary Structures


1
College of Engineering, United Arab Emirates University, Al Ain 15551, United Arab Emirates
2
Faculty of Engineering, Fayoum University, Faiyum 63514, Egypt
*
Author to whom correspondence should be addressed.
Infrastructures 2021, 6(5), 69; https://0-doi-org.brum.beds.ac.uk/10.3390/infrastructures6050069
Submission received: 31 March 2021
/
Revised: 29 April 2021
/
Accepted: 30 April 2021
/
Published: 3 May 2021
Abstract
:This study addresses the feasibility of reusing pre-damaged steel beams in temporary structures. The extensive structural investigation of notch-damaged, unrepaired, and laterally unsupported steel beams was performed experimentally and numerically. The simply supported specimens were tested in two-point loading with the study parameters being the location and size of the notch. Some beams had one notch on one edge of the tension flange at different locations, and some beams had two notches on both edges of the tension flange. Three-dimensional numerical models were generated to simulate the behavior of the test beams. After verifying the model, the numerical analysis was extended to cover additional different notch depths and widths. The study showed that the capacity of beams with single notch was more influenced by the notch depth increase than it was by the increase in the notch width. Beams with double notches exhibited an even more pronounced and distinct decrease in the capacity as the notch depth and width increased. This investigation supports the feasibility of reusing pre-damaged steel beams in temporary structures under service loads and certain levels of damage, where the behavior of such beams is within the elastic range and the beam maximum defection is less than the allowable one.
1. Introduction
Several shapes of structural steel members are used in structures and bridges. Some of the most commonly used steel shapes are I-sections, built-up sections, and wide flange members which, when used in flexure, develop the highest bending stresses in the flanges, making them a critical part of the member cross-section. Therefore, any damage to the flanges such as area loss in the flange area, due to removing a localized corrosion or due to minor collisions during construction or because of low clearance of structures, reduces the flexural capacity of the beam. This might give rise to a limited or whole failure of the structure. Fiber-reinforced plastic (FRP) composite materials have been utilized in retrofitting concrete structures as well as wood, masonry, and steel structural members. The composite materials may be glass or carbon-FRP materials (GFRP or CFRP) and they are used in the form of flexible sheets or rigid plates.
Hmidan et al. [1] tested notch-damaged steel I-beams strengthened with CFRP sheets. They stated that the level of initial damage in the CFRP-strengthened beams affected the behavior of the plastic region in the vicinity of the notch tip, the CFRP debonding initiation rate, and the beam mode of failure. Shaat and Fam [2,3,4] presented the results of an experimental work on retrofitting artificially damaged steel–concrete composite beams by saw-cutting part of the steel beam tension flange. The tested beams were repaired using adhesively bonded CFRP sheets. The findings of their study showed that adhesively bonded CFRP sheets can be used to repair damaged steel–concrete composite beams. Nozaka et al. [5] compared the test results of various CFRP laminate/adhesive schemes that were used to retrofit notched steel beams. The experimental results showed that an adhesive with fairly large ductility was essential to effectively redistribute the stresses in the adhesive layer. Deng et al. [6,7] proposed the utilization of mixed-mode cohesive law to mimic notch-damaged steel beams strengthened with CFRP plates. They stated that even though the bearing capacity of the beams was increased, the ductility decreased as the notch size increased and the premature debonding mode of failure took place. Siwowski and Siwowska [8] and Siwowska and Siwowski [9] experimentally compared the flexural behavior of steel beams strengthened with CFRP plates. Four different configurations of strengthened steel plates with a center notch under fatigue load (adhesive-bonded non-prestressed plates and adhesive-bonded prestressed plates) were considered. They demonstrated the possibility of extending the fatigue life of steel plates nearly four times with non-prestressed plates and, in some cases, completely arresting the crack growth by using prestressed plates. Elchalakani [10] presented the experimental results of CFRP-rehabilitated corroded steel circular hollow sections (CHS) tested under quasi-static large deformations. The results showed that the increase percentage in the combined flexural and bearing strength of the CHS was generally affected by the corrosion level. For the CFRP-rehabilitated CHS with 20% corrosion level, the stiffness and capacity were fully restored; however, for CFRP-rehabilitated CHS with higher corrosion levels of 40–80%, such stiffness and capacity were not entirely recovered. Chen et al. [11] examined the fatigue behavior of cracked rectangular hollow section (RHS) steel beams. They revealed details of strengthening arrangements using CFRP plates with high modulus and conducted fatigue tests on the strengthened RHS beams. The experimental results indicated that high modulus CFRP increased the beam fatigue life. Ochi et al. [12] experimentally explored the strengthening effects of high modulus CFRP strips bonded to the tensile flange of I-shaped steel girders. Six beam specimens with different adhesive lengths were used and the beams were tested in flexure. The authors suggested a scheme to prevent debonding of the strips and experimentally tested it. The experimental results were discussed to highlight the effectiveness of the strengthening CFRP strips and the suggested debonding prevention scheme. Ghafoori and Motavalli [13] developed a retrofitting system by prestressing CFRP plates and attaching them to the steel beams using only a pair of mechanical locks that function in friction. Design considerations of the locks were proposed. The retrofitted beams were statically tested to failure and the test results showed an increase in beam yielding and ultimate capacities. Li el al. [14] designed end anchorage systems to be used with prestressed CFRP plates to rehabilitate notch-damaged steel beams. They experimentally studied the rehabilitated beam specimens for flexural behavior. It was concluded that prestressed CFRP strengthening plates could restore the bearing capacity and ductility of the notch-damaged steel specimens, delay debonding propagation, and prevent premature failure. However, the improvement of the rehabilitated beam stiffness was not evident.
Zhou et al. [15] experimentally and numerically investigated nine notch-damaged wide flange steel beam specimens. The specimens were retrofitted using carbon fiber reinforced polymer (CFRP) laminates and a recently developed carbon-fiber hybrid-polymeric matrix composite (CHMC) that has been termed CarbonFlex. The peak load deflections of the CarbonFlex-retrofitted beams were higher than their CFRP-retrofitted counterparts. Both experimental and numerical results indicated the effectiveness of CarbonFlex, as a candidate retrofitting material, for damaged steel structures. Hmidan et al. [16] proposed a modeling approach to simulate debonding of the CFRP sheets and crack propagation in crack-dependent behavior of CFRP-strengthened steel members subjected to axial tension. The modeling approach was experimentally validated and implemented into three-dimensional FE models to examine the effect of various notch sizes on the behavior of CFRP-strengthened steel members. Chiew et al. [17] tested three types of FRP-bonded steel joints to investigate the bond failure mechanism of FRP. Numerical simulations of strain distributions along the bond line were also carried out to verify the experimental work. Using the equivalent strain energy density based on the failure criterion a bond failure model was proposed. Tavakkolizadeh and Saadatmanesh [18,19] and Photiou et al. [20] studied the behavior of damaged steel–concrete composite steel girders repaired with CFRP sheets under static loading. Three scenarios of 25%, 50%, and 100% loss of tension flange area of the W-shape cross-section were investigated. Test results revealed that epoxy-bonded CFRP sheets could restore the stiffness and ultimate load-carrying capacity and of repaired girders. Comparison between experimental and numerical modeling showed that the traditional methods of analysis of composite beams were conservative. Wang and Wu [21] developed two approaches termed symmetrical and asymmetrical prediction approaches to predict the fatigue crack spreading of FRP-strengthened double-edged cracked steel beams using finite element (FE) modelling. These approaches were verified experimentally. The comparative results concluded that the prediction of the fatigue crack propagation of the double-edged cracked FRP-strengthened steel members could approximately be projected. Colombi and Fava [22] developed curves for predicting crack growth in CFRP-strengthened steel beams. They conducted nine fatigue tests on CFRP-strengthened cracked steel beams. The authors concluded that their developed curves showed that CFRP strengthening strips prolonged the fatigue life of the beams and reduced the fatigue crack propagation. They also stated that debonding of the CFRP strips had an unfavorable effect on the efficiency of the strengthening technique.
A simple analytical approach was developed by Kim and Brunell [23] and Kim and Harries [24] for estimating the bond length of the various repair strategies. Different CFRP repair strategies for steel beams with notch damages were examined. The influence of the notch configurations was studied using finite element (FE) analysis to obtain the interaction between CFRP-repair and the initial damage of steel beams loaded in flexure. Kadhim [25] numerically examined the performance of continuous steel beams strengthened with CFRP plates and focused on the effect of plate length on the steel beam behavior. The numerical results indicated that when the length of strengthening CFRP plates in sagging and hogging regions of the beam exceeded 40% and 60% of the beam span length, respectively, the ultimate strength increase rate decreased. Haeri el al. [26] numerically studied the crack propagation in beams with double internal cracks tested in a three-point flexural test. They concluded that when two cracks overlapped, they combined in the failure progression with decreased stress values when the cracks were positioned at the midpoint of the beam span. Yu et al. [27] developed a bond failure model to predict the bond failure load of steel beams strengthened with FRP laminates. They studied the effects of laminate thickness, bond length, and adhesive thickness on the bond strength. Their study concluded that reducing the laminate thickness and modulus, reducing the adhesive thickness, or increasing the bond length can increase the bond strength between the strengthening FRP laminates and steel beams. Previous studies by Zhou et al. [15], Abambres and Arruda [28], and Ulger and Okeil [29] examined the effects of initial imperfection on the behavior of strengthened steel beams. They first executed the preliminary FE models to extract the Eigen buckling mode shapes, which were later impregnated into the preliminary FE models to impose initial imperfections in the final FE model. These studies established that using separate or a combination of mode shapes imposed initial imperfection in the FE modeling of the control steel beam and the strengthened steel beams had an insignificant effect on the final results, and that it was pointless to consider initial imperfections in the FE models. Moreover, Gonçalves [30] stated that if local/distortional buckling is not significant, it would be recommended to use one-dimensional finite elements as they provide sufficiently accurate results with a considerably lower computational time and cost.
Mohammed et al. [31] presented a critical review of the existing jacketing techniques to repair and strengthen declining infrastructure. The review identified present practices and techniques, highlighted design guidelines to use FRP composite jackets in repairing structures, and underlined the challenges in future research to increase the acceptance of using composite repair schemes in infrastructure. The structural performance of three new proposed railway composite sleepers were investigated experimentally and numerically by Ferdous et al. [32]. The findings of the investigation indicated that the proposed composite sleepers were economical and could structurally replace the current railway track timber sleepers. A review by Tingley et al. [33] and case study by Pongiglione and Calderini [34] have recommended the reuse of structural steel to reduce embodied carbon and raw material consumption, despite some barriers such as the quality of the reused steel, additional cost, and availability of the desired sections. However, reusing structural steel members with damages was not addressed. A new publication (SCI P427—Structural Steel Reuse: assessment, testing and design principles) recommends using reclaimed steel members that were not used in old construction and have not been subjected to extreme loads such as fire or impact. Further, the publication recommends to avoid using reclaimed members in structures where they could be subjected to fatigue, such as bridges. However, this publication did not provide design recommendations for reclaimed members with damages in temporary infrastructure work.
The literature review demonstrates that researchers have mostly investigated beams with damages in the tension side and proposed rehabilitation and strengthening techniques to notch-damaged structural steel members using composite FRP plates and sheets with some unstrengthened notched beams as reference and reveals the lack of research on unrepaired steel beams that have notch damage and are laterally unsupported. The objective of this study is to experimentally and numerically examine the feasibility of reusing steel beams with notch damage in the tension in temporary structural applications without being repaired and laterally supported.
2. Experimental Program
2.1. Specimen Specifics
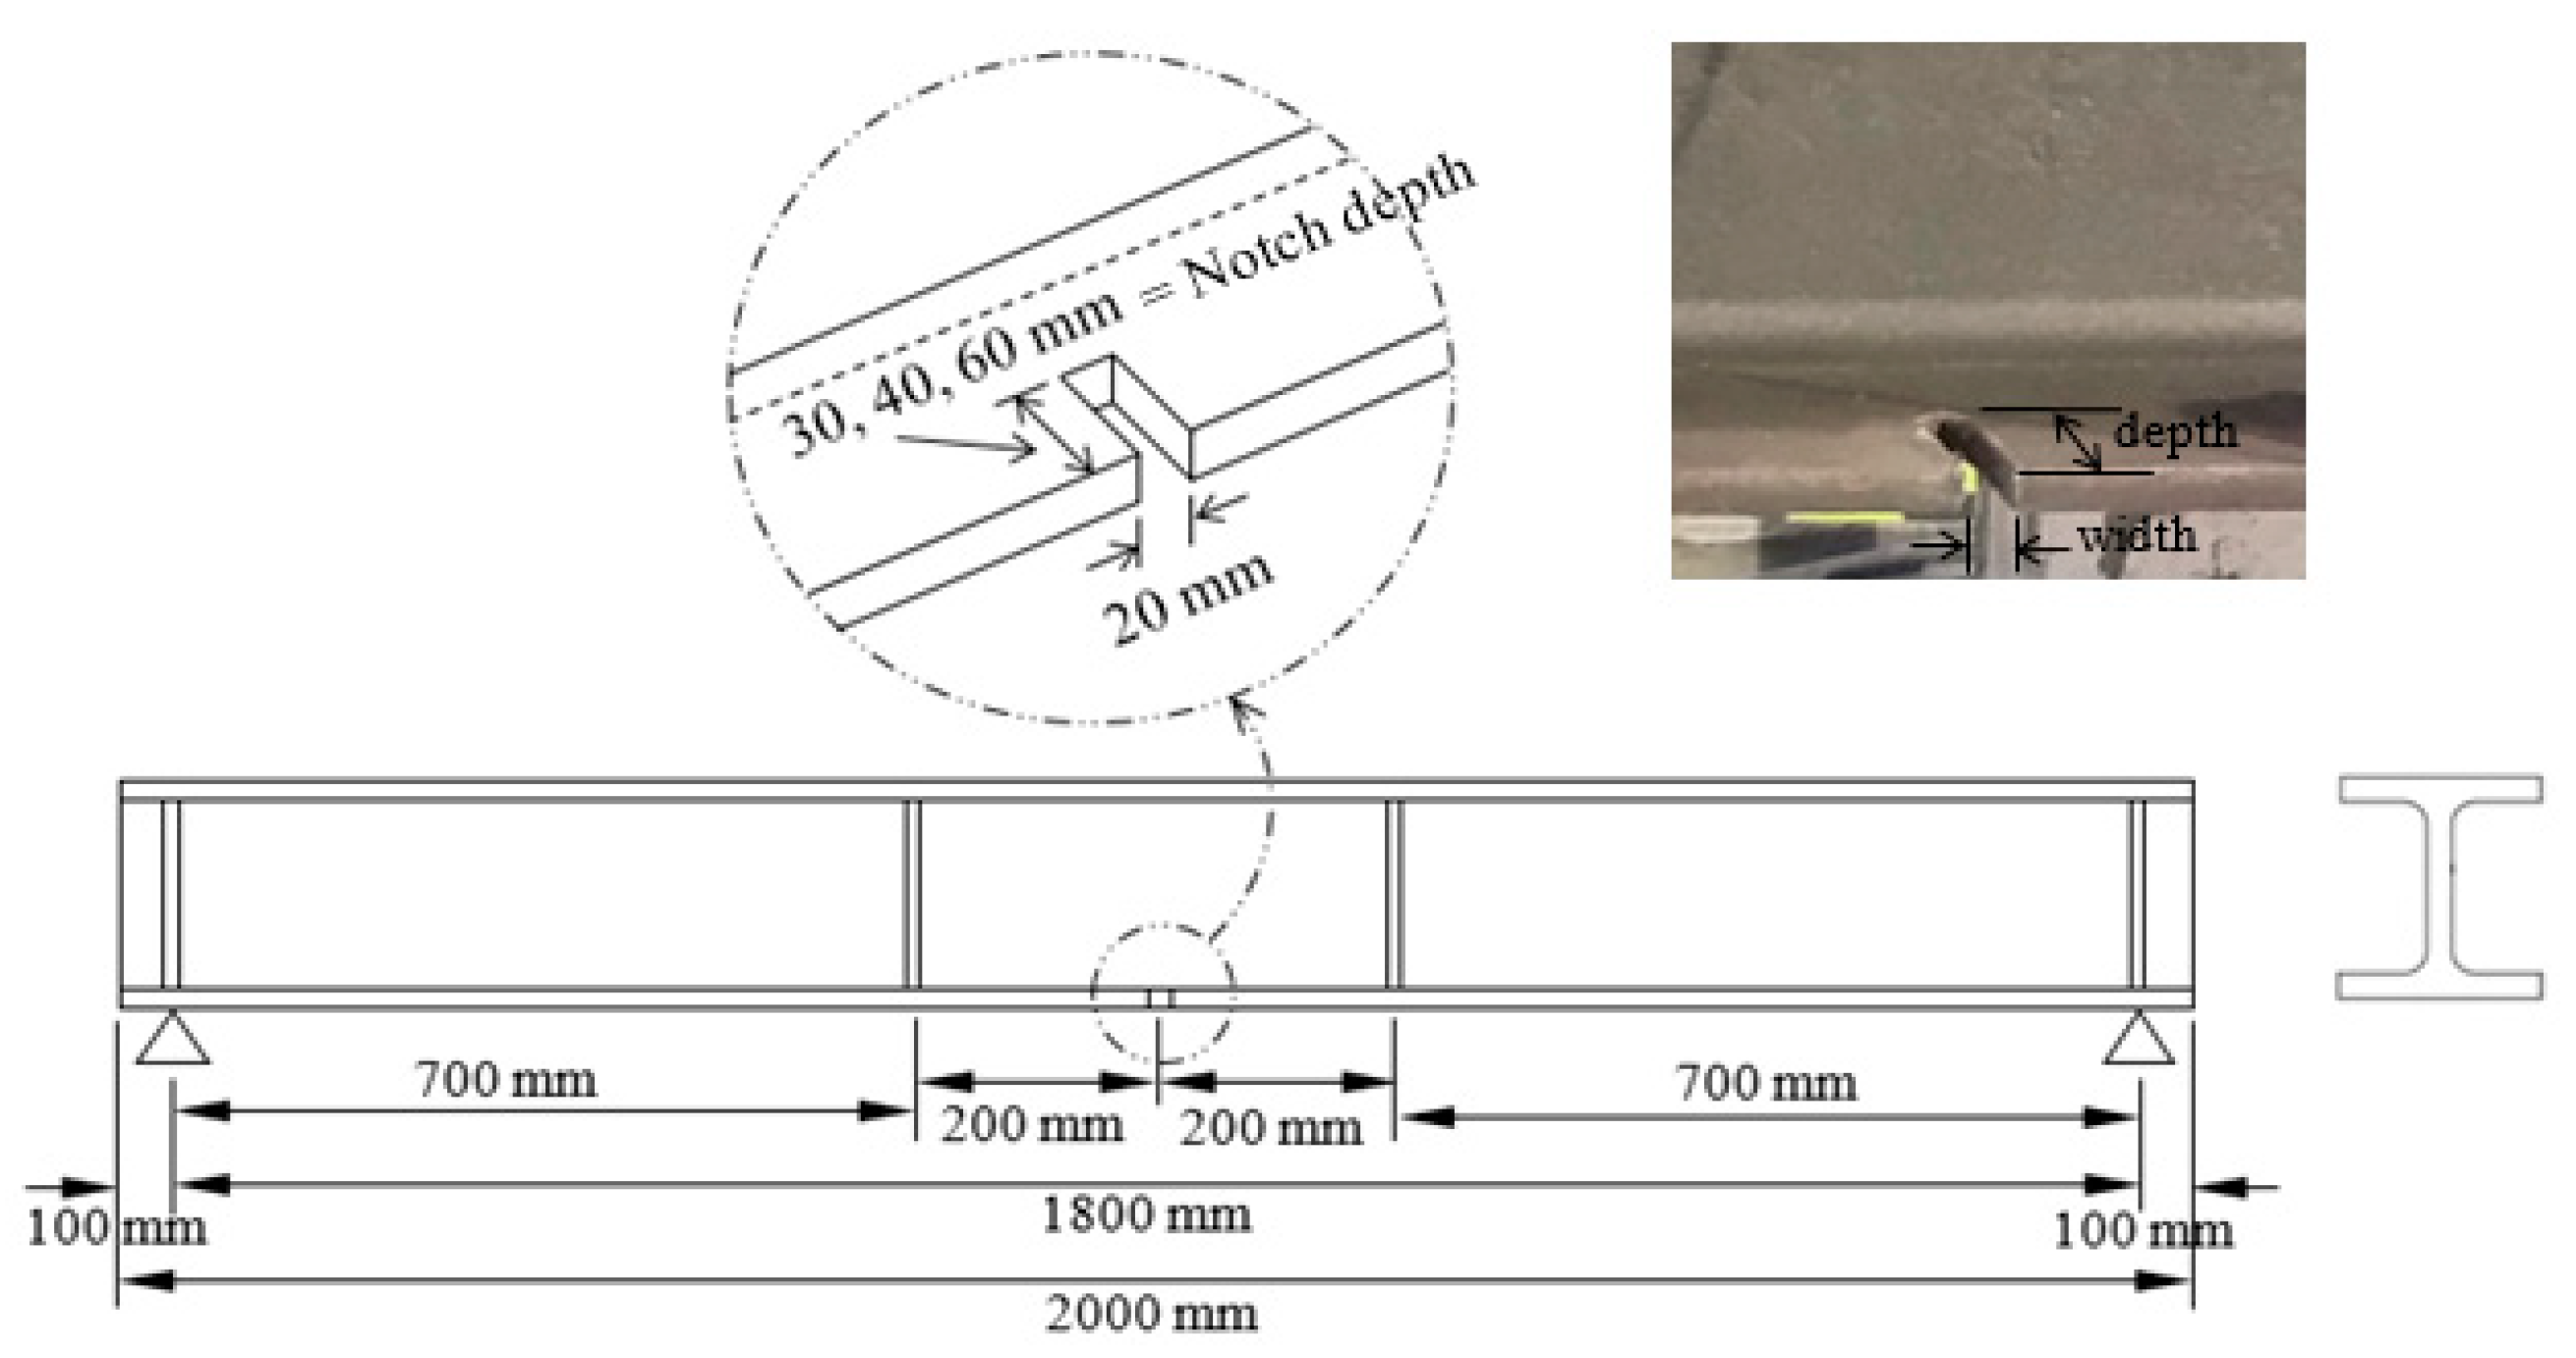
A total of twelve bare I-shaped steel beams of W 203 × 203 × 46.1 sections were prepared, instrumented, and experimentally tested to examine their flexural performance. One of the specimens, control beam, was kept undamaged while the other eleven specimens were pre-damaged by cutting a U-shaped notch in their tension (bottom) flange and were left unrepaired. The American Institute of Steel Construction manual (AISC) was utilized in this work to design the control beam. Accordingly, the span and section of the laterally unsupported control beam were selected to ensure that it would not undergo lateral torsional buckling. The AISC manual provides design recommendations for tension members with bolted connections where the bolt holes can be considered as a damage to the member. Additionally, the AISC manual covers the design of beams with web openings and beams with missing flange. All twelve laterally unsupported I-shaped specimens were tested in two-point loadings for flexure and the parameters considered in the study were the location and the size of the notches. The notch size (depth) considered in this study was 30 mm, 40 mm, and 60 mm in depth, while the notch opening width was kept constant at 20 mm in all the damaged specimens, as shown Figure 1. All beams had a total length of 2000 mm and an actual span of 1800 mm between supports, as shown in Figure 1. The location of the notch selected in this study was at one-quarter, one-third, and the middle of the specimen clear span. All pre-damaged steel specimens had notches on one side of the tension flange with respect to the beam web except for two specimens where two notches were cut at the middle of the specimen clear span on both sides of the tension flange and had two different depths, 40 mm and 60 mm.
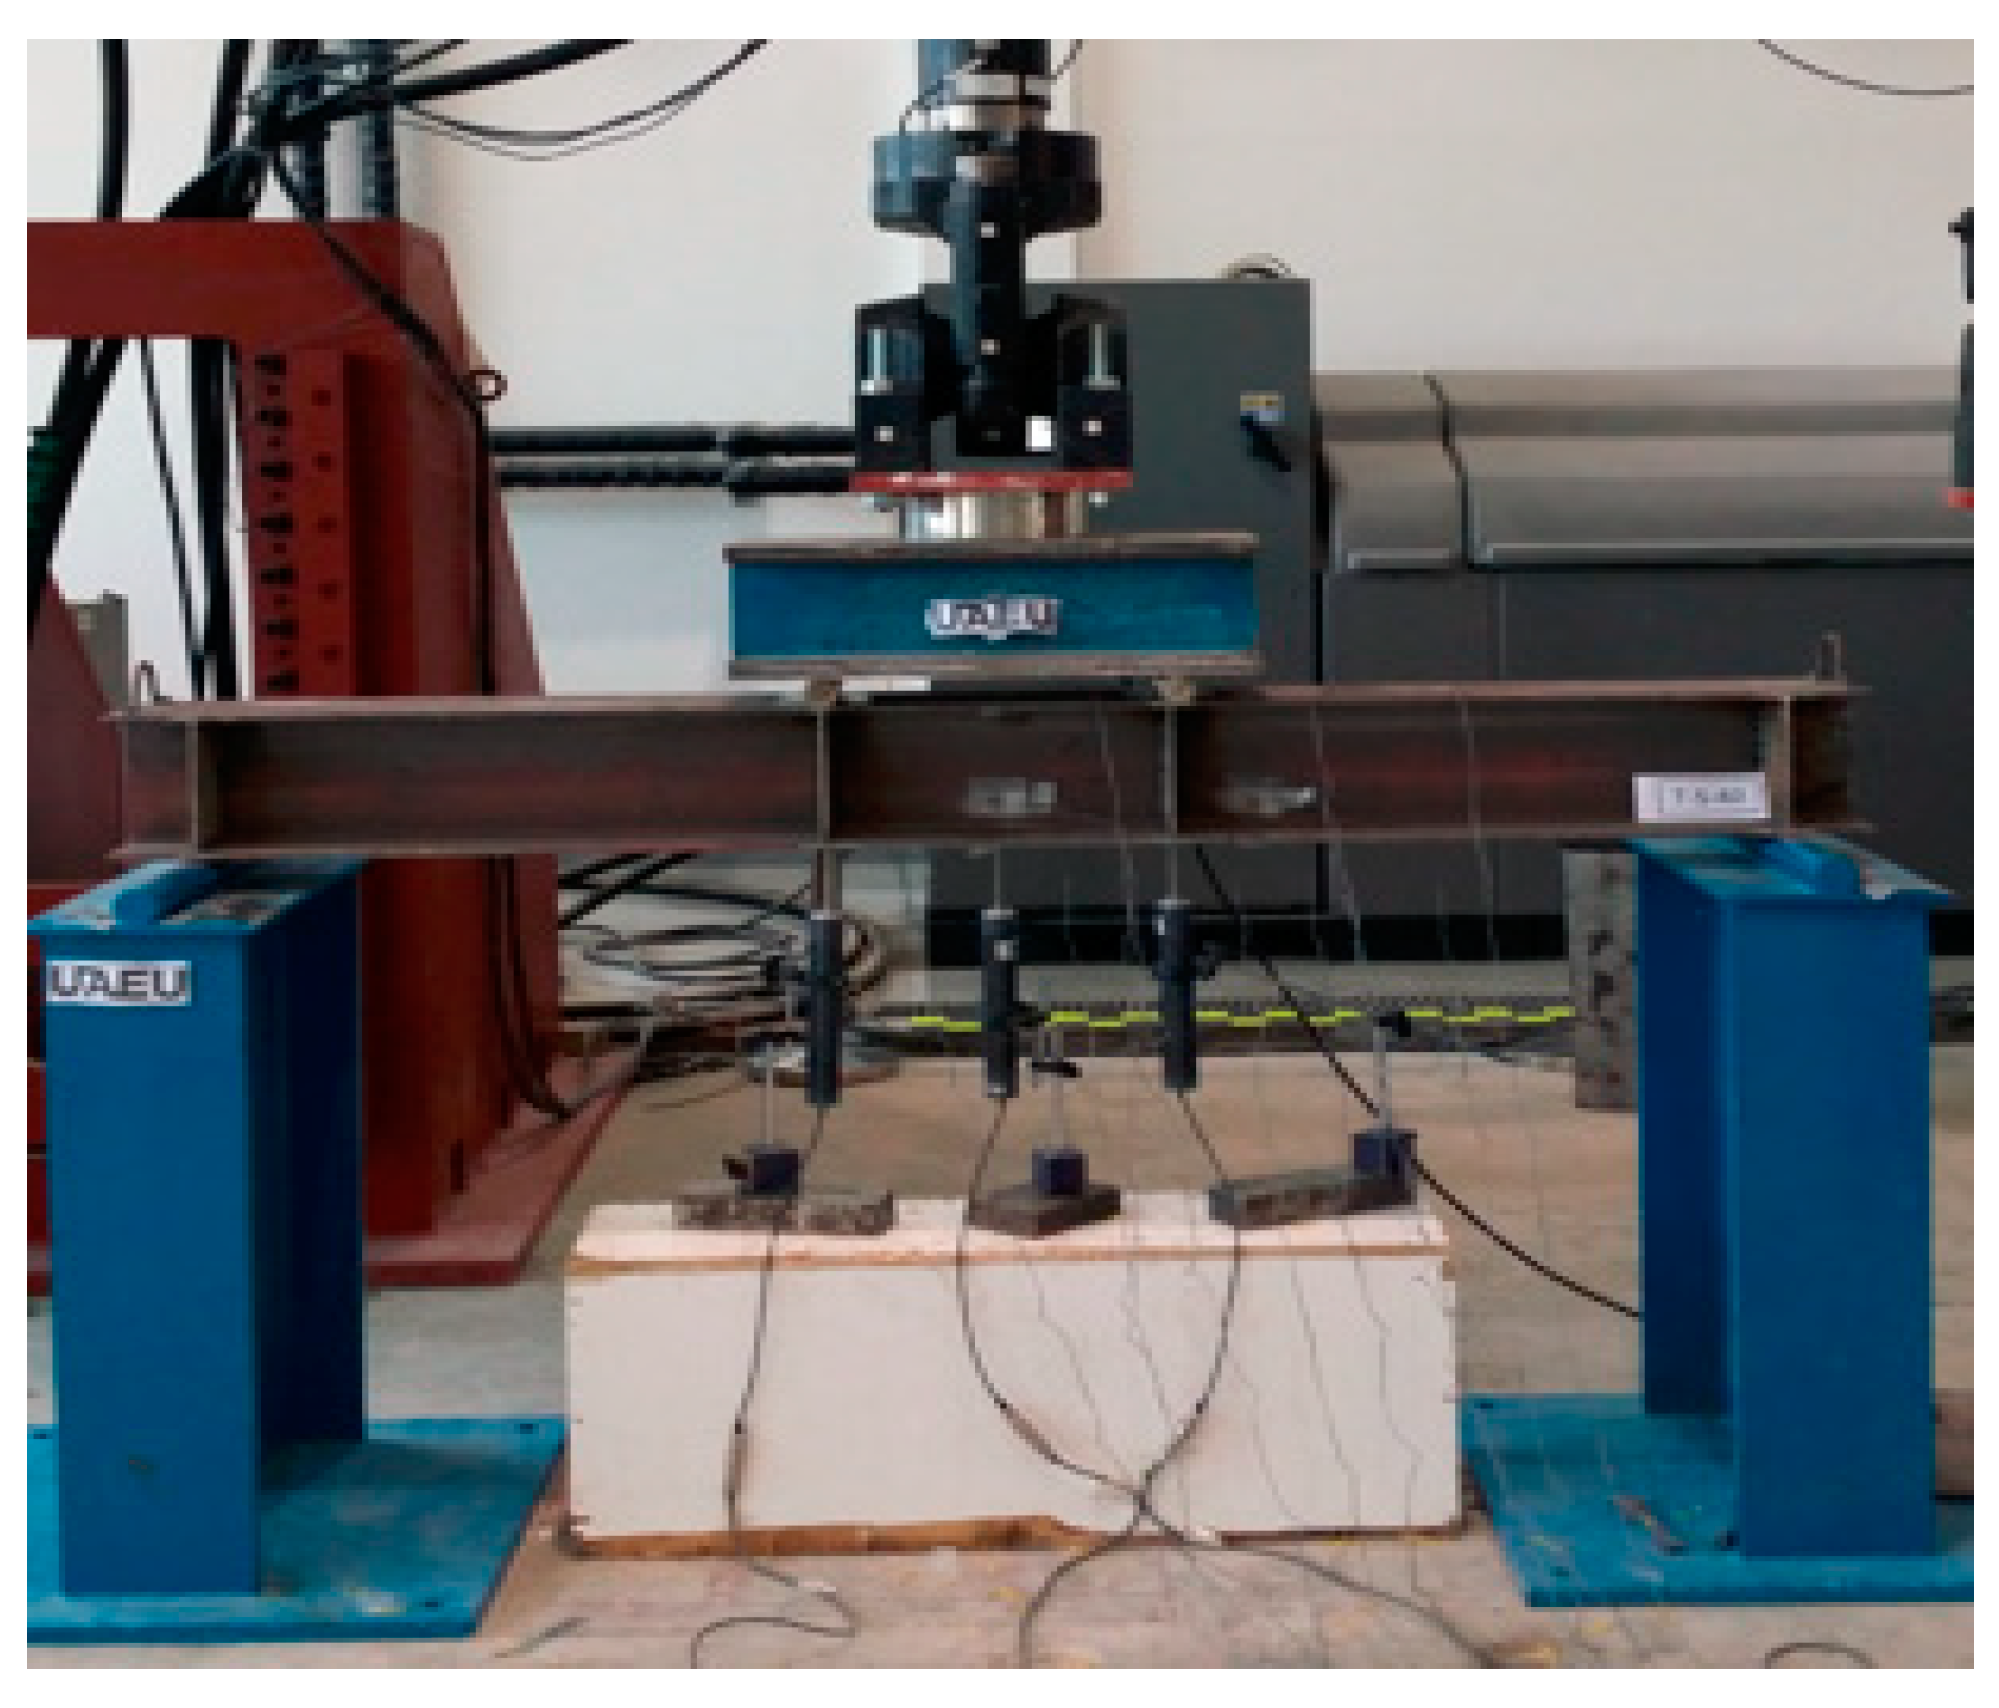
All tested I-shaped steel beam specimens in this study had the same section, W 203 × 203 × 46.1. The flange and web specifics are listed Table 1. Figure 2 shows the front view of a typical beam specimen during test setup. Vertical stiffeners were installed at the specimen support and loading point locations, as shown in Figure 1 and Figure 2, to avoid web crippling. All damaged specimens, as well as the control specimen, were laterally unsupported and unrepaired.
2.2. Specimen Categorizing
Eleven beams out of the twelve tested steel beam specimens had an artificially made U-shaped notch damage of different depths and different locations, while the width of the notches was kept constant. The notch layout was marked on the flange to make sure of the cut dimensions and the flange was then saw-cut. One beam had no artificial damage and was denoted as a control beam. Nine of the eleven notch-damaged beams had a single notch (denoted as S) on one side of their tensile flange at different locations, while two damaged specimens had double notches (denoted as D) on both sides of the tension flange at the middle of the beam. The eleven damaged specimens were categorized into three sets, as presented in Table 2, depending on the location of the notch: group Q refers to notch located at one quarter of the beam clear span; group T refers to notch located at one-third of the beam clear span; and group M refers to notch located at the beam clear mid-span. The damaged beams were labeled as Q-S-X, T-S-X, M-S-X, or M-D-X, as shown in Table 2, where the X represents the notch depth of 30 mm, 40 mm, and 60 mm, while the notch opening width was kept constant at 20 mm in all damaged beams. The control beam was labeled C-NG-0 (control, no groove/notch, zero notch depth). The notch depth from 0 to 60 mm, representing up to 60% of the flange free width, was selected to simulate minor to moderate damage in the beam and to avoid any sudden flipping of the laterally unsupported damaged steel specimen during testing.
2.3. Material Properties
The steel I-shaped specimens tested in this study were made of W 203 × 203 × 46.1 mild steel. The mechanical properties of the steel of the specimens were acquired from standard tensile coupon test. Twelve coupon samples were cut form the top left flange, the bottom right flange, and the middle of the web of the test steel specimens. The coupon samples were prepared and tested in line with ASTM E8 2016 standard. The average ultimate and yielding strengths achieved were 431 ± 12 MPa and 289 ± 8 MPa, respectively (according to the manufacturer’s catalogue, the ultimate strength is 420 MPa and the yielding strength is ≥250 MPa).
2.4. Instrumentation of Test Setup
The steel beam specimens were tested in a two-point loading test. The clear span of all specimens was 1800 mm. The loading points were 200 mm to the left and right of the specimen middle section and 700 mm away from the specimen supports, as shown in Figure 1. The damaged beam specimens were left unrepaired and vertical stiffeners were installed at specimen support and loading point locations to avoid web crippling, as shown in Figure 1 and Figure 2. The laterally unsupported beam specimens were loaded in a displacement control mode at a rate of 2 mm/min.
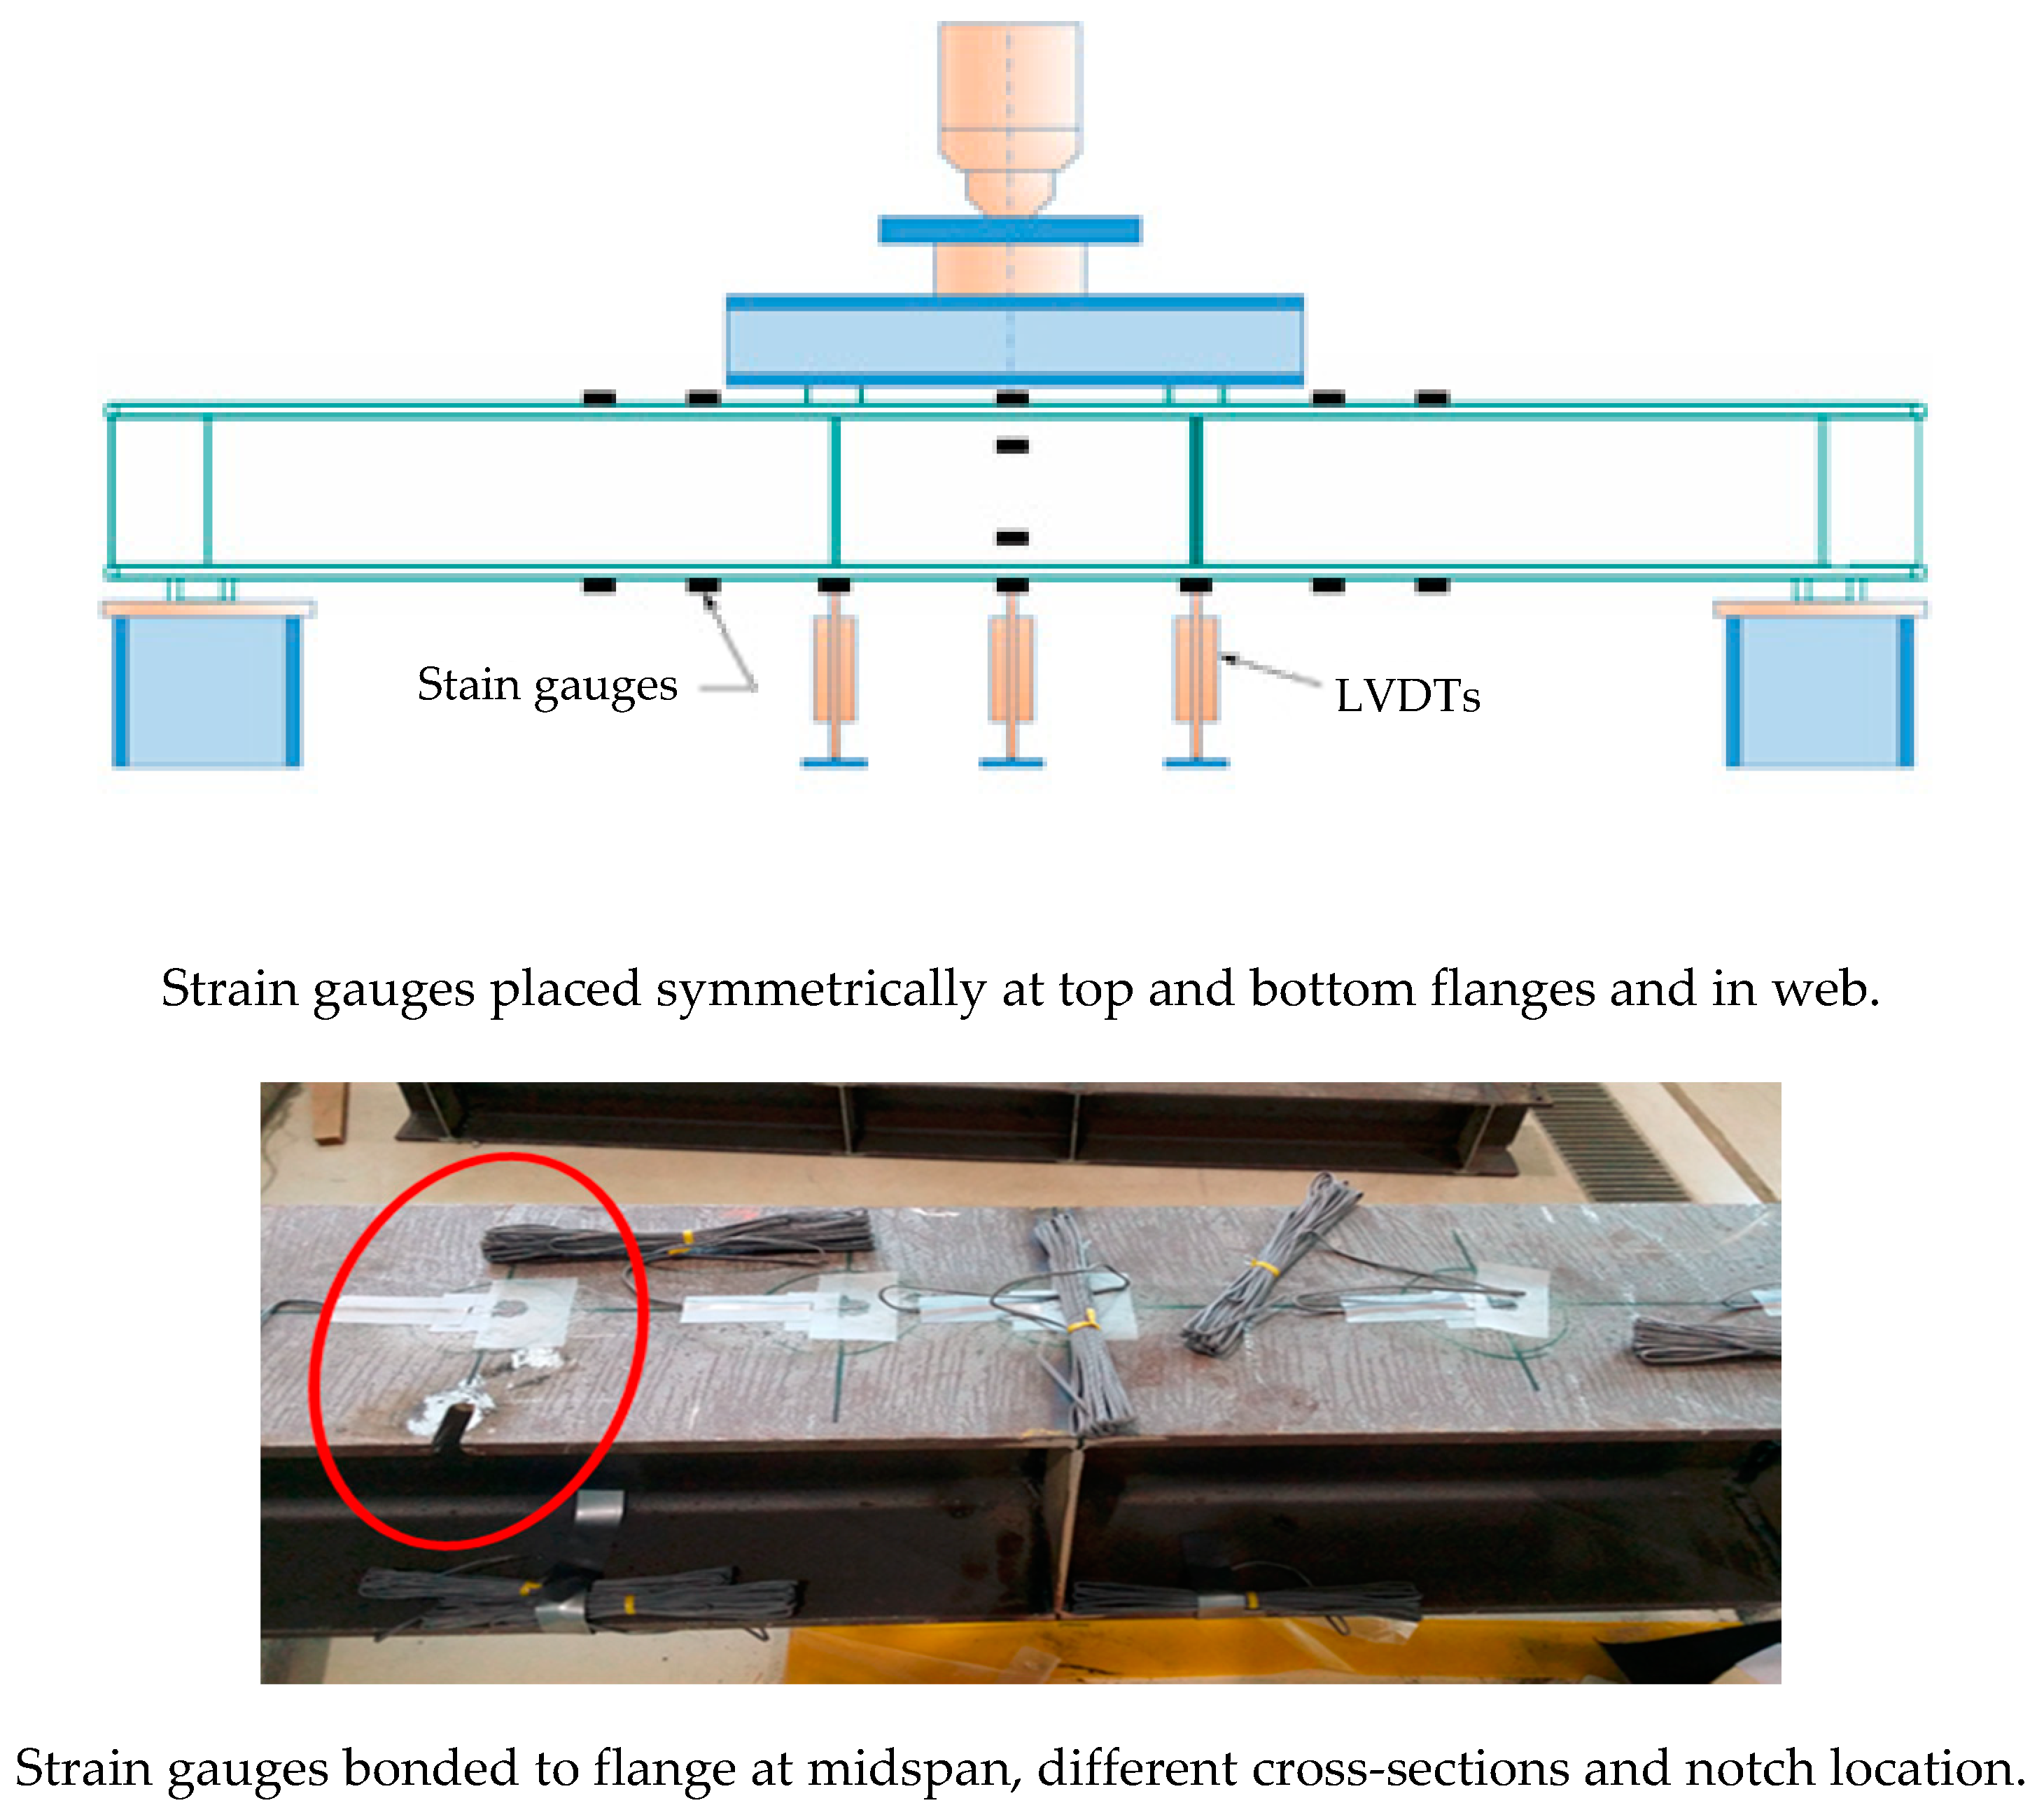
All tested beam specimens were prepared and instrumented with linear variable differential transformers (LVDTs) and strain gauges for deflection and strain readings. The strain gauges were attached to the external surface of bottom and top flanges and the web of the specimens at different locations, as displayed in Figure 3. The LVDTs were placed under the bottom flange at the loading point locations and at the middle section of the specimen, as shown in Figure 3.
The experimental setup was selected in light of the literature review presented in the paper, in which most of the cited references address members with notches in the tension side of the beam. It should be noted that since the damaged steel beam is to be reused, it can be rotated and flipped around in the site to properly position the notch in the tension zone of the beam.
3. Discussion of Experimental Results
The purpose of the experimental testing was mainly to trace the load–deflection curve and to collect readings from the strain gauges bonded to the specimen up to the post-yielding zone. However, since the steel beam specimens were laterally unsupported, extra caution was required during testing in terms of an immediate halt to the test to try to prevent the actuator in the testing frame from tilting when buckling/lateral rotation occurred in the specimens. Accordingly, some specimen tests took a longer time than other tests, and consequently more data were gathered, depending on how soon the buckling initiated causing the actuator to tilt and the test to stop. It should be noted that the test was originally planned to have a maximum beam deflection equal to the beam clear span over 120 (1800/120 = 15 mm). However, the early unanticipated twisting of the actuator forced the test to be stopped earlier and before reaching the beam intended deflection.
3.1. Failure Mode
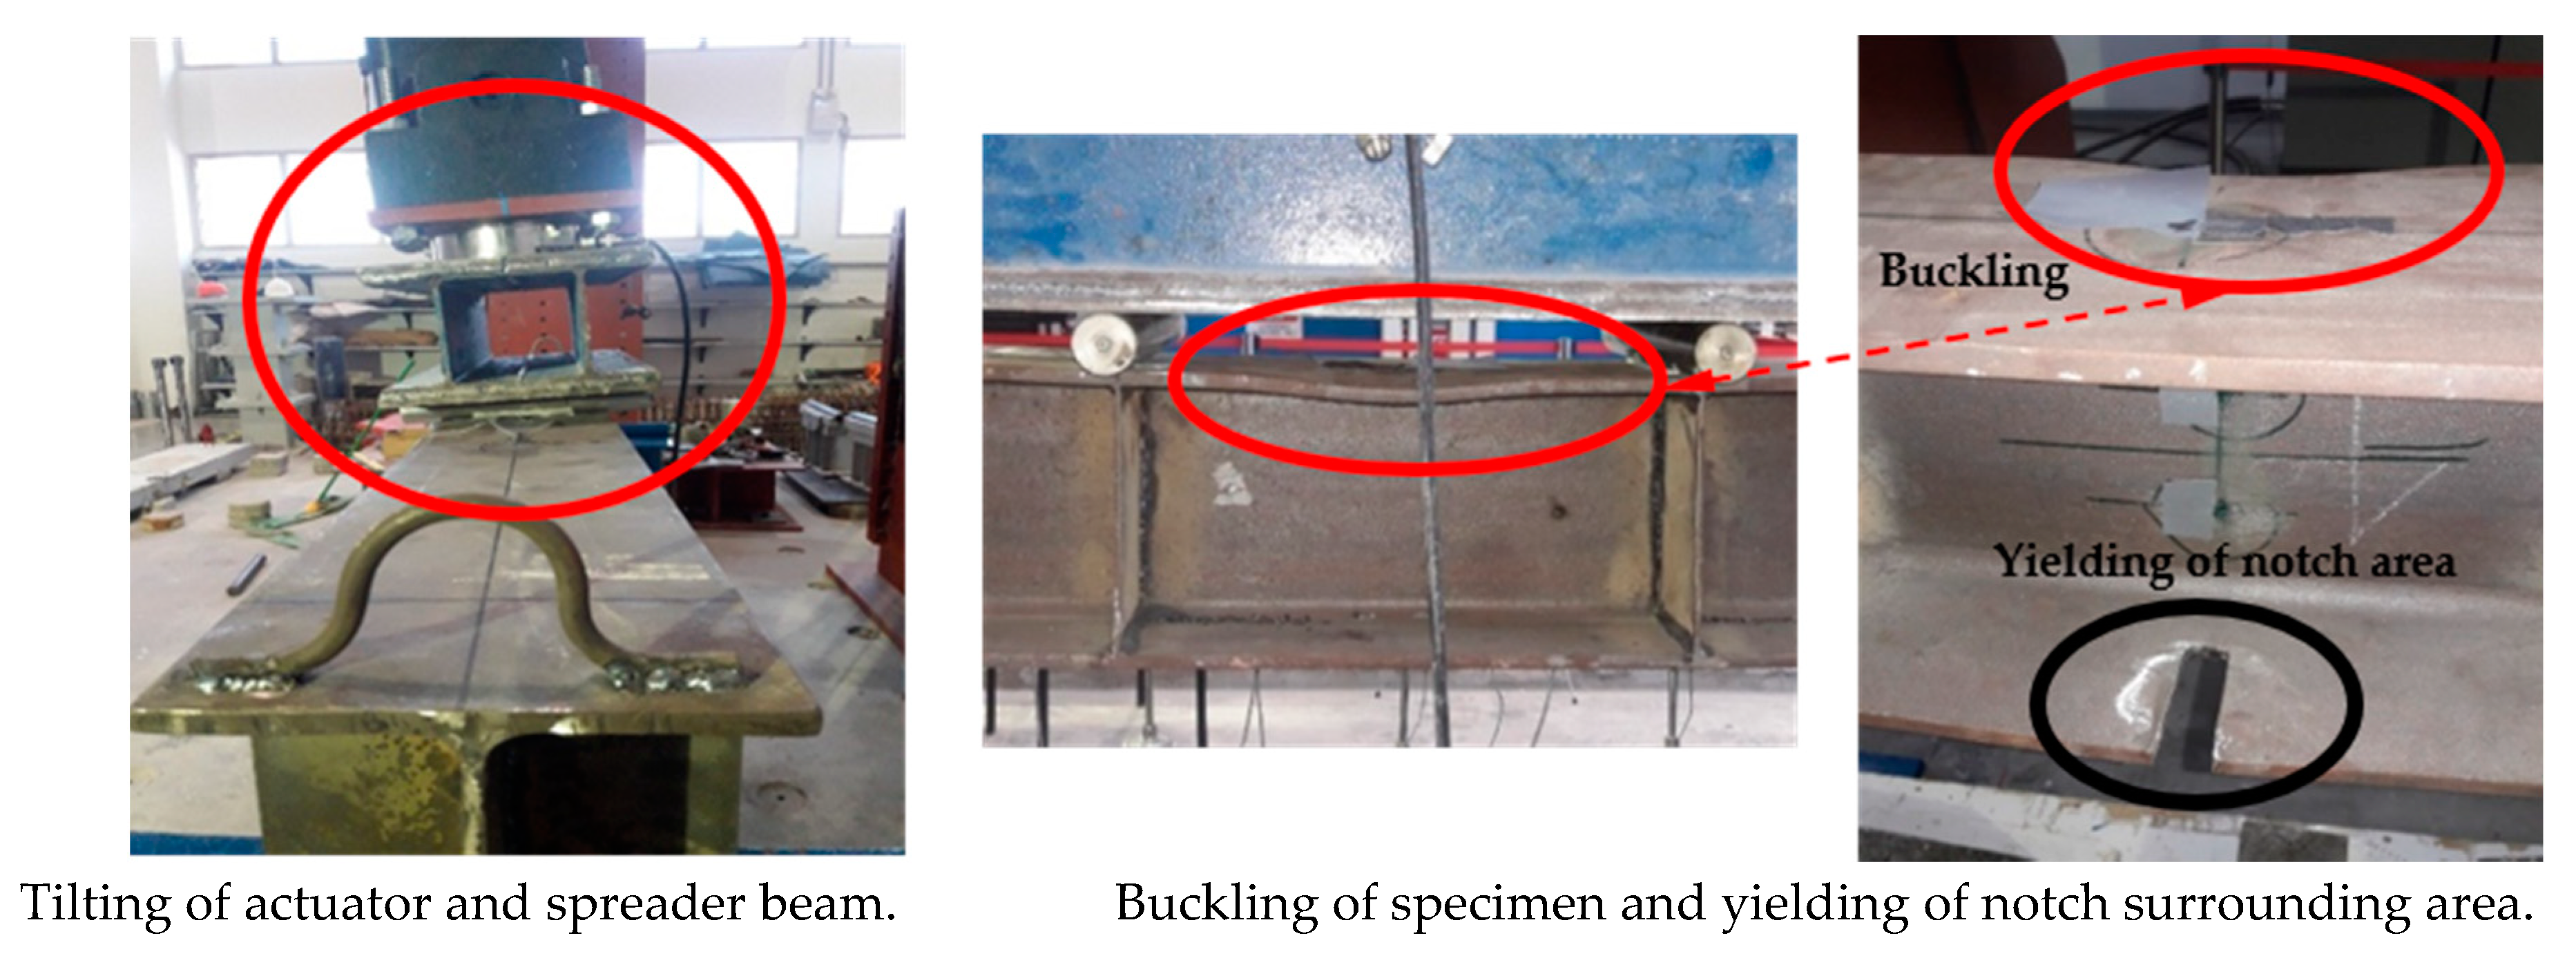
The steel specimens in this study were not tested to ultimate since they were laterally unsupported to simulate their applications in temporary structures. All tested specimens exhibited the same failure mode of flange buckling causing the actuator to twist, as shown in Figure 4, and the test had to stop to avoid any hazardous consequences. As a result, the tests did not reach the ultimate load and the descending branch of the load–deflection curve could not be obtained because directly after a buckling in the compression flange developed, the actuator tilted instantly and the test had to be stopped immediately for safety reasons and to avoid unreliable test readings. Hence, the peak load was determined as the load at which the compression flange buckled causing the actuator to suddenly tilt.
3.2. Applied Load versus Mid-Span Deflection
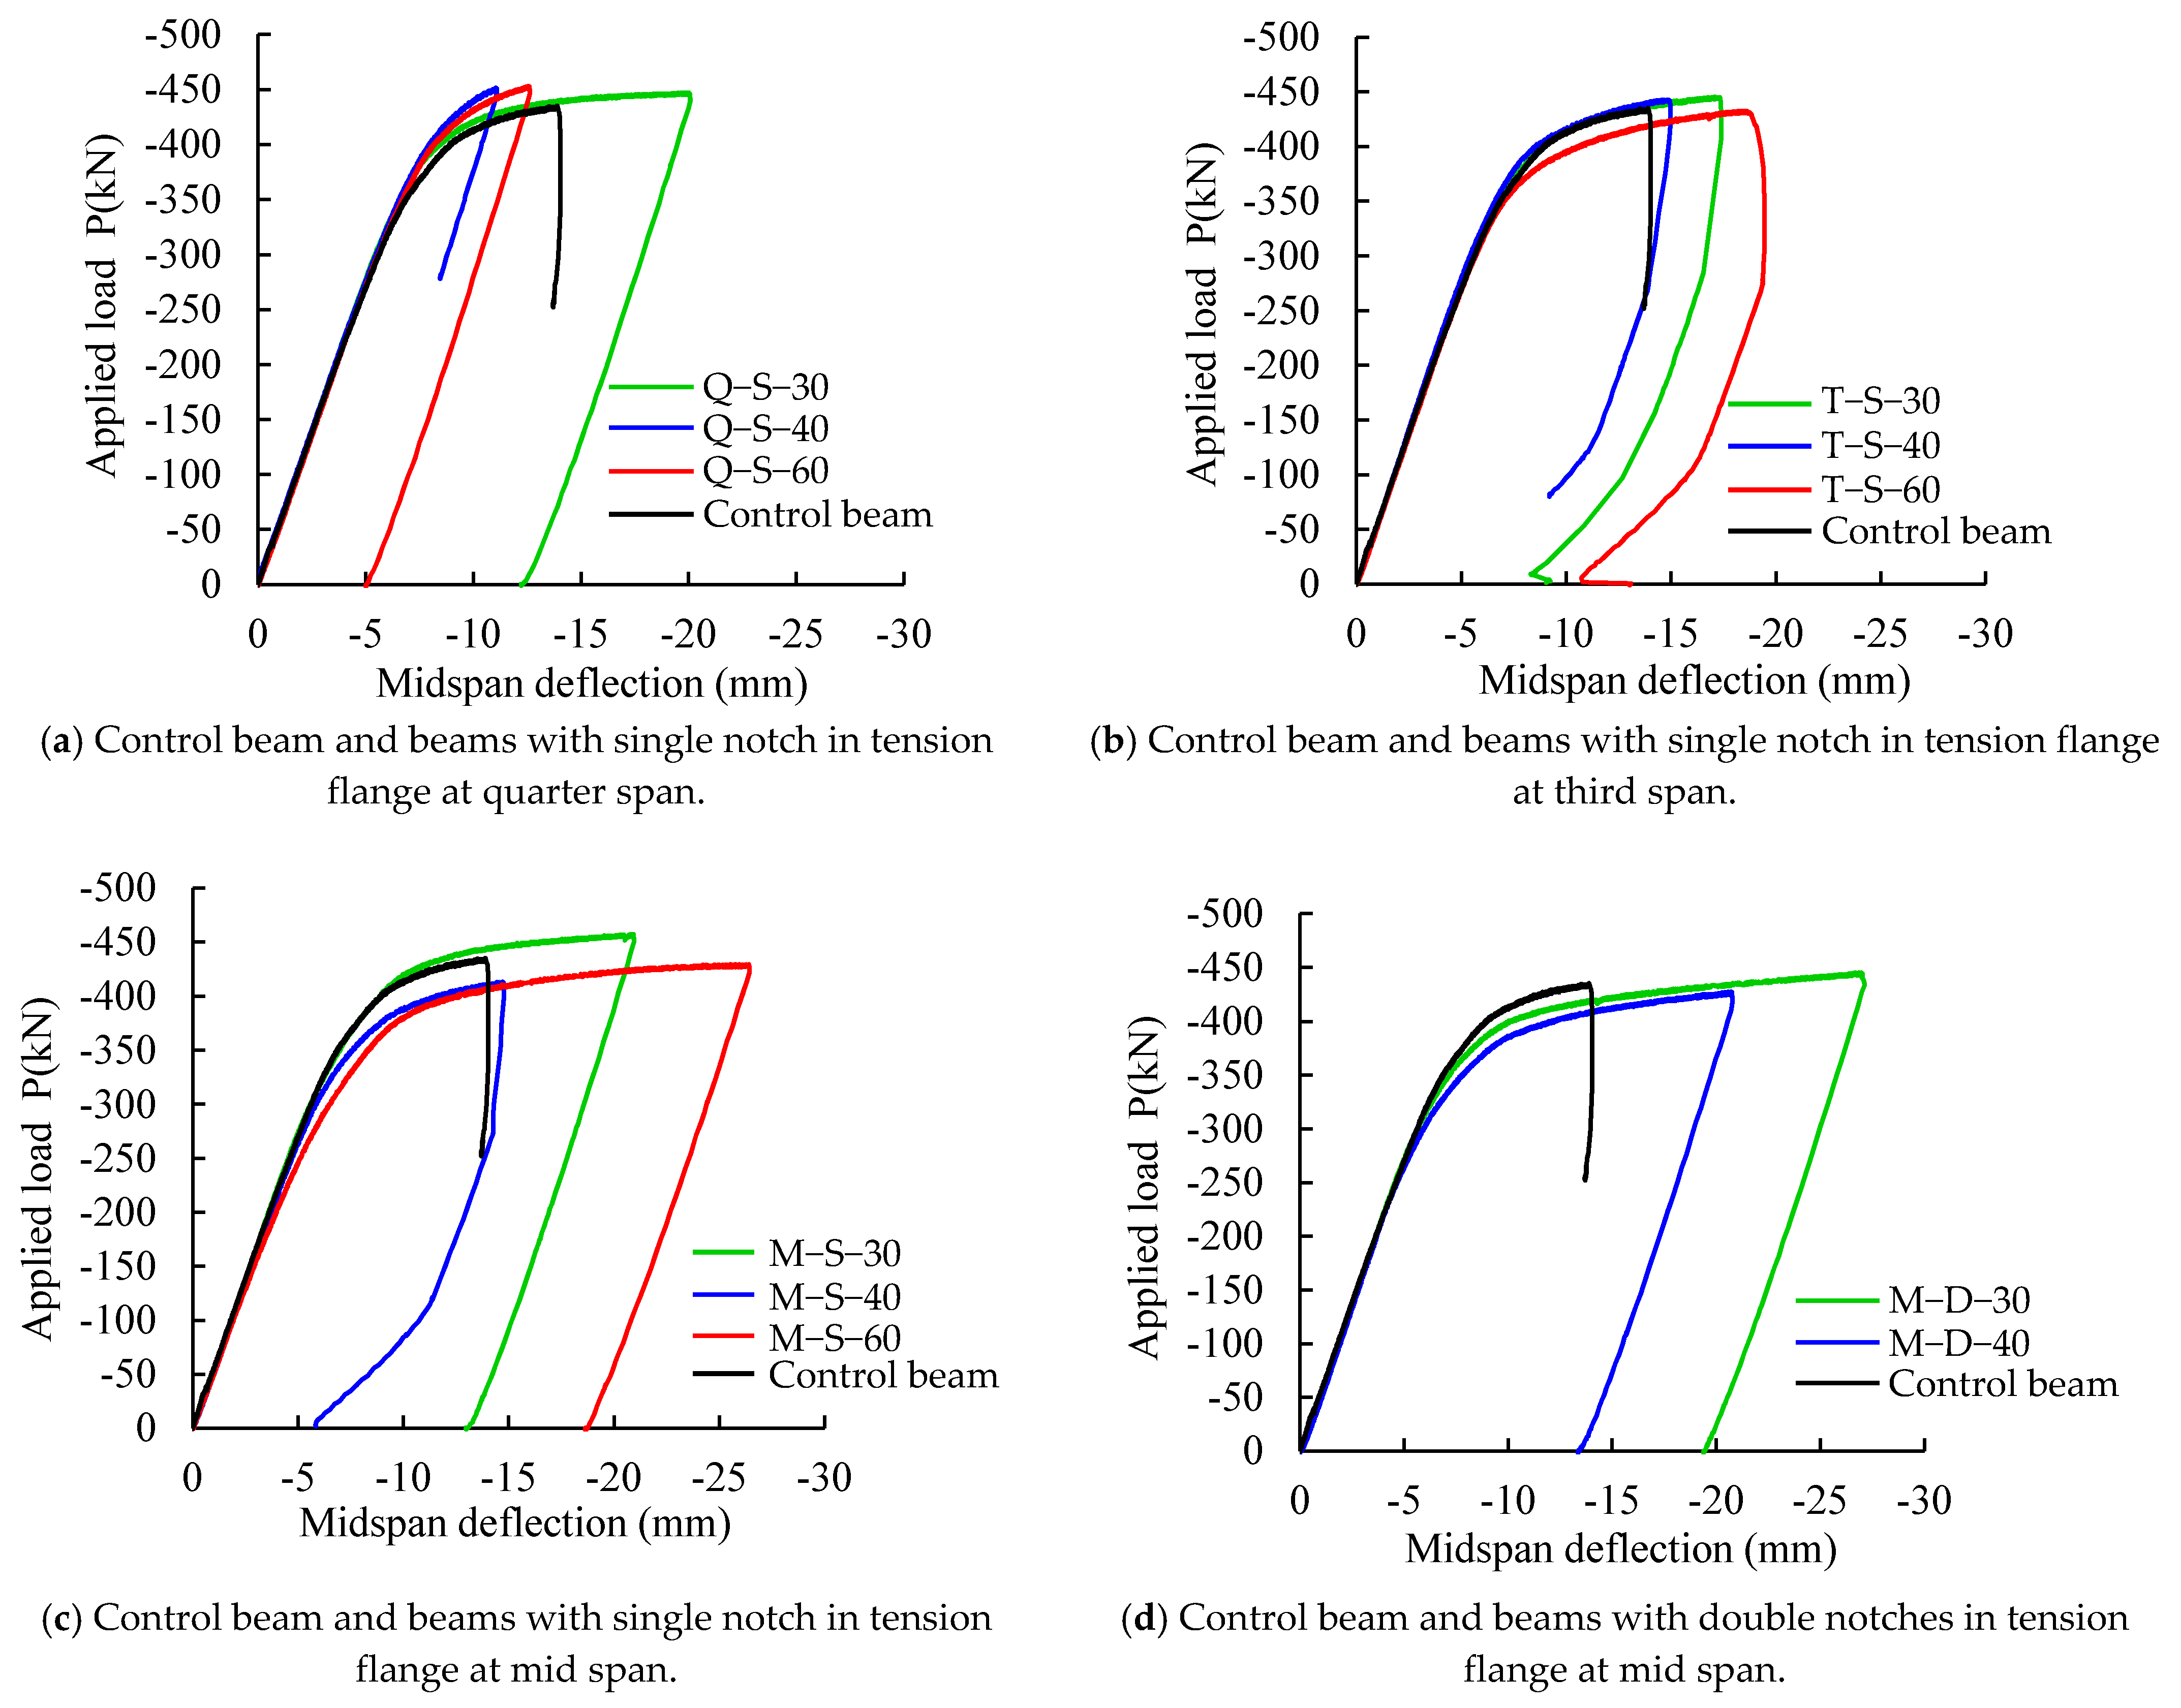
All the notch-damaged steel specimens had their notches in the tension flange located at a quarter (Q) and third (T) of the clear span from the right support and at the midspan (M). The applied load–midspan deflection relations for all tested beams are depicted in Figure 5. Initially, all the beams had the same stiffness and the deflection increased linearly at the same rate until the specimens started to yield. After yielding, the specimen stiffness decreased, causing the deflection to increase at a faster rate. It is clear from Figure 5 that all tested specimens had almost the same load-carrying capacity and that their behavior had a similar pattern. However, Figure 5a shows that the absence of symmetry and closeness of the notch to the support appeared to be the more significant factors affecting the stability of the beam than the size of the notch. As indicated above, the tests stopped when the actuator twisted and the specimens were unloaded. It is worth noting that this study considered only two specimens with double notches, M-D-30 and M-D-40.
3.3. Applied Load versus Strain
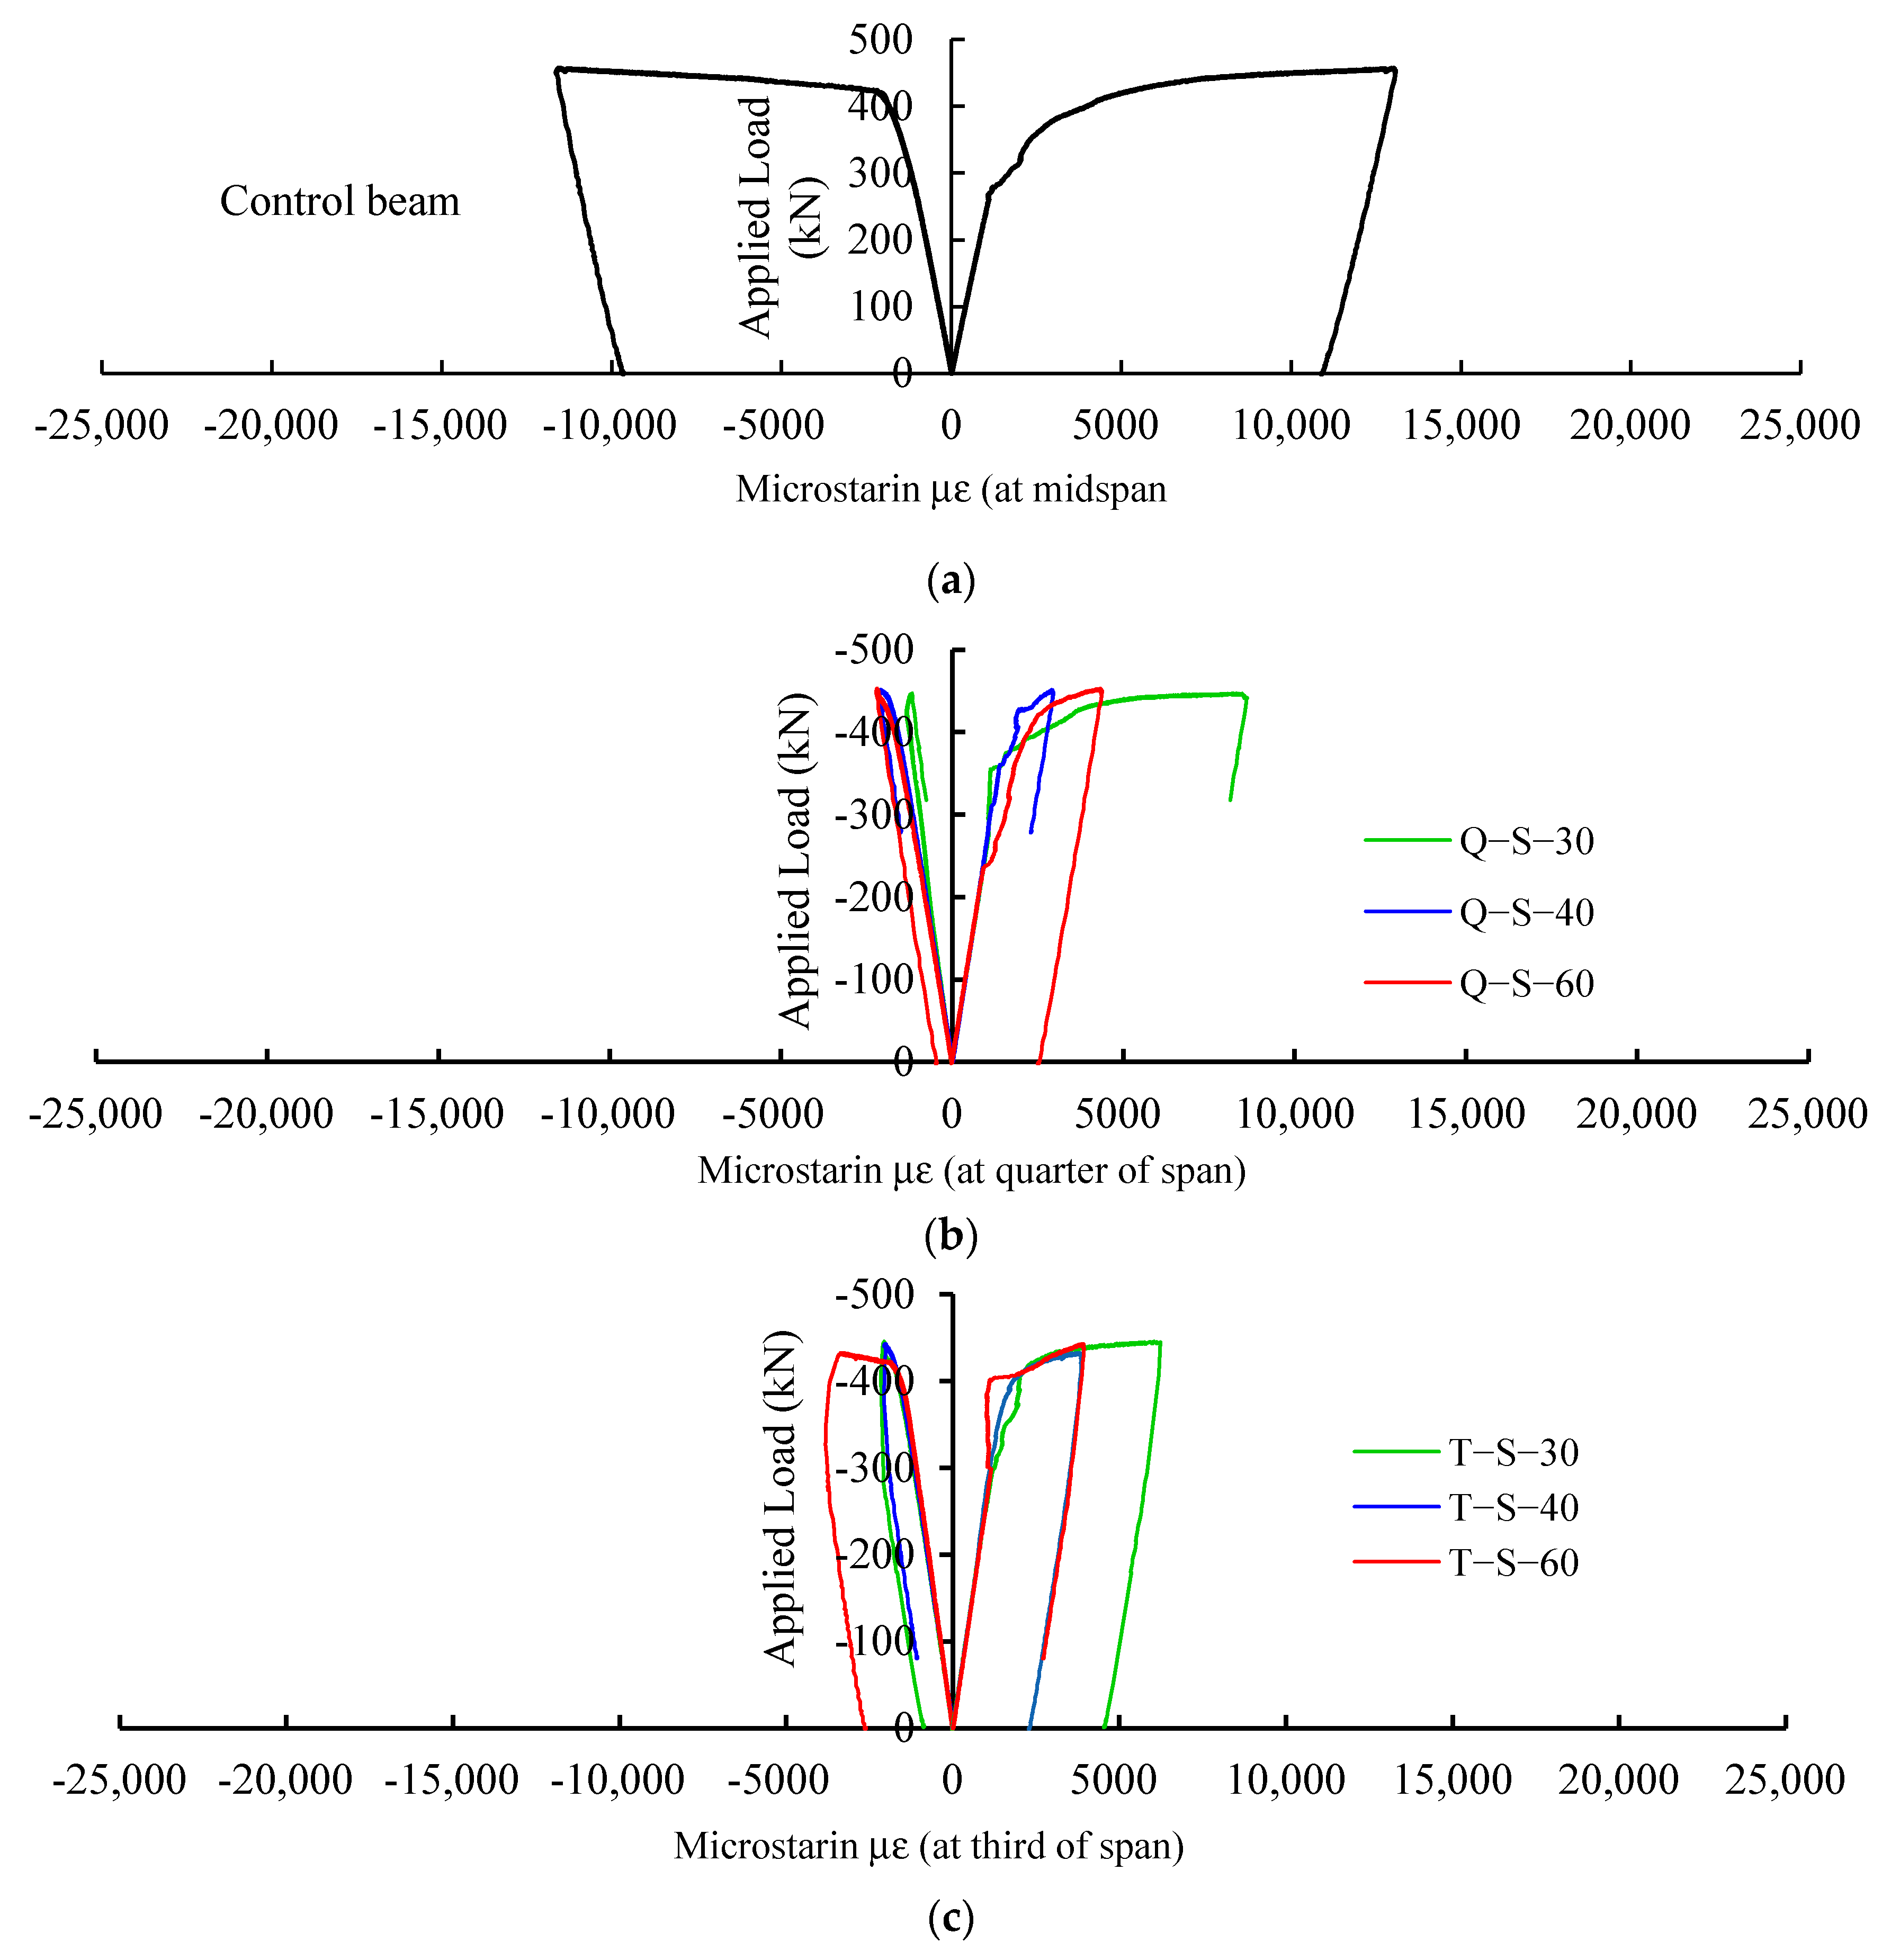
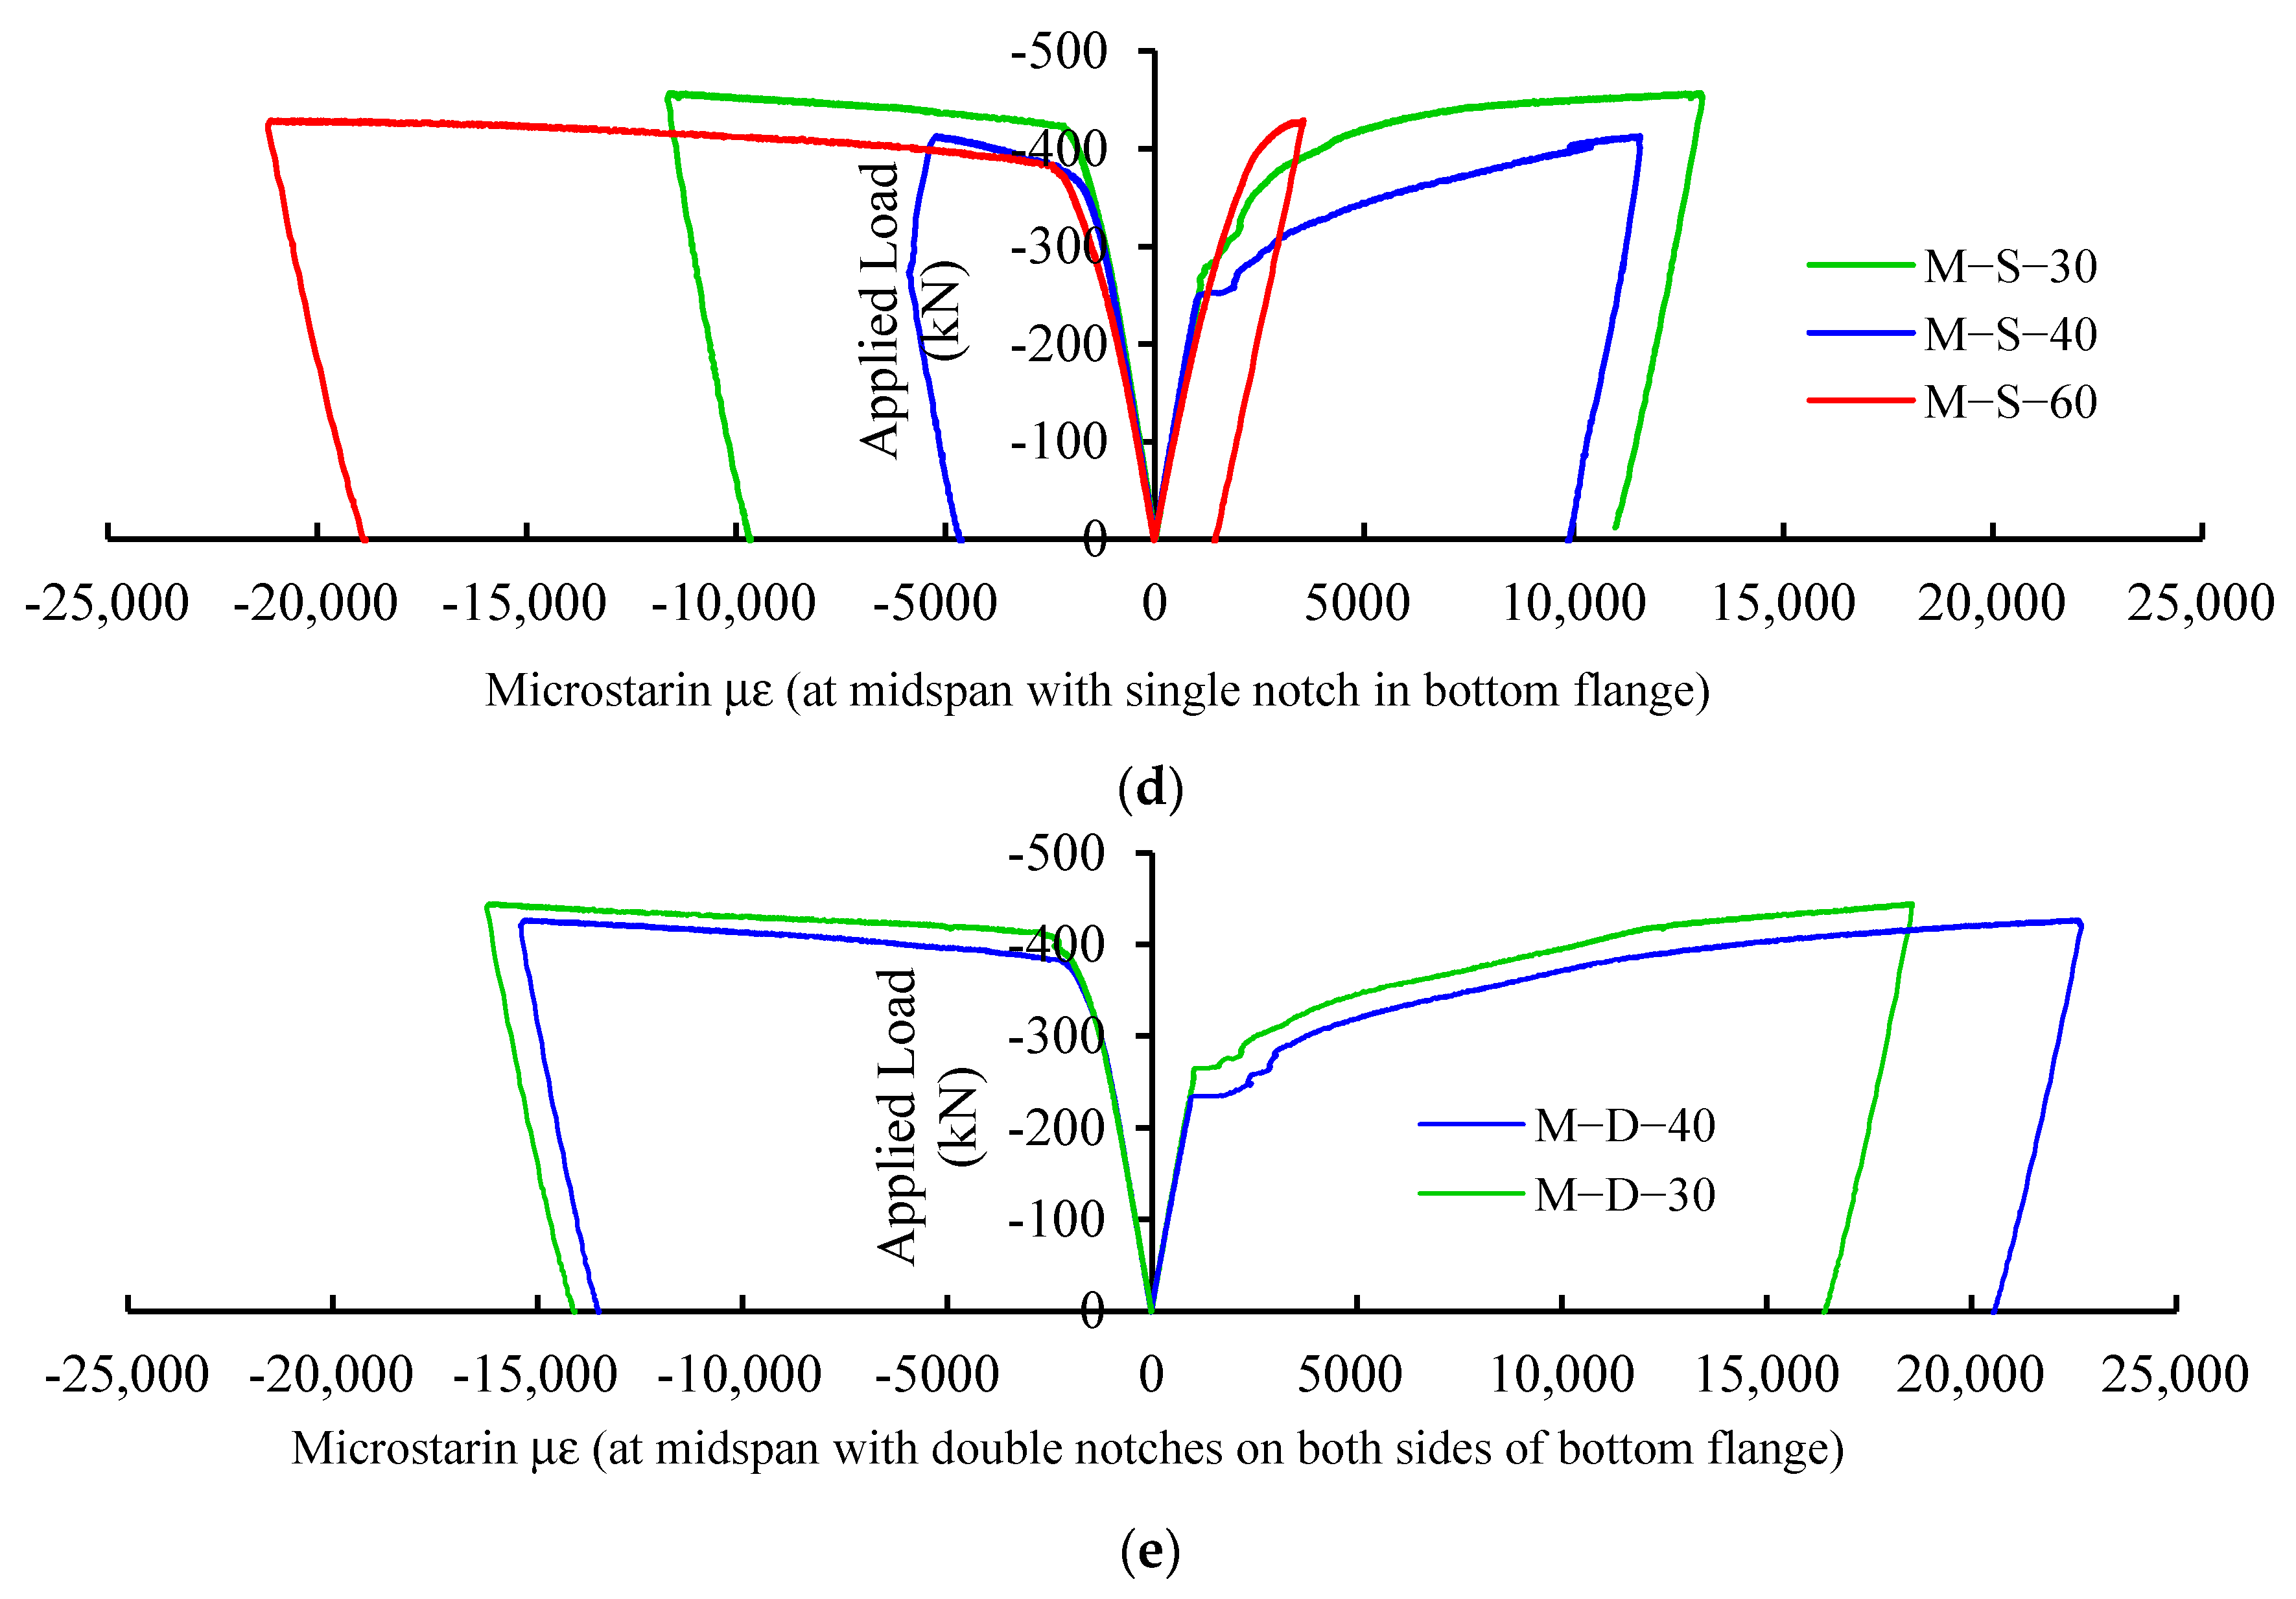
Figure 6 presents the applied load–strain relations in all tested steel specimens. Figure 6a shows the response of the extreme top (compression) and bottom (tension) strains at the midspan of the control beam. The strains in Figure 6b–e are the top and bottom strains at cross-sections passing through the notch. Figure 3 shows the strain gauges at a section passing through the notch. For the control beam, it is apparent from Figure 6a that the top and bottom strain responses were almost identical, which is expected as the strain gauges were located at the section of maximum moment of the undamaged beam. It can also be noticed that at a load of 420 kN, the top strain response showed a clear yielding point beyond which the strain demonstrated a yielding plateau behavior with a minor increase in the applied load; whereas the bottom strain response showed a change in the rate of the increasing strain at a load magnitude of 280 kN, and as the load was increased, the bottom strain increased at a faster rate until the strain reached the yield plateau zone at a load of 420 kN. All of Figure 6b–e show that the top and bottom strain responses presented similar pattern as that of the control beam but with different strain values. Figure 6b,c show that for notches located at one-quarter and one-third of the specimen span, including the different notch sizes considered in this study, the beam top and bottom strain values at the notch section did not significantly vary. It can be concluded that if the notch, with the sizes examined in this study, is located anywhere within one-third of the beam clear span, the beam behavior was not sensitive to the notch location. However, when the notch is at the midspan of the beam (Figure 6d,e), the top and bottom strains increased significantly, indicating that the beams exhibited ductile behavior and were able to undergo larger deflections. As a result, when the notch is at the midspan of the beam, the beam becomes more resilient. This change in behavior can be attributed to the location of the notch. When the notches were at one-quarter and one-third of the clear span, the steel beams were not symmetrical, causing the vertical deflected shape to be unsymmetrical as well. As the load was increased, the unsymmetrical cross-section of the beams at the notch location made the beam to buckle unsymmetrically out of plane. The simultaneous effects of unsymmetrical vertical deflection and out of plane buckling expedited the torsion of the beams at small strain responses, whereas for beams with notches at their centerlines, the beams were symmetrical, causing a symmetrical vertical deflected shape and the symmetrical out of plane buckling of the beam. As a result of this dual symmetry in deflection and out of plane buckling, the beams showed more resilient responses as the load was increased and, eventually, experienced larger top and bottom strains.
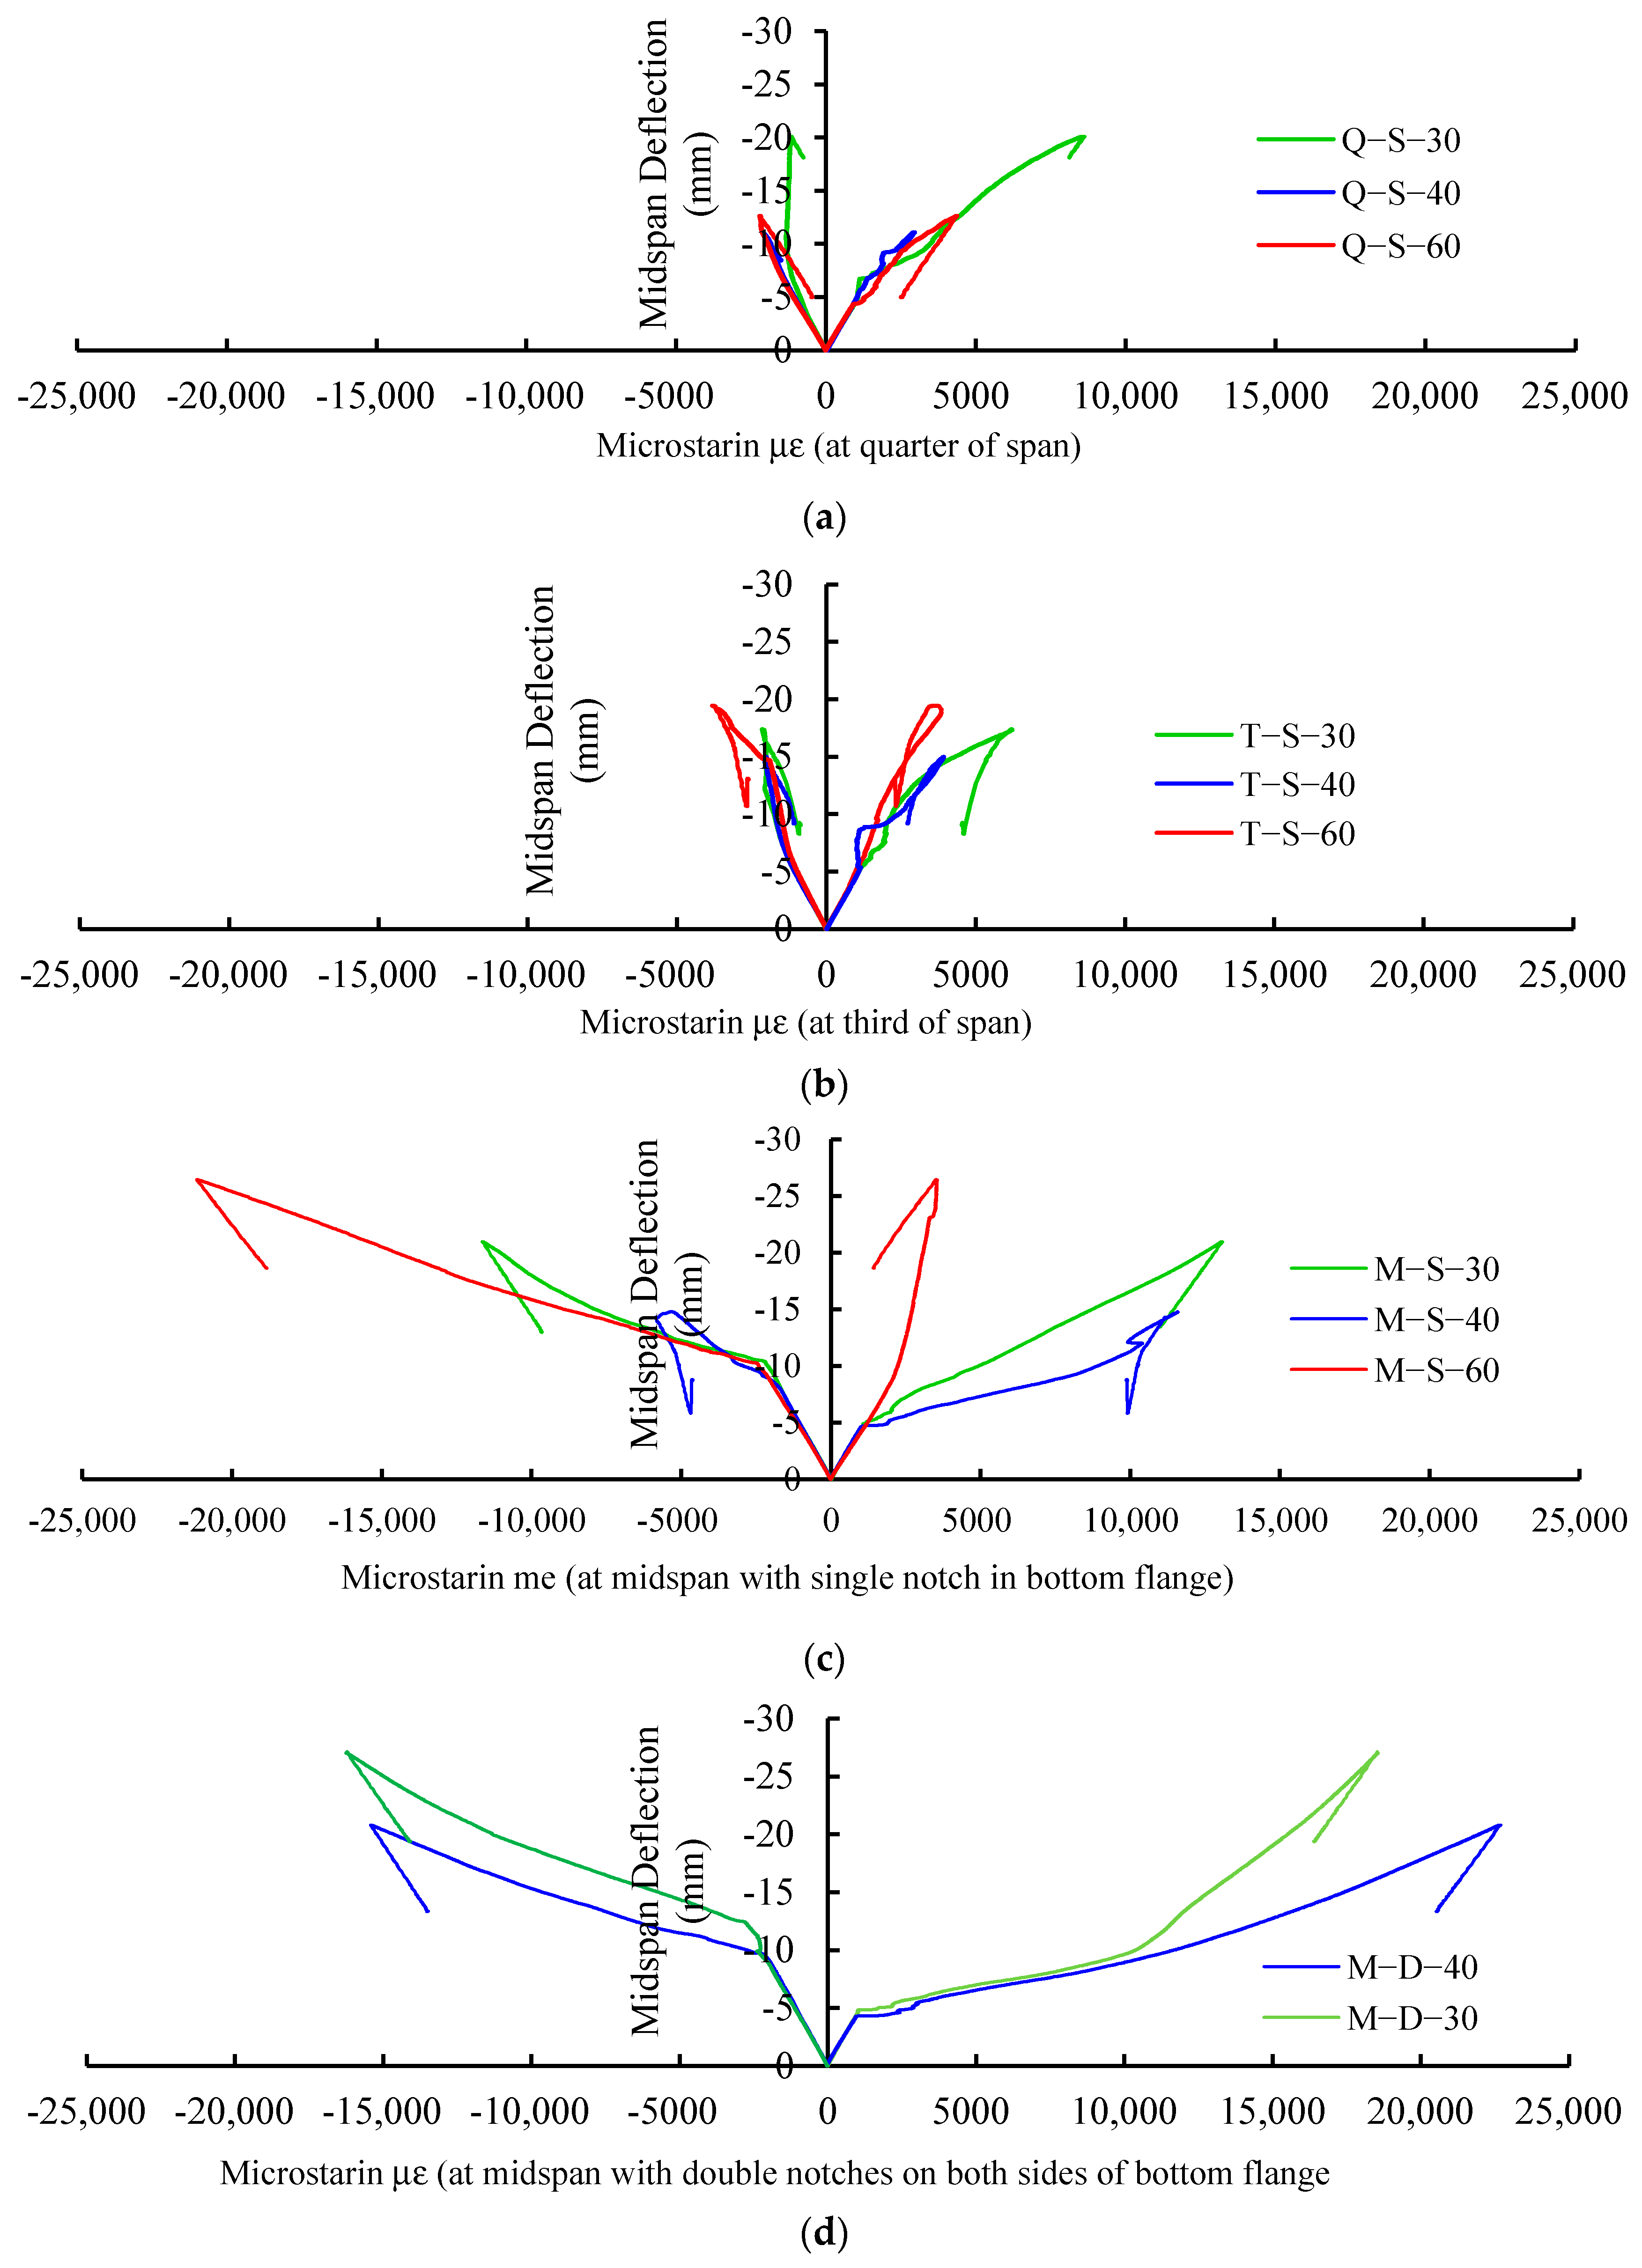
3.4. Deflection-Strain Response
Figure 7 shows the midspan deflection–strain responses in all tested steel specimens. Figure 7a,b show that the top and bottom strains at the location of the notch were very small and somewhat the same as the deflection increased. However, when the notch was at the midspan of the beam, the top and bottom strains increased significantly as deflection increased, as shown in Figure 7c,d. The latter figures also indicate that as the deflection reached 5 mm, the bottom flange started to yield while the top flange remained elastic. As the deflection increased, the bottom strain increased much faster than the top strain. When the deflection was almost twice as much (about 10 mm), the top flange started to yield while the bottom flange had experienced large inelastic deformation. This is attributed to the beam’s neutral axis being shifted up towards the top flange due to the notch being in the bottom flange. It can be established from Figure 7c,d that when the deflection reached almost 10 mm, the top strain response was linear and it was not sensitive to the location of the notch. On the other hand, the bottom strain response was significantly affected by the location of the notch. Therefore, the location of the notch did not have a major impact on the deflection of the beam but it did accelerate the yielding and plastic behavior of the tension part of the beam way before it did for the compression part of the beam.
The test results in Figure 5, Figure 6 and Figure 7 show that the worst-case scenario in terms of deformations was when the specimens had a notch damage at the midspan. Based on this outcome, the comparison between the numerical and test results focused only on specimens with notch damages at the midspan and the other specimens were excluded.
4. FE Modeling (ATENA-3D)
To further explore the flexural performance of the steel I-shaped beams, all tested specimens were modelled using a finite-element software ATENA-3D, version 5.6.0 (Cervenka et al. [35]). The authors have used ATENA in previous studies [36,37] due to its high simulation capability. Moreover, the accuracy of numerical results in this study confirmed the validity of this software. The specimen models were accomplished in two steps: pre-processing and post processing. Material selection, geometrical dimensions and shapes, and boundary conditions, and mesh generation of the specimens were identified in the pre-processing phase.
4.1. Material Modeling
The material stress–strain relationship of the W 203 × 203 × 46.1 steel beam specimens was represented by a bilinear elastic–perfectly plastic model with a yielding strength of 280 MPa, elastic modulus of 200 GPa, and a hardening modulus of 0 GPa. The steel specimens in this study were not tested to ultimate since they were laterally unsupported to simulate their applications in temporary structures. Using the elastic perfectly plastic stress–strain relationship for the steel material would be more representative of the test results. Therefore, this relationship was adopted in this study. The constitutive stress–strain relation of the utilized loading and bearing steel plates was denoted as the elasto-isotropic model and these steel plates were assumed to remain elastic with a modulus of elasticity of 200 GPa. Von Mises yield criterion was considered as the failure criterion in the FE analysis.
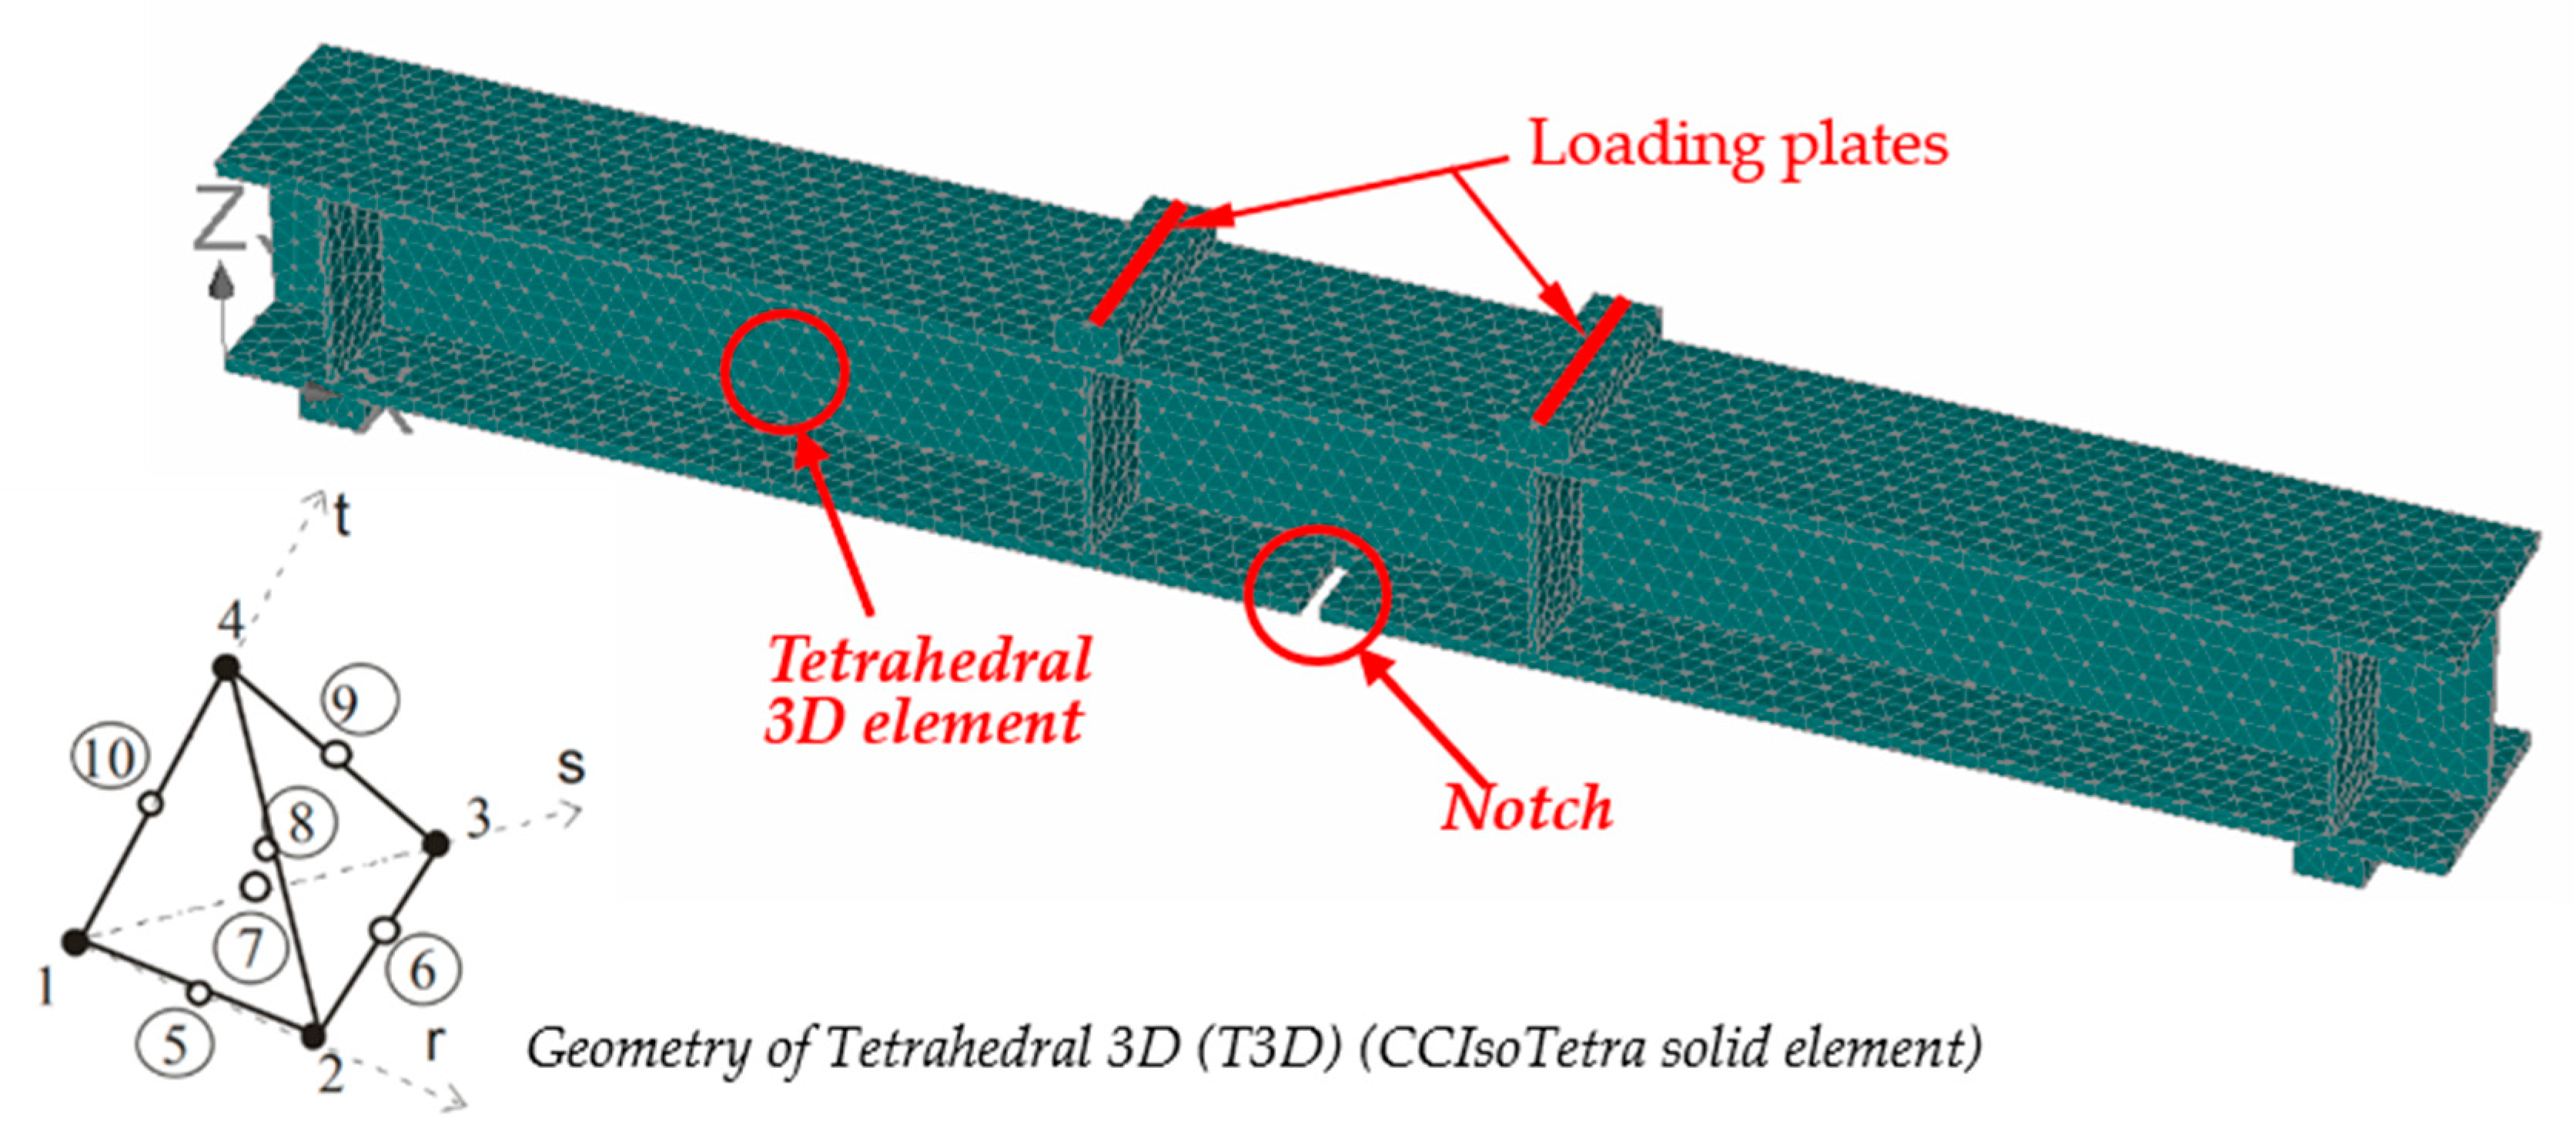
4.2. Mesh Generation
ATENA-3D software has three different types of 3D solid elements: tetrahedral elements 3D (CCIsoTetra), brick elements (CCIsoBrick), and wedge elements (CCIsoWedge). In this study, the three element types were examined to tune the FE mesh, and it was found that the tetrahedral 3D (T3D) (CCIsoTetra) solid element was the most appropriate element that best explained the behavior of the specimens and, therefore, was used in this study to generate the FE models. Hence, the maximum T3D element size of 25 mm and up to 16500 T3D elements used in the steel specimen modeling were found to be adequate to produce acceptable results within a balanced analysis running time. Figure 8 shows a FE mesh of the W-shaped steel beam with a notch in the bottom tension flange at the middle of the span.
4.3. Analysis Method
The Newton–Raphson procedure was utilized by the software when the numerical models of all specimens were executed. The specimens were subjected to displacement-control loading that would allow displacements to continue increasing even after the specimen fails.
5. Discussion of Test and Numerical Outcomes
The load–deflection curves did not reach the peak loads because the compression flange of the test steel specimens buckled. Once the local buckling in the compression flange developed, the actuator tilted instantly and the test was stopped immediately for safety reasons. Therefore, the curves could not reach the peak loads.
In this study, the ultimate load was determined as the load at which the compression flange buckled, causing the actuator to suddenly tilt and forcing the authors to stop the test immediately for safety reasons. This is the load that caused the beginning of permanent deformation in the test specimens.
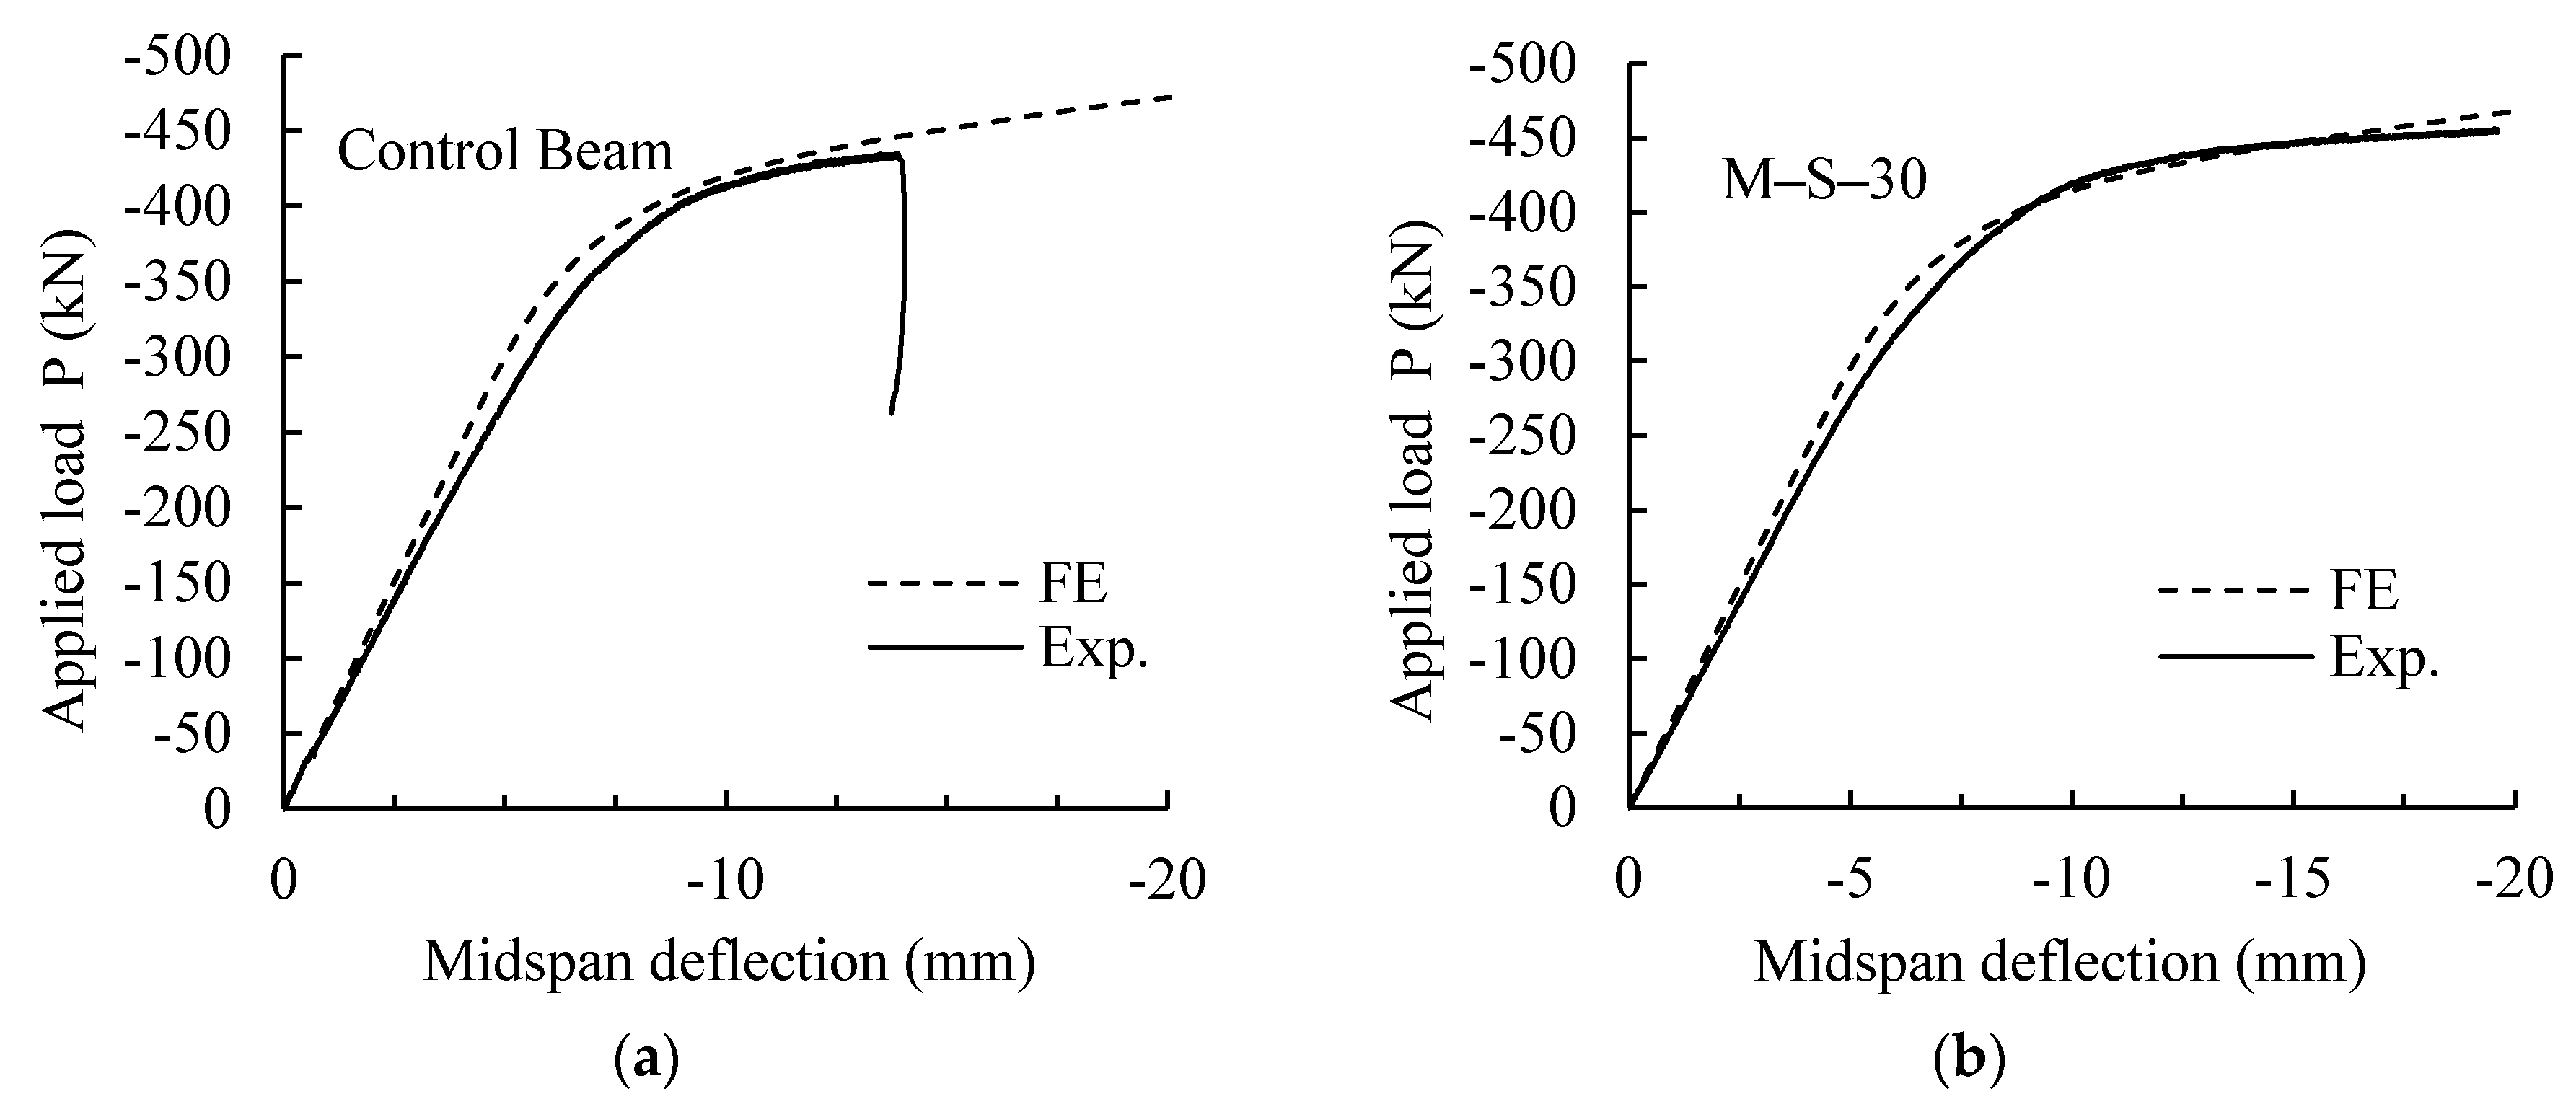
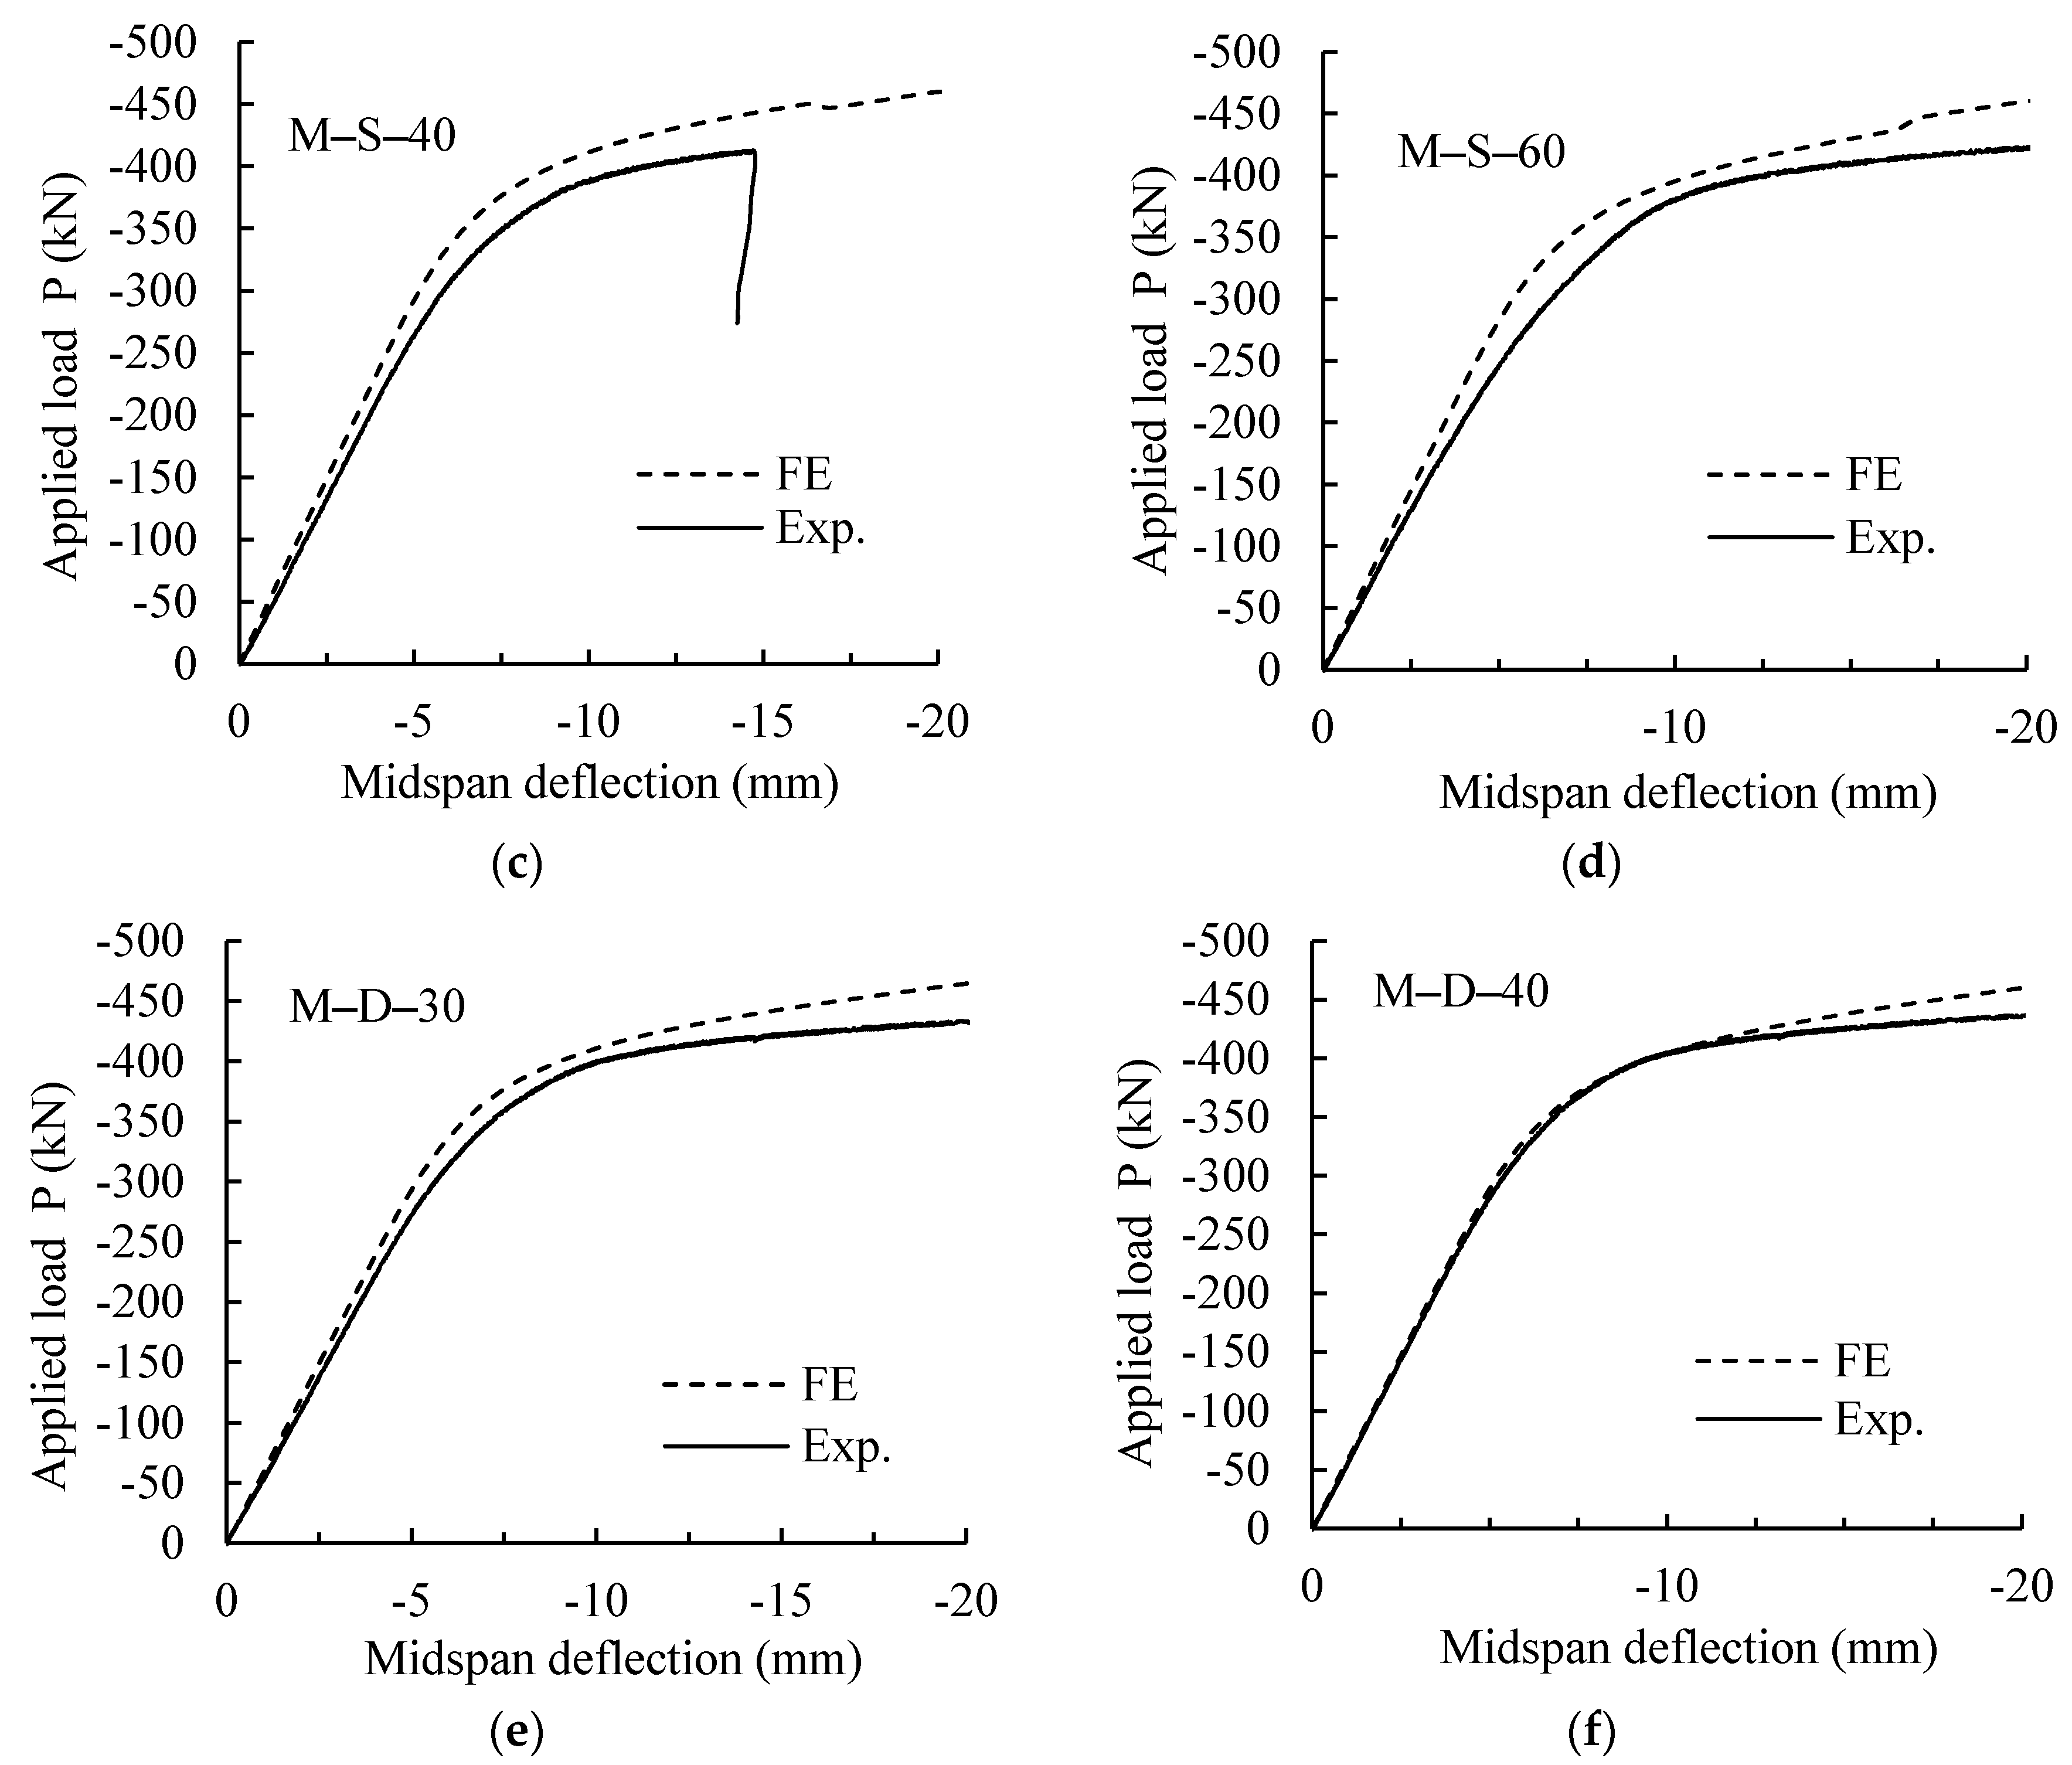
Figure 9a–f show a comparison between the experimental and numerical FE load–deflection responses of each individual specimen with notches at the midspan. It is clear that the proposed FE model predicted load–deflection responses are identical and comparable to their experimental counterparts. Figure 9b,f show that the numerically predicted stiffness and peak load were almost the same as those of experimental work for specimens with single and double notches, M-S-30 and M-D-40, whereas for the rest of the specimens, the numerically predicted stiffness and peak load were on the average between 2–4% higher than the experimentally obtained ones. This slight discrepancy could be attributed to misalignment of the specimen or the deflection measuring device during testing. These identical results between the experimental and numerical FE load–deflection responses ensure that the proposed FE model can be utilized for further investigation of the behavior of damaged steel beams with notch sizes and locations other than the ones considered in the experimental program of this study.
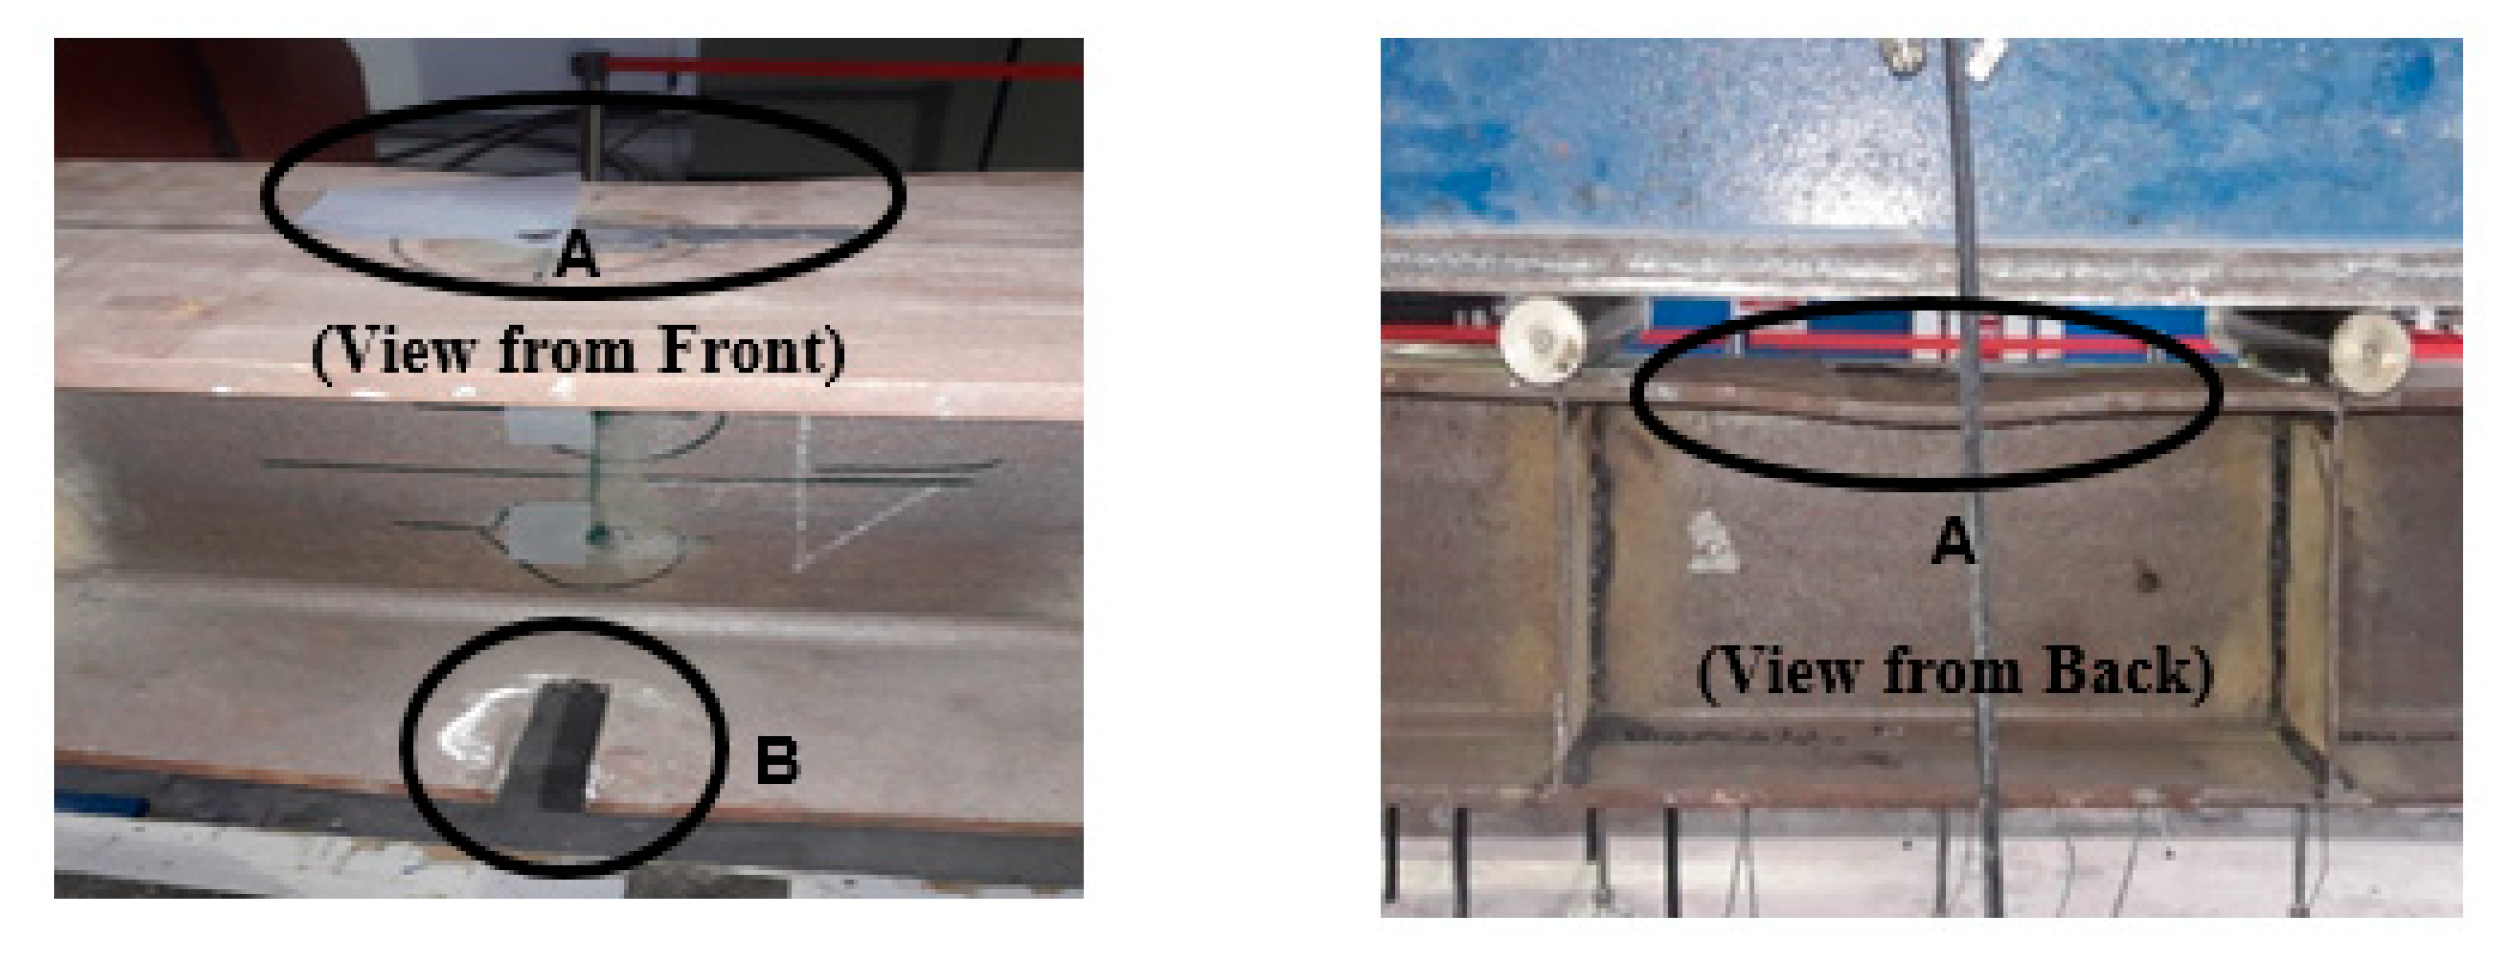
Figure 10 shows similar failure modes in tests and FE models (buckling in the compression flange). It is apparent from the figure that the predicted numerical failure mode was in agreement with the test failure mode. This similarity between the numerical and test failure modes confirms the accuracy of the numerical simulation generated in this study.
6. Application of the Verified FE Model to Beams with Notch Sizes Not Considered in Test Program
Based on the verification of the FE model in the previous Section (Figure 9 and Figure 10), the numerical investigation was extended to cover further different notch depth and width values, with the notch damage being considered in the tension side and only at the beam midspan since this was the worst damage location scenario, as revealed by the results shown in Figure 5, Figure 6 and Figure 7. The extended analysis examined beams with single notches (M-S) and double notches (M-D) at midspan with 40 mm, 60 mm, and 80 mm in depth, and 20 mm, 40 mm, 60 mm, 100 mm, 150 mm, 200 mm, 250 mm, 300 mm, and 350 mm in width.
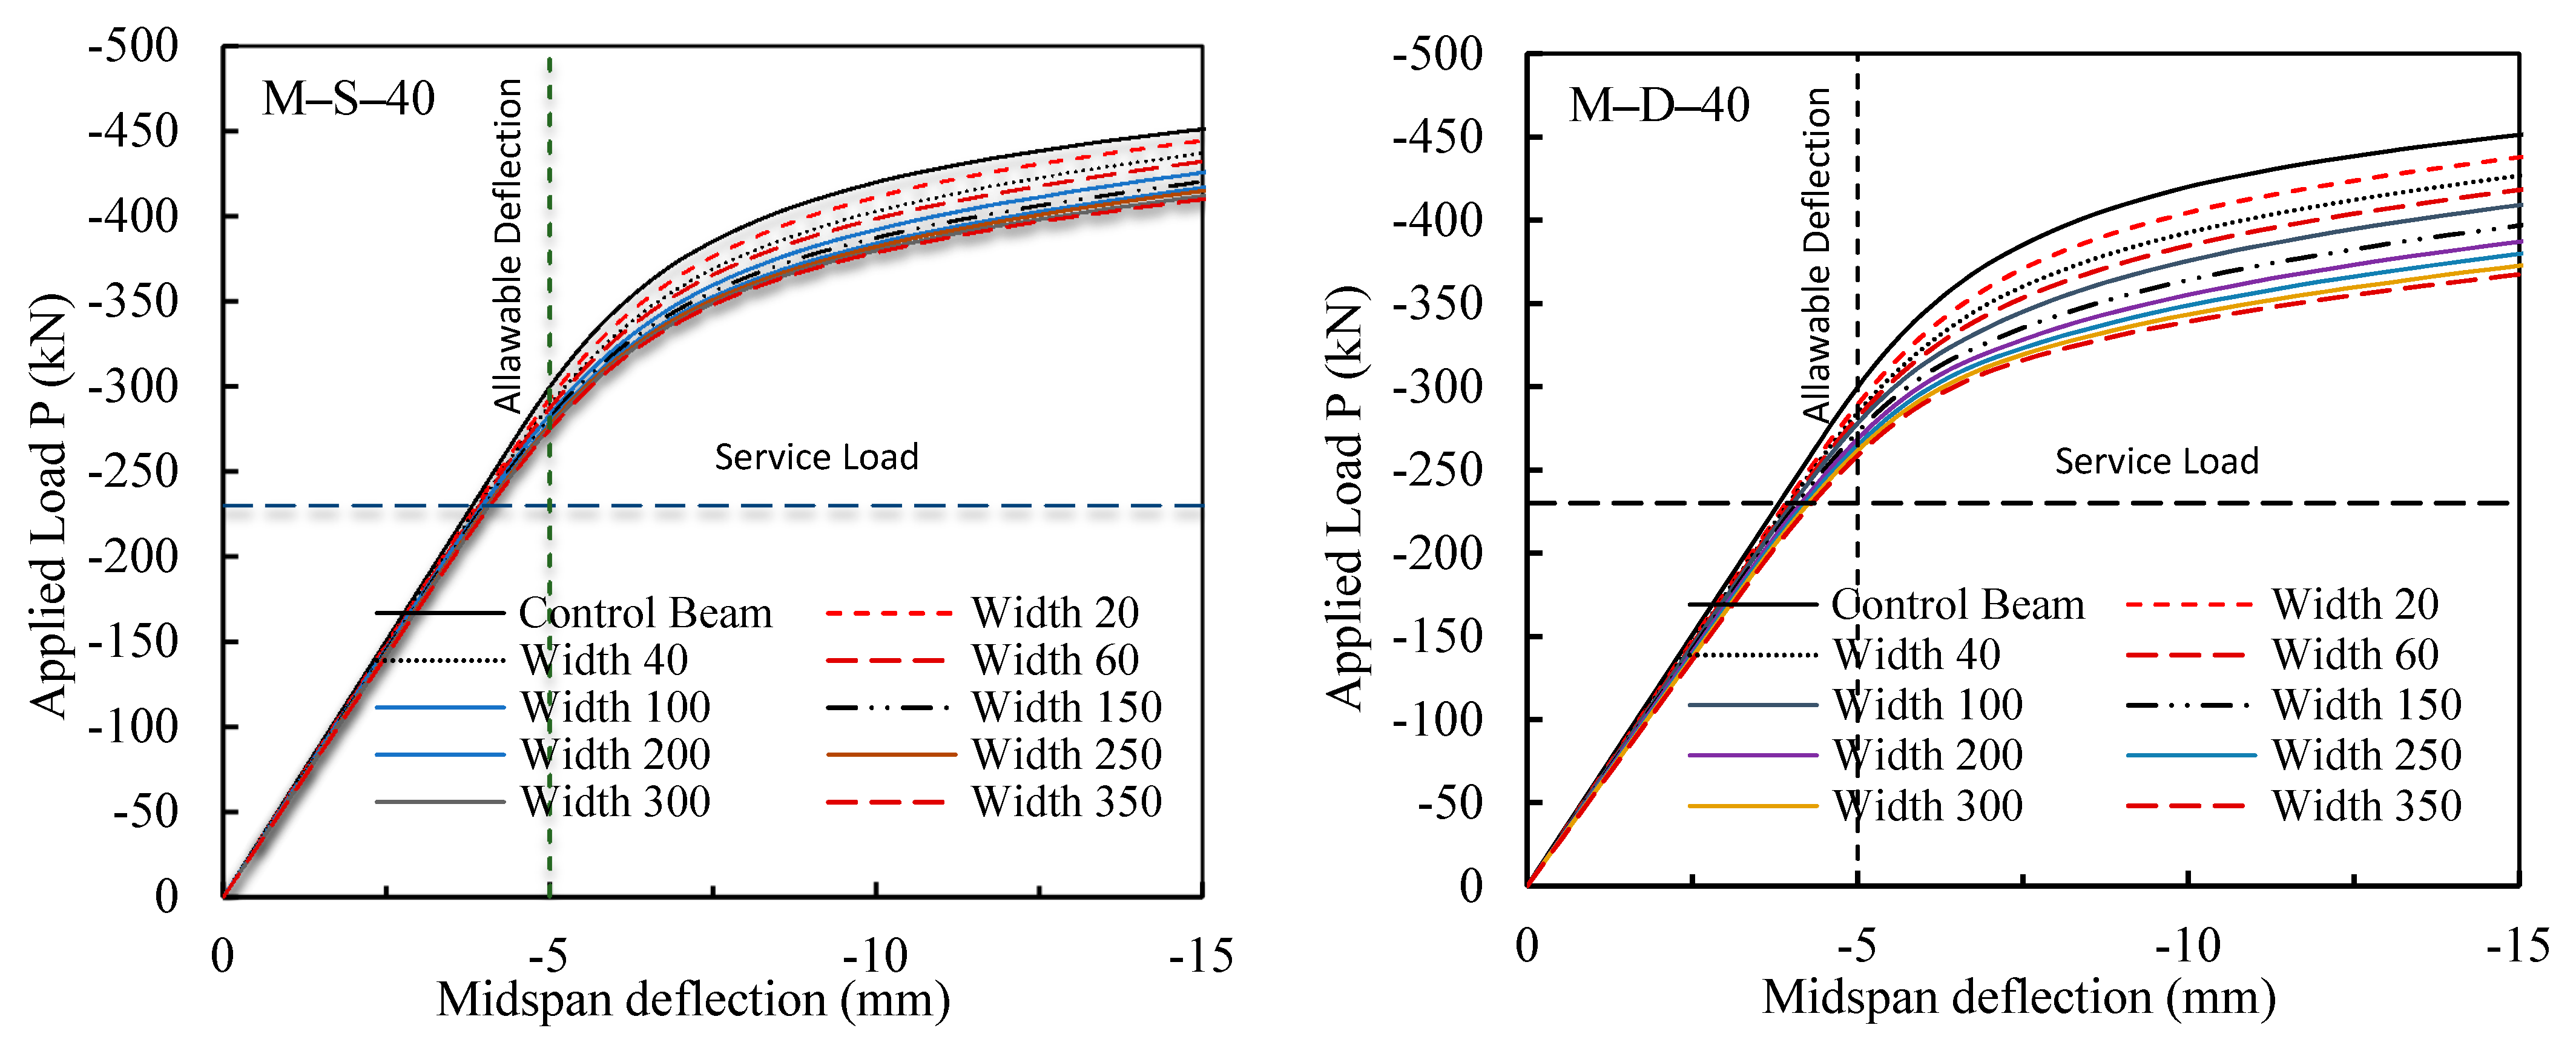
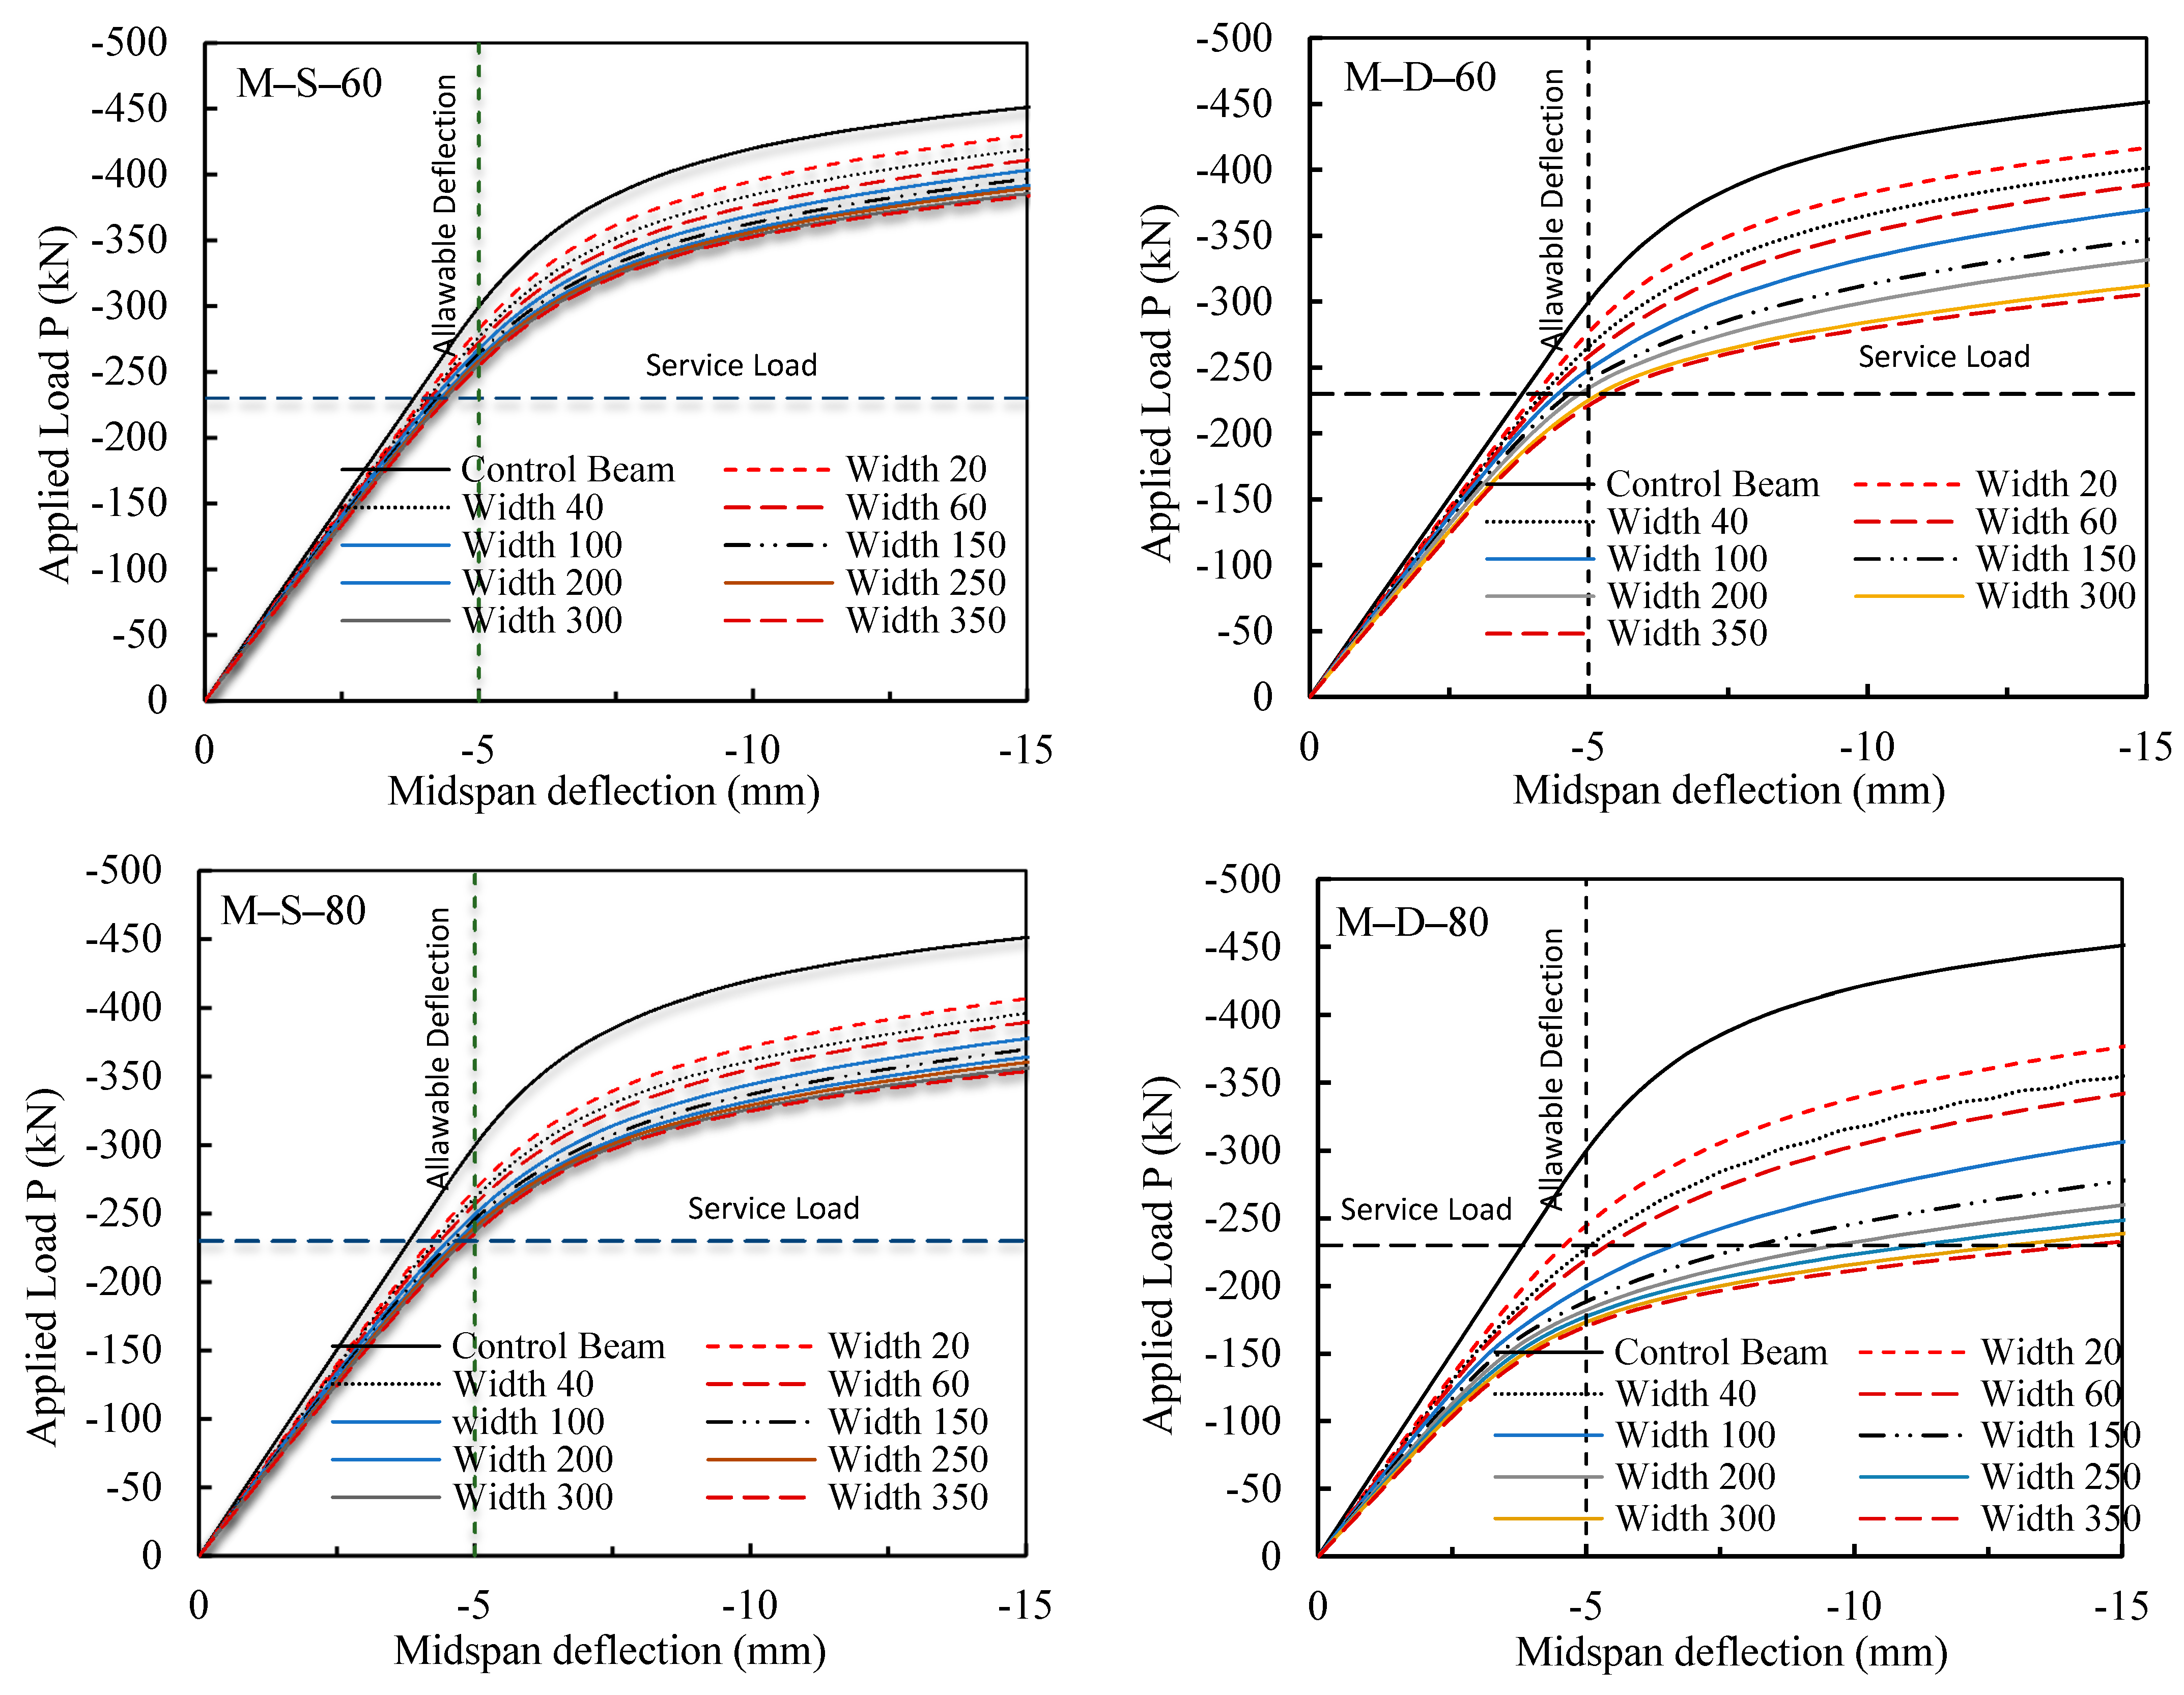
Figure 11 displays the numerical load–midspan deflection relationships for the extended numerical investigations. In comparison with the control beam load-carrying capacity, the figure shows that the capacity of damaged steel specimens that have single notches at the midspan (M-S) was more significantly influenced and weakened by the notch depth increase (40 mm, 60 mm, and 80 mm) than it was influenced and weakened by the increase in the notch width (20 mm, 40 mm, 60 mm, 100 mm, 150 mm, 200 mm, 250 mm, 300 mm, and 350 mm). The increase in the notch depth contributed directly to decreasing the stiffness of the damaged beams as manifested in the figure. Damaged beams with notch depths of 40 mm (M-S-40) showed a decrease in the load-carrying capacity ranging from 1–8.5% as opposed to the control beam when the notch width ranged from 20 mm to 350 mm. Beams with notch depths of 60 mm (M-S-60) showed a decrease in the load-carrying capacity ranging from 5–15% when the notch width stretched from 20 mm up to 350 mm. Likewise, damaged beams with notch depth of 80 mm (M-S-80) showed a decrease in the load-carrying capacity ranging from 8–20%, as opposed to the control beam when the notch width ranged from 20 mm to 350 mm.
The influence of increasing the notch depth on the load-carrying capacity was even more pronounced and more distinct in damaged beams with double notches in the flange at the midspan (M-D), as shown in Figure 11, where the increase in the notch width started to considerably contribute to weakening the beam capacity as well. The increase in both the notch depth and width in the M-D specimens contributed directly to substantially decreasing the stiffness and the capacity of the damaged steel specimens, as manifested in Figure 9. Damaged beams with notch depths of 40 mm (M-D-40) showed a decrease in load-carrying capacity ranging from 2.5–16%, as opposed to the control beam when the notch width ranged from 20 mm to 350 mm. Beams with notch depths of 60 mm (M-D-60) showed a decrease in the load-carrying capacity ranging from 7.5–32% when the notch width stretched from 20 mm up to 350 mm. Likewise, damaged beams with notch depths of 80 mm (M-D-80) showed a decrease in the load-carrying capacity ranging from 14–48%, as opposed to the control beam when the notch width ranged from 20 mm to 350 mm. One observation from Figure 11 worthy of highlighting is that when the notch width in all the numerically examined damaged beams was equal to half the distance between the applied loads, i.e., 200 mm or more, the notch width influence on the capacity of the beams became insignificant.
To relate the above findings to practical everyday applications, the service load was assumed to be equal to half the maximum applied load, i.e., 455 kN/2 = 228 kN. For steel beams, deflection due to service live load is of concern in the finished structures and, therefore, the allowable deflection (i.e., deflection limit) considered in the discussion of the numerical result findings was set to be equal to δ = L/360 = 1800 mm/360 = 5 mm, where L is the beam span length. Hence, horizontal and vertical lines showing the level of the service load and the allowable deflection, respectively, were drawn in Figure 10. With these two lines established, it is clear from the figure that although all damaged beams, with the exception of M-D-80 beams, performed well in service load conditions with deflections less than the allowable deflection, the load capacity of the beams at the allowable deflection was considerably influenced by the notch depth and width. As a result, all damaged beams would not require any immediate action in service load conditions except those of M-D-80, where immediate and urgent action would be needed, such as replacing or retrofitting the beams. However, the decision for any needed repair in terms of urgency depends on the load capacity of the damaged steel beams at the allowable deflection.
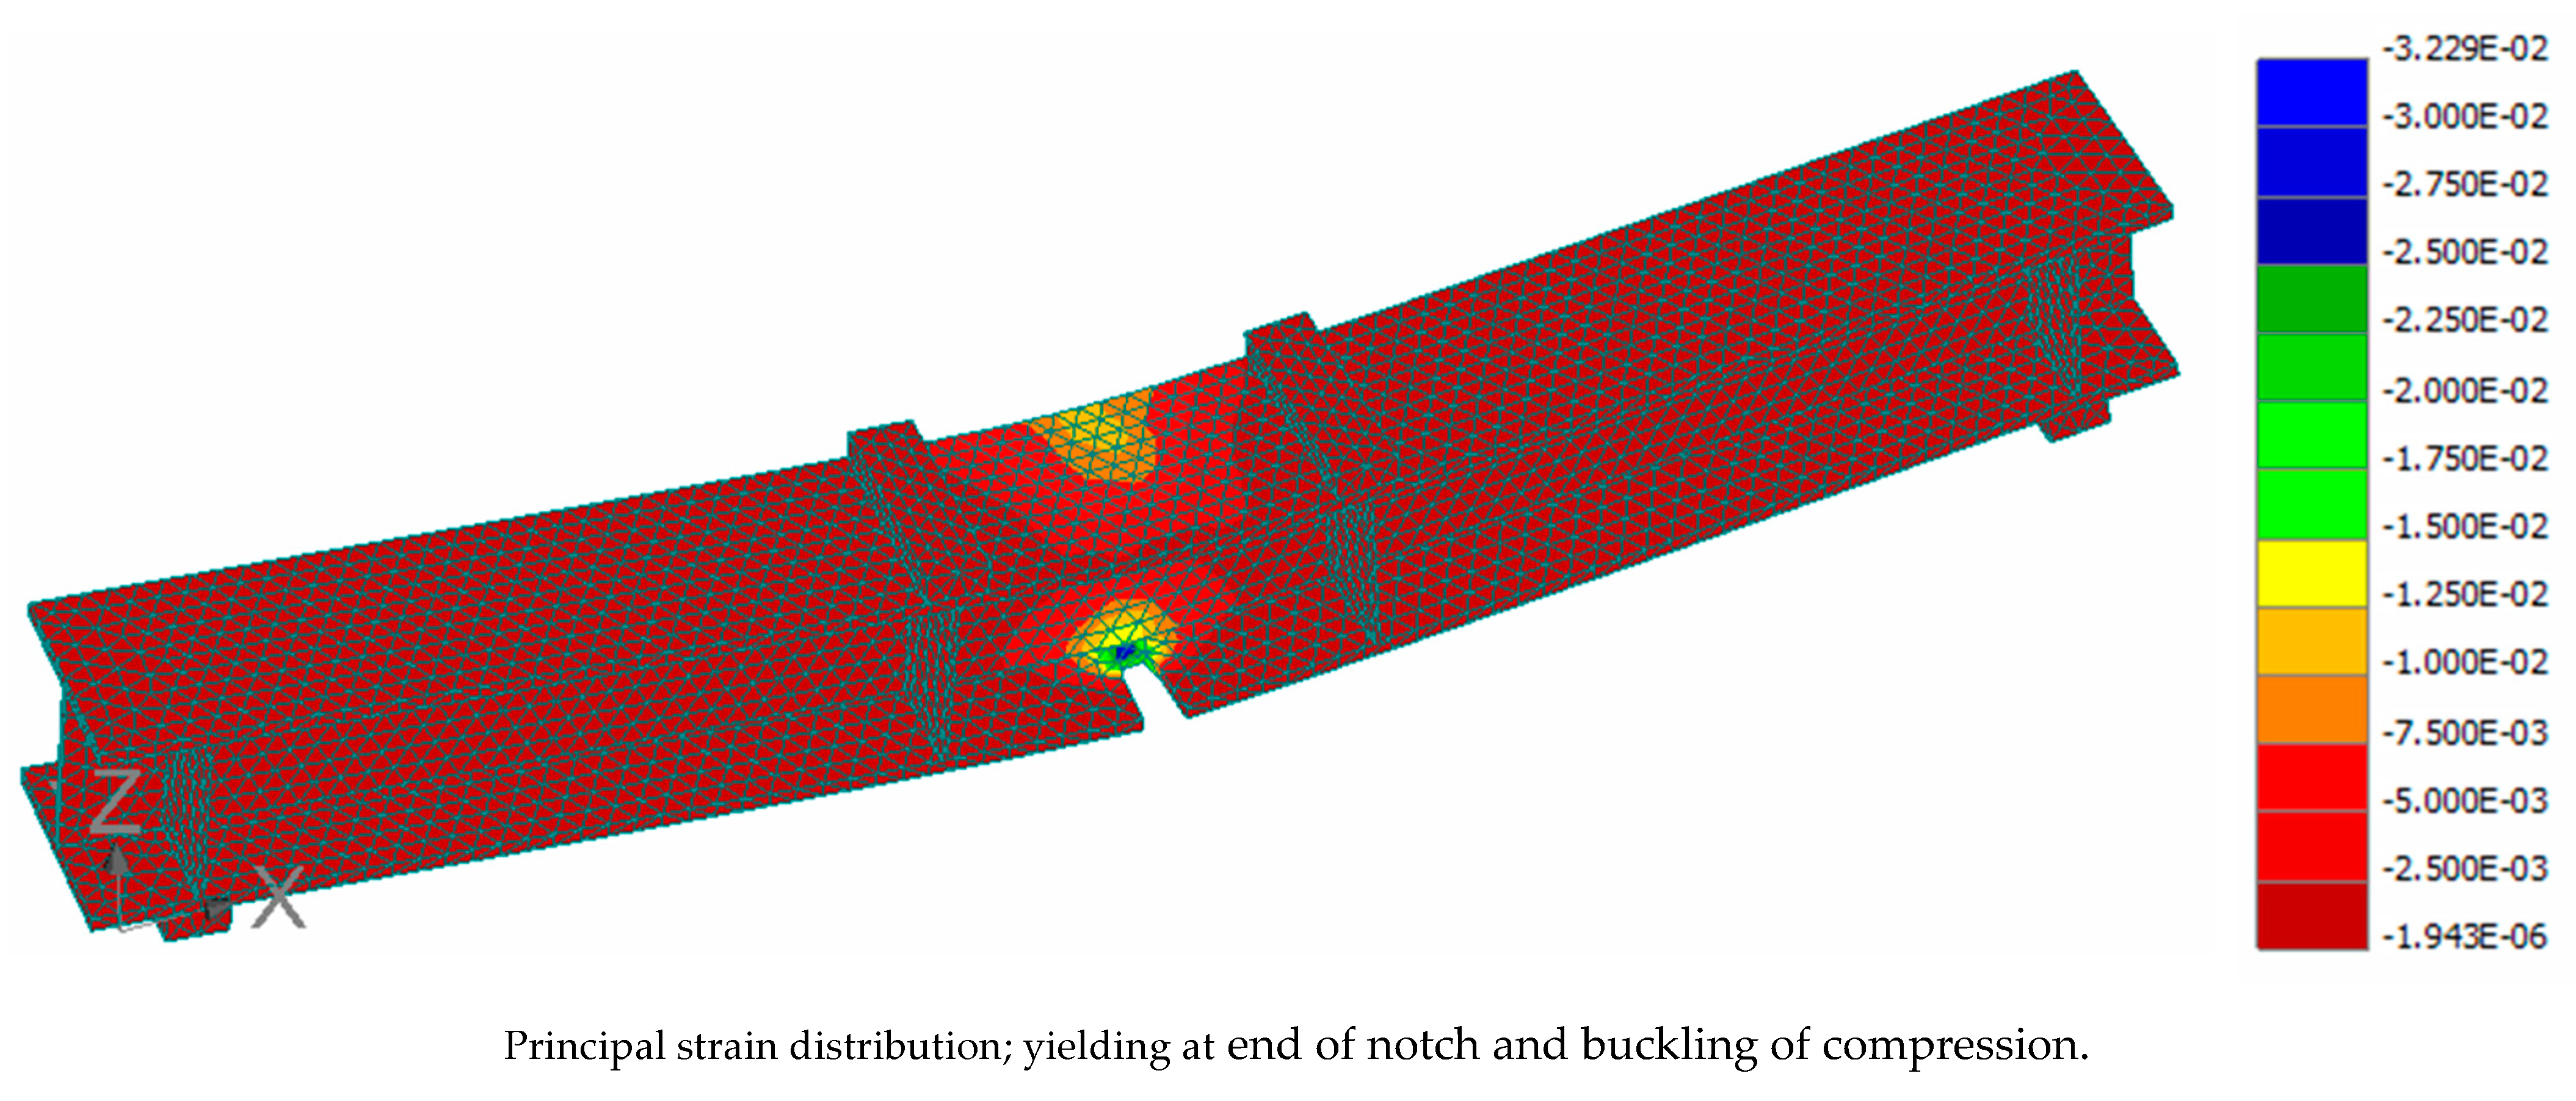
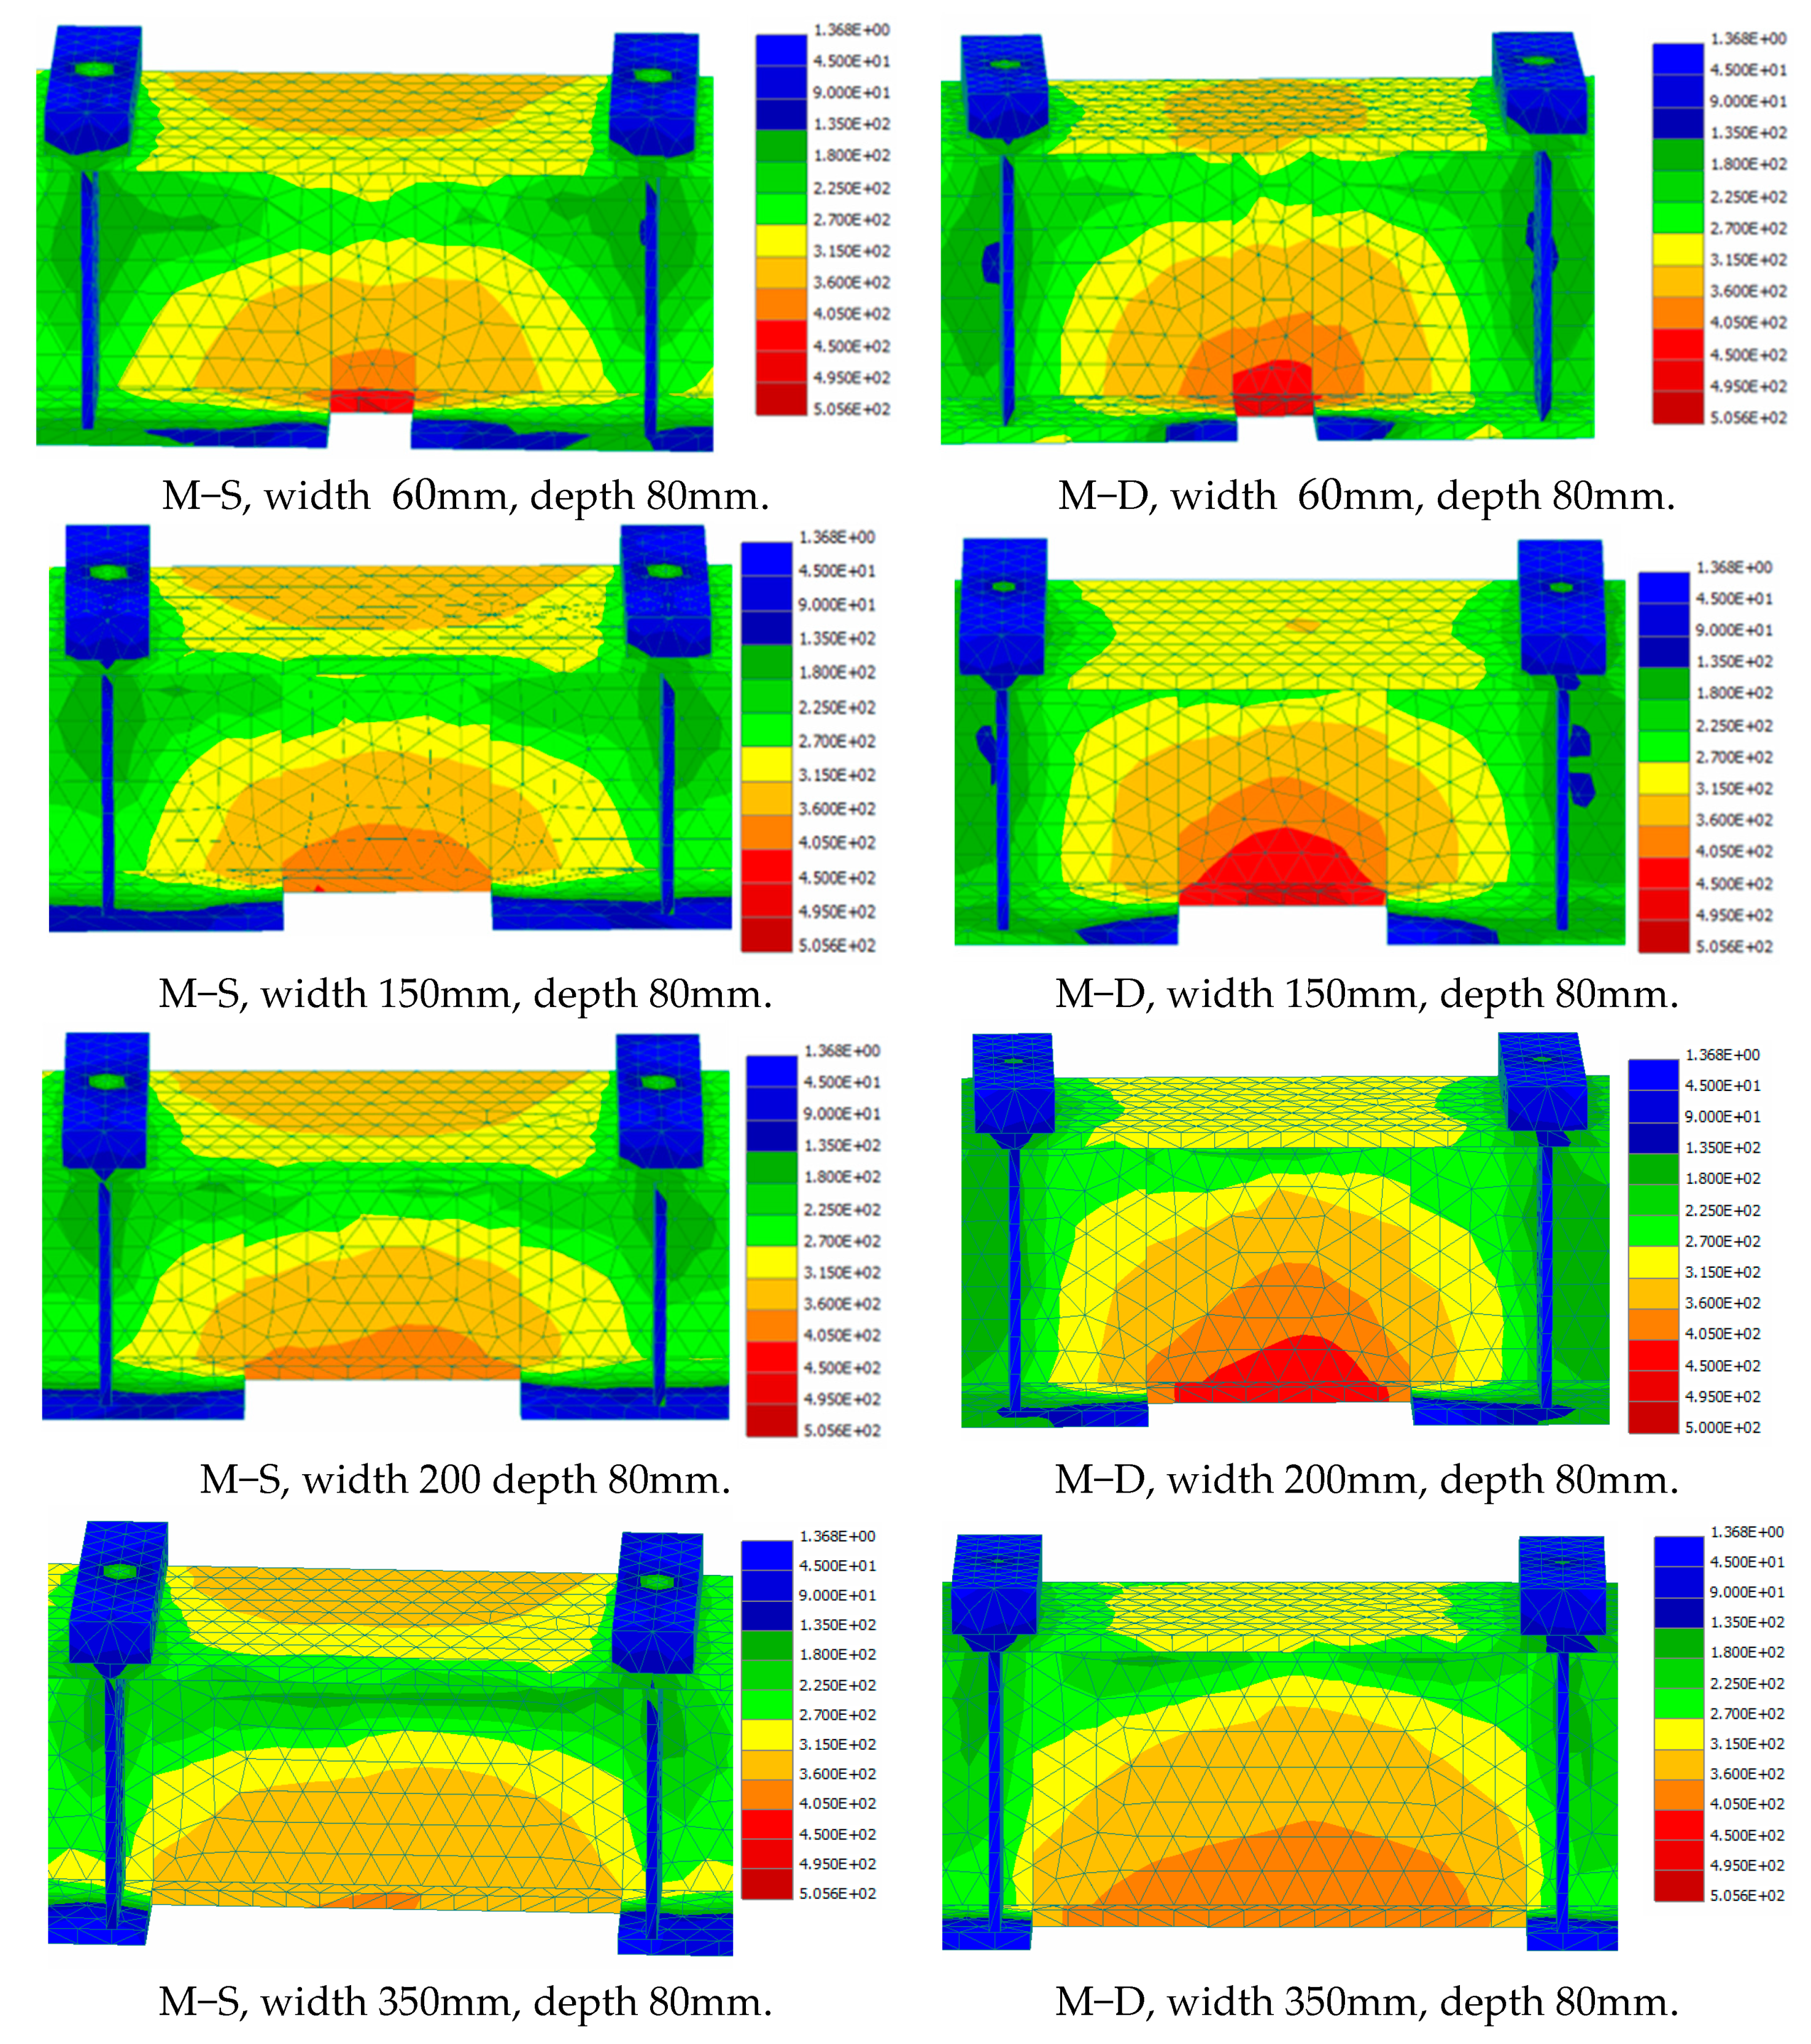
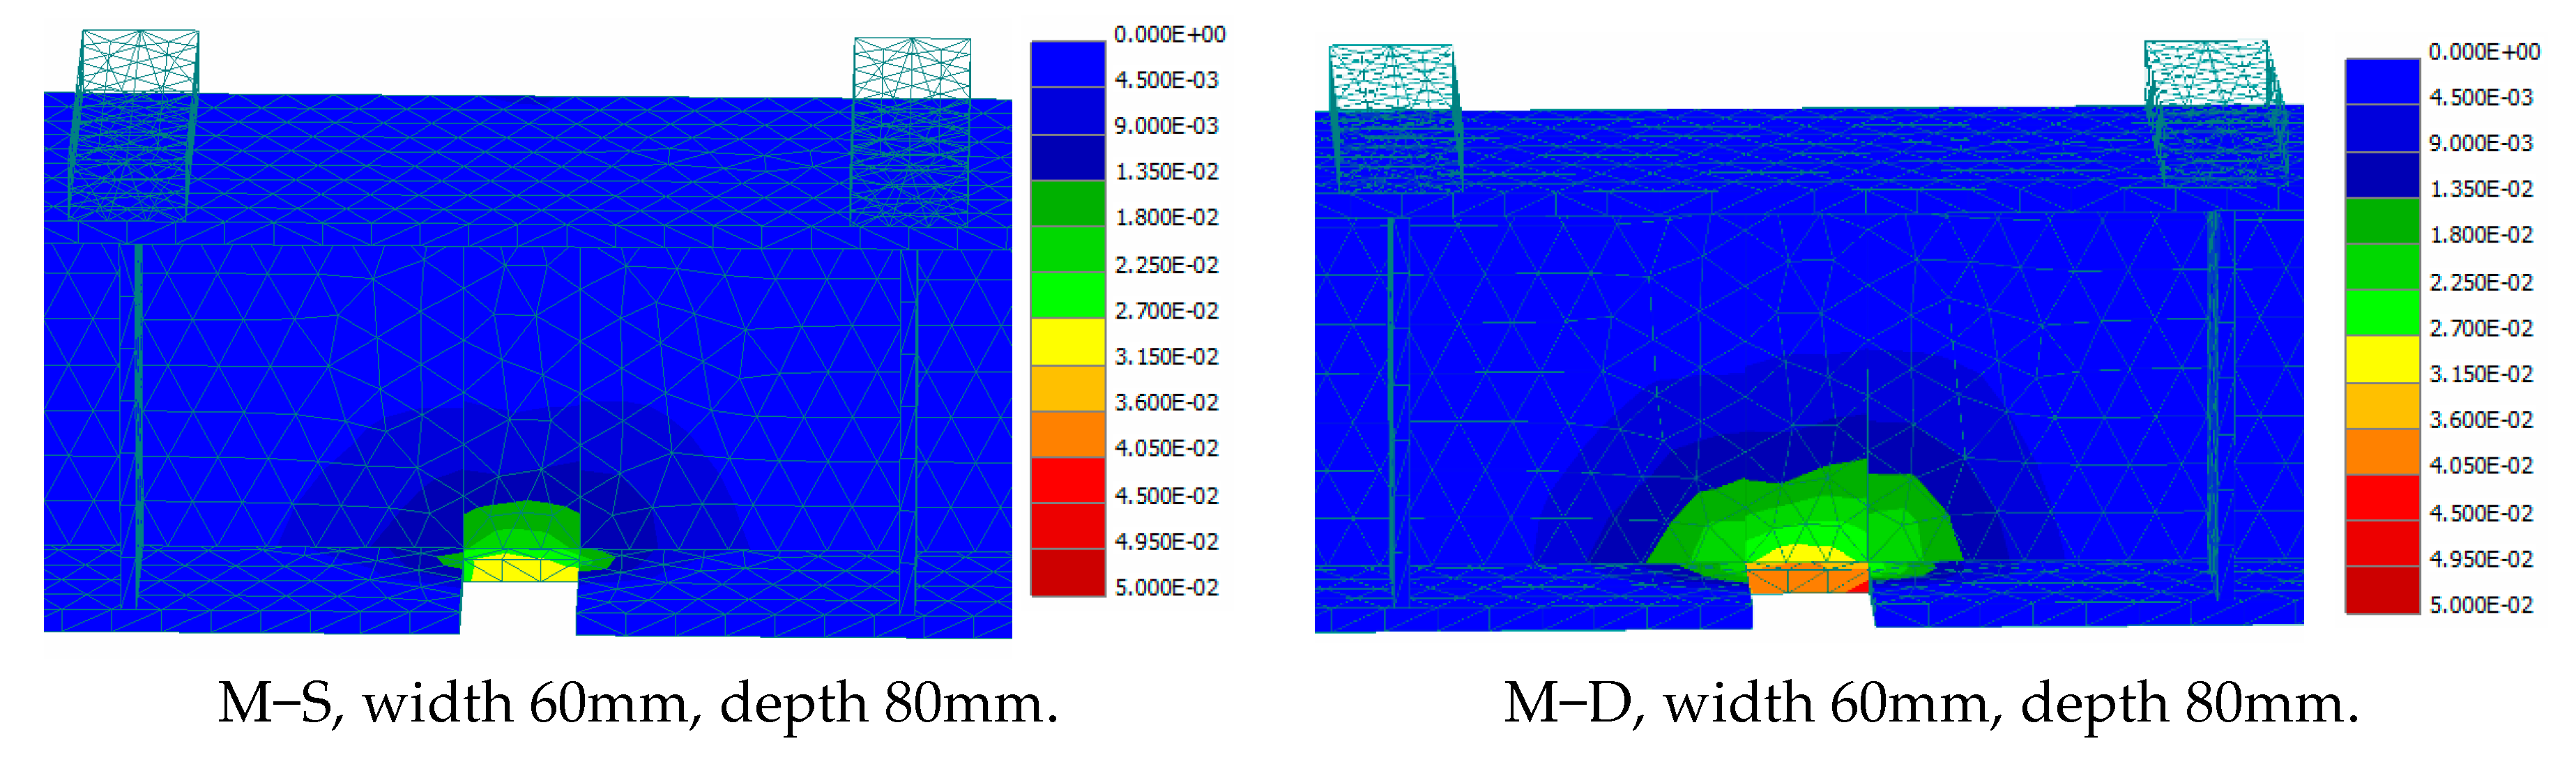
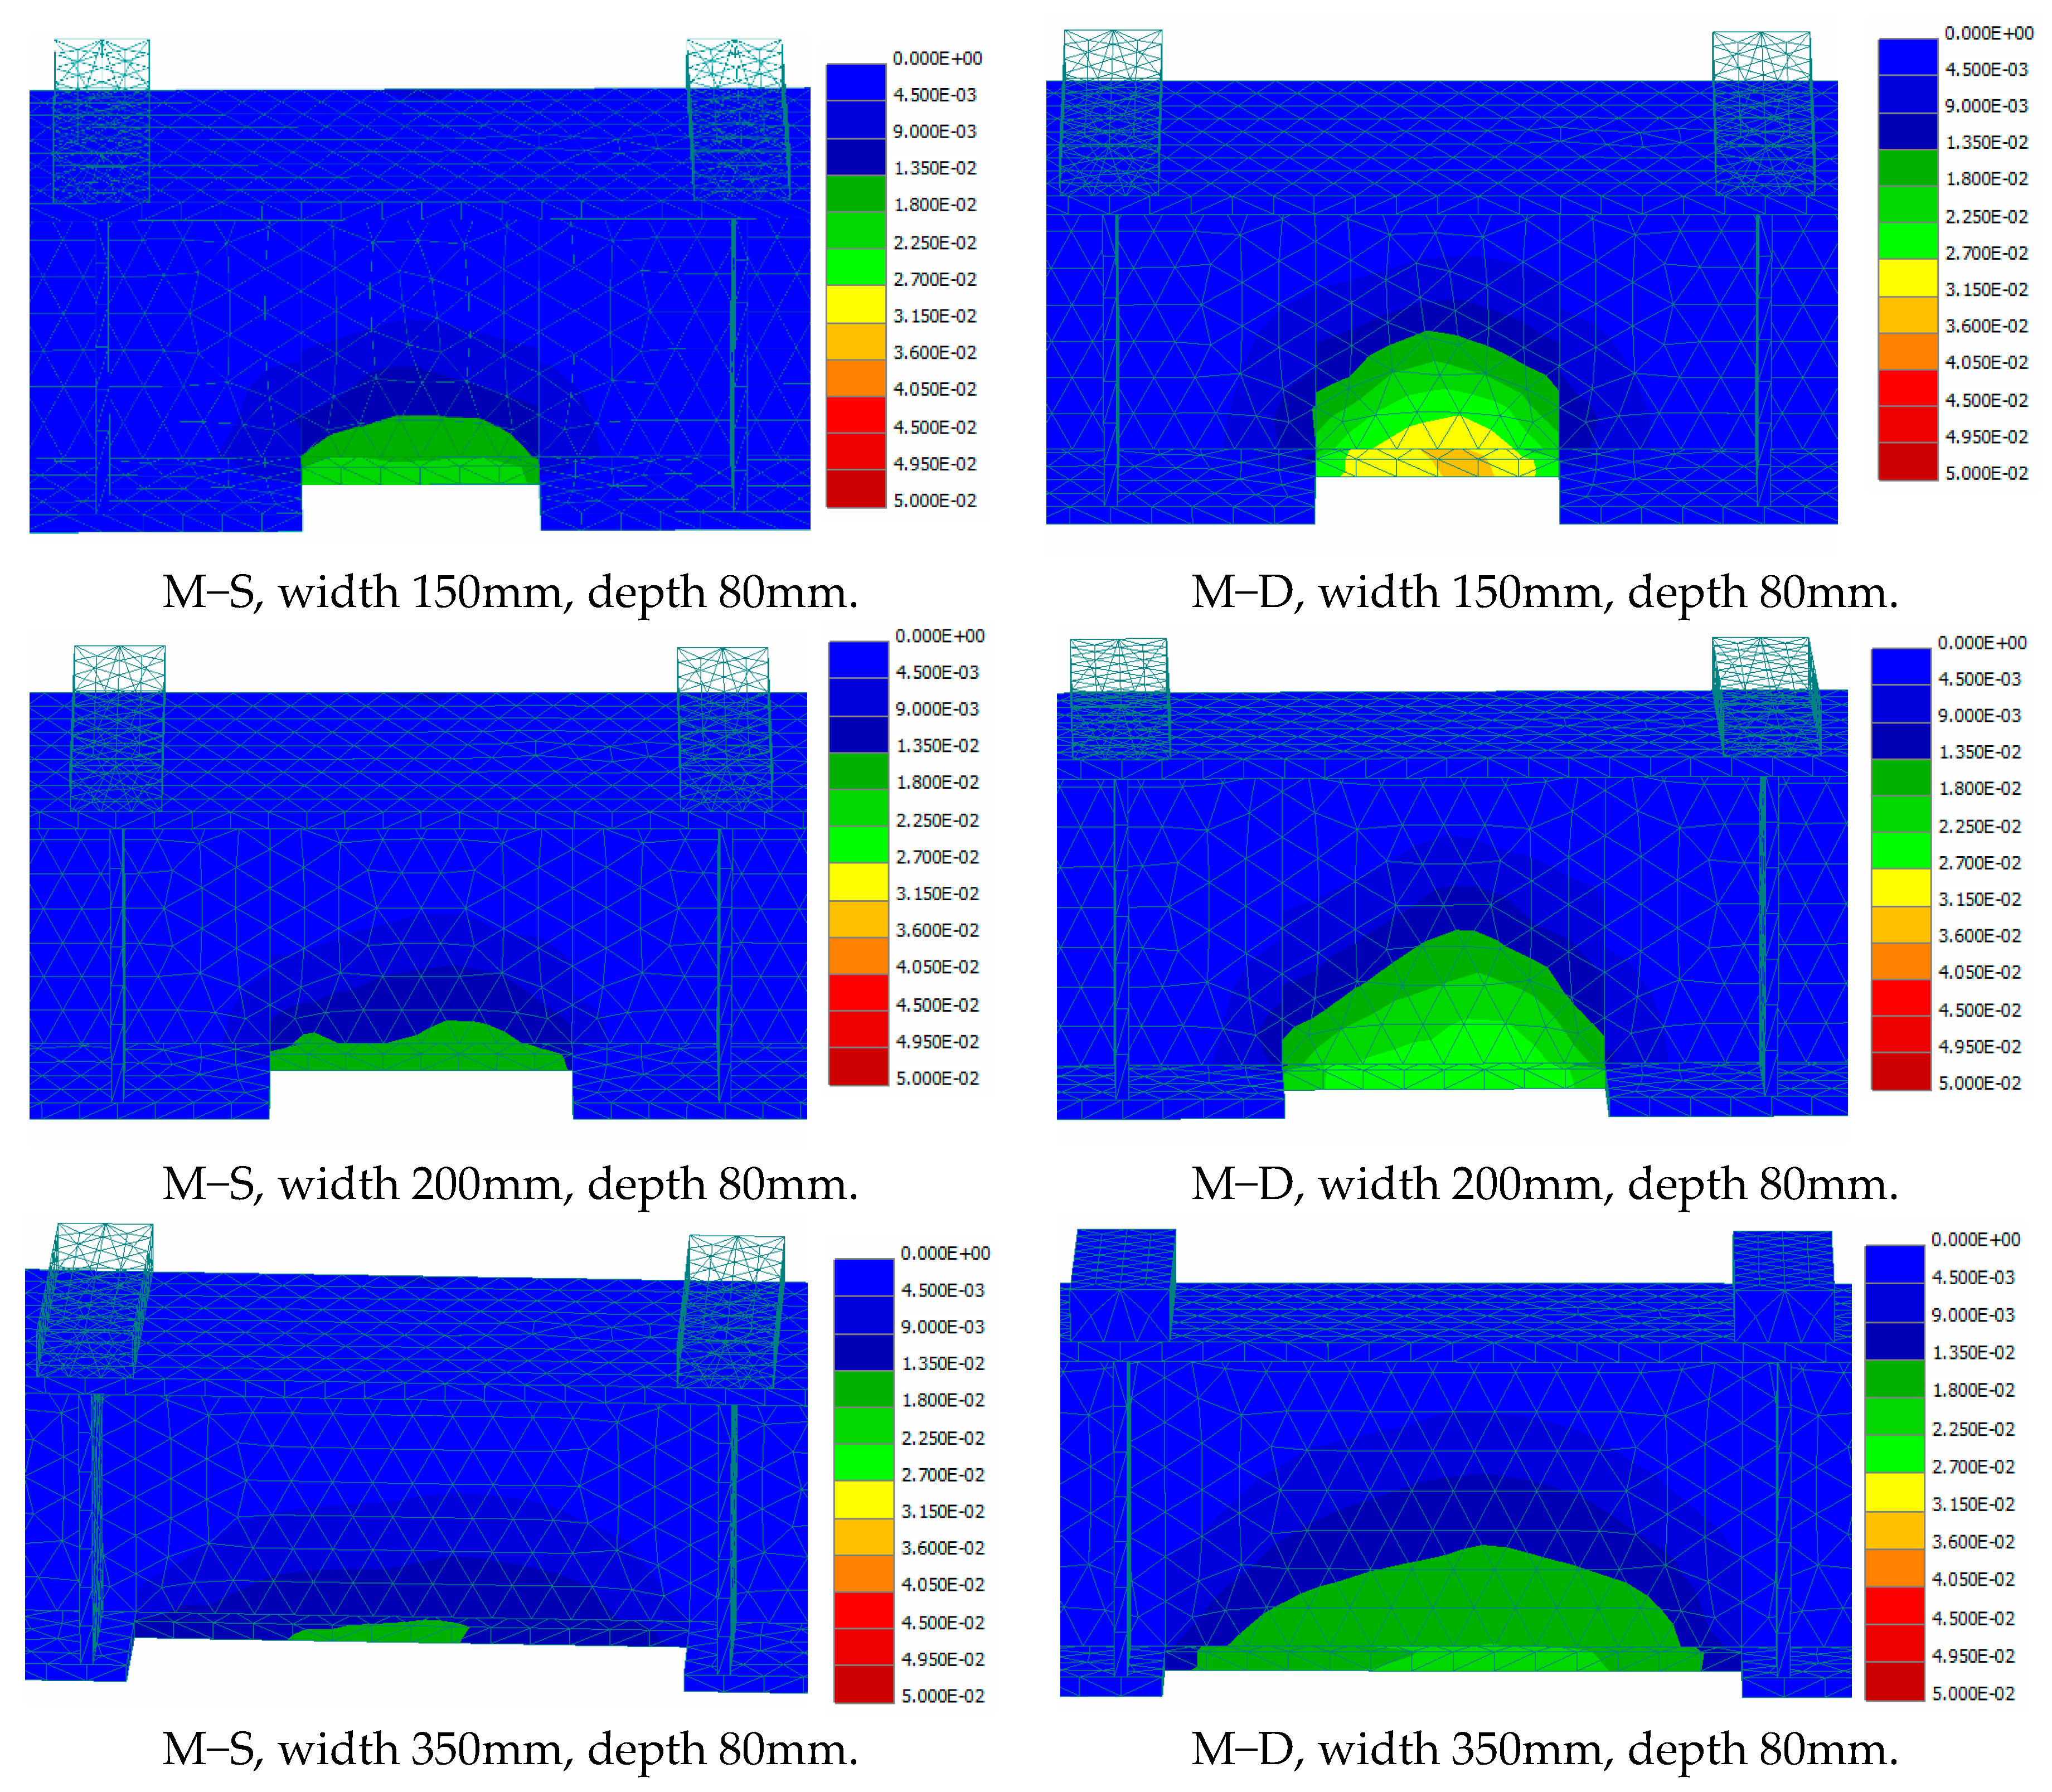
Figure 11 indicates that when the depth of the notch increased, the load-carrying capacity of the beams was significantly affected. This can be explained by the observation that when the notch depth increased, the notch damage got closer to the beam web and, therefore, the stress concentration at the end of the notch became within the vicinity of the beam web, leading to an increase in the web strains and stresses. The increase in the web strain and stress led to a decrease in the beam stiffness and capacity and to an increase in the defection rate. This analysis is clearly confirmed by Figure 12 and Figure 13, where for M-S and M-D beams with notch depths of 80 mm, the stresses and strains were concentrated and high not only in the beam flange but also in the beam web, due to the nearby notch. On the other hand, as the width of the notch increased, these high stresses and strains spread, affecting a larger area of the web, as revealed in Figure 12 and Figure 13, and caused a wider portion of the beam to yield. As a result, the stiffness of the beam decreased, the beam capacity decreased, and the beam deflection rate increased rapidly, which accelerated the occurrence of permanent deformations. The figures show that the damage affected the stiffness of the beams, resulting in an increase in deflections at design loads. This impact of the damage on the steel beam deflection should be addressed in design codes for serviceability requirements.
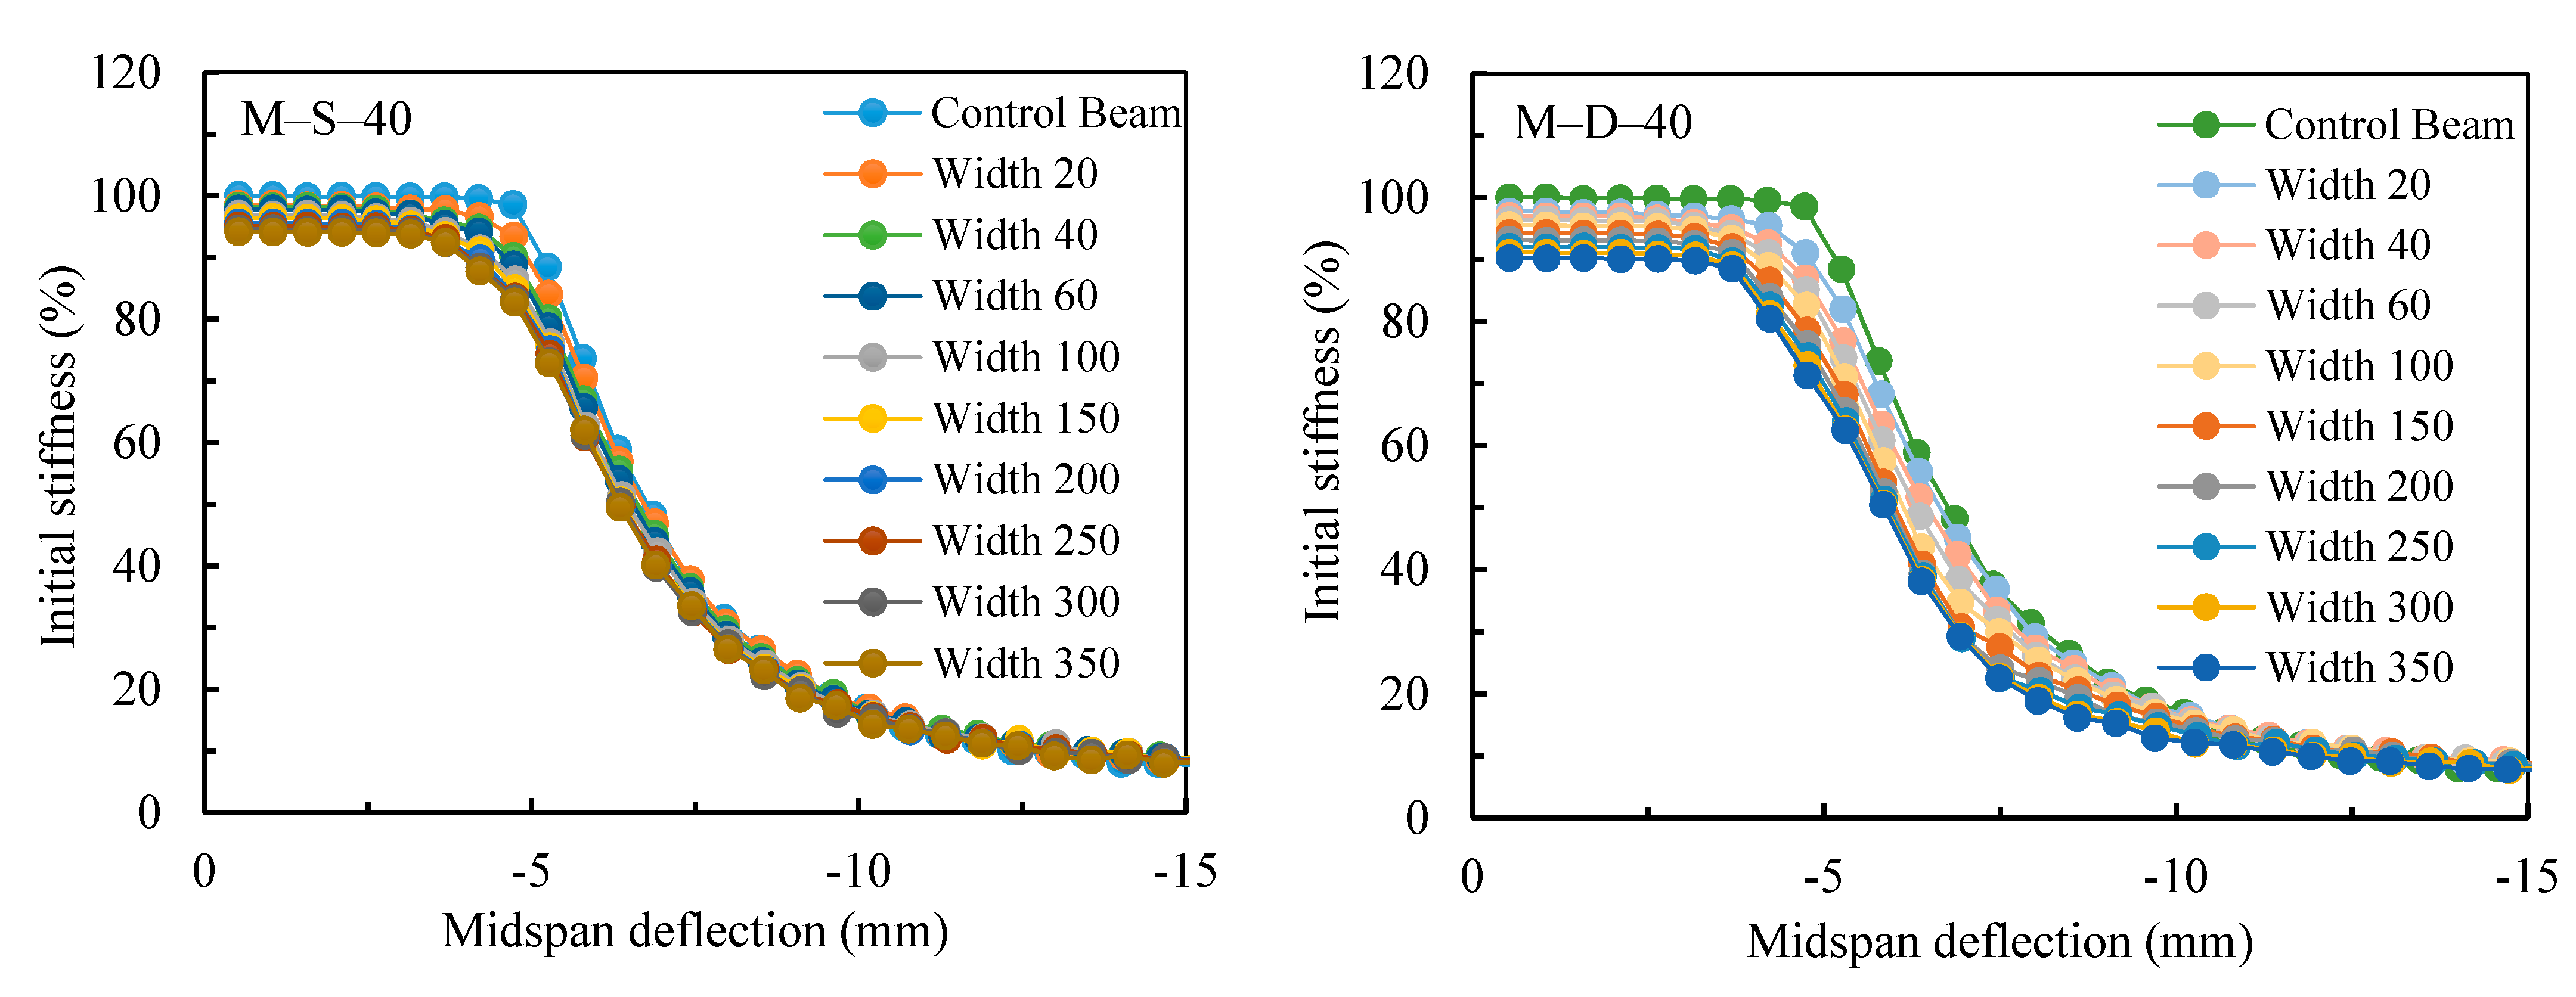
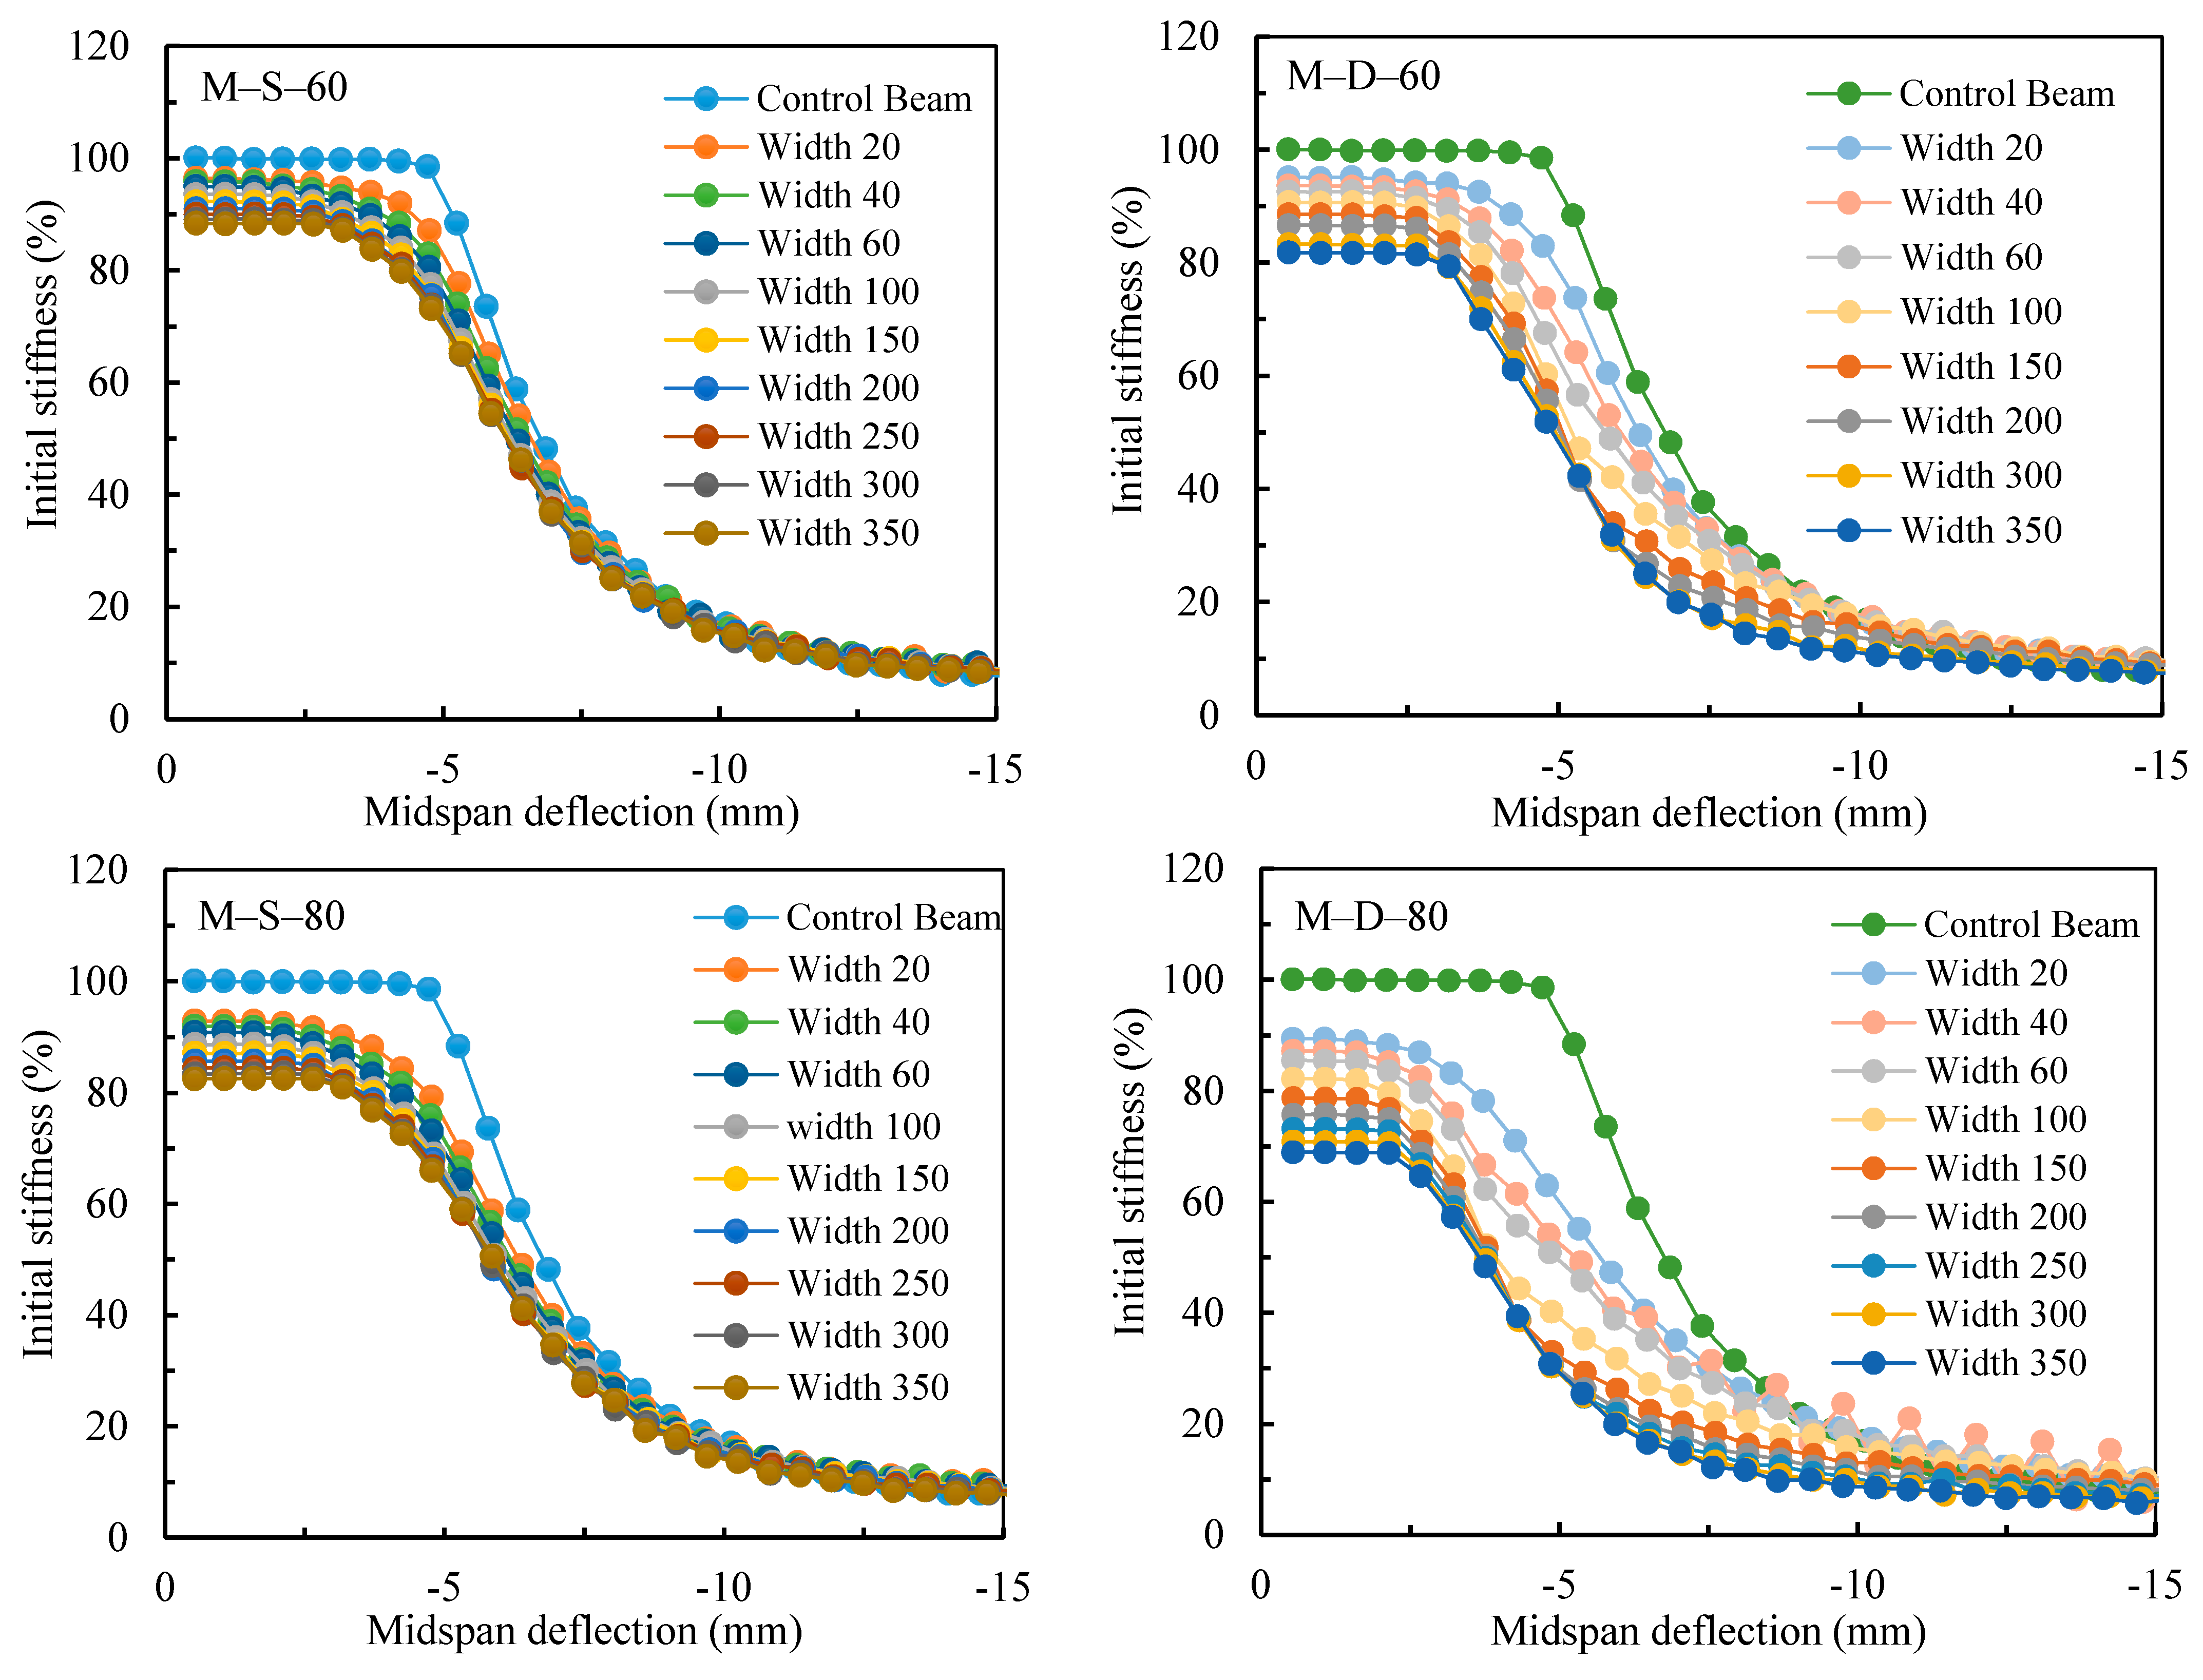
The numerical stiffness versus numerical midspan deflection relation of the control beam was represented in Figure 14, and numerical relative stiffness of the damaged steel beams with respect to the control beam numerical stiffness versus numerical midspan deflections were drawn in Figure 15.
Figure 14 of the control beam identifies the start of the beam yielding, which occurred at a deflection a little less than the allowable deflection of 5 mm, as shown in the figure. The figure also identified the start of the plastic zone/behavior of the beam. It is evident from Figure 14 that the stiffness dropped rapidly and immediately after the yielding was reached, causing the beam to undergo inelastic deformation until the stiffness became asymptotic, indicating stiffness softening or plastic behavior with no increase in the capacity. The beginning of the plastic zone occurred at a deflection equal to almost three times as much as the yielding deflection, as shown in the figure.
The numerical relative stiffness of the damaged steel beams versus the numerical midspan deflections are drawn in Figure 15. The figure demonstrates that the yielding of the M-S beams was reached faster as the depth of the notch increased while increasing the width of the notch did not sizably affect the beginning of the plastic behavior. On the other hand, M-D beams demonstrated that a quicker yielding of the beam was achieved at small deflection values as the depth of the notch increased. In addition, as the width of the notch increased, the softening of the beam (plastic behavior) was reached at much smaller deflections than those in the M-S beams. This is due to the spreading of the yielding stress over a larger web area, as confirmed by the stress and strains distributions in Figure 12 and Figure 13. Figure 15 reveals an interesting observation and that is the curves of the damaged beams are shifted to the left as if the beams were already loaded and deformed. As a result, the beams reached the allowable deformation and plastic behavior at lower loads. The results highlight the applicability of using the finite element technique to investigate the maximum acceptable damage size with respect to the reuse of any damaged beam based on its configuration.
Therefore, this investigation supports the feasibility of reusing pre-damaged steel beams in temporary structures under service loads and certain levels of damage, where the behavior of such beams is within the elastic range and the maximum defection is less than the allowable one.
7. Conclusions
The feasibility of reusing pre-damaged steel beams in temporary structures such as the excavation of temporary supporting systems, and waler beams, was addressed in this study. The extensive structural investigation of notch-damaged laterally unsupported steel beams with various sizes of U-shaped notch damage in the tension flange was carried out experimentally and numerically. Notch damages on one side and on two sides of the tension flange were considered in the study. The load-carrying capacity of the majority of the investigated damaged beams was not affected by the deflection while in service load conditions. In contrast, when the deflection of the damaged beams exceeded the allowable deflection limit, the capacity reduced, and the damaged beams failed due to buckling of the compression flange. It was observed in double notched beams with notch width depths of 80 mm and widths excessing 40 mm the beams behaved inelastically under allowable service loads, which jeopardizes the feasibility of further reusing the damaged beam.
The beams with notch damage at midspan were the most critical ones because the notch existed within the beam maximum flexural moment zone. The load-carrying capacity of the considered damaged beams with a single notch at the midspan was more significantly influenced by the notch depth increase than it was influenced by the increase in the notch width. On the other hand, the influence of increasing the notch depth on the load-carrying capacity was even more pronounced and more distinct in beams with double notches in the flange at the midspan of the beam, where the increase in the notch width considerably contributed to reducing the beam capacity as well. This can be explained by the observation that when the notch depth increased, the notch damage got closer to the beam web and, therefore, the stress concentration at the end of the notch became within the vicinity of the beam web and penetrated it, leading to an increase in the web strains and stresses. The increase in the web strains and stresses led to a decrease in the beam stiffness and load capacity and to an increase in the defection rate. Likewise, the increase in the notch width on one side or both sides of the flange allowed the spreading of the stresses and strains into a larger area of the beam web leading to a further reduction in the load capacity and larger deflections.
This study revealed that all damaged beams, with the exception of M-D-80 beams, performed elastically in service load conditions when their deflections were less than the allowable limit. The load capacity of the beams at the allowable deflection was considerably influenced by the notch depth and width. However, for the M-D-80 beams, the load capacities were below the service load limit due to the fact that as the notch depth increased, the effect of increasing its width on the load capacity became more noticeable and evident, leading to a significant decrease in the beam load capacity at the allowable deflection. Therefore, the decision for any needed repair of U-shaped-notch-damaged laterally unsupported beams in terms of urgency and repair method depends on how close the notch depth is to the beam web and on the load capacity of the damaged beams at the allowable deflection. This investigation supports the feasibility of reusing pre-damaged beams in temporary structures under service loads and certain levels of damage, where the behavior of such beams is within the elastic range and the maximum defection is less than the allowable one. The FE can be used to highlight the upper limit of the notch size that allows the damaged beam to be reused without repair.
It is recommended, for future study, to generate reduction factors for the strength and stiffness of the damaged steel beams based on the damage size and different beam configurations. These reduction factors could be presented either as charts or equations to facilitate the design of the damaged beams and explore the possibility of reusing them or not. Additionally, damaged beams with notches in both flanges (or a notch in the compression flange) should be investigated to examine the feasibility of reusing them in temporary structures.
Author Contributions
Conceptualization, B.E.-A. and S.E.; methodology, B.E.-A. and S.E.; software, S.E.; validation, S.E.; formal analysis, B.E.-A. and S.E.; investigation, B.E.-A. and S.E.; resources, B.E.-A. and S.E.; data curation, S.E.; writing—original draft preparation, B.E.-A.; writing—review and editing, B.E.-A.; visualization, B.E.-A. and S.E.; supervision, B.E.-A. and S.E.; project administration, B.E.-A. and S.E.; funding acquisition, B.E.-A. and S.E. All authors have read and agreed to the published version of the manuscript.
Funding
This research was funded by the United Arab Emirates University, grant numbers G00002738 (31N345) and 31N349.
Data Availability Statement
The data that support the findings of this study are available from the authors upon reasonable request.
Acknowledgments
The authors also would like to acknowledge the lab technicians and to acknowledge Zakaria El Karaouf for his contribution in the FE simulations.
Conflicts of Interest
The authors declare no conflict of interest.
References
- Hmidan, A.; Kim, Y.J.; Yazdani, S. CFRP repair of steel beams with various initial crack configurations. J. Compos. Constr. 2011, 15, 952–962. [Google Scholar] [CrossRef]
- Shaat, A.; Fam, A. Axial loading tests on short and long hollow structural steel columns retrofitted using carbon fibre reinforced polymers. Can. J. Civ. Eng. 2006, 33, 458–470. [Google Scholar] [CrossRef]
- Shaat, A.; Fam, A. Repair of cracked steel girders connected to concrete slabs using carbon-fiber-reinforced polymer sheets. J. Compos. Constr. 2008, 12, 650–659. [Google Scholar] [CrossRef]
- Shaat, A.; Fam, A.Z. Slender steel columns strengthened using high-modulus CFRP plates for buckling control. J. Compos. Constr. 2009, 13, 2–12. [Google Scholar] [CrossRef]
- Nozaka, K.; Shield, C.K.; Hajjar, J.F. Effective bond length of carbon-fiber-reinforced polymer strips bonded to fatigued steel bridge I-girders. J. Bridge Eng. 2005, 10, 195–205. [Google Scholar] [CrossRef]
- Deng, J.; Jia, Y.; Zheng, H. Theoretical and experimental study on notched steel beams strengthened with CFRP plate. Compos. Struct. 2016, 136, 450–459. [Google Scholar] [CrossRef]
- Deng, J.; Li, J.; Wang, Y.; Xie, W. Numerical study on notched steel beams strengthened by CFRP plates. Constr. Build. Mater. 2018, 163, 622–633. [Google Scholar] [CrossRef]
- Siwowski, T.W.; Siwowska, P. Experimental study on CFRP-strengthened steel beams. Compos. Part B Eng. 2018, 149, 12–21. [Google Scholar] [CrossRef]
- Siwowska, P.; Siwowski, T. Strength evaluation of steel beams prestressed with CFRP plates. In Proceedings of the Eurosteel 2017, Copenhagen, Denmark, 13–15 September 2017. [Google Scholar]
- Elchalakani, M. Rehabilitation of corroded steel CHS under combined bending and bearing using CFRP. J. Constr. Steel Res. 2016, 125, 26–42. [Google Scholar] [CrossRef]
- Chen, T.; Wang, X.; Qi, M. Fatigue improvements of cracked rectangular hollow section steel beams strengthened with CFRP plates. Thin-Walled Struct. 2018, 122, 371–377. [Google Scholar] [CrossRef]
- Ochi, N.; Matsumura, M.; Hisabe, N. Experimental study on strengthening effect of high modulus CFRP strips with different adhesive length installed onto the lower flange plate of I shaped steel girder. Procedia Eng. 2011, 14, 506–512. [Google Scholar] [CrossRef] [Green Version]
- Ghafoori, E.; Motavalli, M. Innovative CFRP-prestressing system for strengthening metallic structures. J. Compos. Constr. 2015, 19, 04015006. [Google Scholar] [CrossRef]
- Li, J.; Wang, Y.; Deng, J.; Jia, Y. Experimental study on the flexural behaviour of notched steel beams strengthened by prestressed CFRP plate with an end plate anchorage system. Eng. Struct. 2018, 171, 29–39. [Google Scholar] [CrossRef]
- Zhou, H.; Attard, T.L.; Wang, Y.; Wang, J.A.; Ren, F. Rehabilitation of notch damaged steel beams using a carbon fiber reinforced hybrid polymeric-matrix composite. Compos. Struct. 2013, 106, 690–702. [Google Scholar] [CrossRef]
- Hmidan, A.; Kim, Y.J.; Yazdani, S. Crack-dependent response of steel elements strengthened with CFRP sheets. Constr. Build. Mater. 2013, 49, 110–120. [Google Scholar] [CrossRef]
- Chiew, S.; Yu, Y.; Lee, C. Bond failure of steel beams strengthened with FRP laminates—Part 1: Model development. Compos. Part B Eng. 2011, 42, 1114–1121. [Google Scholar] [CrossRef]
- Tavakkolizadeh, M.; Saadatmanesh, H. Strengthening of steel-concrete composite girders using carbon fiber reinforced polymers sheets. J. Struct. Eng. 2003, 129, 30–40. [Google Scholar] [CrossRef] [Green Version]
- Tavakkolizadeh, M.; Saadatmanesh, H. Repair of damaged steel-concrete composite girders using carbon fiber-reinforced polymer sheets. J. Compos. Constr. 2003, 7, 311–322. [Google Scholar] [CrossRef] [Green Version]
- Photiou, N.; Hollaway, L.; Chryssanthopoulos, M.K. Strengthening of an artificially degraded steel beam utilising a carbon/glass composite system. In Advanced Polymer Composites for Structural Applications in Construction; Woodhead Publishing: Cambridge, UK, 2004; pp. 274–283. [Google Scholar]
- Wang, H.-T.; Wu, G. Crack propagation prediction of double-edged cracked steel beams strengthened with FRP plates. Thin-Walled Struct. 2018, 127, 459–468. [Google Scholar] [CrossRef]
- Colombi, P.; Fava, G. Experimental study on the fatigue behaviour of cracked steel beams repaired with CFRP plates. Eng. Fract. Mech. 2015, 145, 128–142. [Google Scholar] [CrossRef] [Green Version]
- Kim, Y.J.; Brunell, G. Interaction between CFRP-repair and initial damage of wide-flange steel beams subjected to three-point bending. Compos. Struct. 2011, 93, 1986–1996. [Google Scholar] [CrossRef]
- Kim, Y.J.; Harries, K.A. Predictive response of notched steel beams repaired with CFRP strips including bond-slip behavior. Int. J. Struct. Stab. Dyn. 2012, 12, 1–21. [Google Scholar] [CrossRef]
- Kadhim, M.M.A. Effect of CFRP plate length strengthening continuous steel beam. Constr. Build. Mater. 2012, 28, 648–652. [Google Scholar] [CrossRef]
- Haeri, H.; Sarfarazi, V.; Zhu, Z.; Hedayat, A.; Nezamabadi, M.F.; Karbala, M. Simulation of crack initiation and propagation in three point bending test using PFC2D. Struct. Eng. Mech. 2018, 66, 453–463. [Google Scholar] [CrossRef]
- Yu, Y.; Chiew, S.; Lee, C. Bond failure of steel beams strengthened with FRP laminates—Part 2: Verification. Compos. Part B Eng. 2011, 42, 1122–1134. [Google Scholar] [CrossRef]
- Abambres, M.; Arruda, M.R. Finite element analysis of steel structures—A review of useful guidelines. Int. J. Struct. Integr. 2016. [Google Scholar] [CrossRef]
- Ulger, T.; Okeil, A.M. Analysis of thin-walled steel beams retrofitted by bonding GFRP stiffeners: Numerical model and investigation of design parameters. Eng. Struct. 2017, 153, 166–179. [Google Scholar] [CrossRef]
- Goncalves, R. An assessment of the lateral-torsional buckling and post-buckling behaviour of steel I-section beams using a geometrically exact beam finite element. Thin-Walled Struct. 2019, 143, 106222. [Google Scholar] [CrossRef]
- Mohammed, A.A.; Manalo, A.C.; Ferdous, W.; Zhuge, Y.; Vijay, P.V.; Alkinani, A.Q.; Fam, A. State-of-the-art of prefabricated FRP composite jackets for structural repair. Eng. Sci. Technol. Int. J. 2020, 23, 1244–1258. [Google Scholar] [CrossRef]
- Ferdous, W.; Manalo, A.; AlAjarmeh, O.; Mohammed, A.A.; Salih, C.; Yu, P.; Khotbehsara, M.M.; Schubel, P. Static behaviour of glass fibre reinforced novel composite sleepers for mainline railway track. Eng. Struct. 2021, 229, 111627. [Google Scholar] [CrossRef]
- Tingley, D.D.; Cooper, S.; Cullen, J. Understanding and overcoming the barriers to structural steel reuse, a UK perspective. J. Clean. Prod. 2017, 148, 642–652. [Google Scholar] [CrossRef]
- Pongiglione, M.; Calderini, C. Material savings through structural steel reuse: A case study in Genoa. Resour. Conserv. Recycl. 2014, 86, 87–92. [Google Scholar] [CrossRef]
- Cervenka, V.; Jendele, L. ATENA Program Documentation—Part 1: Theory, Cervenka Consulting; Červenka Consulting s.r.o.: Prague, Czech Republic, 2012. [Google Scholar]
- Mansour, M.; El-Ariss, B.; El-Maaddawy, T. Effect of Support Conditions on Performance of Continuous Reinforced Concrete Deep Beams. Buildings 2020, 10, 212. [Google Scholar] [CrossRef]
- Alkhalil, J.; El-Maaddawy, T. Finite element modelling and testing of two-span concrete slab strips strengthened by externally-bonded composites and mechanical anchors. Eng. Struct. 2017, 147, 45–61. [Google Scholar] [CrossRef]
Figure 1.
Dimensions of damaged beam specimens.

Figure 2.
Beam test setup.

Figure 3.
Beam specimen instrumentation.

Figure 4.
Failure mode of specimens.

Figure 5.
Experimental applied load–midspan deflection relations.

Figure 6.
Applied load–strain response of specimens.


Figure 7.
Midspan deflection–strain response of specimens.

Figure 8.
ATENA 3D FE model—mesh generation.

Figure 9.
Comparison between test and numerical load–deflection relations of specimens with notch at midspan.
Figure 9.
Comparison between test and numerical load–deflection relations of specimens with notch at midspan.


Figure 10.
Similar failure modes in tests and FE models.


Figure 11.
Numerical applied load–midspan deflection relations.


Figure 12.
Stress distribution with the middle third segment of the beams.

Figure 13.
Strain distribution with the middle third segment of the beams.


Figure 14.
Numerical stiffness–midspan deflection relation of the control beam.

Figure 15.
Numerical stiffness–midspan deflection relations of control and damaged beams.


Table 1.
Typical details of the examined I-beam (W-shape: W 203 × 203 × 46.1).
| Product | Dimensions | ||||||
|---|---|---|---|---|---|---|---|
 Designation Designation | Mass per meter G kg/m | Web height h mm | Flange width b mm | Web thickness tw mm | Flange thickness tf mm | Root radius r mm | |
| Inch × inch × lbs/ft | mm × mm × kg/m | ||||||
| W 8 × 8 × 31 | W 203 × 203 × 46.1 | 46.1 | 203 | 203 | 7.2 | 11.0 | 10 |
Table 2.
Test matrix—specimen categorizing.
| Set (Location of Notch) * | Notch Depth (mm) | Specimen ** |
|---|---|---|
| C | 0 | C-NG-0 |
| Q | 30 | Q-S-30 |
| 40 | Q-S-40 | |
| 60 | Q-S-60 | |
| T | 30 | T-S-30 |
| 40 | T-S-40 | |
| 60 | T-S-60 | |
| M | 30 | M-S-30 |
| 40 | M-S-40 | |
| 60 | M-S-60 | |
| MD | 30 | M-D-30 |
| MD | 40 | M-D-40 |
* Location of notch: C = control specimen; Q = notch at quarter of specimen length; T = notch at one-third of specimen length; M = notch in middle of specimen; S = single notch on one edge of tension flange; D = double notches on both edges of tension flange. ** NG-0 = zero groove/notch; specimen example: QS-30 = single notch 30 mm depth on one edge of tension flange at quarter of specimen length; TS-40 = single notch 40 mm depth on one edge of tension flange at one-third of specimen length; MD-40 = double notches 40 mm depth on both edges of tension flange in the middle of specimen.
Publisher’s Note: MDPI stays neutral with regard to jurisdictional claims in published maps and institutional affiliations. |
© 2021 by the authors. Licensee MDPI, Basel, Switzerland. This article is an open access article distributed under the terms and conditions of the Creative Commons Attribution (CC BY) license (https://creativecommons.org/licenses/by/4.0/).
Share and Cite
MDPI and ACS Style
El-Ariss, B.; Elkholy, S. Feasibility of Reusing Damaged Steel Beams in Temporary Structures. Infrastructures 2021, 6, 69. https://0-doi-org.brum.beds.ac.uk/10.3390/infrastructures6050069
AMA Style
El-Ariss B, Elkholy S. Feasibility of Reusing Damaged Steel Beams in Temporary Structures. Infrastructures. 2021; 6(5):69. https://0-doi-org.brum.beds.ac.uk/10.3390/infrastructures6050069
Chicago/Turabian StyleEl-Ariss, Bilal, and Said Elkholy. 2021. "Feasibility of Reusing Damaged Steel Beams in Temporary Structures" Infrastructures 6, no. 5: 69. https://0-doi-org.brum.beds.ac.uk/10.3390/infrastructures6050069