1. Introduction
The first Italian airports were born in the first decades of the last century: they were built for military needs. Those infrastructures were just a large leveled circular area, lawned estate, where airplanes took off or landed in the most favorable wind direction. Over the years, elliptical shapes first and tricuspid hypocycloids then were adopted to minimize the fields’ surfaces. Moreover, the increasing aircraft size and weight and the greater demand for resistance to chemical agents (e.g., fuels and anti-freezers) [
1] determined the final transition from airfields to paved runways [
2]. The Italian Air Force (IAF) designed the first paved runway in 1927 to bear the increasing movements of heavy aircraft. Only in 1938 were paved runways of IAF conceived for operational reasons, in order to guarantee flight operations during rainy periods. Since the Second World War, new airport pavement design methods and construction technologies have been studied to face the dynamic and static stresses induced by aircraft. At present, most of the operative military Italian airports (15) derive from structures built between 1945 and 1975, when the most important changes in performance and payload (e.g., transition from engines to jets) of military aircraft occurred. Runways built during the War or post-War period were composed of concrete slabs on a granular not crushed base layer. With the transition to jets, these runways were lengthened, widened, and, with the exception of the thresholds, covered with asphalt [
3]. Concrete thresholds were resistant to attack by fuel and chemicals, while asphalt ensured regular paved surfaces, without joints [
4]. On the other hand, runways built in the 60s and 70s were composed of three bituminous layers on a stabilized subbase, while the thresholds were composed of rigid pavements. Nowadays military runways have flexible or semi-rigid pavements because of their simple building process and low construction costs, while thresholds and parking areas are composed of rigid pavements to prevent rutting and chemical damages [
5].
The large experience of the IAF has helped to collect data on design, construction, and maintenance of runways over more than 80 years. With regard to concrete pavements, Jointed Plain Concrete Pavements (JPCP) without dowel and tie bars are the most frequent solution because of simple and rapid execution, lower cost than other concrete solutions (the presence of bars involves an increase in expenditure varying from 8% to 20%, while a continuous reinforcement involves a higher initial expense of 50% or more) [
6], good monitored performances [
7,
8,
9,
10,
11], and simple maintenance works [
12,
13], the latter with potential applications to other facilities, where regular maintenance might lag behind [
14,
15,
16]. The absence of reinforcement requires a double foundation layer: a bottom one composed of a granular mixture and a top one composed of a cement-stabilized mixture. Finally, when high traffic volumes are expected, the experience gained with JPCP solution without bars suggests compensating for the absence of bars with a slab thickness increase or with a cement-treated base layer [
17].
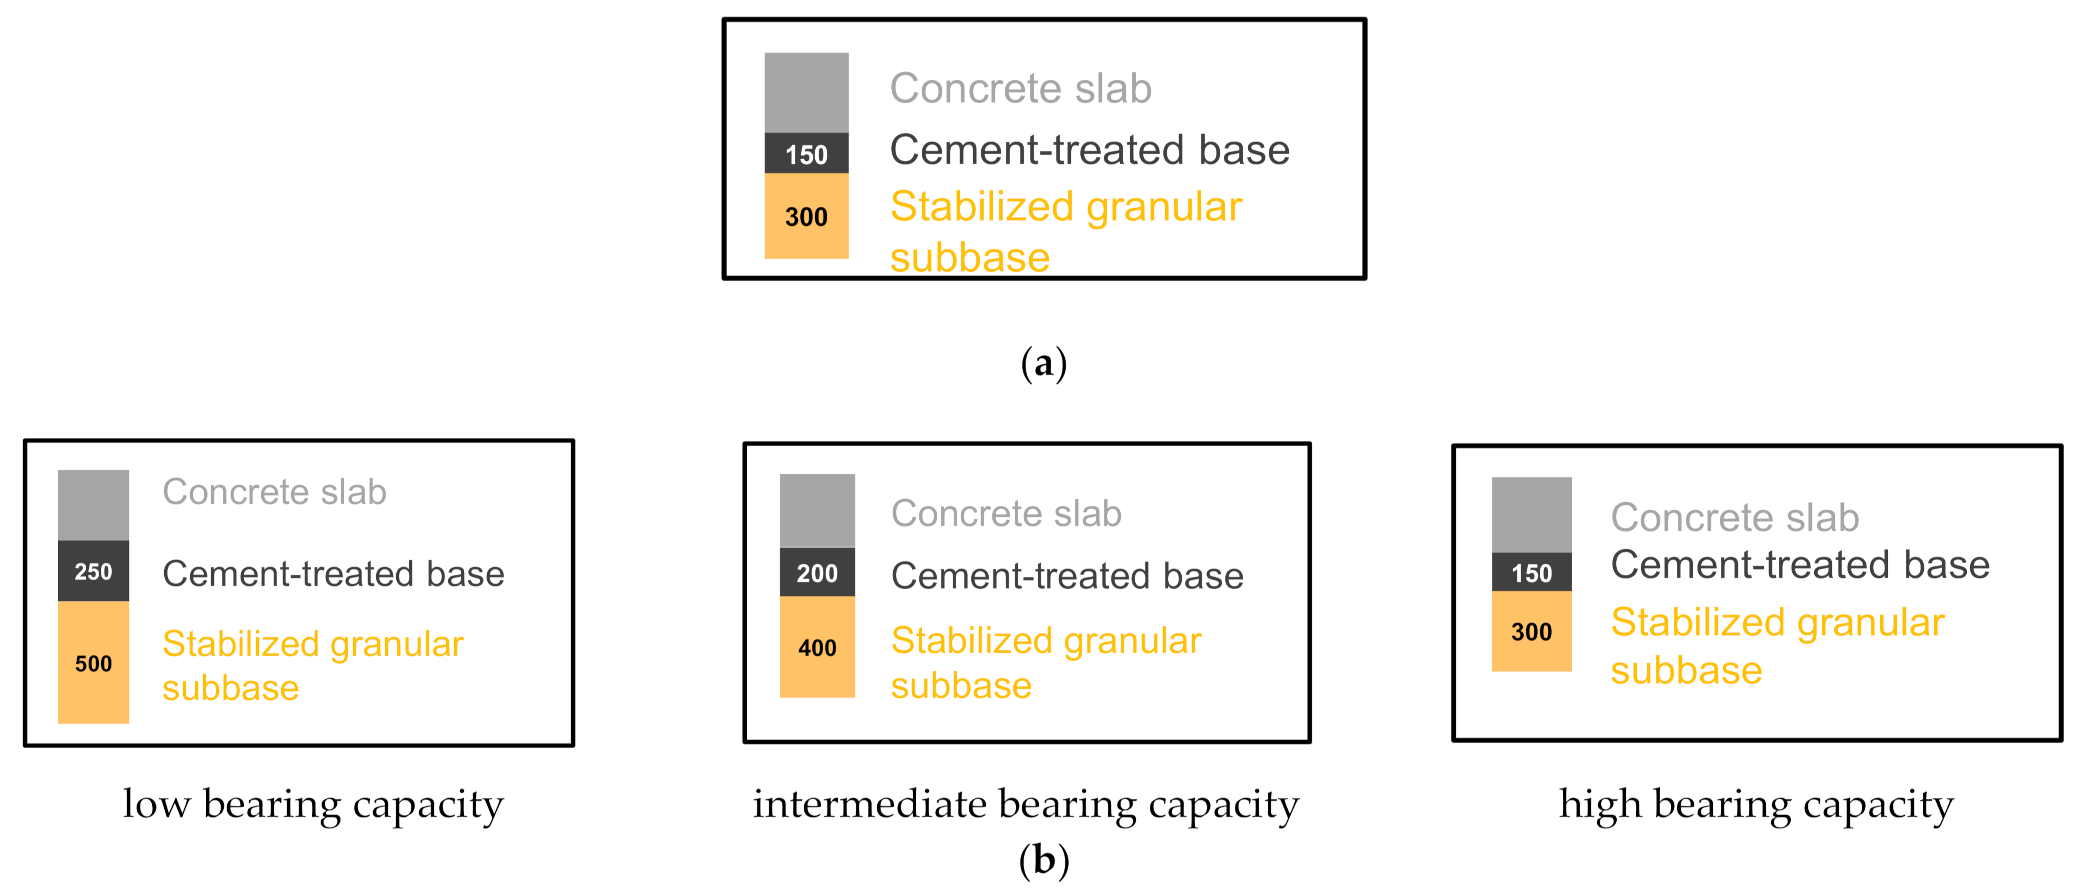
In the present study, a catalogue of airport pavements is presented. A three-layer pavement is considered (subbase, base, and concrete slab) and two different approaches were followed to design and verify a set of solutions:
to keep constant the thickness of the two deeper layers (30 cm for the granular layer and 15 cm for the cement-bound layer) (
Figure 1a);
to vary the thickness of the bottom layers. This second approach provides three pairs of different thicknesses for the bottom layers as the bearing capacity of the subgrade varies: 50 cm and 25 cm for low bearing capacity, 40 cm and 20 cm for intermediate bearing capacity, and 30 cm and 15 cm for high bearing capacity, for the granular and cement-bound layer, respectively (
Figure 1b). This approach aims to evaluate the most convenient pavement given the bearing capacity and the number of movements.
The design of the rigid pavements was carried out with the software FAARFIELD 1.42 (Federal Aviation Administration Rigid and Flexible Iterative Elastic Layered Design) [
18]. It exploits the Finite Element Method (FEM) to calculate the stresses and strains and performs the fatigue analysis considering the number of coverages of the design airplane [
19]. Each solution was verified by the Westergaard theory [
20]. Altogether, the paper proposes several pavement sets to constitute a catalogue considering twenty traffic volumes and seven subgrade load bearing capacity values. Finally, the construction costs of each verified pavement were calculated varying the construction method (i.e., construction by slipform paver or by a fixed form and labor-oriented method of paving). The results of this study answer the need of a faster and easier analysis procedure than the FEM approach that could be used to design block pavements.
2. Data and Methods
In order to analyze a runway pavement, the input data about traffic, reference service life, subgrade load bearing capacity, and performance of materials should be considered [
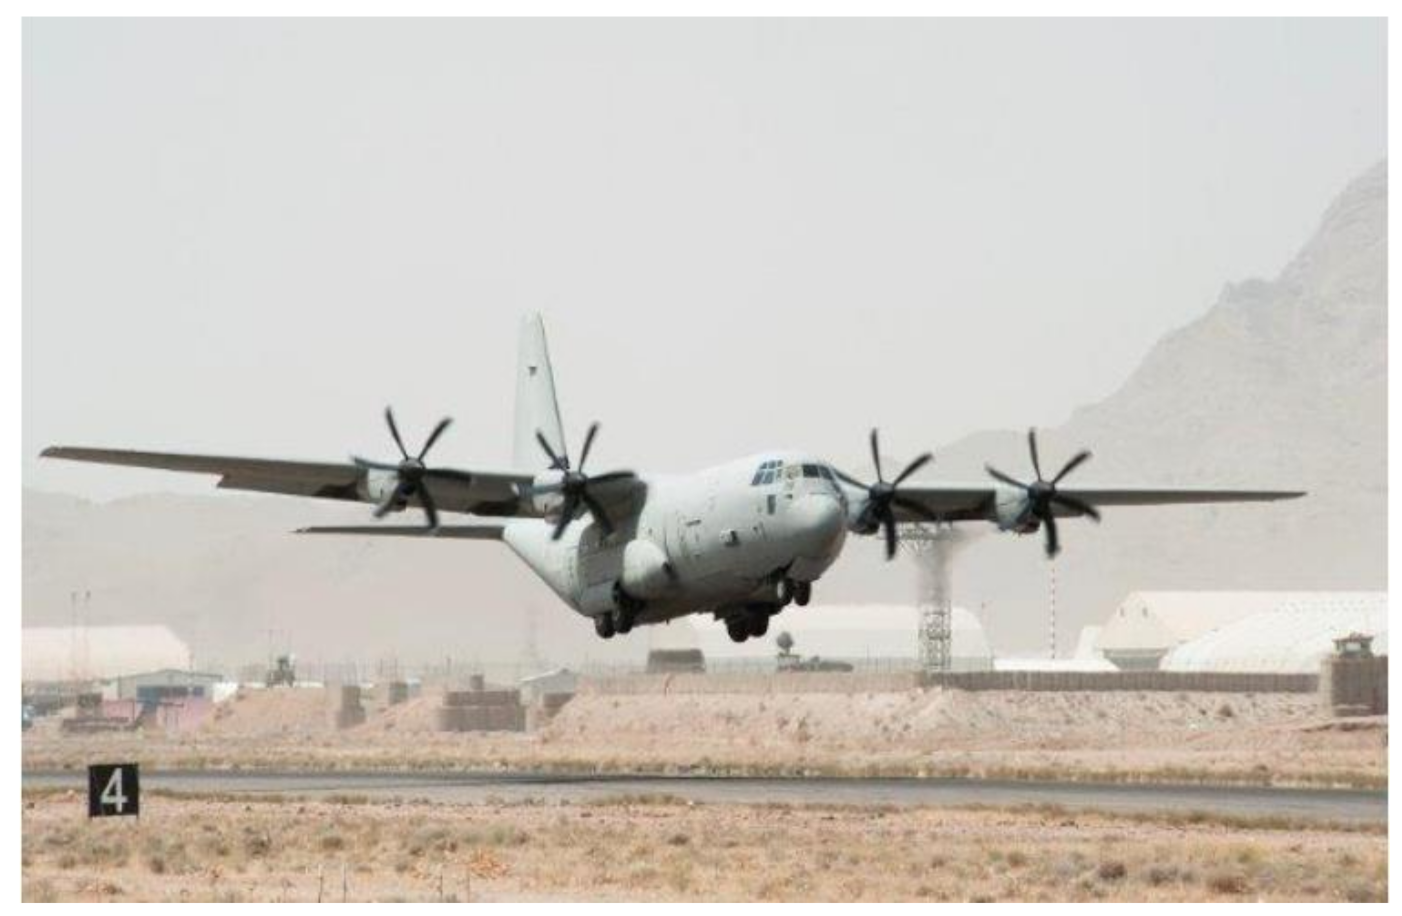
21]. In this study, the reference aircraft is the four-engine turboprop C-130J Hercules (Lockheed Martin, Bethesda, MD, USA), used by the Italian Air Force for civil and military operations (
Figure 2). It can operate in 13 of the operative military Italian airports.
Its load distribution at landing is 5% on the front gear and 95% on the rear one; the other characteristics are listed in
Table 1.
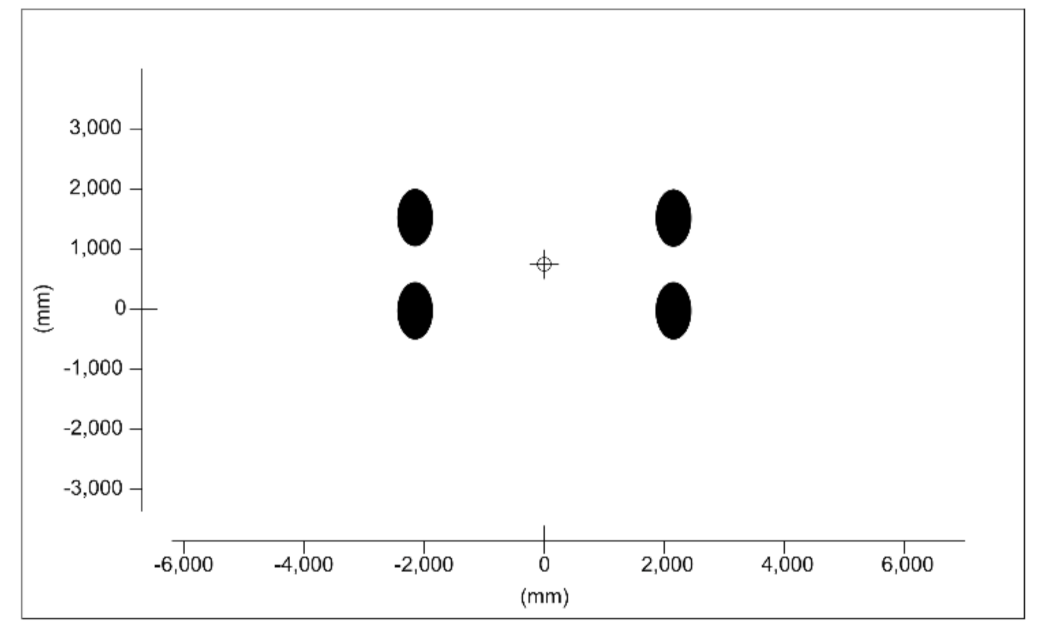
Figure 3 shows the layout of the main landing gears of C-130J: it is a tandem with two single wheels.
In this study, the reference service life was 20 years according to the NATO Approved Criteria and Standards for Airfields [
22]; 20 traffic levels were considered to define the catalogue: they range between 500 and 10,000 take-offs, in steps of 500.
The load bearing capacity of the subgrade is defined by means of the California Bearing Ratio (CBR) [
23] and the equivalent reaction module k is calculated according to Equation (1) [
18], where k is in MPa/m.
In this study, CBR varies between 2.5% and 20% (therefore, k ranges between 15.9 and 64.2 MPa/m); this range was divided into 7 sub-intervals of amplitude equal to 2.5%. The lower value of CBR (i.e., 2.5%) is a limit value under which a subgrade stabilization is necessary before building the pavement. The upper value of CBR (i.e., 20%) is assumed as the maximum constant value during the year, when the soil water content varies.
With regard to the materials of the pavement layers,
Table 2,
Table 3,
Table 4 and
Table 5 list their threshold values and reference standards.
Granular stabilized mix should have not less than 80% CBR in the laboratory, performed on samples compliant with [
33]. Moreover, the liquid limit W
L should be less than 25%; IP should be equal to zero.
Cement used in cement-bound subbase should comply with EN 197-1 [
34]; water should comply with EN 1008:2002 [
35] (
Table 6).
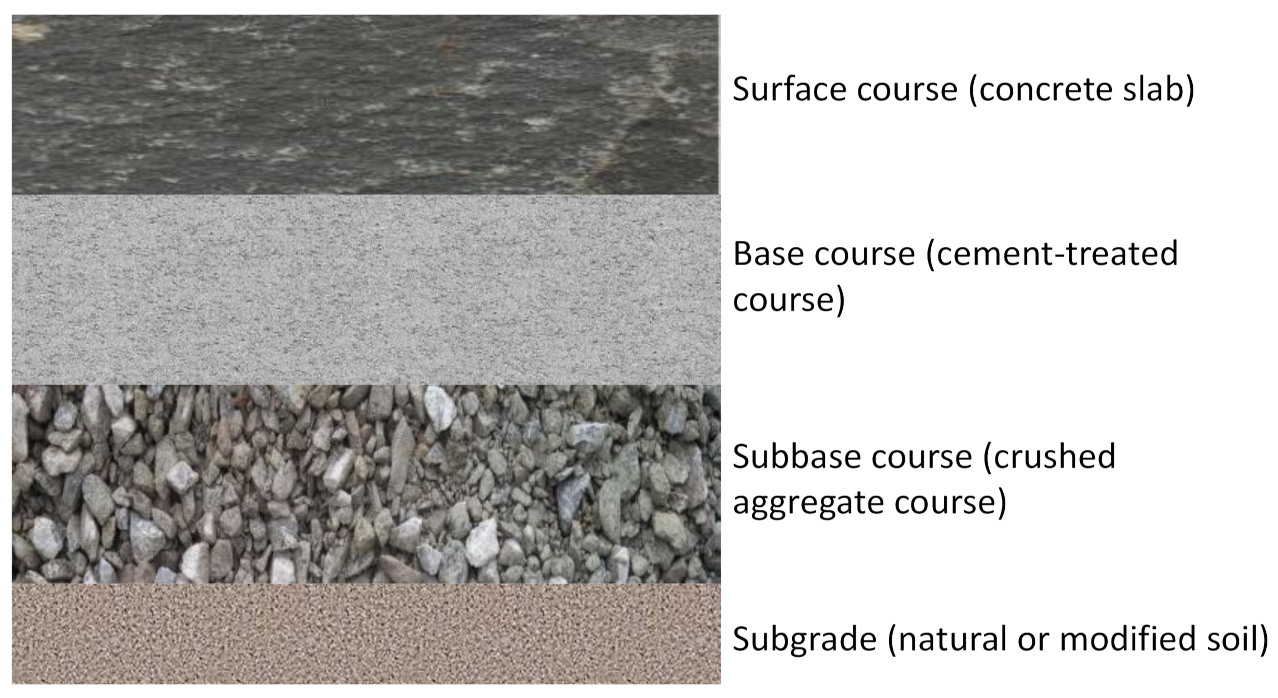
The software FAARFIELD 1.42 was used to design the JPCP pavements: they have a 4-layer structure composed of subgrade, subbase course, base course, and surface course (
Figure 4).
According to AC 150/5370-10G [
38], each JPCP layer should satisfy a minimum thickness value for technical reasons (
Table 7).
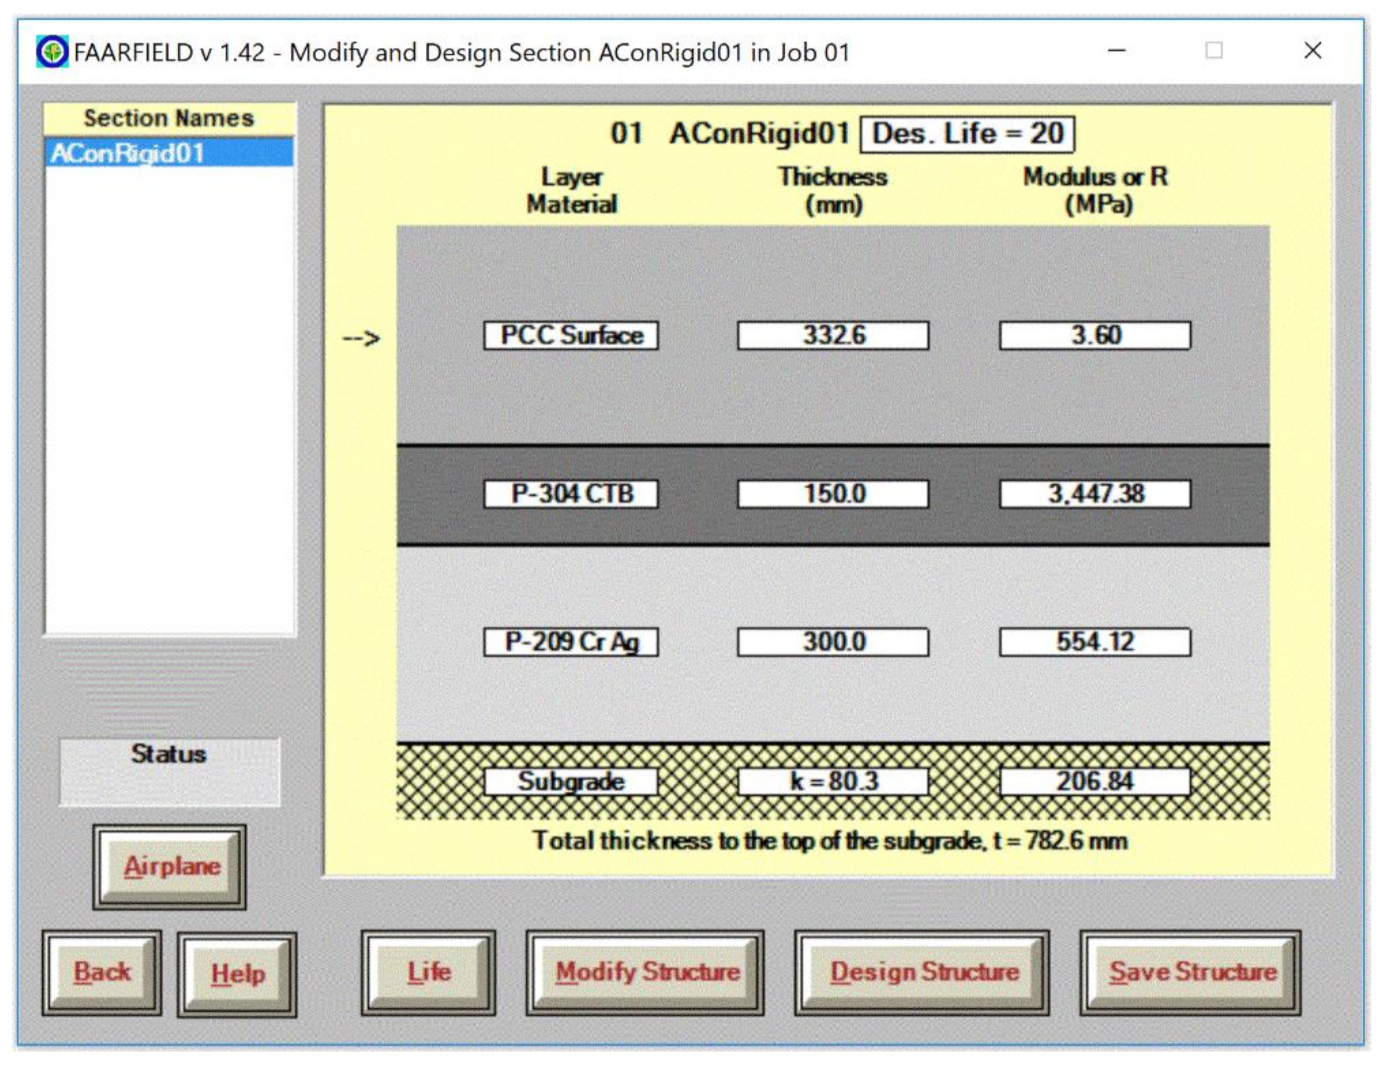
FAARFIELD permits setting of the value of k, the number of years of the service life, and the traffic mix (
Figure 5).
The value of the Young's modulus of base and subbase layers is automatically set according to the selected materials, while it is possible to define the Modulus of rupture (MOR) of the concrete according to EN 12390-5 [
39]. The concrete mix considered in this study is grade C 35/45 [
40], with MOR at 28 days not less than 4.1 MPa. Details about concrete mix proportion used for mechanized laying are listed in
Table 8.
After inputting all the required data, the software provides the thicknesses of the 3 layers over the subgrade. Although not modeled in FAARFIELD 1.42 [
18], a geosynthetic sheet underlay was provided to avoid contamination of the subbase layers with fine material of the subgrade [
18]. Finally, the results from FAARFIELD were verified using the Westergaard theory [
20]: the maximum tensile stresses at the bottom of the slab for a load at the interior and at the edge of slab or at the top of the slab for a load at the corner were compared to MOR [
41]. Finally, construction costs of each catalogued pavement were calculated using national price lists [
42], regional price lists [
43,
44] and price lists provided by experience of the 8th Gruppo Genio Campale. Unit prices were implemented in the VBA code “Economic Sustainability of Concrete pavement” developed by the authors [
45]. The initial construction costs of the pavement, including overheads and business profits, were evaluated, while costs for earthworks and subgrade compaction were overlooked. All input variables were compliant with the values adopted by IAF: they were derived from datasets and bills of quantities of realized pavement projects. Three construction methodologies were considered: manual installation with fixed formwork, laying with an owned slipform, and laying with rented an slipform. Manual and mechanized laying differ for the hourly production (10 m
3/h vs. 18 m
3/h, respectively) and for the required labor (9 vs. 5 workers, respectively).
3. Results
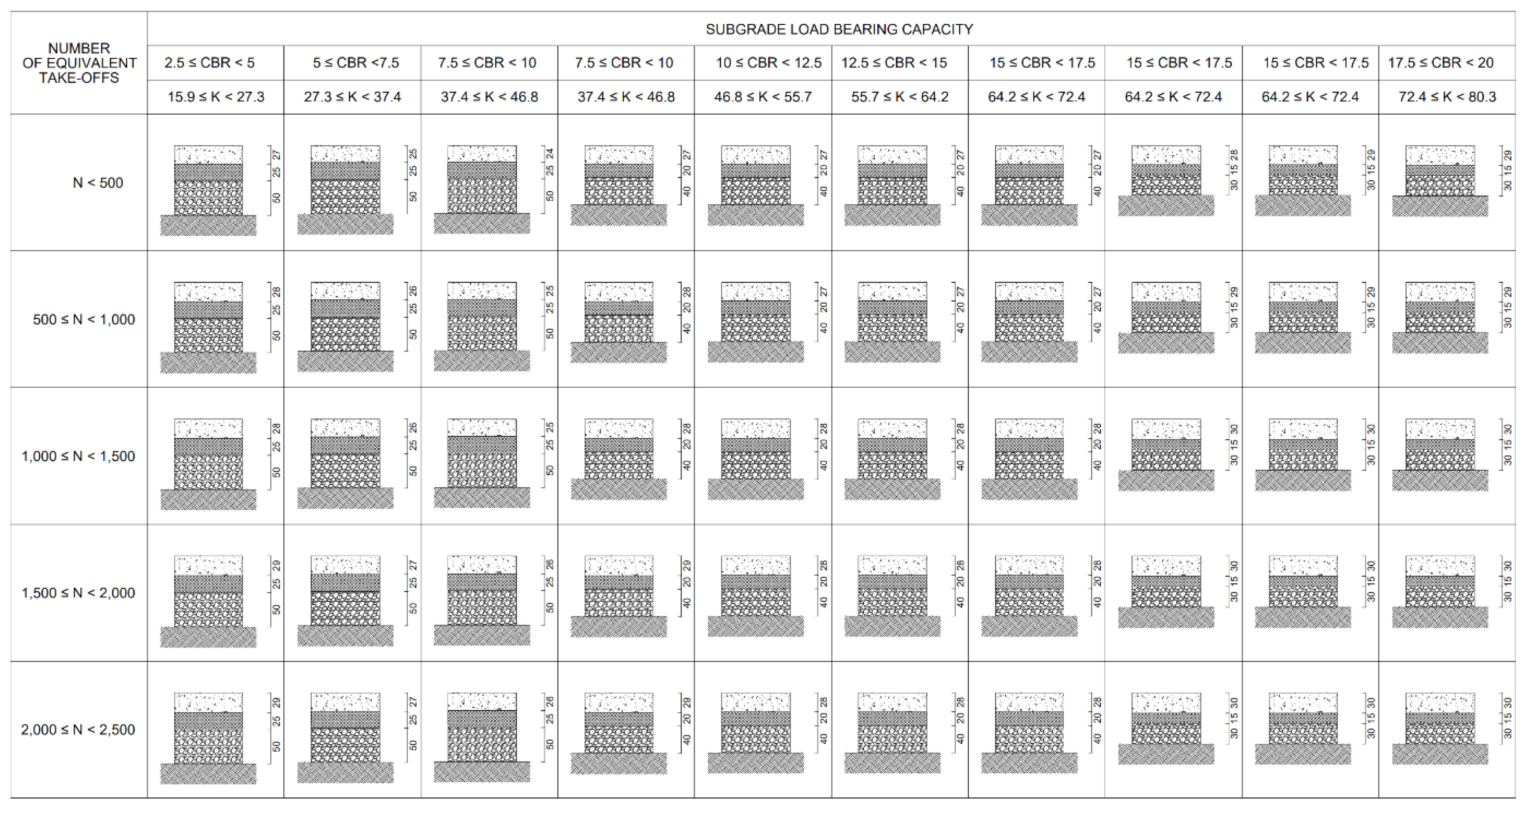
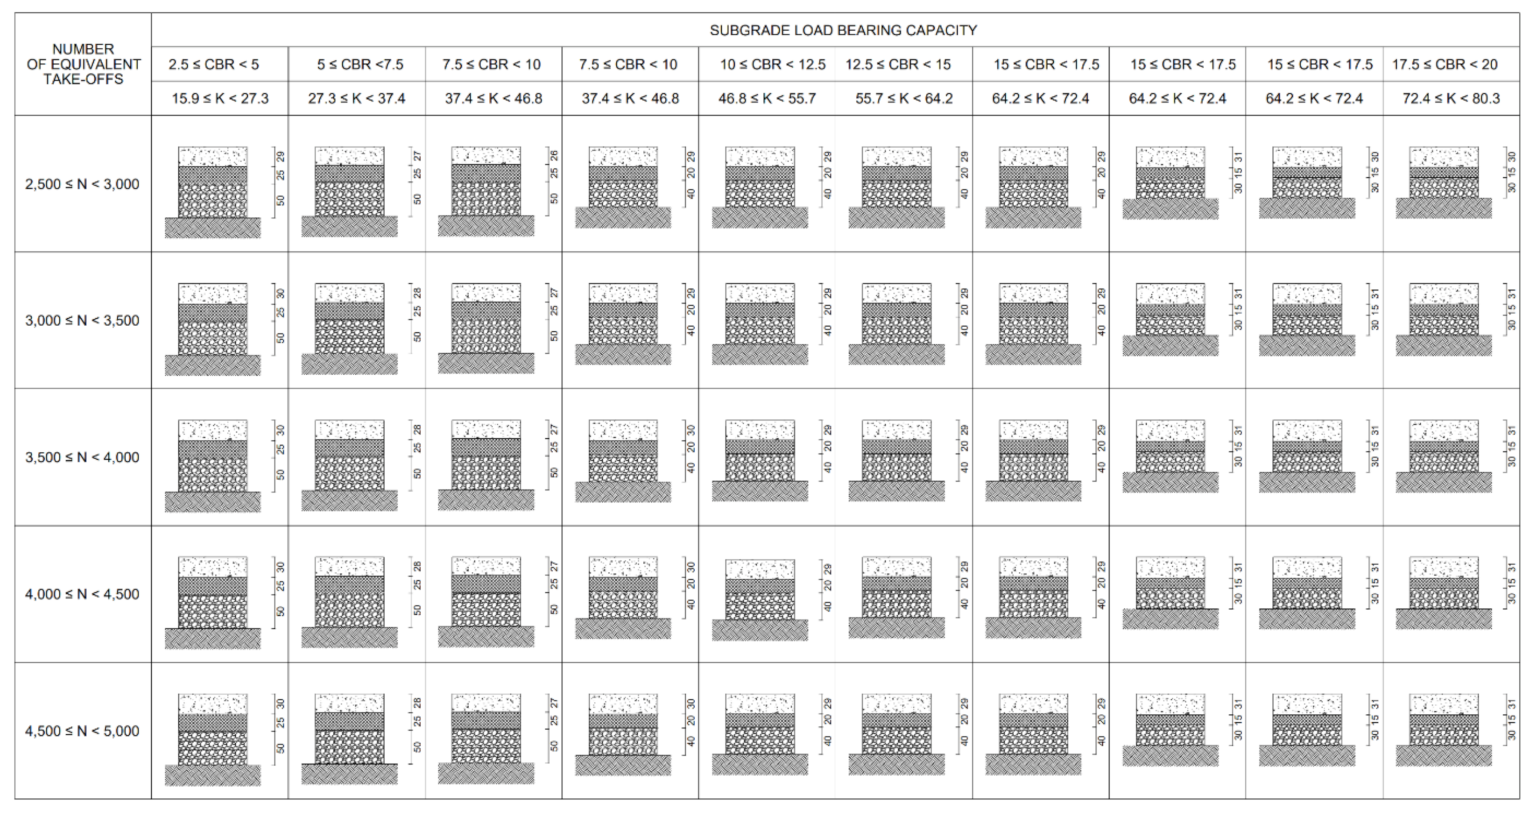
Figure 6,
Figure 7,
Figure 8 and
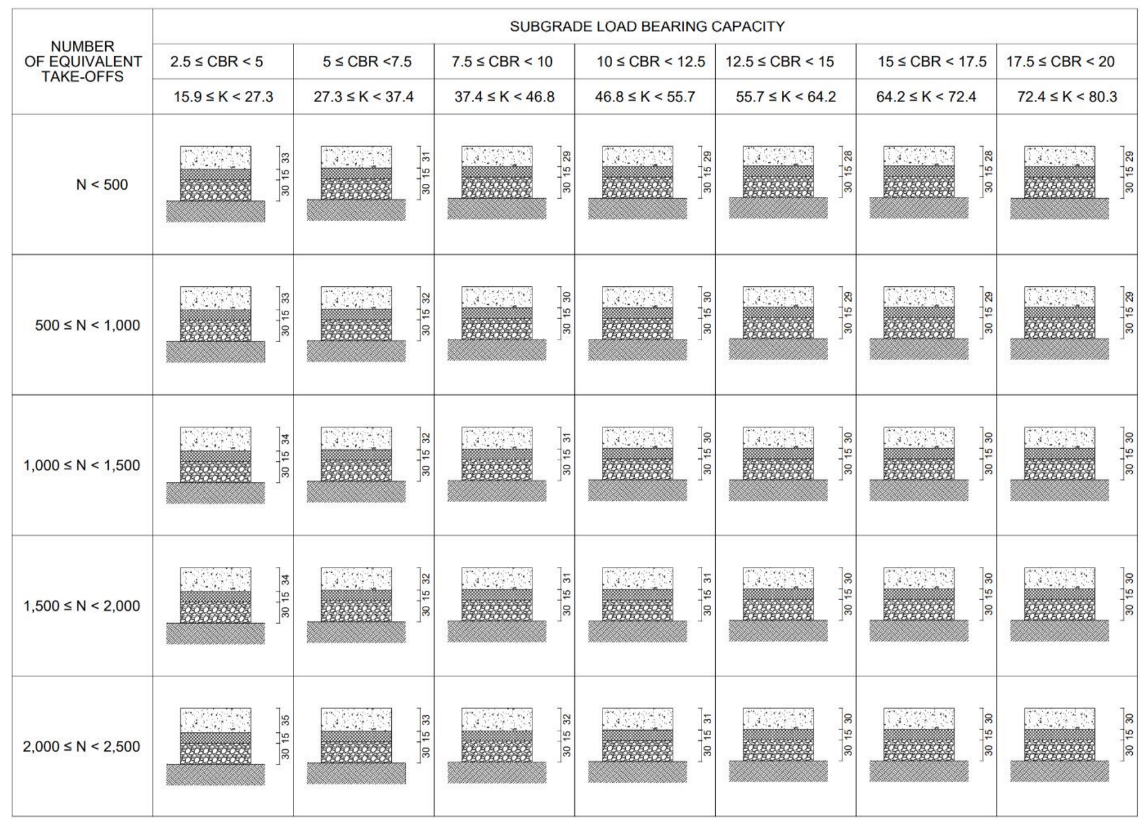
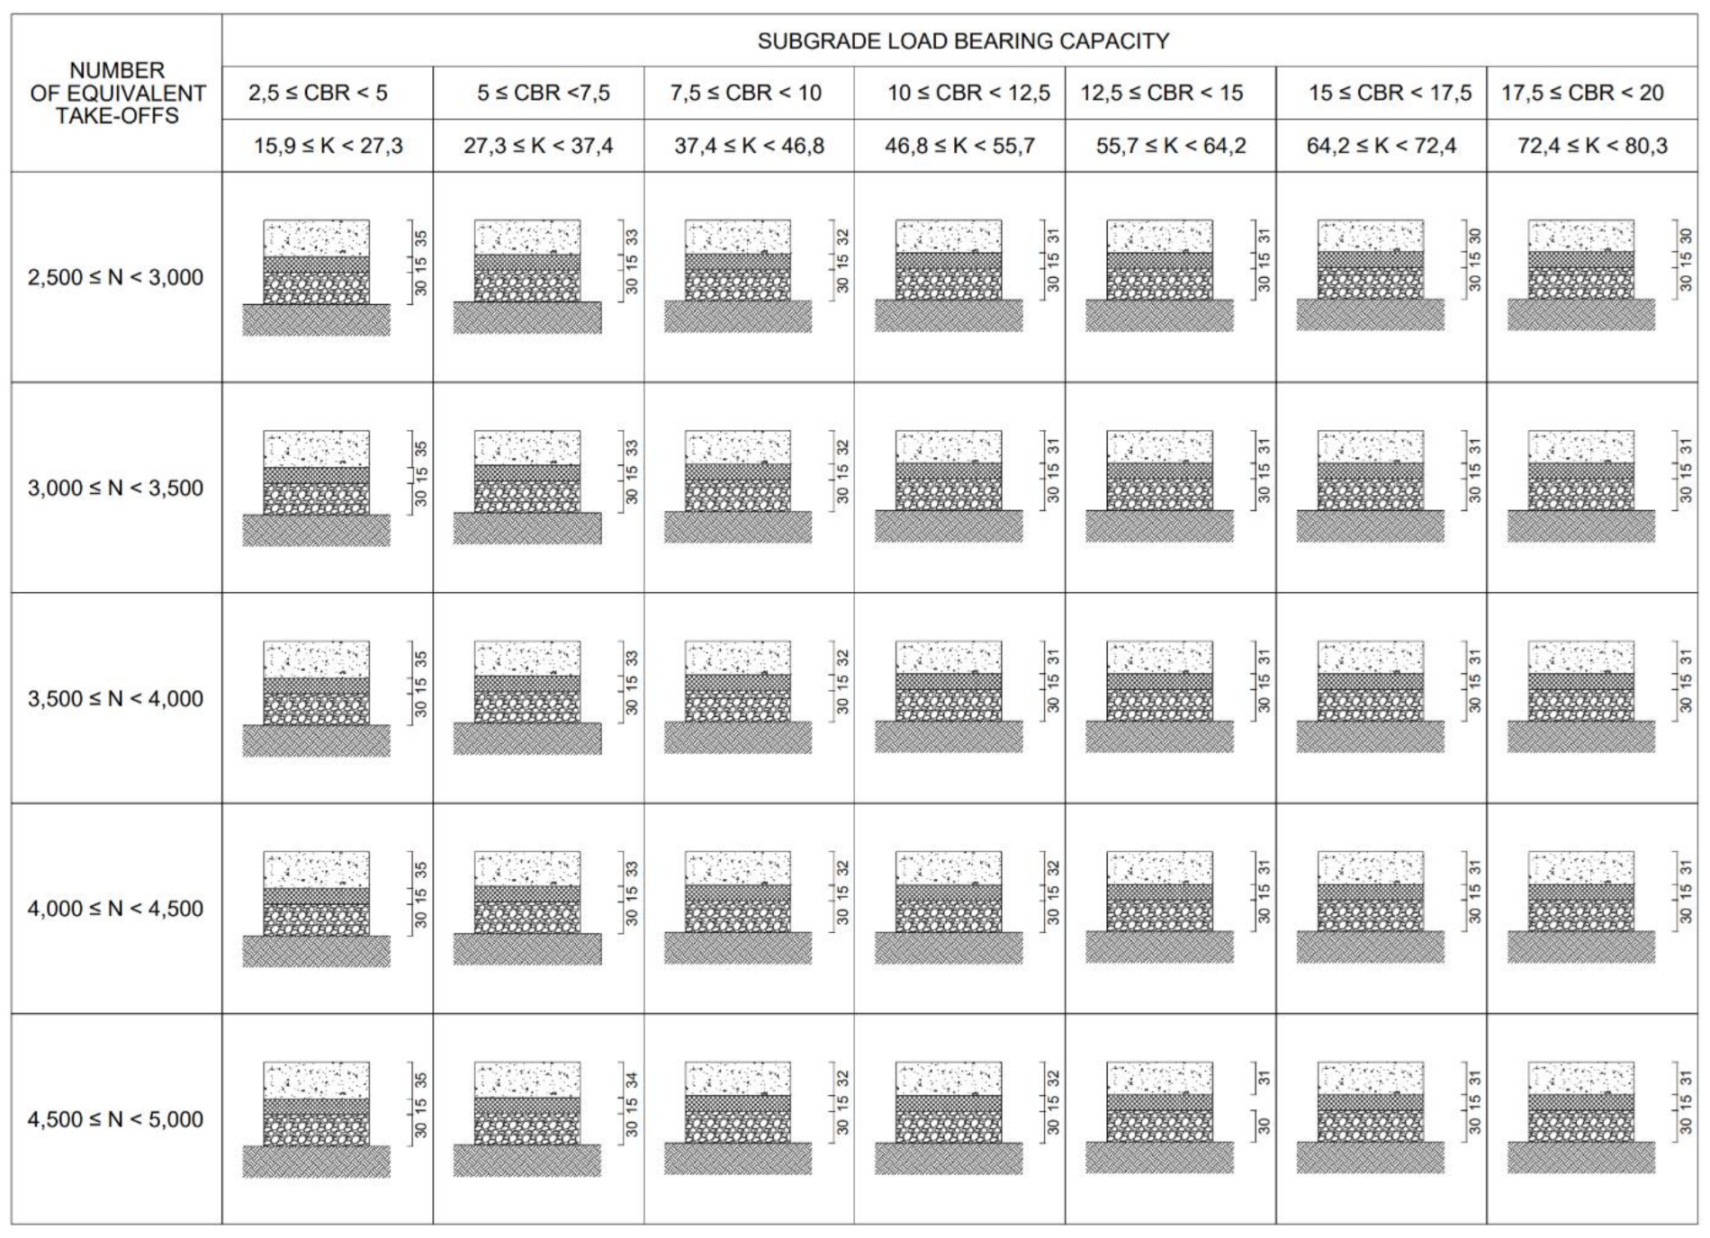
Figure 9 show the verified JPCP pavements composed of 4 m wide × 4 m long slabs built with a characteristic cube compressive strength (R
ck) of concrete equal to 45 MPa (MOR ≥ 4.1 MPa); different input data regarding load bearing capacity and number or repetitions during the service life were considered.
Data from
Figure 6 and
Figure 7 permit deepening knowledge of how the subgrade load bearing capacity and the number of movements affect the thickness of the concrete slabs (
Table 9) for constant values of MR (i.e., 4.1 MPa) and thickness of the bottom layers (i.e., base and subbase). The cells’ color in
Table 9 varies from green to red for increasing concrete thickness.
For a constant value of CBR, the slab thickness increases from 33 cm (N equal to 500) to 36 cm (N equal to 10,000) for CBR equal to 2.5% and from 29 cm (N equal to 500) to 32 cm (N equal to 10,000) for CBR equal to 20%. Therefore, the percentage increase in the slab thickness is 9.1% and 10.3%, respectively. For a constant number of repetitions and increasing CBR (from 2.5% to 20%), the percentage decrease in the slab thickness is 9.1% (N equal to 500) and 11.1% (N equal to 10,000). Since the maximum number of repetitions examined in the study is 20 times more than the minimum one, and the maximum CBR is 8 times more than the minimum one, it is possible to conclude that under the hypotheses of this study the subgrade load bearing capacity affects the slab thickness more than the traffic volume.
Data from
Figure 8 and
Figure 9 permit to deepening of knowledge of how the subgrade load bearing capacity and the number of movements affect the thickness of the concrete slabs (
Table 10) for constant values of MR (i.e., 4.1 MPa) and variable thickness of the bottom layers (i.e., subbase and base equal to 50 cm and 25 cm for CBR between 2.5% and 10%; 40 cm and 20 cm for CBR between 7.5% and 17.5%; 30 cm and 15 cm for CBR between 15% and 20%). The cells’ color in
Table 10 complies with that in
Table 9.
In
Table 9 and
Table 10, the slab thickness tends to increase against CBR increase for low traffic volumes because the tensile stress under the traffic load depends on the radius of relative stiffness
l (Equation (2))
where
E is the Young’s modulus of the slab,
h is the slab thickness,
ν is the Poisson’s ratio for concrete,
q is the modulus of reaction of the base layer. Since base and subbase layers increase k according to [
46], the (constant) maximum allowable load stress according to [
20] implies a trend of h that is not monotonous to verify the slab (Equation (3)). Indeed,
h affects the tensile stress (
σC) in the bottom surface of a slab loaded at the interior and away from all the edges:
where
P is the applied load and
b is the equivalent radius of the resisting section.
The approach of variable thickness of the bottom layer has relevant effects on the slab thickness. For a low subgrade load baring capacity (i.e., CBR between 2.5% and 7.5%), the comparison of the results in
Table 10 and
Table 9 highlights the reduction in the slab thickness for constant
N values. In particular, doubling the number of repetitions from 500 to 1000 the percentage increase in the slab thickness is 3.7%, while doubling CBR the percentage decrease in the slab thickness is 7.4%: the base bearing capacity affects the slab thickness more than the traffic volume. This effect is reduced increasing the CBR and reducing the thickness of the bottom layers (e.g., for CBR between 7.5% and 15% and
N equal to 500 the slab thickness does not vary, while when doubling
N it increases from 27 cm to 28 cm). For high CBR values, the trend of slab thickness is opposite to that observed for low CBR values. Therefore, the technical results are needed for the economic analysis of construction costs of the pavements in
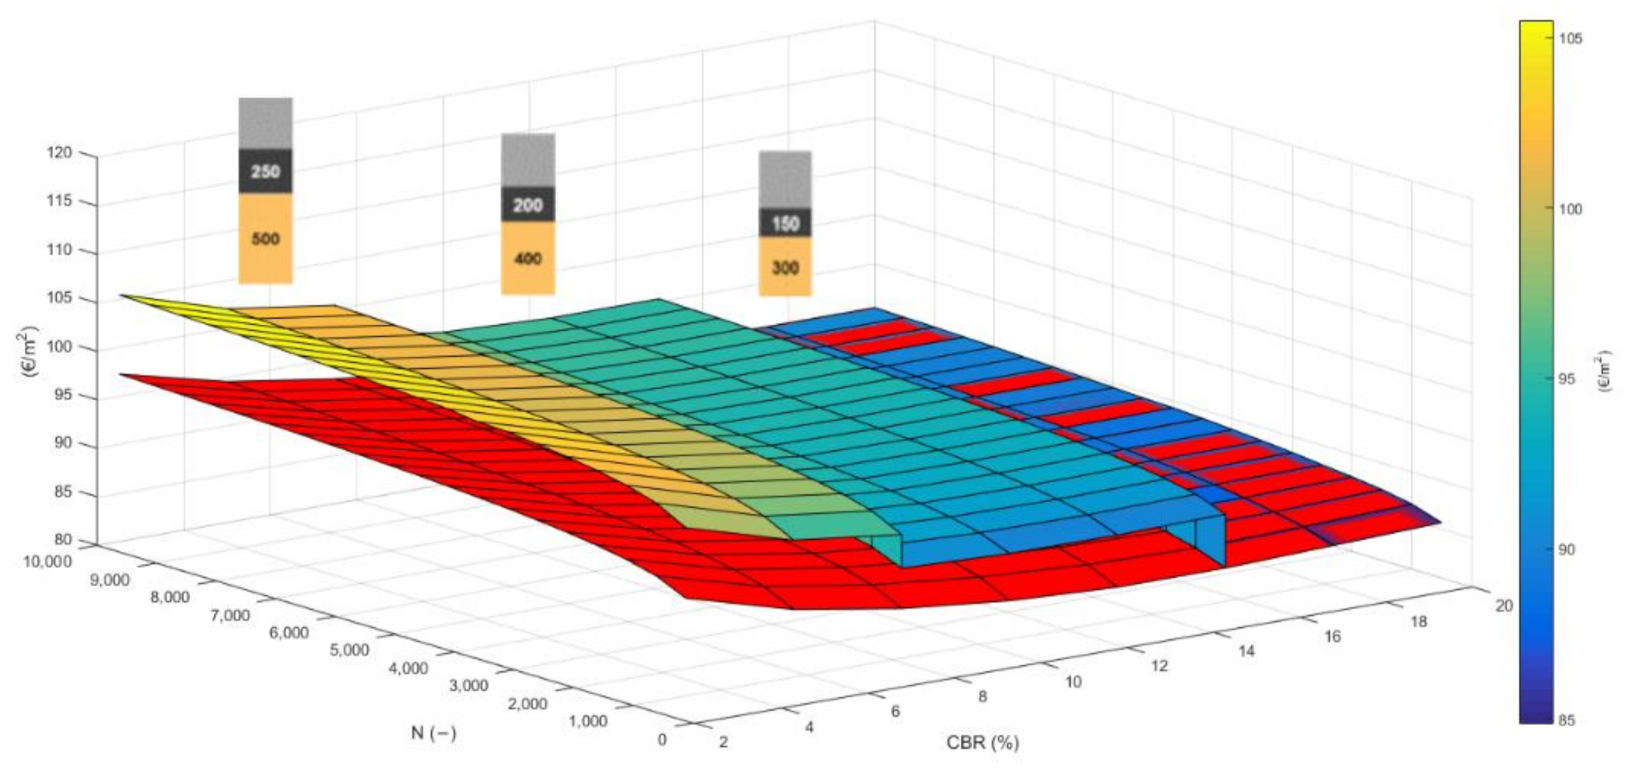
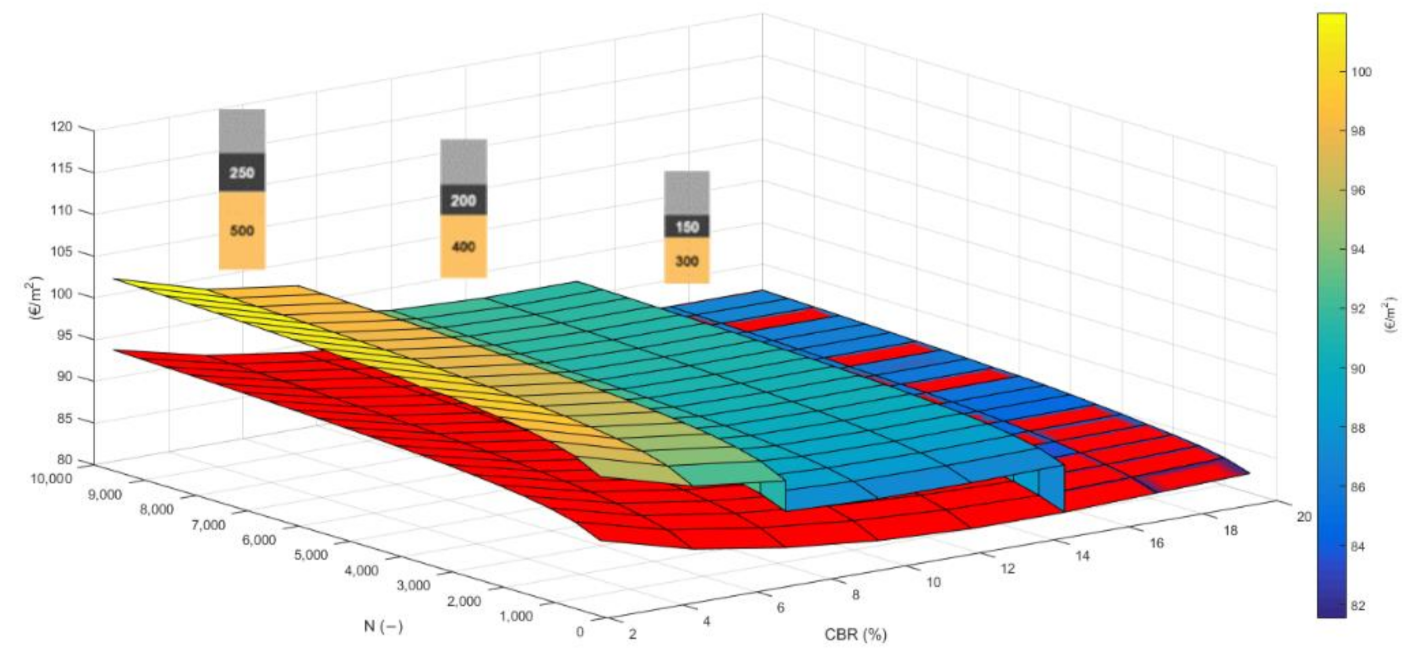
Figure 6,
Figure 7,
Figure 8 and
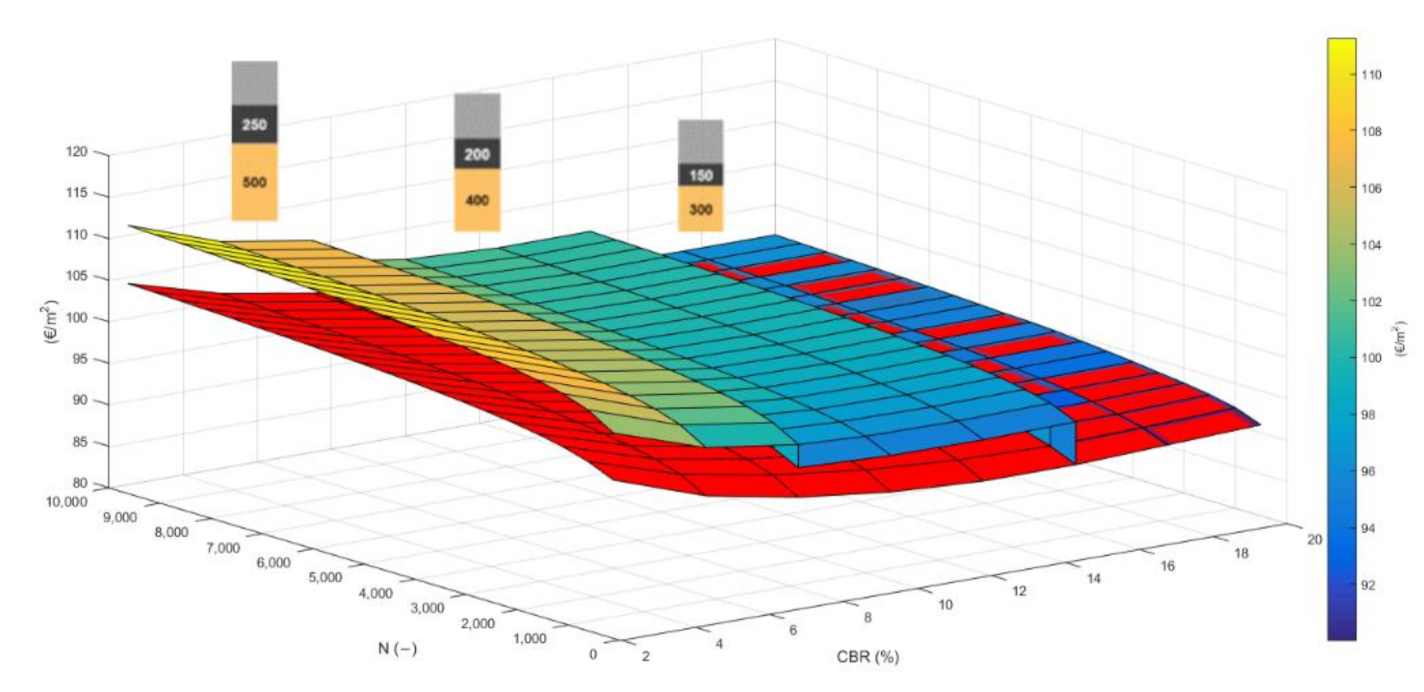
Figure 9 in order to identify the best strategies. In
Figure 10,
Figure 11 and
Figure 12 the red surface represents costs of the first scenario (i.e., constant thickness of the two deeper layers), while the blue to yellow surface refers to the second scenario (i.e., variable thickness of the bottom layers).
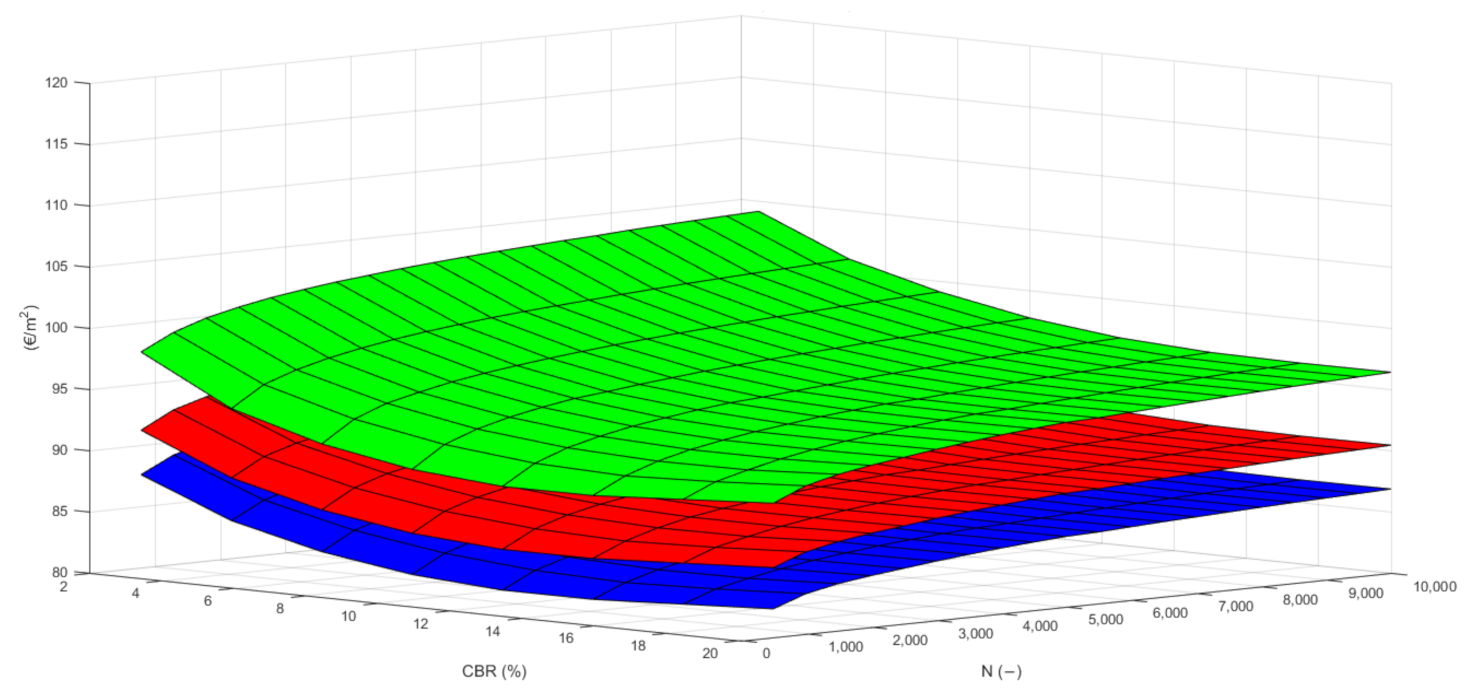
In all the designed structures, pavements with 30 cm-thick mixed subbase and 15 cm-thick cement treated base layer are cheaper than those with variable thickness of the bottom layers. Another benefit of the "fixed foundation" is the speed of execution because the laying of thinner layers is faster and easier. In regard to the construction methodology, the use of an owned slip form paver turns out to be cheaper (
Figure 13: green surface for laying with a rented slip form, red surface for manual laying, and blue surface for an owned slip form).
Table 11 lists the construction costs calculated for pavements of scenario 1: they refer to the pavement structures listed in
Table 9.
Figure 13 and
Table 11 show that using an owned slipform (blue surface) ensures the lower construction costs than manual (red surface) or mechanical laying with a rented slipform (green surface). However, the pavement manager should consider a more complex asset allocation in order to decide on this long-term investment considering its internal rate of return [
47].
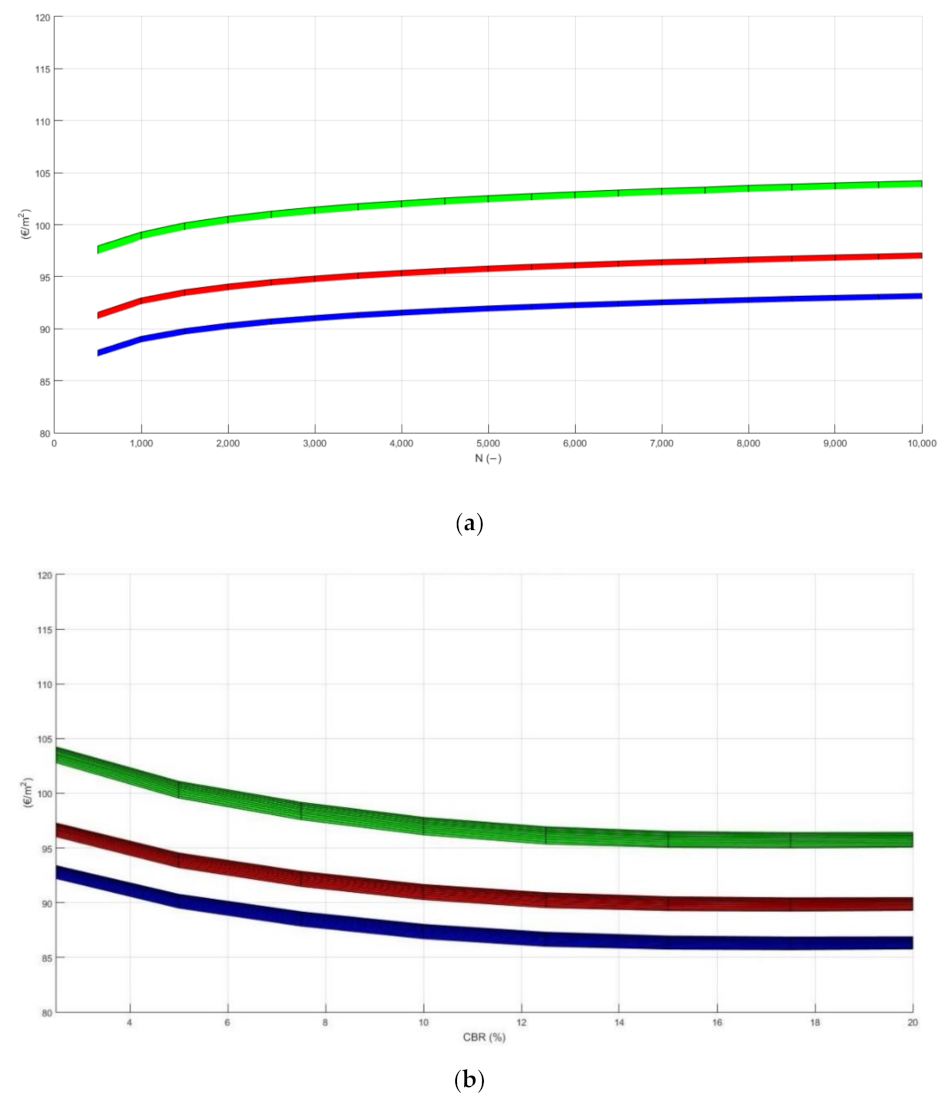
Figure 14a and
Figure 14b show the construction costs depending on the number of repetitions when CBR is equal to 2.5% and on the CBR value when
N is equal to 5000, respectively. Their colors comply with those of
Figure 13 (i.e., green for laying with a rented slipform, red for manual laying, and blue for laying with an owned slipform).
Finally, the construction costs for scenario 2 (variable thickness of the bottom layer) were compared.
Table 12 lists the results: given a slab thickness value, each cost refers to all the pairs of CBR and
N in
Table 10.
In regard to the economic questions, input data refer to Italian unit prices, but the relative percentage differences between the examined solutions could give preliminary answers to non-Italian airport pavement managers.
4. Discussion
The results of the study are useful to draw up a technical–economic feasibility study [
48,
49] for a new airport JPCP. Given the design traffic mix and the characteristics of the aircraft that will operate in the 20-year service life, it is possible for each
i-th airplane to derive the number
N of take-offs equivalent to the design of the aircraft (i.e., C-130J in this study), using Equation (4):
where
TCEQi is the number of take-offs of the
i-th airplane equivalent to those of the design airplane;
TCi is the number of take-offs of the
i-th airplane;
M is the number of wheels on each leg of the main landing gear of the airplane design;
Ni is the number of wheels on each leg of the main landing gear of the
i-th airplane;
W is the maximum weight on the single wheel on each leg of the main landing gear of the airplane design;
Wi is the maximum weight on the single wheel on each leg of the main landing gear of the
i-th airplane.
Once the equivalent number of take-offs for each individual aircraft has been calculated, it is possible to obtain the equivalent number of take-offs
N which permits identification of one of the twenty traffic levels provided in the proposed catalogue (Equation (5)).
Therefore, the obtained results can be implemented in feasibility studies to solve structural and economic issues regarding an airport JPCP, as currently happens for road pavements [
50].
Finally, the findings of this study could be useful for the evaluation of existing airfield pavements that satisfy one of the proposed solutions. Indeed, the proposed catalogue can be used to evaluate the residual life of an old pavement. Given the pavement structure and the subgrade CBR, the number of repetitions of C130J is obtained. If the traffic volume on the pavement in the past is known, it could be evaluated in terms of number of take-offs of C-130J according to Equation 4, and the residual traffic can be estimated. This approach is valid even when the existing structure is not listed in the catalogue: the interpolation between the provided solutions allows estimation of the traffic. On the other hand, as already mentioned, the catalogue can be used only in feasibility studies and for a quick evaluation of the pavement. In the final design phases, traffic must be estimated with a more rigorous calculation method.
5. Conclusions
Most of the Italian military airports derive their structures from concrete pavements built in the post-War period. These structures have been designed, laid and managed all over the State, under different conditions of subgrade bearing capacity, mechanical characteristics of materials, traffic mix, traffic volume during the service life. However, a practical design tool for jointed plain concrete pavements without tie and dowel bars is lacking.
On that basis, the paper presents a catalogue for airport JPCP composed of concrete slabs laid on a cement-treated base and a stabilized granular subbase designed with the software FAARFIELD 1.42 and verified according to the Westergaard theory. All data input about materials and traffic comply with the experience gained by the Italian Air Force. Seven load bearing capacity values (i.e., CBR between 2.5% and 20%), twenty traffic levels (i.e., number of repetitions during the service life between 500 and 10,000), and two scenarios (i.e., constant or variable thickness of the two subbase layers) are examined in the first part of the study to design 170 pavements. The construction costs of each solution are calculated according to the Italian price lists and compared considering three methodologies to pave the concrete slabs (i.e., using a rent slipform paver, using an owned slipform paver, or fixed form). Whatever the methodology adopted to lay the concrete slabs, the construction costs of the first scenario are less than those of the second scenario (e.g., for CBR = 2.5% and N = 500 the construction costs are: 99.41 EUR/m2, 93.08 EUR/m2, and 89.38 EUR/m2 for a rented slipform, fixed form, and an owned form in the first scenario; 104.76 EUR/m2, 99.83 EUR/m2, and 96.55 EUR/m2 for a rented slipform, fixed form, and an owned form in the second scenario).
The results are valid for a single aircraft (i.e., turboprop C-130J), but it is possible to adapt them to a different and non-homogeneous traffic mix. Therefore, both the structural and economic results are interesting and useful, since they provide an inexpensive guide for the preliminary design of JPCP to be laid in airports. Indeed, the proposed catalogue could be used under different conditions because it can be used with different input data (i.e., subgrade bearing capacity, airplane design, traffic mix, construction procedures). The proposed solution could be a valid instrument for design in feasibility studies, when the airport pavement manager should compare different strategies and identify the best option.


 ,
, 


