
The Role of Climate Change in the Assessment of the Seismic Resilience of Infrastructures


Department of Civil and Environmental Engineering, University of Auckland, 20 Symonds Street, Auckland 1010, New Zealand
Infrastructures 2021, 6(5), 76; https://0-doi-org.brum.beds.ac.uk/10.3390/infrastructures6050076
Submission received: 1 February 2021
/
Revised: 11 February 2021
/
Accepted: 20 February 2021
/
Published: 18 May 2021
(This article belongs to the Special Issue Resilience of Infrastructures to Natural Hazards)
Abstract
:Climate change is modifying scientific attitudes toward pre- and post-event assessments of natural hazards. Unprecedented levels of destruction need renewed focus on addressing and protecting communities forcing the decision makers to change their attention to vulnerability and risk assessment. In particular, society and economy rely heavily on infrastructures, as fundamental links for movement of goods and people, and are extremely vulnerable to multiple hazards (such as droughts, floods, storms, and coastal hazards). In this regard, resilience quantifies the recovery time and procedures to facilitate and enhance pre-hazard and post-hazard event mitigation and emergency response strategies of systems and entire communities. Resilience calculation depends on two important contributions: loss and recovery models that need to consider the effects of climate change. This paper aims to propose a methodology that implements the most recent approaches to assess climate change inside the traditional framework of resilience. The proposed framework is then applied to a case study of a bridge.
1. Introduction
System vulnerability to natural hazards is an interesting topic in scientific literature, with many recent contributions (e.g., [1,2,3,4]). In particular, many risk-based frameworks were developed to assess long-term effects (such as deterioration and life-cycle loads) considering the opportunity to include the effects of climate change which impacts multi-sectors, such as the environment, civil structures and infrastructures, biology and economy. In this regard, [5] summarized the state of the art on cost assessment methods for natural hazards (NHs), by proposing the EU project “Costs of Natural Hazards” (CONHAZ) (from February 2010 to January 2012) that considered several NHs and different sectors. Extensive literature (summarized in [6]) proposed adaptation plans (i.e., [7,8,9]), some focused on multiple social, environmental, organisational, and conceptual with integrated [10,11] and holistic approaches [12,13], including uncertainties [14].
The main contributions that studied the impacts of climate change concentrated on hurricanes. For example, [15] studied the impact of climate change with scenario-based analyses to explore the cost effectiveness of various adaptation strategies. Ref. [16] investigated repair cost evaluations for several future climate scenarios and examined a statistical model to study hurricanes in the Atlantic Ocean. Recently, the authors of [17] applied artificial neural networks to estimate the economic losses in the Southeastern US coastal regions (encompassing eight states from Texas to North Carolina). They proposed predictions to forecast future hurricanes to assess different climate change scenarios: current climate conditions, near-term projection, and long-term projection.
In the past, climate damage functions (CDF) have been adopted in global-scale climate impact analyses (e.g., [18,19]) to estimate the relationship between environmental variables (i.e., temperature change) and the magnitude of sectoral damages [20]. In particular, Ref. [21] showed significant relationships between the global mean temperature increase above the 1961–1990 levels and the predictions of global-scale impacts in 2050 by considering selected indicators. CDF were also used for the estimations (e.g., [22,23,24]) of the social cost of carbon and damages due to climate change [25,26,27,28]. Moreover, estimations of climate damage generally focus on temperature-denominated CDF (by estimating damages per unit of temperature change) since temperature is closely correlated with other climate stressors (e.g., changes in precipitation and extreme events). For example, [29] proposed specific temperature thresholds to perform damage estimates within a climate policy framework. In additions, some recent studies focused on the assessment of seismic fragility and vulnerability of structures following mechanical (i.e., [30]) and empirical (i.e., [31]) approaches.
The present paper aims to move from these previous contributions by proposing a novel approach based on resilience that has been applied in civil engineering to assess the seismic vulnerability of structures and infrastructures. In particular, the paper aims to extend the well-credited definition proposed by [32] to include the long-term effects due to climate change. The ultimate objective is to predict how the change of specific environmental variables will impact on the resilience, as a parameter to define the vulnerability to natural hazards. In this regard, the paper shows a formulation that may be applied in long-term assessments that can be useful by several stakeholders, such as public administrators, infrastructure owners, or other decision makers. This paper proposes to include climate change effects inside the resilience framework in order to calculate the increase of losses as an evolutionary process that depends on one selected environmental variable. The multi-dimensional nature of resilience and the easy-to-read results will allow to perform the proposed methodology for applications in many disciplines, such as environmental sciences, civil engineering, and economy.
2. Methodology
Resilience is a well-credited concept currently applied to perform multi-dimensional risk assessment. Multiple definitions of resilience have been proposed since [33] defined resilience as "the capacity to cope with unanticipated dangers after they have become manifest, learning to bounce back." During the following decade the concept became more specific and [34] considered that resilience is "the buffer capacity or the ability to a system to absorb perturbation, or magnitude of disturbance that can be absorbed before a system changes its structure by changing the variables." A similar definition that extended the application of resilience to "individuals, group and organisations, and systems" was also proposed by [35]. The definition of resilience started to include the issue of recovery and [36] defined resilience as "the ability of an individual or organisation to expeditiously design and implement positive adaptive behaviours matched to the immediate situation, while enduring minimal stress." Another definition was given by [37] who considered the possibility of an "amount of assistance from outside the community." The authors of [38] extended the concept of resilience to "the capacity to adapt existing resources and skills to new systems and operating conditions." The authors of [39] described resilience as "an active process of self-righting, learned resourcefulness and growth the ability to function psychologically at a level far greater than expected given the individual’s capabilities and previous experiences" and thus extending considerably the original definition of resilience by referring to individuals. In the early 2000s, other definitions were proposed (i.e., [40,41,42]) and a more inclusive definition was developed in [43] that considered resilience as "the capacity of a system, community or society potentially exposed to hazards to adapt, by resisting or changing in order to reach and maintain an acceptable level of functioning and structure. This is determined by the degree to which the social system is capable of organising itself to increase this capacity for learning from past disasters for better future protection and to improve risk reduction measures." It is worth noting the importance given to the social dimension and the role of learning from the past and future protection actions. Ref. [44] proposed an inter-related concept of resilience that considers technical, organizational, social and economic dimensions and it may assess the performance of critical systems (i.e., electric power, water, road infrastructures, and critical structures) and the social and economic dimensions of communities. Later, [32,45] developed a mathematical formulation that assesses the level of functionality or performance by including recovery time [32,45,46,47], as the period necessary to restore the functionality of the system to a desired level. This paper follows the theoretical formulation of resilience proposed by [32] that allows to calculate quantitatively resilience of a system subjected to an event at a specific time (t0e):
where
- t0E is the time of occurrence of the event E,
- RT is the repair time (or recovery time) necessary to restore the functionality,
- Q(t) is the recovery function that quantifies the recovery process to return to the pre-event level of functionality.
Resilience is graphically designed as the normalized shaded area underneath the recovery function Q(t) and thus its quantification is based on the definition of Q(t) functions and depends on two important contributions [48,49]: (1) A loss model is necessary to assess the reduction of functionality due to the impact of natural hazards in correspondence with the time of occurrence. Risk assessments require probabilistic-based approaches to consider all the possible damage and failure scenarios. (2) A recovery model describes a series of events, actions, or changes to enhance the capacity of an affected system or a community, when faced with singular, multiple, or unique shocks and stresses. Recovery functions are essential for evaluating resilience but influenced by many variables, time and spatial dimension with disparities among different geographic areas, in the same community or state and showing different rates and quality of recovery.
When climate change is considered, it affects both previous models. (1) Loss model needs to consider the role of climate change in modifying the damage of the systems. In particular, models of damage may be described by the existing CDF [25,26] and defined in terms of a specific environmental variable (i.e., temperature) and consequently losses need to be assessed from these models. (2) Recovery model describes at every step of the considered environmental variable, the repair time TR and the final functionality (QE) that the system will recover at the repair time. These quantities depend on the way the community preparedness and available resources are affected by climate change.
Therefore, the proposed methodology aims to introduce a dependency on the environmental variable inside the definition of recovery functions. In this regard, resilience may be extended to climate change as:
where
is the environmental variable (EV) for describing the climate change,
and are the EVs at the beginning and at the end of the considered period of time (intended as an evolutionary process).
The paper considers the temperature as the reference environmental variable for assessing the role of climate change on resilience.
3. Recovery Model (RM)
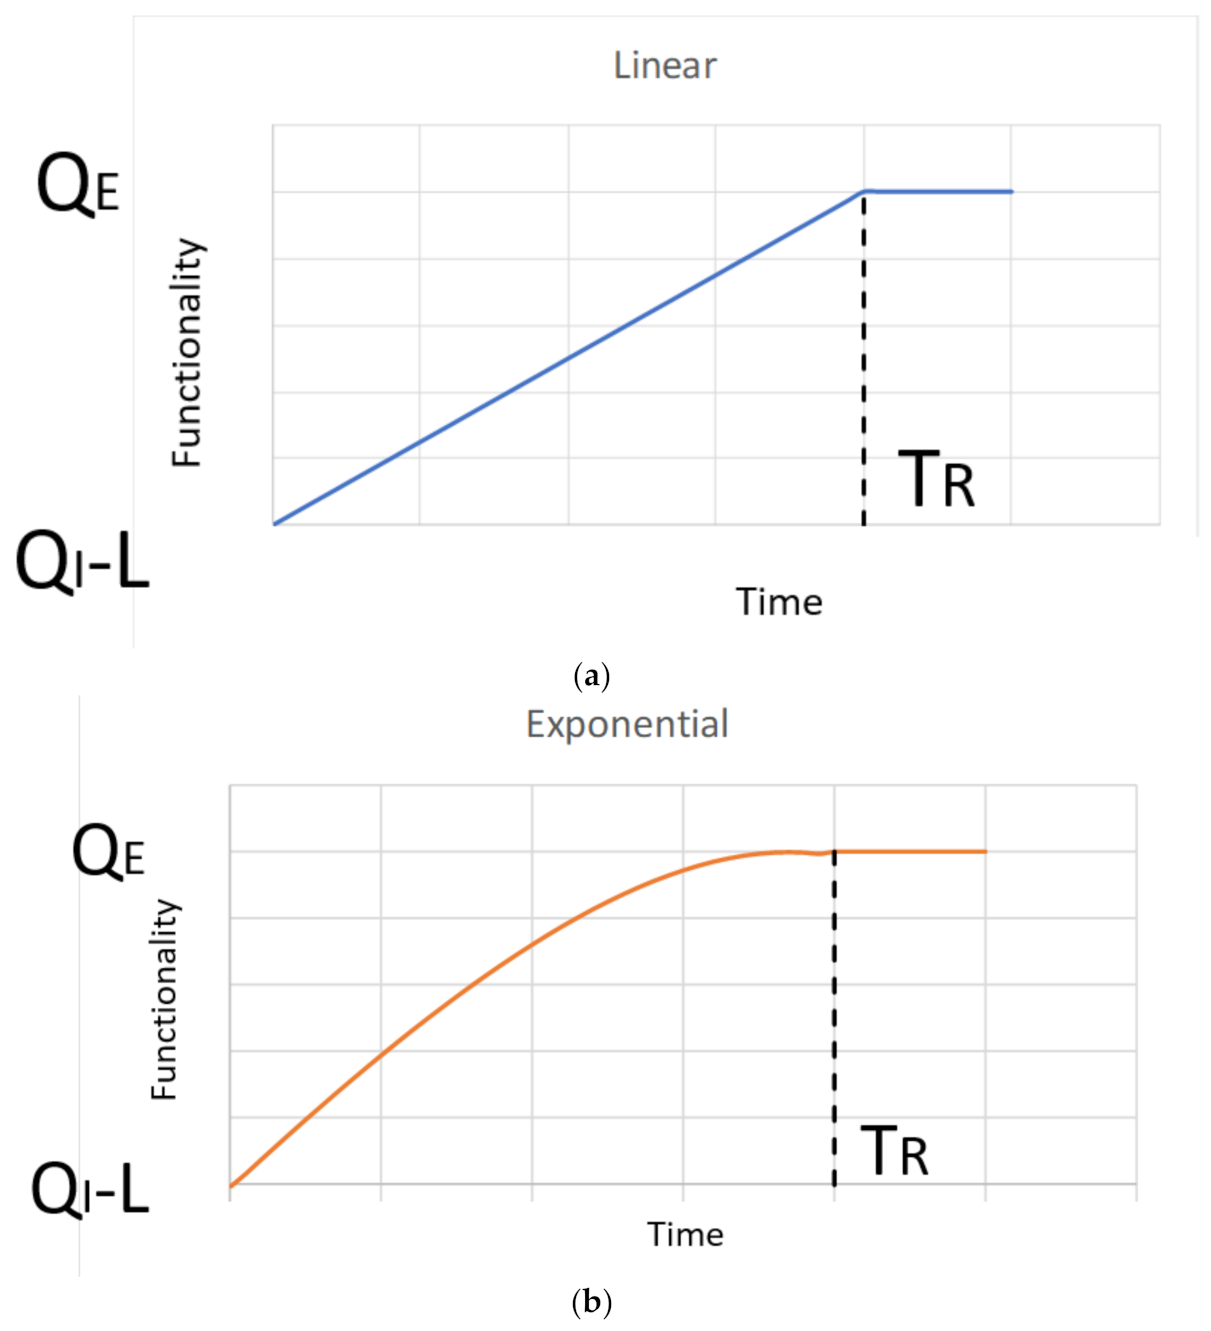
Recovery model presents disparities among different geographic areas in the same community or state, showing different rates and quality of recovery. Different types of recovery functions (shown in Figure 1) can be selected depending on the system and society preparedness response and this paper investigates the three possible recovery functions proposed in the literature: linear, exponential [50], and trigonometric [51]. Therefore:
Linear:
Exponential:
Trigonometric:
that satisfy two conditions: (1) Q = QI − L (for t = 0) and (2) Q = QE (for t = TR)
and where
- QI is the initial functionality at t0;
- QE is the final functionality at the end of the recovery process and that the system will recover at the repair time;
- L is total loss that determinates the level of functionality due to the NH and the first point of the recovery function (at the occurrence time t0E).
It is worth noting that QI, QE, and L are described as functions of the EV but constant during the recovery process, following the original assumptions made by [32].
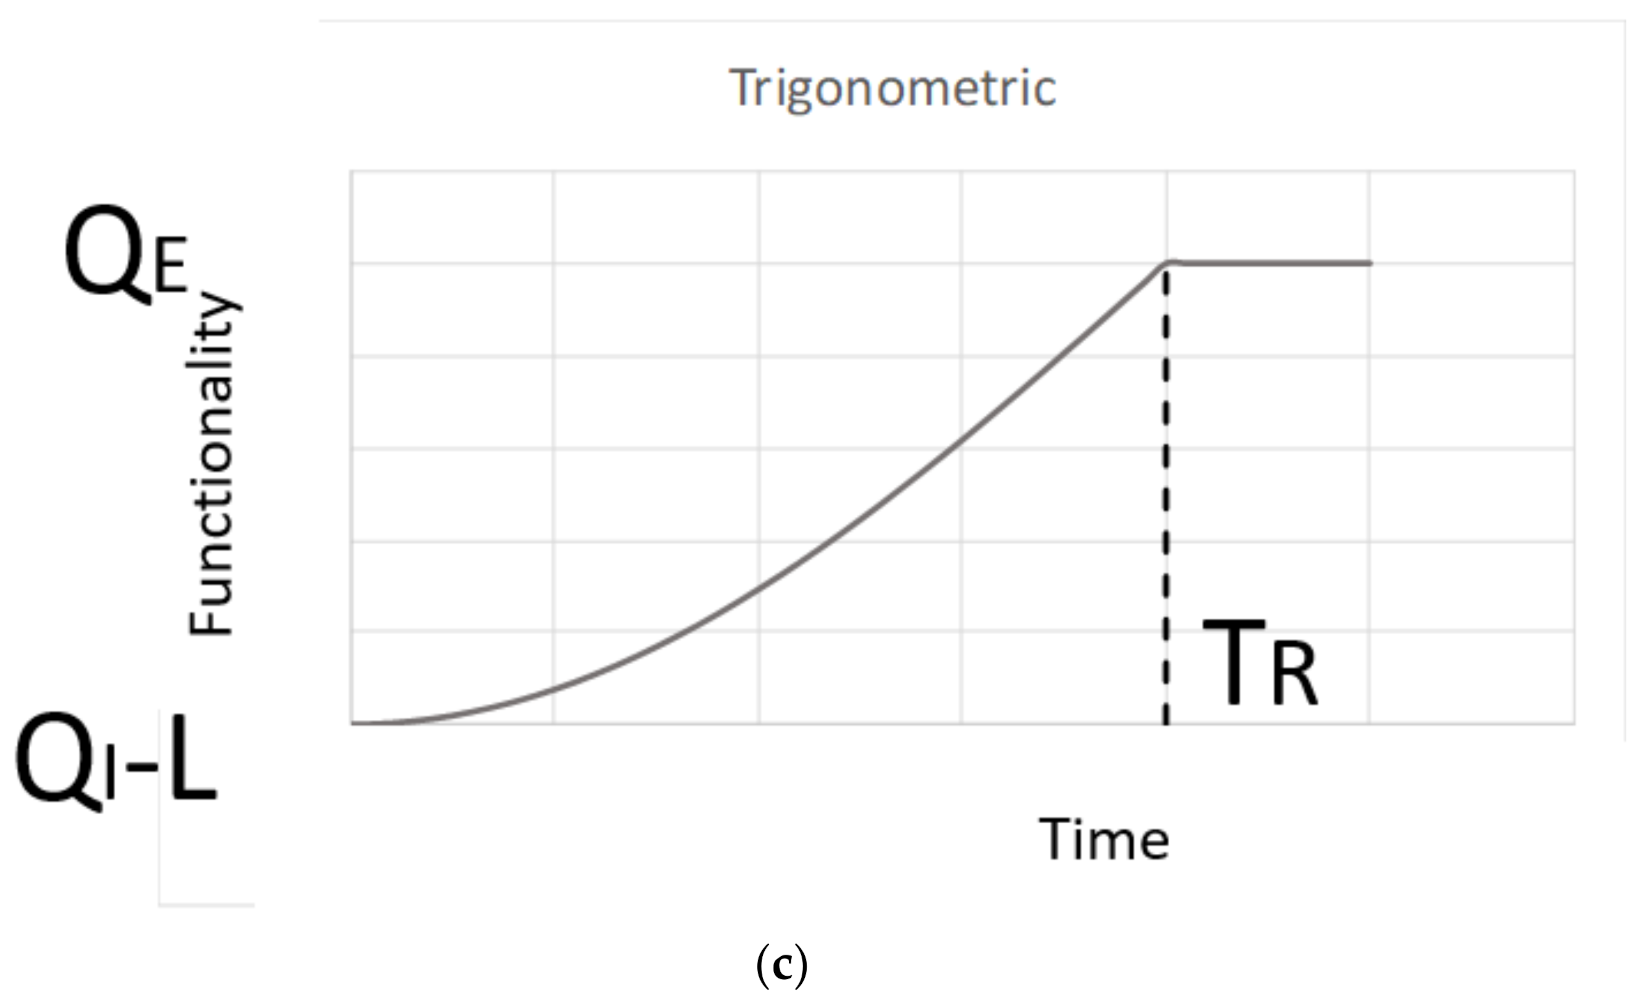
Introducing (3) into (2) and developing the calculations, it is possible to define resilience in the (t, Θ) domain (Figure 2) and referring to three recovery models:
Linear:
Exponential:
Trigonometric:
It is worth noticing that the terms QI, QE, and L define the variability of R along the EV associated to the climate change.
4. Loss Model (LM)
This paper proposes to model the evolutionary process due to climate change by including the environmental variable inside the loss model. The evolutionary process is based on CDF that uses regression analyses to derive relationships among damage parameters derived from the various sectoral models [20]. However, CDF presents some important limitations that need to be considered. First of all, they generally consider only one region of the world and they cannot comprehensively address all sectors that are impacted by climate change. In addition, they cannot integrate completely cross-sectorial results into the system of economic impacts and thus CDF may underestimate the economic and social context in which the biophysical and economic damages from climate changes are expected to occur. Finally, natural events associated with climate change are characterized by very high uncertainty, which greatly complicates the modelling of their economic impact. For example, for the infrastructure arena, it is fundamental to considering indirect losses [50,51,52] and their interactions (i.e., impacts of transportation and energy failing at once). In addition, CDF may only allow incomplete coverage and valuation of ecosystem effects and incomplete treatments of the impacts of extreme events in general (i.e., the modification of the Atlantic Meridional Overturning Circulation). Therefore, the loss model is calculated as a function of the environmental variable (particularly the temperature) to define the increase of the losses due to climate change (and graphically shown in Figure 2 with a red line). In the way the framework is built, CDF curves may be included inside the framework (4) to have semi-empirical assessments to describe the increase of losses derived by climate change. In order to show a case study and discuss the results, two analytical formulations were herein considered to model the evolutionary process: (a) a linear and (b) an exponential function that describe the increase of losses over the EV. Therefore, the role of climate change on resilience quantification was considered.
Linear:
Exponential:
that satisfy two conditions: (1) L = 0 (for Θ = Θ1) and (2) L = QI (for Θ = Θ2).
Figure 3 shows Equation (5).
5. Resilience Assessment
The assessment of resilience consists of implementing (5) inside (4) and assuming that QF and QI are not functions of Θ. Table 1 shows the results of the calculation of resilience for all the proposed cases: linear, exponential, and trigonometric RM and linear and exponential LM. It is possible to define a coefficient γ called recovery efficiency that allows to estimate the effect on resilience of the recovery model. In particular, the trigonometric loss model is generally used when the recovery process is driven by less resources than those available for the linear process and here it is demonstrated that the recovery efficiency (γ = is around 36.33%. On the contrary, the exponential model represents a system with a big amount of resources in the beginning of the recovery process and they rapidly decrease at the end. If compared with the linear case, recovery efficiency (γ = e − 1) increases by +71.82%.
Comparing the results for linear and exponential loss models, it is worth noting that when losses increase rapidly, the system may not be fast enough to react and thus its resilience decreases. In particular, resilience depends on QE and QI. The contribution of QE is insensitive to the loss model and contributes for 50%. QI significantly depends on the rate of increase of the loss model and for the exponential model it contributes only with a rate of (0.52%).
Overall, resilience is a commonly used parameter for a wide range of stakeholders and multi-sectorial actors, such as infrastructure owners, transportation authorities, and public administrators that may be interested in considering the long-term effects due to climate change. Therefore, considering the effects of climate change in terms of resilience allows to improve the readability of the outputs. When climate change is included, the results show an increase of losses due to the evolutionary process of the temperature, selected as the environmental variable. The dependency of such evolutionary process allows to estimate the effects of climate change on the resilience of the system.
6. Case Study
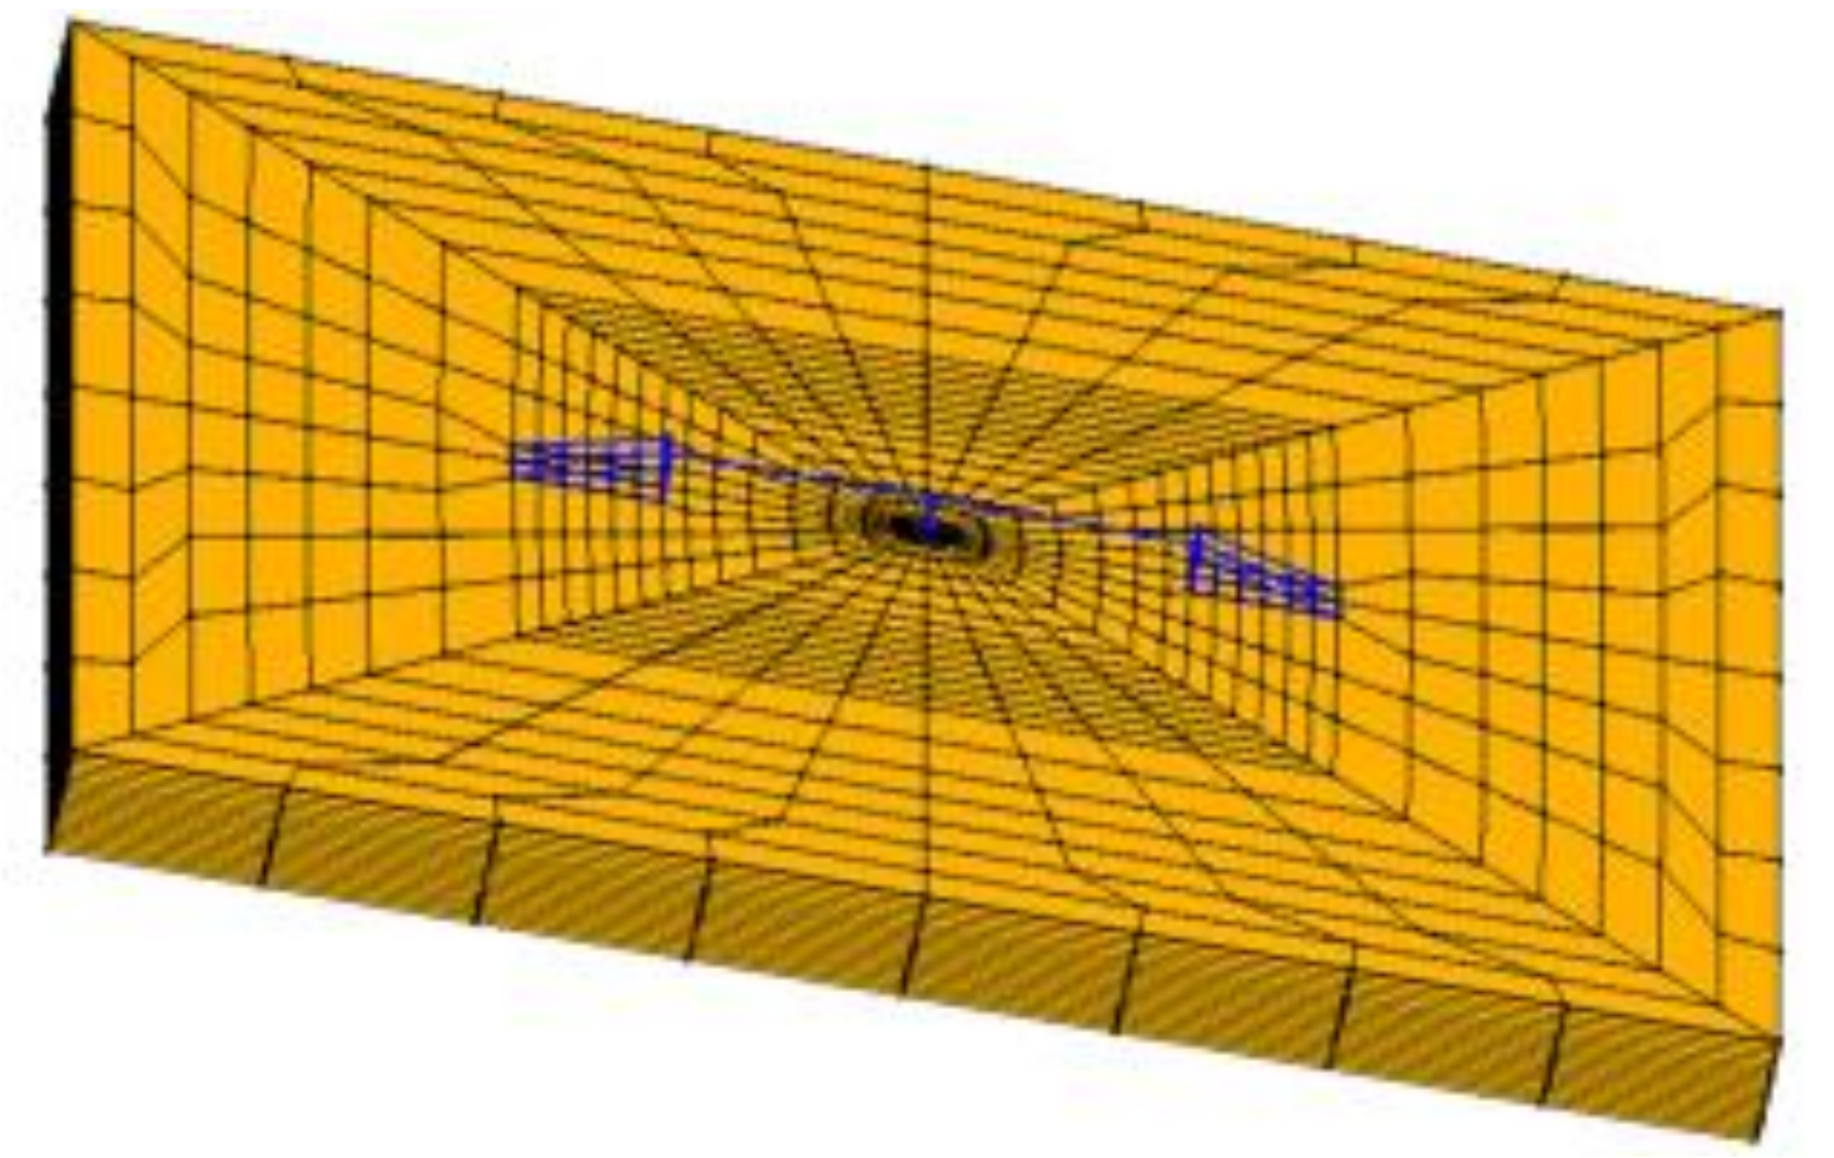
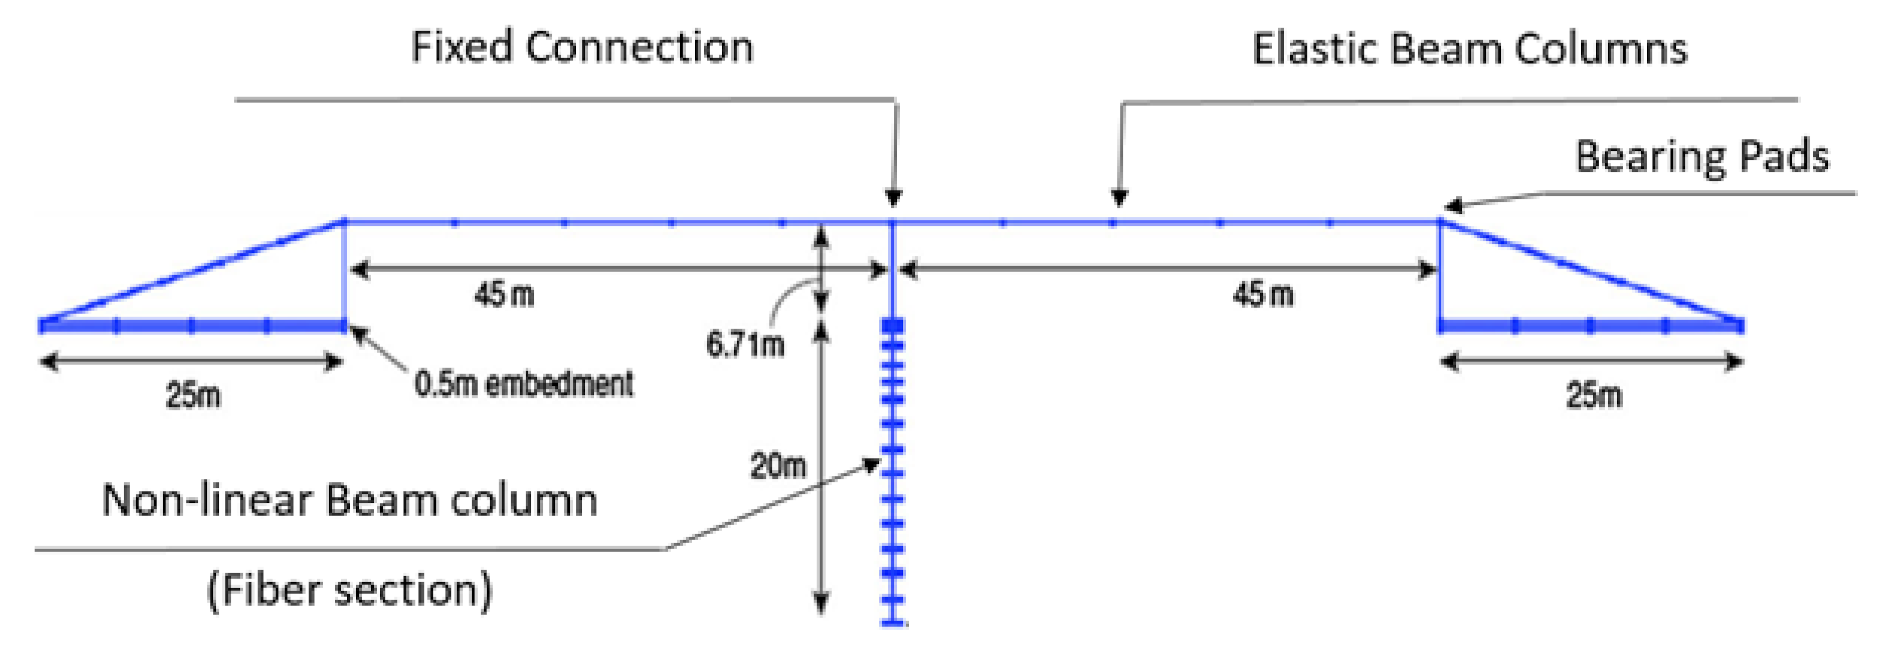
This section applies the previous formulations to a case study that was proposed in [52,53,54], where the assessment of Soil Structure Interaction (SSI) effects was carried out. The present paper does not consider SSI since the effects of soil deformability were neglected. The structure (Figure 4) consists of a typical Californian Ordinary Standard Bridge (OSB) designed according to the Caltrans Seismic Design Criteria, [55]. The bridge was modeled with a 3D finite element model (Figure 5 and Figure 6) with Opensees [56,57] and some assumptions to reduce the computational cost (see [54]). The soil was considered stiff, by as assuming a 200 m × 200 m × 20 m 3D soil mesh (6360 modes and 5330 non-linear ‘‘Bbar brick’’ elements). The element dimensions and absorbent boundary conditions were assumed the same as those performed in [54]. The bridge was founded of a stiff layer (named STIFF in [54]) in order to reduce the effects of the soil, modelled with the PressureIndependMultiYield (PIMY, [57]), whose representative parameters are shown in Table 2.
The abutment foundations consisted of 0.5 m concrete slabs, modelled with rigid-link elements for both abutments. The foundation of the column was modelled as a single Type I Caltrans 20 m-pile shaft. The 25 m-embankments were founded on 0.5 m foundations with a total weight of 30,000 kN. The 90 m-deck was modelled with elastic beam elements (cross section: 5.72 m2, moment of inertia about transversal axis: 2.81 m4 and vertical axis: 53.9 m4, distributed loads: 130.3 kN/m), with elastic material (Young modulus: 2.8 × 10⁷ kPa, shear modulus: 1.15 × 10⁷ kPa, density: 24 kN/m3). The column was connected with the deck with a fixed connection by restraining all the components of deformations in the 6 directions. Non-linear forced-based beam elements and fiber-section (cross section: 0.95 m2, moment of inertia about longitudinal and transversal axis: 0.108 m4) were applied to model the 6.71 m-column that was connected with the deck with Equaldof (fixed connection). Deck and abutments were connected with zero-length elements (with high stiffness) in the transversal and vertical directions and with bearing pads along the longitudinal connections, realized with Soft Damping Rubber Bearings (modulus of elasticity: G = 0.4 MPa and equivalent viscous damping: n = 10%), more details in [54].
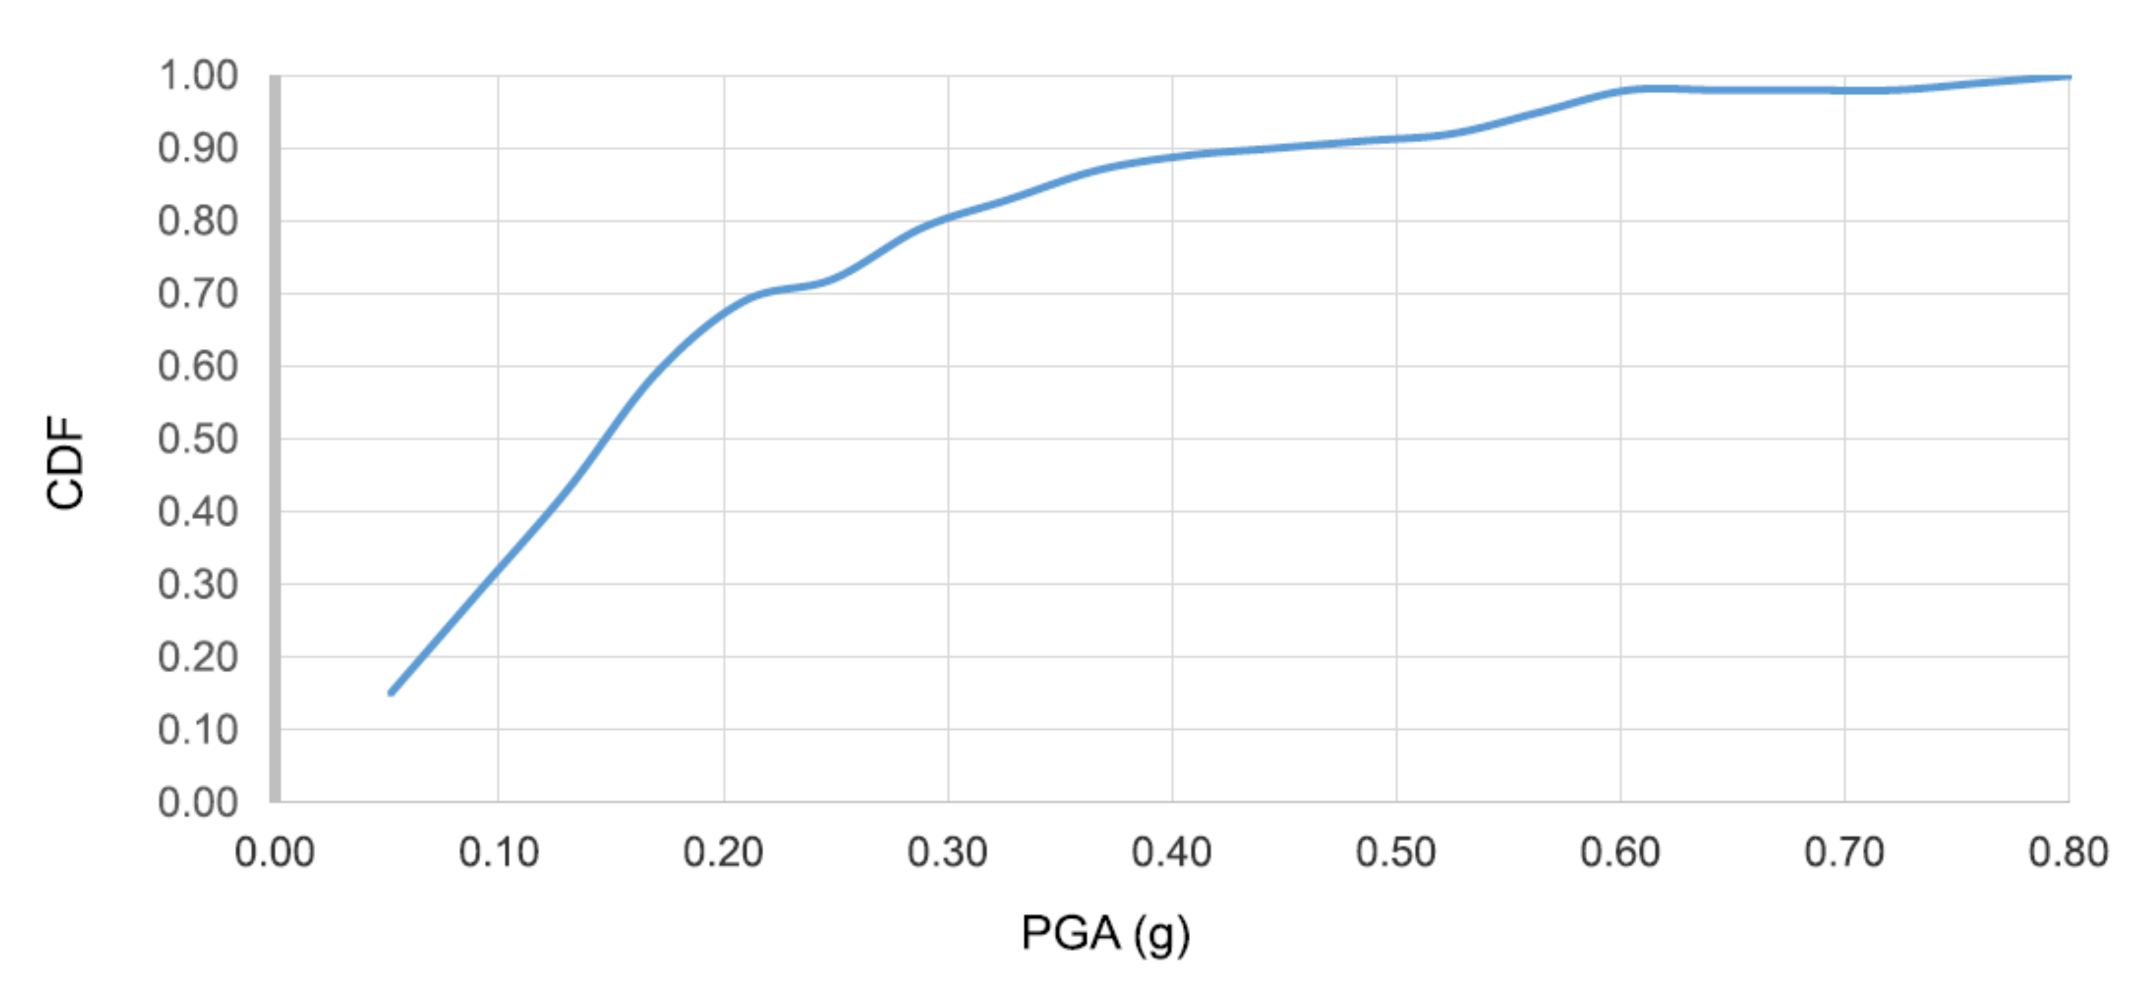
One-hundred input motions were selected from the PEER NGA database (http://peer.berkeley.edu/nga/ (accessed on 10 February 2021)) and are composed of three perpendicular acceleration time history components (two lateral and one vertical), as in [52]. The ground motion hazard was selected in order to reproduce infrequent events of large magnitude by following [58,59] that considered 2%, 10%, and 50% probabilities of exceedance in 50 years for bridge configurations. Figure 7 shows the cumulative density function (CDF) for the 100 motions and PGA, chosen as the reference intensity measure.
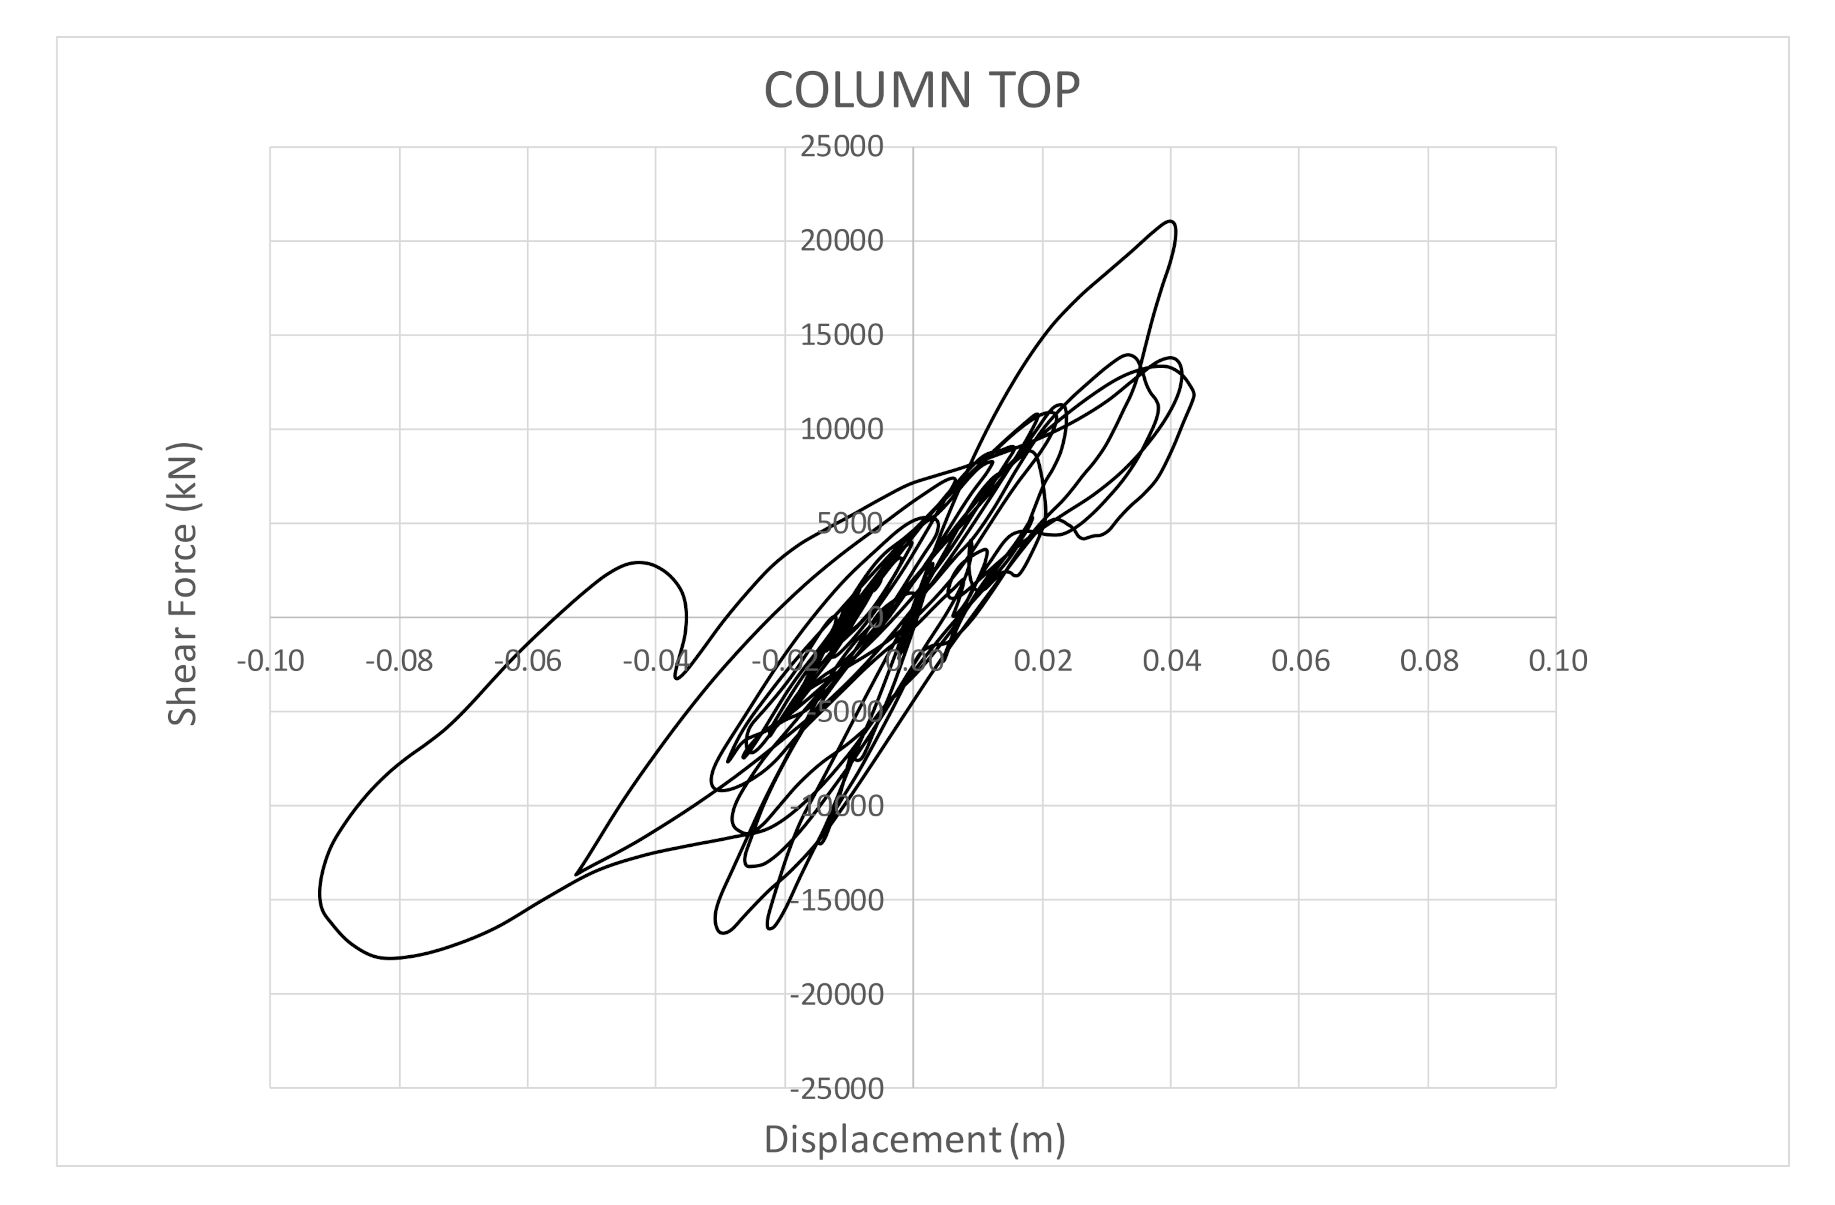
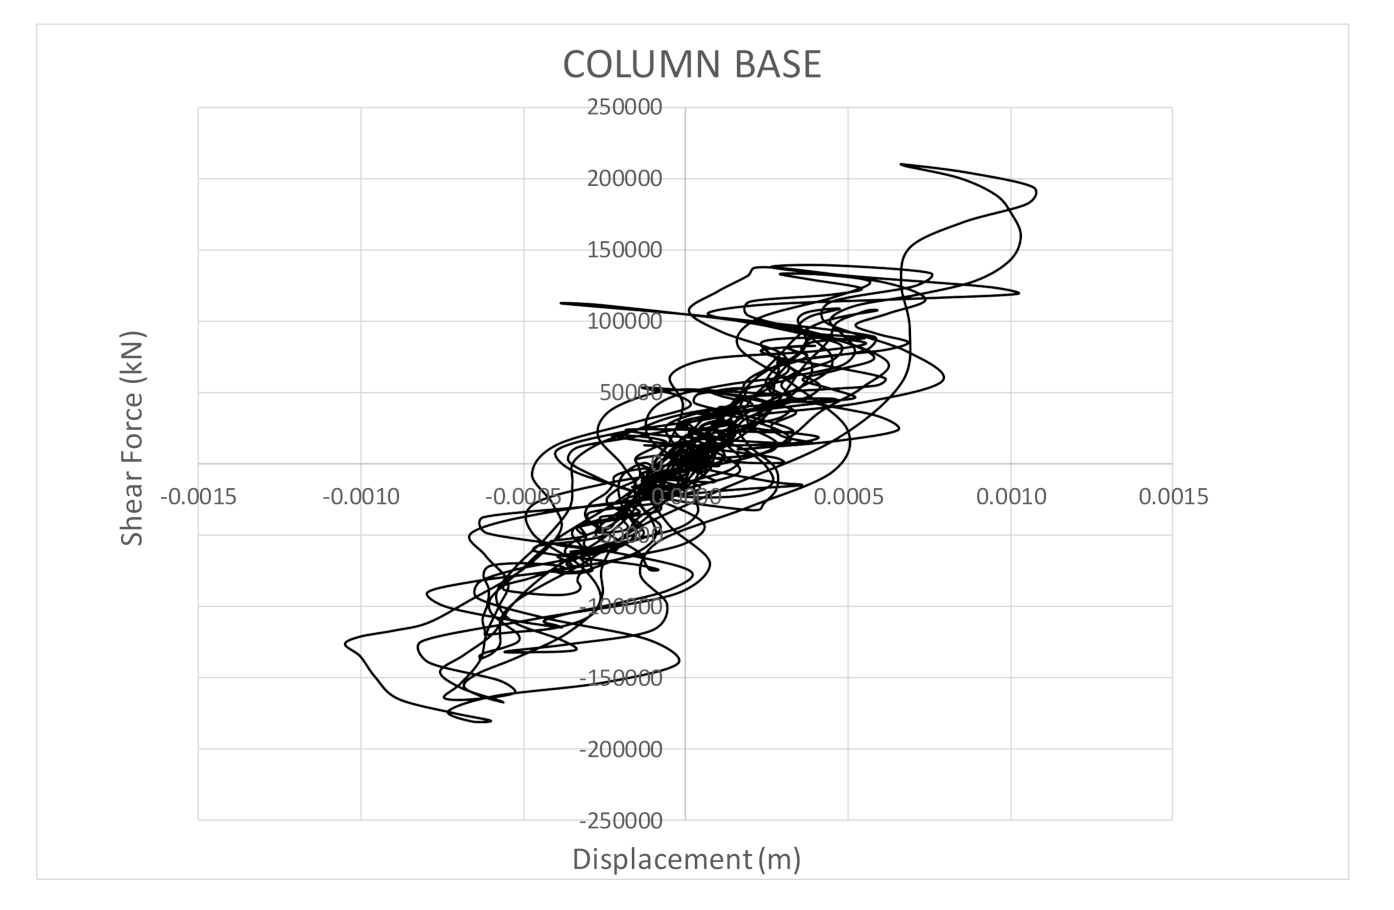
Figure 8 and Figure 9 show the response in correspondence of CNP, chosen as the most severe seismic scenarios for shear forces at the top and at the base of the column, respectively. It is worth noting the importance of non-linearity in the performance of the bridge for both considered positions. In addition, the displacements at the base are not zero because soil deformability (even if small) was considered in the model. However, the displacements at the top of the column are mainly due to the effects of the structural flexibility because the effects of soil-structure interaction are not significant.
The aim of the case study is to investigate the role of climate change in the assessment of resilience. In this regard, the two selected evolutionary processes were used to model the dependency of losses on the temperature, selected as the environmental variable. In particular, the assumptions at the base of the two loss models have important consequences in the increase of losses and therefore on the final calculation of resilience.
Assuming the formulation of losses proposed in [54]:
where
- RCR is the total repair cost ratio defined as the ratio between the cost of repair and the cost of replacement (without including demotion and expressed in percentage).
- RT is the total repair time expressed in crew working days (CWD) and
- i is the coefficient that defines indirect costs.
Some assumptions were considered: (1) the final functionality equal to 100% (QE = 1) and (2) the indirect losses equal to 10% RT (i = 0.1). Then, it was possible to calculate the resilience from Table 3, by considering three specific probabilities of exceedance in 50 years (2%, 5%, and 10%), more details in [54].
Table 4 and Table 5 represent the values of resilience when linear and exponential evolutionary processes are accounted for in the loss model, respectively. It is worth noting the reduction of resilience due to the exponential evolutionary process in comparison with the linear process: for a linear LS, the values are all more than 1, while for the exponential case, the system is much less resilient (with values smaller than 1 and for trigonometric RM, the value reaches 0.2). Such a reduction depends on the rate of losses that is too rapid for the system to react when the evolutionary process is modeled with an exponential formulation.
7. Conclusions
Quantification of resilience should consider the effects of climate change to be used as an indicator for future plans in infrastructure engineering. This paper contributes to this issue by proposing a resilience-based framework that models the uncertainties connected with climate change. Three recovery models and two loss models were proposed based on different analytical formulations in order to realistically assess resilience under different conditions. The effects of climate change were introduced inside the loss model by accounting two evolutionary processes (linear and exponential) and thus to consider the increase of damage due to the selected environmental variable (the temperature). The proposed framework was applied to a two-span Californian highway bridge in order to estimate recovered functionality. The paper demonstrates the importance of considering climate change by presenting readable findings for a wide range of different stakeholders, particularly for infrastructural decision-makers.
Overall, the paper may be the base for many interdisciplinary applications in order to include future perspectives in the assessment of designs and recovery solutions.
Funding
This research received no external funding.
Institutional Review Board Statement
Not applicable.
Informed Consent Statement
Not applicable.
Data Availability Statement
Not applicable.
Acknowledgments
The author thanks Claudio Muccioli for his assistance in developing the analytical formulation proposed in the paper.
Conflicts of Interest
The author declare no conflict of interest.
References
- Dehgani, M.; Flintsch, G.; McNeil, S. Impact of road conditions and disruption uncertainties on network vulnerability. J. Infrastruct. Syst. 2014, 20, 04014015. [Google Scholar] [CrossRef]
- Moini, N. Modeling of Risks Threatening Critical Infrastructures: System Approach. J. Infrastruct. Syst. 2015, 22, 04015010. [Google Scholar] [CrossRef]
- Nourzad, S.H.H.; Pradhan, A. Vulnerability of Infrastructure Systems: Macroscopic Analysis of Critical Disruptions on Road Networks. J. Infrastruct. Syst. 2015, 22. [Google Scholar] [CrossRef]
- Eidsvig, U.M.K.; Kristensen, K.; Vangelsten, B.V. Assessing the risk posed by natural hazards to infrastructures. Nat. Hazards Earth Syst. Sci. 2017, 17, 481–504. [Google Scholar] [CrossRef] [Green Version]
- Meyer, V.; Becker, N.; Markantonis, V.; Schwarze, R.; van den Bergh, J.C.J.M.; Bouwer, L.M.; Bubeck, P.; Ciavola, P.; Genovese, E.; Green, C.; et al. Assessing the costs of natural hazards—State of the art and knowledge gaps. Nat. Hazards Earth Syst. Sci. 2013, 13, 1351–1373. [Google Scholar] [CrossRef]
- Hafezi, M.; Sahin, O.; Stewart, A.R.; Mackey, B. Creating a Novel Multi-Layered Integrative Climate Change Adaptation planning Approach Using a Systematic Literature Review. Sustainability 2018, 10, 4100. [Google Scholar] [CrossRef] [Green Version]
- Schmitt, K.; Albers, T.; Pham, T.T.; Dinh, S.C. Site-specific and integrated adaptation to climate change in the coastal mangrove zone of Soc Trang Province, Viet Nam. J. Coast. Conserv. 2013, 17, 545–558. [Google Scholar] [CrossRef] [Green Version]
- Turner, R.K.; Palmieri, M.G.; Luisetti, T. Lessons from the Construction of a Climate Change Adaptation Plan: A Broads Wetland Case Study. Integr. Environ. Assess. Manag. 2016, 12, 719–725. [Google Scholar] [CrossRef]
- Nay, J.J.; Abkowitz, M.; Chu, E.; Gallagher, D.; Wright, H. A review of decision-support models for adaptation to climate change in the context of development. Clim. Dev. 2014, 6, 357–367. [Google Scholar] [CrossRef] [Green Version]
- Voinov, A.; Shugart, H.H. “Integronsters”, integral and integrated modeling. Environ. Model. Softw. 2013, 39, 149–158. [Google Scholar] [CrossRef]
- Kelly, R.A.; Jakeman, A.J.; Barreteau, O.; Borsuk, M.E.; Elsawah, S.; Hamilton, S.H.; Henriksen, H.J.; Kuikka, S.; Maier, H.R.; Rizzoli, A.E.; et al. Selecting among five common modelling approaches for integrated environmental assessment and management. Environ. Model. Softw. 2013, 47, 159–181. [Google Scholar] [CrossRef]
- UNDESA. Report of the Capacity Building Workshop and Expert Group Meeting on Integrated Approaches to Sustainable Development Planning and Implementation; United Nations Department of Economic and Social Affairs: New York, NY, USA, 2015. [Google Scholar]
- Boyd, E. Climate adaptation: Holistic thinking beyond technology. Nat. Clim. Chang. 2017, 7, 97–98. [Google Scholar] [CrossRef]
- Mach, K.J.; Field, C.B. Toward the next generation of assessment. Annu. Rev. Environ. Resour. 2017, 42, 569–597. [Google Scholar] [CrossRef]
- Bjarnadottir, S.; Li, Y.; Stewart, M.G. A probabilistic-based framework for impact and adaptation assessment of climate change on hurricane damage risks and costs. Struct. Saf. 2011, 33, 173–185. [Google Scholar] [CrossRef]
- Cui, W.; Caracoglia, L. Exploring hurricane wind speed along US Atlantic coast in warming climate and effects on predictions of structural damage and intervention costs. Eng. Struct. 2016, 122, 209–225. [Google Scholar] [CrossRef] [Green Version]
- Lin, C.Y.; Cha, E.J. Hurricane Risk Assessment for Residential Buildings in the Southeastern US Coastal Region in Changing Climate Conditions Using Artificial Neural Networks. Nat. Hazards Rev. 2020, 21, 04020024. [Google Scholar] [CrossRef]
- Nordhaus, W.; Boyer, J. Warming the World: Economic Models of Global Warming; MIT Press: Cambridge, MA, USA, 2000. [Google Scholar]
- Füssel, H.M.; Toth, F.L.; van Minnen, J.G.; Kaspar, F.R.A.N.K. Climate impact response functions as impact tools in the tolerable windows approach. Clim. Chang. 2003, 56, 91–117. [Google Scholar] [CrossRef]
- Neumann, J.E.; Willwerth, J.; Martinich, J.; McFarland, J.; Sarofim, M.C.; Yohe, G. Climate Damage Functions for Estimating the Economic Impacts of Climate Change in the United States. Rev. Environ. Econ. Policy 2020, 14, 25–43. [Google Scholar] [CrossRef] [Green Version]
- Arnell, N.W.; Brown, S.; Gosling, S.N.; Hinkel, J.; Huntingford, C.; Lloyd-Hughes, B.; Lowe, J.A.; Osborn, T.; Nicholls, R.J.; Zelazowski, P. Global-scale climate impact functions: The relationship between climate forcing and impact. Clim. Chang. 2016, 134, 475–487. [Google Scholar] [CrossRef] [Green Version]
- Nordhaus, W. Economic aspects of global warming in a post-Copenhagen environment. Proc. Natl. Acad. Sci. USA 2010, 107, 11721–11726. [Google Scholar] [CrossRef] [PubMed] [Green Version]
- Anthoff, D.; Tol, R.S.J. The uncertainty about the social cost of carbon: A decomposition analysis using FUND. Clim. Chang. 2013, 117, 515–530. [Google Scholar] [CrossRef]
- Hope, C. Critical issues for the calculation of the social cost of CO2: Why the estimates from PAGE09 are higher than those from PAGE2002. Clim. Chang. 2013, 117, 531–543. [Google Scholar] [CrossRef]
- Marten, A.L.; Kopp, R.E.; Shouse, K.C.; Griffiths, C.W.; Hodson, E.L.; Kopits, E.; Mignone, B.K.; Moore, C.; Newbold, S.C.; Waldhoff, S.; et al. Improving the assessment and valuation of climate change impacts for policy and regulatory analysis. Clim. Chang. 2013, 17, 433–438. [Google Scholar] [CrossRef]
- Pizer, W.; Adler, M.; Aldy, J.; Anthoff, D.; Cropper, M.; Gillingham, K.; Greenstone, M.; Murray, B.; Newell, R.; Richels, R.; et al. Using and improving the social cost of carbon: Regular, institutionalized updating and review are essential. Science 2014, 346, 1189–1190. [Google Scholar] [CrossRef] [PubMed]
- Newbold, S.; Marten, A. The value of information for integrated assessment models of climate change. J. Environ. Econ. Manag. 2014, 68, 11–123. [Google Scholar] [CrossRef]
- Stoerk, T.; Wagner, G.; Ward, R.E.T. Recommendations for improving the treatment of risk and uncertainty in economic estimates of climate impacts in the Sixth Intergovernmental Panel on Climate Change Assessment Report. Rev. Environ. Econ. Policy 2018, 12, 371–376. [Google Scholar] [CrossRef] [Green Version]
- Yohe, G.W. Characterizing transient temperature trajectories for assessing the value of achieving alternative temperature targets. Clim. Chang. 2017, 145, 469–479. [Google Scholar] [CrossRef]
- Ruggieri, R.; Porco, F.; Uva, G.; Vamvatsikos, D. Two frugal options to assess class fragility and seismic safety for low-rise reinforced concrete school buildings in Southern Italy. Bull. Earthq. Eng. 2021, 19, 1415–1439. [Google Scholar] [CrossRef]
- Amari, K.; Foufa, A.A.; Zouaoui, M.C.; Uva, G. Seismic Vulnerability of Masonry Lighthouses: A Study of the Bengut Lighthouse, Dellys, Boumerdès, Algeria. Buildings 2020, 10, 247. [Google Scholar] [CrossRef]
- Cimellaro, G.P.; Reinhorn, A.M.; Bruneau, M. Framework for analytical quantification of disaster resilience. Eng. Struct. 2010, 32, 3639–3649. [Google Scholar] [CrossRef]
- Wildavsky, A. Searching for Safety; Technical report; Transaction Publishers: London, UK, 1988; Volume 10. [Google Scholar]
- Hoiling, C.; Schindler, D.; Walker, B.W.; Roughgarden, J. Biodiversity in the Functioning of Ecosystems: An Ecological Synthesis. In Biodiversity Loss: Economic and Ecological Issues; Cambridge University Press: Cambridge, UK, 1997; p. 44. [Google Scholar]
- Horne, J.F.; Orr, J.E. Assessing behaviors that create resilient organizations. Employ. Relat. Today 1997, 24, 29–39. [Google Scholar] [CrossRef]
- Mallak, L. Measuring resilience in health care provider organizations. Health Manpow. Manag. 1998, 24, 148–152. [Google Scholar] [CrossRef] [PubMed] [Green Version]
- Mileti, D.S. Disasters by Design: A Reassessment of Natural Hazards in the United States; National Academies Press: Wahington, DC, USA, 1999. [Google Scholar]
- Comfort, L. Shared Risk: Complex Systems in Seismic Response; Pergamom Press, 1999. Available online: http://books.google.it/books?id=BqmDQgAACAAJ (accessed on 23 February 2021).
- Paton, D.; Smith, L.; Violanti, J. Disaster response: Risk, vulnerability and resilience. Disaster Prev. Manag. 2000, 9, 173–180. [Google Scholar] [CrossRef]
- Kendra, J.M.; Wachtendorf, T. Elements of resilience after the world trade center disaster: Reconstituting New York city’s emergency operations centre. Disasters 2003, 27, 37–53. [Google Scholar] [CrossRef] [PubMed]
- Cardona, D.O. The Notions of Disaster Risk: Conceptual Framework for Integrated Management; Technical report; Inter-American Development Bank, Universidad Nacional de Colombia, Istituto de Estudios Ambientales: Manizales, Colombia, 2003. [Google Scholar]
- Pelling, M. The Vulnerability of Cities: Natural Disasters and Social Resilience; Earthscan LLC, 2003. Available online: http://books.google.it/books?id=cjjBdCzB-C0C (accessed on 23 February 2021).
- UNISDR. Hyogo Framework for 2005–2015: Building the Resilience of Nations and Communities to Disasters. Technical report. In Proceedings of the World Conference on Disaster Reduction, Kobe, Japan, 18–22 January 2005. [Google Scholar]
- Bruneau, M.; Chang, S.E.; Eguchi, R.T.; Lee, G.C.; O’Rourke, T.D.; Reinhorn, A.M.; Shinozuka, M.; Tierney, K.; Wallace, W.A.; von Winterfeldt, D. A framework to quantitatively assess and enhance the seismic resilience of communities. Earthq. Spectra 2003, 19, 733–752. [Google Scholar] [CrossRef] [Green Version]
- Bruneau, M.; Reinhorn, A. Exploring the concept of seismic resilience for acute care facilities. Earthq. Spectra 2007, 23, 41–62. [Google Scholar] [CrossRef] [Green Version]
- Porter, K.A.; Kiremidjian, A.S.; LeGrue, J.S. Assembly–based vulnerability of buildings and its use in performance valuation. Earthq. Spectra 2001, 17, 291–312. [Google Scholar] [CrossRef]
- Cimellaro, G.P.; Reinhorn, A.M.; Bruneau, M. Seismic resilience of a hospital system. Struct. Infrastruct. Eng. 2009, 6, 127–144. [Google Scholar] [CrossRef]
- Forcellini, D. Seismic resilience of isolated bridge configurations with soil–structure interaction. Innov. Infrastruct. Solut. 2017, 2, 2. [Google Scholar] [CrossRef]
- Ranjbar, P.R.; Naderpour, H. Probabilistic evaluation of seismic resilience for typical vital buildings in terms of vulnerability curves. Structures 2020, 23, 314–323. [Google Scholar] [CrossRef]
- Kafali, C.; Grigoriu, M. Rehabilitation Decision Analysis. In Proceedings of the 9th International Conference on Structural Safety and Reliability (ICOSSAR’05), Rome, Italy, 19–23 June 2005. [Google Scholar]
- Chang, S.E.; Shinozuka, M. Measuring improvements in the disaster resilience of communities. Earthq. Spectra 2004, 20, 739–755. [Google Scholar] [CrossRef]
- Forcellini, D. Cost assessment of isolation technique applied to a benchmark bridge with soil structure interaction. Bull. Earthq. Eng. 2017, 15, 51–69. [Google Scholar] [CrossRef]
- Forcellini, D. A new methodology to assess Indirect Losses in Bridges subjected to multiple hazards. Innov. Infrastruct. Solut. 2019, 4, 1–9. [Google Scholar] [CrossRef]
- Forcellini, D. Resilience-Based Methodology to Assess Soil Structure Interaction on a Benchmark Bridge. Infrastructures 2020, 5, 90. [Google Scholar] [CrossRef]
- Caltrans Seismic Design Criteria; Version 1.3; California Department of Transportation: Sacramento, CA, USA, 2003.
- Mazzoni, S.; McKenna, F.; Scott, M.H.; Fenves, G.L. Open System for Earthquake Engineering Simulation, User Command-Language Manual; OpenSees Version 2.0; Pacific Earthquake Engineering Research Center, University of California: Berkeley, CA, USA, 2009; Available online: http://opensees.berkeley.edu/OpenSees/manuals/usermanual (accessed on 23 February 2021).
- Lu, J.; Elgamal, A.; Yang, Z. OpenSeesPL: 3D Lateral Pile-Ground Interaction. User Manual, Beta 1.0. Available online: http://soilquake.net/openseespl/ (accessed on 23 February 2021).
- Mackie, K.R.; Lu, J.; Elgamal, A. Performance-based earthquake assessment of bridge systems including ground-foundation interaction. Soil Dyn. Earthq. Eng. 2012, 42, 184–196. [Google Scholar] [CrossRef]
- Banerjee, S.; Prasad, G.G. Seismic risk assessment of reinforced concrete bridges in flood-prone regions. Struct. Infrastruct. Eng. 2013, 9, 952–968. [Google Scholar] [CrossRef]
Figure 1.
(a) Recovery model (linear); (b) recovery model (exponential); (c) recovery model (trigonometric).
Figure 1.
(a) Recovery model (linear); (b) recovery model (exponential); (c) recovery model (trigonometric).


Figure 2.
Resilience in the domain (t, Θ), linear recovery model.

Figure 3.
(a) Loss model L (Θ), linear; (b) loss model L (Θ), exponential.

Figure 4.
Case study.

Figure 5.
Finite element model.

Figure 6.
Benchmark bridge.

Figure 7.
Benchmark bridge.

Figure 8.
Displacement vs. shear force at the top of the column for the most severe earthquake.

Figure 9.
Displacement vs. shear force at the base of the column for the most severe earthquake.


Table 1.
Resilience calculation for linear, exponential, and trigonometric Recovery Model and linear and exponential Loss Model.
Table 1.
Resilience calculation for linear, exponential, and trigonometric Recovery Model and linear and exponential Loss Model.
| Resilience | Linear LM | Exponential LM |
|---|---|---|
| Linear RM | ||
| Exponential RM | ||
| Trigonometric (RM) |
Table 2.
PressureIndependMultiYield model: soil parameters.
| Soil Properties | |
|---|---|
| Mass density (kN/m3) | 18 |
| Shear Modulus (MPa) | 150 |
| Bulk Modulus (MPa) | 750 |
| Cohesion (kPa) | 75 |
| Shear wave velocity (cm/s) | 430 |
Table 3.
Repair Time and total Repair Cost Ratio values for several probability of exceedance.
| Probability of Exceedance | RT (CWD) | RCR (%) |
|---|---|---|
| 50% | 4.0 | 2.5 |
| 10% | 20.0 | 8.8 |
| 2% | 52.2 | 33.3 |
Table 4.
Resilience linear LM (for the selected probability of exceedance).
| Probability of Exceedance | Linear RM | Exponential RM | Trigonometric RM |
|---|---|---|---|
| 50% | 1.471 | 2.528 | 0.535 |
| 10% | 1.392 | 2.392 | 0.506 |
| 2% | 1.115 | 1.916 | 0.405 |
Table 5.
Resilience exponential LM (for the selected probability of exceedance).
| Probability of Exceedance | Linear RM | Exponential RM | Trigonometric RM |
|---|---|---|---|
| 50% | 0.550 | 0.946 | 0.200 |
| 10% | 0.546 | 0.939 | 0.198 |
| 2% | 0.532 | 0.914 | 0.193 |
Publisher’s Note: MDPI stays neutral with regard to jurisdictional claims in published maps and institutional affiliations. |
© 2021 by the author. Licensee MDPI, Basel, Switzerland. This article is an open access article distributed under the terms and conditions of the Creative Commons Attribution (CC BY) license (http://creativecommons.org/licenses/by/4.0/).
Share and Cite
MDPI and ACS Style
Forcellini, D. The Role of Climate Change in the Assessment of the Seismic Resilience of Infrastructures. Infrastructures 2021, 6, 76. https://0-doi-org.brum.beds.ac.uk/10.3390/infrastructures6050076
AMA Style
Forcellini D. The Role of Climate Change in the Assessment of the Seismic Resilience of Infrastructures. Infrastructures. 2021; 6(5):76. https://0-doi-org.brum.beds.ac.uk/10.3390/infrastructures6050076
Chicago/Turabian StyleForcellini, Davide. 2021. "The Role of Climate Change in the Assessment of the Seismic Resilience of Infrastructures" Infrastructures 6, no. 5: 76. https://0-doi-org.brum.beds.ac.uk/10.3390/infrastructures6050076