
Characteristics of Crashes Caused by Distracted Driving on Rural and Suburban Roadways in Jordan


1
Department of Civil Engineering, The Hashemite University, Zarqa 13133, Jordan
2
Department of Civil Engineering and Quantity Surveying, Military Technological College, Al Matart Street, Muscat 111, Oman
3
Civil Engineering Department, Jordan University of Science and Technology, Irbid 22110, Jordan
4
Department of Civil Engineering, Applied Science Private University, Amman 11931, Jordan
*
Author to whom correspondence should be addressed.
Infrastructures 2021, 6(8), 107; https://0-doi-org.brum.beds.ac.uk/10.3390/infrastructures6080107
Submission received: 18 June 2021
/
Revised: 20 July 2021
/
Accepted: 22 July 2021
/
Published: 29 July 2021
(This article belongs to the Special Issue Transport Systems: Safety Modeling, Visions and Strategies)
Abstract
:The objective of this study was to identify the most salient driver faults that cause crashes on some Jordanian rural and suburban roadway segments, to examine crashes with distracted driving as the driver’s fault, and to investigate the differences between crashes caused by distracted driving. Data for more than 10,200 crashes on nine roadway segments (five rural and four suburban) were accessed from the relevant government agency, but only n = 2472 were used for analysis after controlling for crashes specified as being caused by drivers’ distracted driving. IBM SPSS version 22 was used to perform descriptive analysis and independent samples’ t-tests. The results revealed that distracted driving was the second most common driver fault to cause crashes and the second main cause of fatalities and injuries on both rural and suburban roadways. Distracted driving on rural highways appears to be more fatal, whereas it caused more crashes with severe injuries on suburban roads. The variables at junction, road grade, number of lanes, weather condition, crash type, and number of vehicles involved were found to be statistically significant but with a small effect size. The following categories showed high percentages of distracted driving crashes on rural and suburban roadways: males, drivers 25–39 years old, non-holidays, weekdays, tangent sections, two-way divided roads, not at junction, level roads, two-lane roads, clear weather, dry surface, daylight, and automobile vehicles showed high percentages of distracted driving crashes on rural and suburban roadways. Differences between crashes on rural and suburban roadways caused by distracted driving were found to be small.
1. Introduction
Safe driving entails a complex combination of behaviors in which the driver is required to successfully perform a number of complex activities concurrently [1]. Such activities include (but are not limited to) route detection and tracking, speed and lateral position controlling, collision avoiding, road laws obeying, and vehicle systems status monitoring [2]. Drivers are often observed as engaging in activities that will likely divert their attention away from the main crucial activity required for safe driving [1]. Pashler [3] pointed out that humans normally have limited capability to carry out more than two tasks in parallel.
The definitions of distracted driving reported in the literature vary. Distracted driving occurs when the recognition of the information required for safe driving is delayed due to something such as an individual, an event, or an activity inside or outside the vehicle, forcing the driver to divert his attention away from the driving task [4,5]. Distraction can undermine driving performance and impact driver behavior in different ways and to various degrees. Dingus et al. [6] maintained that driver distraction and slips of attention have a significant influence on road crashes and other related road safety issues. Distraction reduces the performance of the driver and is an important factor in the occurrence of traffic accidents [7,8]. Louw et al. [9] indicated that over 90% of reported traffic accidents were the outcome of human error and caused by issues related to the acquisition of visual information. Moreover, drivers can be held responsible for causing 90% of critical traffic conditions [6,10]. Khattak et al. [11] indicated that human factors still contribute to 93% of crashes, whereas recognition errors (including distraction) are found to be the driving error contributing to the highest percentage of crashes.
Regan et al. [12] defined driver inattention as “…insufficient, or no attention, to activities critical for safe driving”. They also listed several forms of driver inattention such as biological factors that block the driver from noticing crucial information for safe driving; misprioritized attention of drivers (i.e., drivers’ attention focused on one side of driving while excluding another); and driver distraction, which is considered as one form of driver inattention where a competing or a secondary task (which can be driving-related or non-driving-related) diverts the attention of the drivers away from crucial safe driving tasks.
Goodsell et al. [1] conducted a comprehensive review of studies on driver distraction and listed four major moderating factors that might influence the occurrence of driver distraction. The first moderating factor is driver characteristics (age and driving experience). The second moderating factor is the level of demand of the driving task. Weather, traffic, and road conditions were found to influence the demand of driving tasks [13]. The third moderating factor is the level of demand for attention of the competing activity (i.e., visual–manual vs. auditory–vocal). The fourth moderating factor is the drivers’ ability to change their behavior to keep satisfactory driving performance in the face of competing tasks (also known as self-regulation) [14].
Shortfalls of driving performance due to engagement in competing tasks have been found to include the following: poor lane keeping and speed control, increase in reaction time, skipping traffic signals, inadequate headway distances, risky gap acceptances, reduction in situational awareness, and visual scanning of the roadway [15,16,17,18]. Many of these shortfalls in driving performance are correlated with a substantial risk of crashes [6]. For example, poor speed control, when examined separately from other causal factors such as driver distraction, might increase crash risk by 12.8 times, and short headway distances can increase crash risk by 13.5 times [6].
Young et al. [13] indicated that driver distraction might be affected by the demand of the driving task, which in turn may be influenced by factors such as weather, traffic, and road conditions. Generally, more demanding tasks impair driving performance more. Accordingly, it is expected that distractions in different areas and road types may vary.
Driving tasks might be affected by road aggressiveness [19]. Spanish drivers’ perceptions of aggressive behavior and the most aggressive acts performed when driving were studied by Alonso et al. [19]. Their results show that both infractions and dangerous behaviors correspond to aggressive driving, which definitely becomes a source of distraction. It has also been found that drivers who tend to have several accidents give less importance to elements that can affect the driving task such as distraction.
Xuedong et al. [20] indicated that crash rates in rural sections are regularly lower than those in urban ones. They also indicated that rural areas have lower crash risk when compared to urban places. Additionally, it was found that an increase in traffic volume and section length would increase the frequency of crashes and lower the chances of the occurrence of severe crashes. Research indicates that fatality rates in rural areas are higher than in urban locations [21,22,23]. Similarly, it is expected that suburban roadways will have similar characteristics of crash potential. Suburban roadways are transitional high-speed roadways between low-speed urban streets and high-speed rural highways. They have the characteristics of both rural (i.e., high-speed) and urban (i.e., with curb and gutter used for drainage) roadways [24]. Territorial variables (built environment and physical severance) can affect the occurrence of accidents, even due to distraction. In their study on traffic crashes on rural roads with older pedestrians, Casado-Sanz et al. [25] indicated that a small number of studies in the literature have discussed territorial variables (built environment and physical severance). Casado-Sanz et al. [25] aimed at determining the significant factors that increase the probability of a fatal outcome in the case of a crash involving at least one seriously injured individual at rural crosstown roads. The results revealed that the physical severance index (territorial variable) was very significant and suggested that the probability of a fatal outcome on a lateral rural crosstown road is almost two times higher than that at the baseline condition of a central rural crosstown road.
In Jordan, the rapid growth in population was accompanied by an increase in vehicle ownership. According to Jordan’s Department of Statistics [26], there were about 10.5 million inhabitants in 2019. Additionally, Driver and Vehicle License Department (DVDL) [27] records show that the number of licensed drivers in 2019 exceeded 2.5 million, and that there were around 1.6 million registered vehicles. The majority of Jordan’s population (90.33%) live in urban or suburban areas (areas are classified as follows: urban when the population > 10,000 inhabitants, and suburban when the population falls between 5000 and 10,000 inhabitants [28]). Consequently, a rapid growth in population and vehicle ownership has contributed, among other factors, to the increasing number of crashes.
Accident statistics clearly show that when compared to developed countries, Jordan suffers from a relatively low level of traffic safety, which results in great socio-economic losses. The Annual Report of Traffic Accidents in Jordan [29] showed that 161,511 traffic accidents occurred in Jordan in 2019, of which 10,857 were human injury accidents that resulted in 643 fatalities at an estimated financial cost of around USD 454 million. When compared with accidents worldwide, Jordan ranked in the top four countries in the year 2017 in relation to deaths per 10,000 vehicles. In the year 2019, human-related factors were responsible for 98.2% of accidents in Jordan that resulted in human injuries. Driver fault (not taking the necessary precautions) accounted for a high percentage (around 40%) of injuries and deaths in 2019 [26].
Due to the significant impact of distraction on driver performance and the great losses resulting from it, this study aimed to identify the most salient driver faults that cause crashes on nine segments of Jordan’s rural and suburban roadways using the available crash data. The study also sought to examine crashes with distracted driving as the driver’s fault and to investigate the differences between crashes caused by distracted driving on rural and suburban roadways. Knowing which road factors influence distracted driving on rural and suburban roadways can help researchers, traffic experts, and authorities to identify the most effective measures that may reduce driver distraction and target different driver groups with the best practices that fit their driving behaviors and keep them attentive. Likewise, the best practices can be implemented on different roadway types, under varying weather conditions, and at different times of the year.
2. Methodology
2.1. Crash Data
The data used in this study were extracted from traffic accident records obtained from the Jordan Traffic Institute for the years 2014 to 2018. The available data provide information about more than 10,200 crashes on nine roadway segments (five rural and four suburban), which connect different areas with Amman (capital city of Jordan). The information includes crash date and time; driver’s age, gender, and fault; pavement surface type and condition; lanes’ direction, number, horizontal alignment, and grade; weather and lighting conditions; crash type and speed of vehicles involved; severity; and location coordinates. Some of the driver age records were incomplete (missing or mistakenly entered). The retention of cases with outliers (out-of-range values) can distort the results of the analyses; hence, such cases were either corrected or deleted [30]. It is worth mentioning here that distracted driving was listed among drivers’ faults, but the records mentioned nothing about what caused the distraction. Therefore, it is assumed that distracted driving may be attributed to any of the known distraction types (visual, manual, cognitive, and auditory) or a combination of them. Although some of the drivers’ faults can be interrelated—for example, distraction can lead to degraded lane keeping, speed control problems, missed traffic signal, etc.—the results presented here depend solely on the provided information, and thus, there is no way to find such a link between the driver’s faults. Therefore, the total sample size analyzed in this study was restricted to those cases that the police clearly indicated as being caused by distracted driving (n = 2472). Among the 2472 crashes that were caused by distracted driving, 910 (36.8%) occurred in suburban areas, and 1562 (63.8%) took place in rural areas. The details of the collected data and their categories are discussed in the next section.
2.2. Data Analysis
The IBM SPSS version 22 statistical software package was used to perform independent samples t-tests to determine whether there were statistically significant differences between drivers. The analysis conducted in this work consisted of two levels. In the first level, an analysis of drivers’ faults was conducted by using descriptive statistics to discover the most common driver faults responsible for causing crashes on rural and suburban roadways. In the second level, on the other hand, an independent samples t-test analysis was used to examine the characteristics of distracted driving crashes and investigate the differences between crashes caused by distracted driving on rural and on suburban roadways based on human- and location-related factors.
3. Analysis and Results
3.1. Drivers’ Faults Analysis
The analysis of the available accident data for both rural and suburban roadway segments for the years 2014–2018 is shown in Table 1 below. The analysis revealed that three of the drivers’ faults listed in Table 1 were responsible for almost 73% of all reported crashes. Lane departure (25.95%), distracted driving (24.19%), and tailgating (22.79%) were the top driver faults causing crashes. In fourth and fifth places came traffic rules violation (9.6%) and wrong-way driving (8.21%). The remaining driver faults, listed in Table 1, were responsible for less than 10% of reported crashes. Moreover, the analysis of the severity of crashes showed that the most frequently occurring driver’s faults (lane departure and distracted driving) were the causes of crashes with the highest severity. These driver faults were responsible for almost 81% of the total reported fatalities, 77% of severe injuries, 63% of moderate injuries, 67% of slight injuries, and almost 46% of property damage only (PDO) crashes. Reckless driving was ranked as the third major fault causing fatalities with almost 7%, and control loss and traffic rules violation were also responsible for nearly 7% of reported fatalities.
3.2. Distracted Driving Analysis
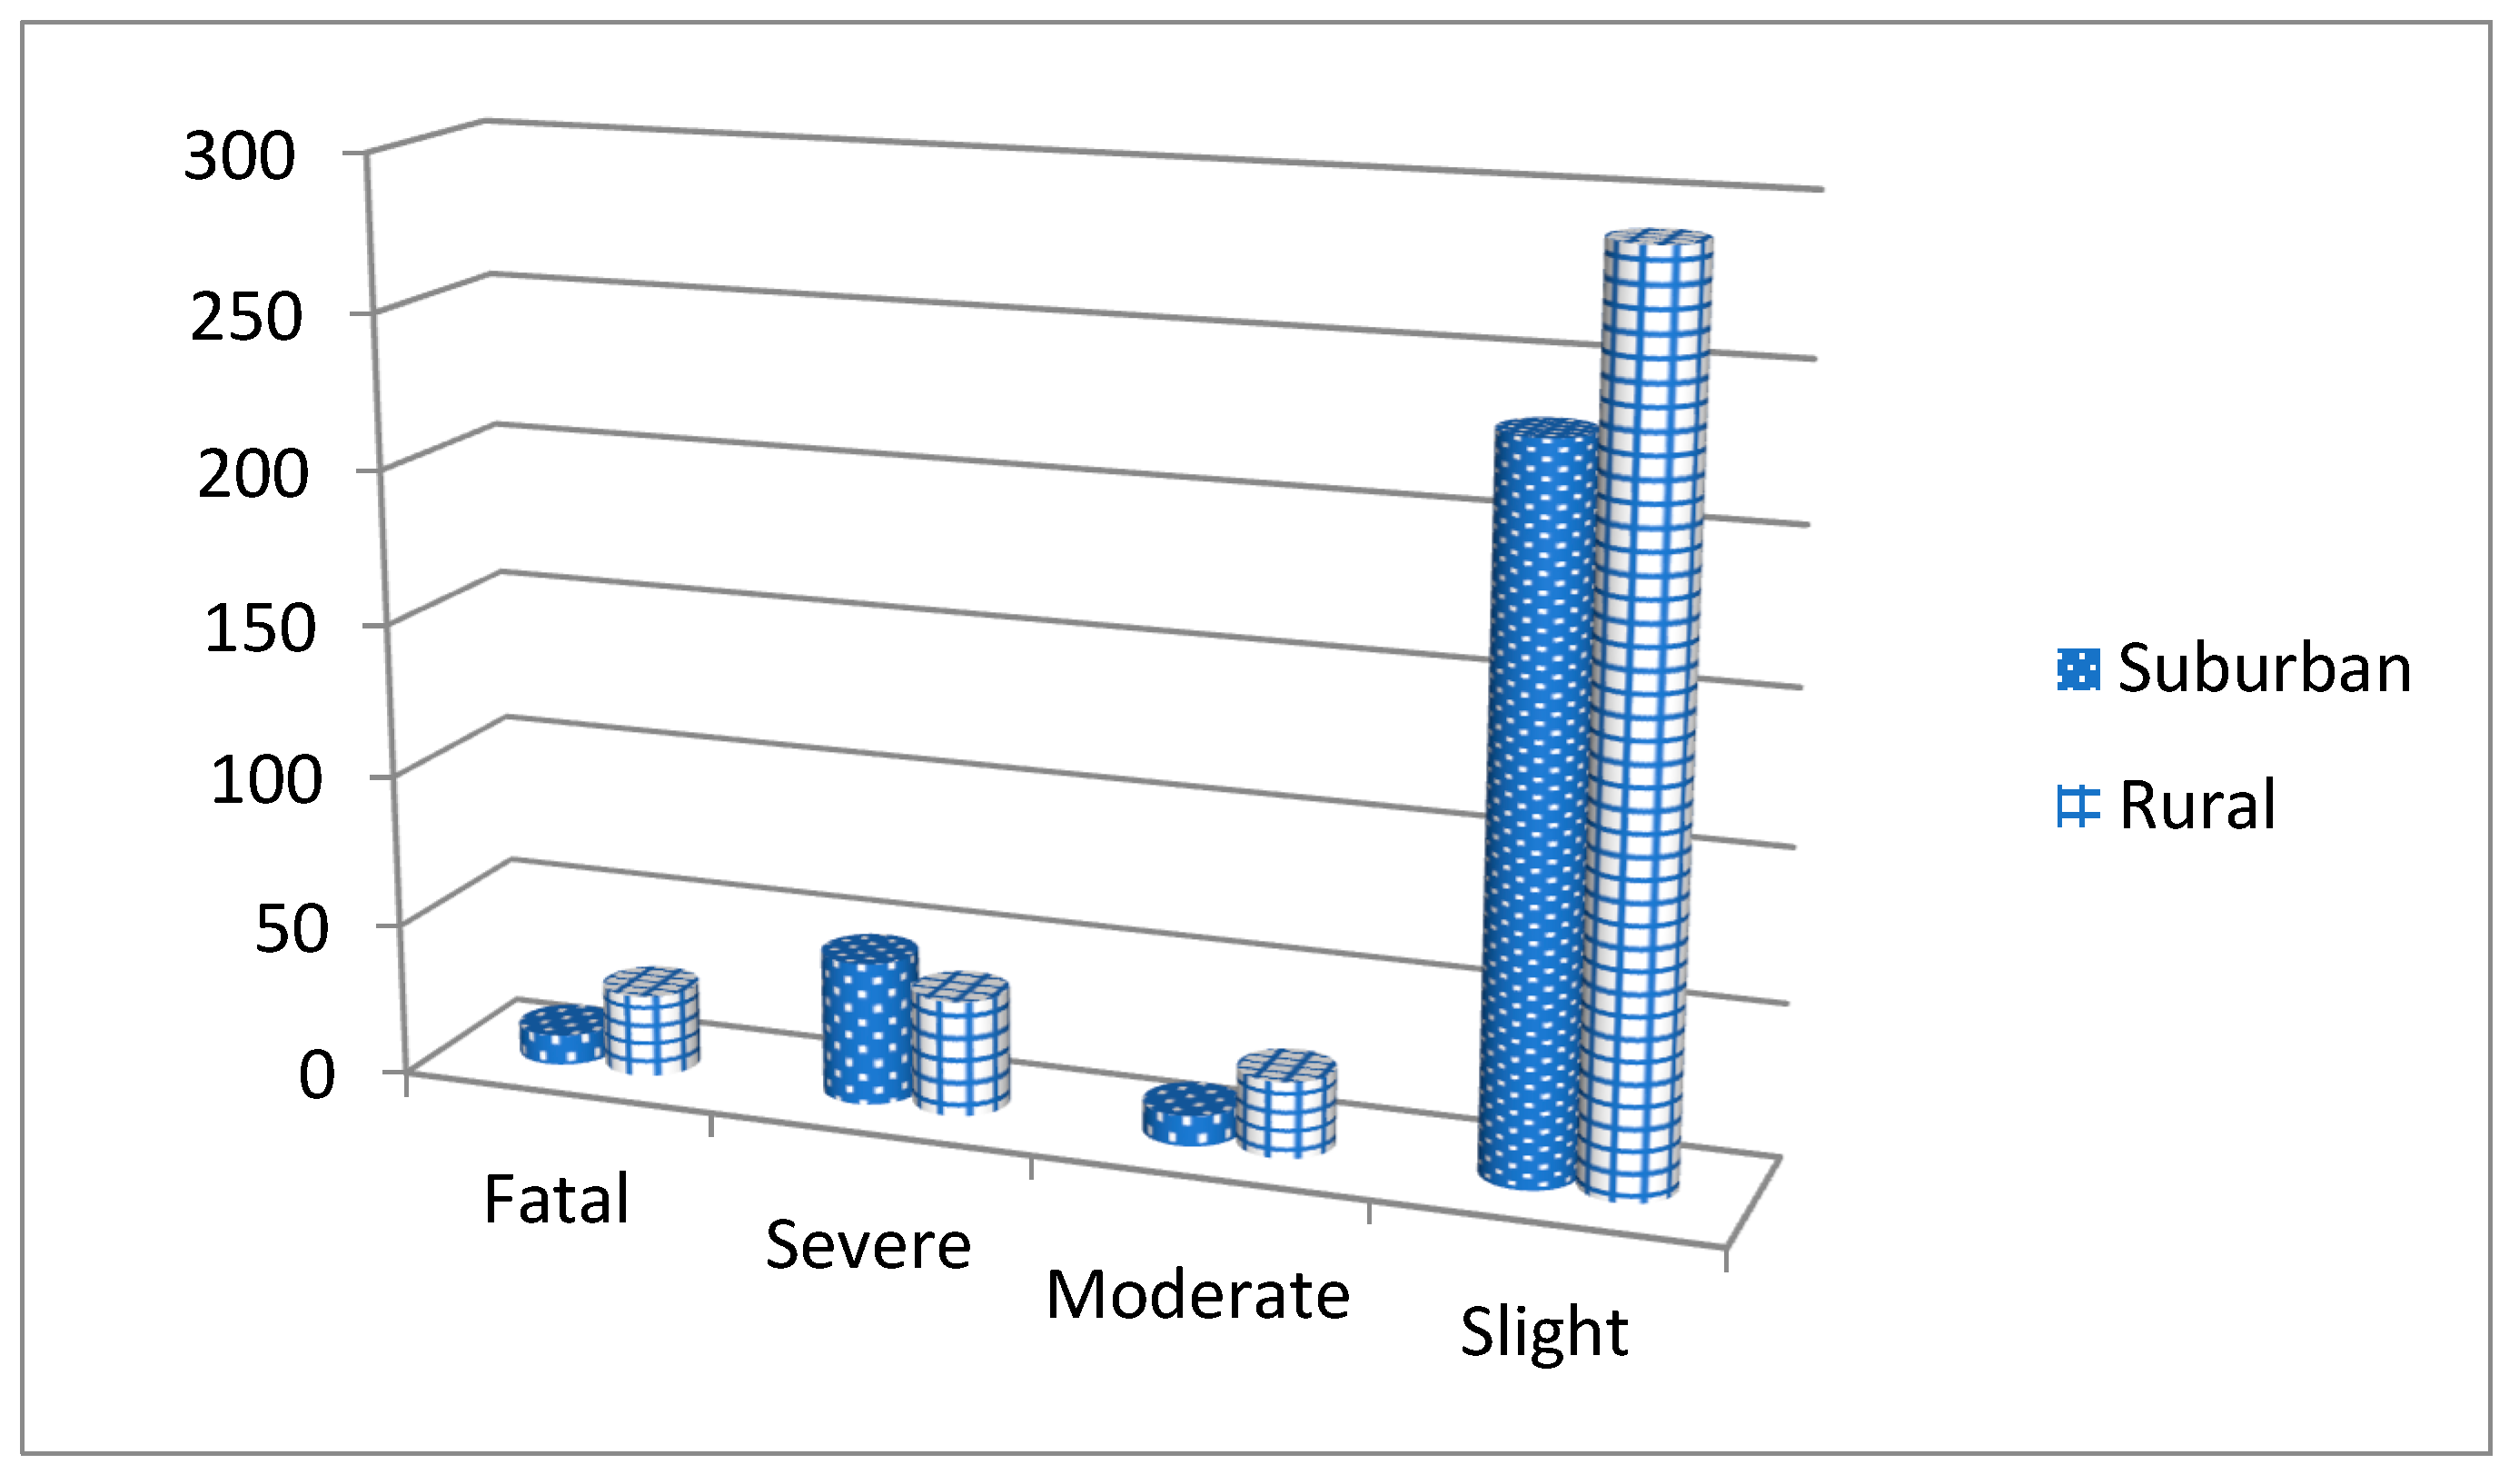
As stated earlier, distracted driving was found to be the second highest ranking drivers’ fault responsible for crashes on rural and suburban roads, and it was the second most hazardous cause of fatalities and injuries. Available records show that the number of crashes with distracted driving listed as the driver’s fault is 2472, which represents 24.19% of all crashes. Distracted driving as a driver’s fault was responsible for 22.7% of fatalities, 22.7% of severe injuries, 21.6% of moderate injuries, 24.4% of slight injuries, and 22.4% of PDO crashes. The characteristics of these crashes are discussed based on statistics acquired from the available data. Differences between crashes on rural and suburban roads caused by distracted driving were investigated based on three different factors: human- and time-related factors, presented in Table 2; road- and environment-related factors, presented in Table 3; and crash-type- and vehicle-related factors, shown in Table 4. Among the 2472 crashes with distracted driving listed as the driver’s fault, 910 (36.8%) occurred in suburban areas and 1562 (63.8%) took place in rural areas. The severity of crashes in rural and suburban roads is presented in Figure 1. Distracted driving in rural areas seemed to be more fatal, whereas that on suburban roads led to more severe injuries.
Table 2 shows the characteristics of crashes caused by distracted driving as the drivers’ fault according to human- and time-related factors. According to the table, males were responsible for almost two-thirds of the crashes on both rural and suburban roadways. The differences in crash percentages between rural and suburban areas for males and females indicate that females were more distracted on rural roadways than males were, who appeared to be more distracted on suburban roadways where driving tasks are more demanding. Table 2 shows that drivers in the age group of 25–39 years were responsible for 64.2% of crashes, while drivers in the age group of 40–54 years caused only 22.7% of distracted driving crashes on both rural and suburban roadways. The percentages of crashes between age groups for rural and suburban areas show no major difference, except a slight increase in percentage in suburban areas for drivers of the age group 40–54.
The analysis in Table 2 shows that the majority of crashes (96%) occurred on “no holiday” days. The percentages of crashes between “holiday” and “no holiday” show no major differences between rural and suburban roadways. Distracted driving crashes during weekdays are almost three times more frequent than those that occur on weekends. Unlike suburban roadways, rural roadways seem to have slightly more distracted driving crashes during weekdays, although suburban roads show more crashes during weekends. Table 2 also shows that around 69% of distracted driving crashes occurred at midday and evening on both rural and suburban roadways. Morning and night-time crashes caused by distracted driving seem to be slightly more common on suburban roadways. Meanwhile, rural roadways show a higher percentage of crashes due to distracted driving around midday.
The characteristics of crashes caused by distracted driving as the drivers’ fault according to road- and environment-related factors are shown in Table 3. More than 98% of these crashes took place on tangent sections on both rural and suburban roads. A higher percentage of crashes caused by distracted driving on two-way divided roads took place on suburban roads, whereas a higher percentage of crashes were seen on one-way and two-way undivided rural roads. The analysis shows that the majority of crashes (87.62%) took place at “no junction” roadway sections in both rural and suburban areas. The percentage of “at junction” crashes was slightly higher on suburban roads.
Table 3 shows that the majority of distracted driving crashes occurred on level grades, under dry surface conditions, in clear weather, and on two-lane roads for both rural and suburban areas. Rural roads witnessed more crashes at level grades, while suburban roadways saw more crashes on descending sections. No major difference was noticed in terms of the surface condition between urban and suburban areas. A higher percentage of crashes with distracted driving was noticed on two-lane rural roadways, while a higher percentage of crashes was seen on three-lane suburban roads. Suburban roads witnessed more crashes with distracted driving noted as the driver’s fault during clear weather and daylight hours, whereas more crashes were seen on rural roadways when lighting conditions were dark.
The characteristics of crashes caused by distracted driving as the driver’s fault according to crash-type- and vehicle-related factors are shown in Table 4. Collision, with a percentage of 83.62%, was the most often occurring crash type in both rural and suburban areas. Crash types caused by distracted driving seem to occur in different percentages in rural and suburban roadway sections. Collision and run-off-road (ROR) crashes occurred in higher percentages on rural roads, whereas more pedestrian crashes were seen on suburban road sections. Crashes that involved more than one vehicle were seen in higher percentages in suburban road sections.
Distracted driving crashes that occurred at speeds of 40–80 km/h were the most observed among all speed categories. The highest percentage of crashes on suburban roads occurred at speeds of 40–80 km/h, while for rural roads, the highest percentage of crashes occurred at speeds of 60–100 km/h. Crashes at speeds of higher than 100 km/h seemed to occur on rural roads only. Rural roads witnessed a higher percentage of crashes caused by distracted driving involving automobiles, medium vehicles, and tractor vehicles. On the other hand, crashes on suburban roads involved more light and heavy vehicles.
After comparing the differences between crashes resulting from distracted driving on rural and suburban roads based on crash percentages, a statistical analysis was conducted to assess whether these differences are statistically significant. Table 5 shows the results of the independent samples t-test for rural and suburban roadways. Six variables were found to be statistically significant: at junction, road grade, number of lanes, weather condition, crash type, and number of vehicles involved. For these variables with statistically significant differences, the effect size was calculated using Eta square and classified using Cohen’s [31] guidelines, where 0.01 = small effect, 0.06 = moderate effect, and 0.14 = large effect. From the foregoing, and as shown in the table below, the six variables with statistically significant differences ended up having only a small effect. This indicates that the reported differences do not have a strong effect.
Moreover, the independent samples test was also conducted to explore whether differences exist between genders in terms of distracted driving. The results shown in Table 6 below indicate that differences only exist under three conditions, namely road surface conditions, weather conditions, and lighting conditions. However, the effect size calculations revealed that the differences were very small, as reflected by the fact that no values crossed Cohen’s [31] guideline classifications for a small effect size (0.01).
4. Discussion
The driver fault analysis conducted in this study proves the significant influence of distraction on driver performance and the great losses resulting from it. The analysis revealed that distracted driving was responsible for causing nearly one-fourth of the reported crashes included in this study. Moreover, the analysis of the severity of crashes showed that distracted driving was responsible for 22.7% of all reported fatalities, 22.7% of severe injuries, and 22.4% of PDO crashes. These results are in line with previous findings [6,7,8,9,10,11] indicating that human error was responsible for a very high percentage of crashes, and distraction had a significant influence on road crashes. These results also prove that humans continue to have limited capability to perform more than two tasks in parallel, as reported by Pashler [3].
The analysis of distracted driving on rural and suburban roads was performed based on three different groups of factors: human- and time-related factors, road- and environment-related factors, and crash-type- and vehicle-related factors. Distracted driving in rural areas seemed to be more fatal, whereas suburban roads witnessed more severe injuries. The higher frequency of fatalities on rural roads could be attributed to the fact that traffic on rural roads runs at higher speeds, resulting in more severe and fatal crashes. This finding is in line with those of Eberhardt et al. [21], Kmet et al. [22], and Gonzalez et al. [23], who indicated that fatality rates in rural areas are higher than those in urban locations.
The analysis of distracted driving based on human factors revealed that males were responsible for almost two-thirds of the crashes on both rural and suburban roadways. This percentage is reasonable considering that the number of licensed male drivers in Jordan is almost twice that of licensed female drivers [23]. The differences between genders in terms of distracted driving were investigated using an independent samples t-test. Statistically significant differences with a small effect size were found between male and female drivers under three conditions, namely road surface conditions, weather conditions, and lighting conditions. As reported by Young et al. [13], distractions and road and environmental factors are expected to make the driving task more demanding, thus leading to impaired driving performance.
Differences were noted between drivers’ age groups in that younger age groups were causing crashes due to distracted driving almost three times more often than older groups. This finding is in line with that of Regan et al. [12], who suggested that older and/or more experienced drivers are more skillful at conducting multiple activities while driving, unlike younger and/or less experienced drivers. The slight difference in percentages of crashes between age groups for rural and suburban areas can be attributed to the more demanding driving tasks on suburban roads due to higher traffic volumes and extra accessing maneuvers.
Road aggressiveness is one important human factor that was not included in the crash records. Alonso et al. [19] indicated that drivers who tend to have several accidents give less importance to elements that can affect the driving task. The number and types of traffic violations (accident history) of drivers can be used to indicate the road aggressiveness factor. Therefore, the availability of the driver’s accident record in the crash report can be very helpful in studying driving behaviors and can contribute to a better understanding of driver distraction for reducing road crashes.
The study of the effect of time-related factors on distracted driving showed that the majority of crashes occur on “no holiday” days and during weekdays, which can be attributed to the higher exposure to risky situations resulting from higher traffic volumes that occur on roads on regular working days. Rural roadways showed a slightly higher occurrence of distracted driving crashes during weekdays, although suburban roads showed more crashes during weekends. Morning and night-time crashes were slightly more frequent on suburban roadways; this could be due to the higher traffic volumes on suburban roadways during these times. Meanwhile, rural roadways showed a higher percentage of crashes due to distracted driving at midday; this could also be attributed to the active movement of traffic on rural roads during this time.
Young et al. [13] indicated that distraction on different areas and road types may vary. Weather, traffic, and road conditions influence the demandingness of the driving task. Therefore, the characteristics of crashes caused by distracted driving according to road- and environment-related factors were investigated. The result of the independent samples t-test revealed that four variables were statistically significant with a small effect size: at junction, road grade, number of lanes, and weather condition. The percentage of at-junction crashes was slightly higher on suburban roads, which could be attributed to the higher demandingness level of the driving task due to higher traffic volumes. The majority of distracted driving crashes were seen on level grades, under dry surface conditions, in clear weather, and on two-lane roads for both rural and suburban areas. Suburban roads witnessed more crashes with distracted driving as the drivers’ fault during clear weather and daylight times, whereas more crashes were recorded on rural roadways when the lighting conditions were dark. This is consistent with Stutts et al. [32], who found that those who were distracted at the time of their crashes were less likely to be traveling on multi-lane roadways and were less likely to have crashed at an intersection or other road junction.
Casado-Sanz et al. [25] suggested using the physical severance index in future research, which considers the distribution of urban land as a relationship between the difference in the built areas on both sides of the road and the total built area. Territorial variables (built environment and physical severance) can affect the occurrence of accidents. Since the available data provide the coordinates of crashes, it might be possible to consider such territorial variables in future studies.
The analysis of the crashes caused by distracted driving as the drivers’ fault according to crash-type- and vehicle-related factors showed that collision was the most common crash type in both rural and suburban areas. The crash types and the number of vehicles involved were statistically significantly different between rural and suburban roads. Collision and run-off-road (ROR) crashes occurred in higher percentages on rural roads, whereas more pedestrian crashes were seen on suburban road sections. The high percentage of pedestrian crashes in suburban areas makes sense, as pedestrians are seen in urban and suburban areas more often and are only occasionally seen on rural roadways. Crashes that involved more than one vehicle were seen in higher percentages in suburban road sections, which could be explained by the existence of traffic-congested sections in suburban areas. The number of distracted driving crashes involving one vehicle was higher in rural areas due to less traffic and higher speeds.
As presented in the previous section, the highest percentages of crashes on suburban roads occurred at speeds of 40–80 km/h, while for rural roads, the highest percentages of crashes occurred at speeds of 60–100 km/h. Crashes at speeds of higher than 100 km/h seemed to occur on rural roads only. This is consistent with earlier findings by Thomason [24], who reported the same result about suburban roadways and rural highways. As for vehicle type, we noticed that both automobiles and light vehicles comprised more than 80% of vehicles involved in the reported crashes. Rural roads witnessed a higher percentage of crashes caused by distracted driving involving automobiles, medium vehicles, and tractor vehicles. A similar finding was reported by Stutts et al. [32], who indicated that distracted drivers were more likely to be driving during non-daylight hours and were more likely to be driving a pickup truck, van, or sport utility vehicles.
One of the major limitations of the present study is that the obtained data lack, in some respects, important details that, if they existed, would deliver more thorough and useful results about distraction. Therefore, it is recommended that accident reports be carefully designed to include all specific details, such as the type of distraction factor (visual, manual, cognitive, and auditory) that caused the driver’s distraction. Providing such details in the crash report would help eliminate confusion caused by interrelated information and would deliver complete information that will be significantly helpful to this field of research. It is also suggested that crash reports should include information on the number of accidents that drivers were previously involved in. Having this factor available can help researchers examine the effect of aggressive driving, as recommended by Alonso et al. [19], on all kinds of crashes, including distraction.
5. Conclusions
The aim of this study was to highlight the risk of driver distraction, which is one of the major driver’s faults, in causing traffic crashes that cost great losses of lives and resources. Most drivers’ faults that cause crashes on rural and suburban roadways were identified. Crashes caused by distracted driving were examined, and the differences between crashes on rural and suburban roadways were investigated. Based on the findings of this study, the following can be concluded:
Comprising almost one-fourth of the reported crashes (24.19%), distracted driving was the second most frequent driver fault causing crashes on both rural and suburban roadways.
- (1)
- Distracted driving was the second most hazardous fault causing fatalities and injuries on both rural and suburban roadways, comprising an average of nearly 22% of all reported fatalities and injuries.
- (2)
- Distracted driving on rural highways appeared to be more fatal, whereas suburban roadways witnessed more severe injuries.
- (3)
- Six variables were found to be statistically significant but with small effect size values: at junction, road grade, number of lanes, weather condition, crash type, and number of vehicles involved.
- (4)
- Statistically significant differences between gender groups only exist under three conditions: road surface conditions, weather conditions, and lighting conditions.
- (5)
- High percentages of distracted-driving-related crashes on rural and suburban roadways were noticed among the following categories: males, drivers aged 25–39 years, non-holidays, weekdays, tangent sections, two-way divided roads, not at junction, level roads, two-lane roads, clear weather, dry surface, daylight, and automobile vehicles.
- (6)
- Differences between crashes on rural and suburban roadways caused by distracted driving showed that a higher percentage of crashes occurred on rural roadways when the driver was female, the driver was 25–39 years old, the time was midday, the road was two-way and undivided, it was not at a junction section, there were two lanes, the driving speed was above 80 km/h, and light vehicles were involved.
- (7)
- Differences between crashes on rural and suburban roadways caused by distracted driving showed that a higher percentage of crashes occurred on suburban roadways when the driver was male, the driver was 40–54 years old, the time was morning and night, the road was two-way and divided, it was at a junction, there were three lanes, there was clear weather, the driving speed was 40–60 km/h, and automobiles and medium vehicles were involved.
- (8)
- Collision and ROR crash types were seen on rural roadways in a higher percentage, whereas more pedestrian crashes were observed on suburban roadway sections.
Considering the above-mentioned results, it is recommended that practitioners and policy-makers establish specialized programs and awareness campaigns intended to educate drivers on several factors that affect their driving abilities and emphasize and stimulate mindful driving with a sufficient cognitive and visual emphasis on driving initiatives and the traffic environment. It is also recommended that this same dataset be used in the future for model development to obtain a deeper understanding about factors that contribute to distracted driving and simulate the impact of distracted driving on the injury or crash severity of a given crash.
Author Contributions
Conceptualization, T.M.A.-R.; Methodology, T.M.A.-R. and A.A.U.; formal analysis, T.M.A.-R., A.A.U. and A.A.A.-O.; Investigation; T.M.A.-R.; resources, T.M.A.-R.; data curation, T.M.A.-R.; writing—original draft, T.M.A.-R., A.A.U. and A.A.A.-O.; writing—review and editing, T.M.A.-R., A.A.U. and A.A.A.-O., visualization, T.M.A.-R., A.A.U. and A.A.A.-O.; supervision, T.M.A.-R.; project administration, T.M.A.-R. All authors have read and agreed to the published version of the manuscript.
Funding
This research did not receive any specific grant from any funding agencies.
Data Availability Statement
The data that support the findings of this study are not publicly available due to privacy/ethical restrictions, but they are available from the corresponding author upon reasonable request.
Acknowledgments
Thanks are due to the Jordan Traffic Institute officers for providing the traffic accident data that were used in this study.
Conflicts of Interest
The authors declare no conflict of interest.
References
- Goodsell, R.; Cunningham, M.; Chevaleir, A. Driver Distraction: A Review of Scientific Literature. National Transportation Commission. ARRB Report. Project No. 013817. 2019. Available online: https://www.ntc.gov.au/sites/default/files/assets/files/Driver%20distraction%20%20A%20review%20of%20scientific%20literature.pdf (accessed on 25 December 2020).
- Cunningham, M.; Regan, M. Driver distraction and inattention. In Safe Mobility: Challenges, Methodology and Solutions; Transport and, Sustainability; Lord, D., Washington, S., Eds.; Emerald Publishing: Bingley, UK, 2018; Volume 11. [Google Scholar]
- Pashler, H. Overlapping mental operations in serial performance with preview. Q. J. Exp. Psychol. 1994, 47, 161–191. [Google Scholar] [CrossRef] [PubMed]
- Chand, A.; Bhasi, A.B. Effect of driver distraction contributing factors on accident causations—A review. AIP Conf. Proc. 2019, 2134, 060004. [Google Scholar] [CrossRef]
- Casado-Sanz, N.; Guirao, B.; Attard, M. Analysis of the risk factors affecting the severity of traffic accidents on Spanish crosstown roads: The driver’s perspective. Sustainability 2020, 12, 2237. [Google Scholar] [CrossRef] [Green Version]
- Dingus, T.A.; Guo, F.; Lee, S.; Antin, J.F.; Perez, M.; Buchanan-King, M.; Hankey, J. Driver crash risk factors and prevalence evaluation using naturalistic driving data. Proc. Natl. Acad. Sci. USA 2016, 113, 2636–2641. [Google Scholar] [CrossRef] [PubMed] [Green Version]
- Jannat, M.; Hurwitz, D.S.; Monsere, C.; Funk, K.H., II. The role of driver’s situational awareness on right-hook bicycle-motor vehicle crashes. Saf. Sci. 2018, 110, 92–101. [Google Scholar] [CrossRef]
- Parnell, K.J.; Stanton, N.A.; Plant, K. Where are we on driver distraction? Methods, approaches and recommendations. Theor. Issues Ergon. Sci. 2018, 19, 578–605. [Google Scholar] [CrossRef]
- Louw, T.; Madigan, R.; Carsten, O.; Merat, N. Were they in the loop during automated driving? Links between visual attention and crash potential. Inj. Prev. 2017, 23, 281–286. [Google Scholar] [CrossRef] [Green Version]
- Singh, S. Critical Reasons for Crashes Investigated in the National Motor Vehicle Crash Causation Survey (No. DOT HS 812 506). Traffic Safety Facts Crash. Stats Series. National Highway Traffic Safety Administration. 2018. Available online: https://crashstats.nhtsa.dot.gov/Api/Public/ViewPublication/812506 (accessed on 25 December 2020).
- Khattak, A.J.; Ahmad, N.; Wali, B.; Dumbaugh, E. A taxonomy of driving errors and violations: Evidence from the naturalistic driving study. Accid. Anal. Prev. 2021, 151, 105873. [Google Scholar] [CrossRef]
- Regan, M.A.; Hallett, C.; Gordon, C.P. Driver distraction and driver inattention: Definition, relationship and taxonomy. Accid. Anal. Prev. 2011, 43, 1771–1781. [Google Scholar] [CrossRef] [PubMed]
- Young, K.; Regan, M.; Lee, D. Factors moderating the impact of distraction on driving performance and safety. In Driver Distraction: Theory, Effects, and Mitigation; Regan, M.A., Lee, D.J., Young, K.L., Eds.; CRC Press Taylor & Francis Group: Boca Raton, FL, USA, 2008. [Google Scholar]
- Young, K.; Regan, M. Driver distraction: A review of the literature’. In Distracted Driving; Faulks, I.J., Regan, M., Stevenson, M., Brown, J., Porter, A., Irwin, J.D., Eds.; Australasian College of Road Safety: Sydney, NSW, Australia, 2007; pp. 379–405. Available online: https://www.researchgate.net/publication/251312763_Driver_Distraction_A_Review_of_the_Literature (accessed on 29 December 2020).
- Bayly, M.; Young, K.; Regan, M. Sources of distraction inside the vehicle and their effects on driving performance. In Driver Distraction: Theory, Effects and Mitigation; Regan, M.A., Lee, J.D., Young, K.L., Eds.; CRC Press: Boca Raton, FL, USA, 2008. [Google Scholar]
- Horberry, T.; Edquist, J. Distractions outside the vehicle. In Driver Distraction: Theory, Effects, and Mitigation; Regan, M.A., Lee, J.D., Young, K., Eds.; CRC Press: Boca Raton, FL, USA, 2008; pp. 215–228. [Google Scholar]
- Cunningham, M.; Regan, M.; Imberger, K. Understanding driver distraction associated with specific behavioural interactions with in-vehicle and portable technologies. J. Australas. Coll. Road Saf. 2017, 28, 27–40. [Google Scholar]
- Caird, J.K.; Simmons, S.M.; Wiley, K.; Johnston, K.A.; Horrey, W.J. Does talking on a cell phone, with a passenger, or dialing affect driving performance? An updated systematic review and meta-analysis of experimental studies. Hum. Factors 2018, 60, 101–133. [Google Scholar] [CrossRef] [PubMed] [Green Version]
- Alonso, F.; Esteban, C.; Montoro, L.; Serge, A. Conceptualization of aggressive driving behaviors through a Perception of aggressive driving scale (PAD). Transp. Res. Part F Traffic Psychol. Behav. 2019, 60, 415–426. [Google Scholar] [CrossRef]
- Xuedong, Y.; Wang, B.; An, M.; Zhang, C. Distinguishing between Rural and Urban Road Segment Traffic Safety Based on Zero-Inflated Negative Binomial Regression Models. Discret. Dyn. Nat. Soc. 2012, 2012, 789140. [Google Scholar] [CrossRef] [Green Version]
- Eberhardt, M.S.; Ingram, D.D.; Makuc, D.M. Urban and Rural Health ChartBook Health; National Center for Health Statistics: Hyattsville, MD, USA, 2001. [Google Scholar]
- Kmet, L.; Brasher, P.; Macarthur, C. A small area study of motor vehicle crash fatalities in Alberta, Canada. Accid. Anal. Prev. 2003, 35, 177–182. [Google Scholar] [CrossRef]
- Gonzalez, R.P.; Cummings, G.R.; Phelan, H.A.; Harlin, S.; Mulekar, M.; Rodning, C.B. Increased rural vehicular mortality rates: Roadways with higher speed limits or excessive vehicular speed? J. Trauma 2007, 63, 1360–1363. [Google Scholar] [CrossRef]
- Thomason, C. Roadway Design Manual. Manual Notice 2020-1. Chapter 3. 2020. Available online: http://onlinemanuals.txdot.gov/txdotmanuals/rdw/suburban_roadways.htm (accessed on 13 December 2020).
- Casado-Sanz, N.; Guirao, B.; Gálvez-Pérez, D. Population ageing and rural road accidents: Analysis of accident severity in traffic crashes with older pedestrians on Spanish crosstown roads. Res. Transp. Bus. Manag. 2019, 30, 100377. [Google Scholar] [CrossRef]
- Department of Statistics/Jordan (DOS). Yearbook for 2019. 2019. Available online: http://dosweb.dos.gov.jo/DataBank/Population_Estimares/PopulationEstimates.pdf (accessed on 23 December 2020). (In Arabic)
- Driver and Vehicle License Department (DVDL) Records/Jordan. Available online: https://www.dvld.gov.jo/dvldportal/faces/misc/annualReport?_afrLoop=676752790620234&_afrWindowMode=0&_afrWindowId=b7oefx2nz_204#%40%3F_afrWindowId%3Db7oefx2nz_204%26_afrLoop%3D676752790620234%26_afrWindowMode%3D0%26_adf.ctrl-state%3Db7oefx2nz_272 (accessed on 26 December 2020). (In Arabic)
- Ababsa, M. Atlas of Jordan: History, Territories and Society; Presses de l’Ifpo, Institut Français du Proche-Orient: Beirut, Lebanon, 2013. [Google Scholar]
- Directorate of General Security. The Annual Report of Traffic Accidents in Jordan for the Year 2019 AD; Amman Jordan. 2019. Available online: https://www.psd.gov.jo/images/docs/TrafficRep2019.pdf (accessed on 23 December 2020). (In Arabic)
- Pallant, J. SPSS Survival Manual: A Step-by-Step Guide to Data Analysis Using IBM SPSS, 7th ed.; Open University Press: London, UK, 2020. [Google Scholar]
- Cohen, J. Statistical Power Analysis for the Behavioral Science; Academic Press: New York, NY, USA, 1988. [Google Scholar]
- Stutts, J.C.; Reinfurt, D.W.; Staplin, L.O.R.E.N.; Rodgman, E.A. The Role of Driver Distraction in Traffic Crashes. AAA Foundation for Traffic Safety, USA. 2001. Available online: https://rosap.ntl.bts.gov/view/dot/17717 (accessed on 3 January 2021).
Figure 1.
Severity of crashes with distracted driving listed as driver’s fault on rural and suburban roads.
Figure 1.
Severity of crashes with distracted driving listed as driver’s fault on rural and suburban roads.

Table 1.
Percentage and severity of crashes based on drivers’ faults.
| Drivers’ Faults | % of All Crashes | Fatal | Severe Injury | Moderate Injury | Slight Injury | PDO |
|---|---|---|---|---|---|---|
| Lane departure | 25.95 | 95 | 202 | 67 | 919 | 2089 |
| Distracted driving | 24.19 | 37 | 85 | 35 | 522 | 1963 |
| Tailgating | 22.79 | 3 | 13 | 10 | 215 | 2211 |
| Traffic rules violation | 9.6 | 5 | 16 | 0 | 164 | 901 |
| Wrong-way driving | 8.21 | 2 | 9 | 2 | 69 | 799 |
| Reckless driving | 2.63 | 8 | 10 | 12 | 65 | 219 |
| Control loss | 2.44 | 6 | 10 | 5 | 68 | 207 |
| Ignoring road signs | 1.63 | 1 | 1 | 0 | 17 | 152 |
| Overtaking | 0.71 | 1 | 14 | 22 | 33 | 60 |
| Commercial vehicle loads | 0.55 | 0 | 0 | 0 | 2 | 55 |
| Speeding | 0.44 | 1 | 7 | 4 | 22 | 31 |
| Red light running | 0.29 | 0 | 2 | 0 | 17 | 24 |
| Improper stopping | 0.28 | 0 | 3 | 2 | 10 | 21 |
| Reckless at curves | 0.24 | 4 | 0 | 3 | 15 | 16 |
| Vehicle defect | 0.03 | 0 | 2 | 0 | 5 | 1 |
| Brake failure | 0.02 | 0 | 0 | 0 | 0 | 2 |
Table 2.
Distracted driving crashes on rural and suburban roadways according to human- and time-related factors.
Table 2.
Distracted driving crashes on rural and suburban roadways according to human- and time-related factors.
| Factor | Category | Percent of Total Distracted Driving Crashes on | ||
|---|---|---|---|---|
| Rural and Suburban | Rural | Suburban | ||
| Gender | Females | 32.81 | 33.93 | 30.77 |
| Males | 67.19 | 66.07 | 69.23 | |
| Age | Below 25 | 5.4 | 5.81 | 4.76 |
| 25–39 | 64.2 | 64 | 63.11 | |
| 40–54 | 22.7 | 22.61 | 24.46 | |
| Above 60 | 7.7 | 7.58 | 7.67 | |
| Holiday | No | 96.04 | 96.29 | 95.6 |
| Yes | 3.96 | 3.71 | 4.4 | |
| Time of the day | Evening | 32.4 | 32.46 | 32.31 |
| Morning | 13.03 | 12.04 | 14.72 | |
| Midday | 36.93 | 38.35 | 34.51 | |
| Night time | 17.64 | 17.15 | 18.46 | |
| Day | Weekday | 75.32 | 75.67 | 74.73 |
| Weekend | 24.68 | 24.33 | 25.27 | |
Table 3.
Distracted driving crashes according to road- and environment-related factors.
| Factor | Category | Percent of Total Distracted Driving Crashes on | ||
|---|---|---|---|---|
| Rural and Suburban | Rural | Suburban | ||
| Alignment | Curve | 1.7 | 1.54 | 1.98 |
| Tangent | 98.3 | 98.46 | 98.02 | |
| Direction | One-way | 6.19 | 8.06 | 2.97 |
| Two-way divided | 66.07 | 62.04 | 73.07 | |
| Two-way undivided | 27.74 | 29.9 | 23.96 | |
| At junction | No | 87.62 | 88.67 | 85.82 |
| Yes | 12.38 | 11.33 | 14.18 | |
| Grade | Ascending | 7.36 | 7.36 | 7.36 |
| Descending | 4.41 | 3.33 | 6.27 | |
| Level | 88.23 | 89.31 | 86.37 | |
| No. of lanes | 1 | 0.65 | 1.02 | 0 |
| 2 | 87.62 | 98.98 | 68.13 | |
| 3 | 11.73 | 0 | 31.87 | |
| Surface | Dry | 95.45 | 94.81 | 95.7 |
| Wet | 4.55 | 5.19 | 4.3 | |
| Weather | Clear | 95.1 | 94.24 | 96.7 |
| Dust | 0.73 | 1.03 | 0.22 | |
| Fog | 0.57 | 0.7 | 0.33 | |
| Rain | 2.99 | 3.2 | 2.53 | |
| Snow | 0.04 | 0.06 | 0 | |
| Storm wind | 0.57 | 0.77 | 0.22 | |
| Lighting | Dark | 2.87 | 3.65 | 1.54 |
| Daylight | 68.07 | 67.35 | 69.23 | |
| Night with insufficient lighting | 9.07 | 8.52 | 10 | |
| Night with sufficient lighting | 14.24 | 14.6 | 13.62 | |
| Sunrise | 0.57 | 0.83 | 0.22 | |
| Sunset | 5.18 | 5.05 | 5.39 | |
Table 4.
Distracted driving crashes according to crash-type- and vehicle-related factors.
| Factor | Category | Percent of Total Distracted Driving Crashes on | ||
|---|---|---|---|---|
| Rural and Suburban | Rural | Suburban | ||
| Crash type | Collision | 83.62 | 89.18 | 74.07 |
| Pedestrian | 14.24 | 7.87 | 25.16 | |
| ROR | 2.14 | 2.95 | 0.77 | |
| Vehicles involved | 1 | 25.81 | 29.58 | 19.34 |
| 2 | 68.28 | 65.81 | 72.31 | |
| 3 | 5.14 | 3.84 | 7.14 | |
| 4 or more | 0.77 | 0.77 | 1.21 | |
| Vehicle speed | <40 | 4.05 | 3.91 | 4.29 |
| 40–<60 | 35.32 | 26.18 | 50.99 | |
| 60–<80 | 32.36 | 32.52 | 32.09 | |
| 80–100 | 16.46 | 33.87 | 12.63 | |
| >100 | 11.81 | 3.52 | 0 | |
| Vehicle type | Automobile | 50.93 | 52.56 | 48.13 |
| Heavy vehicle | 5.7 | 4.29 | 8.13 | |
| Light vehicle | 32.61 | 27.78 | 40.88 | |
| Medium vehicle | 8.74 | 12.36 | 2.53 | |
| Motorcycle | 0.28 | 0.45 | 0 | |
| Tractor vehicle | 1.74 | 2.56 | 0.33 | |
Table 5.
Independent samples t-test: rural vs. suburban roadways.
| Variables | F | t | df | Sig. (2-Tailed) | Effect Size |
|---|---|---|---|---|---|
| Holiday | 2.804 | −0.838 | 2470 | 0.402 | - |
| Time of day | 4.133 | −0.059 | 1830.403 | 0.953 | - |
| Weekday/weekend | 1.098 | 0.527 | 2470 | 0.599 | - |
| Horizontal alignment | 2.680 | 0.819 | 2470 | 0.413 | - |
| Direction | 44.532 | −0.392 | 2196.874 | 0.695 | - |
| At junction | 16.922 | −2.020 | 1756.910 | 0.044 | 0.001 |
| Road grade | 35.640 | 2.821 | 1601.583 | 0.005 | 0.001 |
| No. of lanes | 10,307.452 | 20.620 | 909.000 | 0.000 | 0.01 |
| Surface condition | 7.561 | −1.419 | 2112.542 | 0.156 | - |
| Weather condition | 17.967 | −2.256 | 2203.157 | 0.024 | 0.001 |
| Lighting condition | 0.643 | −0.069 | 2470 | 0.945 | - |
| Crash type | 137.264 | 6.956 | 1770.340 | 0.000 | 0.003 |
| No. of vehicles involved | 31.675 | 5.507 | 2094.276 | 0.000 | 0.002 |
Table 6.
Independent sample t-test: males vs. females.
| Variables | F | t | df | Sig. (2-Tailed) | Effect Size |
|---|---|---|---|---|---|
| Holiday | 9.101 | 1.439 | 1413.70 | 0.150 | - |
| Time of day | 0.136 | −0.245 | 2470 | 0.806 | - |
| Weekday/weekend | 7.885 | 1.396 | 1656.194 | 0.163 | - |
| Horizontal alignment | 1.369 | 0.584 | 2470 | 0.559 | - |
| Direction | 3.639 | −0.529 | 2470 | 0.597 | - |
| At junction | 0.036 | 0.095 | 2470 | 0.924 | - |
| Road grade | 2.244 | 0.731 | 2470 | 0.465 | - |
| No. of lanes | 14.353 | 1.933 | 1755.32 | 0.053 | - |
| Surface condition | 80.096 | 5.155 | 2385.556 | 0.000 | 0.002 |
| Weather condition | 68.251 | 4.812 | 2400.721 | 0.000 | 0.002 |
| Lighting condition | 15.670 | 2.224 | 1774.341 | 0.026 | 0.001 |
| Crash type | 0.044 | 0.104 | 2470 | 0.917 | - |
| No. of vehicles involved | 1.393 | −0.056 | 2470 | 0.956 | - |
Publisher’s Note: MDPI stays neutral with regard to jurisdictional claims in published maps and institutional affiliations. |
© 2021 by the authors. Licensee MDPI, Basel, Switzerland. This article is an open access article distributed under the terms and conditions of the Creative Commons Attribution (CC BY) license (https://creativecommons.org/licenses/by/4.0/).
Share and Cite
MDPI and ACS Style
Al-Rousan, T.M.; Umar, A.A.; Al-Omari, A.A. Characteristics of Crashes Caused by Distracted Driving on Rural and Suburban Roadways in Jordan. Infrastructures 2021, 6, 107. https://0-doi-org.brum.beds.ac.uk/10.3390/infrastructures6080107
AMA Style
Al-Rousan TM, Umar AA, Al-Omari AA. Characteristics of Crashes Caused by Distracted Driving on Rural and Suburban Roadways in Jordan. Infrastructures. 2021; 6(8):107. https://0-doi-org.brum.beds.ac.uk/10.3390/infrastructures6080107
Chicago/Turabian StyleAl-Rousan, Taleb M., Abdullahi A. Umar, and Aslam A. Al-Omari. 2021. "Characteristics of Crashes Caused by Distracted Driving on Rural and Suburban Roadways in Jordan" Infrastructures 6, no. 8: 107. https://0-doi-org.brum.beds.ac.uk/10.3390/infrastructures6080107