
Performance of Polymer Cementitious Coatings for High-Voltage Electrical Infrastructure


1
Department of Civil Engineering, Xi’an Jiaotong-Liverpool University, Suzhou 215123, China
2
State Key Laboratory of Power Grid Environmental Protection, High Voltage Department, China Electric Power Research Institute, Wuhan 430074, China
3
Department of Civil and Environmental Engineering, University of Surrey, Guildford GU2 7HX, UK
4
Department of Civil and Environmental Engineering, Imperial College, London SW7 2AZ, UK
*
Author to whom correspondence should be addressed.
Infrastructures 2021, 6(9), 125; https://0-doi-org.brum.beds.ac.uk/10.3390/infrastructures6090125
Submission received: 14 July 2021
/
Revised: 26 August 2021
/
Accepted: 30 August 2021
/
Published: 2 September 2021
(This article belongs to the Special Issue Reusing, Recycling and Repurposing Infrastructure: Components and Construction Materials)
Abstract
:This paper investigates the electrical, thermal and mechanical properties as well as the environmental performance of polymer cementitious composites (PCCs) as sustainable coating materials for underground power cables and as high-voltage insulators. Particular focus is placed on the optimised mix design and the effect of the manufacturing method on the performance of PCCs, incorporating liquid styrene and acrylic (SA) monomers, wollastonite and muscovite. Microstructural investigations, together with results from strength tests, indicate that the manufacturing method is a key performance parameter. Experimental results show that PCC mixes containing 25% SA emulsion, 12.5% wollastonite and no muscovite provide the most favourable dielectric properties from the mixes investigated. The PCC material has a dielectric strength up to 16.5 kV/mm and a dielectric loss factor lower than 0.12. Additional experiments also show that PCC has good thermal stability and thermal conductivity. The mechanical strength tests indicate that PCC specimens possess reliable strengths which are applicable in structural design. Environmental assessments also show that PCCs possess significantly lower embodied energy and embodied carbon than conventional plastic insulating materials.
1. Introduction
Combinations of cement or alternative fillers such as wollastonite or muscovite and polymeric compounds have been investigated in the past in the form of polymer powders, water-soluble polymers or polymer emulsions. Polymer composite materials are frequently used in situations where an increase in durability, adhesion with substrates or thermal or waterproofing properties is required [1,2,3,4]. Amongst the most used compounds in combination with cement are styrene acrylic copolymer (SAE), styrene butadiene rubber emulsion (SBR), poly(styrene-co-hydroxyethyl methacrylate) (P(St-co-HEMA)), ethylene-vinyl acetate copolymer (EVA) and vinyl acetate-versatic vinylester (VA/VeoVA) [5]. Wollastonite is the mineral with an acicular shape which can also be regarded as a low-carbon non-hydraulic binder, as carbonation forms a heterogeneous matrix with mechanical properties similar to those of the conventional hydrated cement pastes [6,7]. Muscovite is a silicate mineral occurring as non-fibrous plates and is a good electrical and thermal insulator used in electronic equipment and transmitting capacitors, among other applications [8].
Polymers can interact with the cement components in contact with water due to ionic binding and cross-linking. During cement hydration, the polymer film formation property is inhibited, and the crystallisation process is changed [9]. The retardant effect, occurring due to the formation of a polymer membrane that encapsulates the cement grains [10], has two thrusts. The first is a delaying effect represented by a postponed hydration peak, and the second is a slowing down effect characterised by a reduced main hydration peak [11]. This not only produces an increase in the setting time but also in the porosity of the hardened material [12]. The structure of polymer-modified mortars is generally homogeneous, with a small diameter and uniformly distributed voids [2].
The polymer-modified cement microstructure is characterised by a shell configuration of polymer-containing hydrates, polymer granule beads, and nonhydrated cement grain [10]. A continuous film of polymer within the matrix forms a polymer/cement ratio of 10%, providing a structure where bicontinuous phases of the polymer and cement hydrates are intertwined [12]. However, the level of interaction between the cement and polymers seems to depend on the polymer properties, where certain types of polymers do not cause significant modifications in the microstructural profile of modified cement paste. For example, the possible interaction between VA/VeoVA copolymers and Portland cement is excluded [13].
The mechanical properties of such materials are typically enhanced by the presence of polymers [14]. For example, blends of SAE and SBR produce a synergistic effect, particularly with regard to the flexural strength, which is 20–40% higher for SAE/SBR blends compared with that of mono-emulsion-modified mortars [5]. SAE emulsion only enhances the flexural strength and tensile bond strength of a ternary binder system [15]. Additionally, SAE emulsions have good water reduction and water retention effects in mortar as well as reduced shrinkage rates. The water reduction rate reaches about 40% when the SAE emulsion-to-cement ratio is 20%, while the water retention rate is maintained at around 99% as the emulsion-to-cement ratio reaches 10% or more [16].
SAE emulsions have been successfully used in combination with cement and silica fume to enhance the dielectric constant for applications to electromagnetic shielding materials [17,18]. The presence of SB emulsion with an emulsion/cement mass ratio ≤0.30 increases the relative permittivity (dielectric constant) (2 kHz) from 27 to 43, which is attributed to the compatibility between the cement and the emulsion solid (Wang and Chung 2018). In terms of the increase in relative permittivity, the cement is the main contributor, followed by the emulsion–cement interface. Additionally, due to the same interactions, the relative permittivity of the cement paste from 10 kHz to 1 MHz is decreased by 28% when silica fume is used, yet it is increased through the use of SB emulsion by 21% [19]. It was also shown that between PVA emulsion (polyvinyl acetate) and the styrene-acrylic SA copolymer, the latter performs better, as its matrix allows a reduction in the percolation threshold to a larger extent [17].
Wollastonite fibers are used as fillers in ceramics or plastics, as these enhance the water vapour transmission in paint films [20]. More recently, combinations with cement or other fillers have been investigated [6,21]. Accelerated carbonation tests showed that 25 wt.% of natural wollastonite in wollastonite-Portland cement pastes exhibits a high compressive strength over 80 Mpa [22]. A combination of wollastonite particles replacing cement at a rate of 50% and recycled waste ceramic aggregates reduced the workability of the concrete but increased the compressive, tensile and flexural strengths by about 24%, 4% and 10%, respectively, in comparison with the reference concrete [21]. Moreover, cement mortars with 12% and 15% synthetic wollastonite had higher compressive and flexural strengths than the control mortar [7]. Mechanically activated muscovite can react with hydration products in cement pastes such as calcium hydroxide to form calcium silicate hydrate [23,24].
Although wollastonite can be regarded as a non-hydraulic binder, and muscovite has been used as a reactive powder to produce hardened cementitious composites, these fillers received limited research attention, even though they can provide enhanced thermal and electrical insulation properties. Moreover, studies regarding their electric and electromagnetic performance are lacking. The influence of polymer emulsions such as styrene-acrylic copolymers on the microstructural properties, electrical and thermal insulation as well as the mechanical properties of the cementitious materials incorporating wollastonite or muscovite has not been examined before [25].
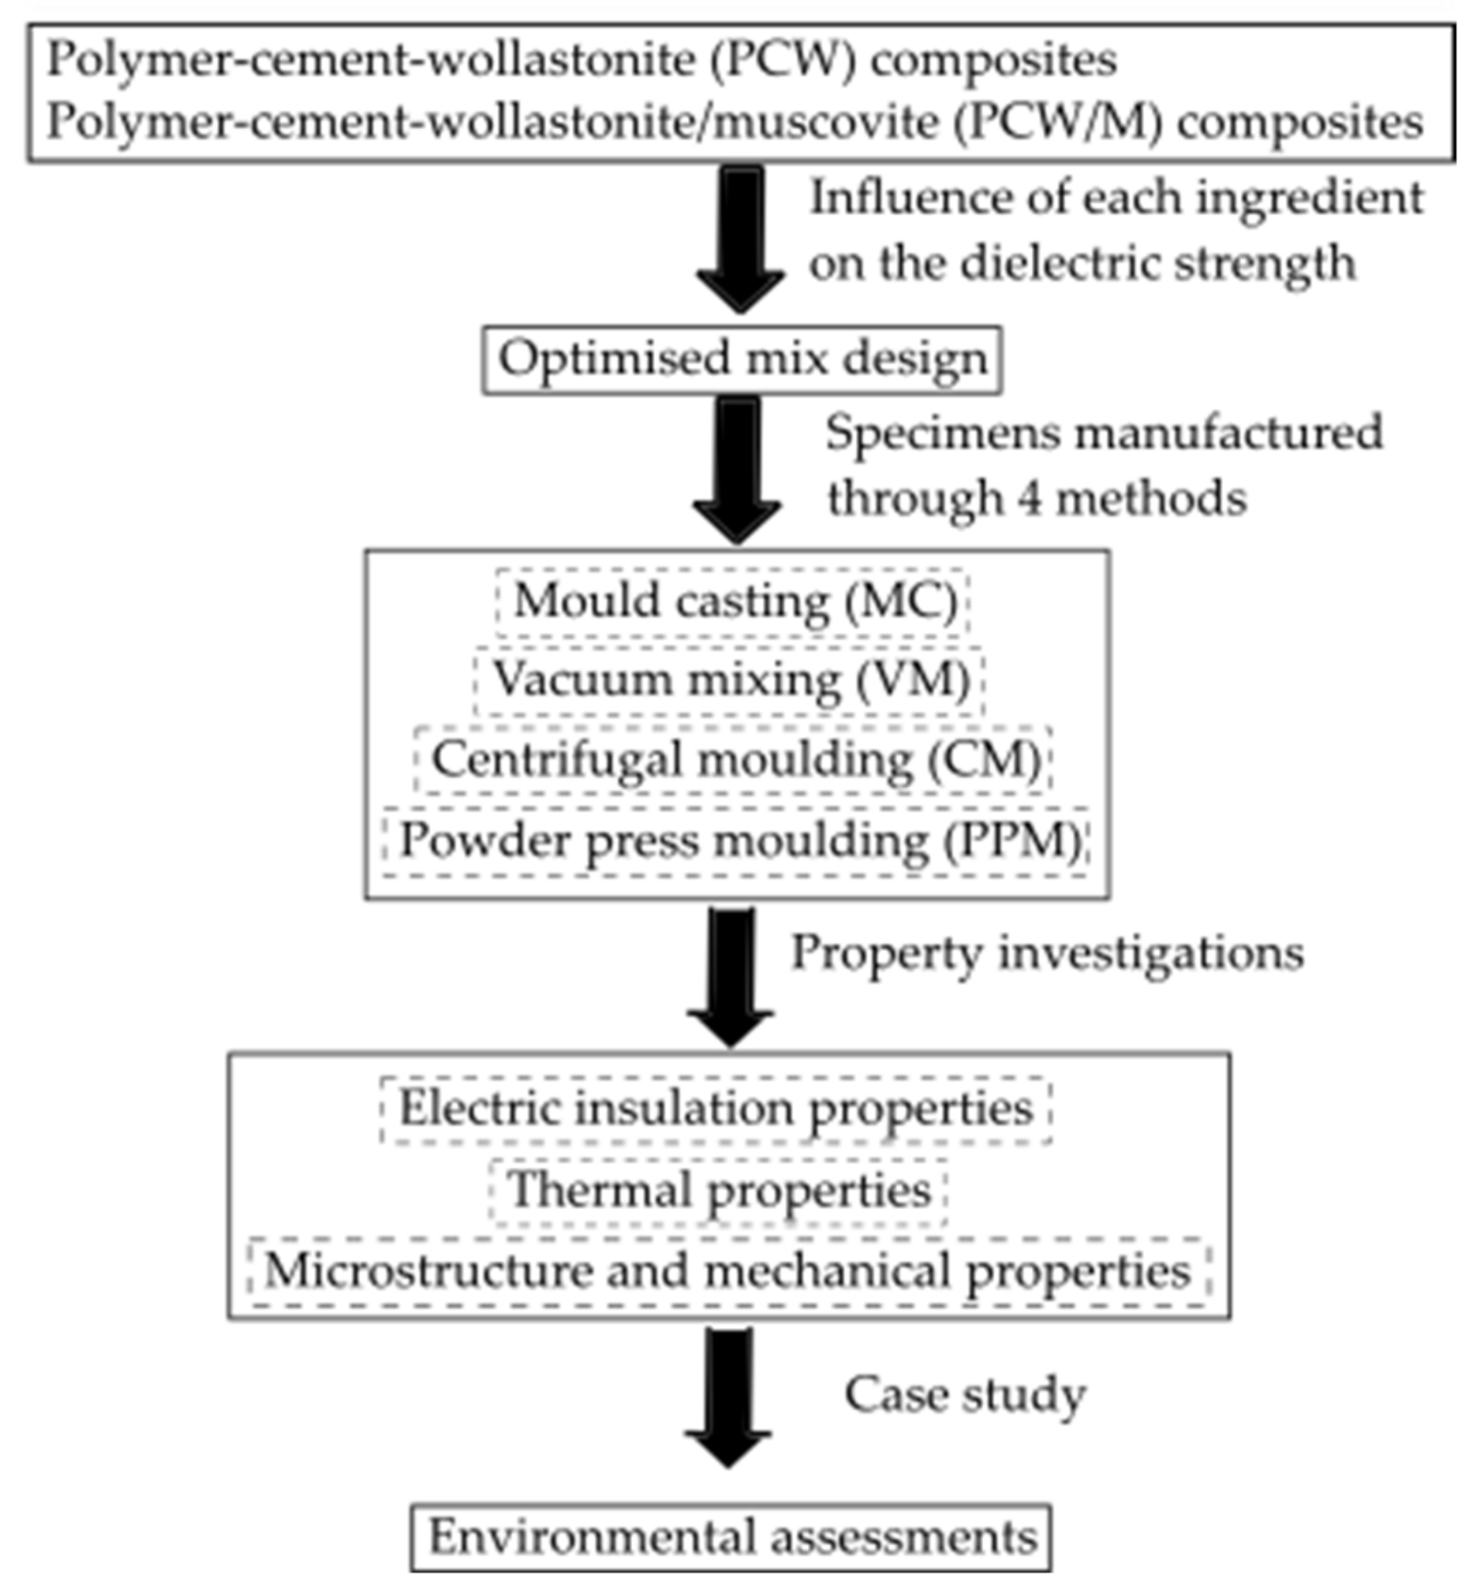
To this end, a series of experimental studies are proposed in this investigation to examine the performance of polymer-cement-wollastonite (PCW) and polymer-cement-wollstonite/muscovite (PCW/M) composites. The general flow chart of the experimental investigation embedded in this study is shown in Figure 1, with the details demonstrated in the following sections. An ‘optimised’ mix design and a suitable manufacturing method for styrene-acrylic polymer cement composites are proposed. The study presents the experimental results and assessment of the factors influencing the electric, thermal, microstructural and mechanical properties of PCCs, as well as a comparative environmental assessment. This work is part of a China Electric Power Research Institute-funded project that aims to develop sustainable electric insulating materials that can be used as structural elements [25]. The results provide key information on the fundamental properties of PCC materials and contribute to the development of cementitious construction materials with high-value electrical and thermal performance.
2. Materials and Mixes
2.1. Material Details
The polymer cementitious composites (PCCs) described in this paper were provided with liquid styrene and acrylic (SA) monomers, wollastonite and muscovite. Portland cement PO 42.5R with a specific gravity of 3.10 was used as the main binder of the mixes [26]. The cement composition included 22.77% SiO2, 5.15% Fe2O3, 8.26% Al2O3, 53.25% CaO, 1.85% MgO, 0.36% Na2O, 0.85% K2O and 2.34% SO3.
Aside from cement, the mixes included two types of fillers: admixtures and tap water. One of the fillers took the form of calcium metasilicate or wollastonite fibres (CaSiO3: about 48.28% CaO and 51.72% SiO2), which are white to yellowish-brown naturally occurring minerals. These fibres were used in other studies to improve the strengths of the composite material, with the aim to enhance its thermal properties and reduce its electrical conductivity [21,22].
The second filler, hydrated aluminium potassium silicate or muscovite (Al2K2O6Si), is a silicate mineral occurring as non-fibrous plates. This is a good electrical and thermal insulator used in electronic equipment and transmitting capacitors [8]. Muscovite provided by a local supplier was also considered filler in PCC to improve the workability and electric insulation of the material. Micro-size (5–20 μm) wollastonite and muscovite particles were chosen to enhance the compactness of the mixture and provide enhanced thermal and electrical properties.
The polymer emulsion used in the PCC mix was a commercial copolymer of liquid styrene and acrylic (SA) monomers [27]. These were chosen to contribute to the water and heat resistance as well as to aid insulation and material flexibility. The SA emulsion (XQS-200) used in these mixes had a solid particle content of 48–52%, monomer content of 0.1–0.5%, a pH of 8–9 and a viscosity between 1000–2000 (mPass). Additionally, a polycarboxylate superplasticiser and an aqueous defoamer were employed to improve the workability of the mixture [28,29].
2.2. Manufacturing Methods
A total of 51 mixes of polymer cementitious composites (PCCs) consisting of more than 400 disc samples, with a diameter of 50 mm and a thickness of 2 mm, were prepared to determine the dielectric strengths of the material and the optimum mix ratio. In order to perform a detailed study regarding the influence of the manufacturing methods on the insulation properties of PCC materials, mixes with and without muscovite particles were prepared for each method. In total, 8 types of mixes with a minimum of 4 samples for each mix were prepared. For all mixing procedures, disc samples (Ø50 × 2 mm) were prepared for material investigations, while cylindrical (Ø5 × 12.5 mm) and prismatic specimens (Ø5 × 5 × 12.5 mm) were prepared for the compressive and flexural experiments. Details of each preparation process and the sample details are discussed below. After manufacturing, all samples were kept in a curing chamber (YH-40-B) for 14 days and oven dried at a temperature of 60 °C prior to testing.
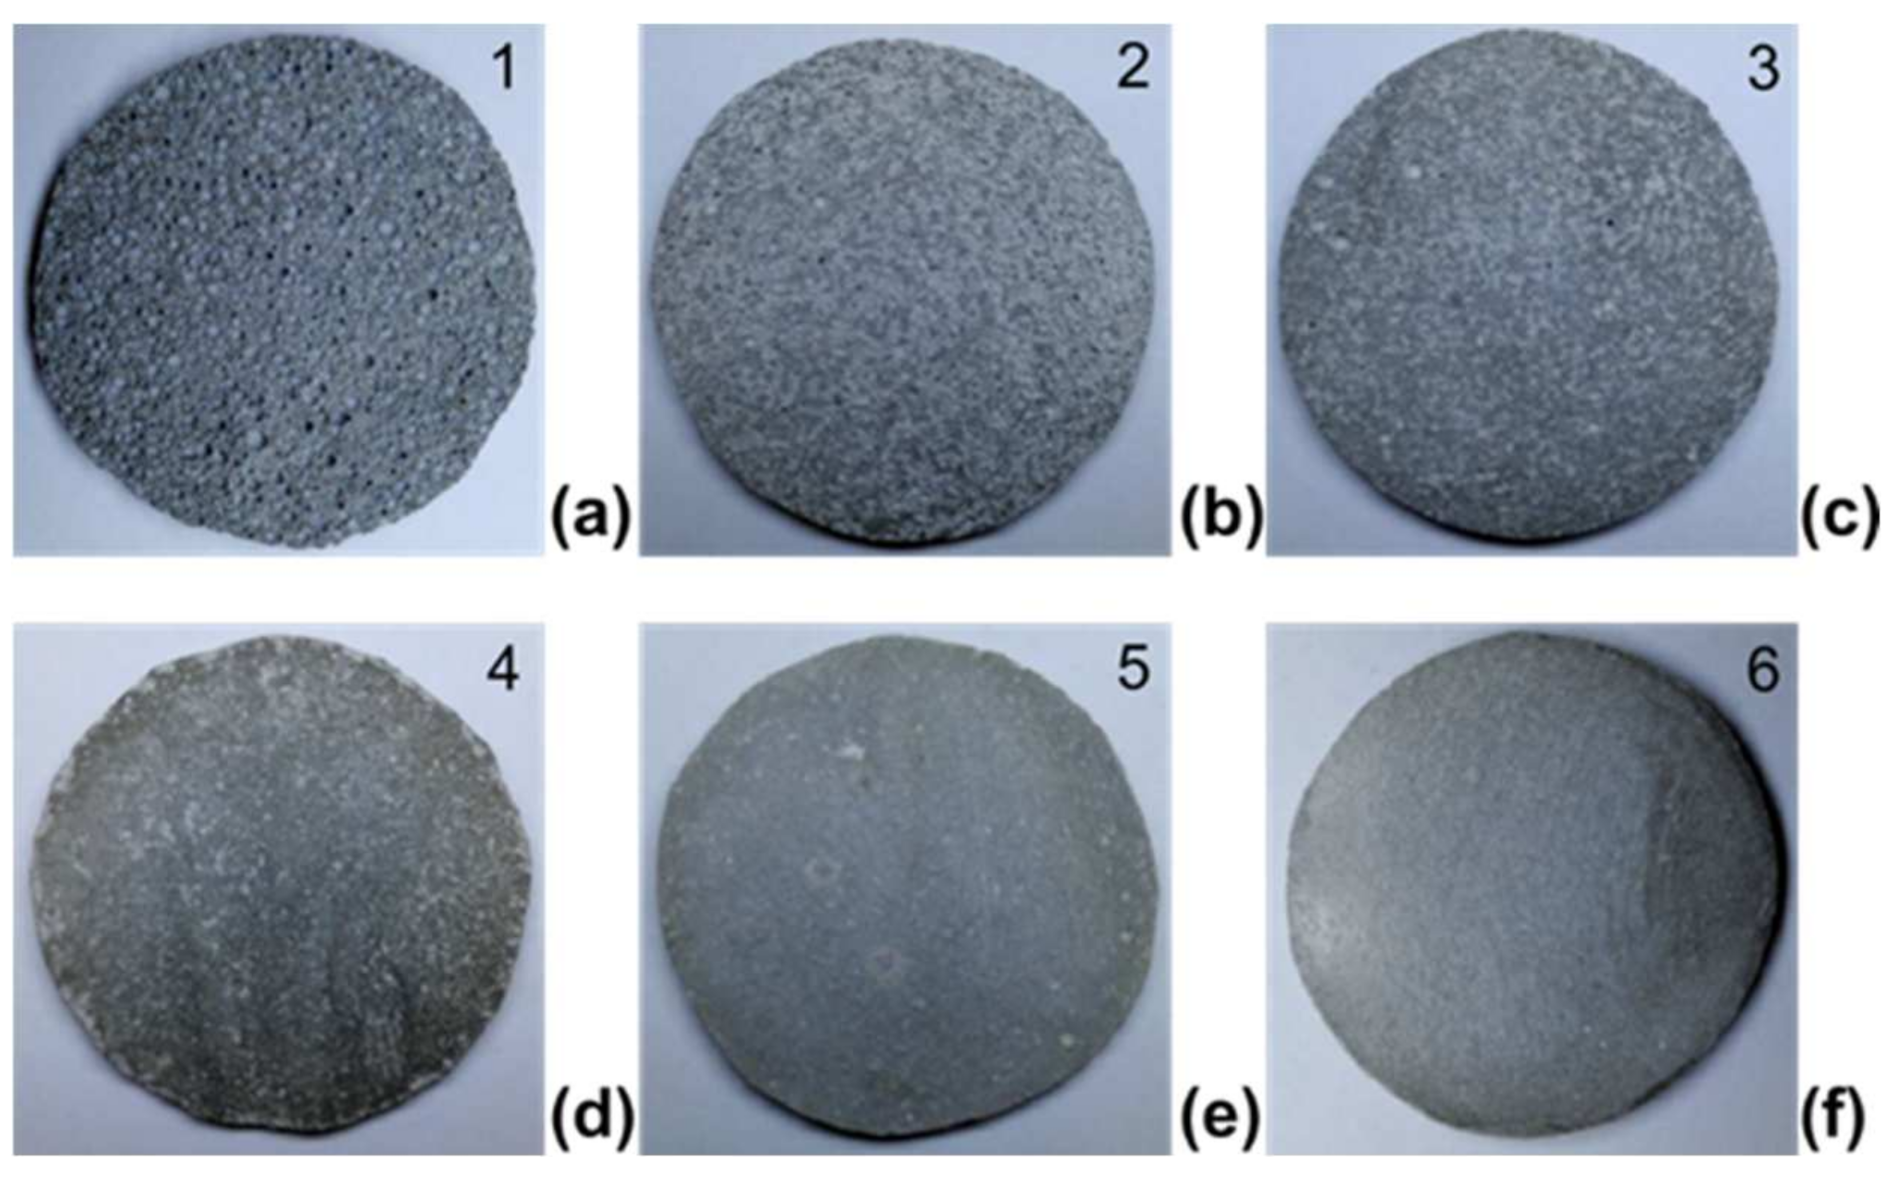
A rotary mixing machine with a capacity of 5 L was used for the mould casting (MC). Figure 2 shows the samples obtained through this mixing. Through a smoother appearance, from left to right, images of samples 1–6 showed gradual improvement in mix homogeneity and less porosity. The mixing rate was 200 rot/min. Initially, the styrene and acrylic (SA) emulsion and water were mixed together in the container for 1–2 min, and the water-to-cement ratio (w/c) was 0.25. The cement and filler particles were then mixed for 3–5 min. The ready mixed SA emulsion and additives were then added, and all the materials were mixed for another 20 min.
The vacuum mixing (VM) method aims to reduce the air content in the paste to the minimum during the mixing procedure. The mixing system used in this study contained a three-neck round container, an electric rotary rod and a vacuum pump (SHZ-D(III)). As before, the SA emulsion and designed amount of water (w/c = 0.25) were mixed in the container first and were then followed by the cement and filler particles. All the materials were mixed for 20 min, while the air in the container was vacuumed during the last 5 min. Through this procedure, the air content in the mixture created by mixing was reduced to the minimum, while the moisture ratio was also maintained.
The centrifugal moulding (CM) of concrete and mortar was first used for the casting of thin wall pipes. Compared with conventional casting methods, CM allows further compaction of the cement and filler particles. In this study, use was made of a centrifuge (TG16-WS) with a maximum speed of 16,000 rot/min, a speed accuracy of ±30 rot/min, a maximum capacity of 6 × 50 mL and a relative centrifugal acceleration of 23,669× g m/s2 (g represents gravity’s acceleration). The cement, SA emulsion and filler granules were all mixed together. The same w/c ratio (0.25) was maintained in this casting method, while most of the water content was segregated from the mix under the centrifugal force. The mixture was then placed in plastic test tubes and centrifuged at a speed of 200 rot/min for 10 min.
The powder press moulding (PPM) method has been widely used in the manufacturing of insulation elements (e.g., ceramic chips). In this study, a tablet press machine (DY-30) was used for the casting of PCC samples. The cement and filler granules were dry mixed separately first in the mixing container for 2–3 min. The SA emulsion was then added to the dry powder and mixed for another 5 min. Additional water was sprayed on the surface of the dry mixes with further mixing for 2–3 min. The mixes were then idled for 2 h to ensure the evaporation of added water. The mixtures were subsequently placed in the moulding system with non-spill spoons. A compressive pressure of 10 MPa was applied on the sample and maintained for 10 s.
2.3. Mix Optimisation
In the first step, a total of 21 mixes with cement and SA emulsion ratios between 0% and 50% were prepared as listed in Table 1, using the mould casting method (MC) described above. Mix references adopt the format TTxx, in which xx indicates the amount of SA emulsion in grams added to the mix while maintaining constant cement and admixtures. After selecting the mixes with the highest dielectric strength [30,31], the dielectric loss, thermogravimetric and infrared spectroscopy analyses, microstructural investigations as well as the thermal conductivity and main mechanical properties of the specimens manufactured through different methods were assessed, and they are described in detail in Section 3, Section 4 and Section 5.
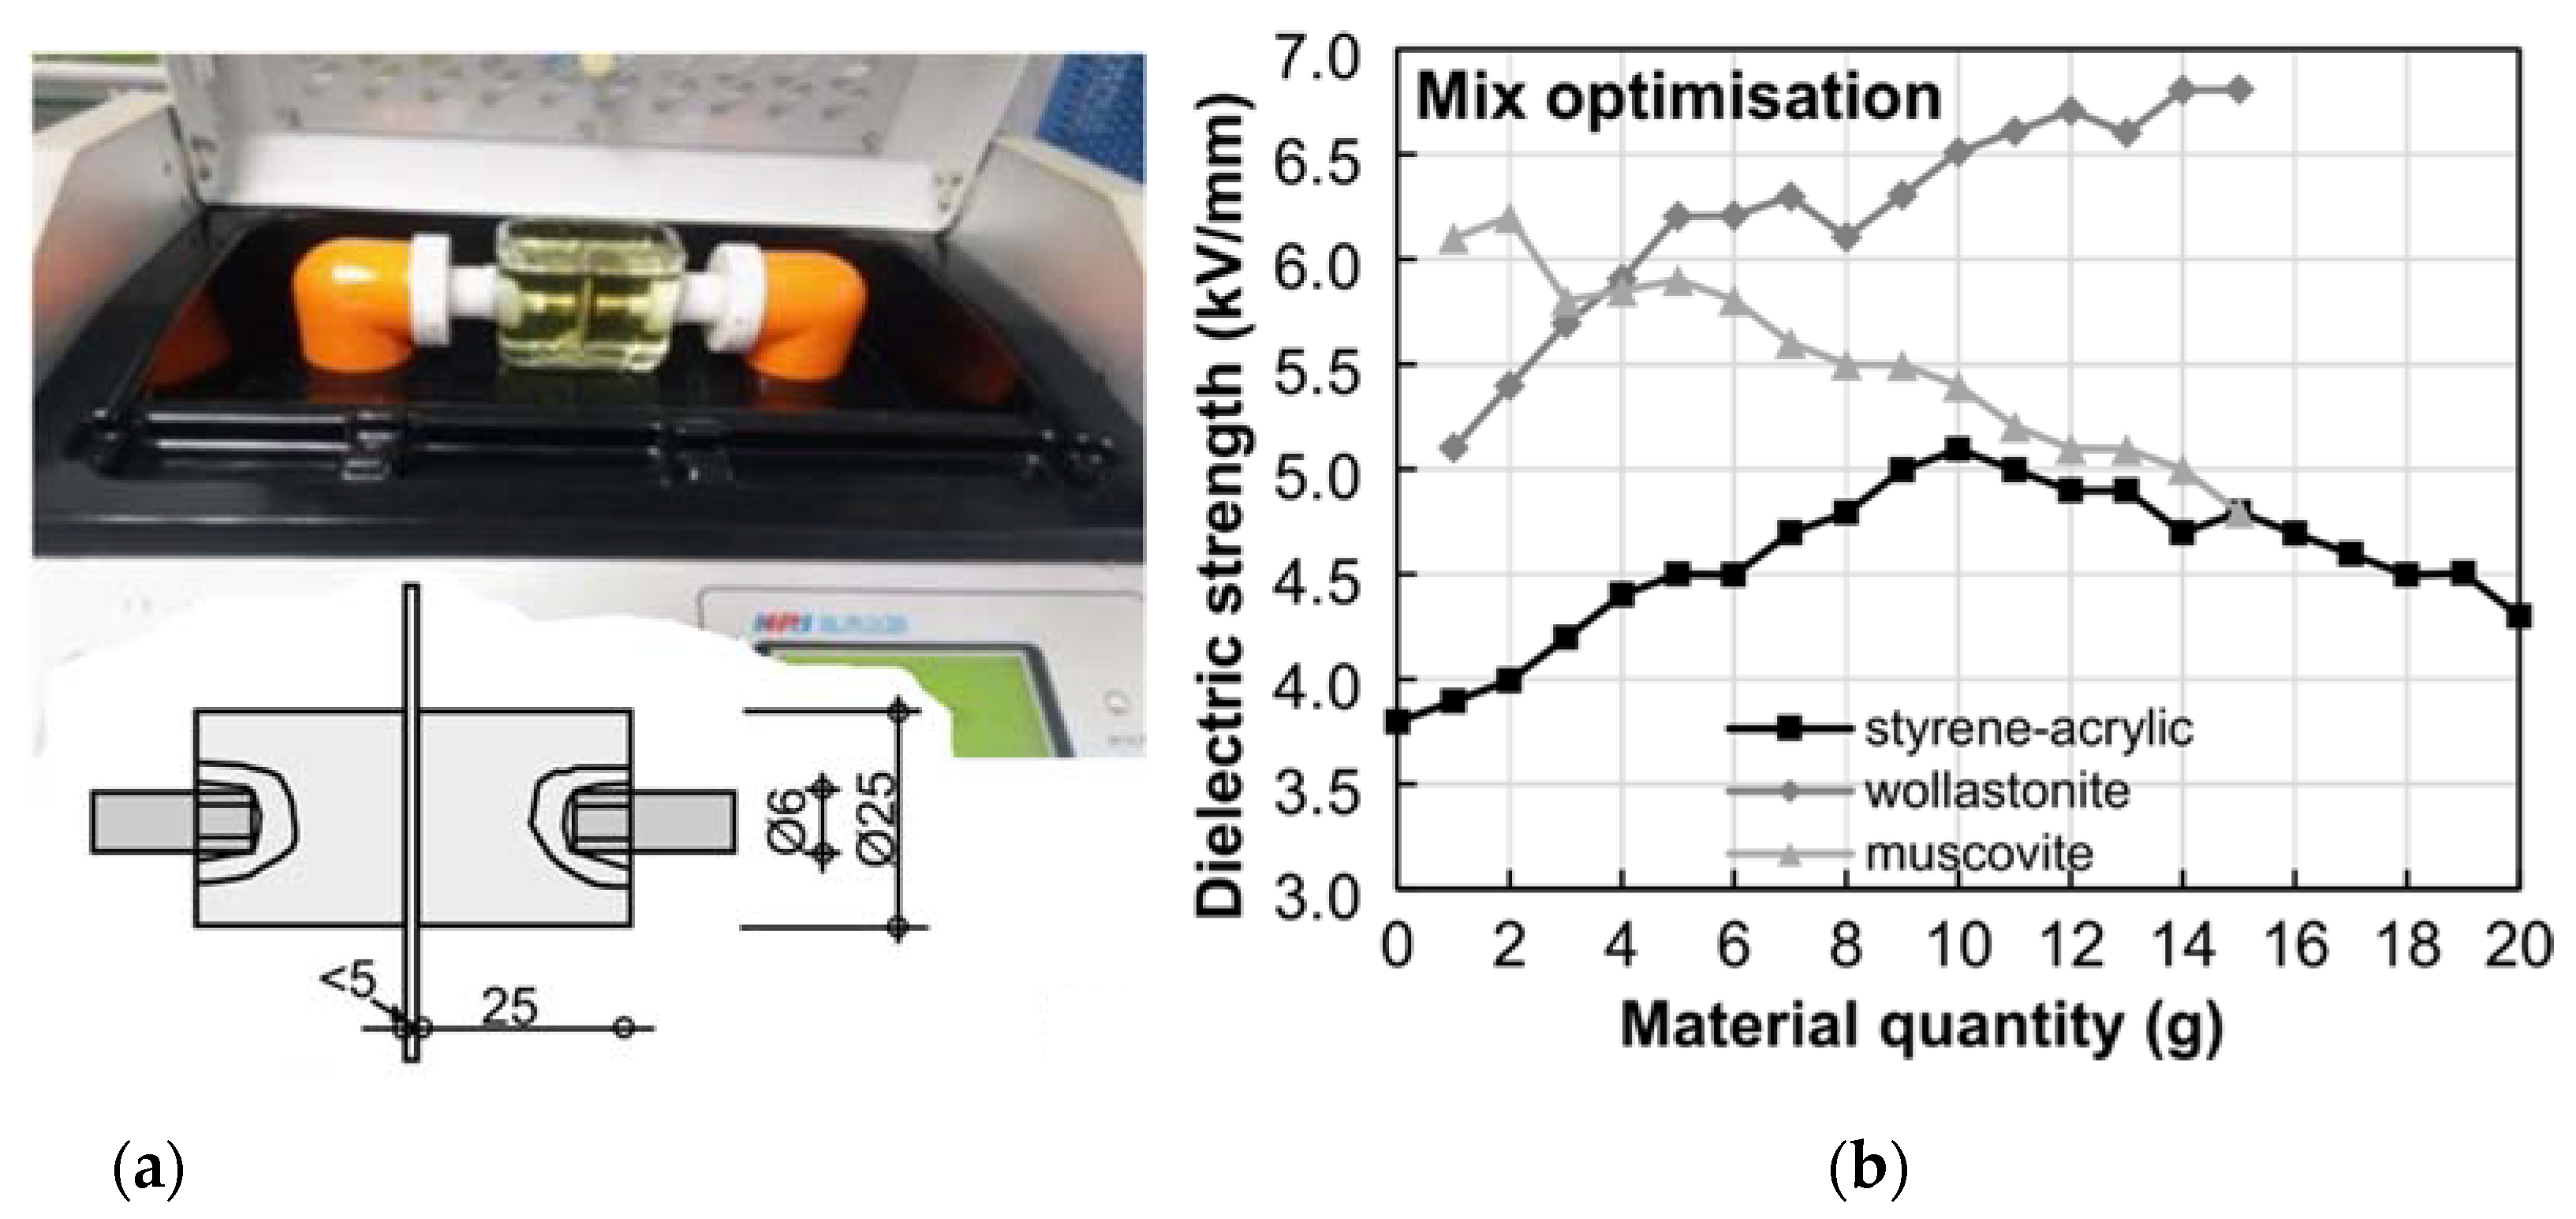
As shown from the test set-up and the results in Figure 3, from a total of 21 mixes consisting of cement, SA, admixtures and water only, the highest dielectric strength of the cement paste was reached by adding 25% SA emulsion. A further increase to the added emulsion caused a reduction in strength. The SA emulsion formed a grid structure between the cement particles which enhanced the insulation properties of the material. Further increasing the emulsion, on the other hand, caused poor compatibility between the SA particles and the cement paste. Consequently, 25% SA emulsion (i.e., 10 g in each sample) was used in the optimum mix design. As shown in Table 1, a water-to-cement ratio of 0.25 was maintained during the casting to achieve a relatively compact mix and materials with adequate strength [32].
The following 15 mixes were prepared to investigate the influence of wollastonite on the insulation and workability of the PCC material. The mix reference from Table 1 and Table 2 adopts the format TWxx, in which xx indicates the amount of wollastonite in grams added to the mix, whilst the cement, SA emulsion and admixtures were kept constant. As shown in Figure 3b, the dielectric strength of the mixes increased significantly as the amount of wollastonite reached 12.5% (i.e., 5 g in each sample), which was chosen for the optimum mix. The last 15 mixes listed in Table 1 were prepared to investigate the influence of muscovite particles on the dielectric strength of the PCC. As for the previous mixes, the mix format TMxx includes the muscovite content in grams, whilst the other components were kept constant. Figure 3b indicates that although muscovite provided high insulation properties, the mix of muscovite with polymer-cement pastes reduced the dielectric strength of the mix. This was caused by the poor bonding between the muscovite powder and SA particles, and segregation of the filler and cement paste was also observed.
3. Electric Insulation Properties
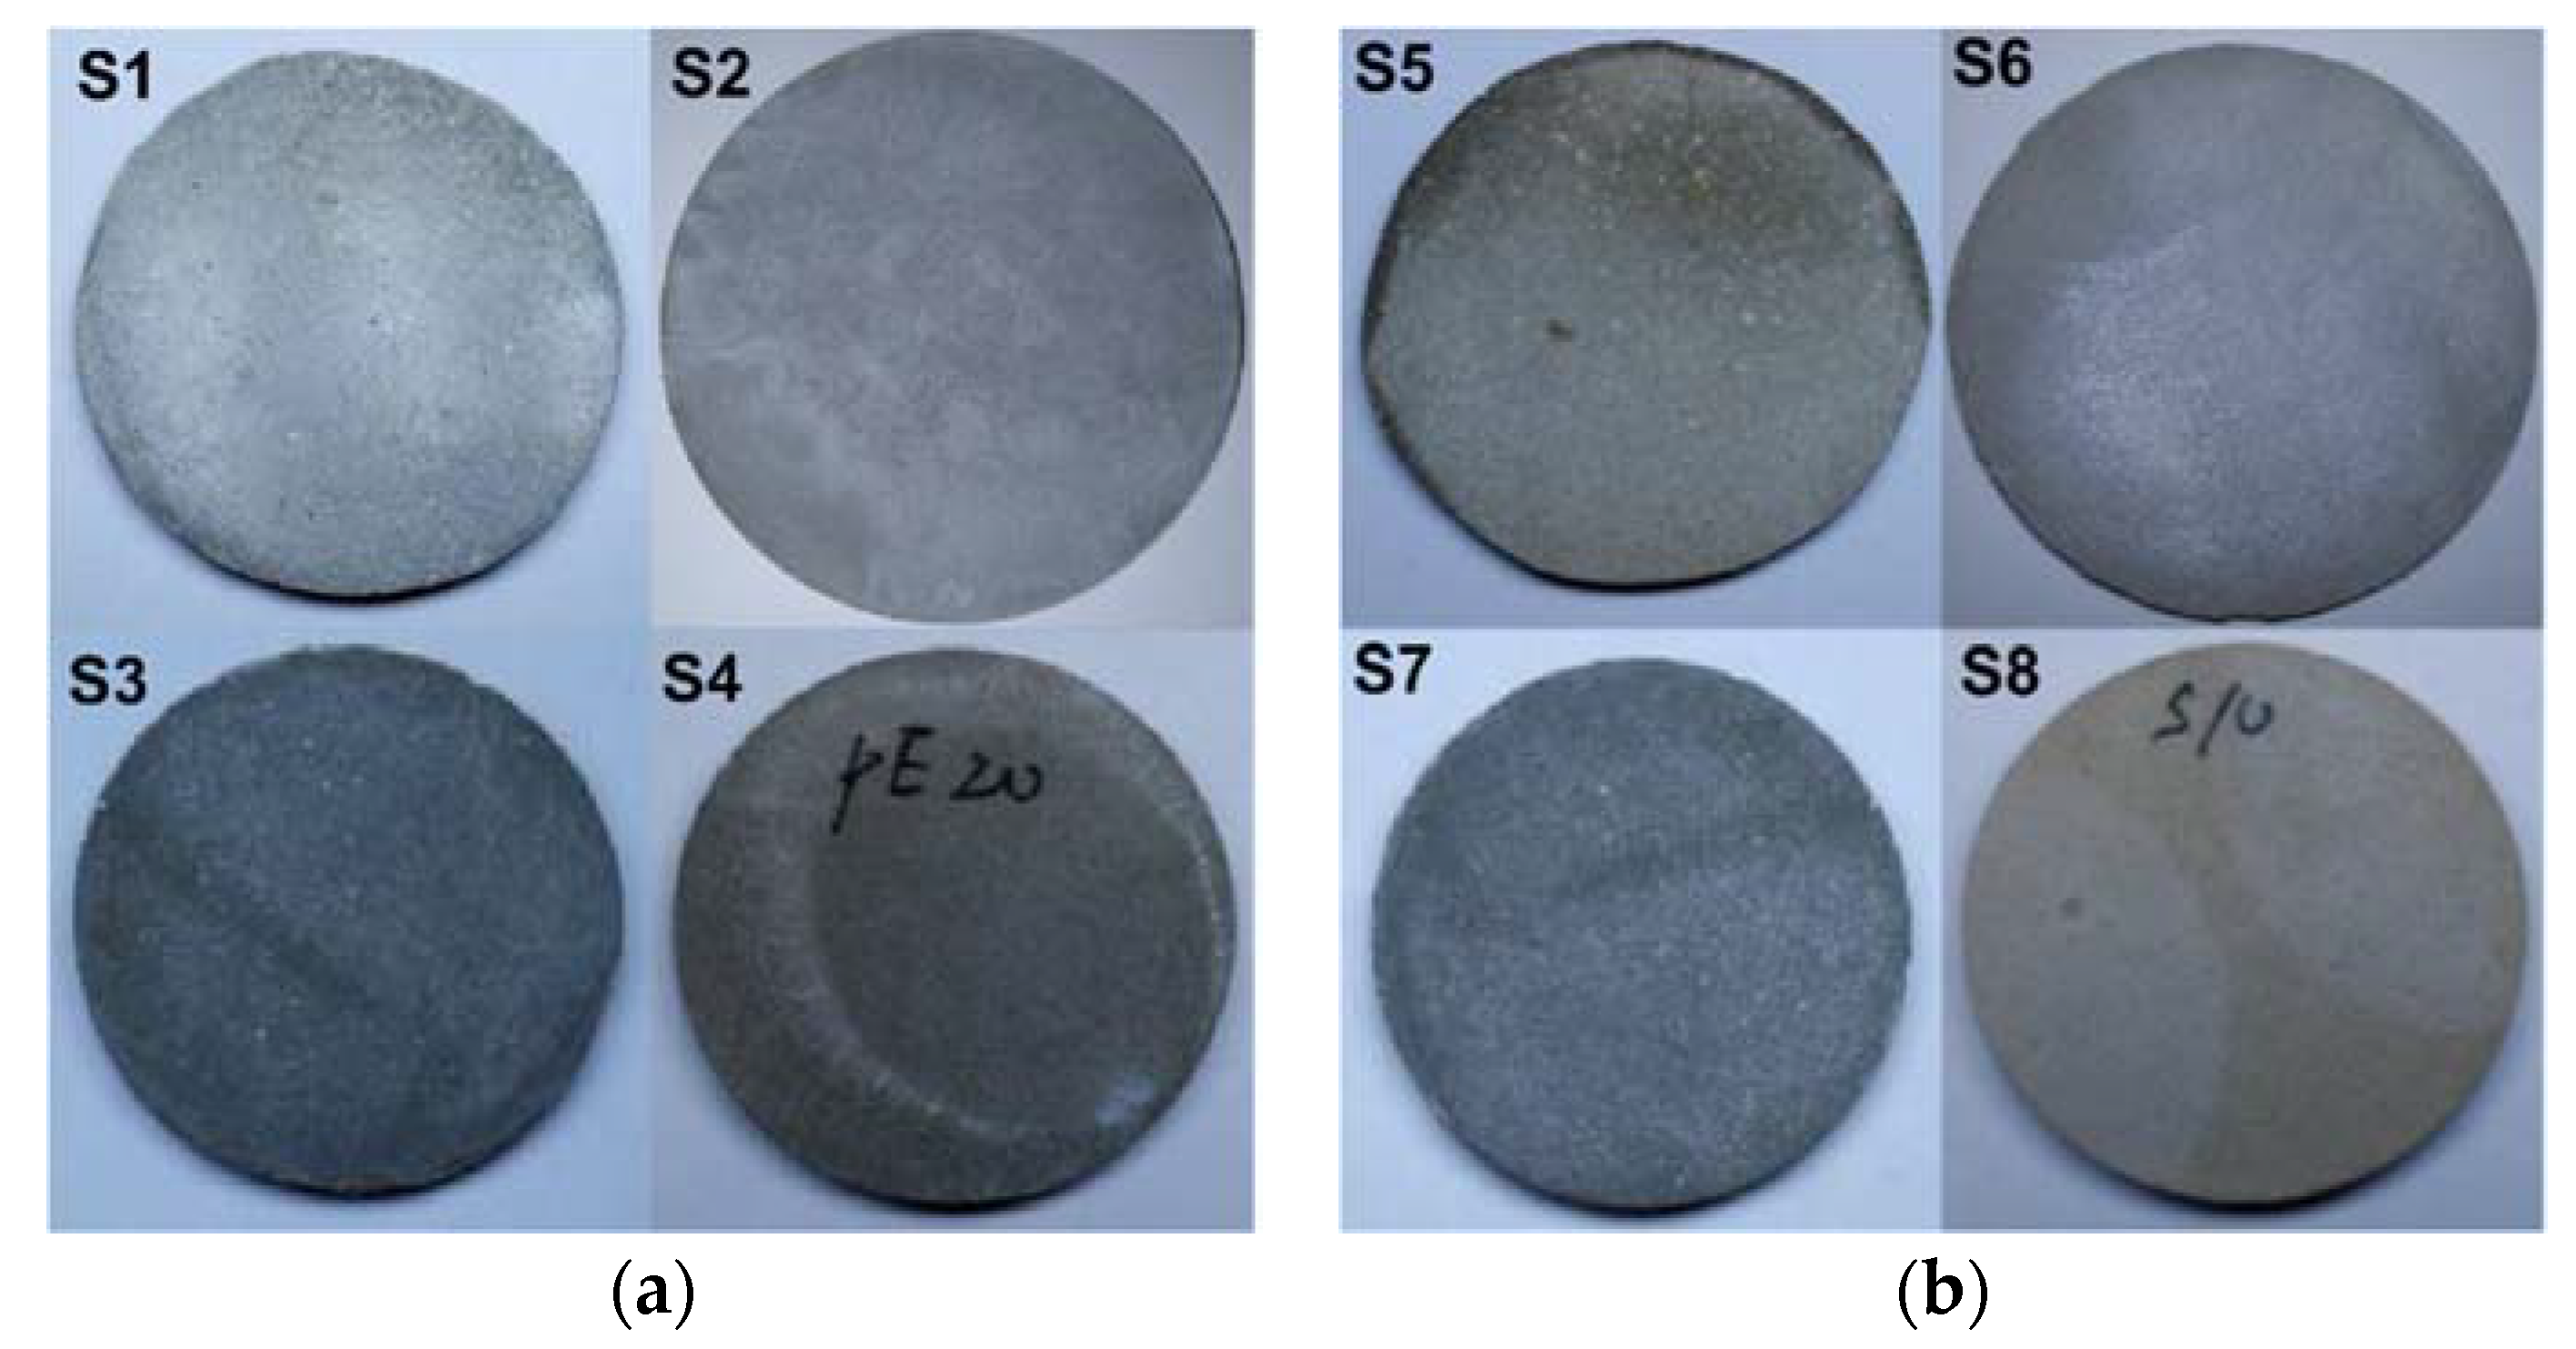
The samples prepared were divided into eight groups as shown in Table 2 and Figure 4 in order to investigate the electrical and mechanical behaviour of the polymer-cement-wollastonite composite (PCWC) and polymer-cement-wollastonite/muscovite composite (PCW/MC) materials. The amounts of cement, SA emulsion and wollastonite were chosen according to the mix optimisation described above. Particular focus was placed on the influence of the manufacturing methods on the properties of the PCC materials. The investigated properties included the dielectric strength, dielectric loss, thermal stability, infrared (IR) spectroscopy analysis, microstructural analysis, thermal conductivity and mechanical properties. The experimental procedures and corresponding results are discussed in detail in this section.
3.1. Dielectric Strength
As mentioned before, the dielectric strength (EB) is defined as the maximum voltage that the material with a unit thickness can withstand (kV/mm) before electrical breakdown occurs (i.e., when current flows through the material). A total of 24 disc samples with a size of Ø50 × 2 mm (three specimens in each group) were manufactured using the four methods with and without muscovite granules. Tests using a JY6611 machine were performed under the ambient temperature (25 °C). According to procedures recommended by the codified provisions mentioned before, an AC voltage with a frequency of 50 Hz was applied to the test specimen through an electrode, which was increased at a rate of 2 kV/s from 0. The test was manually stopped when the first spark occurred.
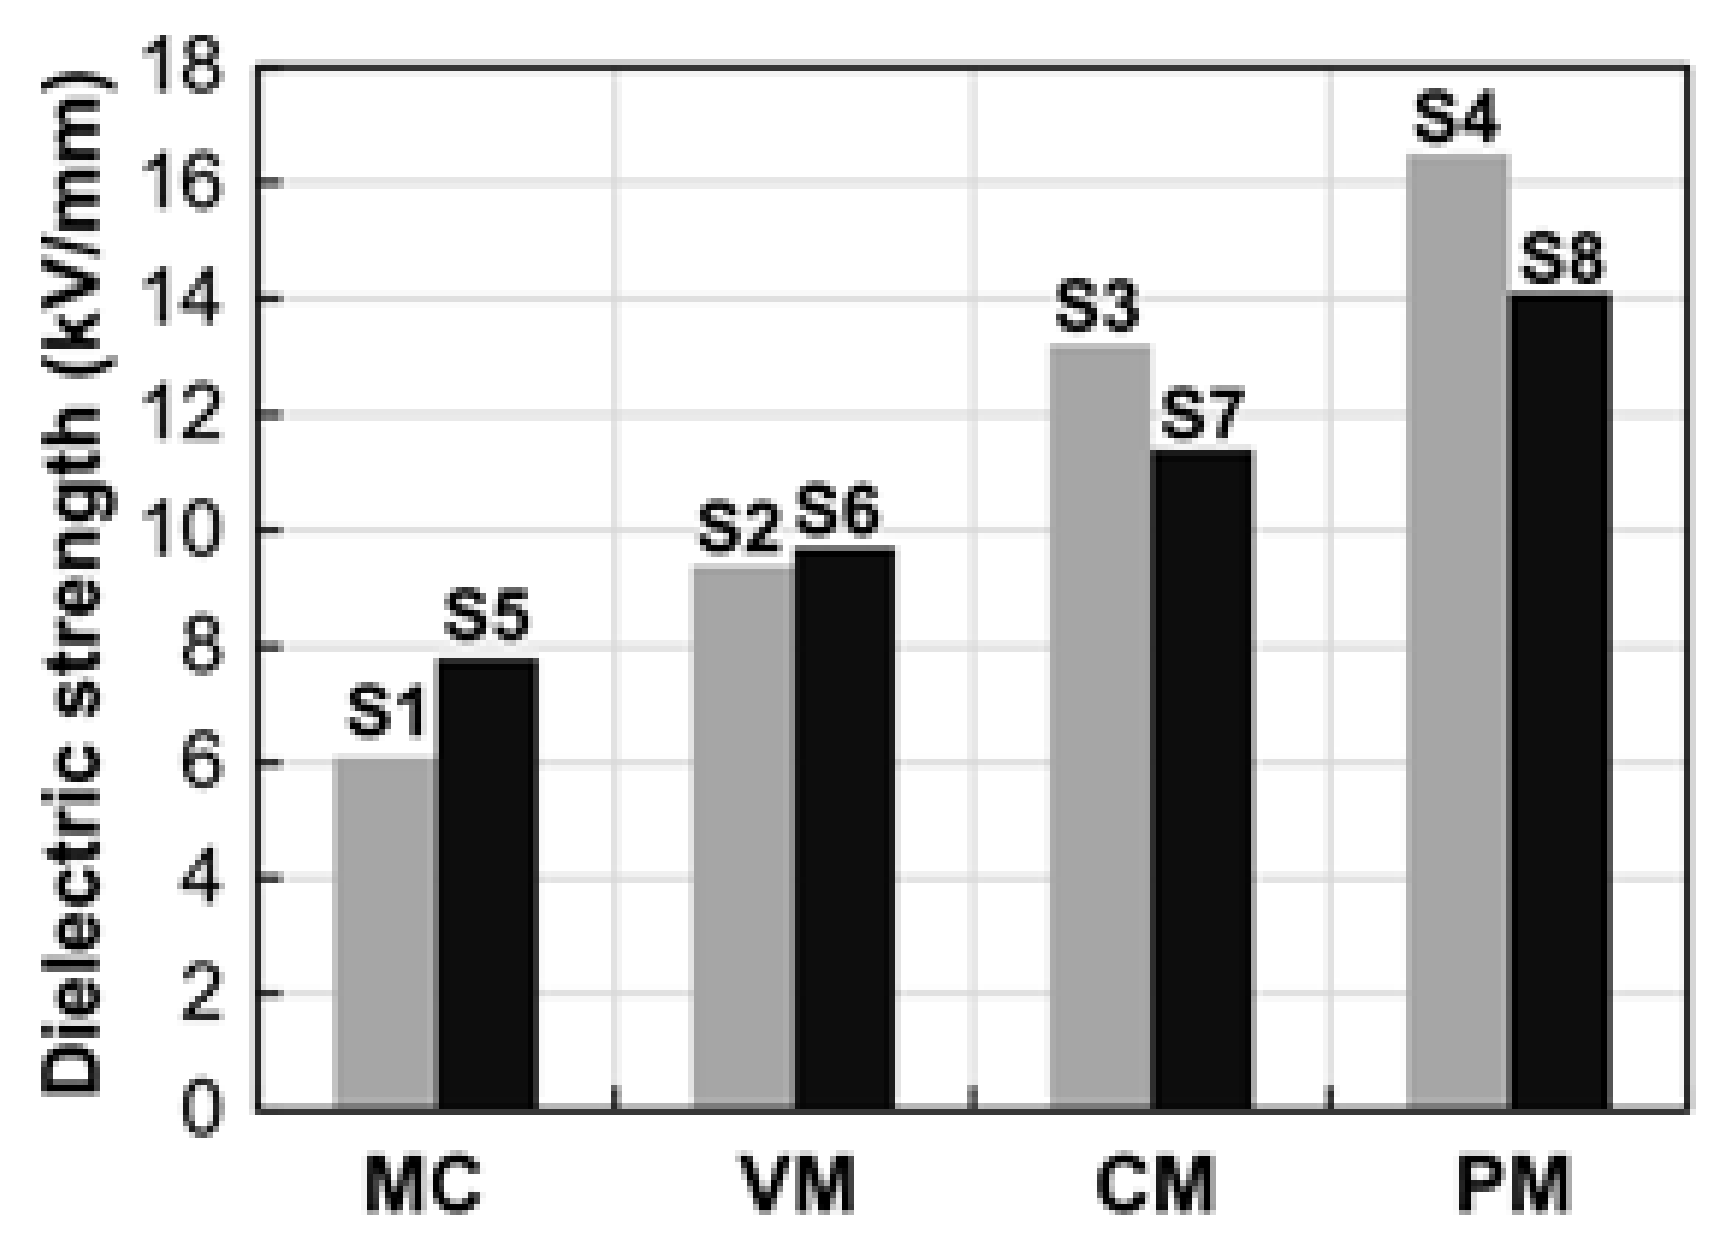
The dielectric strengths depicted in Figure 5 for the specimens from each group are listed in Table 2, determined as the average value of all three specimens. It can be noted that the manufacturing method had a significant influence on the dielectric strengths of the PCCs. Samples from the S1-PCW/MC and S5-PCWC groups, which were manufactured from mould casting, provided the lowest dielectric strengths. Compared with specimens from the other groups, the S1-PCW/MC and S5-PCWC specimens had the highest porosities, as the mixing procedure also introduced a large amount of air content. Compared with specimens from the S1-PCW/MC and S5-PCWC groups, the specimens from groups S2-PCW/MC and S6-PCWC, which were manufactured through vacuum mixing, provided around a 30% increase in dielectric strength. The vacuuming procedure reduced the air content in the mixtures, leading to enhanced insulation.
Specimens prepared through centrifugal moulding (S3-PCWC and S7-PCW/MC) provided a twofold dielectric strength compared with their counterparts manufactured via conventional mixing. The centrifugal force removed most of the water and air content, which led to a much more compact mixture. The powder press moulding method provided specimens with the highest dielectric strengths, since it required almost zero added water in mixtures and no air content was introduced during the manufacturing. It is also noted that the muscovite particles did not enhance the insulation properties of the composite material as mentioned before. Hence, further experiments were limited to the PCWC samples only (i.e., groups S1–S4).
The dielectric strengths of the PCCs from this study showed values between 6.1 and 16.5 kV/mm, which are within the ranges obtained for common insulating materials such as glass (5–10 kV/mm) and electro-ceramics (8–15 kV/mm) [33]. Other studies also indicated that PCCs incorporating acrylic and vinyl ester have dielectric strengths between 6 and 9 kV/mm [34,35]. Consequently, the PCC mixes developed in this study provided adequate dielectric strengths to be applied in most high-voltage insulating systems.
3.2. Dielectric Loss
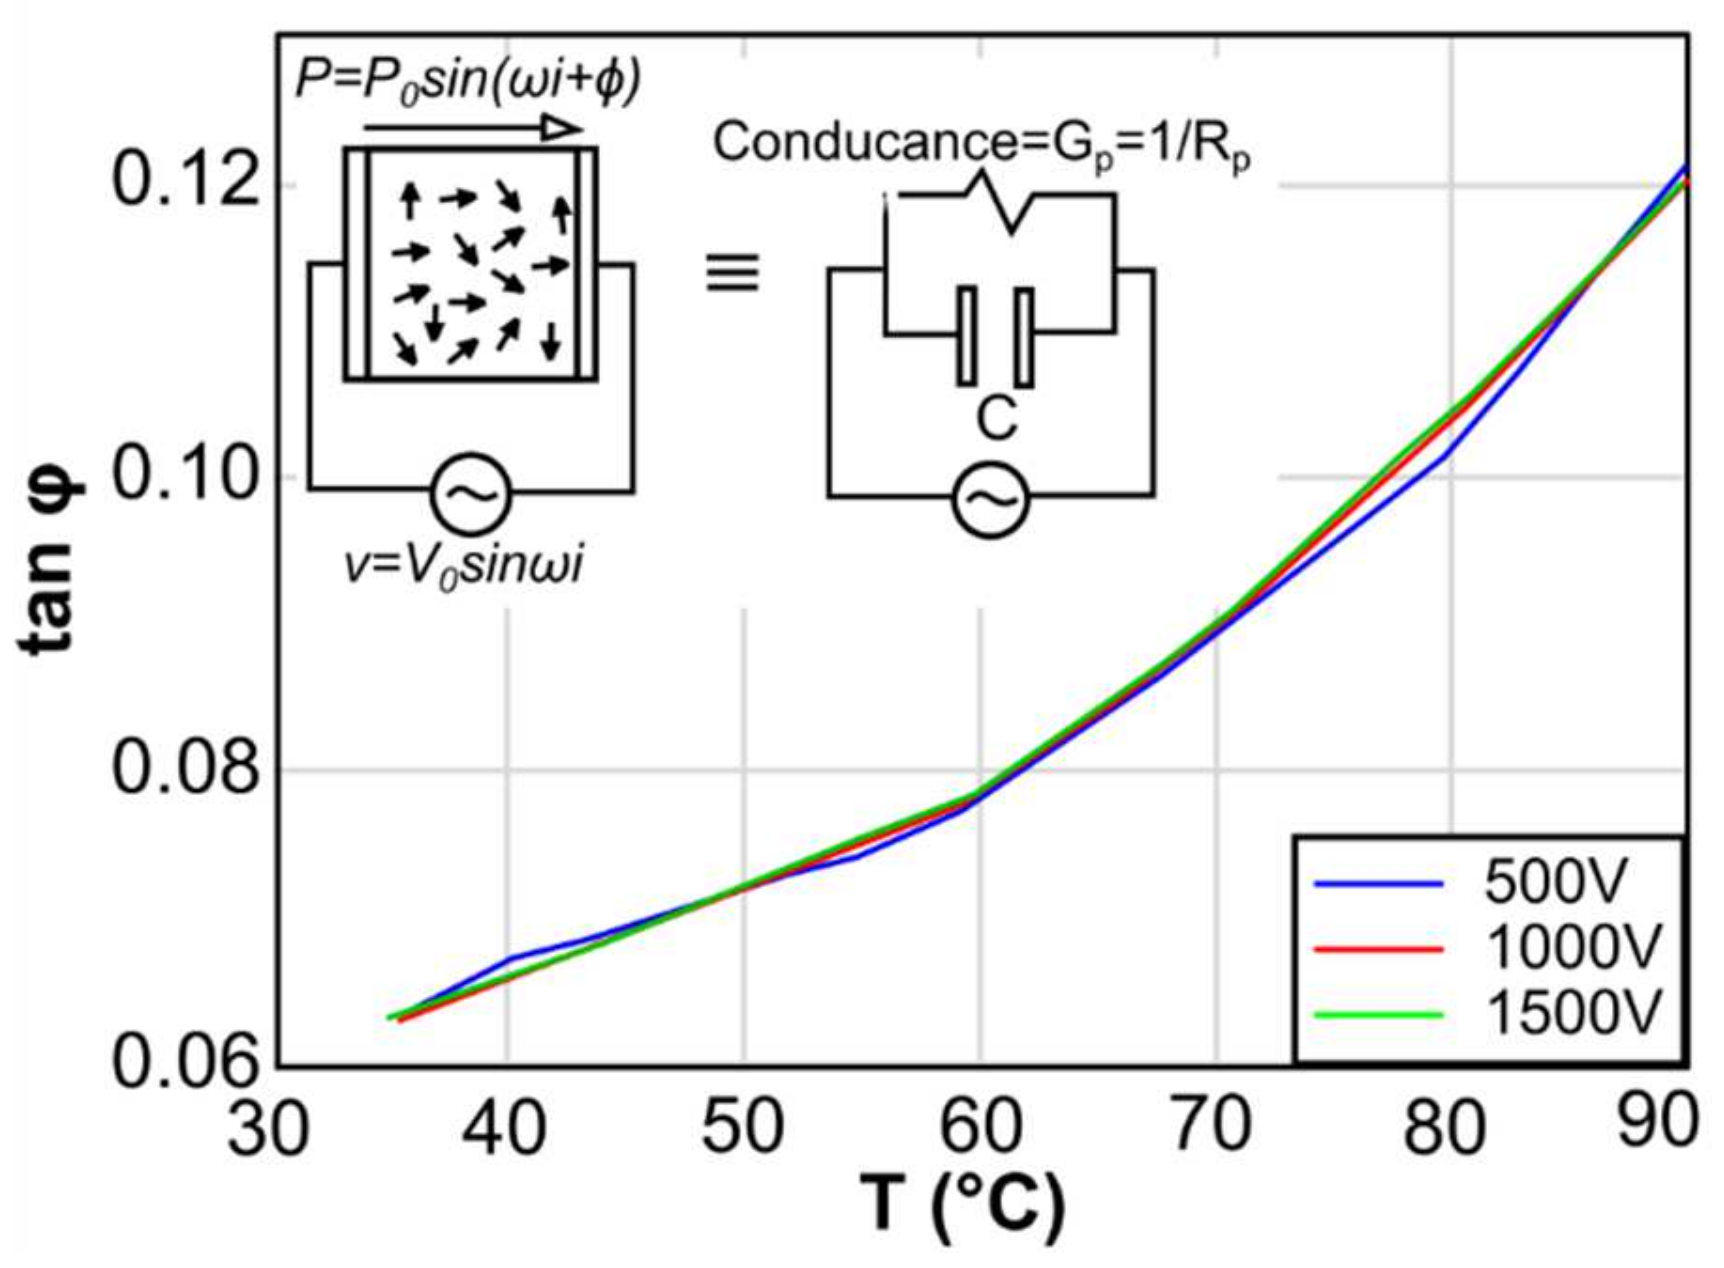
Dielectric loss of a solid material under the influence of an alternating electric field, represented by the dielectric loss tangent angle tanδ, defines the electrical energy dissipated by the motion of dipoles and free charges within the dielectric material as polarisation switches directions. A high value of tanδ indicates a large amount of electric energy loss, which is converted to thermal energy. The admittance of a dielectric material under an alternating voltage is equivalent to a parallel combination of an energy lossless capacitor C’ and resistance Rρ, which causes the loss of electrical energy as shown in the top left of Figure 6. In this study, the testing arrangements included a bridge circuit, a vacuum container with solid electrodes, a vacuum pump and a high voltage power supply with temperature adjustment [36].
The dielectric loss tests in this study focused on the PCC specimens manufactured through a press powder method which provided the highest dielectric strength, as mentioned in the previous section. The test specimen with the size of Ø50 × 2 mm was placed between two solid electrodes in the vacuum container. Various levels of alternating voltages (U = 500 V, 1000 V and 1500 V) of 50 Hz were applied to the circuit to investigate the influence of the external electric field on the dielectric behaviour of the PCC material. In addition, the temperature in the container was controlled between 35 °C and 90 °C to investigate the influence of the temperature on the dielectric loss of the PCC material. It can be noted from Figure 6 that the applied voltage had no influence on the dielectric loss tangent of the PCC material, while the higher temperature led to a higher tanδ. In general, all the PCC specimens manufactured through press powder moulding had a tanδ lower than 0.12.
The introduction of polymer components such as the SA employed in this study greatly reduces the dielectric loss of PCC materials compared with the conventional concrete mixtures, which possess a tanδ between 0 and 101 [37]. Studies of PCC mixes incorporating various types of insulating fillers, such as recycled rubber and cycloaliphatic epoxy resin, indicated a reduction of tanδ in the range from 10-2 to 10-1 [38], which is in accordance with the results in this study. The tanδ factor of the PCC in this study showed similar values compared to other types of insulating coating materials, such as silicon rubber (0.05–0.20) [39]. Conversly, the dielectric loss factor of the PCC showed much higher values than other types of widely used insulating materials such as cross-linked polyethylene (from 10-3 to 10-4) and SF6 gas (less than 10-7) under a frequency of 50 Hz [40,41,42]. Based on these results, the low cost and high durability of the PCC materials also provide the potential for application of such materials in cable protection covers and high-voltage insulators [34].
4. Thermal Properties
4.1. Thermal Conductivity
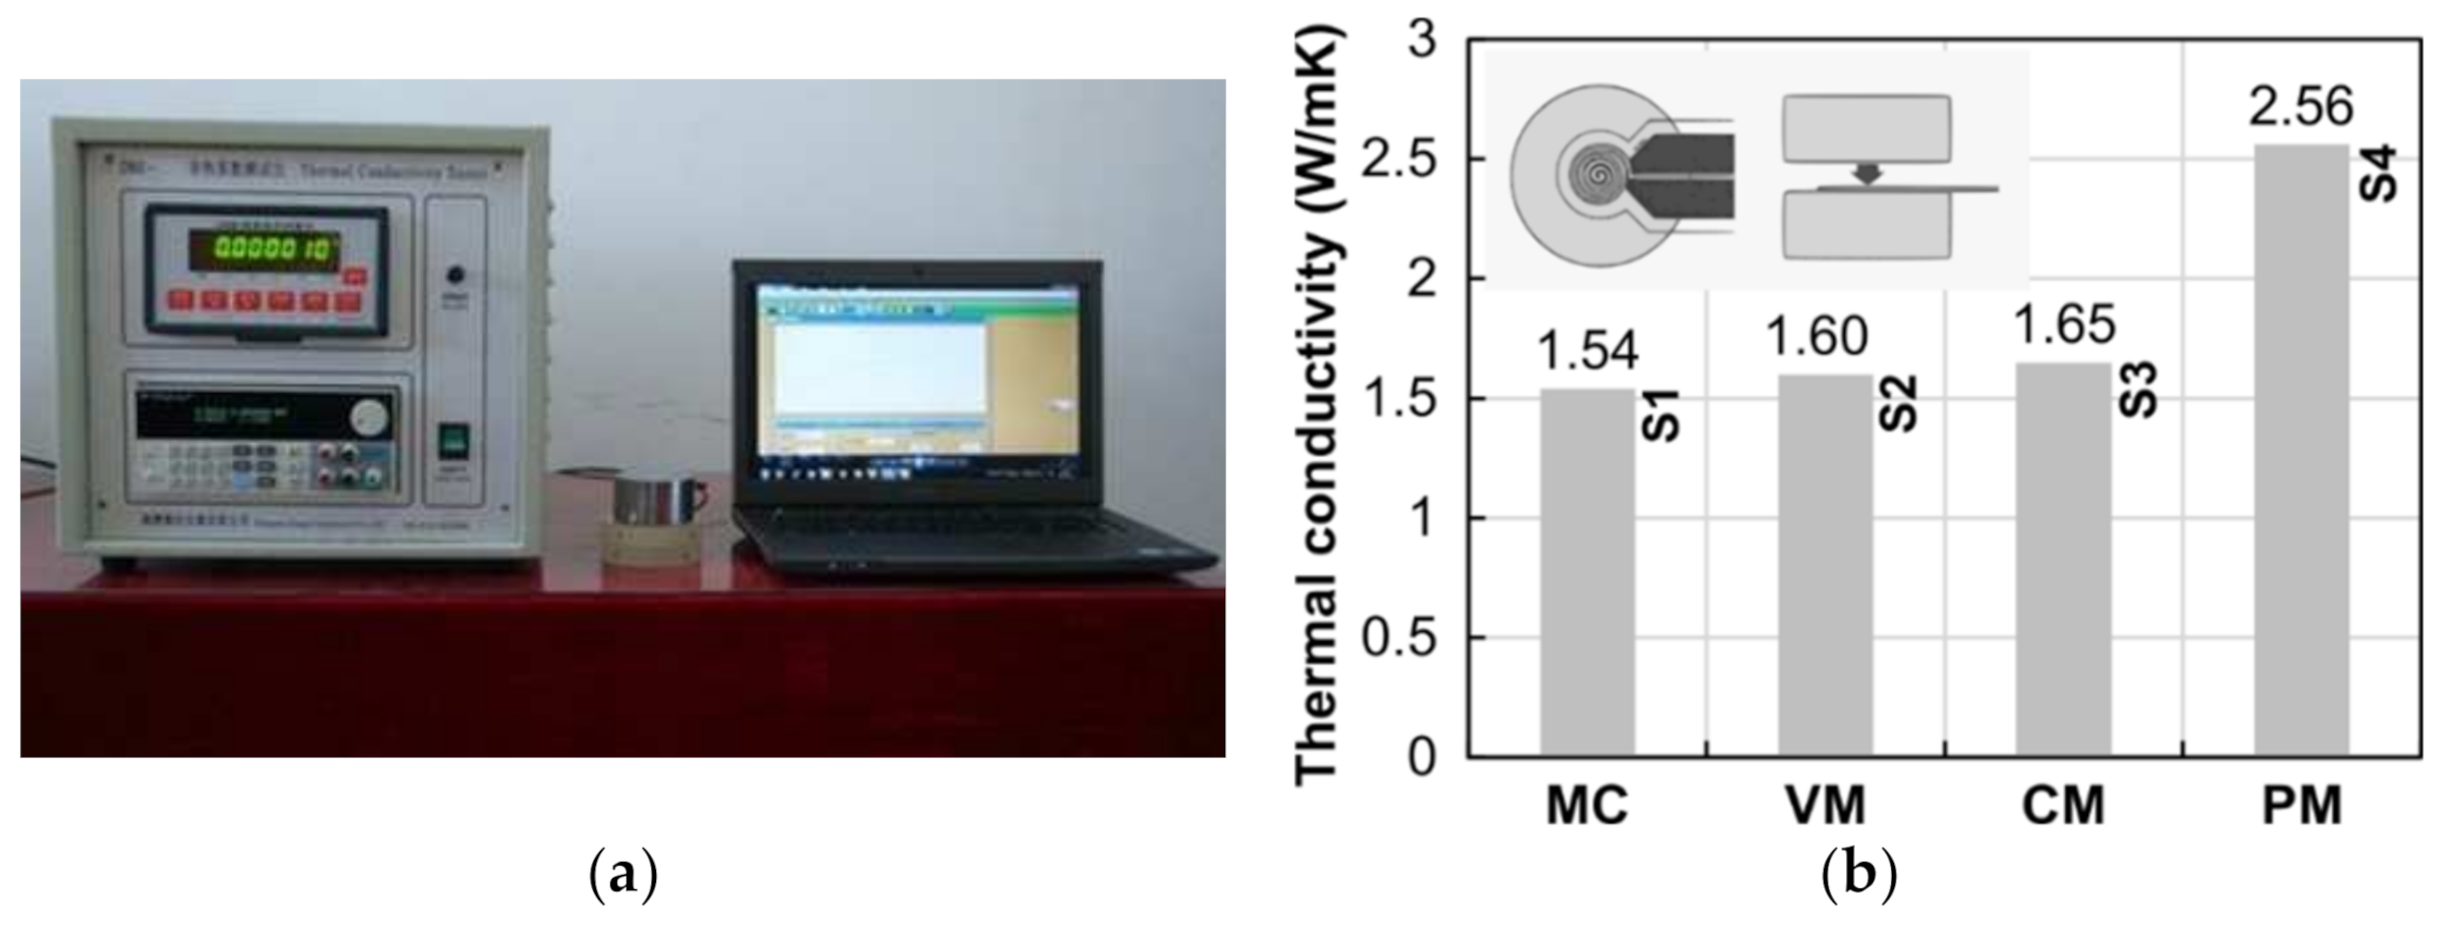
Thermal conductivity (λ) (W/m·K or W/m °C) defines the amount of heat (W) transferred in 1 s through a material with an area of 1 m2, which has a thickness of 1 m and a temperature difference between the two surfaces of 1 K (or °C). In this study, the Transient Plane Source (TPS) method [43] was used for measuring the thermal conductivity of the PCC materials. Compared with the other widely used methods such as Transient Hot Strip (THS) [44], which requires samples with specific geometries [45], the TPS method only needs samples with two parallel smooth surfaces (e.g., disc samples of Ø50 × 2 mm). As indicated schematically in the top right side panel of Figure 7, a 10–20-μm thick pure nickel disk resistor covered on both sides with Kapton foil for protection and electric insulation, whose resistance is in a linear relationship with the temperature, was utilised in the TPS method. This resistor performed simultaneously as the heat source and temperature sensor for the thermal conductivity measurement. During the test, the sensor was sandwiched between two tested insulating specimens.
The automated DRE-IV machines (DRE-IV) employed in this study to measure the thermal conductivity of the PCCs, were in accordance with the requirement of ISO 22007-2 [46], as shown in Figure 7a. The thermal conductivity of the PCC samples from groups S1–S4 are listed in Table 3 and Figure 7. It can be noted that the λ of the PCCs was between 1.5 and 2.54 W/mK, depending on the manufacturing method. Studies have shown that the thermal conductivity of concrete depends on its mix components and increases with the increase in density and compactness of the mix [47,48]. The polymer emulsion and antifoaming agent applied in the PCC mixes, in combination with the manufacturing methods, reduced the porosity of the material, reaching λ = 2.54 W/mK.
The PCC outperformed the typically used coatings and insulating materials in terms of their thermal conductivity factors. For example, cross-linked polyethylene had λ = 0.5 W/mK [49], silicone rubber had λ = 0.2 W/mK [50], SF6 gas had λ = 0.014 W/mK and insulating oils were around λ = 0.13 W/mK. As heat dissipation is essential for electrical devices and cables, materials with a high value of λ are desirable for insulating coatings and mediums [51]. The high heat conductivity factor, combined with the thermal stability test results presented in the following section, indicate that the PCCs provided reliable thermal properties compared with existing insulating materials.
4.2. Thermalgravimetric Analysis
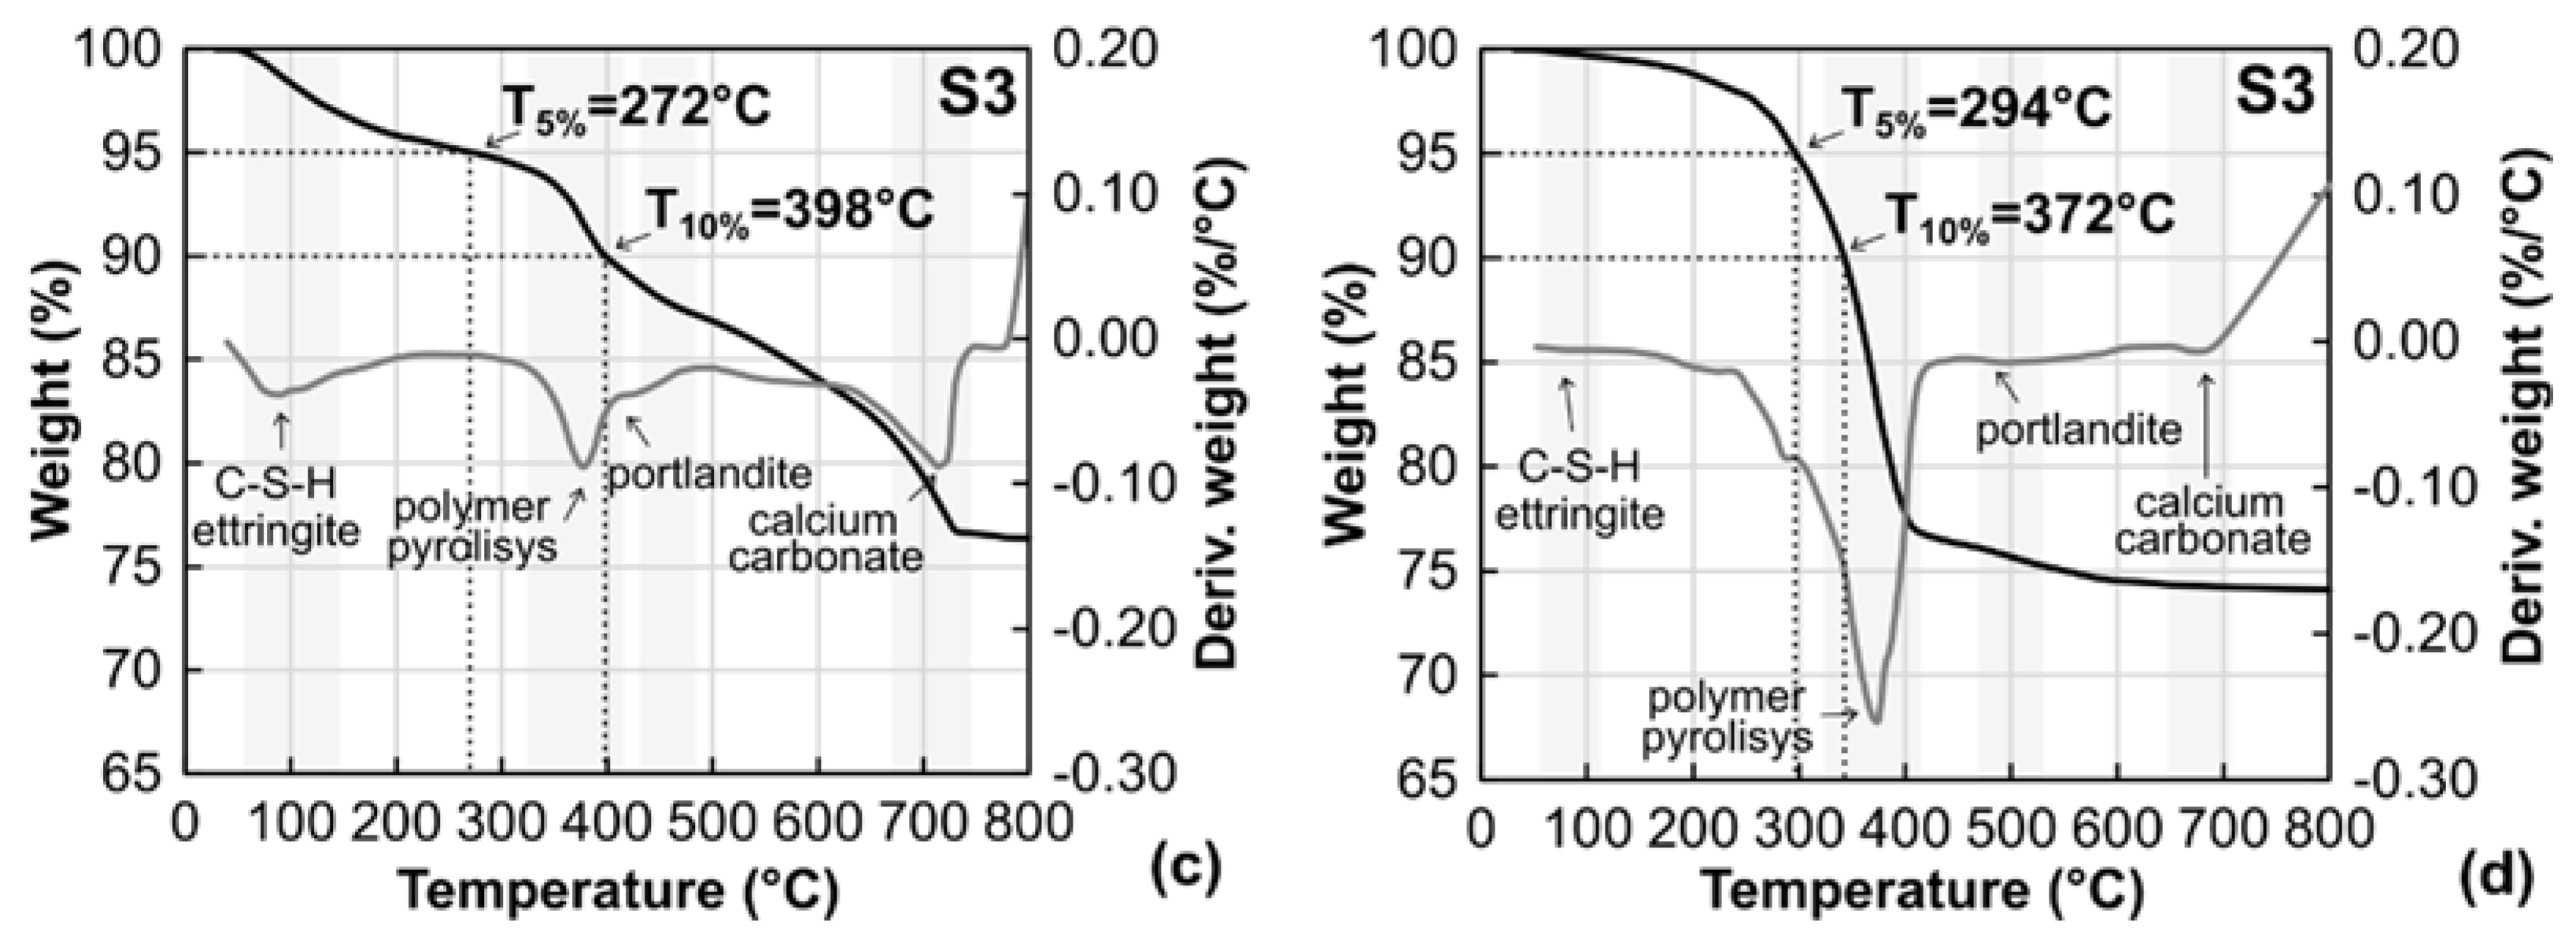
The use of thermal analysis, including differential thermal analysis and derivative thermogravimetry, enables a description of the reactions that occur in cementitious composites with an increase in temperature [52]. Typically, hydrated cement pastes include four main components: tricalcium silicate (C3S), dicalcium silicate (C2S), tricalcium aluminate (C3A) and tetracalcium aluminoferrite (C4AF) [53]. In cement-based materials, the main hydration products are calcium silicate hydrate (C-S-H) and portlandite (calcium hydroxide - CH). A number of research studies showed that under an increase in temperature, cement pastes and concretes develop a set of reactions. At temperatures in the range of 30–105 °C, the free water and part of the bound water evaporates, whilst at around 120 °C, it becomes nonexistent [53]. Furthermore, within 110–180 °C, ettringite and gypsum decompose, and water loss from the carboaluminate hydrates occurs [54,55].
In addition to the above, C-S-H and carboaluminate hydrates decompose at temperatures above 180 °C but below 300 °C. The last two stages include dihydroxylation of the portlandite (calcium hydroxide Ca(OH)2) at 450–550 °C [56] and decarbonation of calcium carbonate CaCO3 at 700–900 °C [57]. At this stage, depending on the mix proportions and properties of the constituents, 5–30% wt% weight loss can occur. In the particular cases of polymer concretes, the range where weight loss occurs due to polymer pyrolysis is around 350–430 °C [1,10]. In terms of the fillers used in this paper, wollastonite is a stable material with low weight loss up to 1000 °C, which can only occur due to the presence of small traces of impurities (e.g., calcium carbonate) [58].
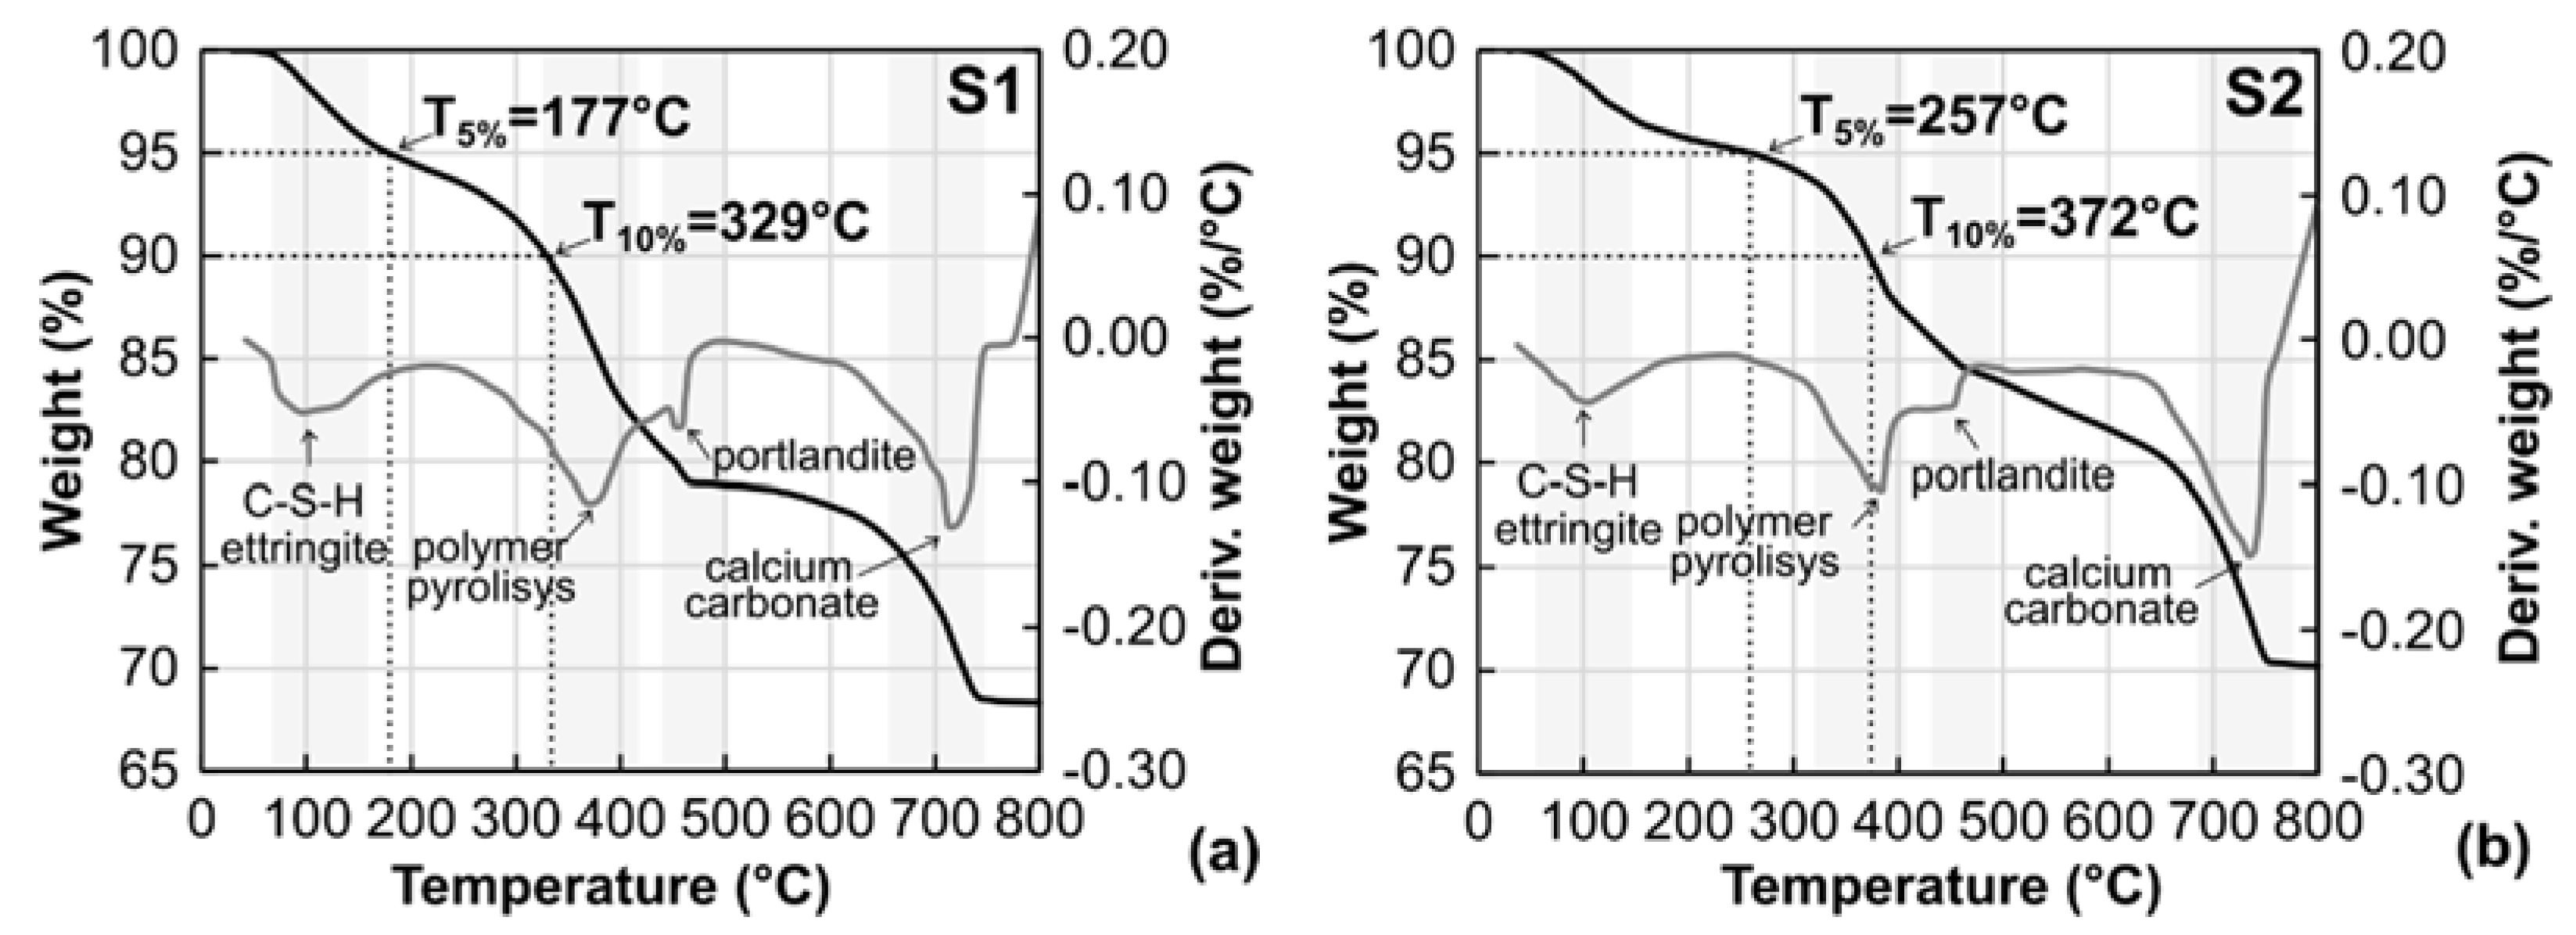
To investigate the thermal stability of the PCC mixes, thermogravimetric analyses (TGA) of the selected PCC samples were further carried out in a thermal analyser (Netzsch STA 409PC). The working temperature was established between 30 and 800 °C with a heating rate of 20 °C/min in a nitrogen environment. As shown in Table 3, TGA was performed with samples from groups S1–S4 (without muscovite granules), which were in accordance with the groups for the thermal conductivity tests.
As indicated by the black curves in Figure 8, samples from all the groups lost 5% of their mass at temperatures (T5%) of 170–300 °C. The highest thermal stability up to 300 °C was shown for S4. This was followed by decomposition of the hydration products. It can be noted that samples from S1, S2 and S3 showed a mass loss of more than 2% at a temperature between 100 and 200 °C. No pyrolysis of the polymer or inorganic powders occurred at this temperature; hence, the mass loss was caused by the vaporisation of the water content and other volatiles. This was also captured through the first derivative of the weight, represented by the grey curves. The first peak was observed around 100 °C, which corresponded to water evaporation, followed by decomposition of the hydration products. A 10 percent (T10%), mass loss was observed at 329–372 °C. This was associated with a relatively sudden drop in the weight loss–temperature curves (TGA) and the highest peaks in the derivative curves (DTG). As shown in previous studies, cementitious materials are relatively stable in the range of 300–400 °C without any major component being eliminated from the composite. Implicitly, the mass loss and corresponding peaks on the derivative curves were associated with polymer pyrolysis, which was shown to occur between 350 and 430 °C.
In terms of the best thermal performance, samples from groups S1–S3 showed an increase in compactness, leading to an increase in thermal stability, which was in accordance with the influence on the dielectric strengths as presented previously. Although the constituent quantities were the same, samples from S4 on the other hand showed significant degradation between 300 and 400 °C. This was attributed to the higher porosity of the samples, which allowed a faster thermal transfer and hence implicitly accelerated the polymer pyrolysis. Out of the first three mixing procedures, the best performance was obtained for samples from the S3 group, which had a relatively high T5% and the highest T10%, whilst the remaining mass at 800 °C was around 76% of the initial, which was 12%, 8% and 3% higher than that of S1, S2 and S3, respectively. It is worth noting that weight loss above 5% would occur around 900–1000 °C when the wollastonite would suffer structural changes [52,58].
5. Microstructure and Mechanical Properties
5.1. Infrared Spectroscopy Analysis
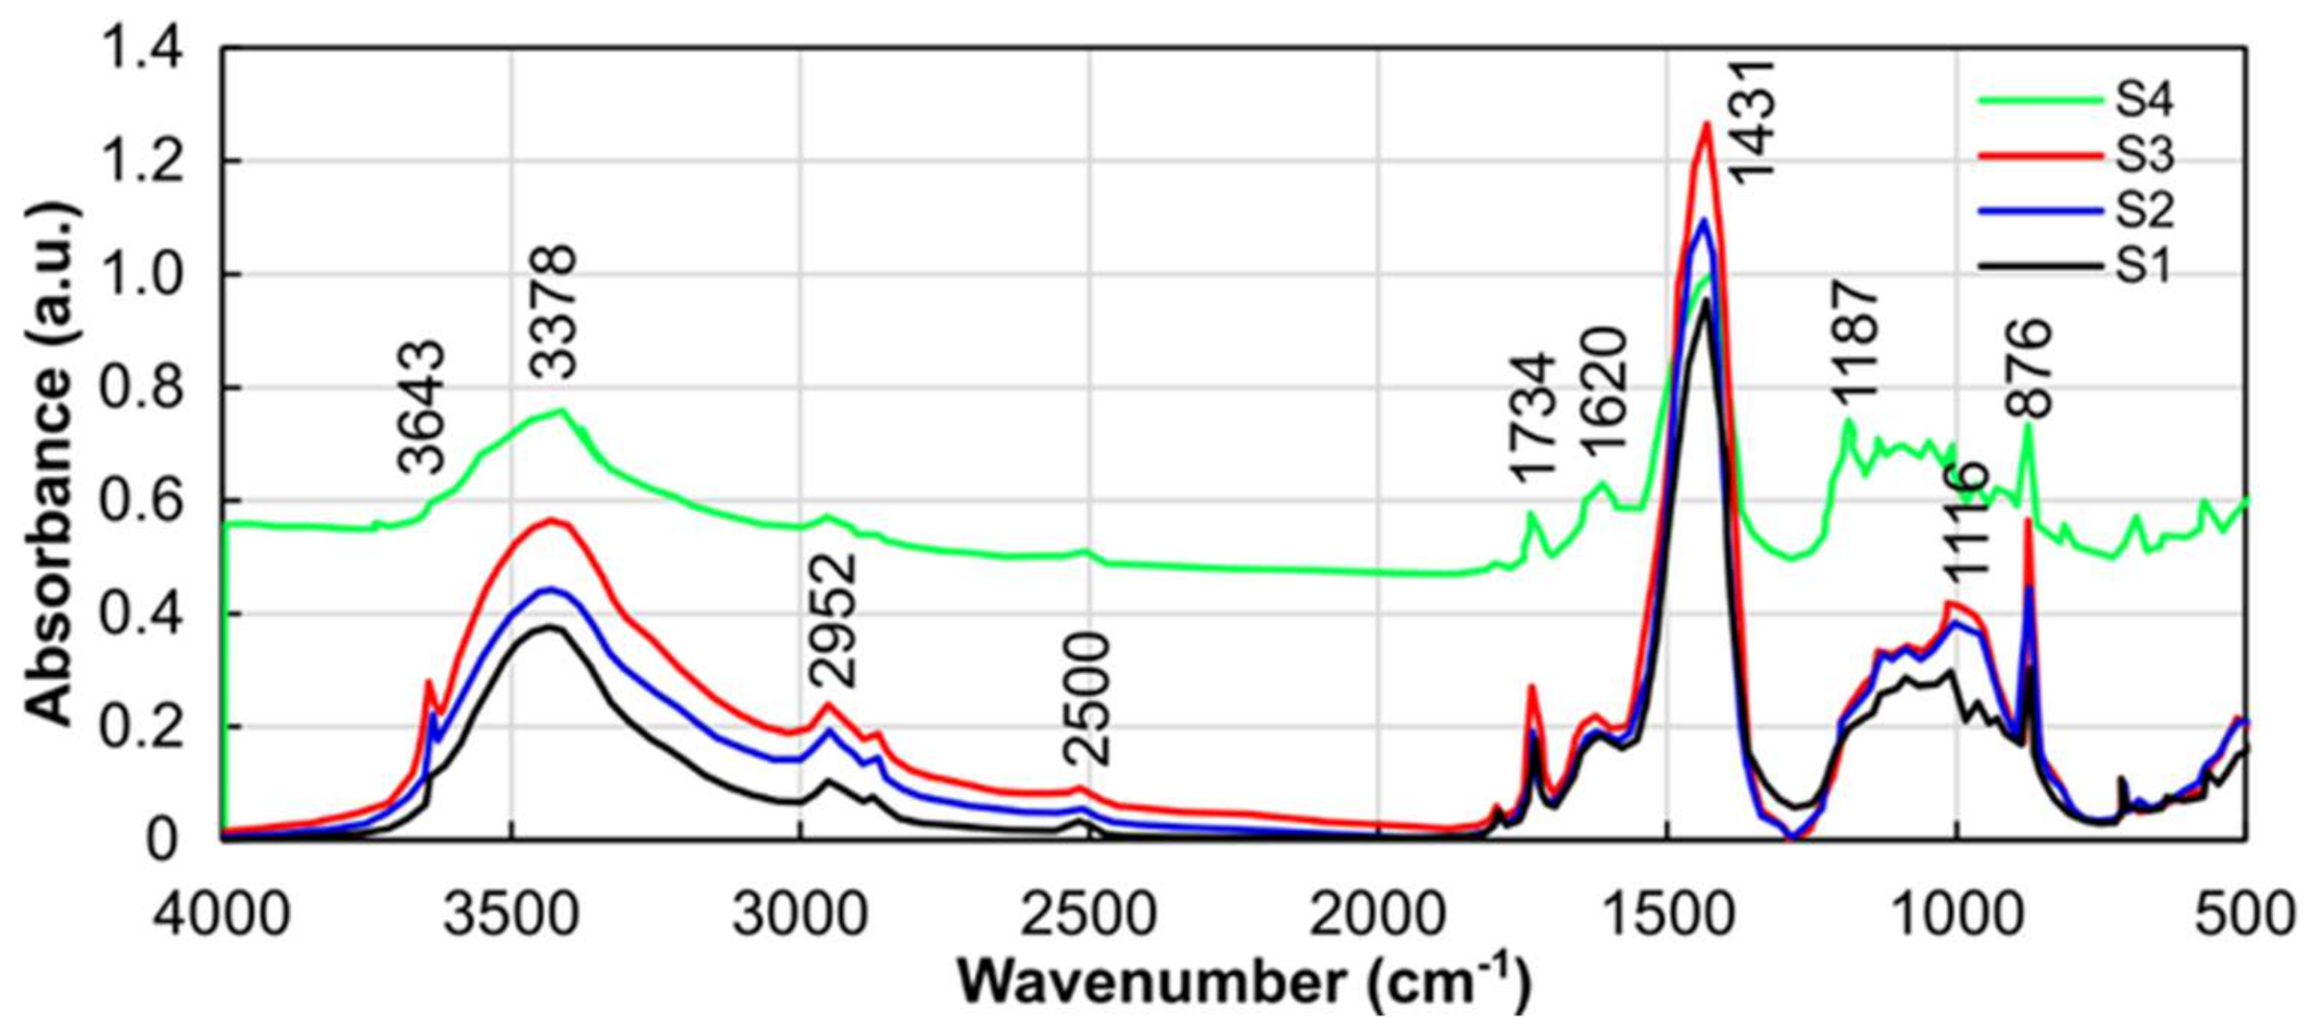
Fourier-transform infrared spectroscopy (FTIR) can be represented by a curve depicting the relationship between infrared light absorbance or transmittance and wavenumbers, which can also by represented in terms of a wavelength or frequency. Through this procedure, a beam of infrared light of a different wavelength is transmitted onto the molecules of the substance, and certain wavelengths of infrared rays are absorbed to form an infrared absorption spectrum of the molecule. The absorbance–wavenumber curve provides an indication of the chemical reactions in the material. The FTIR curves, resulting from an analysis of samples S1–S4 with FTIR equipment (PerkinElmer Spectrum 100 FT-IR), are shown in Figure 9.
According to the FTIR curves in Figure 9, the calcium hydroxide peak indicating consumption of portlandite in the mortars was around 3643 cm−1, which is clearly observed in Figure 9 [59,60]. In the 3300–3500 cm−1 range, a broader peak corresponding to O-H vibrations appeared as a result of hydration due to the presence of water in the air [61]. Three other peaks were visible in the range of 2100–3300 cm−1, with a maximum near 3000 cm−1 corresponding to C-H, which is characteristic for SAE [62]. An absorption peak was further observed around 1734 cm−1, corresponding to C=O in the SAE powder-modified cement pastes [60]. Moreover, the peak around 1620 cm−1 could be attributed to the C-C stretching vibration, which is characteristic for wollastonite [63]. The peak observed at 1431 cm−1 was attributed to the calcium carbonate typical for cementitious materials, which ranges between 1410 and 1510 cm−1 [64]. Additionally, the same peak can also be attributed to wollastonite, which can contains CaO [65]. Typical sulphate absorption bands were generally present in the range of 1100–1200 cm−1 due to S–O stretching vibration [66]. The peak at 1100 cm−1 of the composite could be assigned to Si-O, which is considered fingerprint evidence for the degree of polymerization with the formation of the calcium silica hydrate phase as a result of hydration of the cement [59,66], whilst around 900 cm−1, this was due to Si-O-Ca stretching present in wollastonite [65].
Through the FTIR analysis, it was shown that quantitative variations in terms of absorbance values occurred as a function of the manufacturing methods of the PCW composites. A clear difference was observed between S4 and the curves of the other three groups (S1–S3). Implicitly, the inherent different porosity and free water in the sample had an impact on the absorption of infrared light. On the other hand, the FTIR results for samples from the S1–S3 groups showed a similar hydration process and reactions within the material with some influence from the manufacturing method.
5.2. Microstructural Analysis
In cementitious materials, the microscopic morphology, pore size, grain boundaries and degree of agglomeration of the original materials and their products determine the final properties of the materials. The particle type and their size distribution and, implicitly, the specific surface of the mineral admixtures strongly influence the hydration speed of the process and the demand for water [67]. Cement powders are characterised by very heterogeneous and irregular particle structures with shape factors between one and five, which are affected by fragmentation and tend to form agglomerates [68]. As mentioned before, the main hydration products in cement pastes are either inner products when C-S-H forms within the boundary of the original particles or outer products when C-S-H and calcium hydroxide form in what was originally water-filled space [69].
On the other hand, wollastonite has an acicular morphology with crystal lengths at least two times greater than their width, while the shape coefficient of wollastonite (crystal diameter divided by thickness) can be higher than 15 [58]. Wollastonite is regarded as a non-hydraulic binder, since on-carbonation forms a heterogeneous matrix in a similar manner to those of the conventional hydrated cement pastes, resulting in the formation of two main products: calcium carbonate (CaCO3) and amorphous silica gel (SiO2) [6]. Materials such as styrene-acrylic emulsions used in the mixes described in this paper have several effects at the microstructural level, such as obstructing the fine pores network inside the hydrates, filling larger pores and forming membranes that encapsulate cement grains [70].
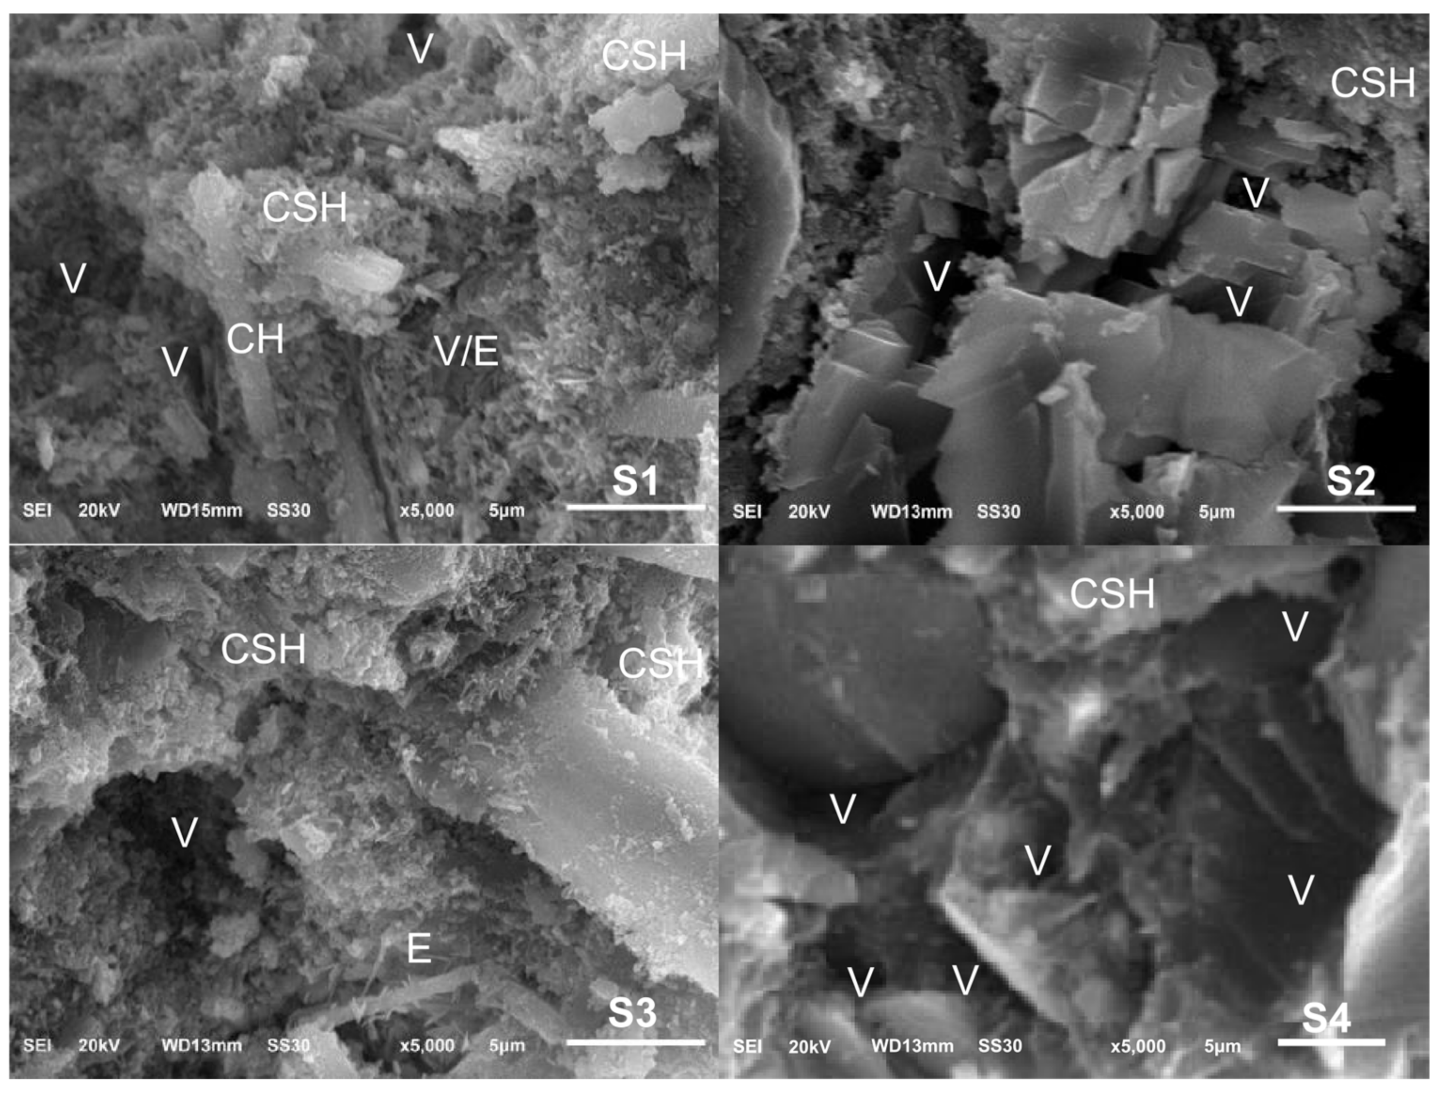
These characteristics are observed in Figure 10, which depicts scanning electron microscope (SEM) images of the selected samples using the manufacturing methods described in Section 2. The microstructural investigations were undertaken using a microscope (JEOL JSM-6510 LV) at two locations of randomly selected samples. Prior to studying the samples, these were spread over a conductive tape and covered in gold film. The microstructural examination showed the typical hydration products found in cement pastes for the S1 and S3 manufacturing methods, similar to the characteristics observed in other investigations (e.g., [71]). The S2 SEM images seemed to show a less porous structure in which membrane-like substances (hydrates and polymers) bonded the aggregate together, crossing the pores like a bridge [10,70]. Ultimately, the results of S4 showed an increased porous media in comparison with the other manufacturing methods (S1–S3) and a non-hydrated cement particle, strengthening the results obtained from the thermogravimetric analysis in Section 4.2.
5.3. Mechanical Properties
In addition to the above material properties, the mechanical strengths of the PCC material were also investigated in this study, including the uniaxial compression and flexural strengths. As introduced previously, cylindrical samples (Ø5 × 12.5 mm) and prismatic samples (5 × 5 × 12.5 mm) were prepared for the two types of tests. These were performed under a displacement ratio of 0.2 mm/min, typical for structures under static loading [72]. The compressive and flexural strengths of the PCC samples from groups S1–S4 are shown in Table 3. It is noted that the manufacturing methods have a significant influence on the strengths of PCC materials. The PCC samples from mould casting showed the lowest compressive and flexural strengths (38.2 MPa and 7.2 MPa, respectively), while specimens from group S2 (VM) had corresponding strengths of 40.5 MPa and 12 MPa, respectively. The enhancement in strength was mainly due to the reduction in the air content in the specimens from the vacuuming procedure. The specimens from group S3 showed twofold the compressive and flexural strengths compared with their counterparts from group S1. Similar to the enhancement in dielectric strength, the specimens prepared from CM were highly compacted, with considerably less water and air content due to the centrifugal force. It can be noted that the highest values of compressive (up to 81 MPa) and flexural strengths (up to 21 MPa) were acquired with PCC materials provided through the powder press moulding method, since it introduced almost zero added water and air content during manufacturing.
The SA emulsion provided much higher enhancement to the flexural strength of the PCC materials due to the potential higher tensile strength of the SA emulsion and the overall improvement in the cement hydrate–aggregate bond [2]. Similar to the influence on the dielectric and thermal properties of the PCC materials, the samples from groups S1–S4 showed an increase in strength due to the increase in the mixture’s compactness and reduction in the water content. It is important to note that the PCC materials provided reliable compressive (up to 81 MPa) and flexural strengths (up to 21 MPa) which were suitable for application as structural materials [73,74]. The high strengths of the PCC materials provide potential applications of such materials in load resistance systems for the protection of telecommunication and electrical power cables. Compared with the direct burial method used in the laying of power cables, the highly durable, low-cost tunnel of PCC material would offer additional protection for the cables from corrosion and other hazards such as ground motions and rodents chewing on them.
6. Environmental Assessments
Power transmission network infrastructures, such as electric insulating cables, contain substantial amounts of materials that possess large amounts of energy [75]. The most commonly used electric insulating materials are plastics such as polyvinyl chloride (PVC), polyethylene (PE), high-density polyethylene (HDPE) and cross-linked polyethylene (XLPE). Synthetic plastic polymers have great potential for providing thermal and electric insulation, high mechanical and ductile properties and water and chemical resistance [76,77]. Polyethylene and PVC materials account for over 95% of the waste plastics in the world, and their essential polymerization of ethane (CH2=CH2) indicates that carbon and hydrogen are the backbone of their produced waste [78].
A comparative environmental assessment of the innovative polymer cementitious concrete system and of the plastic materials used as cable insulating materials was undertaken, as is shown in Table 4. The assessment considered all energy inputs (megajoules) and carbon emissions (kg of carbon dioxide equivalent) from the extraction of raw materials for manufacturing 1 tonne of material to its complete disposal at the end of life. It was shown that the plastic materials possessed significantly high embodied energy (around 77,000 MJ/t) which was almost twice the energy density of diesel fuel (i.e., 43,000 MJ/t). The average greenhouse gas (GHG) emissions of the listed plastic materials during their life cycle was around 3300 kg CO2 eq./t, which is 1.3 times higher than structural steel (i.e., 2500 kg CO2 eq./t) and 20 times higher than typical concrete materials (i.e., 130 kg CO2 eq./t) [79]. From this comparison, it is evident that the production of polymer materials led to a much more severe environmental impact compared with conventional construction materials.
An environmental assessment of the PCC materials investigated in this paper is shown in Table 5, considering the embodied energy and embodied carbon of each component of the mixture. Cement is associated with about 1000 kg CO2 eq./t embodied carbon and 5500 MJ/t embodied energy, which is the main cause of the environmental load of concrete [84,85]. Table 5 shows that the styrene-acrylic copolymer had high values of embodied energy and embodied carbon (i.e., 37,400 MJ/t and 1500 kg CO2 eq./t, respectively) which were comparable to the plastic materials, as shown in Table 4, since SA is also formed through the polymerization of ethane [80,86].
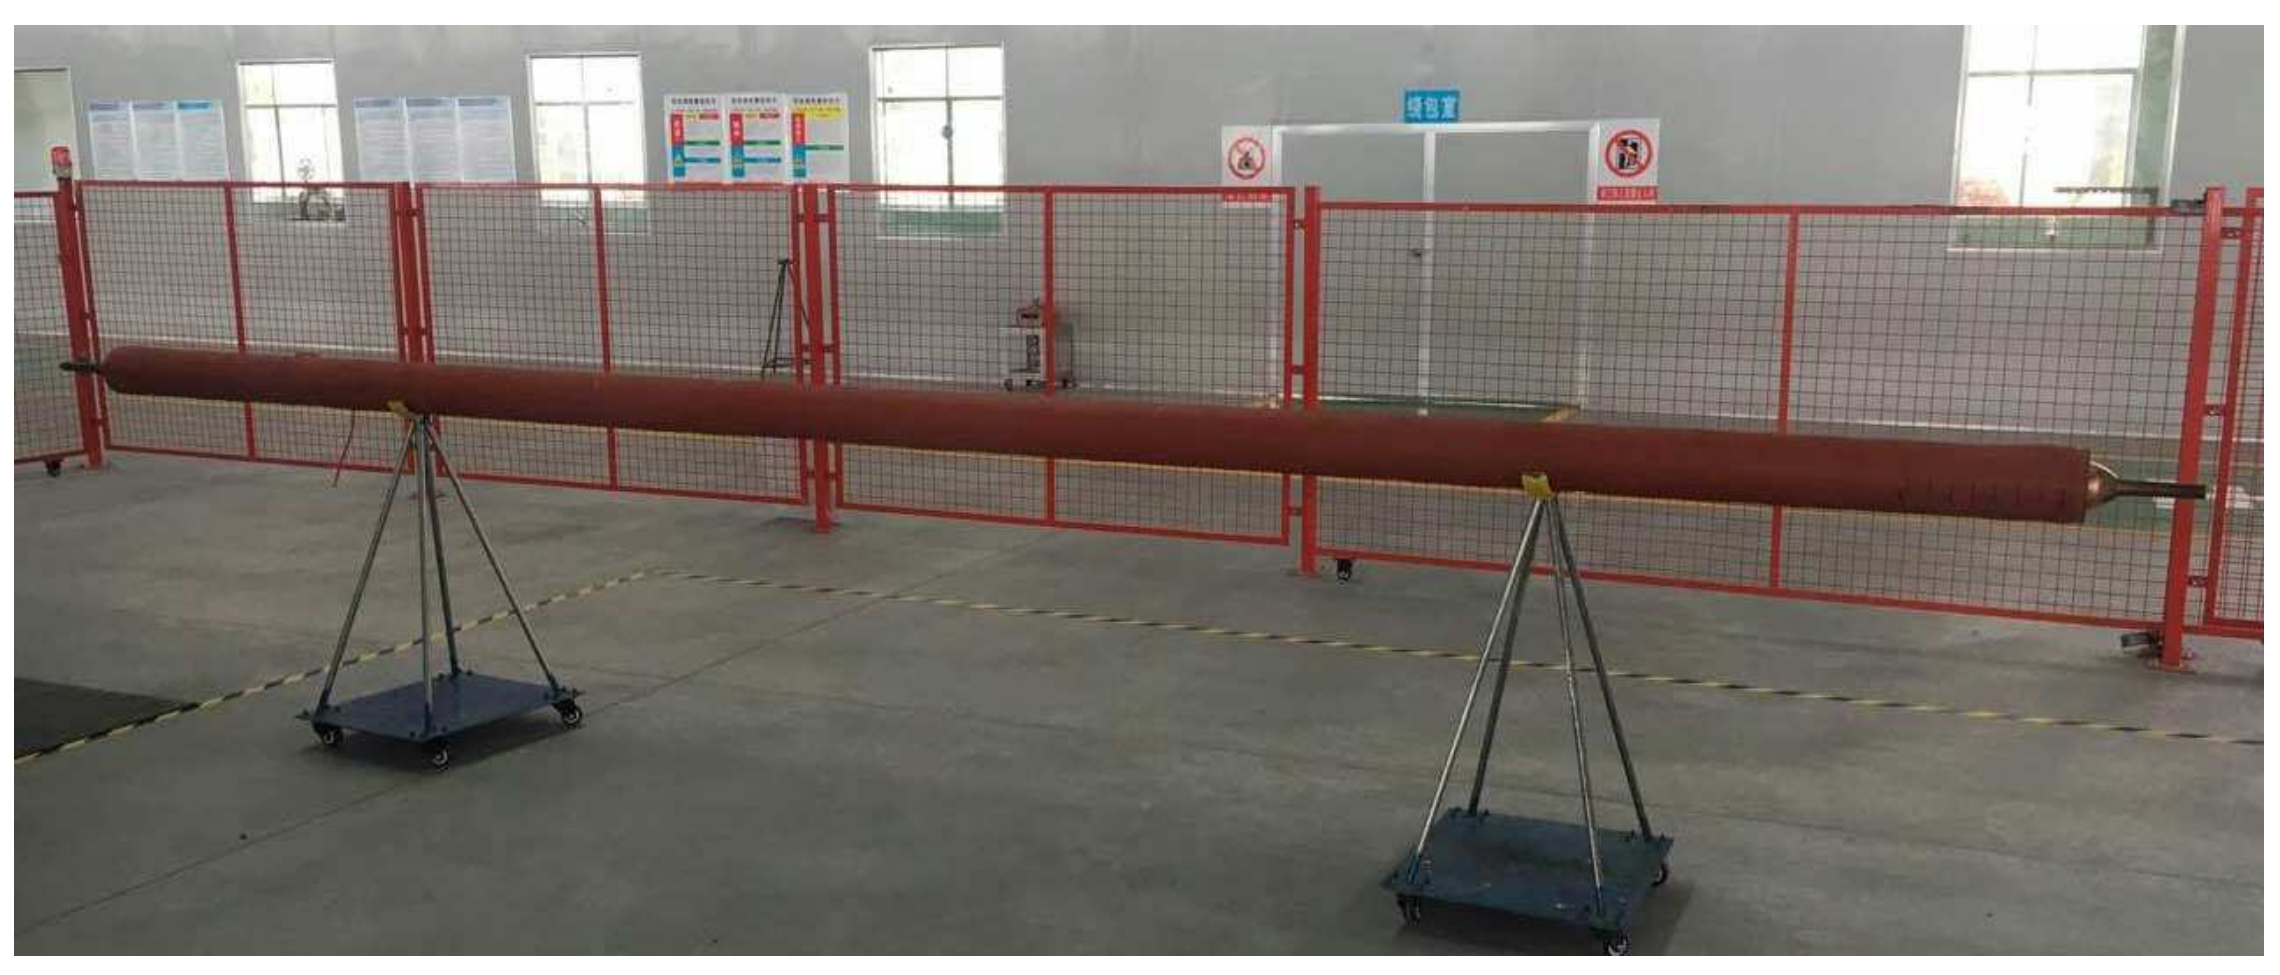
A prototype of a 6-m long PCC tube network (shown in Figure 11) was manufactured and used as a reference for the environmental assessment in this paper. The tube, designed to carry 35 kV, had an outer diameter of 190 mm and an inner diameter of 100 mm. Instead of using traditional plastic materials, a PCC layer was manufactured using centrifugal moulding (CM) to provide insulation and mechanical protection. Electrical characteristic tests indicated that the insulation resistance of the cable tunnel was 4500 MΩ with a dielectric loss of 4.5%, which met the requirements.
Table 4 and Table 5 compare the embodied energies and embodied carbon of conventional plastic insulation materials and those of the PCC tube prototype using the respective specific gravity of each component. The conventional plastic materials possessed an average embodied energy of 100,000 MJ/m3 and GHG emissions of 4000 kg CO2 eq./m3. On the other hand, the PCC had a total embodied energy and embodied carbon of 17,434 MJ/m3 and 1640 kg CO2 eq./m3, respectively. Hence, the amount of energy required to manufacture a cable tunnel with appropriate properties for practical application while being comparable with conventional systems, was reduced by more than 80%, while the embodied carbon was halved.
7. Concluding Remarks
This paper described an experimental investigation and an environmental assessment of polymer cementitious composites (PCCs) as sustainable coating materials for underground power cables and as high-voltage insulators. A detailed account of more than 400 tests on PCC disc samples incorporating liquid styrene and acrylic (SA) monomers (wollastonite and muscovite) was given. Prior to describing the sample manufacturing methods, the selected polymer emulsion and fillers, as well as the mix optimisation procedures, were presented in detail. Focus was given to the influence of the four manufacturing methods on the dielectric and mechanical properties of the PCC. Additional thermogravimetric, infrared spectroscopy and scanning electron microscope analyses were carried out to offer detailed insight into the microstructure of the PCC.
Mix optimisation studies have shown that PCCs with 25% SA emulsion provide the highest dielectric strength from the mixtures investigated, while a further increase in SA causes poor compatibility between constituents. Although muscovite possesses high insulating properties compared with the other materials considered in this paper, the poor bonding between the muscovite powder and SA particle as well as the cement paste reduced the dielectric strength of the PCC. A mix containing 25% SA emulsion, 12.5% wollastonite and no muscovite was shown to offer the best balance in terms of strength and microstructure. The optimised PCC material could reach dielectric strengths up to 16.5 kV/mm, depending on the manufacturing methods, which is above the value of common insulating materials such as glass and electro-ceramics. The dielectric loss factor tanδ of the PCC materials was lower than 0.12, which is comparable to silicone rubber.
Thermal conductivity tests and thermogravimetric analyses also showed that the PCCs had relatively high conductivity (λ > 1.3 W/m·K) and good thermal stability, respectively. This indicates a superior heat dissipation property in comparison with existing alternatives. As for the above material properties, the mechanical strengths and the microstructure are also greatly influenced by the manufacturing methods. The compressive and tensile strength of the PCC materials increased with the reduction in water content and porosity and reached maximum values of about 80 MPa and 20 MPa, respectively. Environmental assessments showed that the PCC possessed significantly lower embodied energy and embodied carbon than conventional plastic insulating materials.
The study presented in the paper indicates that PCC materials have great potential for high-voltage electrical insulating infrastructure. Compared with conventional plastic-based insulating materials such as PE and XLPE, the PCC possesses higher strength, better thermal properties, lower environmental impacts and reasonable electrical properties. Future studies can also focus on optimising the mixing design of the PCC composites to further improve the dielectric strength and reduce the dielectric loss of the material, as well as undertake full-scale tests on members and assessing the performance in service of infrastructure components incorporating the PCC.
Author Contributions
Conceptualization, B.X., H.L. and J.C.; methodology, H.L. and D.V.B.; software, H.L.; validation, B.X., H.L. and D.V.B.; formal analysis, B.X. and D.V.B.; investigation, B.X., D.V.B. and A.Y.E.; resources, H.L. and J.C.; data curation, B.X. and D.V.B.; writing—original draft preparation, B.X. and D.V.B.; writing—review and editing, B.X., D.V.B. and A.Y.E.; supervision, A.Y.E. and J.C.; funding acquisition, H.L. and J.C. All authors have read and agreed to the published version of the manuscript.
Funding
This research was funded by China Electric Power Research Institute, grant number GY71-15-054, GYW17201500088.
Data Availability Statement
The data presented in this study are available on request from the corresponding author.
Acknowledgments
The financial support of China Electric Power Research Institute (GY71-15-054, GYW17201500088) is gratefully acknowledged.
Conflicts of Interest
The authors declare no conflict of interest.
References
- Marvila, M.T.; Azevedo, A.R.G.; Barroso, L.S.; Barbosa, M.Z.; Brito, J. Gypsum plaster using rock waste: A proposal to repair the renderings of historical buildings in Brazil. Constr. Build. Mater. 2020, 250, 118786. [Google Scholar] [CrossRef]
- Marvila, M.T.; Azevedo, A.R.G.; Cecchin, D.; Costa, J.M.; Xavier, G.C.; Carmo, D.; Monterio, S.N. Durability of coating mortars containing acai-fibres. Case Stud. Constr. Mater. 2020, 13, e00406. [Google Scholar] [CrossRef]
- Marques, B.; Antonio, J.; Almeida, J.; Tadeu, A.; Brito, J.D.; Dias, S.; Pedro, F.; Sena, J.D. Vibro-acoustic behaviour of polymer-based composite materials produced with rice husk and recycled rubber granules. Constr. Build. Mater. 2020, 264, 120221. [Google Scholar] [CrossRef]
- Li, G.; Ding, Y.; Gao, T.; Qin, T.; Lv, Y.; Wang, K. Chloride resistance of concrete containing nanoparticle-modified polymer cementitious coatings. Constr. Build. Mater. 2021, 299, 123736. [Google Scholar] [CrossRef]
- Schütz, M.K.; Baldissera, A.F.; Coteskvisk, P.M.; Vecchia, F.D.; Menezes, S.C.; Miranda, C.R.; Einloft, S. Chemical degradation of reinforced epoxy-cement composites under CO2-rich environments. Polym. Compos. 2018, 39, E2234–E2244. [Google Scholar] [CrossRef]
- Ashraf, W.; Olek, J.; Tian, N. Multiscale characterization of carbonated wollastonite paste and application of homogenization schemes to predict its effective elastic modulus. Cem. Concr. Compos. 2016, 72, 284–298. [Google Scholar] [CrossRef]
- Yücel, H.E.; Özcan, S. Strength characteristics and microstructural properties of cement mortars incorporating synthetic wollastonite produced with a new technique. Constr. Build. Mater. 2019, 223, 165–176. [Google Scholar] [CrossRef]
- Osman, M.A.; Atallah, A.; Müller, M.; Suter, U.W. Reinforcement of poly (dimethylsiloxane) networks by mica flakes. Polymer 2001, 42, 6545–6556. [Google Scholar] [CrossRef]
- Chandra, S.; Flodin, P. Interactions of polymers and organic admixtures on portland cement hydration. Cem. Concr. Res. 1987, 17, 875–890. [Google Scholar] [CrossRef]
- Ollitrault-Fichet, R.; Gauthier, C.; Clamen, G.; Boch, P. Microstructural aspects in a polymer-modified cement. Cem. Concr. Res. 1998, 28, 1687–1693. [Google Scholar] [CrossRef]
- Kong, X.; Emmerling, S.; Pakusch, J.; Rueckel, M.; Nieberle, J. Retardation effect of styrene-acrylate copolymer latexes on cement hydration. Cem. Concr. Res. 2015, 75, 23–41. [Google Scholar] [CrossRef]
- Marceau, S.; Lespinasse, F.; Bellanger, J.; Mallet, C.; Boinski, F. Microstructure and mechanical properties of polymer-modified mortars. Eur. J. Environ. Civ. Eng. 2012, 16, 571–581. [Google Scholar] [CrossRef]
- Gomes, C.E.M.; Ferreira, O.P.; Fernandes, M.R. Influence of vinyl acetate-versatic vinylester copolymer on the microstructural characteristics of cement pastes. Mater. Res. 2005, 8, 51–56. [Google Scholar] [CrossRef]
- Lokuge, W.; Aravinthan, T. Effect of fly ash on the behaviour of polymer concrete with different types of resin. Mater. Des. 2013, 51, 175–181. [Google Scholar] [CrossRef]
- Zhang, X.; Li, G.; Song, Z. Influence of styrene-acrylic copolymer latex on the mechanical properties and microstructure of Portland cement/Calcium aluminate cement/Gypsum cementitious mortar. Constr. Build. Mater. 2019, 227, 116666. [Google Scholar] [CrossRef]
- Wang, R.; Wang, P. Function of styrene-acrylic ester copolymer latex in cement mortar. Mater. Struct. 2010, 43, 443–451. [Google Scholar] [CrossRef]
- Plyushch, A.O.; Paddubskaya, A.G.; Kuzhir, P.P.; Maksimenko, S.A.; Ivanova, T.; Merijs-Meri, R.; Bitenieks, J.; Zicans, J.; Suslyaev, V.I.; Pletnev, M.A. Comparative Analysis of Electromagnetic Response of PVA/MWCNT and Styrene-Acrylic Copolymer/MWCNT Composites. Russ. Phys. J. 2016, 59, 278–283. [Google Scholar] [CrossRef]
- Wang, M.; Chung, D.D.L. Understanding the increase of the electric permittivity of cement caused by latex addition. Compos. Part B Eng. 2018, 134, 177–185. [Google Scholar] [CrossRef]
- Wen, S.; Chung, D.D. Effect of admixtures on the dielectric constant of cement paste. Cem. Concr. Res. 2001, 31, 673–677. [Google Scholar] [CrossRef]
- Somtürk, S.M.; Emek, İ.Y.; Senler, S.; Eren, M.; Kurt, S.Z.; Orbay, M. Effect of wollastonite extender on the properties of exterior acrylic paints. Prog. Org. Coat. 2016, 93, 34–40. [Google Scholar] [CrossRef]
- Zareei, S.A.; Ameri, F.; Shoaei, P.; Bahrami, N. Recycled ceramic waste high strength concrete containing wollastonite particles and micro-silica: A comprehensive experimental study. Constr. Build. Mater. 2019, 201, 11–32. [Google Scholar] [CrossRef]
- Huang, H.; Guo, R.; Wang, T.; Hu, X.; Garcia, S.; Fang, M.; Luo, Z.; Maroto-Valer, M.M. Carbonation curing for wollastonite-Portland cementitious materials: CO2 sequestration potential and feasibility assessment. J. Clean. Prod. 2019, 211, 830–841. [Google Scholar] [CrossRef]
- Yao, G.; Zang, H.; Wang, J.; Wu, P.; Qiu, J.; Lyu, X. Effect of mechanical activation on the pozzolanic activity of muscovite. Clays Clay Miner. 2019, 67, 209–216. [Google Scholar] [CrossRef]
- Li, C.; Wan, J.; Sun, H.; Li, L. Investigation on the activation of coal gangue by a new compound method. J. Hazard. Mater. 2010, 179, 515–520. [Google Scholar] [CrossRef]
- China Electric Power Research Institute. Feasibility Study on Polymer Concrete Pipeline Transmission Technology; Report ZGY2017-24; NARI Group Corporation: Nanjing, China, 2017. (In Chinese) [Google Scholar]
- Standardization Administration of China, GB 175-2007. Common Portland Cement; AQSIQ and SAC: Beijing, China, 2009. [Google Scholar]
- Lingfeng Chemical Reagent Co. Ltd.: Shanghai, China. Available online: http://shlfhx.yixie8.com/ (accessed on 9 September 2019).
- Xu, H.; Sun, S.; Yu, Q.; Wei, J. Effect of β-cyclodextrin pendant on the dispersion robustness of polycarboxylate superplasticizer toward kaolin. Polym. Compos. 2018, 39, 755–761. [Google Scholar] [CrossRef]
- Zhao, H.; Deng, M.; Tang, M. Synthesis, characterization and dispersing mechanism of aminosulfonate-phenol-formaldehyde superplasticizer for the cement particles. Polym. Compos. 2018, 39, 2250–2258. [Google Scholar] [CrossRef]
- China National Standards, GB/T 1408.1-2006. Electrical Strength of Insulation Materials-Test Methods—Part 1: Tests at Power Frequencies; Chinese Standard Press: Beijing, China, 2006. [Google Scholar]
- China National Standards, GB/T 507-2002. Insulating Oil Breakdown Voltage Measurement; Chinese Standard Press: Beijing, China, 2002. [Google Scholar]
- Bompa, D.V.; Elghazouli, A.Y.; Xu, B.; Stafford, P.J.; Ruiz-Teran, A.M. Experimental assessment and constitutive modelling of rubberised concrete materials. Constr. Build. Mater. 2017, 137, 246–260. [Google Scholar] [CrossRef] [Green Version]
- Salih, A.; Salim, K.; Hassooni, M.; Shihab, A.; Jabbar, H.; Abdulameer, I.; Mahdi, S.; Kadhem, H. Study the effect of nano SiO2 on dielectric strength property of zirconia. AIP Conf. Proc. 2018, 1968, 020021. [Google Scholar] [CrossRef]
- Gunasekaran, M.; Boneti, H.J. Performance of polymer concrete insulators in Latin America. In Proceedings of the Conference on Electrical Insulation and Dielectric Phenomena—CEIDP ‘96, Millbrae, CA, USA, 20–23 October 1996; Volume 1, pp. 420–423. [Google Scholar] [CrossRef]
- Pratap, A. Vinyl ester and acrylic based polymer concrete for electrical applications. Prog. Cryst. Growth Charact. Mater. 2002, 45, 117–125. [Google Scholar] [CrossRef]
- China National Standards, GB/T 1409-2006. Recommended Methods for the Determination of the Permittivity and Dielectric Dissipation Factor of Electrical Insulating Materials at Power, Audio and Radio Frequencies Including Meter Wavelengths; Chinese Standard Press: Beijing, China, 2006. [Google Scholar]
- An, Q.; Qi, S.; Zhou, W. Thermal, electrical, and mechanical properties of Si3N4 filled LLDPE composite. Polym. Compos. 2009, 30, 866–871. [Google Scholar] [CrossRef]
- Bignozzi, M.C.; Saccani, A.; Sandrolini, F. New polymer mortars containing polymetric wastes. Part 2. Dynamic mechanical and dielectric behaviour. Compos. Part A Appl. Sci. Manuf. 2002, 33, 205–211. [Google Scholar] [CrossRef]
- Guo, J.; Wang, X.; Jia, Z.; Wang, J. Nonlinear electrical properties and field dependency of BST and nano-ZnO-doped silicone rubber composites. Molecules 2018, 23, 3153. [Google Scholar] [CrossRef] [PubMed] [Green Version]
- Luo, Y.; Luo, J.; Li, B. Performance of cross-linked polyethylene insulated cable based on detection of high voltage electric field. IEEE Trans. Electr. Electron. Mater. 2018, 20, 40–45. [Google Scholar] [CrossRef]
- Liu, T.; Fothergill, J.; Dodd, S.; Nilsson, U. Dielectric spectroscopy measurements on very low loss cross-linked polyethylene power cables. In Journal of Physics: Conference Series; University of Reading: Reading, UK, 2009; Volume 183. [Google Scholar] [CrossRef]
- Koch, D. SF6 Properties, and Use in MV and HV Switchgear. Cahier Technique No. 188. 2003. Available online: http://www.schneider-electric.com/ (accessed on 28 April 2021).
- Log, T.; Gustafsson, S.E. Transient plane source (TPS) technique for measuring thermal transport properties of building materials. Fire Mater. 1995, 19, 43–49. [Google Scholar] [CrossRef]
- Gustafsson, S.E.; Karawacki, E.; Khan, M.N. Transient hot-strip method for simultaneously measuring thermal conductivity and thermal diffusivity of solids and fluids. J. Phys. D Appl. Phys. 1979, 12, 1411. [Google Scholar] [CrossRef]
- China National Standards, GB/T10297-2015. Test Method for Thermal Conductivity of Nonmetal Solid Materials by Hot-Wire Method; Chinese Standard Press: Beijing, China, 2015. [Google Scholar]
- ISO 22007-2. Plastics—Determination of Thermal Conductivity and Thermal Diffusivity—Part 2: Transient Plane Heat Source (Hot Disc) Method; International Organization for standardization: Geneva, Switzerland, 2008. [Google Scholar]
- Jones, M.R.; McCarthy, A. Heat of hydration in foamed concrete: Effect of mix constituents and plastic density. Cem. Concr. Res. 2006, 36, 1032–1041. [Google Scholar] [CrossRef]
- Ramamurthy, K.; Kunhanandan Nambiar, E.K.; Ranjani, I.S. A classification of studies on properties of foam concrete. Cem. Concr. Compos. 2009, 31, 388–396. [Google Scholar] [CrossRef]
- Xiong, X.; Yang, M.; Liu, C.; Li, X.; Tang, D. Thermal conductivity of cross-linked polyethylene from molecular dynamics simulation. J. Appl. Phys. 2017, 122, 035104. [Google Scholar] [CrossRef]
- Zhou, W.; Wang, C.; An, Q.; Qu, H. Thermal properties of heat conductive silicone rubber filled with hybrid filler. J. Compos. Mater. 2008, 42, 173–187. [Google Scholar] [CrossRef]
- Ishida, H.; Rimdusit, S. Very high thermal conductivity obtained by boron nitride-filled polybenzoxazine. Thermochim. Acta 1998, 320, 177–186. [Google Scholar] [CrossRef]
- El-Hamouly, S.H.; Ismail, M.R.; Abdel-Rahman, H.A.; Younes, M.M.; Amin, E.H. Thermal, mineralogical, and microstructural characterizations of irradiated polymer blended cement mortar composites. Polym. Compos. 2015, 36, 1849–1858. [Google Scholar] [CrossRef]
- Alarcon-Ruiz, L.; Platret, G.; Massieu, E.; Ehrlacher, A. The use of thermal analysis in assessing the effect of temperature on a cement paste. Cem. Concr. Res. 2005, 35, 609–613. [Google Scholar] [CrossRef]
- Zhou, Q.; Glasser, F.P. Thermal stability and decomposition mechanisms of ettringite at <120 C. Cem. Concr. Res. 2001, 31, 1333–1339. [Google Scholar] [CrossRef]
- Kim, S.J.; Yang, K.H.; Moon, G.D. Hydration characteristics of low-heat cement substituted by fly ash and limestone powder. Materials 2015, 8, 5847–5861. [Google Scholar] [CrossRef] [PubMed] [Green Version]
- Khoury, G.A. Compressive strength of concrete at high temperatures: A reassessment. Mag. Concr. Res. 1992, 44, 291–309. [Google Scholar] [CrossRef]
- Bompa, D.V.; Xu, B.; Elghazouli, A.Y. Constitutive modelling and mechanical properties of cementitious composites incorporating recycled vinyl banner plastics. Constr. Build. Mater. 2021, 275, 122159. [Google Scholar] [CrossRef]
- Tiggemann, H.M.; Tomacheski, D.; Celso, F.; Ribeiro, V.F.; Nachtigall, S.M. Use of wollastonite in a thermoplastic elastomer composition. Polym. Test. 2013, 32, 1373–1378. [Google Scholar] [CrossRef]
- Bulatović, V.; Melešev, M.; Radeka, M.; Radonjanin, V.; Lukić, I. Evaluation of sulfate resistance of concrete with recycled and natural aggregates. Constr. Build. Mater. 2017, 152, 614–631. [Google Scholar] [CrossRef]
- Wang, R.; Yao, L.; Wang, P. Mechanism analysis and effect of styrene–acrylate copolymer powder on cement hydrates. Constr. Build. Mater. 2013, 41, 538–544. [Google Scholar] [CrossRef]
- Kalinkina, E.V.; Kalinkin, A.M.; Forsling, W.; Makarov, V.N. Sorption of atmospheric carbon dioxide and structural changes of Ca and Mg silicate minerals during grinding: I. Diopside. Int. J. Miner. Process. 2001, 61, 273–288. [Google Scholar] [CrossRef]
- Jo, W.H.; Cruz, C.A.; Paul, D.R. FTIR investigation of interactions in blends of PMMA with a styrene/acrylic acid copolymer and their analogs. J. Polym. Sci. Part B Polym. Phys. 1989, 27, 1057–1076. [Google Scholar] [CrossRef]
- Chatterjee, A.; Khobragade, P.S.; Mishra, S. Physicomechanical properties of wollastonite (CaSiO3)/styrene butadiene rubber (SBR) nanocomposites. J. Appl. Polym. Sci. 2015, 132, 42811. [Google Scholar] [CrossRef]
- Witkowski, H.; Koniorczyk, M. New sampling method to improve the reliability of FTIR analysis for Self-Compacting Concrete. Constr. Build. Mater. 2018, 172, 196–203. [Google Scholar] [CrossRef]
- Deshmukh, G.S.; Peshwe, D.R.; Pathak, S.U.; Ekhe, J.D. Evaluation of mechanical and thermal properties of Poly (butylene terephthalate) (PBT) composites reinforced with wollastonite. Trans. Indian Inst. Met. 2011, 64, 127. [Google Scholar] [CrossRef]
- Singh, N.P.; Singh, N.B. Interaction between poly (styrene-alt-maleic acid) sodium salt and hydrating Portland cement. Prog. Cryst. Growth Charact. Mater. 2006, 52, 84–90. [Google Scholar] [CrossRef]
- Monteagudo, S.M.; Moragues, A.; Gálvez, J.C.; Casati, M.J.; Reyes, E. The degree of hydration assessment of blended cement pastes by differential thermal and thermogravimetric analysis. Morphological evolution of the solid phases. Thermochim. Acta 2014, 592, 37–51. [Google Scholar] [CrossRef]
- Bompa, D.V.; Elghazouli, A.Y. Creep properties of recycled tyre rubber concrete. Constr. Build. Mater. 2019, 209, 126–134. [Google Scholar] [CrossRef] [Green Version]
- Richardson, I.G.; Groves, G.W. Microstructure and microanalysis of hardened ordinary Portland cement pastes. J. Mater. Sci. 1993, 28, 265–277. [Google Scholar] [CrossRef]
- Liu, S.J.; Hu, Q.Q.; Zhao, F.Q.; Chu, X.M. Utilization of steel slag, iron tailings and fly ash as aggregates to prepare a polymer-modified waterproof mortar with a core–shell styrene–acrylic copolymer as the modifier. Constr. Build. Mater. 2014, 72, 15–22. [Google Scholar] [CrossRef]
- Vardhan, K.; Goyal, S.; Siddique, R.; Singh, M. Mechanical properties and microstructural analysis of cement mortar incorporating marble powder as partial replacement of cement. Constr. Build. Mater. 2015, 96, 615–621. [Google Scholar] [CrossRef]
- Xu, B.; Bompa, D.V.; Elghazouli, A.Y. Cyclic stress–strain rate-dependent response of rubberised concrete. Constr. Build. Mater. 2020, 254, 119253. [Google Scholar] [CrossRef]
- CEN (European Committee for Standardization). EN 1992-1-1, Eurocode 2: Design of Concrete Structures, Part 1–1: General Rules for Buildings; CEN: Brussels, Belgium, 2004. [Google Scholar]
- National Standard GB50010-2010. Code for Design of Concrete Structures; Ministry of Housing and Urban-Rural Construction of the People’s Republic of China: Beijing, China, 2011. [Google Scholar]
- Harrison, G.P.; McLean, E.J.; Karamanlis, S.; Ochoa, L.F. Life cycle assessment of the transmission network in Great Britain. Energy Policy 2010, 38, 3622–3631. [Google Scholar] [CrossRef] [Green Version]
- Mo, S.; Zhang, J.; Liang, D.; Chen, H. Study on Pyrolysis Characteristics of Cross-linked Polyethylene Material Cable. Procedia Eng. 2013, 52, 588–592. [Google Scholar] [CrossRef] [Green Version]
- Ou, Y. Practical Technology of Flame Retardant; Chemical Industry Press: Shanghai, China, 2002; p. 234. [Google Scholar]
- Qudaih, R.; Janajreh, I.; Vukusic, S.E. Recycling of cross-linked polyethylene cable waste via particulate infusion. In Advances in Sustainable Manufacturing, Proceedings of the 8th Global Conference on Sustainable Manufacturing, Abu Dhabi, United Arab Emirates, 22–24 November 2010; Springer: Berlin/Heidelberg, Germany, 2011; pp. 233–239. [Google Scholar]
- Hammond, G.P.; Jones, C.I. Embodied energy and carbon in construction materials. Proc. Inst. Civ. Eng. Energy 2008, 161, 87–97. [Google Scholar] [CrossRef] [Green Version]
- Kissinger, M.; Sussmann, C.; Moore, J.; Rees, W.E. Accounting for greenhouse gas emissions of materials at the urban scale-relating existing process life cycle assessment studies to urban material and waste composition. Low Carbon Econ. 2013, 4, 36–44. [Google Scholar] [CrossRef] [Green Version]
- Electricity Alliance. Kirkby to Lister Drive: Cable Replacement Project. Electricity Alliance London. 2007. Available online: http://www.nationalgrid.com/uk/Electricity/projects/kirkby/ (accessed on 7 June 2021).
- Singh, P.; Deparrois, N.; Burra, K.G.; Bhattacharya, S.; Gupta, A.K. Energy recovery from cross-linked polyethylene wastes using pyrolysis and CO2 assisted gasification. Appl. Energy 2019, 254, 113722. [Google Scholar] [CrossRef]
- Cableizer. Embodied Energy and Carbon. 2021. Available online: https://www.cableizer.com/documentation/EEC/ (accessed on 10 June 2021).
- Hossain, M.U.; Poon, C.S.; Lo, I.M.C.; Cheng, J.C.P. Comparative LCA on using waste materials in the cement industry: A Hong Kong case study. Resour. Conserv. Recycl. 2017, 120, 199–208. [Google Scholar] [CrossRef]
- Bushi, L.; Meil, J. An Environmental Life Cycle Assessment of Portland Limestone and Ordinary Portland Cement in Concrete; Technical Brief; Athena Sustainable Materials Institute: Ottawa, ON, Canada, 2014. [Google Scholar]
- Sabau, M.; Bompa, D.V.; Silva, L.F. Comparative carbon emission assessments of recycled and natural aggregate concrete: Environmental influence of cement content. Geosci. Front. 2021, 12, 101235. [Google Scholar] [CrossRef]
- Chen, T.Y.; Burnett, J.; Chau, C.K. Analysis of embodied energy use in the residential building of Hong Kong. Energy 2001, 26, 323–340. [Google Scholar] [CrossRef]
- Kwon, S.J.; Wang, X.Y. Optimization of the mixture design of low-CO2 high-strength concrete containing silica fume. Adv. Civ. Eng. 2019, 2019, 7168703. [Google Scholar] [CrossRef] [Green Version]
- Cognat, F.; EPDLA Life Cycle Inventory of Polymer Dispersions. European Plymer Dispersion & Latex Association. 2012. Available online: https://specialty-chemicals.eu/wp-content/uploads/2017/07/4_EPDLA-Life-Cycle-Assessment-LCA-Summary-Report.pdf (accessed on 7 June 2021).
Figure 1.
Flow chart of the experimental investigation.

Figure 2.
Optimisation of samples from mould casting with gradual improvement in compaction: (a) very poor, (b) poor, (c) acceptable, (d) good, (e) very good and (f) excellent. (Note: the lowest sample number ‘1’ indicates a poor homogeneity, and the highest sample number ‘6’ indicates excellent homogeneity).

Figure 3.
(a) Test machine and sketch of electrodes and specimen. (b) Change in dielectric strength with components added.
Figure 3.
(a) Test machine and sketch of electrodes and specimen. (b) Change in dielectric strength with components added.

Figure 4.
Sample characteristics for composite materials with (a) wollastonite and (b) wollstonite and muscovite.
Figure 4.
Sample characteristics for composite materials with (a) wollastonite and (b) wollstonite and muscovite.

Figure 5.
Dielectric strength results for different mixing procedures.

Figure 6.
Dielectric loss tangent of the PCC material under different temperatures and voltages and an idealisation of the dielectric medium as the capacitor and resistor (top right panel).
Figure 6.
Dielectric loss tangent of the PCC material under different temperatures and voltages and an idealisation of the dielectric medium as the capacitor and resistor (top right panel).

Figure 7.
Thermal conductivity test. (a) DRE thermal conductivity parameter test machine. (b) Test results.
Figure 7.
Thermal conductivity test. (a) DRE thermal conductivity parameter test machine. (b) Test results.

Figure 8.
Relationship between remaining mass as a percentage and temperature of samples from (a) group S1, (b) group S2, (c) group S3 and (d) group S4.
Figure 8.
Relationship between remaining mass as a percentage and temperature of samples from (a) group S1, (b) group S2, (c) group S3 and (d) group S4.


Figure 9.
FTIR curves of the samples analysed.

Figure 10.
Microstructure images.

Figure 11.
Prototype of a 35-kV PCC cable tunnel.


Table 1.
Initial mixes with cement and SA emulsion (mass in each sample).
| Sample Number | Number of Mixes (-) | Cement (g) | SA(g) | Wollastonite (g) | Muscovite (g) | Superplasticiser + Defoamer (g) | Water (g) |
|---|---|---|---|---|---|---|---|
| TT00-TT20 | 21 | 40 | 0–20 | 0 | 0 | 0.32 | 10 |
| TW01-TW16 | 15 | 40 | 10 | 1–15 | 0 | 0.32 | 10 |
| TM01-TM16 | 15 | 40 | 10 | 5 | 1–15 | 0.32 | 10 |
Table 2.
Properties of composite samples from different manufacturing methods.
| Method | Group | Type | Cement (g) | SA (g) | Wollastonite (g) | Muscovite (g) | Superplasticiser + Defoamer (g) | Water (g) | Dielectric Strength (kV/mm) |
|---|---|---|---|---|---|---|---|---|---|
| MC | S1 | PCW C | 40 | 10 | 5 | 0 | 0.32 | 10 | 6.1 |
| S5 | PCW/MC | 40 | 10 | 5 | 3.2 | 0.32 | 10 | 7.8 | |
| VM | S2 | PCWC | 40 | 10 | 5 | 0 | 0.32 | 10 | 9.4 |
| S6 | PCW/MC | 40 | 10 | 5 | 3.2 | 0.32 | 10 | 9.7 | |
| CM | S3 | PCWC | 40 | 10 | 5 | 0 | 0.32 | 10 | 13.2 |
| S7 | PCW/MC | 40 | 10 | 5 | 3.2 | 0.32 | 10 | 11.4 | |
| PM | S4 | PCWC | 40 | 10 | 5 | 0 | 0.32 | + | 16.5 |
| S8 | PCW/MC | 40 | 10 | 5 | 3.2 | 0.32 | + | 14.1 |
Table 3.
Average electrical, thermal and mechanical properties of the PWC composites tested.
| Method | Group | Dielectric Strength (kV/mm) | SD * | Thermal Conductivity (W/mK) | SD | Compressive Strength (MPa) | SD | Flexural Strength (MPa) | SD |
|---|---|---|---|---|---|---|---|---|---|
| MC | S1 | 6.1 | 0.5 | 1.54 | 0.17 | 38.2 | 3.7 | 7.2 | 0.6 |
| VM | S2 | 9.4 | 0.5 | 1.60 | 0.07 | 40.5 | 4.5 | 12.0 | 1.0 |
| CM | S3 | 13.2 | 1.5 | 1.65 | 0.08 | 65.8 | 4.9 | 15.7 | 1.8 |
| PM | S4 | 16.5 | 0.6 | 2.56 | 0.20 | 80.7 | 6.8 | 20.5 | 1.8 |
* The standard deviations (SDs) of the corresponding data.
| Material | Embodied Energy (MJ/t) | Embodied Carbon (kg CO2 eq./t) | Specific Gravity (-) | Embodied Energy/m3 (MJ/m3) | Embodied Carbon/m3 (kg CO2 eq./m3) |
|---|---|---|---|---|---|
| PVC | 77,000 | 3100 | 1.40 | 107,800 | 4340 |
| PE | 76,700 | 3100 | 0.96 | 73,600 | 2970 |
| XLPE | 76,700 | 4400 | 0.92 | 70,560 | 4050 |
| HDPE | 77,000 | 2700 | 1.96 | 150,920 | 5300 |
| Components (Group S3) | Embodied Energy (MJ/t) | Embodied Carbon (kg CO2 eq./t) | Amount per Sample (g) | Specific Gravity (-) | Embodied Energy/m3 of PCC (MJ/m3) | Embodied Carbon /m3 of PCC (kg CO2 eq./m3) |
|---|---|---|---|---|---|---|
| Cement | 5500 | 1000 | 40 | 3.11 | 6430 | 1200 |
| SA | 37,400 | 1500 | 10 | 1.08 | 10,920 | 438 |
| Wollastonite | - | - | 5 | 2.75 | - | - |
| Muscovite | - | - | 0 | 2.77 | - | - |
| Superplasticiser | 9000 | 250 | 0.32 | 1.08 | 84 | 2.3 |
| Sum | 17,434 | 1640 |
Publisher’s Note: MDPI stays neutral with regard to jurisdictional claims in published maps and institutional affiliations. |
© 2021 by the authors. Licensee MDPI, Basel, Switzerland. This article is an open access article distributed under the terms and conditions of the Creative Commons Attribution (CC BY) license (https://creativecommons.org/licenses/by/4.0/).
Share and Cite
MDPI and ACS Style
Xu, B.; Li, H.; Bompa, D.V.; Elghazouli, A.Y.; Chen, J. Performance of Polymer Cementitious Coatings for High-Voltage Electrical Infrastructure. Infrastructures 2021, 6, 125. https://0-doi-org.brum.beds.ac.uk/10.3390/infrastructures6090125
AMA Style
Xu B, Li H, Bompa DV, Elghazouli AY, Chen J. Performance of Polymer Cementitious Coatings for High-Voltage Electrical Infrastructure. Infrastructures. 2021; 6(9):125. https://0-doi-org.brum.beds.ac.uk/10.3390/infrastructures6090125
Chicago/Turabian StyleXu, Bowen, Hui Li, Dan V. Bompa, Ahmed Y. Elghazouli, and Jiangbo Chen. 2021. "Performance of Polymer Cementitious Coatings for High-Voltage Electrical Infrastructure" Infrastructures 6, no. 9: 125. https://0-doi-org.brum.beds.ac.uk/10.3390/infrastructures6090125