In Situ X-ray Diffraction Analysis of Stresses during Deep Rolling of Steel


1
Leibniz Institute for Materials Engineering IWT, Division Materials Science, Badgasteiner Str. 3, 28359 Bremen, Germany
2
MAPEX Center for Materials and Processes, University of Bremen, Bibliothekstr. 1, 28359 Bremen, Germany
*
Author to whom correspondence should be addressed.
Quantum Beam Sci. 2018, 2(4), 20; https://0-doi-org.brum.beds.ac.uk/10.3390/qubs2040020
Submission received: 1 June 2018
/
Revised: 12 September 2018
/
Accepted: 25 September 2018
/
Published: 28 September 2018
(This article belongs to the Special Issue Strain, Stress and Texture Analysis with Quantum Beams)
Abstract
:Residual stresses originating from elasto-plastic deformation during mechanical processing can be analyzed post-process with various known methods. A new measurement method to measure and evaluate the strain and stress fields in situ under the contact point during a deep rolling process was developed to describe the dependence of the residual stresses from the internal material load. Using synchrotron radiation at European Synchrotron Radiation Facility (ESRF) (ID11), diffraction measurements were performed in transmission geometry during dynamical loading with different process parameters. The strain and stress fields were analyzed with high spatial resolution in an 8 mm × 4 mm area around the contact point during the process using a 13-mm tungsten carbide roller on samples of AISI 4140H steel. Fast data acquisition allowed the reconstruction of full two-dimensional (2D) strain and stress maps. These could be used to determine the response from the initial material state in front of the roller to the mechanically loaded region with plastic deformation up to the processed material with the resulting residual stresses. This comprehensive analysis was then used to link the internal material load with the resulting residual stresses in the final material state.
1. Introduction
The study of surface modifications achieved through processes with mechanical impact is generally based on the measurement of residual stresses and other material modifications ex situ after the process. For the plastic deformation induced in machining with turning or deep rolling tools, several in-depth studies have investigated the surface state after hard turning, as conducted by M’saoubi et al. [1], and the deep rolling process, as conducted by Meyer et al. [2]. Thus, specific knowledge about the influence of contact parameters in mechanical machining and the resulting residual stresses is available. A different approach, based on the material response, would be to analyze the internal material load at each point of the specimen volume to determine its influence on the resulting material modifications. Using synchrotron radiation, it is possible to measure the material modifications during the application of mechanical or thermal load, whereas measurements during tensile tests of steel specimens have been conducted by Weisser et al. [3] to determine the influence of tensile load on the microstructure. These types of measurements provide information about the spatial and temporal evolution of the material state using synchrotron X-ray diffraction analysis. In situ measurement during processes was also established to investigate internal material load during the orthogonal cutting process by Uhlmann et al. [4], or to analyze the change in microstructure during welding by Staron et al. [5]. For mechanical processing effects, the deep rolling process gives a very specific set of contact parameters leading to the plastification of the surface and inducing material modifications several millimeters inside of the specimen, which was measured for static indentation in a previously published study by Meyer et al. [6], where it was shown that the loading and residual stress fields are symmetric without sample movement. The present study shows the application of synchrotron X-ray diffraction to evaluate the loading stress in QT42CrMo4 steel during the deep rolling process in situ, which adds layers of complexity to the analysis of the superposed states that are found around the contact point while the sample material moves through the process zone, to determine the distribution and amount of the contributing stress components, as well as the interaction of loading stresses and generated residual stresses in the region. The dynamic interaction of the loading fields with the material and the resulting material state can be analyzed in situ with this method, allowing the in-depth study of the mechanical contact. Information about the effect of varying contact parameters on the machined surface was obtained from the measurement of three contact forces applied on the deep rolling tool. The measurement of the loading state within the material and its resulting material modifications, which can be extracted from the analysis shown in this study, is part of a new approach described by Brinksmeier et al. [7] to develop a mechanism-based prediction of metal processing. This approach makes the prediction of the material end state from the applied internal material load possible, which is connected to the fields studied in this analysis since both the internal material load, transition zone, and residual stress end state have been measured for specific contact parameters.
2. Materials and Methods
The in situ process setup used for the experiments in this study consists of a portable frame for an industrial deep rolling tool from Ecoroll AG (Celle, Germany) with a high-pressure hydraulic system to provide lubrication and the required contact force for the mechanical machining. The tool itself consists of a modified cylindrical tungsten carbide roller with a diameter of 13 mm in a brass holder, which is applied vertically on the specimen surface. The tool is connected to the frame in a static alignment, while a sample holder on a linear drive moves the sample with a speed of v = 0.02 mm/s below the contact point (CP), thus creating a deep rolled surface. This slow movement can be considered as quasi-static from the material point of view.
The measured material state consists of specimens of AISI 4140 steel of with a length of 70 mm and a height of 20 mm, as well as a tempered martensitic structure achieved through heating to 850 °C for 2 h, then quenching in 60 °C oil followed by a tempering step at 400 °C for 4 h. The width of the specimen is at 2.8 mm after electro-polishing to eliminate surface changes from the heat treatment. The resulting yield strength was determined to be1420 MPa and the ultimate tensile strength was1550 MPa. Chemical composition of the steel specimens is given in Table 1.
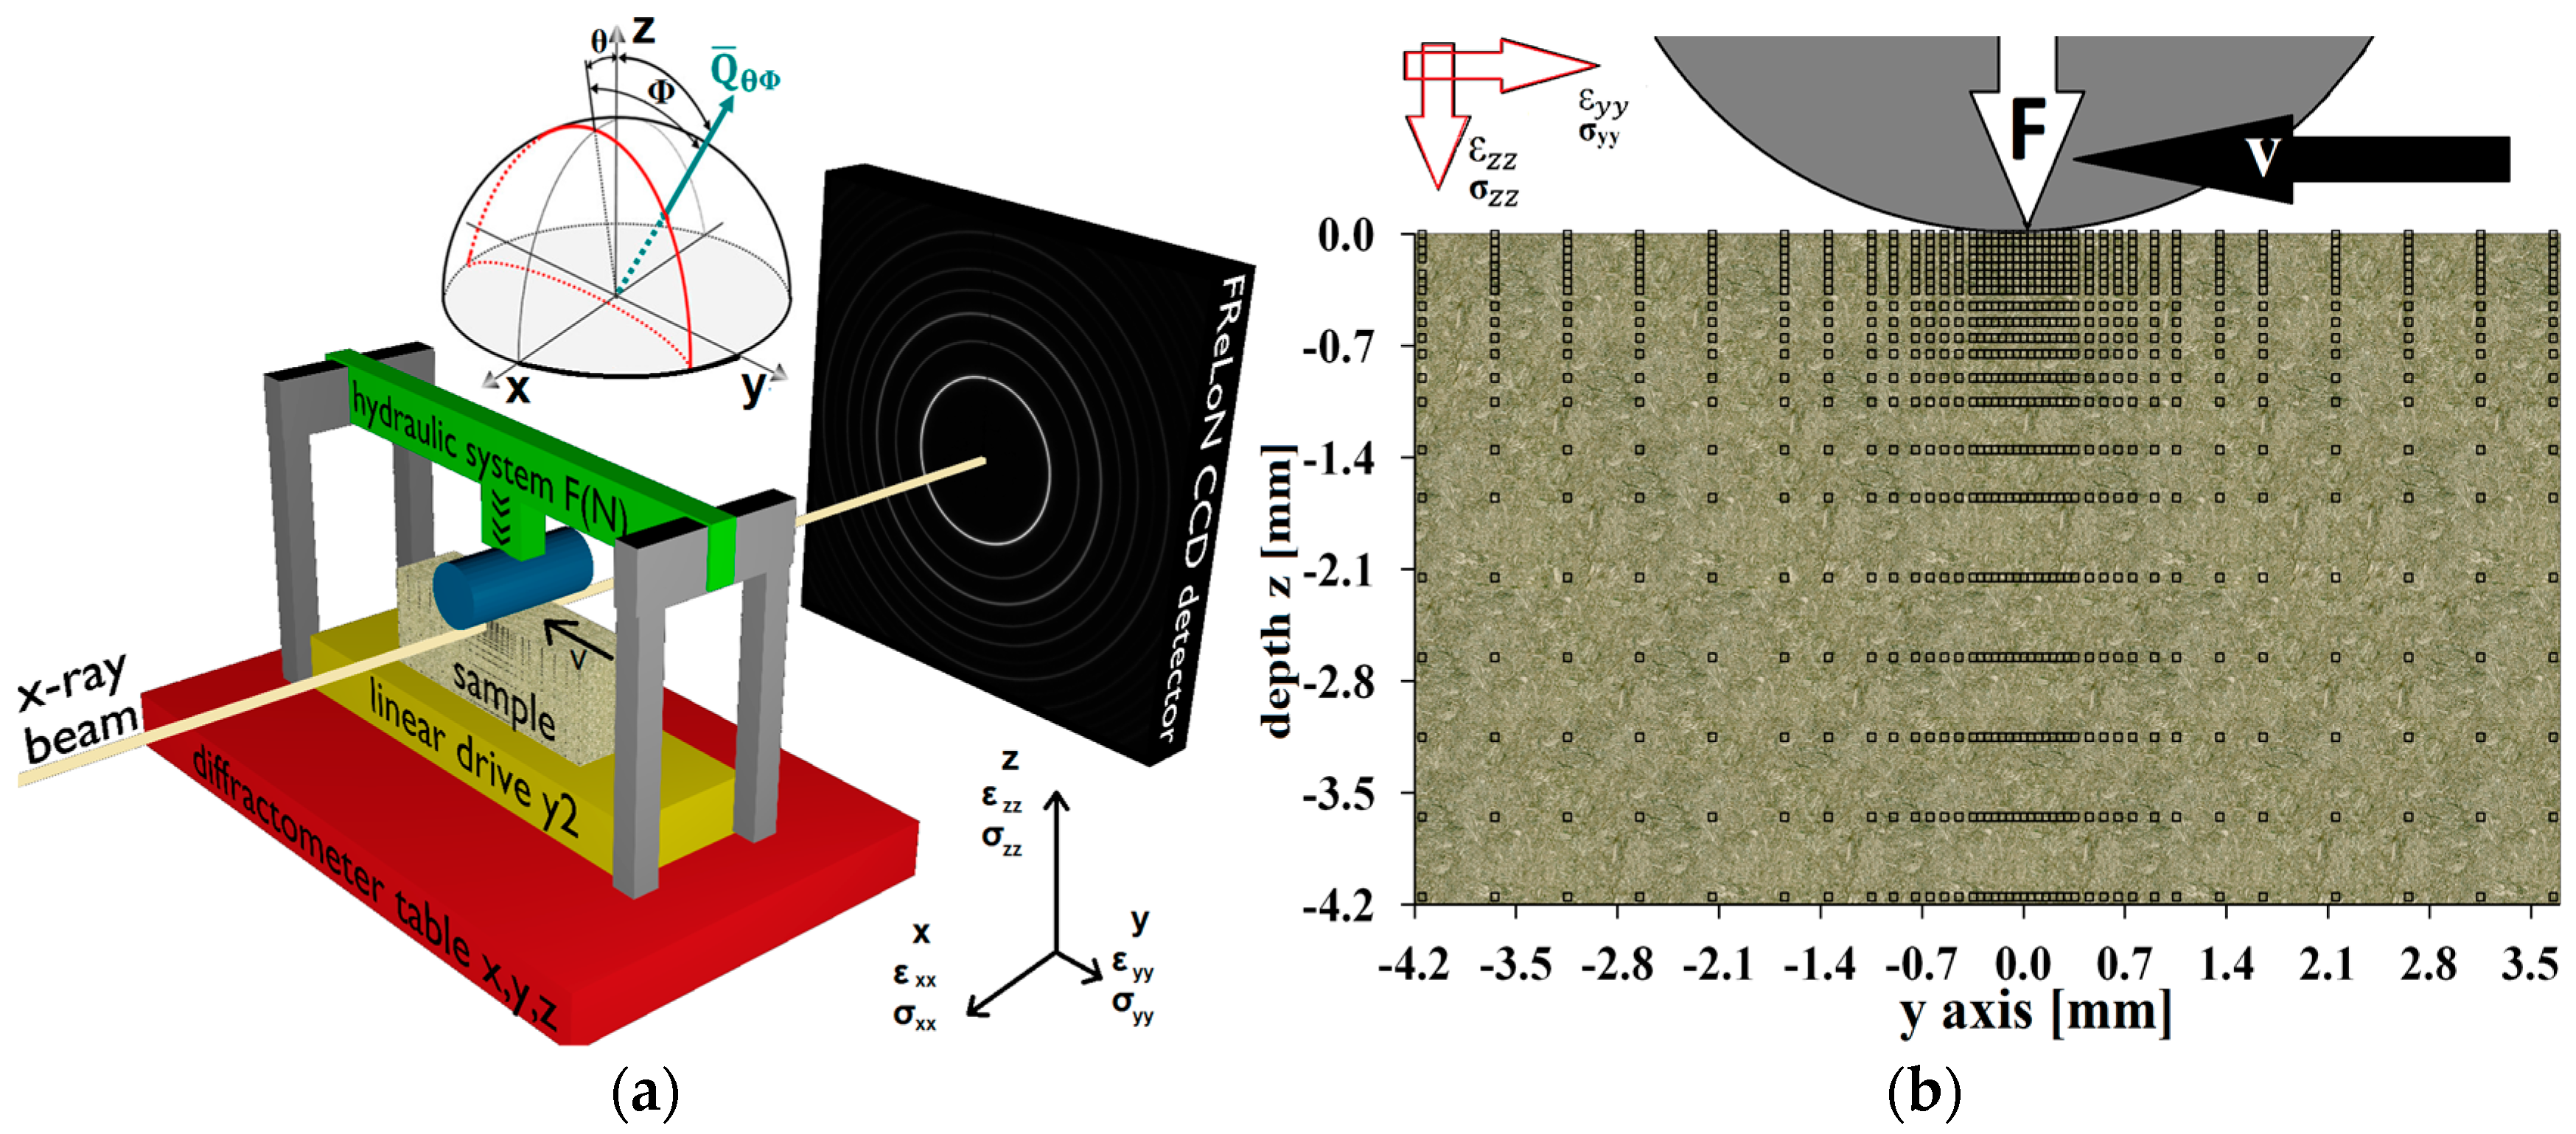
This setup was installed on the diffractometer table of beamline ID11 EH1 at the European Synchrotron Radiation Facility (ESRF, Grenoble, France), during a 48 h beamtime to measure the material modifications with synchrotron diffraction in transmission geometry. The layout of the deep rolling frame and beamline optics is shown in Figure 1a.
The material is in constant motion through the measurement region during the process, but the scan is finished before the boundary conditions of the outward edges can interfere with the stress fields. The sample is moved below the tool, and the resulting internal material loads are scanned as a function of the distance from the contact point. A total of 960 measurement positions were scanned in a region with dimensions of 7.8 mm in width and 3.65 mm in depth along the z direction, with a 50 µm ×50 µm beam size at 100 keV photon energy. The gauge volume for measurement is thus 50 µm × 50 µm × 2800 µm. Each measurement position has a 1-s measurement time consisting of 0.2 s collection duration and 0.8 s diffractometer movement and readout. The distribution of all scans and the sample coordinate system is shown in Figure 1b.
Since the tool and the CP are static during processing, it is possible to scan the material in the processed region without time resolution issues since the sample is considered to be a semi-infinite body with isotropic and homogeneous properties over the length.
From the distributed measurement positions, it is possible to reconstruct the two-dimensional (2D) strain and stress field of the material under deep rolling contact in a dynamic state during the processing, as shown previously by Meyer et al. [6] for the static indentation of specimens using the same experimental set up. The measurements were repeated for three loading states of the tool, which ranged from 3000 N to 3400 N and 3900 N, while the last case is extensively discussed in Section 4. The force applied corresponds to 5 MPa differences in the hydraulic system, which was operated at 30 MPa, 35 MPa, and 40 MPa and later calibrated with a force sensor under the tool.
3. Theoretical Approach and Analysis
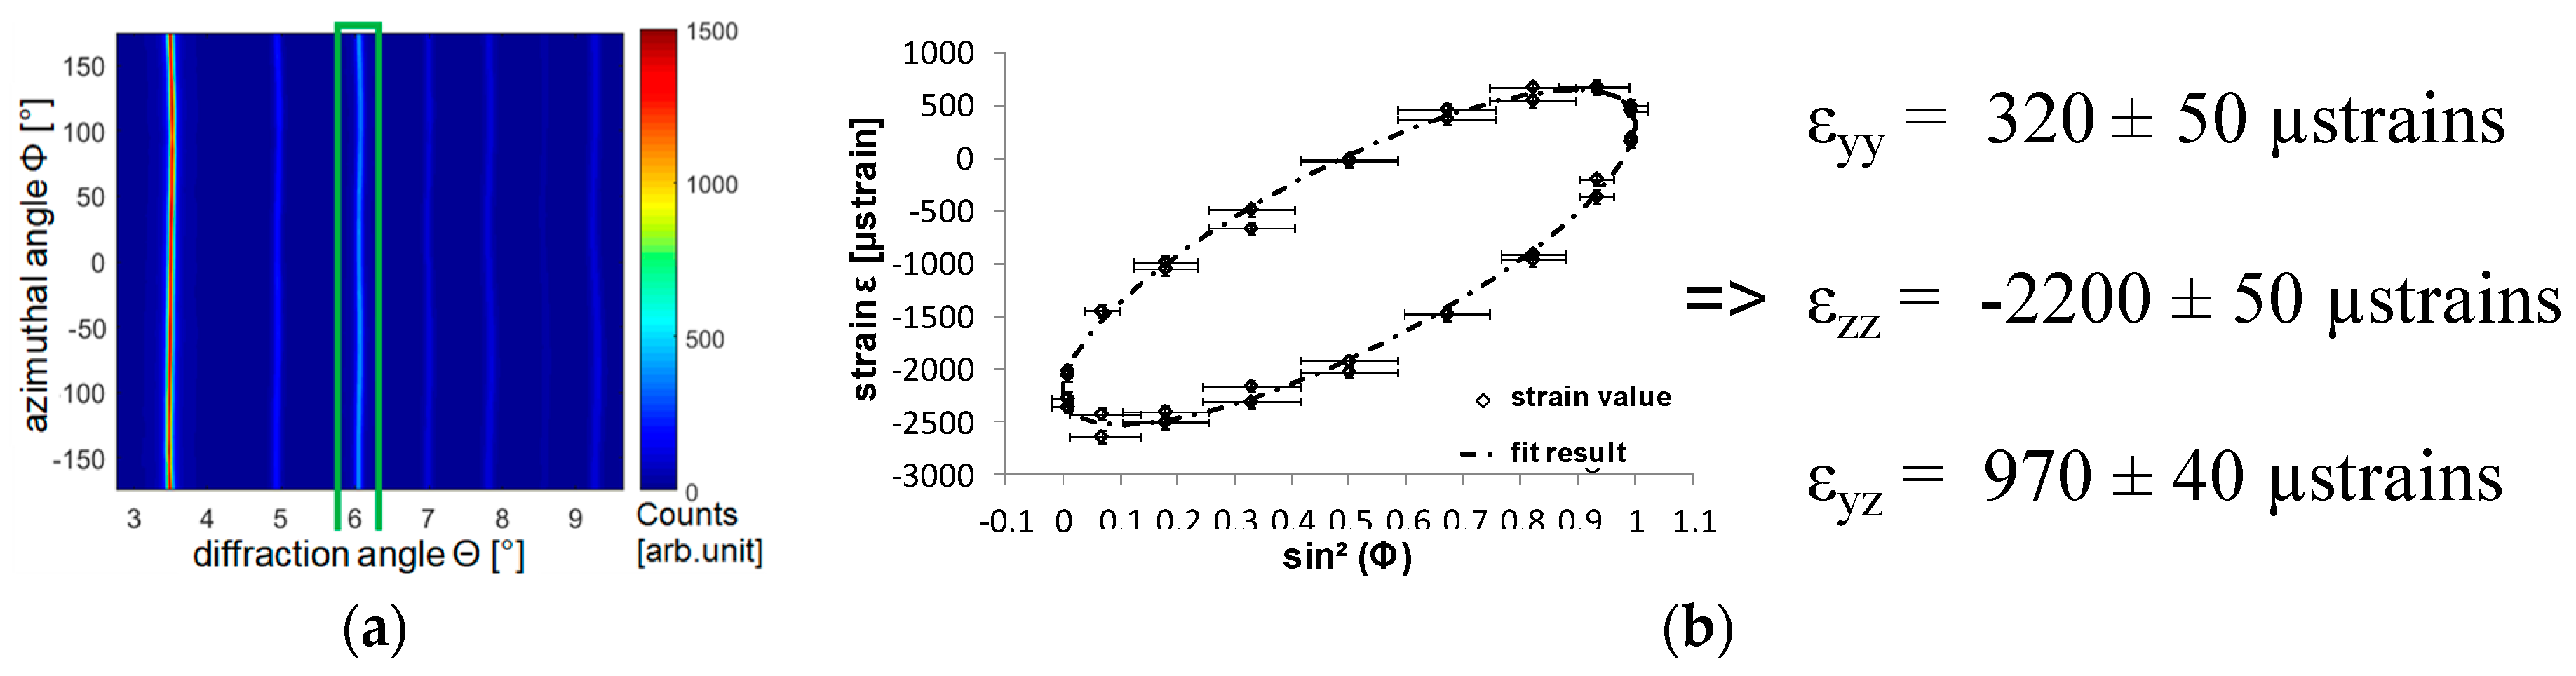
Internal material load and residual stresses can be analyzed from the full diffraction rings of the material utilizing the FRELON detector with 2048 × 2048 pixels and a 47.2 μm pixel size at a distance of 0.27 m. Specifically, the α{211} reflex of the iron martensite was analyzed after azimuthal integration (caking) with the pyFAI program, programmed by Ashiotis et al. [8]. This is shown in Figure 2a as a recalculation of the diffraction image, with α{211} marked with the rectangular area. Calibration of the setup was achieved with LaB6 specimens of comparable thickness. During processing, the strain-free state was determined by averaged measurements from the outer edge of the measurement window with at least a distance of 5 mm to the contact point. The strain was analyzed for 72 equally spaced 5° sections using the plane strain state modified fundamental equation of strain state determination to determine the εyy, εzz, and εyz strain components, as given in residual stress analysis by Noyan [9]. This is shown as an example in Figure 2b, depending on analysis of the strain values for the diffraction angle and each azimuthal angle in Equation (1), in the example for a single point, and was then conducted for the whole 2D stress field.
The plane strain state may be used in this case because relaxation at the boundary condition in the width only affects a small amount of the measured gauge volume, as shown by Uhlmann et al. in a comparable experimental case [4].
This approach is comparable to the analysis done by Zeilinger et al. [10] for the determination of loading stress during the fracturing of thin films. The strain state was then recalculated with the X-ray elastic constants ½ S2 = 5.81 × 10⁻⁵ MPa−1, which are connected to the elastic modulus E and the Poisson value , as given by Noyan for steel specimens [9],to determine the σxx, σyy, σyz, and σzz stress components as well as the hydrostatic σh and equivalent (von Mises) stress σeq, as used by Kuznetsov et al. [11] for the description of burnishing processes using Equation (2). A mean error for the stress values at each point of 30 MPa was achieved, increasing to 50 MPa for the calculated equivalent stresses using the von Mises yield criterion.
4. Results
Stress Distribution during Deep Rolling
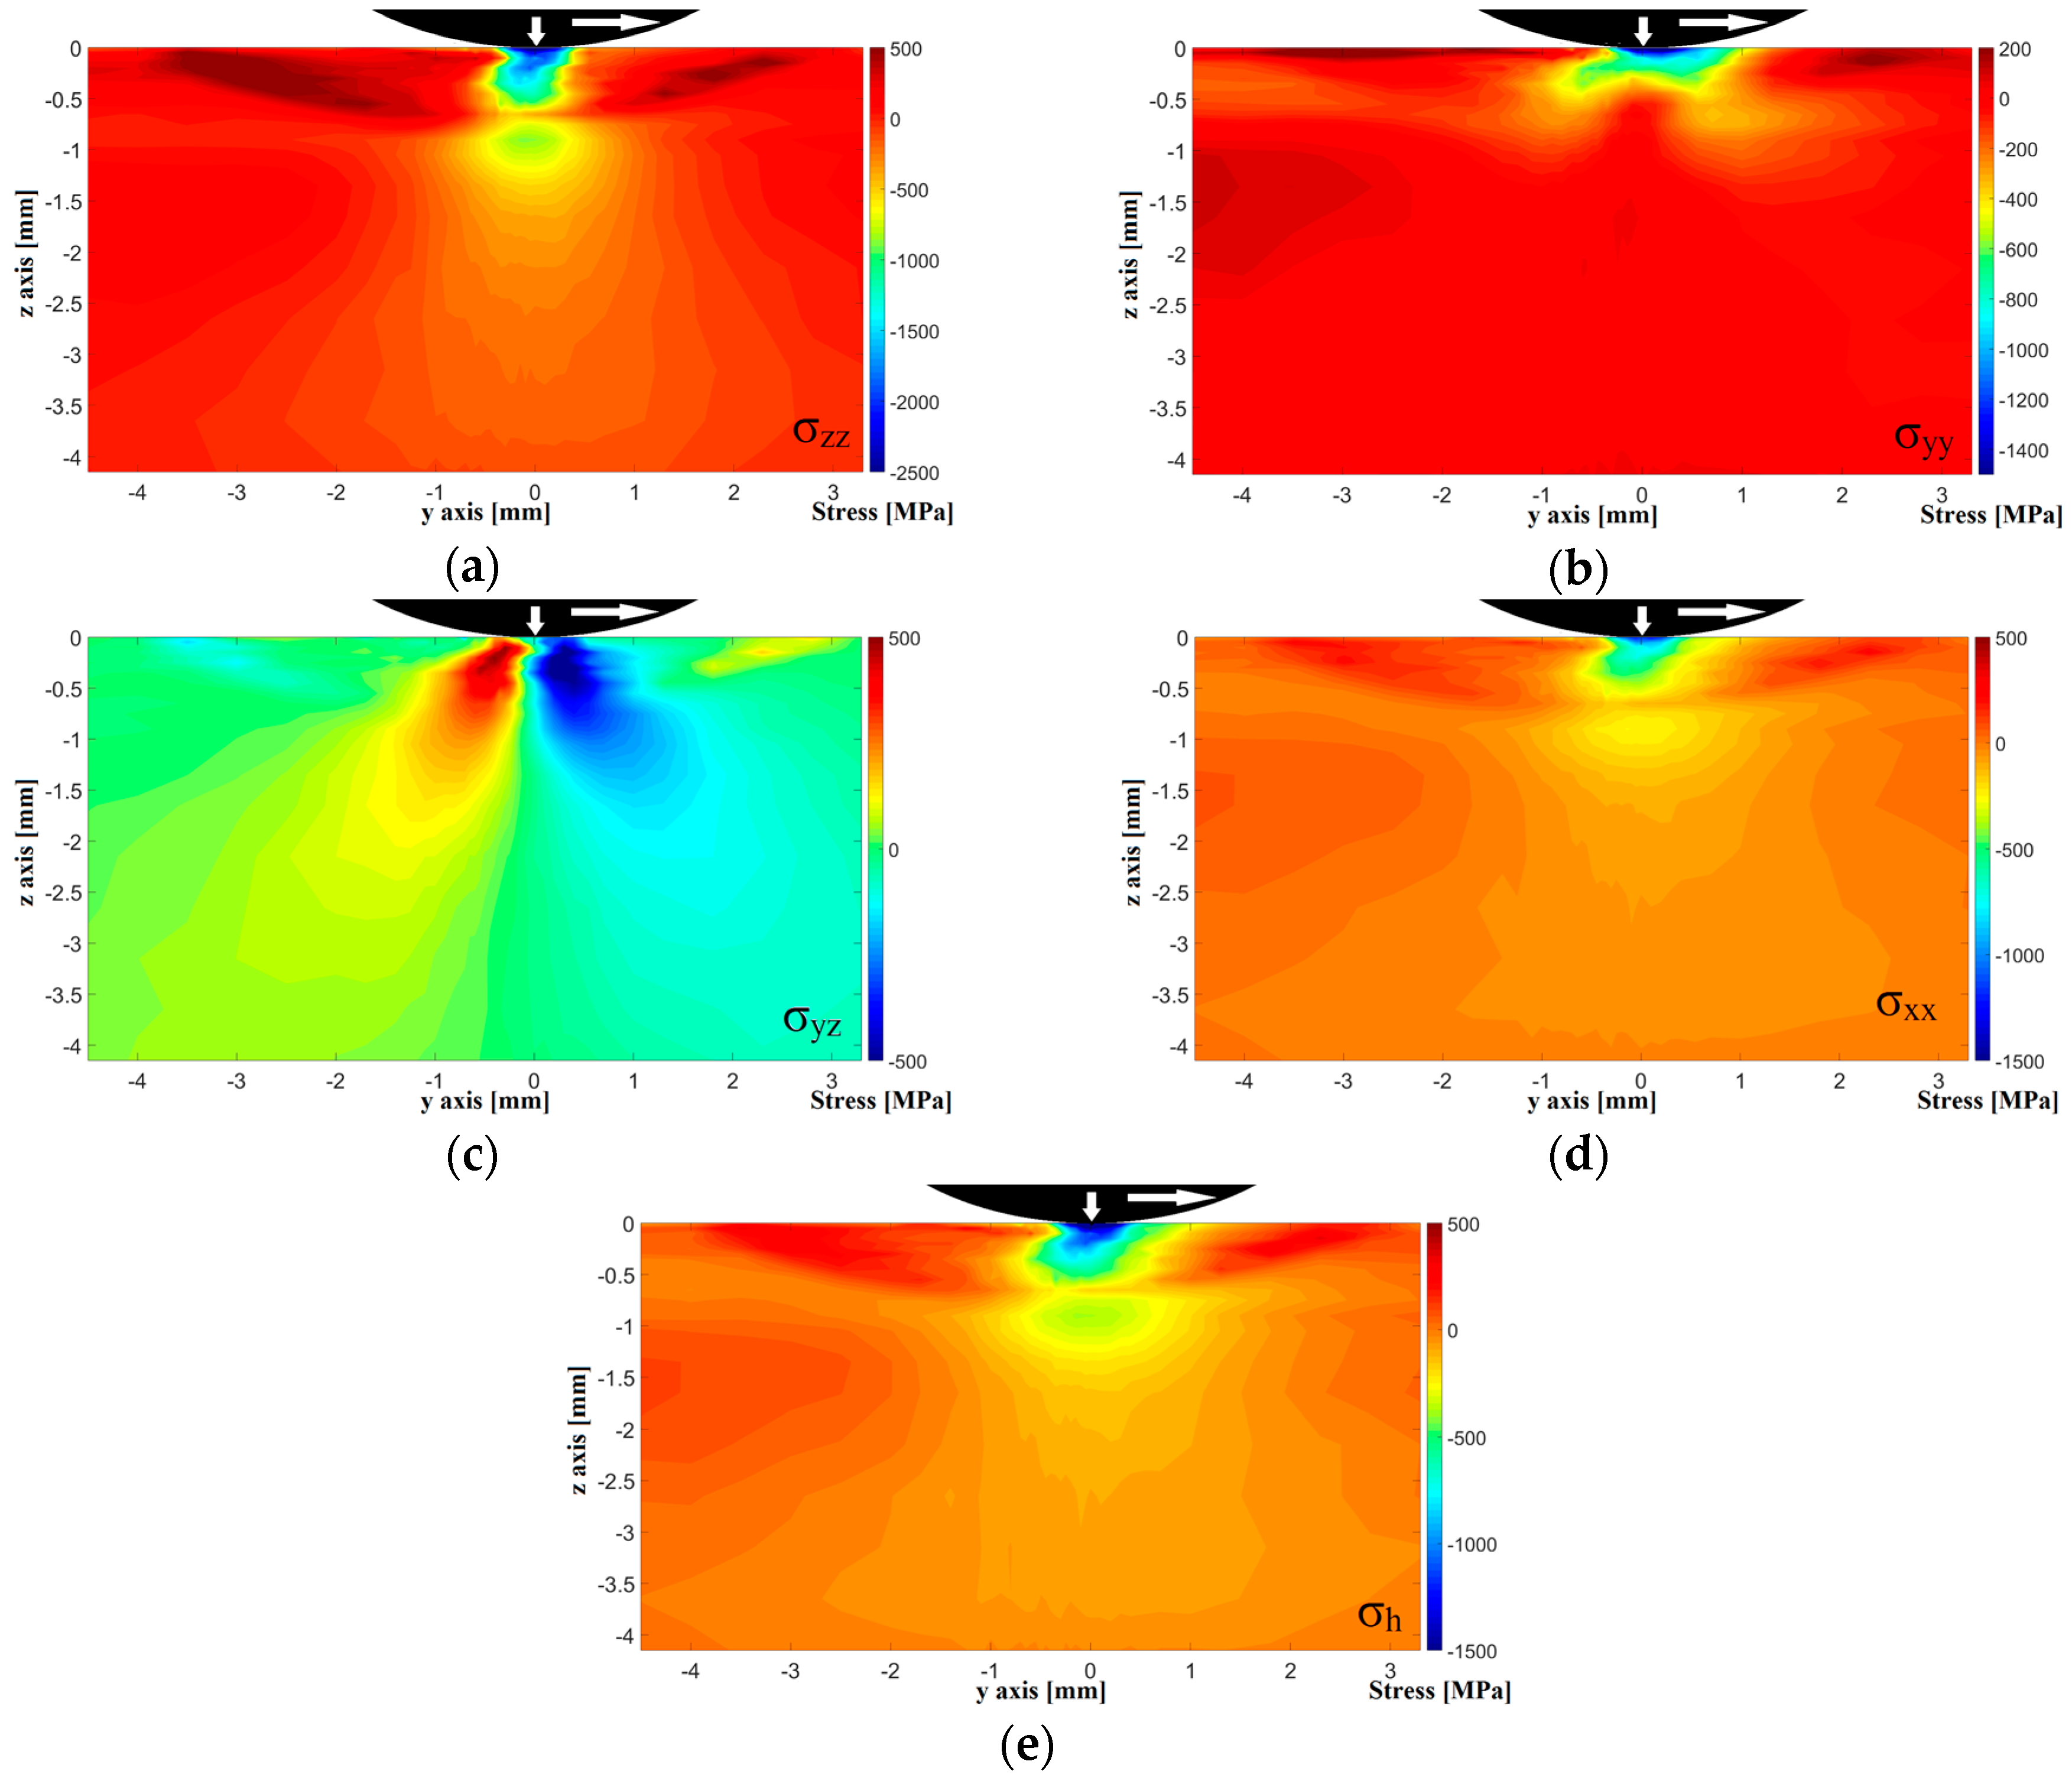
Using synchrotron diffraction data from gauge volumes in the region of the contact point, stress maps showing the distribution of the different stress components are represented as moment captions, where each y-axis position represents a different moment during the process. The first position on the right side describes the material state ahead of the tool just before processing. At position y = 0 mm, the center of the contact point can be distinguished by the increased field strength in all stress components, while the further evolution to negative y-values shows the material state in the transition zone and after processing. The last y position is more or less unaffected by the tool and therefore represents the final state after processing. The analysis during the process shows pronounced loading stress fields developing from the contact point and spreading into the material at different angles at a loading force of 3900 N (Figure 3). As the plastically deformed material leaves the influence of the mechanical contact, the applied loading stress field decreases and separates from the generated surface residual stress field, which can be detected in the region at around y = −4 mm. For the region of plastic deformation, it has to be noted that pure loading stress and created residual stress cannot be separated in this measurement method, since the plastic deformation and residual stress generation take place instantaneously during the loading process when the yield strength is reached. Following the deformation, both components of the stress field are superimposed in each point until the loading stress finally completely disappears on the outward-bound material of the processing direction, where the residual stress is detectable. The determined σzz component (normal stress) displays the highest compressive loading stress, with a maximum at the surface and vertical spread into the affected material. Slight tensile residual stresses can be detected in the surface region after contact, as shown in Figure 3a. The σyy component (longitudinal stress) expands in a tilted direction from the surface in depth, as displayed in Figure 3b.
In comparison, for the region of depth up to 1 mm, where residual stresses were detected, the σzz component decreases from −2500MPa to −800 MPa compressive stresses, while the component ranges from a maximum of −1400 MPa to a local minimum directly under the contact point at −100 MPa. The stress component σy, showing compressive residual stresses, is the component generally measured ex situ with standard methods and is connected to increased fatigue properties of processed parts, as found by Kloos et al. [12]. Therefore, further analysis of this stress component depending on the applied contact forces will follow in Section 5.1.
Shear stresses of the σyz component extend in 45° angles into the material in the loaded region, while the resulting residual stresses (at y = −4.15 mm) are almost zero. This can be attributed to the small amount of shear material flow in the surface region, which is rather small compared to the cutting processes with high shear forces, as found by Shet et al. [13]. The σxx and hydrostatic σh fields and distribution are calculated on the basis of the available stress components and are mainly dominated by the σzz component, which thus follow similar expansion into the material, as shown in Figure 3d,e. The stress fields show a high degree of symmetry to the contact point, which was also observed from indentation tests in the static condition, as found by Meyer et al. [6]. However, the interaction of loading stresses with the residual stresses and the material build-up in front of the roller lead to a slight asymmetry, which is less noticeable for σzz and σyz components and can be seen in the leading region and residual stress of the σyy component.
5. Discussion
5.1. Influence of Contact Parameters on Loading Stress and Residual Stress Distribution
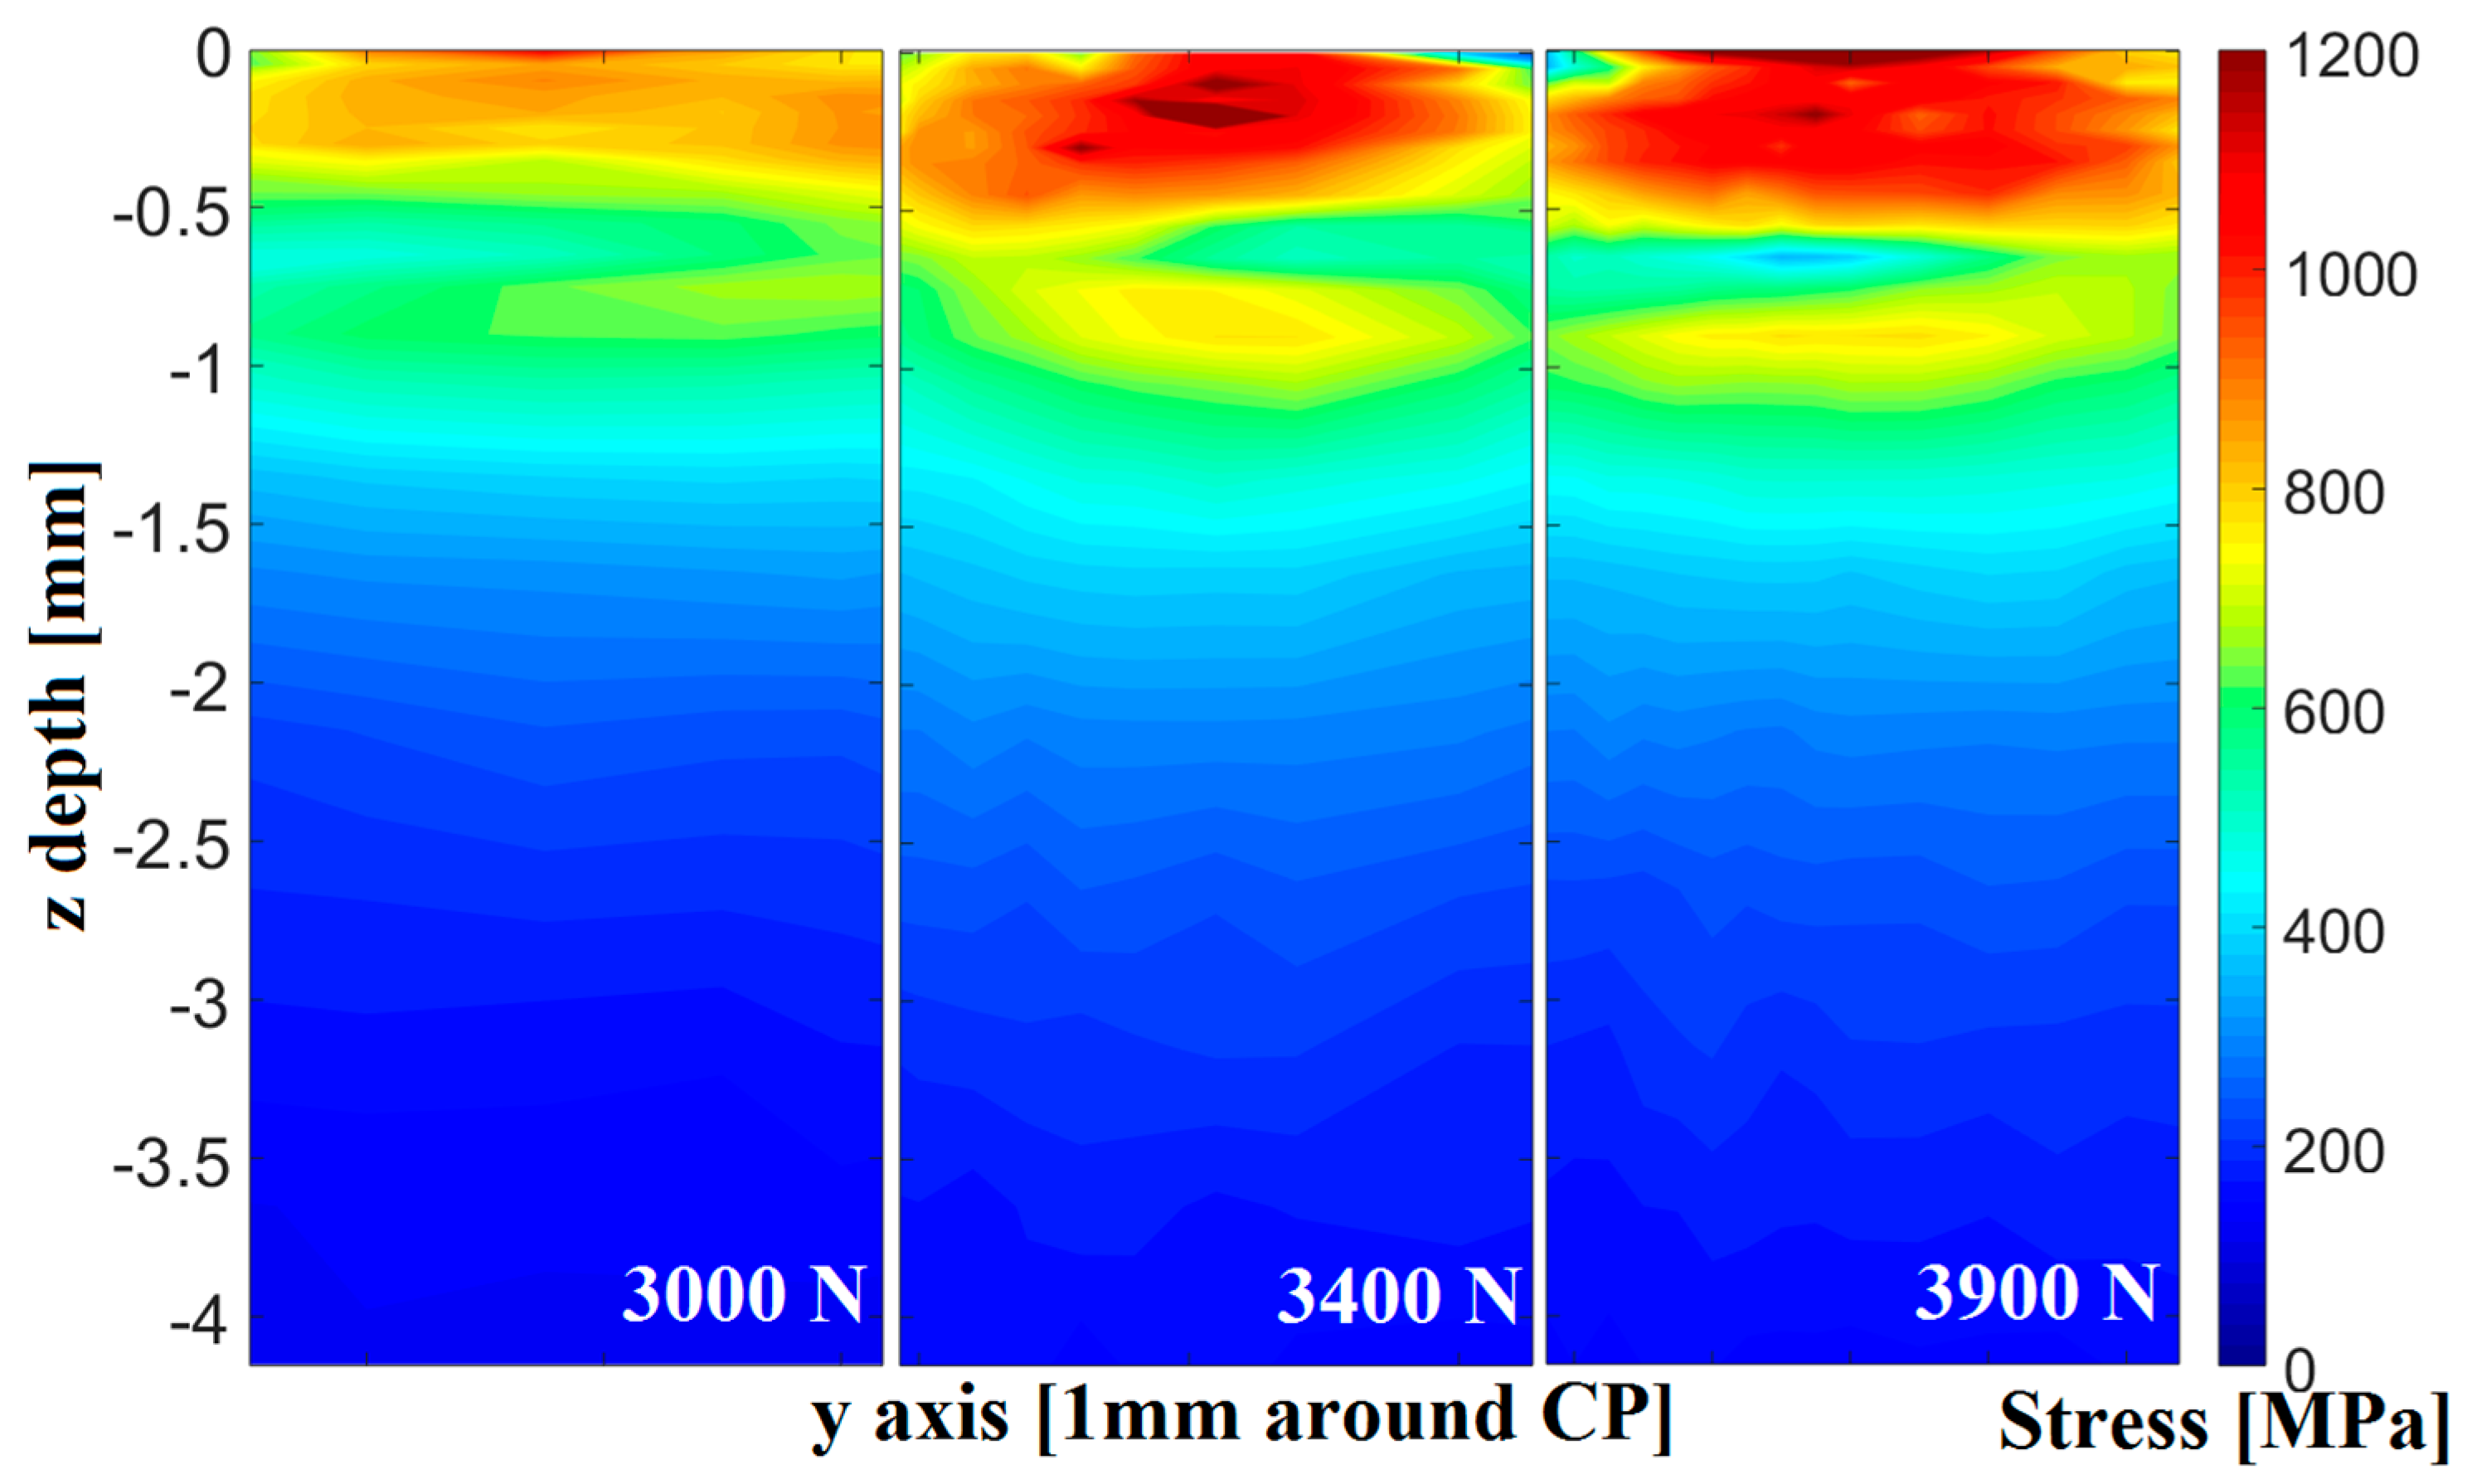
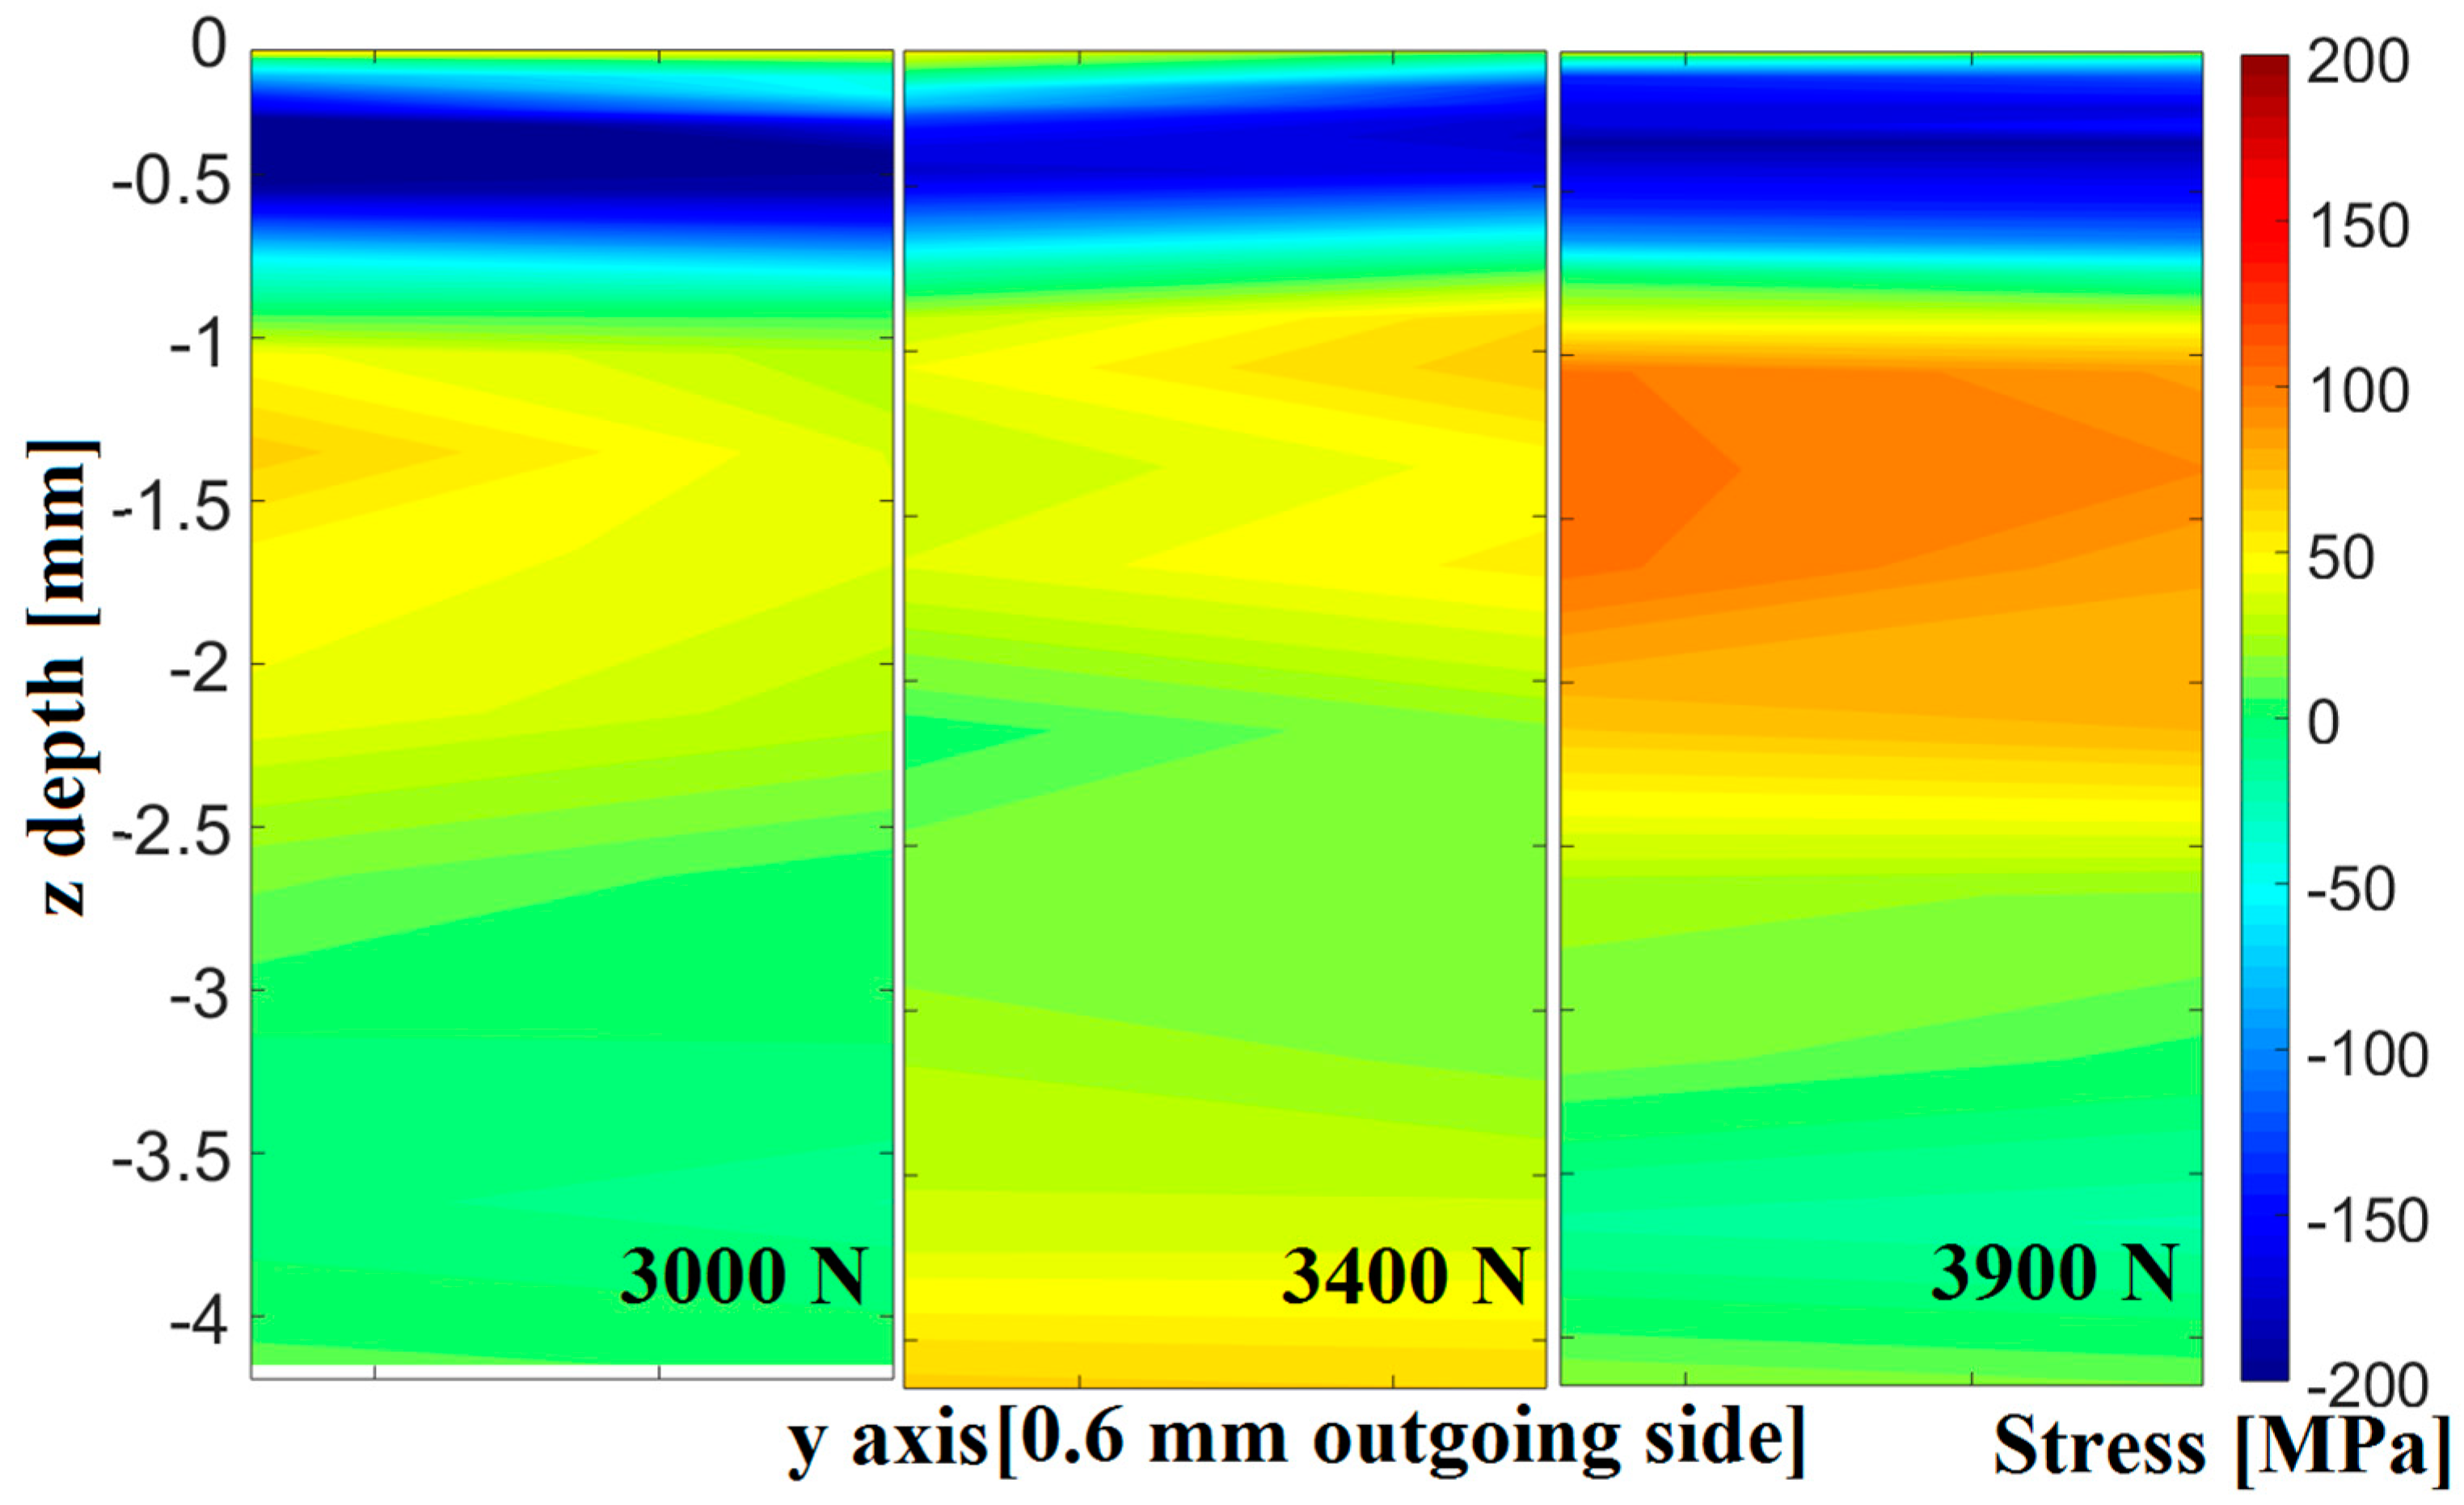
The triaxial loading condition and the zone of plastic deformation of the surface near region can be analyzed based on the calculation of the von Mises equivalent stress with the stress components determined in Section 4.1, as used in finite element method (FEM) simulation by Kuznetsov et al. [11] for burnishing processes. To analyze the influence of different contact parameters on the loading stress and the resulting residual stress field, three different contact forces of the same geometry were realized at 3000 N, 3400 N, and 3900 N. To display and the effect of the plastic deformation, the equivalent von Mises stress σeq was calculated from the determined stress components and the fields in a region of around 1 mm for the CP and outgoing material state were compared for the σyy component. As seen in the equivalent stress field and the outgoing deformed material state, as the loading force increases, both higher amounts and extended distribution of the loading stress were found under the contact point (Figure 4). The highest equivalent stress values below the contact point for each contact force tended to plateau at a value of around 1050 MPa, corresponding to around ~73% of the yield strength for this material state. Comparatively, the generated residual stress distributions in Figure 5, which were taken from enlarged views of the region at −4.5 mm to −3.5 mm in Figure 2b for different contact forces, showed an increase in depth and in the amount of introduced compressive stresses in the σyy component in the surface zone as well as in increase in the counterbalancing tensile residual stresses in the deeper region, which is consistent with the ex situ measurement of residual stresses for different contact forces by Meyer et al. [2]. However, compared to the loading state, there was only small improvement since the stresses also tended to plateau at −200 MPa.
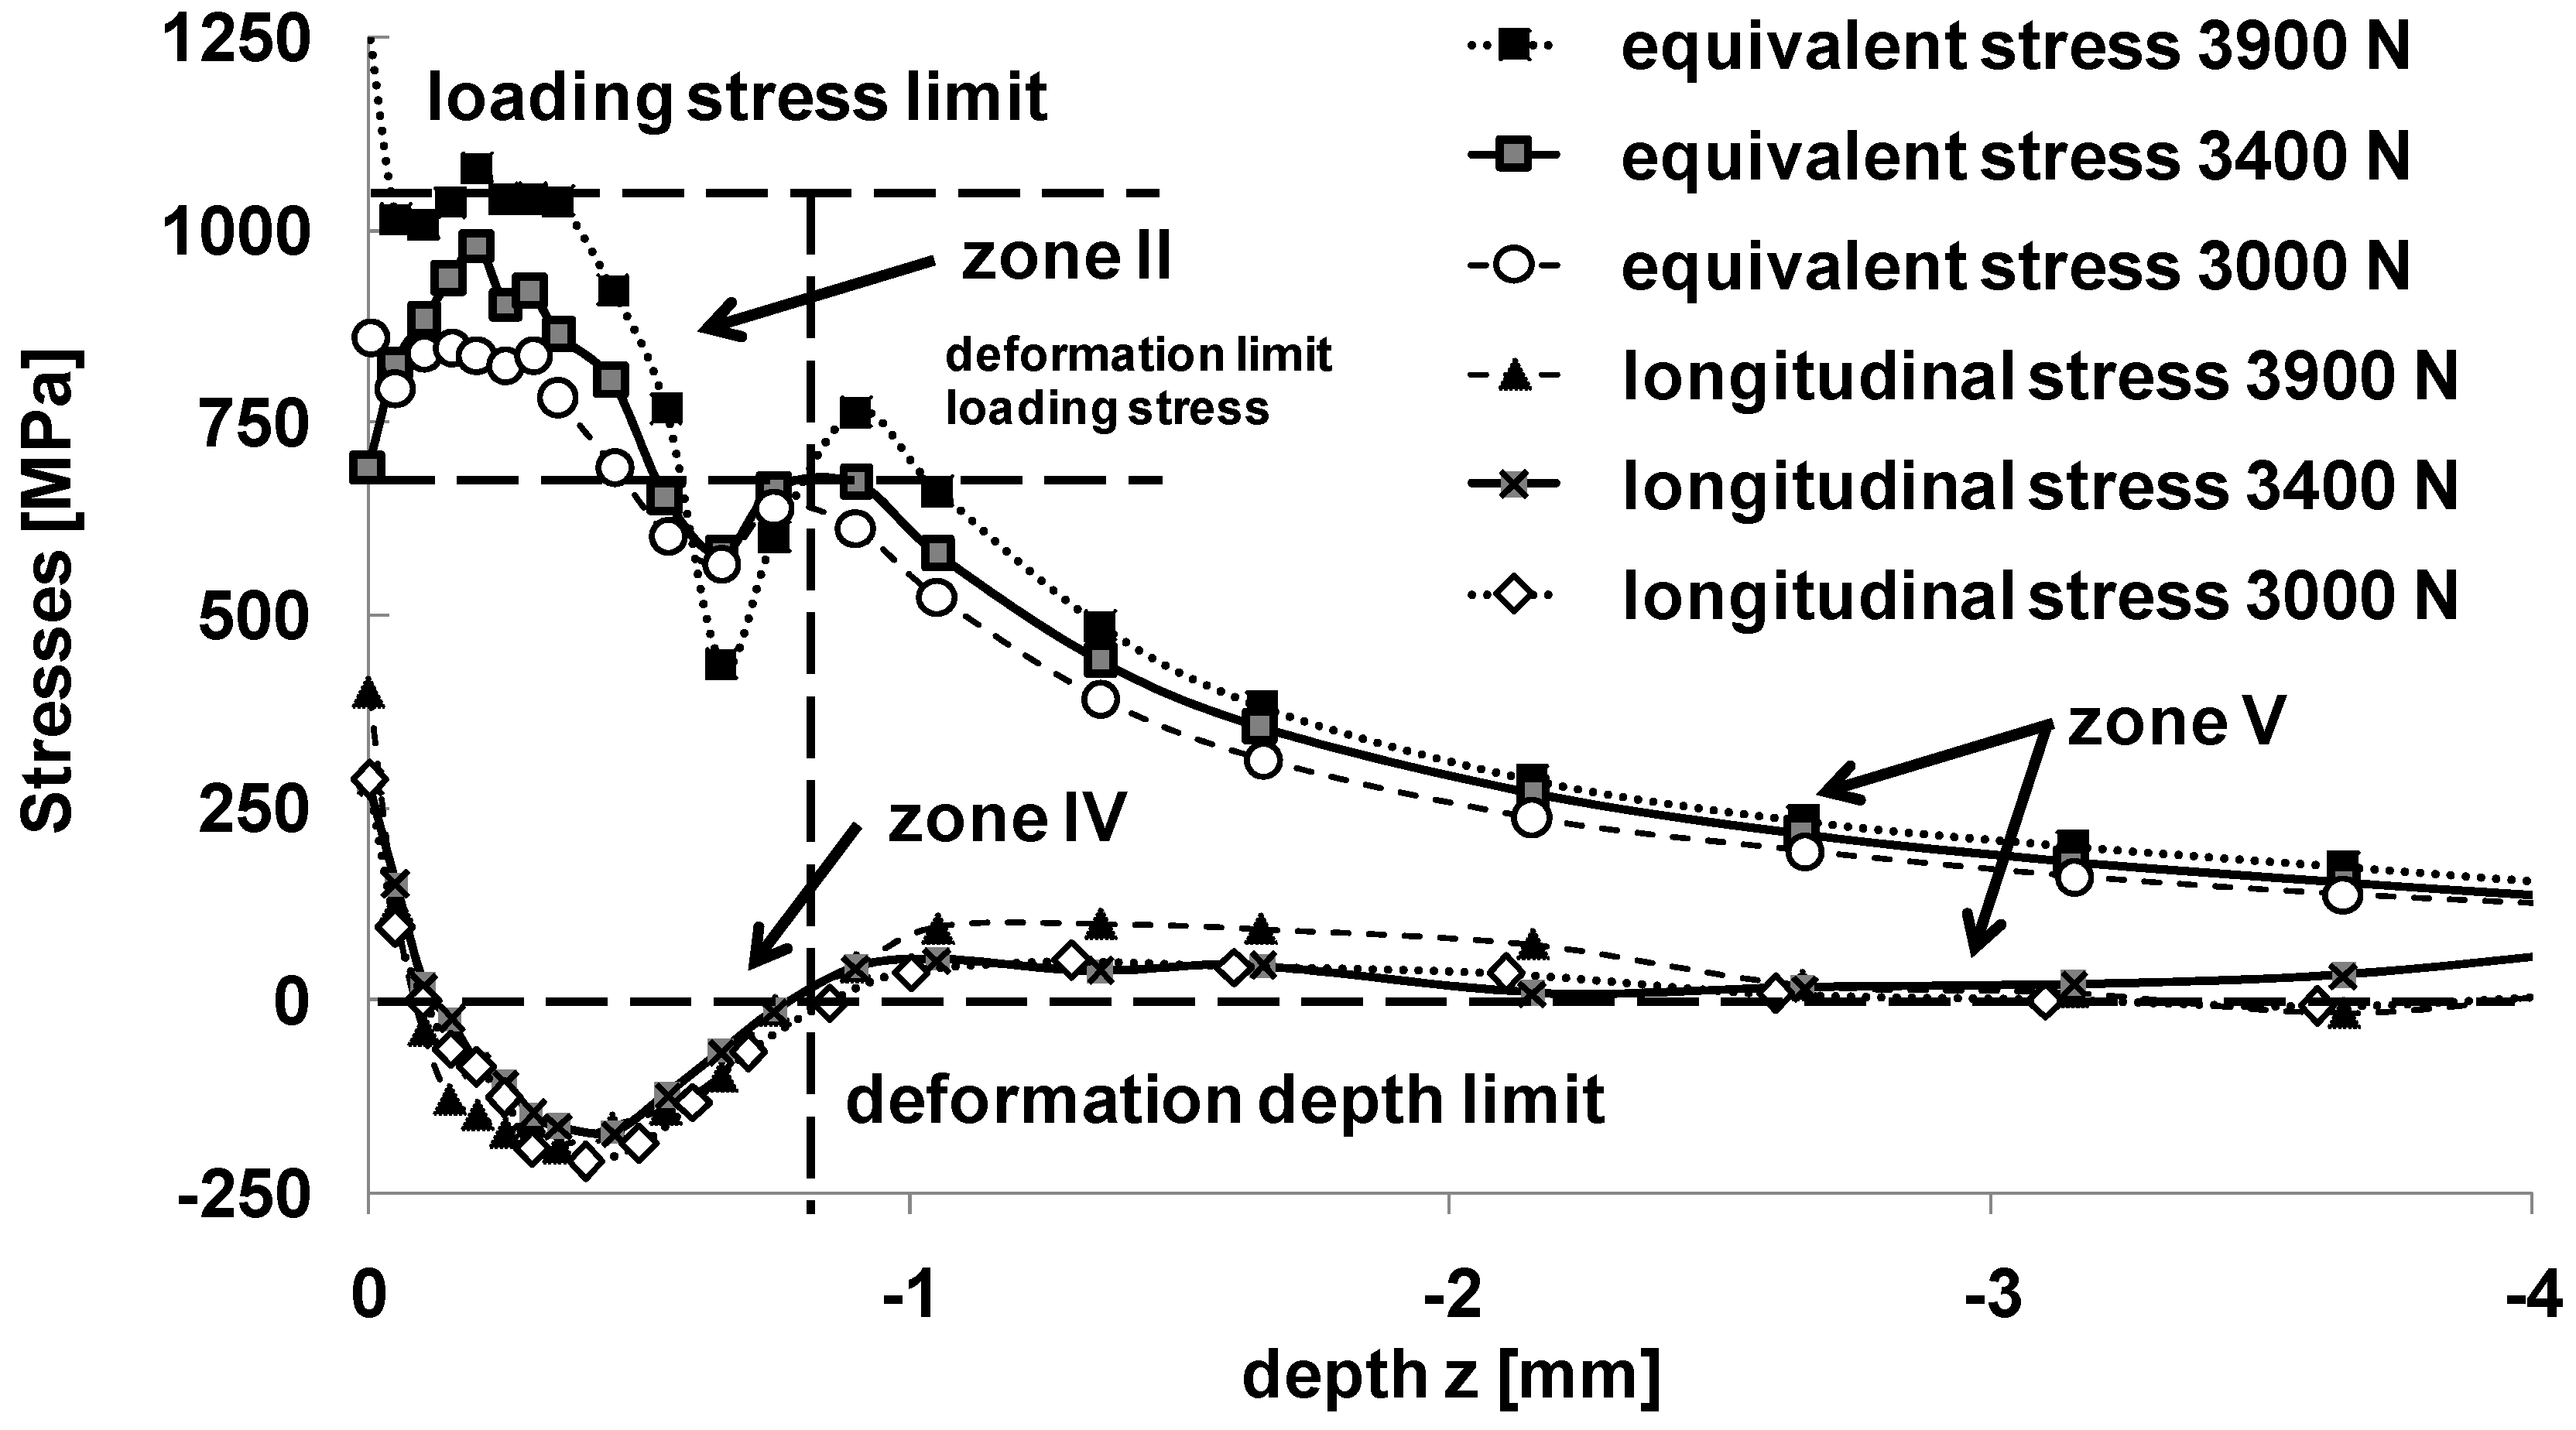
In direct comparison between these distributions, Figure 6 shows the relationship between the equivalent stress distribution at a depth below the contact point and the depth profile of residual stresses. For this, lines with the measurement values can be directly extracted out of the 2D stress fields at the specified y positions and displayed over depth. The point for the transition to compensating stresses can be identified with a position corresponding roughly to the localized equivalent stress maximum under the CP at 0.8 mm in depth, at a value of 700 MPa (~50% yield strength). From the ex situ measurements of the full-width at half maximum (FWHM) corresponding to residual stress distributions, it is already known that the maximum depth of deformation and the residual stress transition zone to compensating stresses are at the same depth. This zone obviously defines the depth limit for the occurring plastic deformation during the deep rolling process and the boundary of the transition zone of the deformation process, as described further in Section 5.2. The localized minimum was not reflected in the residual stress profiles, but since the contact at this point experiences different loading stress states during the rolling process, it can be shown that the leading edge of tool contact influences the residual stress in this depth. The build-up of material in front of the cylinder led to a higher stress field in front of the contact point, which can be seen in the 2D equivalent stress distribution in Figure 7 and the graph for the lower limit of equivalent stress in Figure 9, where the maximum was shifted in respect to the contact point.
5.2. Discussion on the Origin of Residual Stresses and Contact Sequence
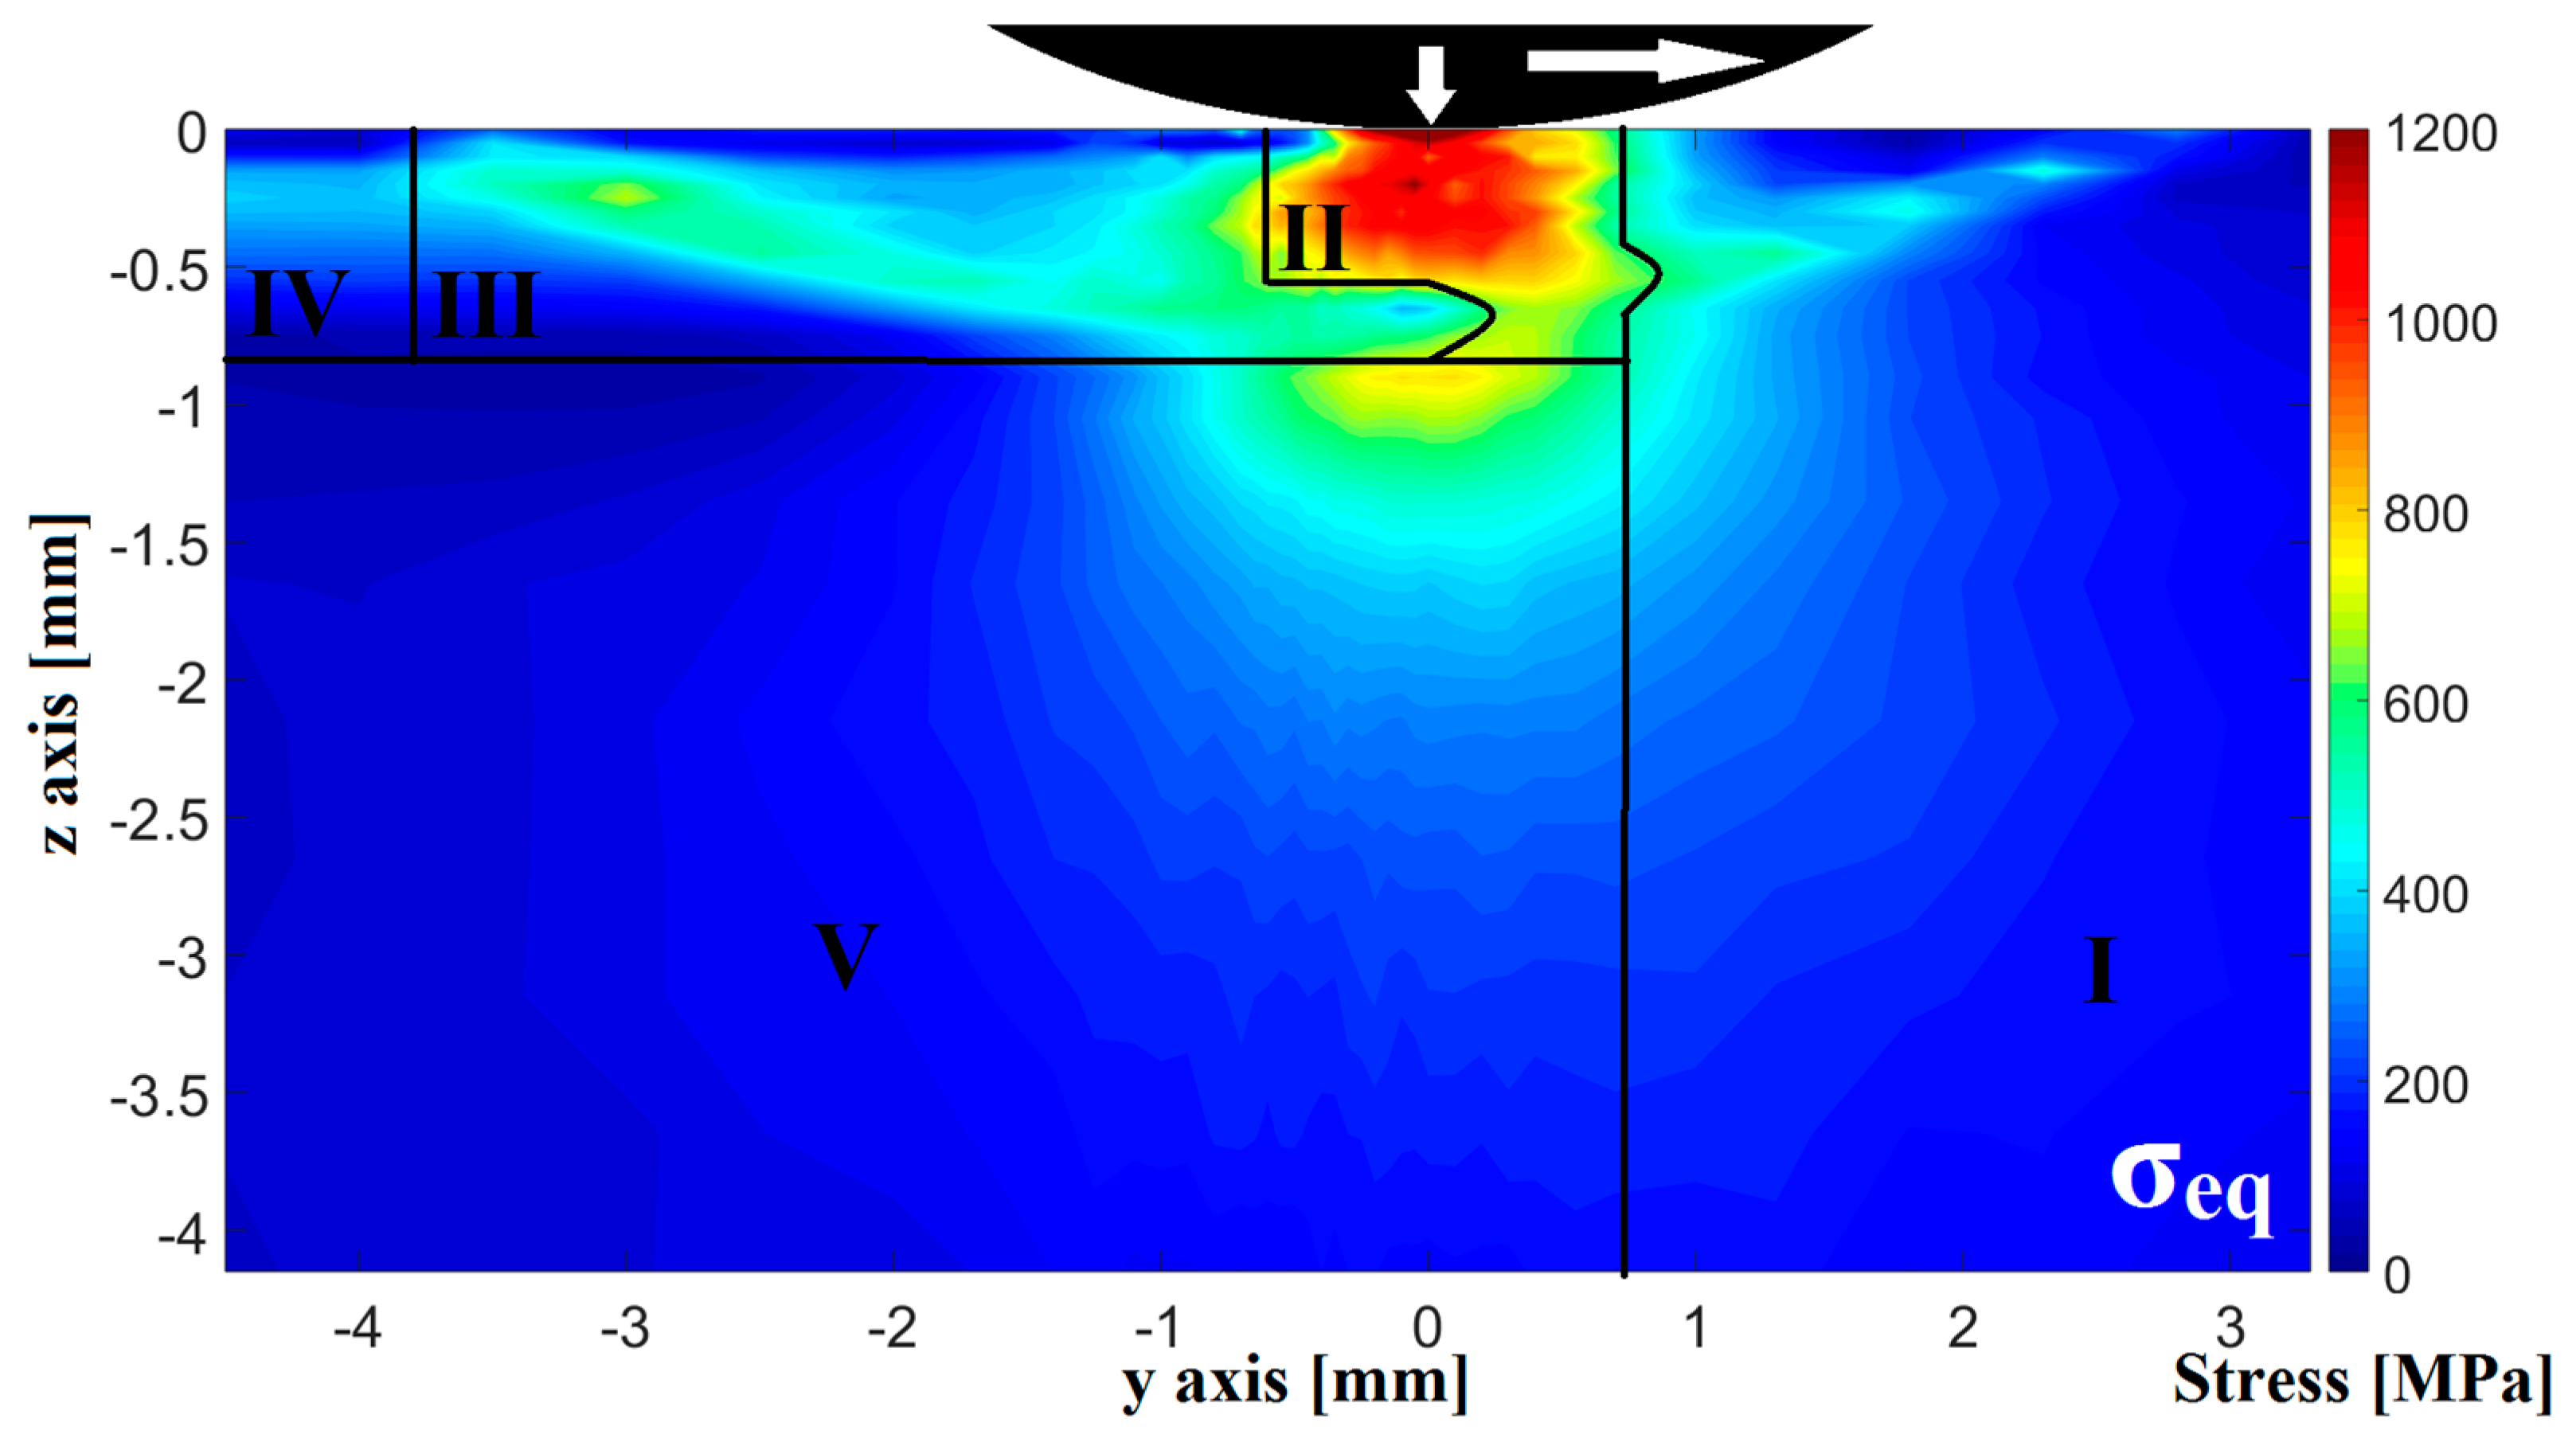
With the calculated equivalent stress field, different regions of the interplay between the initial material state, loading condition, and material response to plastic deformation can be analyzed. With the yield strength of the material, the transition zone in front of the deep rolling tool where plastic deformation occurs can be identified. Figure 7 shows the equivalent stress field during the deep rolling process with a force of 3900 N. The initial but already loaded material state in front of the tool is specified as zone I. If the loading stresses were to be removed, this region would relax to the initial state and only a small compensation of the residual stresses generated in the contact zone would remain. As described in Section 5.1, a region of surface modification by mechanically-induced plasticity can be found in the lateral- and depth-limited zone II. No measurement point in the field shows equivalent stresses higher than the yield strength, because this value would lead to immediate plastic deformation, increase of the contact surface, and further distribution of loading stresses into the surrounding material, since the material state does not experience significant strain hardening. Further, the loading stresses are instantaneously superimposed with already generated residual stresses in this zone. Behind this region, the surface of the specimen is plastically deformed and the loading stresses further interact with the resulting material state in the intermediate zone III, with continuously decreasing effects. This zone is followed by a seamless transition from the superimposed residual and load stress zone into the residual stress region, showing no further change to a higher distance from the contact point (zone IV). The depth of the ground line for zones II–IV is set as the minimum in equivalent stress, which corresponds exactly with the transition zone to compensating stresses.
In the material below the loading stress limit needed for material modification, a zone of elastic stress distribution and compensating stresses in zone V can be identified, which reacts to the deep rolling process and its loading and residual stress field. At a greater depth, the rapid decrease of loading stress to values lower than the yield strength limits the expansion of the material modifications.
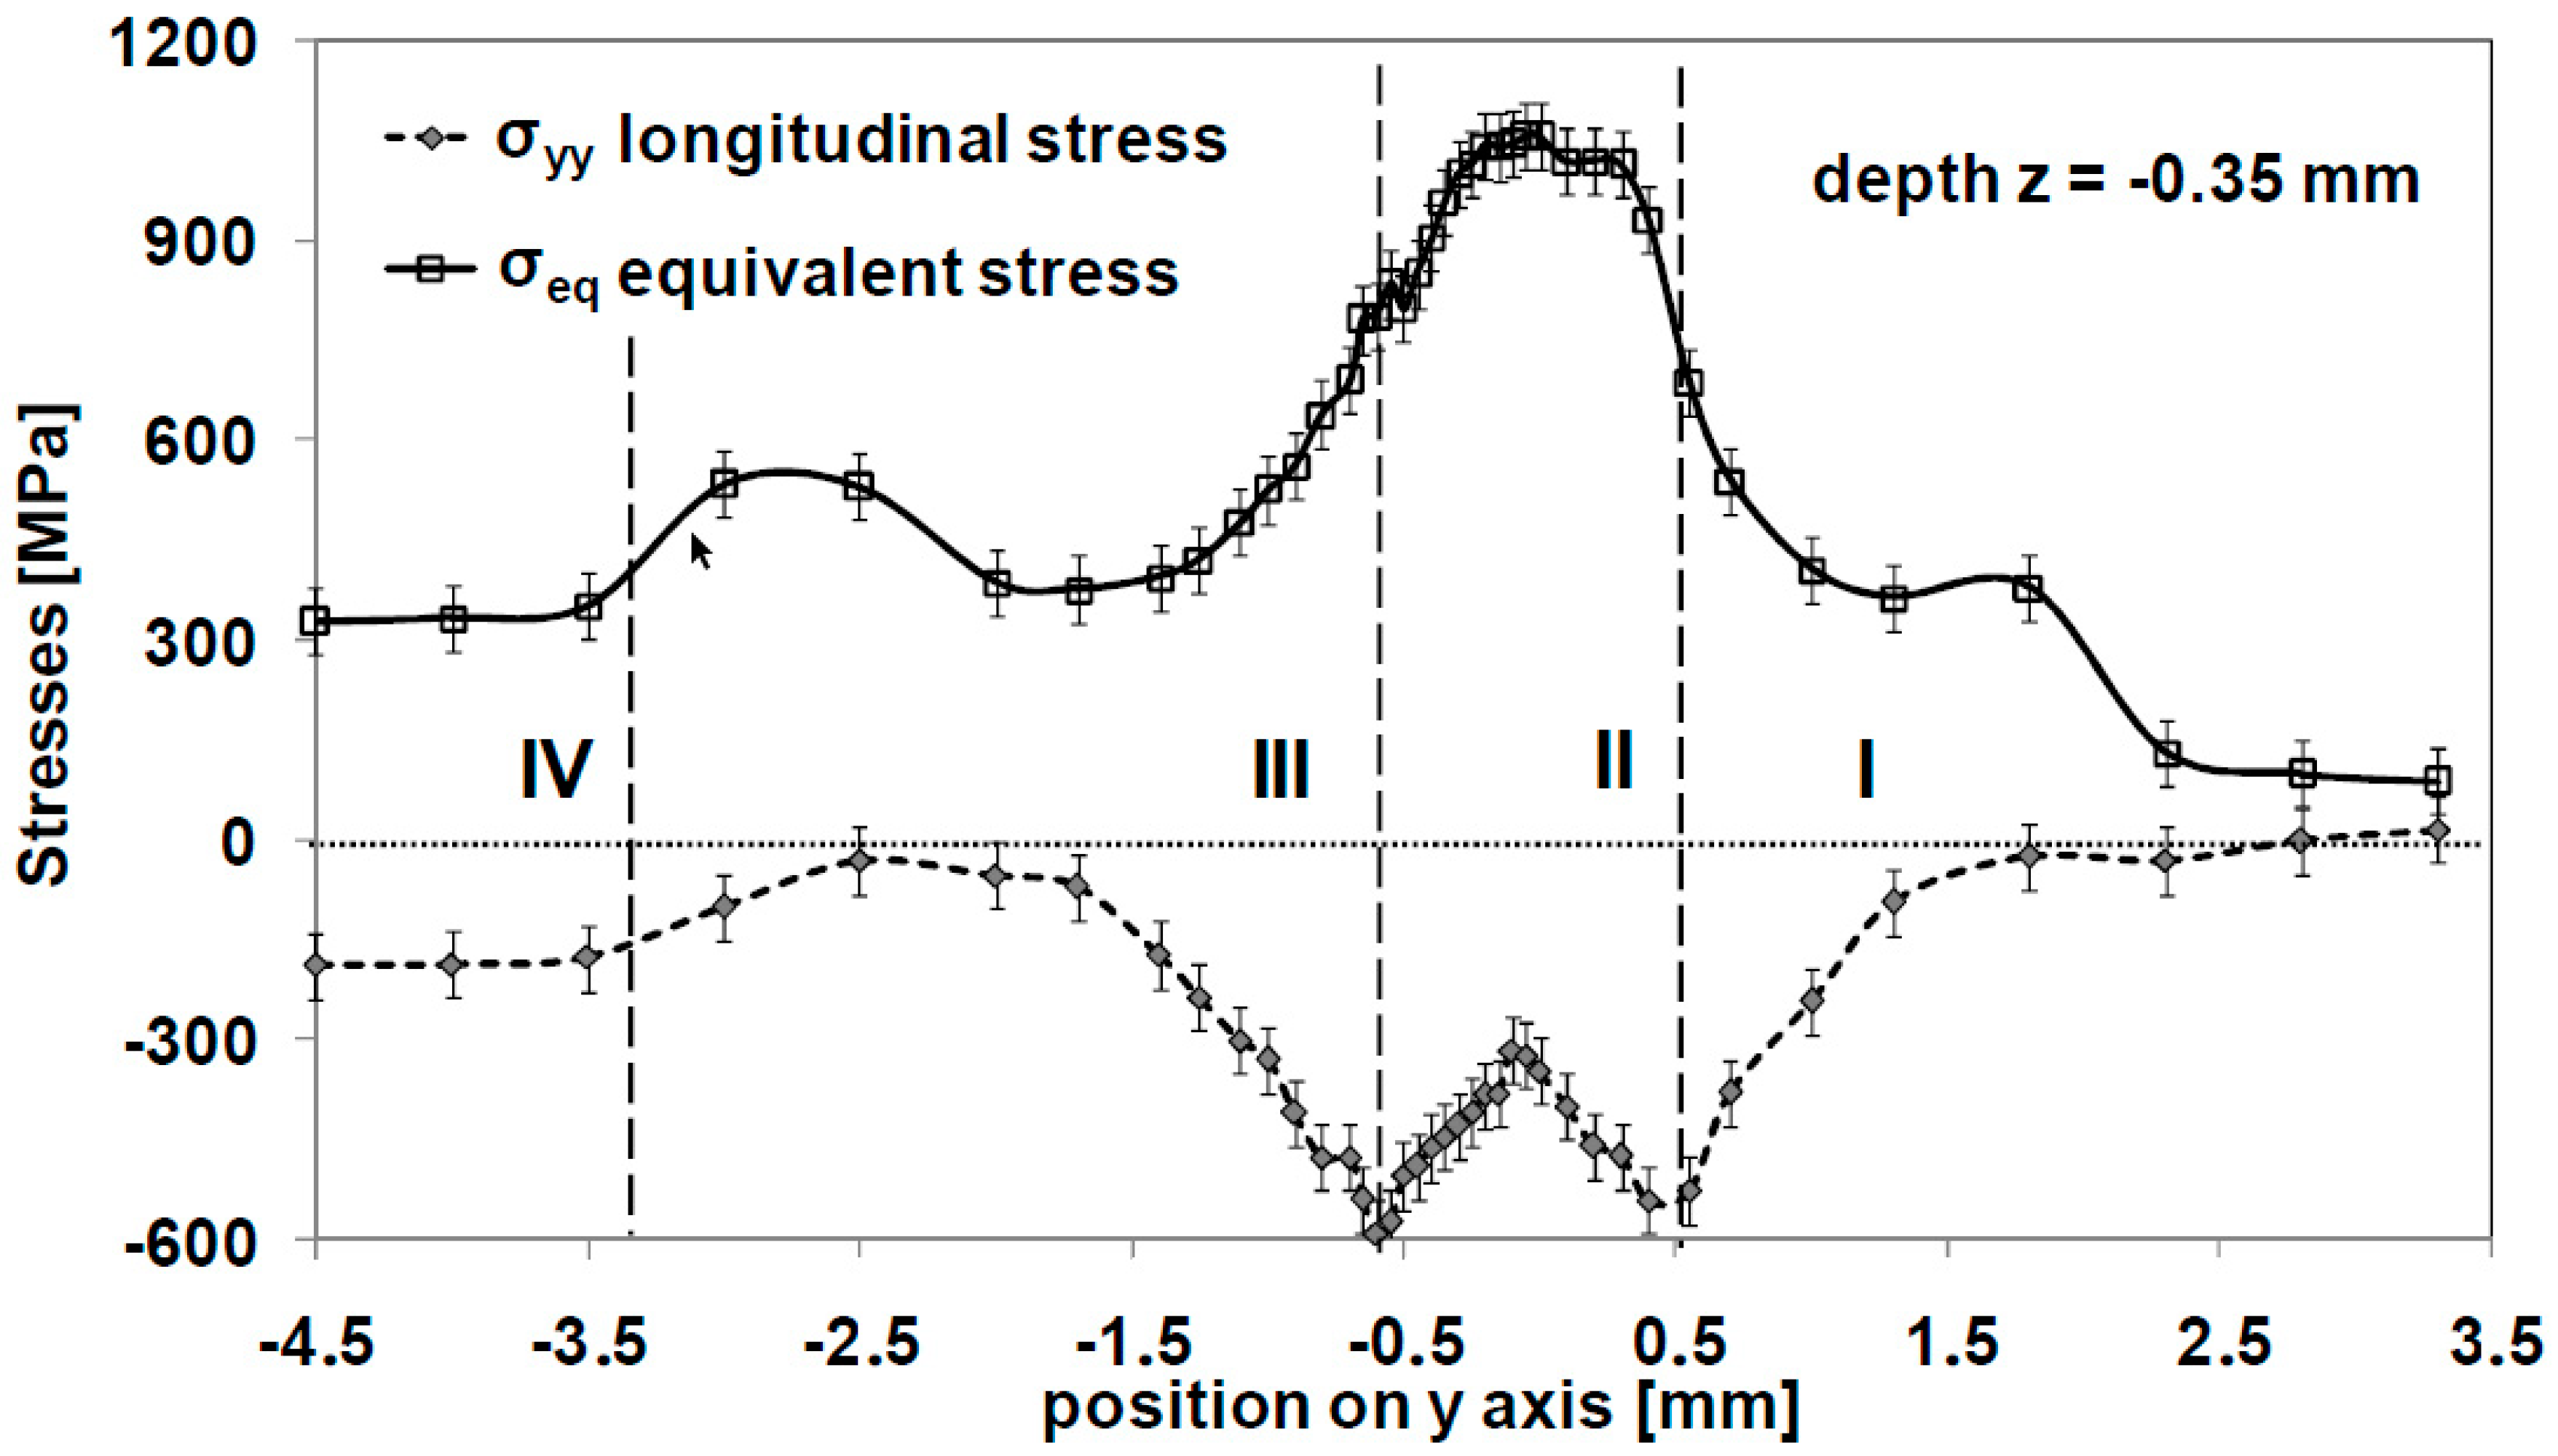
Figure 8 shows the evolution of the longitudinal stress component σyy and the equivalent stress σeq for a process with 3900 N loading force. When displayed in this mode, the two maxima of loading stress in the σyy component around the contact point can be observed for the maximum achieved residual stresses at depth z = −0.35 mm. This region experiences two distinct loading events just before and just after the tool passes over the analyzed zone.
It can also be observed that the residual stress in its superposition with the loading stress is not a simple addition for the loading stress and residual stress in zone III, when it is established in the material in zone II. In zone III, the measured stress state decreases to a minimum around −20 MPa, which is much higher than the residual stress state stabilizing at −200MPa at y= −4.5 mm. For the two peaks of the σyy component at the edges of zone II, it can be observed that there is only a slight difference after the residual stress has been introduced. This indicates load redistribution with other stress components, which can explain the asymmetric evolution of the equivalent stress value when comparing zones I (before) and III (after contact). Thus, the recalculation of pure loading stress is not possible by the subtraction of residual stresses in each component because of the stress redistribution between all stress components.
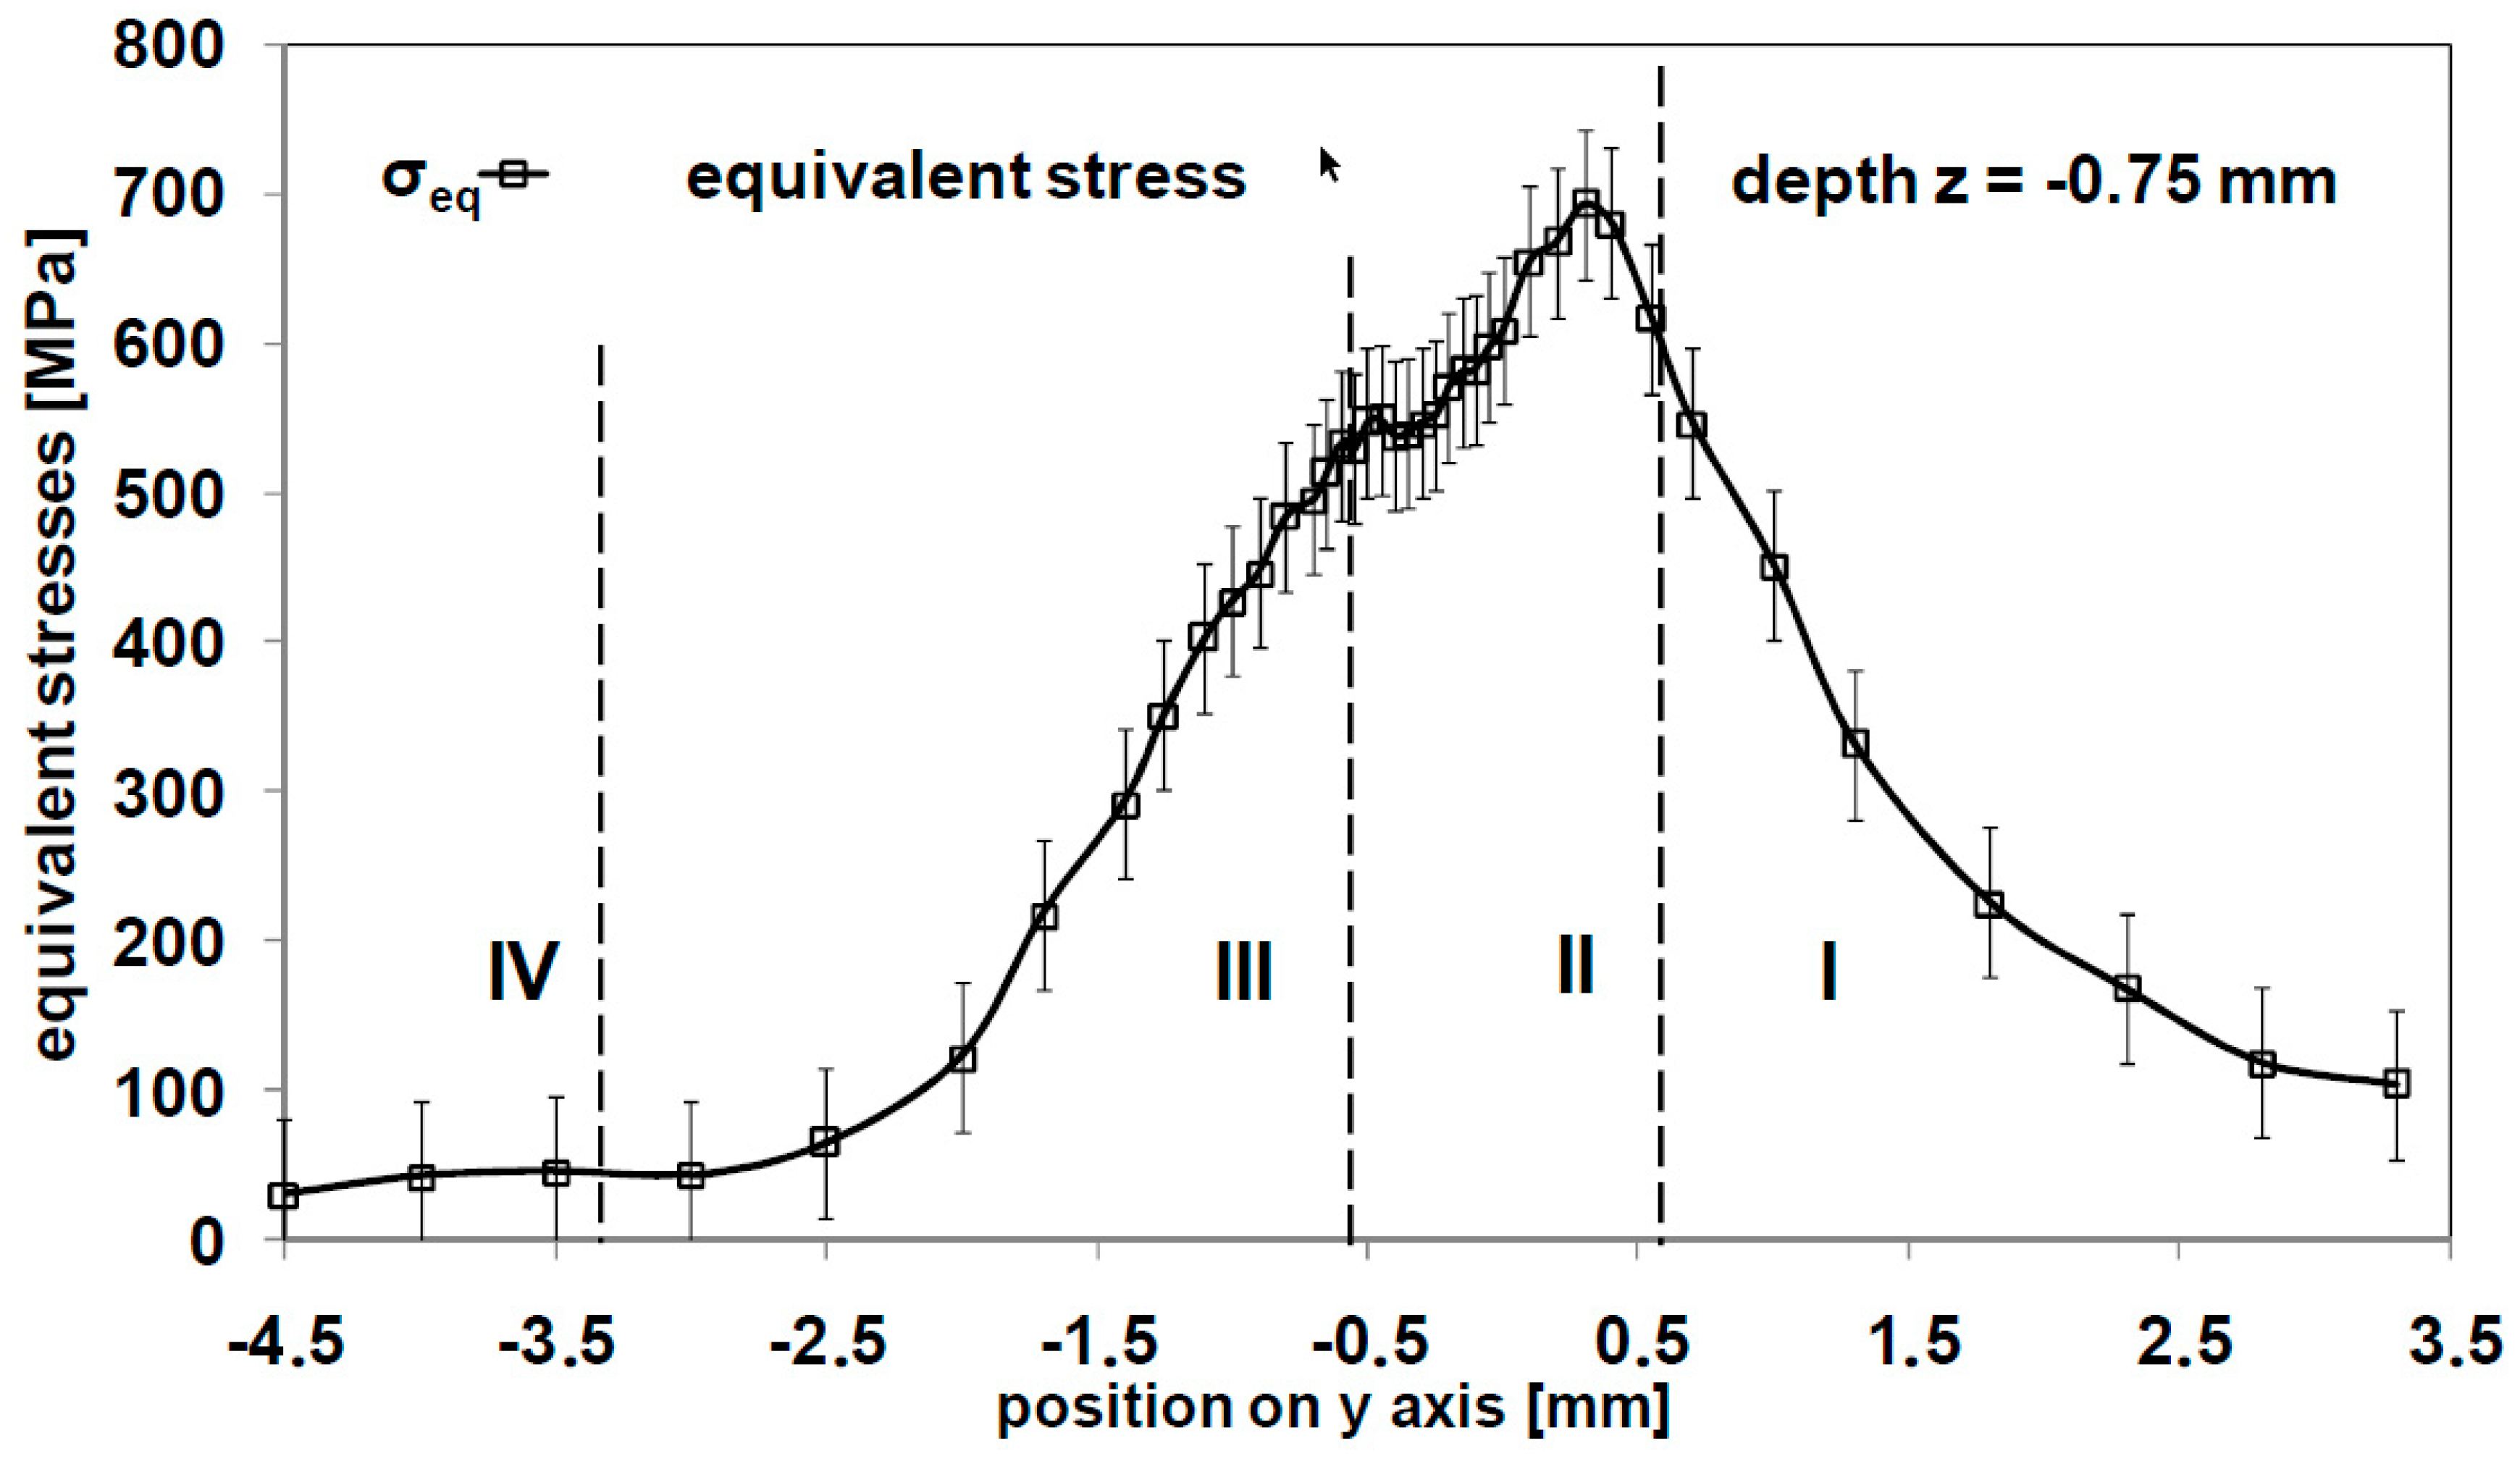
Additionally, concerning the stress evolution at z = −0.35 mm for the maximum residual stress of σyy below the surface, the equivalent stress development at a depth of −0.75 mm can be evaluated (see Figure 9), which corresponds to the position of sign change of the residual stress profile (Figure 6) in zone II towards zone V. This zone was defined as the limit between the plastically deformed material and the subsurface layer where compensation stresses are distributed to balance the “source stresses” of the upper layers. For this region, it can be observed that the equivalent stress increases and reaches a maximum shortly before the tool passes above the region, while after this point, the equivalent stress distribution continuously decreases. No plateau of equivalent stress is measured, as is visible in Figure 8. Since the distribution is assumed to be purely elastic, this evolution is seen as the loading stress sequence, acting during the process without the influence of residual stresses. Based on this, a separation of the theoretical loading stress distribution and the residual stress influence in the plastically deformed region might be achieved in further analyses, at least for this depth and lower.
6. Conclusions
Based on the experimental data from in situ synchrotron X-ray diffraction experiments, it was shown that the rolling plastic deformation and the generated surface material state during the deep rolling process can be analyzed in a simplified dedicated setup. Thanks to the measurement of full diffraction rings in transmission geometry, it was possible to investigate the amount and extent of the stress fields under the contact point while all relevant stress components were determined by the suitable evaluation of the diffraction signal. Using equivalent stress calculation, the material loading and the behavior during plastic deformation was analyzed, enabling the comprehension of the residual stress generation and distribution. It was shown that the interaction in the material shortly before and after the contact point leads to a superposition of the loading stresses with the already generated residual stresses. The loading stress and its associated residual stress state were shown to be connected when an increase in the affected depth and growing loading stresses is observed, which was generated with an increased contact force of the tool. This also leads to an increase in the affected depth of the residual stresses. These main results from the experimental in situ measurement correspond well with trends observed in ex situ measured residual stress dependence on the contact parameters by Meyer et al. [2] as well as with simulated fields distribution of loading stresses in finite element modeling by Sayahi et al. [14].
Further evaluations for the extraction of the theoretical loading stress distribution in the instantaneously plastically deformed region are currently ongoing. The deformation history and loading stress sequence at selected depth points will allow the generation of more information about internal loads and their resulting plastic deformations as well as residual stresses. These results will be used for the development of new simulation models, leading to advances in the knowledge and the prediction of cold-work surface modification processes.
Author Contributions
H.M. and J.E. designed and performed the synchrotron experiments, derived the models and H.M. analyzed the data. The discussion and interpretation of the results was done by H.M. together with J.E., H.M. wrote the manuscript in consultation with J.E.
Funding
This research was funded by Deutsche Forschungsgemeinschaft (German Research Foundation, DFG) under the CRC TRR 136 of subproject C01. The funding is gratefully acknowledged.
Acknowledgments
The experiments were performed on beamline ID11 at the European Synchrotron Radiation Facility (ESRF, Grenoble, France). We are grateful to Local Contact Jonathan Wright at the ESRF for providing assistance in using beamline ID11.
Conflicts of Interest
The authors declare no conflict of interest.
References
- M’saoubi, R.; Outeiro, J.C.; Changeux, B.; Lebrun, J.L.; Dias, A.M. Residual stress analysis in orthogonal machining of standard and resulfurized AISI 316L steels. J. Mater. Process. Technol. 1999, 96, 225–233. [Google Scholar] [CrossRef] [Green Version]
- Meyer, D.; Kämmler, J. Surface integrity of AISI 4140 after deep rolling with varied external and internal loads. Procedia CIRP 2016, 45, 363–366. [Google Scholar] [CrossRef]
- Weisser, M.A.; Evans, A.D.; Van Petegem, S.; Holdsworth, S.R.; Van Swygenhoven, H. In situ room temperature tensile deformation of a 1% CrMoV bainitic steel using synchrotron and neutron diffraction. Acta Mater. 2011, 59, 4448–4457. [Google Scholar] [CrossRef]
- Uhlmann, E.; Henze, S.; Gerstenberger, R.; Brömmelhoff, K.; Reimers, W.; Fischer, T.; Schell, N. An extended shear angle model derived from in situ strain measurements during orthogonal cutting. Prod. Eng. 2013, 7, 401–408. [Google Scholar] [CrossRef]
- Staron, P.; Fischer, T.; Lippmann, T.; Stark, A.; Daneshpour, S.; Schnubel, D.; Eidenberger, E. In Situ Experiments with Synchrotron High-Energy X-rays and Neutrons. Adv. Eng. Mater. 2011, 13, 658–663. [Google Scholar] [CrossRef]
- Meyer, H.; Epp, J.; Zoch, H.W. In situ X-Ray Diffraction Investigation of Surface Modifications in a Deep Rolling Process under Static Condition. Mater. Res. Proc. 2017, 2, 431–436. [Google Scholar]
- Brinksmeier, E.; Klocke, F.; Lucca, D.A.; Sölter, J.; Meyer, D. Process Signatures–A new approach to solve the inverse surface integrity problem in machining processes. Procedia CIRP 2014, 13, 429–434. [Google Scholar] [CrossRef]
- Ashiotis, G.; Deschildre, A.; Nawaz, Z.; Wright, J.P.; Karkoulis, D.; Picca, F.E.; Kieffer, J. The fast azimuthal integration Python library: pyFAI. J. Appl. Crystallogr. 2015, 48, 510–519. [Google Scholar] [CrossRef] [PubMed] [Green Version]
- Noyan, I.C.; Cohen, J.B. Residual Stress: Measurement by Diffraction and Interpretation; Springer: New York, NY, USA, 2013. [Google Scholar]
- Zeilinger, A.; Todt, J.; Krywka, C.; Müller, M.; Ecker, W.; Sartory, B.; Keckes, J. In-situ observation of cross-sectional microstructural changes and stress distributions in fracturing TiN thin film during nanoindentation. Sci. Rep. 2016, 6, 22670. [Google Scholar] [CrossRef] [PubMed]
- Kuznetsov, V.P.; Smolin, I.Y.; Dmitriev, A.I.; Konovalov, D.A.; Makarov, A.V.; Kiryakov, A.E.; Yurovskikh, A.S. Finite element simulation of nanostructuring burnishing. Phys. Mesomech. 2013, 16, 62–72. [Google Scholar] [CrossRef] [Green Version]
- Kloos, K.H.; Fuchsbauer, B.; Adelmann, J. Fatigue properties of specimens similar to components deep rolled under optimized conditions. Int. J. Fatigue 1987, 9, 35–42. [Google Scholar] [CrossRef]
- Shet, C.; Deng, X. Residual stresses and strains in orthogonal metal cutting. Int. J. Mach. Tools Manuf. 2003, 43, 573–587. [Google Scholar] [CrossRef]
- Sayahi, M.; Sghaier, S.; Belhadjsalah, H. Finite element analysis of ball burnishing process: Comparisons between numerical results and experiments. Int. J. Adv. Manuf. Technol. 2013, 67, 1665–1673. [Google Scholar] [CrossRef]
Figure 1.
(a)Schematic of deep rolling setup on ID11 in transmission measurement; (b) distribution of measurement positions in the contact area.
Figure 1.
(a)Schematic of deep rolling setup on ID11 in transmission measurement; (b) distribution of measurement positions in the contact area.

Figure 2.
(a)Azimuthally integrated (caked) diffraction image of a single measurement point; (b) strain results from this diffraction image, fit to the measurement according to Equation (1).
Figure 2.
(a)Azimuthally integrated (caked) diffraction image of a single measurement point; (b) strain results from this diffraction image, fit to the measurement according to Equation (1).

Figure 3.
(a)Stress distribution of σzz component; (b) σyy component; (c) σyz component; (d) σxx component; (e) and hydrostatic σh component for 3900 N contact force.
Figure 3.
(a)Stress distribution of σzz component; (b) σyy component; (c) σyz component; (d) σxx component; (e) and hydrostatic σh component for 3900 N contact force.

Figure 4.
Equivalent loading stress σeq distribution at contact point (y = 0 mm) for three different contact forces.
Figure 4.
Equivalent loading stress σeq distribution at contact point (y = 0 mm) for three different contact forces.

Figure 5.
Resulting residual stress of the σyy component (y = −3.65mm to −4.15 mm) for three applied contact forces.
Figure 5.
Resulting residual stress of the σyy component (y = −3.65mm to −4.15 mm) for three applied contact forces.

Figure 6.
Graph of loading equivalent stresses σeq under contact point at y = 0 mm and the resulting residual stress of the σyy component at y = −4.15 mm over depth for three applied contact forces.
Figure 6.
Graph of loading equivalent stresses σeq under contact point at y = 0 mm and the resulting residual stress of the σyy component at y = −4.15 mm over depth for three applied contact forces.

Figure 7.
Equivalent stress field σeq divided into different zones during the deep rolling process with a material load ofF = 3900 N.
Figure 7.
Equivalent stress field σeq divided into different zones during the deep rolling process with a material load ofF = 3900 N.

Figure 8.
Plot of longitudinal (σyy) and equivalent stress (σeq) evolutions for the material state at the depth of maximum residual stress in the σyy direction at z = −0.35 mm for 3900 N load.
Figure 8.
Plot of longitudinal (σyy) and equivalent stress (σeq) evolutions for the material state at the depth of maximum residual stress in the σyy direction at z = −0.35 mm for 3900 N load.

Figure 9.
Plot of equivalent stress (σeq) evolution at the depth of residual stress compensation at z = −0.75 mm for 3900 N load.
Figure 9.
Plot of equivalent stress (σeq) evolution at the depth of residual stress compensation at z = −0.75 mm for 3900 N load.


Table 1.
Chemical composition of steel specimens.
| Steel | AISI | C (%) | Si (%) | Mn (%) | P (%) | S (%) | Cr (%) | Mo (%) |
|---|---|---|---|---|---|---|---|---|
| 42CrMo4 | 4140 | 0.43 | 0.26 | 0.74 | 0.01 | <0.001 | 1.09 | 0.25 |
© 2018 by the authors. Licensee MDPI, Basel, Switzerland. This article is an open access article distributed under the terms and conditions of the Creative Commons Attribution (CC BY) license (http://creativecommons.org/licenses/by/4.0/).
Share and Cite
MDPI and ACS Style
Meyer, H.; Epp, J. In Situ X-ray Diffraction Analysis of Stresses during Deep Rolling of Steel. Quantum Beam Sci. 2018, 2, 20. https://0-doi-org.brum.beds.ac.uk/10.3390/qubs2040020
AMA Style
Meyer H, Epp J. In Situ X-ray Diffraction Analysis of Stresses during Deep Rolling of Steel. Quantum Beam Science. 2018; 2(4):20. https://0-doi-org.brum.beds.ac.uk/10.3390/qubs2040020
Chicago/Turabian StyleMeyer, Heiner, and Jérémy Epp. 2018. "In Situ X-ray Diffraction Analysis of Stresses during Deep Rolling of Steel" Quantum Beam Science 2, no. 4: 20. https://0-doi-org.brum.beds.ac.uk/10.3390/qubs2040020