Localization of Aluminum in Epidermal Cells of Mature Tea Leaves
by
 and
and
Yoichi Haruyama
1,*, 
Tsuguhisa Fujiwara
1,
Keisuke Yasuda
1,*,
Manabu Saito
2 and
Kohtaku Suzuki
3 1
Department of Informatics and Environmental Science, Kyoto Prefectural University, Hangicho, Shimogamo, Sakyo-Ku, Kyoto, Kyoto 606-8522, Japan
2
Department of Nuclear Engineering, Kyoto University, Kyoto daigaku-katsura, Nishikyo-ku, Kyoto, Kyoto 615-8540, Japan
3
The Wakasa Wan Energy Research Center, 64-52-1 Nagatani, Tsuruga, Fukui 914-0192, Japan
*
Authors to whom correspondence should be addressed.
Quantum Beam Sci. 2019, 3(2), 9; https://0-doi-org.brum.beds.ac.uk/10.3390/qubs3020009
Submission received: 15 April 2019
/
Revised: 20 May 2019
/
Accepted: 27 May 2019
/
Published: 29 May 2019
(This article belongs to the Special Issue Ion Beams in Biology and Medicine)
Abstract
:We have determined the distribution of aluminum in the epidermal cells of mature tea leaves using micro-beam particle-induced X-ray emission. The observed pattern of aluminum distribution in the epidermal cells suggests that aluminum exists in cell walls. Silicon exhibits a distribution that is nearly identical to that of aluminum, suggesting co-localization with aluminum.
1. Introduction
Aluminum (Al) is a key chemical element found in soil. It is soluble under acidic conditions, and its ionic form is toxic to almost all plants. However, the tea plant Camellia sinensis requires Al for its growth and development and accumulates relatively high concentrations of Al in the 10,000-ppm range of its leaves without any significant adverse effects. Numerous studies investigating Al concentrations [1] and distribution [2] in tea leaves have been performed. However, the mechanisms of Al toxicity tolerance and detoxification in tea plants remain unclear.
We have previously studied the concentrations and distributions of various elements, including Al, in tea leaves using multi-elemental capabilities and the spatial resolving power of micro-beam particle-induced X-ray emission (PIXE) and particle-induced γ-ray emission spectroscopy (PIGE) [3,4,5]. We observed that Al concentrations in a young leaf were approximately several hundred ppm and that Al was distributed uniformly across the leaf; however, in a mature leaf, the concentrations increased up to nearly 10,000 ppm, and Al was localized in the epidermis, particularly the upper epidermis. The spatial distribution of silicon (Si) is reportedly similar to that of Al [3]. The findings support the suggestion that Al is detoxified through the production of aluminosilicate compounds [6,7]. Recently, we also investigated the distribution of fluorine (F) in tea leaves using micro-beam PIGE and observed that F is also localized in epidermal cells.
X-ray microanalysis performed by Carr et al. revealed that Al was preferentially accumulated in epidermal cell walls in tea leaves [8]. In addition, Gao et al. conducted a chemical analysis of the cell wall, organelle, and cytoplasm elemental fractions in young tea leaves and reported that more Al and F were accumulated in cell walls than in vacuoles [9].
In our previous studies, we could not reveal the subcellular distribution of the elements. Therefore, in the present study, we attempted to improve the target preparation method to maintain the cellular structure with the aim of determining the localization of Al in epidermal cells at a subcellular resolution by decreasing the micro-beam size as much as possible.
2. Experimental
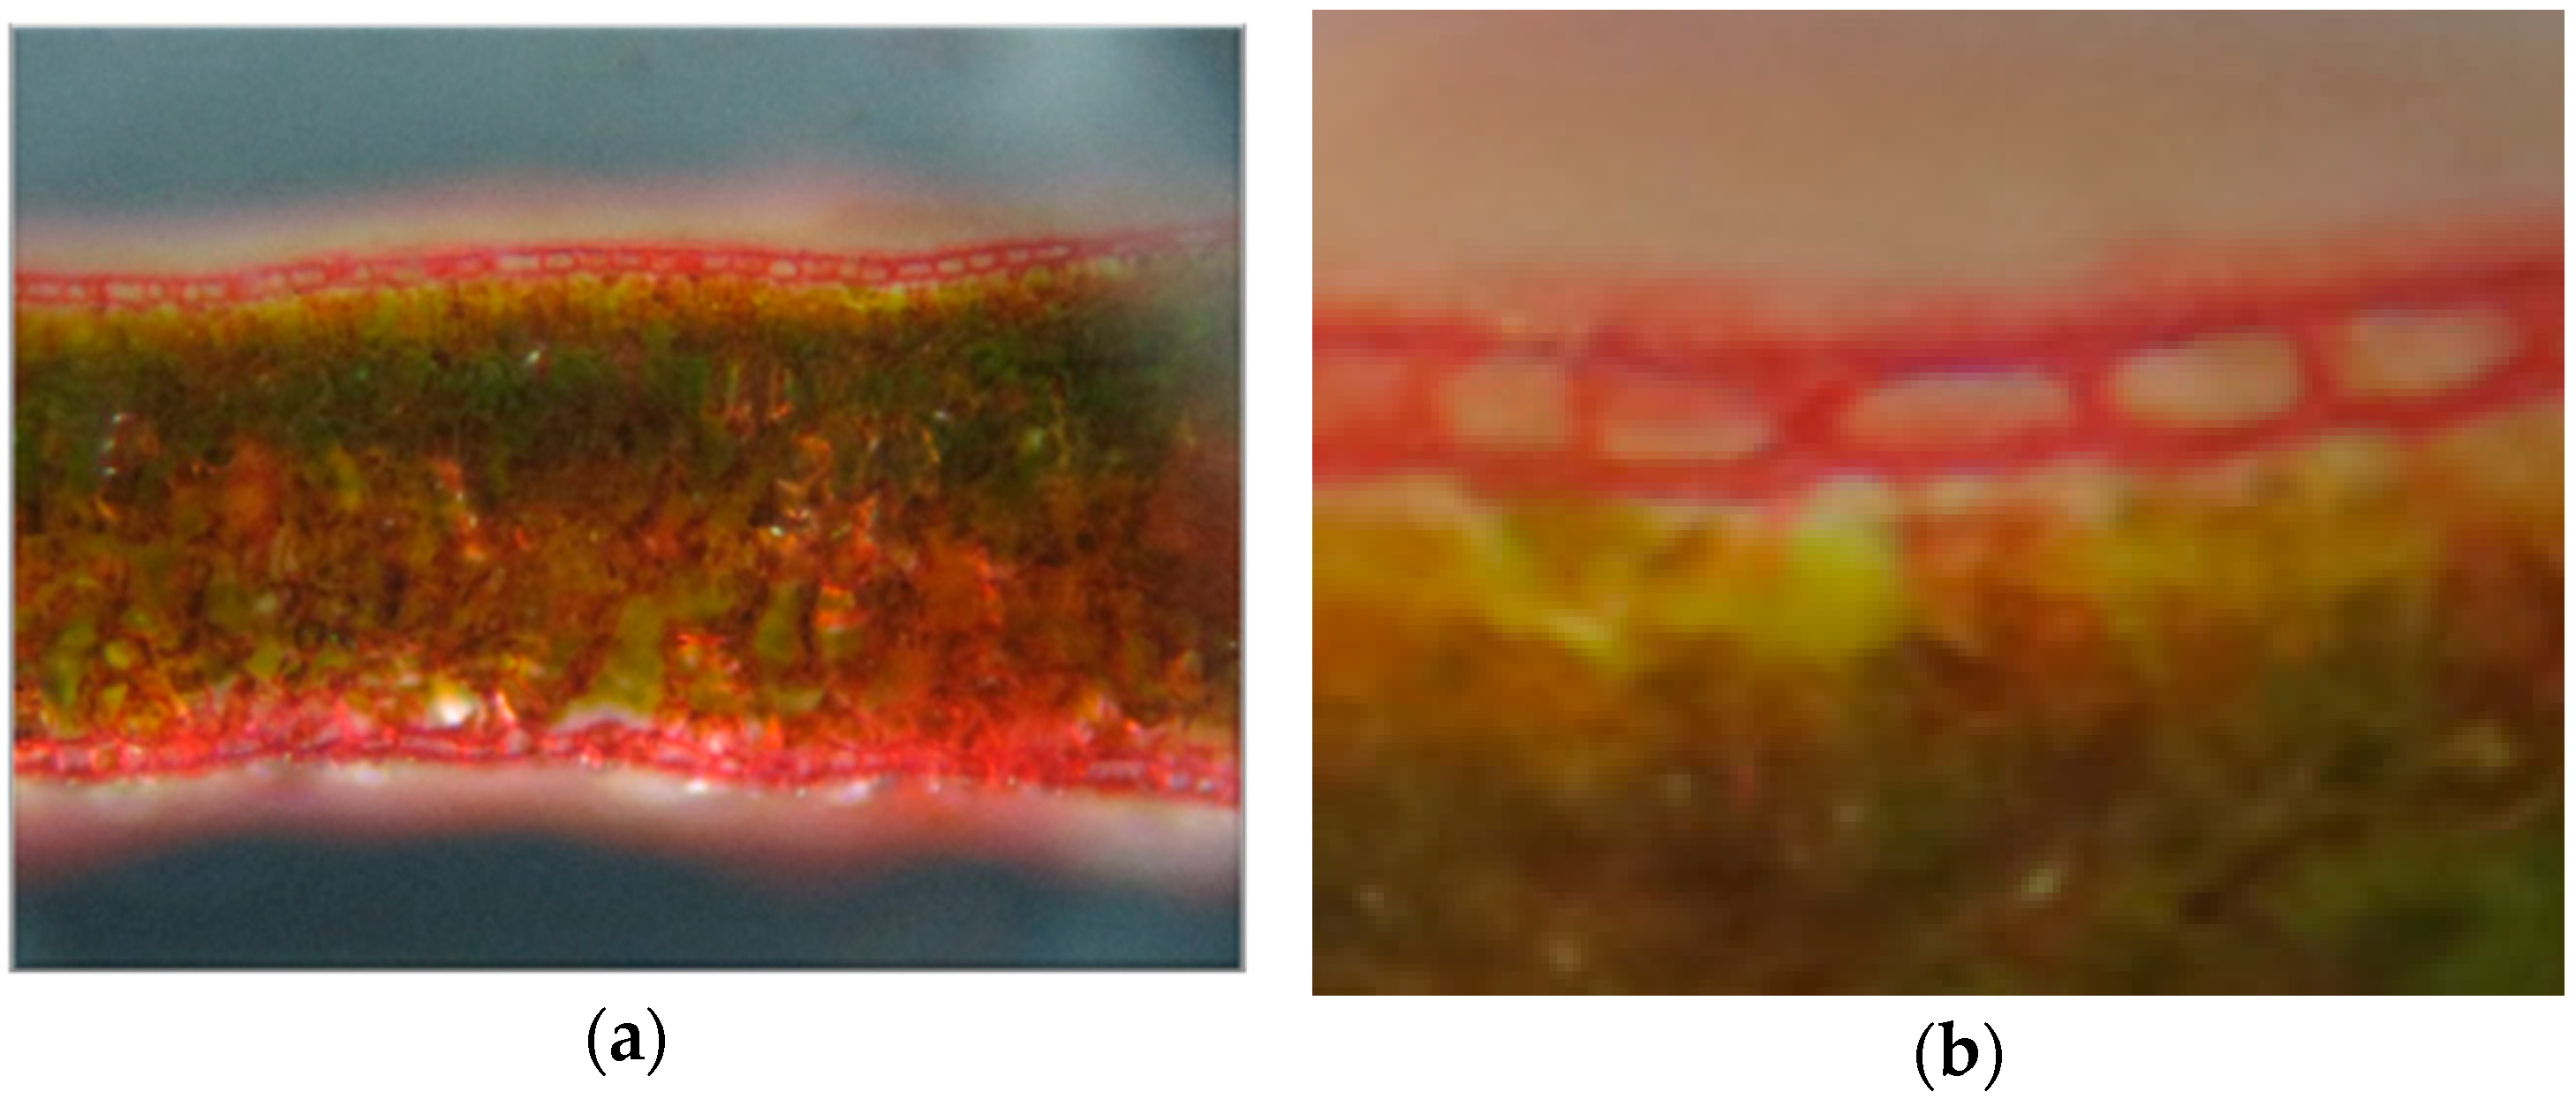
Several tea bushes (C. sinensis cv. Asahi) were kindly provided by the Tea Industry Research Division, Agriculture and Forestry Technology Department, Kyoto Prefectural Agriculture, Forestry and Fisheries Technology Center, Japan. When the first leaves emerged in early spring, we marked a sufficient number of leaves using colored tape and after nearly one year, we plucked the marked mature leaves. The leaves were washed and rinsed with distilled water. Previously, we freeze-dried the leaves first and then inserted the freeze-dried tea leaves into small pieces of pith and cut them into thin transverse cross sections using freehand sectioning. Close examination of the specimens under a microscope revealed that considerable parts of the epidermal cells were damaged by the procedure. In the present study, we have altered the order of procedures, and therefore, we cut the tea leaves first and then freeze-dried them. In the actual procedure, we cut the tea leaf in a small dish filled with liquid nitrogen. Sliced pieces that fell into liquid nitrogen froze instantly. Subsequently, we selected the appropriate sections and freeze-dried them. To examine the cell structures, we selected some sections, stained them with safranin, and observed them under a microscope. Figure 1 is a photograph of a leaf cross section stained with safranin. The cell walls are dyed red. In Figure 1a, both the upper and lower epidermis are stained well. In addition, Figure 1b shows that the structures of almost all the cells of the upper epidermis cells were preserved well.
The thickness of the section was about 200 μm. Only good sections were affixed to a carbon plate with an adhesive conducting tape. We observed the sections carefully under a microscope and marked undamaged sites that would be appropriate for micro-beam measurements.
We used the microprobe beamline at the Wakasa Wan Energy Research Center [10,11,12], and the micro-PIXE measurements were conducted using a proton beam with an energy of 2.5 MeV. The smallest beam size attained with the facility was less than 1 μm × 1 μm [12]. The typical epidermal cell in the examined tea leaf was approximately 12 μm thick, 10–20 μm wide, and the thickness of the cell wall was about 3 μm. A small beam size is essential for the observation of subcellular structures. In addition, an adequate beam current is required for the determination of elemental distribution. Therefore, the beam spot was determined to be around 3 μm at beam currents of about 10 pA. Four hours were required to obtain a 2D image per scan. At first, the scanning area was set to 400 μm2 to cover the entire cross section. Eventually, the scanning area was confined to 80 μm2 including three epidermal cells.
3. Results and Discussion
Figure 2 presents a typical X-ray spectrum of mature tea leaves obtained using micro-PIXE measurements. Figure 1 shows that Al, Si, phosphorus (P), sulfur, chlorine, potassium (K), calcium (Ca), and manganese were detected in the present setup. The positions of each K X-ray peak are indicated by the arrows. The spatial distribution of each element was obtained by gating the energy with the colored areas as shown in Figure 1 and sorting the position information of the list data. The width of the energy gate was set at 1.5 times the fitted full width at half maximum for each element. Except for Ca, the gated energy region did not overlap in all the elements.
Before epidermal cell scanning, we performed a whole leaf section scan with a beam size of 2.8 μm × 1.6 μm and a beam current of 7 pA. The scan area was 400 μm × 400 μm and the scanning was conducted by dividing each direction into 256 points. In the above case, the distance between two points was nearly 1.6 μm. To improve the statistics, the spatial resolution of the obtained image map was reduced to 128 × 128 points.
Figure 3 presents the elemental map of Al (Figure 1a) and K (Figure 1b). The color bar indicates the counts of X-rays. Since there were some background counts in the maps, lower counts are suppressed to zero and are shown in black to facilitate the visualization of the elemental distribution. The position of the leaf section could be distinguished from the maps of K as they were distributed all over the leaf. The leaf was positioned slanting slightly downward from left to right.
Al distribution is illustrated in Figure 3a. The localization in the upper epidermis is clearly visible, in addition to the relatively low levels in the lower epidermis. The concentration in the mesophyll cells is considerably low in comparison to the concentration in the epidermis. The Al concentration trends are consistent with our previous observations [3,4].
As a next step, the scanning area was narrowed down to 80-μm squares to observe subcellular elemental distribution in the upper epidermis cells. However, we obtained a rather wide beam of 4 μm. Figure 4 presents the elemental spatial distributions of Al, Si, K, and P.
Based on Figure 4a, Al was located in the upper epidermis cell wall. We can observe four epidermis cells. The result of Al distribution is consistent with the observations of Carr et al. based on energy dispersive X-ray microanalysis [8] and Tolrà et al. based on low-energy X-ray fluorescence spectro-microscopy [13], which led to the conclusion that Al is localized in the cell wall. In the present study, Si was also localized in the cell wall. Although the Al and Si co-localization in the epidermis was observed in our previous study [3], the present study reveals their co-localization at a subcellular level and at a higher resolution. To the best of our knowledge, this is the first observation of Al and Si co-localization in epidermal cell walls of mature tea leaves. The result suggests that Al and Si form a complex. Some inorganic anions, such as F−, Si+, and sulfate, can create stable complexes with Al and reduce its toxicity [14,15]. Britez et al. observed Al and Si in Faramea marginata, and their results suggested that hydroxy-aluminosilicate was formed in the shoot tissues and was a mechanism of Al detoxification [6]. The results of the present study also suggest the formation of hydroxy-aluminosilicate in tea leaves is a detoxification mechanism.
Tolrà et al. also investigated the distribution of Si and reported that Si was located mainly in mesophyll cells and that the cell walls of the epidermis had much lower Si contents. The reason for the inconsistency between the present study and Tolrà et al. is not clear. They used hydroponically cultivated tea plants aged approximately 14 weeks as samples; conversely, we used cuttings of leaves aged about one year from a tea garden. The difference in the cultivation conditions and the ages of the tea leaves could be the source of the inconsistency in Si distribution.
Figure 4c,d illustrate the elemental distributions of K and P. The two elements were distributed all over the leaf. However, K seemed to be distributed more in the lower part of the epidermal cells or in the upper parts of the palisade layer. However, P was distributed relatively less in the epidermal cells but much more in the palisade cells, which is consistent with the findings of Tolrà et al. [13].
4. Conclusions
We measured the Al distribution in epidermal cells of mature tea leaves using micro-beam PIXE. The observed Al distribution suggests that Al is localized in the cell wall. In addition, Si exhibits a rather similar distribution. The results suggest that Al and Si form a complex in epidermal cells of matured tea leaves. Although the micro-PIXE could not identify the forms of the compounds it could reveal their molar ratios, which is critical information for the determination of the forms of the compounds based on quantitative measurements, which could be explored in further investigations.
Author Contributions
Sample preparation was performed by T.F. PIXE experiments were performed by Y.H., T.F., K.Y., M.S., and K.S. Manuscript preparation was done by Y.H., T.F., and K.Y.
Funding
This research received no external funding.
Acknowledgments
The authors would like to thank the staff of the accelerator group at the Wakasa Wan Energy Research Center for their operation of the accelerator.
Conflicts of Interest
The authors declare no conflicts of interest.
References
- Chenery, E.M. A preliminary study of aluminium and the tea bush. Plant Soil 1955, 6, 174–200. [Google Scholar] [CrossRef]
- Matsumoto, H.; Hirasawa, E.; Morimura, S.; Takahashi, E. Localization of aluminum forms in tea leaves. Plant Cell Physiol. 1976, 17, 627–631. [Google Scholar]
- Takahashi, K.; Uomori, S.-Y.; Yamashita, H.; Saito, M.; Haruyama, Y.; Yasuda, K. DISTRIBUTIONS OF ALUMINUM AND SILICON IN TEA LEAVES. Int. J. PIXE 2012, 22, 225–230. [Google Scholar] [CrossRef]
- Uomori, S.-Y.; Yamashita, H.; Saito, M.; Haruyama, Y.; Yasuda, K. Change of concentrations and distributions of aluminum and manganese in tea leaves. Int. J. PIXE 2013, 23, 13–19. [Google Scholar] [CrossRef]
- Yoshida, T.; Fujiwara, T.; Saito, M.; Haruyama, Y.; Yasuda, K. Concentration and distiribution measurements of fluorine in tea leaves by micro-PIGE. Int. J. PIXE 2013, 23, 119–125. [Google Scholar] [CrossRef]
- Britez, R.M.; Watanabe, T.; Jansen, S.; Reissmann, C.B.; Osaki, M. The relationship between aluminium and silicon accumulation in leaves of Faramea marginata (Rubiaceae). New Phytol. 2002, 156, 437–444. [Google Scholar] [CrossRef]
- Jansen, S.; Watanabe, T.; Dessein, S.; Smets, E.; Robbrecht, E. A Comparative Study of Metal Levels in Leaves of Some Al-accumulating Rubiaceae. Ann. Bot. 2003, 91, 657–663. [Google Scholar] [CrossRef] [PubMed] [Green Version]
- Carr, H.P.; Lombi, E.; Küpper, H.; McGrath, S.P.; Wong, M.H.; McGrath, S. Accumulation and distribution of aluminium and other elements in tea (Camellia sinensis) leaves. Agronomie 2003, 23, 705–710. [Google Scholar] [CrossRef]
- Gao, H.-J.; Zhao, Q.; Zhang, X.-C.; Wan, X.-C.; Mao, J.-D. Localization of Fluoride and Aluminum in Subcellular Fractions of Tea Leaves and Roots. J. Agric. Food Chem. 2014, 62, 2313–2319. [Google Scholar] [CrossRef] [PubMed]
- Yasuda, K.; Nomachi, M.; Sugaya, Y.; Yamamoto, H.; Komatsu, H. Progress of in-air microbeam system at the Wakasa Wan Energy Research Center. Instrum. Methods Phys. Sect. B Beam Interact. Mater. Atoms 2011, 269, 2180–2183. [Google Scholar] [CrossRef]
- Yasuda, K. Microbeam system at the Wakasa Wan Energy Research Center. Int. J. PIXE 2015, 25, 227–233. [Google Scholar] [CrossRef]
- Yasuda, K.; Hatashita, M.; Hatori, S.; Inomata, T.; Ishigami, R.; Ito, Y.; Kurita, T.; Sasase, M.; Takagi, K. Ion microbeam facility at the Wakasa Wan Energy Research Center. Instrum. Methods Phys. Sect. B Beam Interact. Mater. Atoms 2003, 210, 27–32. [Google Scholar] [CrossRef]
- Tolrà, R.; Vogel-Mikuš, K.; Hajiboland, R.; Kump, P.; Pongrac, P.; Kaulich, B.; Gianoncelli, A.; Babin, V.; Barceló, J.; Regvar, M.; et al. Localization of aluminium in tea (Camellia sinensis) leaves using low energy X-ray fluorescence spectro-microscopy. J. Plant Res. 2011, 124, 165–172. [Google Scholar] [CrossRef] [PubMed]
- Tanaka, A.; Tadano, T.; Yamamoto, K.; Kanamura, N. Comparison of toxicity to plants among Al3+, AlSO4+, and Al–F complex ions. Soil Sci. Plant Nutr. 1987, 33, 43–55. [Google Scholar] [CrossRef]
- Hodson, M.J.; Evans, D.E. Aluminium/silicon interactions in higher plants. J. Exp. Bot. 1995, 46, 161–171. [Google Scholar] [CrossRef]
Figure 1.
A photograph of a tea leaf cross section stained with safranin. Both the upper and lower epidermis are stained red. (a) Whole cross section. (b) Enlarged image of the upper epidermis.
Figure 1.
A photograph of a tea leaf cross section stained with safranin. Both the upper and lower epidermis are stained red. (a) Whole cross section. (b) Enlarged image of the upper epidermis.

Figure 2.
Typical X-ray spectrum of the mature tea leaf. The arrows indicate the Kα and Kβ energies of each element. The colored areas show the energy gate widths for the determination of the spatial distribution of the corresponding elements.
Figure 2.
Typical X-ray spectrum of the mature tea leaf. The arrows indicate the Kα and Kβ energies of each element. The colored areas show the energy gate widths for the determination of the spatial distribution of the corresponding elements.

Figure 3.
Elemental distributions of (a) Al and (b) K in the whole leaf. Al was located in both epidermises, while potassium was distributed all over the leaf showing some structure.
Figure 3.
Elemental distributions of (a) Al and (b) K in the whole leaf. Al was located in both epidermises, while potassium was distributed all over the leaf showing some structure.

Figure 4.
Close-up view of (a) Al, (b) Si, (c) K, and (d) P maps. Both axes indicate position in μm. The color bar represents counts per pixel. The top of each figure corresponds to the upper side of the leaf.
Figure 4.
Close-up view of (a) Al, (b) Si, (c) K, and (d) P maps. Both axes indicate position in μm. The color bar represents counts per pixel. The top of each figure corresponds to the upper side of the leaf.

© 2019 by the authors. Licensee MDPI, Basel, Switzerland. This article is an open access article distributed under the terms and conditions of the Creative Commons Attribution (CC BY) license (http://creativecommons.org/licenses/by/4.0/).
Share and Cite
MDPI and ACS Style
Haruyama, Y.; Fujiwara, T.; Yasuda, K.; Saito, M.; Suzuki, K. Localization of Aluminum in Epidermal Cells of Mature Tea Leaves. Quantum Beam Sci. 2019, 3, 9. https://0-doi-org.brum.beds.ac.uk/10.3390/qubs3020009
AMA Style
Haruyama Y, Fujiwara T, Yasuda K, Saito M, Suzuki K. Localization of Aluminum in Epidermal Cells of Mature Tea Leaves. Quantum Beam Science. 2019; 3(2):9. https://0-doi-org.brum.beds.ac.uk/10.3390/qubs3020009
Chicago/Turabian StyleHaruyama, Yoichi, Tsuguhisa Fujiwara, Keisuke Yasuda, Manabu Saito, and Kohtaku Suzuki. 2019. "Localization of Aluminum in Epidermal Cells of Mature Tea Leaves" Quantum Beam Science 3, no. 2: 9. https://0-doi-org.brum.beds.ac.uk/10.3390/qubs3020009