Article

Analysis of Ion-Irradiation Induced Lattice Expansion and Ferromagnetic State in CeO2 by Using Poisson Distribution Function

1
Department of Quantum and Radiation Engineering, Osaka Prefecture University, Sakai, Osaka 599-8531, Japan
2
Japan Atomic Energy Agency (JAEA), Tokai, Ibaraki 319-1195, Japan
3
The Wakasa Wan Energy Research Center (WERC), 64-52-1 Nagatani, Tsuruga, Fukui 914-0192, Japan
*
Author to whom correspondence should be addressed.
Quantum Beam Sci. 2020, 4(3), 26; https://0-doi-org.brum.beds.ac.uk/10.3390/qubs4030026
Submission received: 18 June 2020 / Revised: 20 July 2020 / Accepted: 23 July 2020 / Published: 24 July 2020

Abstract

:
The lattice constant and the magnetic state of CeO2 are modified by the irradiation with 200 MeV Xe ions. Under the assumption that these modifications are induced in the narrow one-dimensional region (the ion track) along the ion beam path, the dependence of the lattice constant and the saturation magnetization of CeO2 on the Xe ion fluence was analyzed by using the Poisson distribution function. The analysis reveals that the lattice constant inside the ion track, which is larger than that outside the ion track, is not affected by the overlapping of the ion track. On the other hand, the ferromagnetic state is induced inside the ion track, but the analysis shows that this ferromagnetic state is gradually destroyed due to the overlapping of the ion track. The present result implies that the Poisson distribution function is useful for describing the effect of the ion track overlapping on the ion irradiation-induced ferromagnetic state in CeO2.

1. Introduction

In our previous paper [1], we have reported that the ferromagnetic state is induced in CeO2 sintered pellets by the irradiation with 200 MeV Xe ions. Moreover, we have shown that the ion-induced magnetization increases with increasing the Xe ion fluence, reaches the maximum value, and then decreases for higher fluences. The lattice constant of CeO2, however, increases monotonically with increasing Xe ion fluence, and tends to be saturated for higher fluences. As several previous studies have already shown, the lattice defects and/or disordering contribute to the appearance of the ferromagnetism in non-magnetic oxides such as TiO2 [2], HfO2 [3], and CeO2 [4,5,6,7]. It is well-known that the high-density electronic excitation by swift heavy ions produces defective one-dimensional structures (ion-tracks) in many oxides. Through the high-resolution TEM (transmission electron microscope) observation, Takaki and Yasuda have shown that, in CeO2 specimens irradiated with 200 MeV Xe ions, one-dimensional defective regions (ion-tracks) are produced along the ion beam paths. Inside the ion-tracks, the arrangement of oxygen atoms is mainly disordered [8,9]. Outside the ion tracks, the atomic arrangement remains unchanged even by the irradiation. The result of the TEM observation suggests that the ferromagnetism of the irradiated CeO2 appears inside the ion-tracks in which the lattice structure becomes defective.
In the present study, we have measured the XRD (X-ray diffraction) spectra and the magnetization and magnetic field (M-H) curves for the 200 MeV Xe ion irradiated CeO2 specimens in the wider range of ion-fluences (5 × 10¹¹–7 × 10¹³/cm2) than that of the previous experiment (5 × 10¹²–4 × 10¹³/cm2) [1]. Then, under the assumption that the ferromagnetic state and the accompanying lattice expansion are induced inside the defective one-dimensional region (ion-track), the effect of ion-track overlapping was examined by using the Poisson distribution function. We will show in this report that the dependence of the magnetization and the lattice constant of CeO2 specimens on the Xe ion fluence can be semi-quantitatively described by the Poisson distribution function.

2. Experimental Procedure

In the present study, CeO2 powders of 99.99% purity were pressed and sintered at 1873 K for 12 h in air. The size of the obtained CeO2 bulk pellets were about 15 mm in diameter and 0.7-mm thick. The mean grain size of the pellets was about 5 μm in diameter. They were polished and cut to an appropriate size for the irradiation experiment, and the measurements for the lattice structure and the magnetic properties. These specimens were irradiated with 200 MeV Xe14+ ions at room temperature by using a high energy ion accelerator at Nuclear Science Research Center, Japan Atomic Energy Agency (JAEA-Tokai). The ion-fluences were from 5 × 10¹¹/cm2 to 7 × 10¹³/cm2. The lattice structure of the specimens was characterized by using a conventional Cu Kα XRD. The magnetic properties were measured at 300 K with a magnetic field from −10,000 to +10,000 Oe by using a superconducting quantum interference device (SQUID) magnetometer.

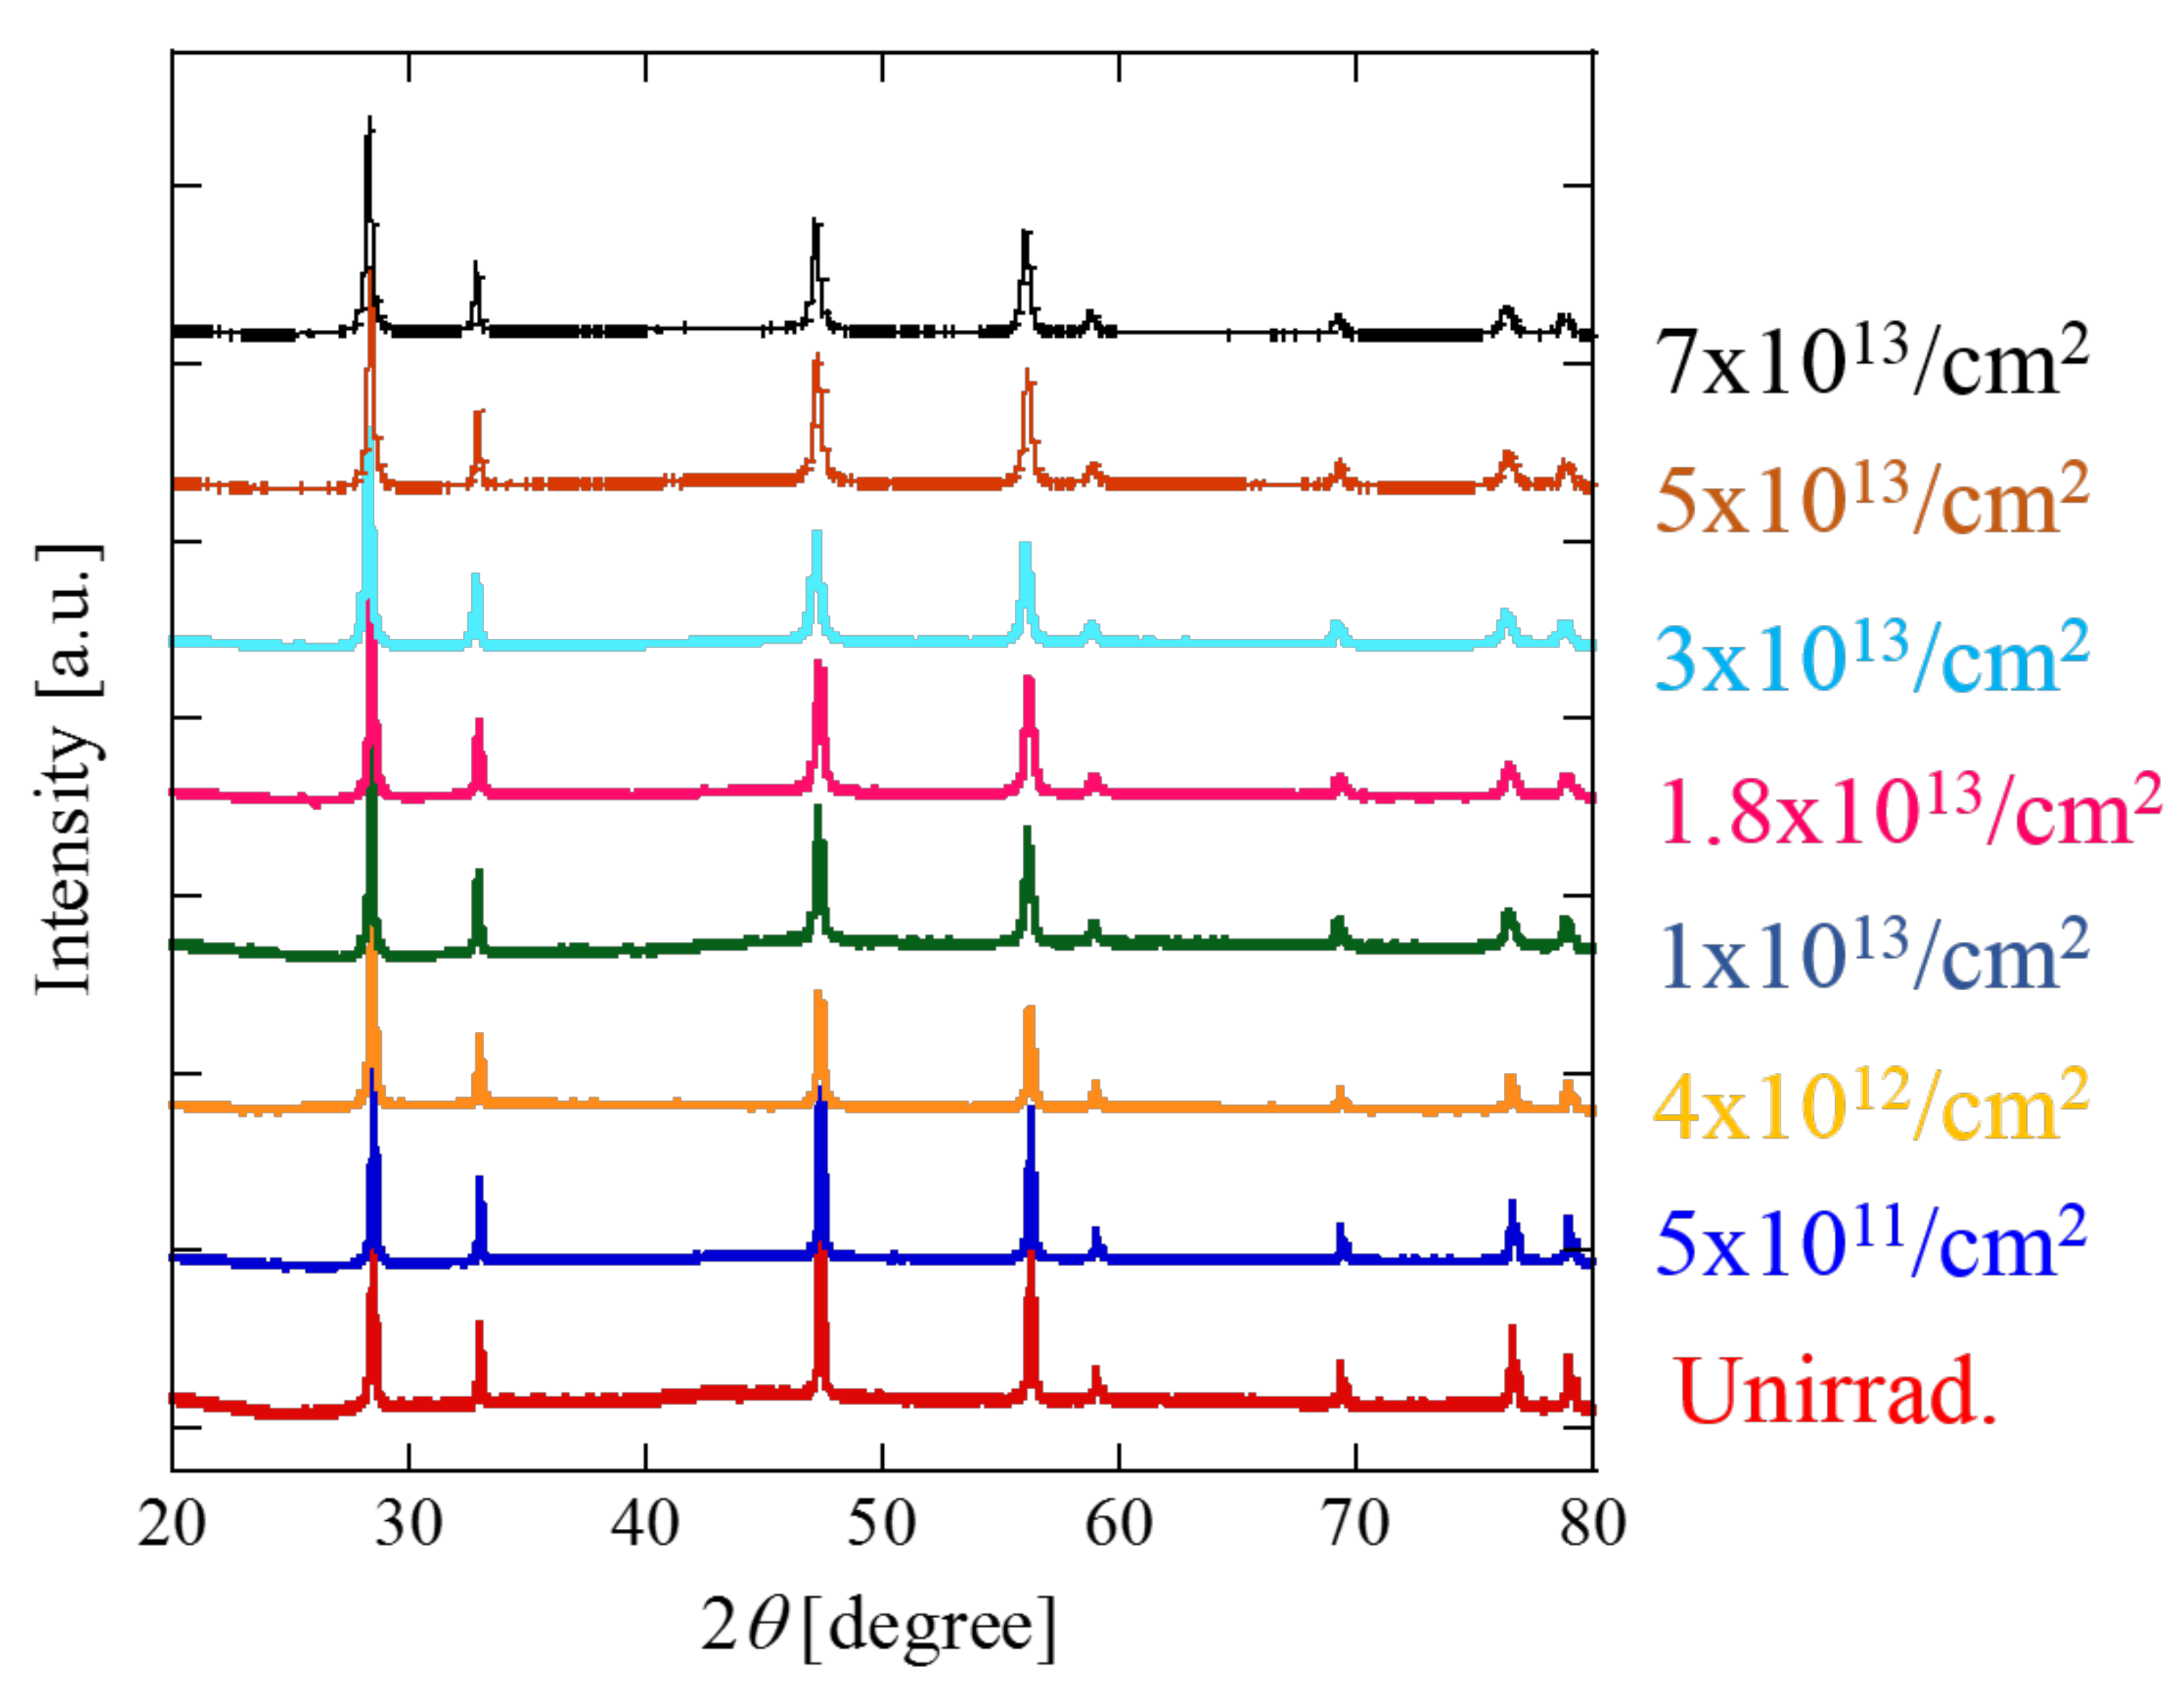
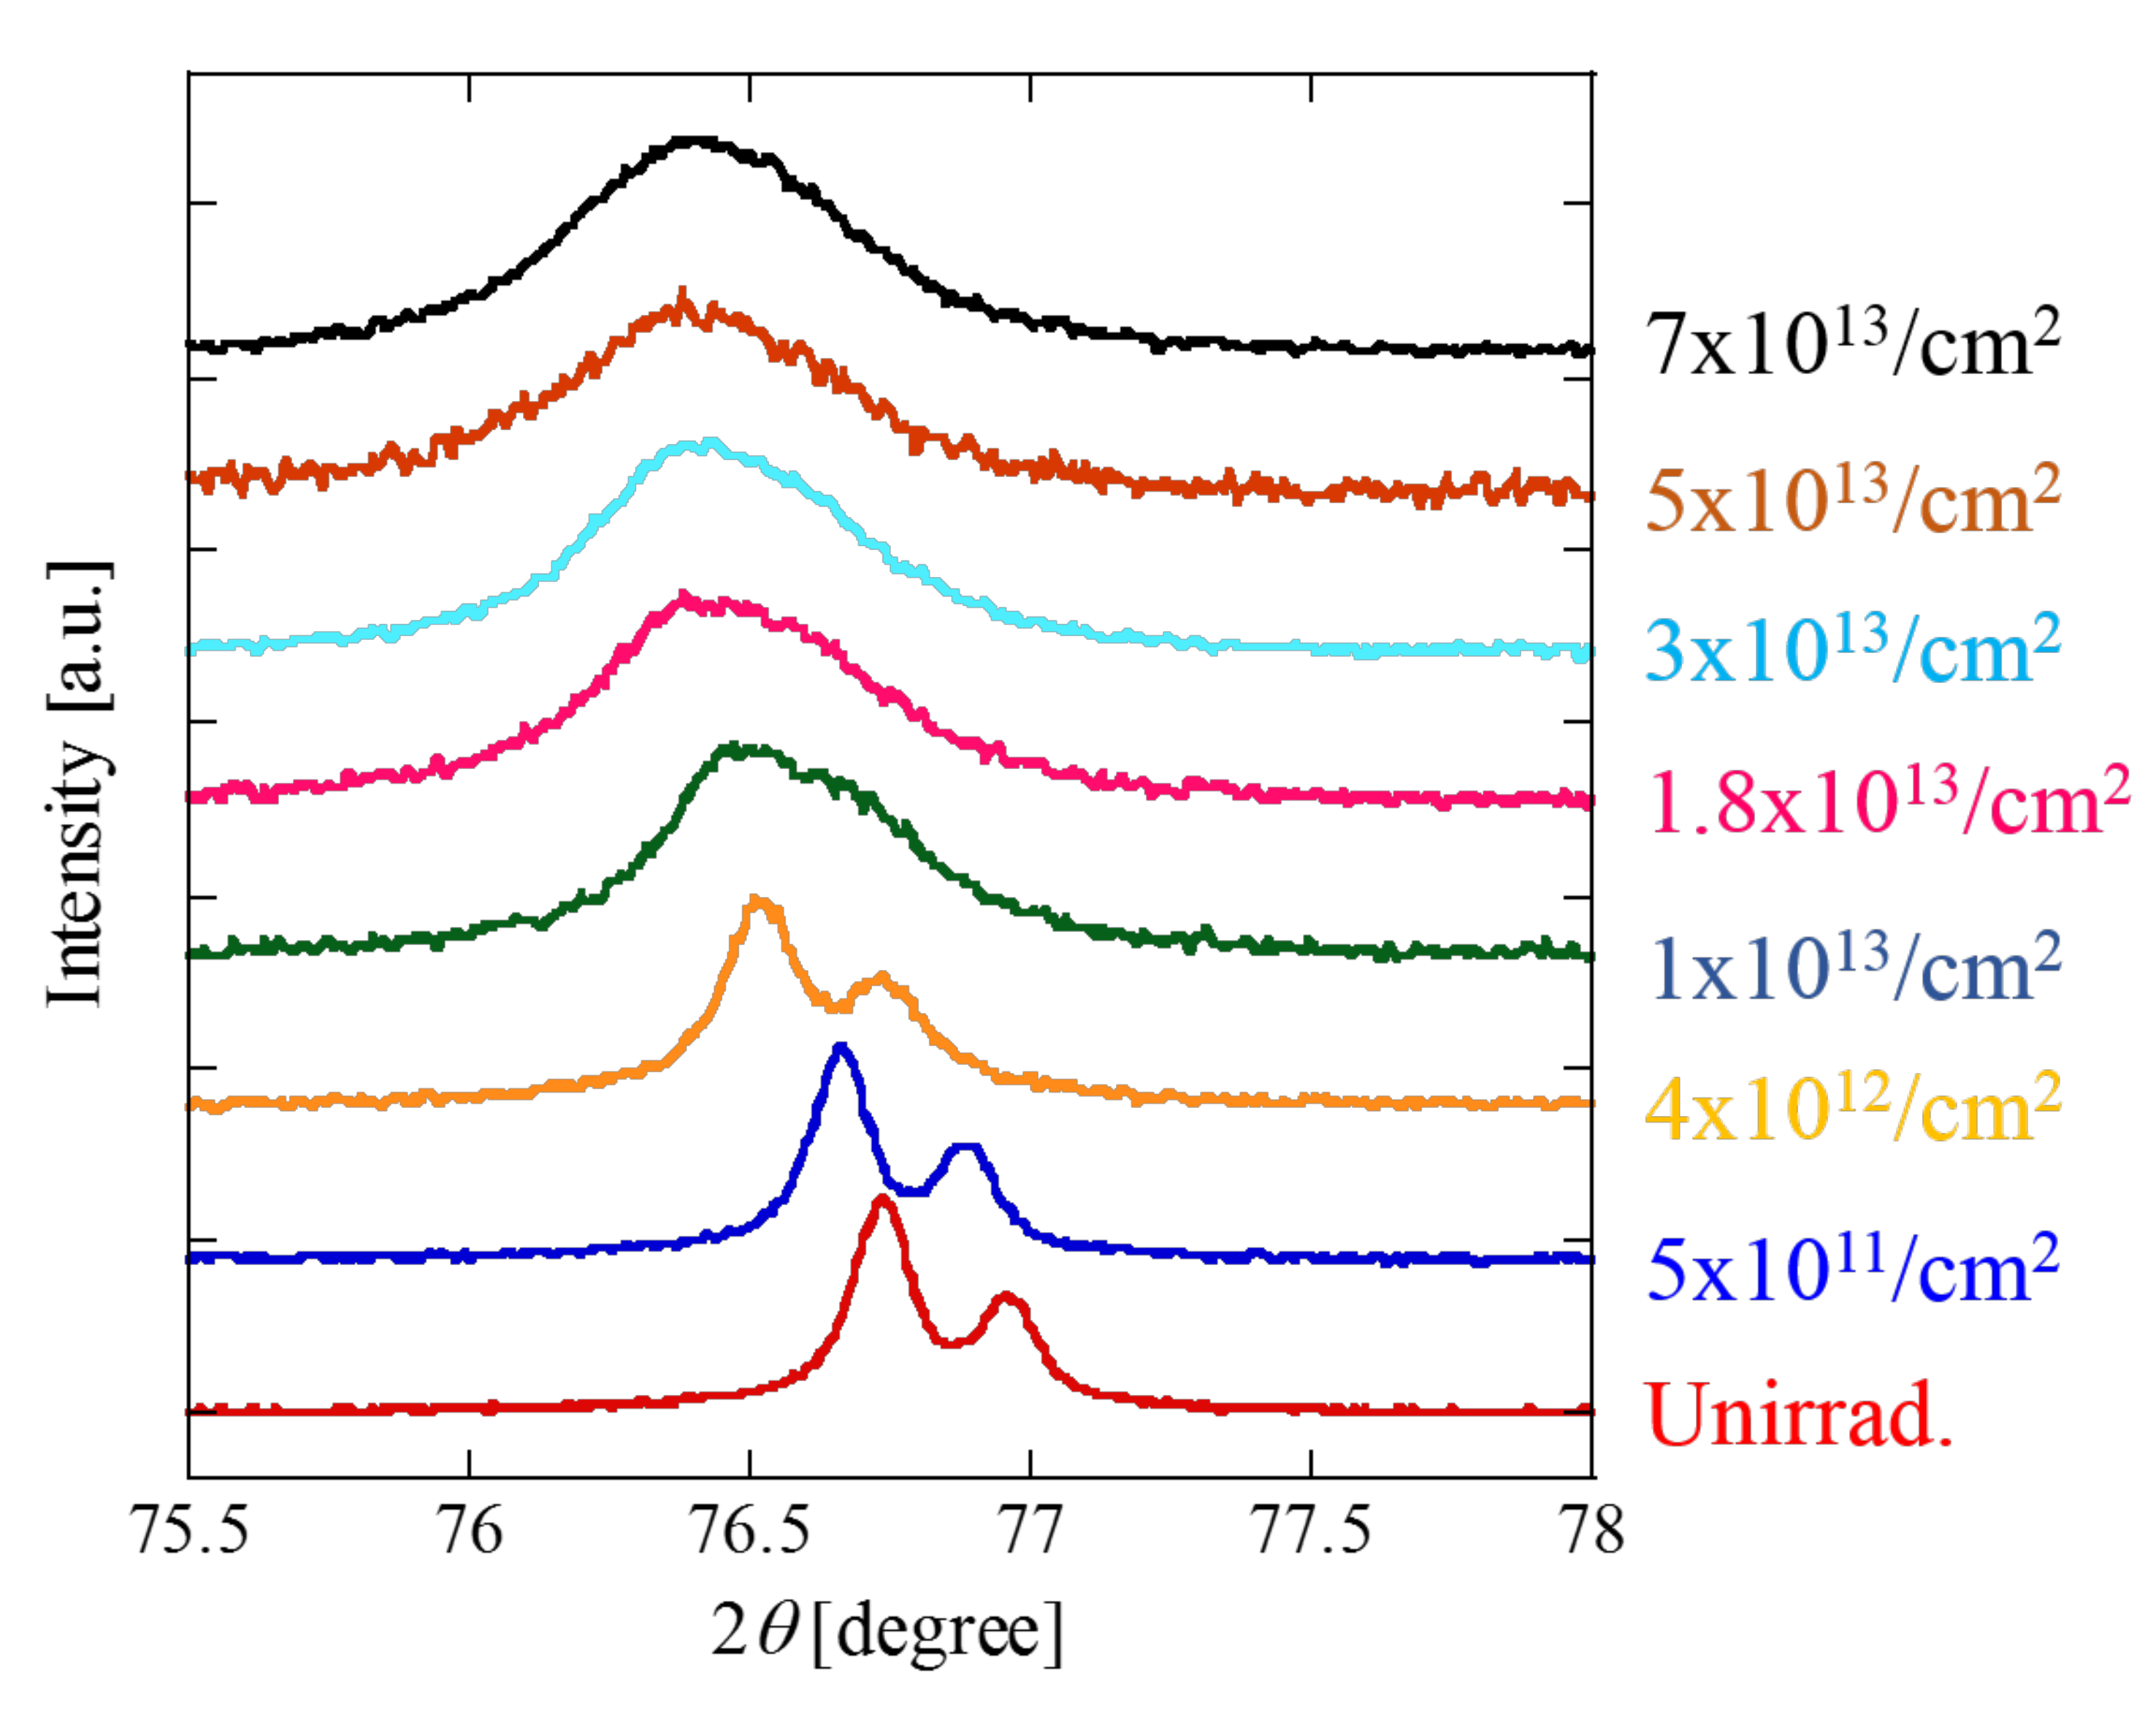
3. Experimental Results

Figure 1 shows the XRD spectra of CeO2 specimens before and after the ion irradiation. In the spectra for the irradiated specimens, an appearance of new peaks or the disappearance of the intrinsic peaks cannot be found and all the diffraction peaks correspond to the fluorite structure, which is the intrinsic crystal structure of CeO2. This result means that the crystal structure of CeO2 remains unchanged even after the ion irradiation. However, when the (331) peaks are carefully observed (see Figure 2), we can clearly find the irradiation effects on XRD spectra. The peaks for the irradiated specimens shift to lower angles and become broadened when increasing the ion-fluence. This result means that the expansion and the disordering of the lattice are induced by the ion irradiation. From the position of XRD peaks for each ion-fluence, we have determined the lattice constant for each ion-fluence by using the Bragg’s law.
Figure 3 shows the lattice constant of CeO2 specimens as a function of Xe ion-fluence. The lattice constant of irradiated specimens monotonically increases with increasing ion-fluence and is saturated for higher ion-fluences.
Since the calculation using the SRIM code [10] shows that the range of 200 MeV Xe ion in CeO2 is about 12 μm, the effects of the irradiation appear only near the surface of the specimens. Since the penetration depth of Cu Kα X-ray in CeO2 (about 4 μm) is much smaller than the ion range, the XRD spectra reflect the lattice structure only for the irradiated surface region. A SQUID magnetometer, however, measures the total magnetic moment not only from the irradiated surface region but also from the unirradiated region. To obtain the magnetization (emu/g) induced by the irradiation, we removed the magnetic moment for the unirradiated region from the measured magnetic moment, and divided the magnetic moment for the irradiated region by its mass. The magnetic moment from the unirradiated part of the specimens can be estimated from the SQUID result for the specimen before the irradiation. The values of the irradiation-induced magnetization (emu/g) obtained through the process described above are plotted as a function of an external magnetic field in Figure 4a (for lower fluences) and Figure 4b (for higher fluences).
Figure 5 shows the saturated magnetization of CeO2 as a function of Xe ion-fluence. As can be seen in Figure 4 and Figure 5, after the irradiation, the ferromagnetic state clearly appears and the saturation magnetization value increases with increasing ion-fluences. The value of magnetization reaches the maximum value, and then decreases with increasing ion-fluences. The Xe ion fluence dependence of the lattice constant (Figure 3) and that of the saturation magnetization (Figure 5) are very similar to the previous result [1]. We can surely confirm the effect of Xe ion irradiation on CeO2 by the present experiment for a wider range of ion fluences and more data points than for the previous experiment.

4. Data Analysis

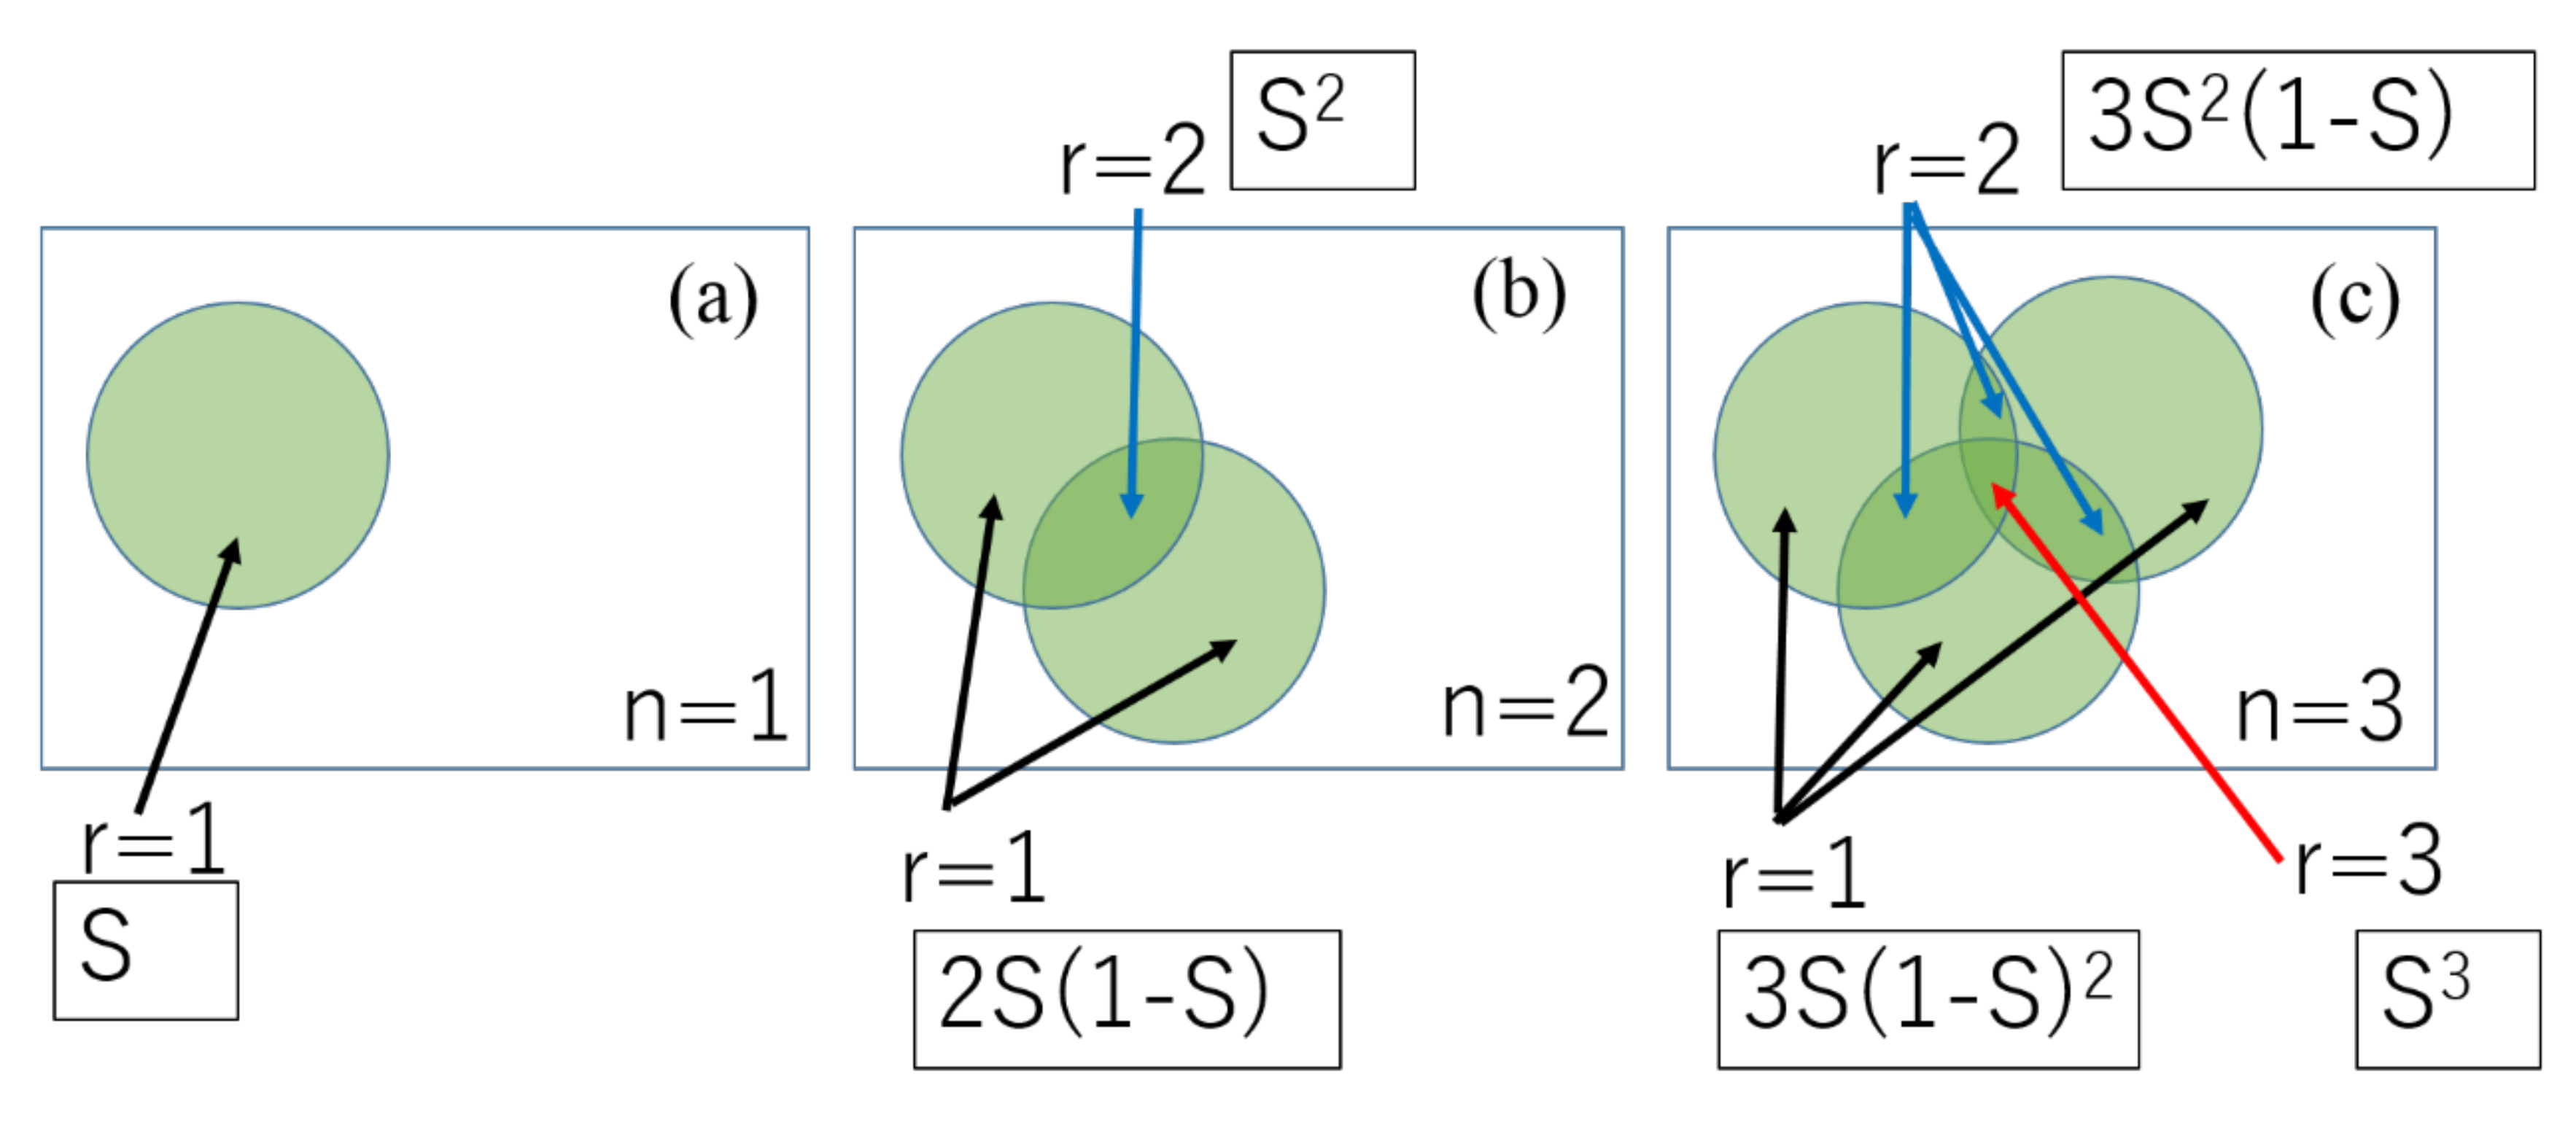
4.1. Binomial Distribution Function and Poisson Distribution Function for the Expression of Track-Overlapping

Our experimental results show that the Xe ion fluence dependence of the lattice constant of CeO2 is very different from that of the saturation magnetization. The difference appears for higher ion fluences. The lattice expansion is saturated and the magnetization decreases. Since we have mentioned that the effects of 200 MeV Xe ion irradiation appear in ion-track regions, the difference must be attributed to overlapping ion-tracks, which occurs at higher fluences. Benyagoub et al. have used the Poisson distribution function in order to explain the effect of the ion-track overlapping on the phase transformation in ZrO2 irradiated with swift heavy ions [11]. They have shown that the phase transformation from the monoclinic to tetragonal structure needs the overlapping of the ion-tracks (at least two ion impact). The Poisson distribution function is the approximate expression of the binomial distribution function for a large number of trials and a small probability for each trial. Ishikawa et al. have explained the change in XRD spectra for CeO2 irradiated with 200 MeV Xe ions directly by using the binomial distribution function [12].
To explain the relationship between the probability of the ion-track overlapping and the probability distribution function, we will first use the binomial distribution function. The schematic drawing of the ion-track overlapping is shown in Figure 6. This drawing is similar to the figure in Reference [12]. The area of each rectangle is assumed to be 1 cm2. In the figure, the value of n is the number of ion-tracks/cm2, and r means the number of the impact by the ion-tracks. Figure 6a shows the production of a single ion track with the cross section of S (the number of ion-tracks is n = 1/cm2, and the number of the impact is r = 1). For the present case, only inside the area of S, the changes in lattice constant and a magnetic state are induced. Figure 6b shows the overlapping of ion-tracks by the production of a second ion-track (the total number of ion-tracks is n = 2/cm2). The area for the double impact (r = 2), which corresponds to the probability of the track overlapping, is S2, and the total area of non-overlapped ion-tracks (r = 1) is 2S (1−S). When a third ion-track is produced (n = 3), as is shown in Figure 6c, the areas of triple impact (r = 3), double impact (r = 2), and single impact (r = 1) are S3, 3S2 (1−S), and 3S (1−S)2, respectively. For a given number of ion-tracks, n, the total area for the r-times impact (r <= n), A(n,r), is described by the following binomial distribution function.
A ( n , r ) = n C r S r ( 1 S ) n r for   r   =   0 ,   1 ,   2 , 3 , n
Since the original meaning of Equation (1) is the discrete probability for the number of successes, r, in a sequence of n independent trials, we can easily understand that A(n,r) can be described by the binominal distribution function in Equation (1). When a value of n is very large and a value of S is very small, the binomial distribution function can be approximated by the Poisson distribution function. The present case surely fulfills this condition. The value of n, which corresponds to the ion fluence per cm2, is 1011–1014, while the value of S is expected to be the order of 10−13. Therefore, A(n,r) can be described by using the Poisson distribution function as:
A ( n , r ) = ( n S ) r exp ( n S ) r !
The sum of the non-impact (r = 0) and impact areas (r = 1,2,3…n) must be unity.
r = 0 n A ( n , r ) = A ( n , 0 ) + r = 1 n A ( n , r ) = exp ( n S ) + r = 1 n A ( n , r ) = 1
The total area which is affected by the ion track impacts is given by:
r = 1 n A ( n , r ) = 1 exp ( n S )
If the change in properties of a target material does not depend on the number of the track impact, the macroscopic change in the property should be simply proportional to Equation (4). Many papers have reported that, when a target material is amorphized inside the ion-track, the macroscopic change in target material properties is expressed by Equation (4), which is the Poisson law, because the amorphous state remains unchanged even by the following ion impacts [13,14,15]. In such cases, by fitting the experimental results using the Poisson law, the area of each ion-track, S, and the track diameter can be determined.

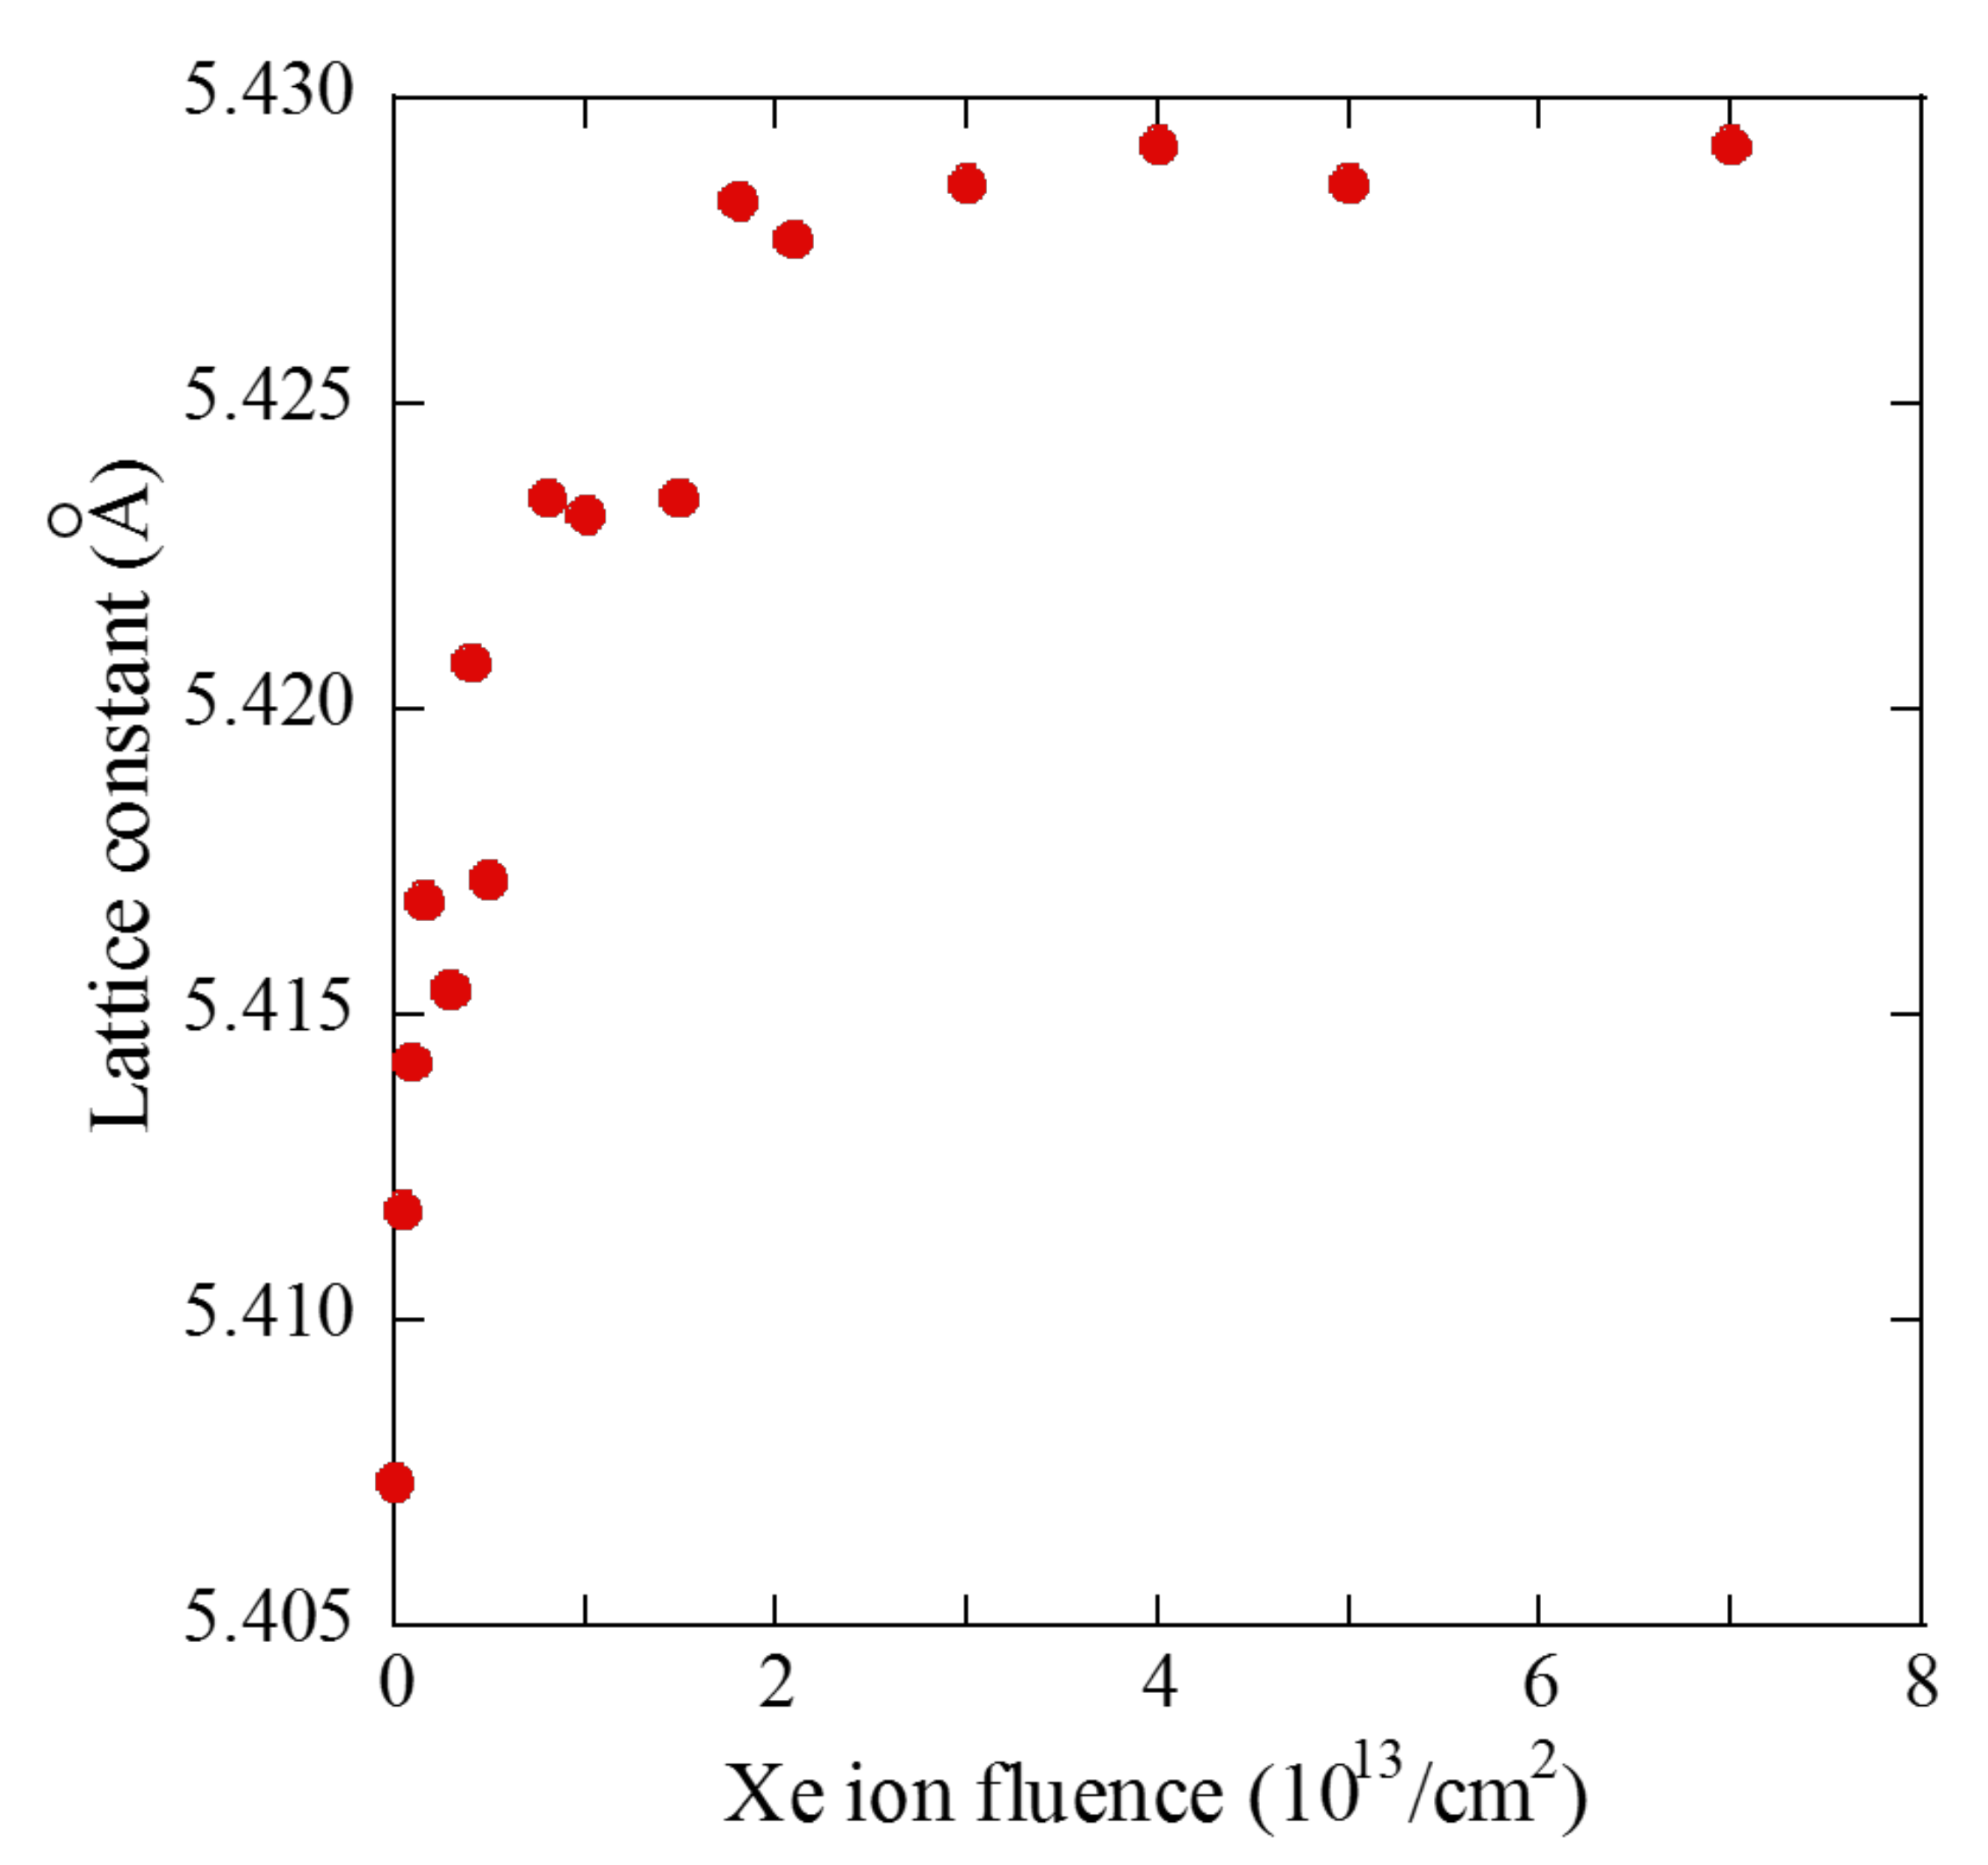
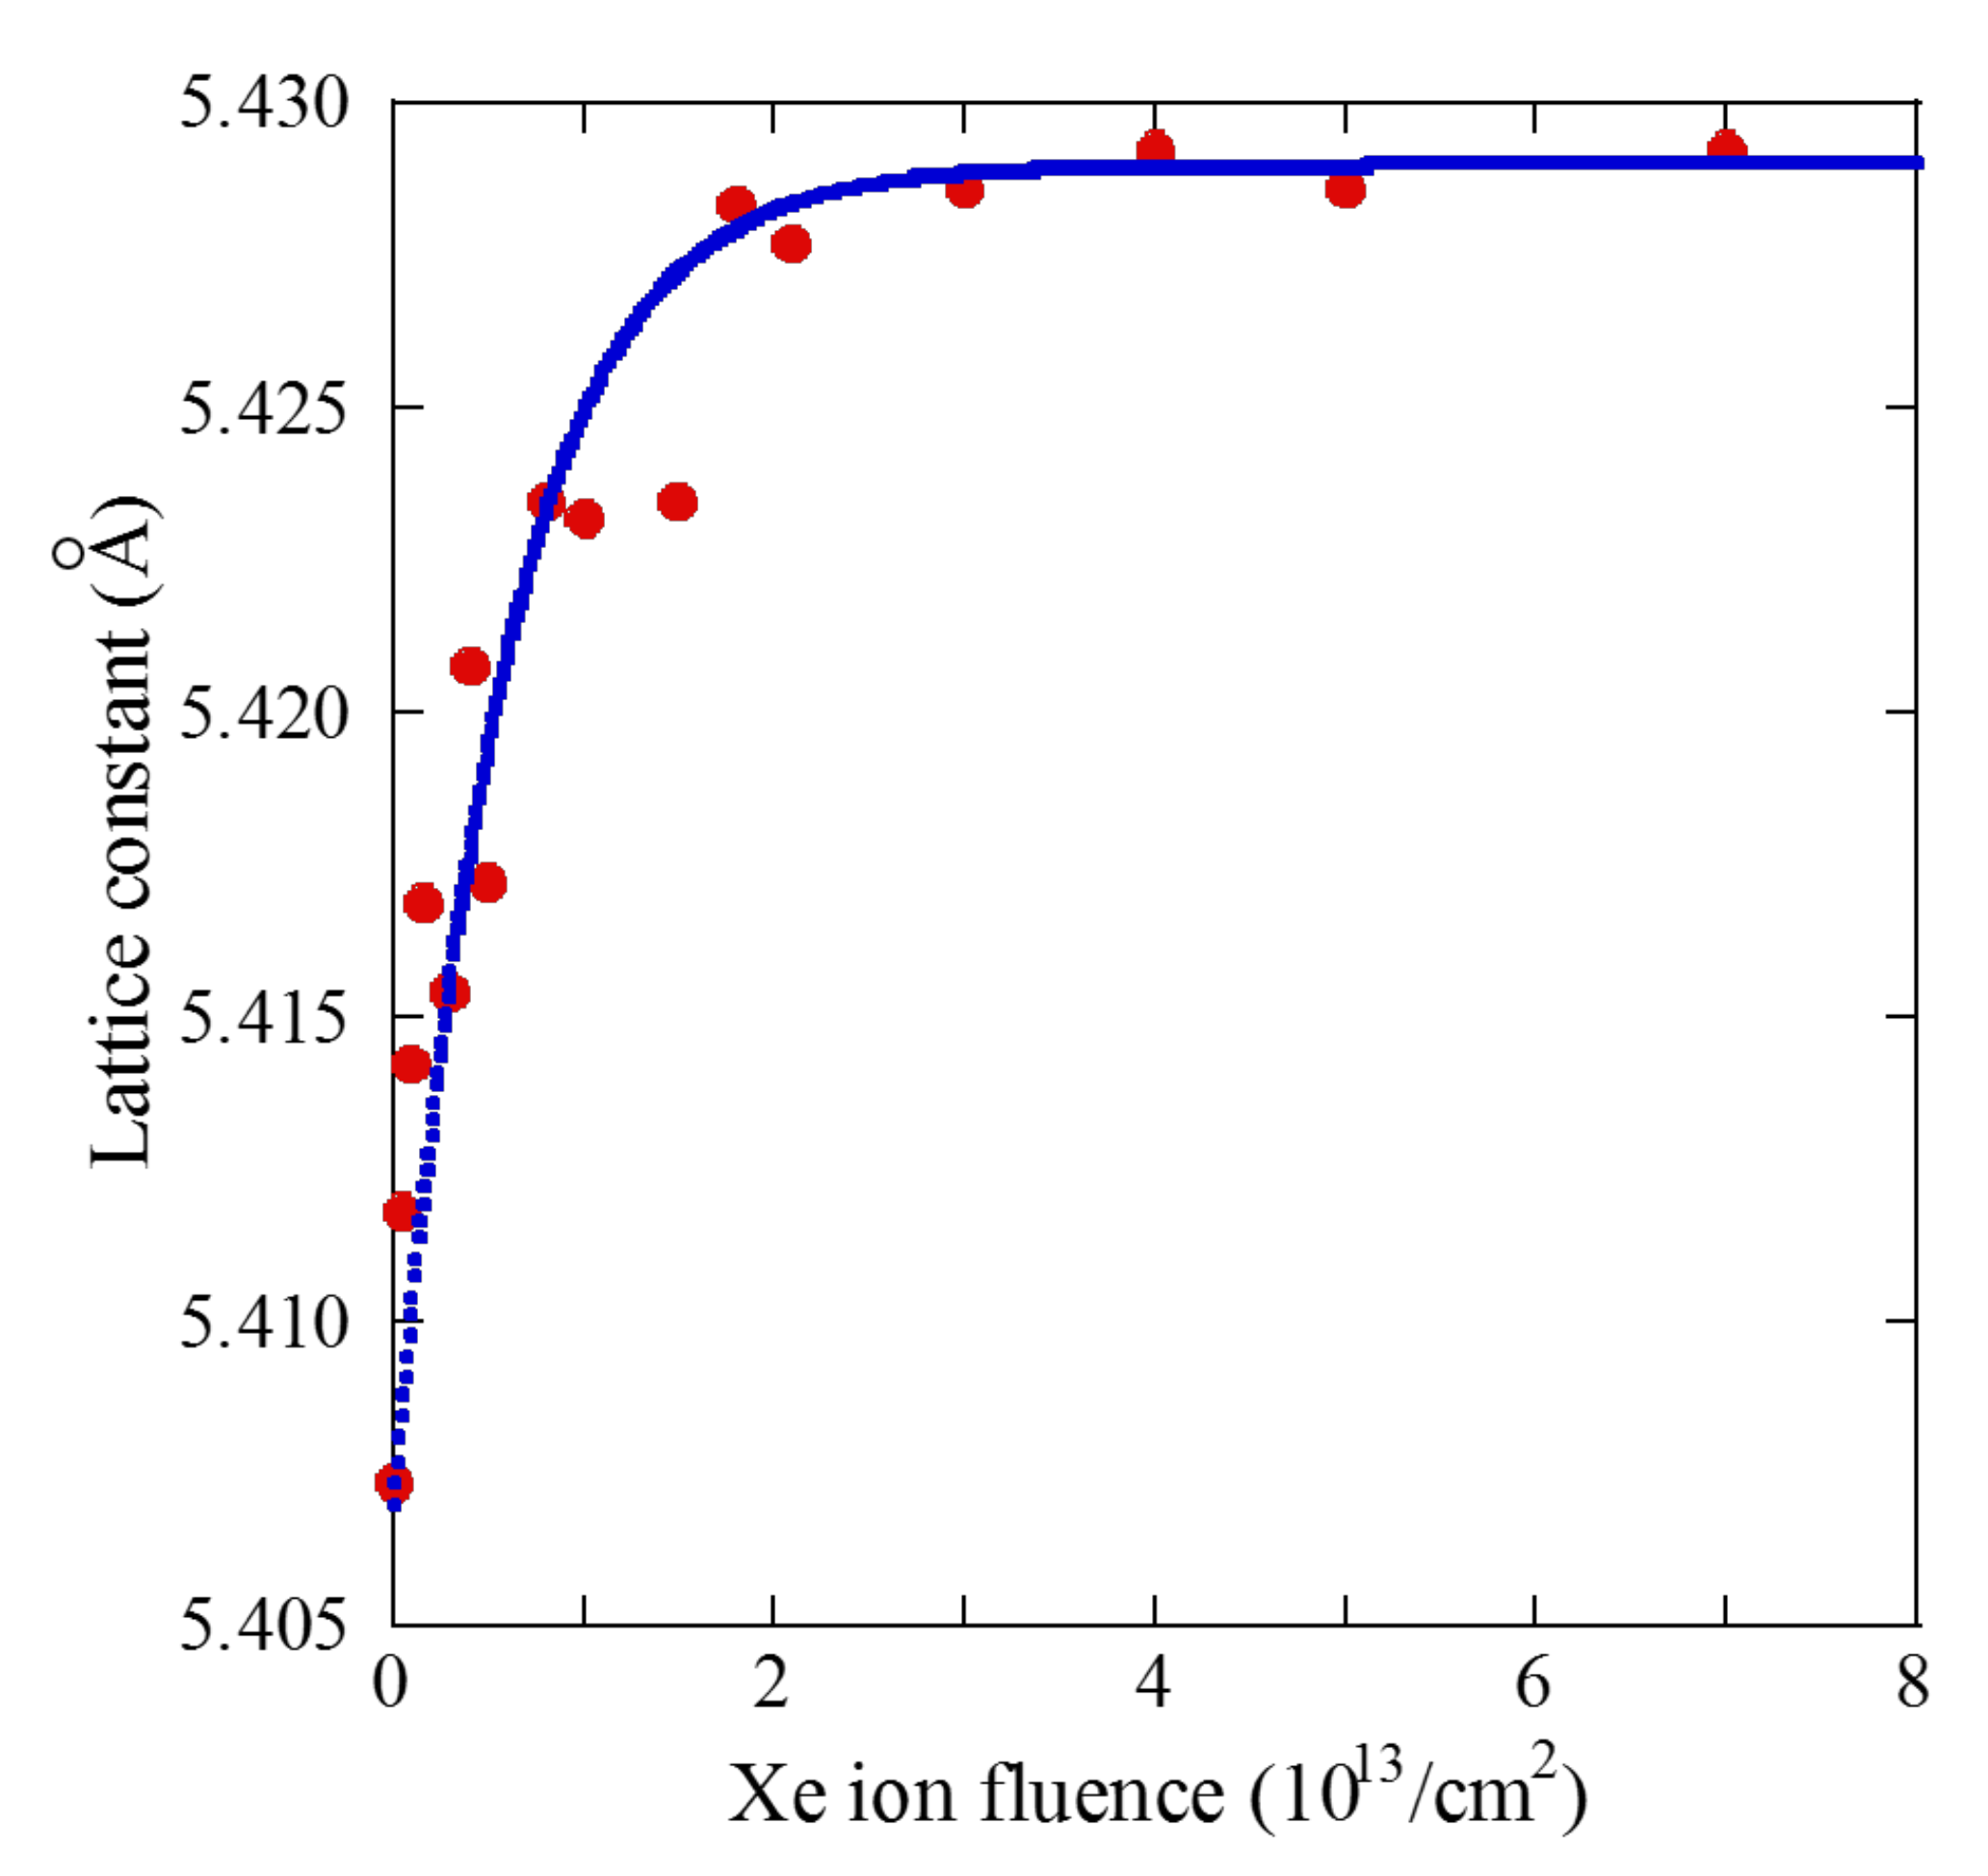
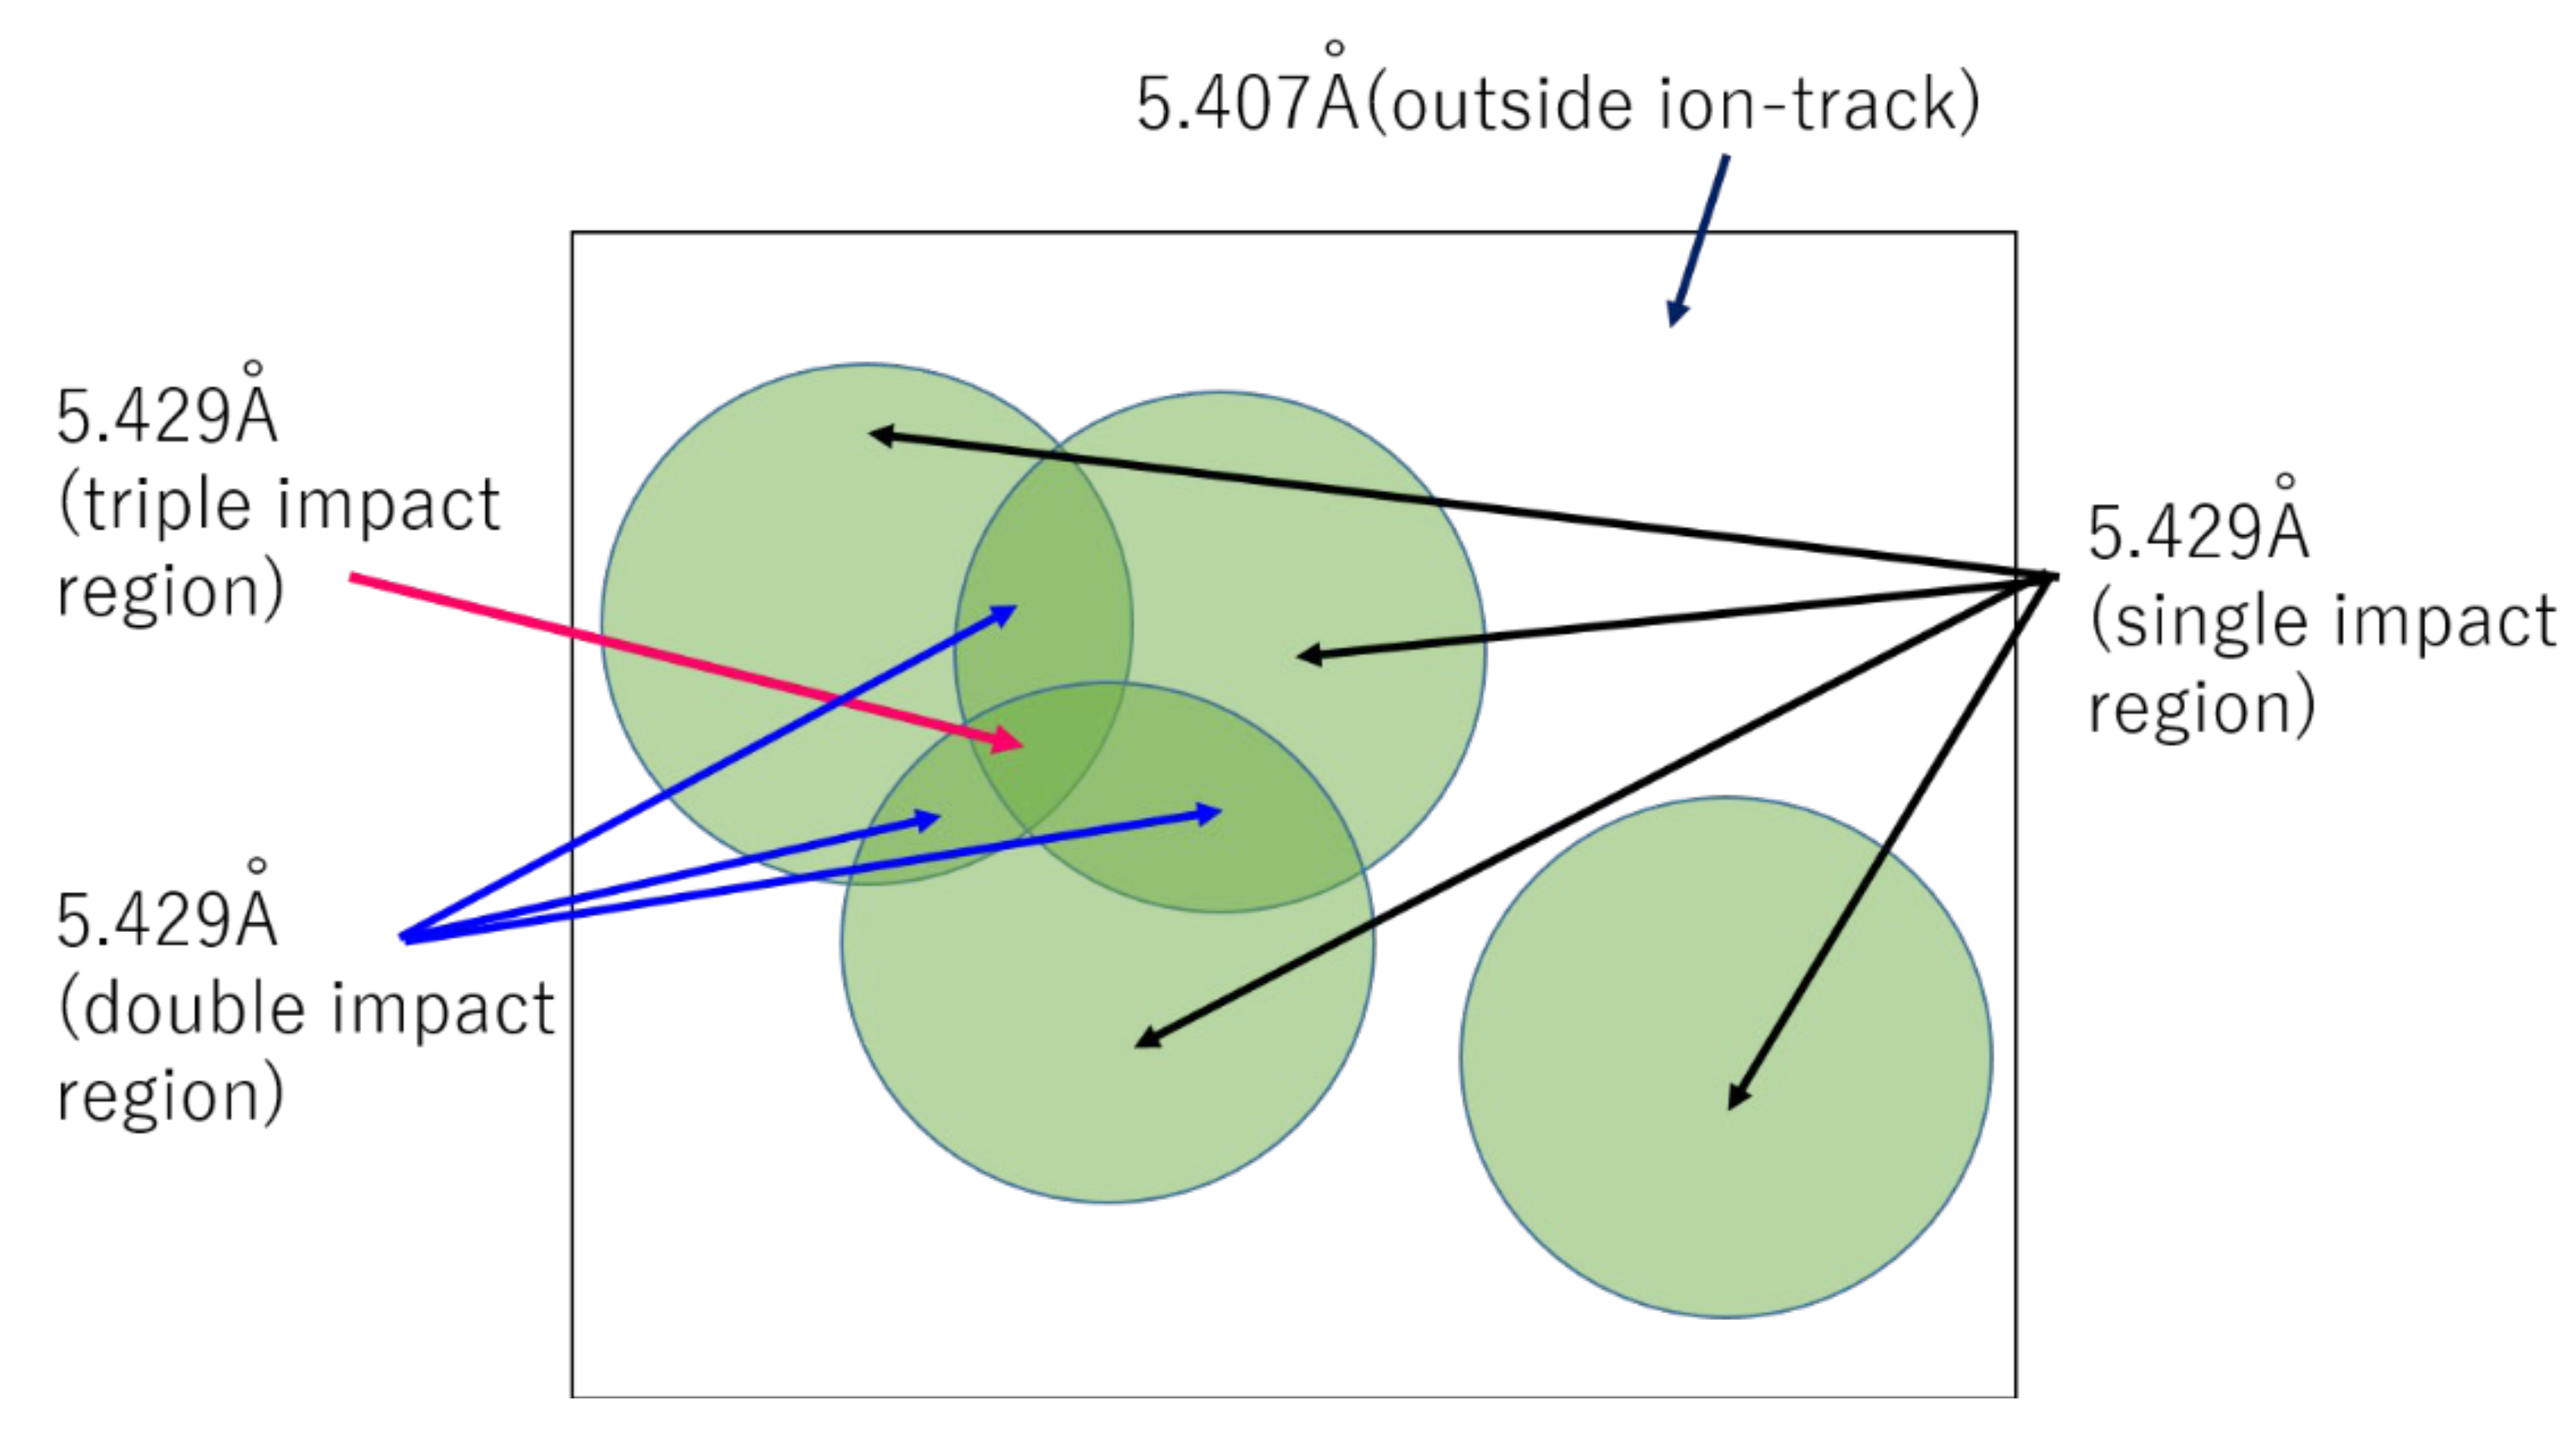
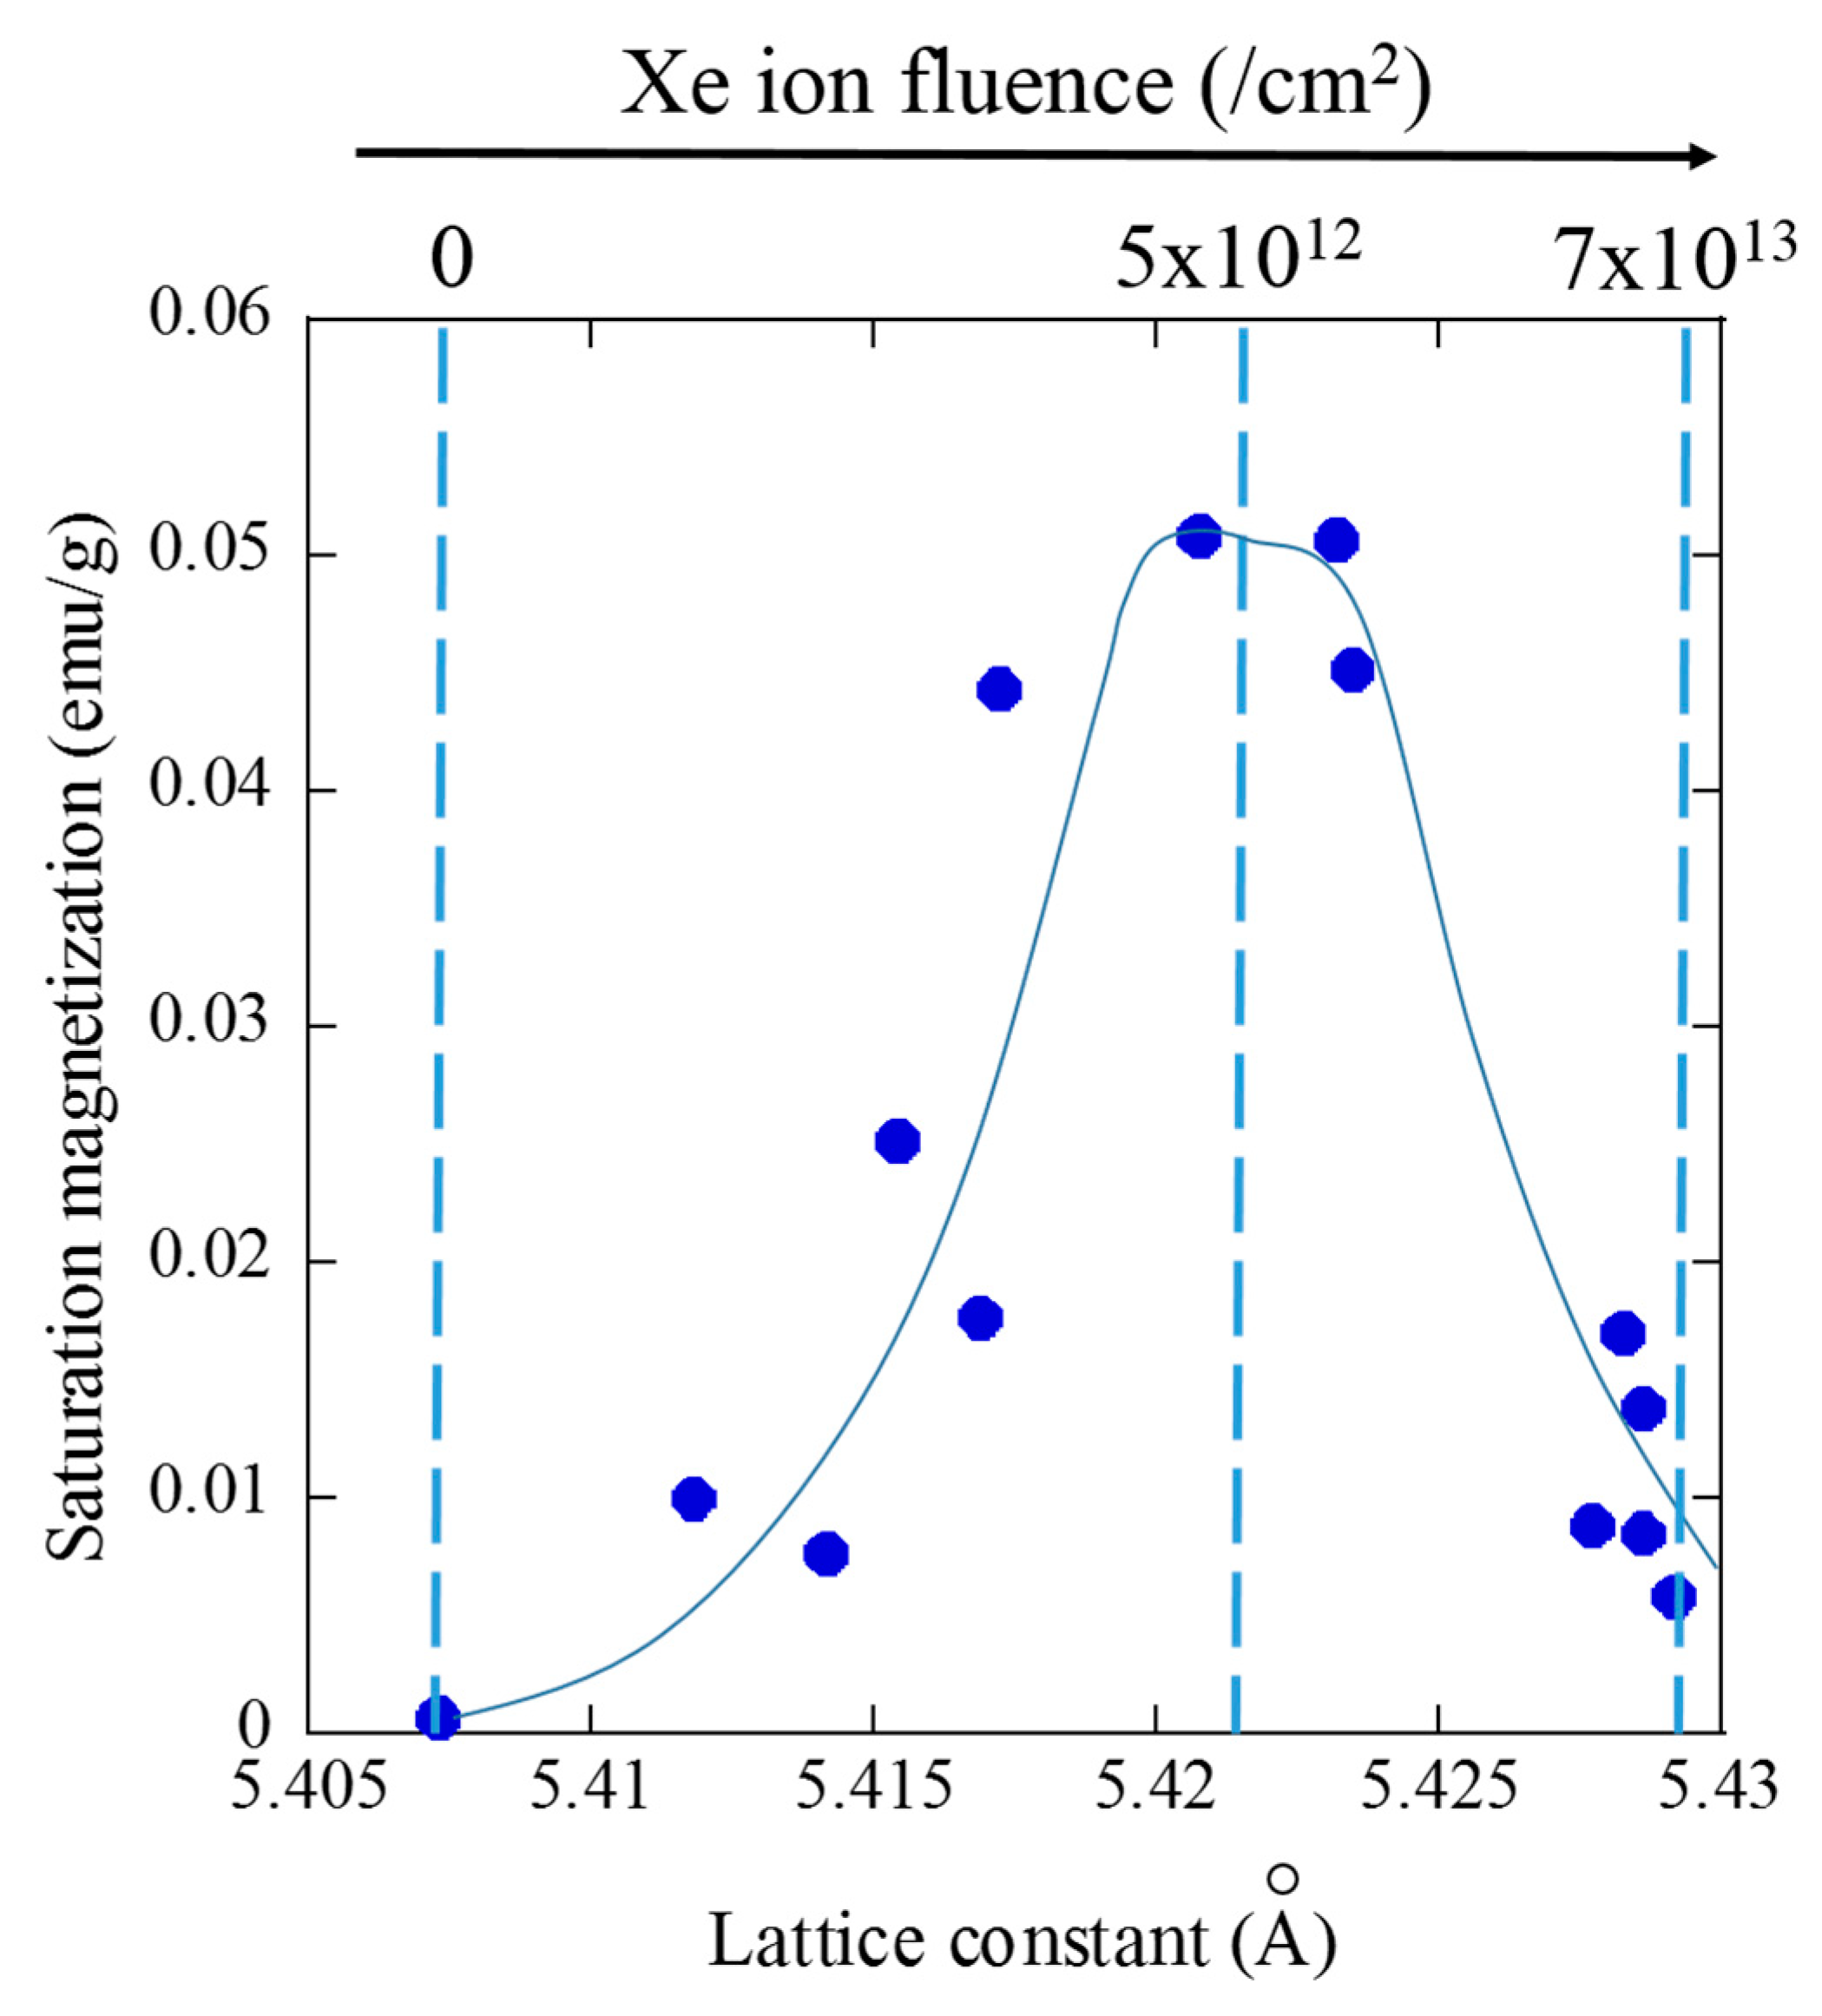
4.2. Analysis of Ion Fluence Dependence of a Lattice Constant for CeO2 by using the Poisson Law

Figure 7 shows that the experimental result on the ion fluence dependence of lattice constant, L(ϕ), can be fitted well by using the following function.
L ( ϕ ) = ( L 1 L 0 ) × ( 1 exp ( S ϕ ) ) + L 0
where L0 is the lattice constant outside the ion-tracks, L1 is the lattice constant inside the ion-track, S is the cross section of each ion track, and ϕ is the ion fluence. The value of L0 is the same as the lattice constant for the un-irradiated specimen (5.407 Å). As best fitting parameters, the values of L1 = 5.429 Å and S = 1.7 × 10⁻¹³/cm2 have been used. The good fitting of the experimental result by using the Poisson law means that the lattice constant inside the ion-track is not affected by overlapping ion-tracks. Figure 8 explains this situation. The lattice constant for the double impact region, triple impact region, and more is the same as that for the single impact region. This is similar to the case of the amorphous tracks. From the following equation,
D = 4 S / π
The diameter, D, of the ion-track in which the lattice constant increases is estimated to be 4.7 nm.

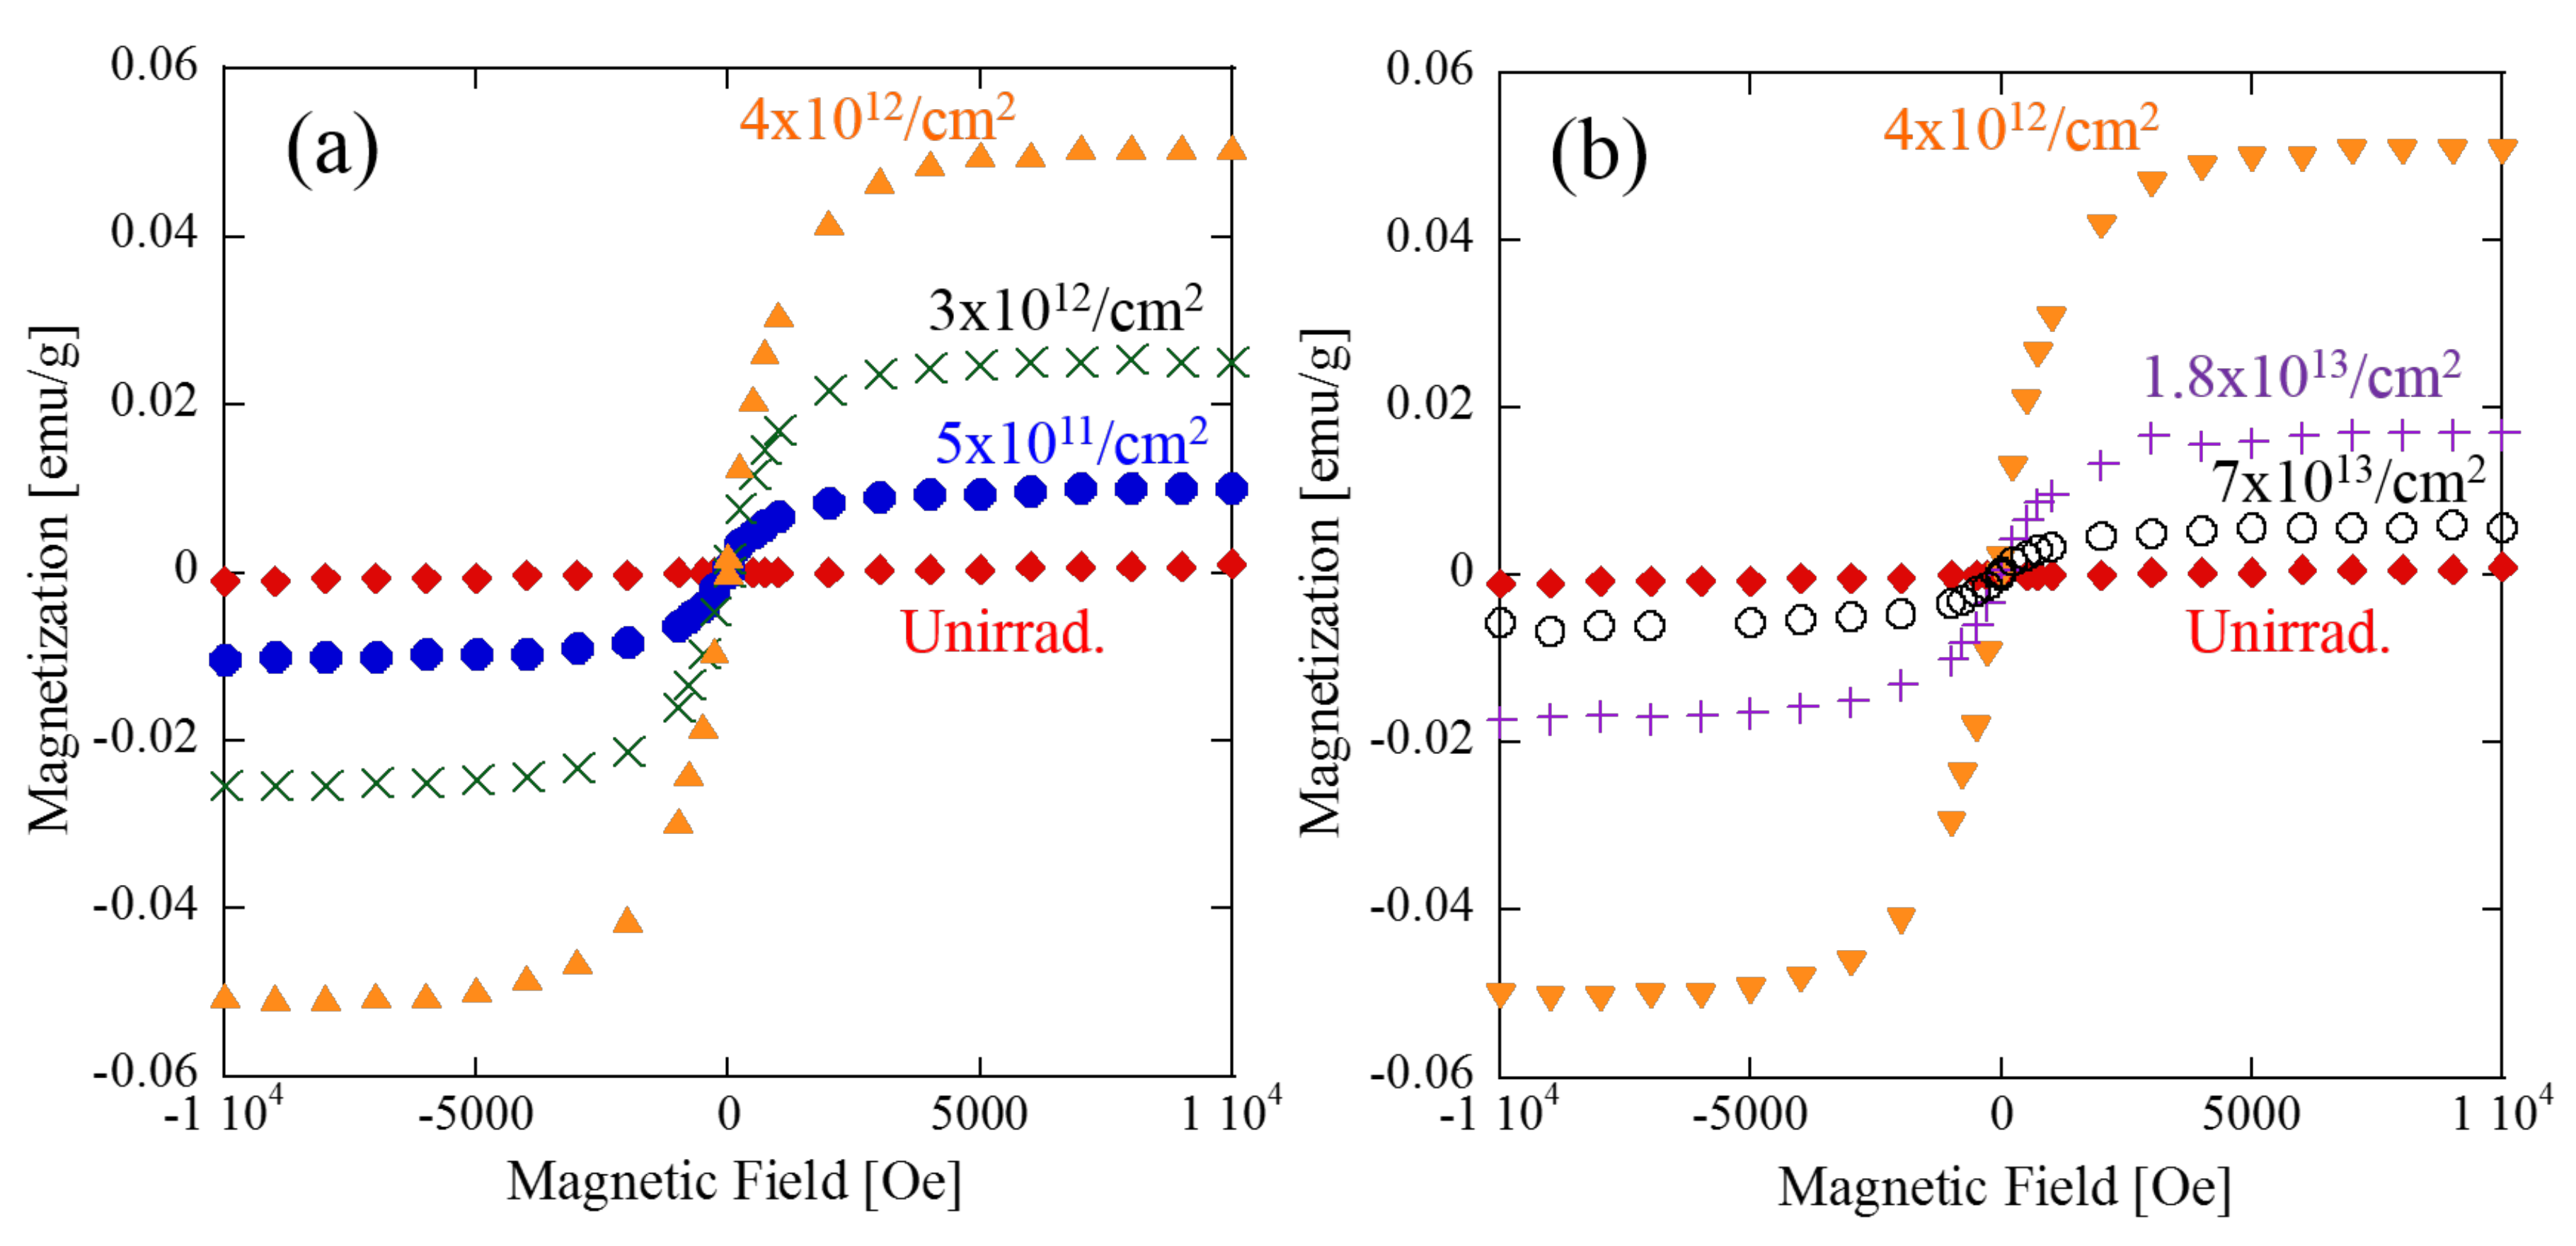
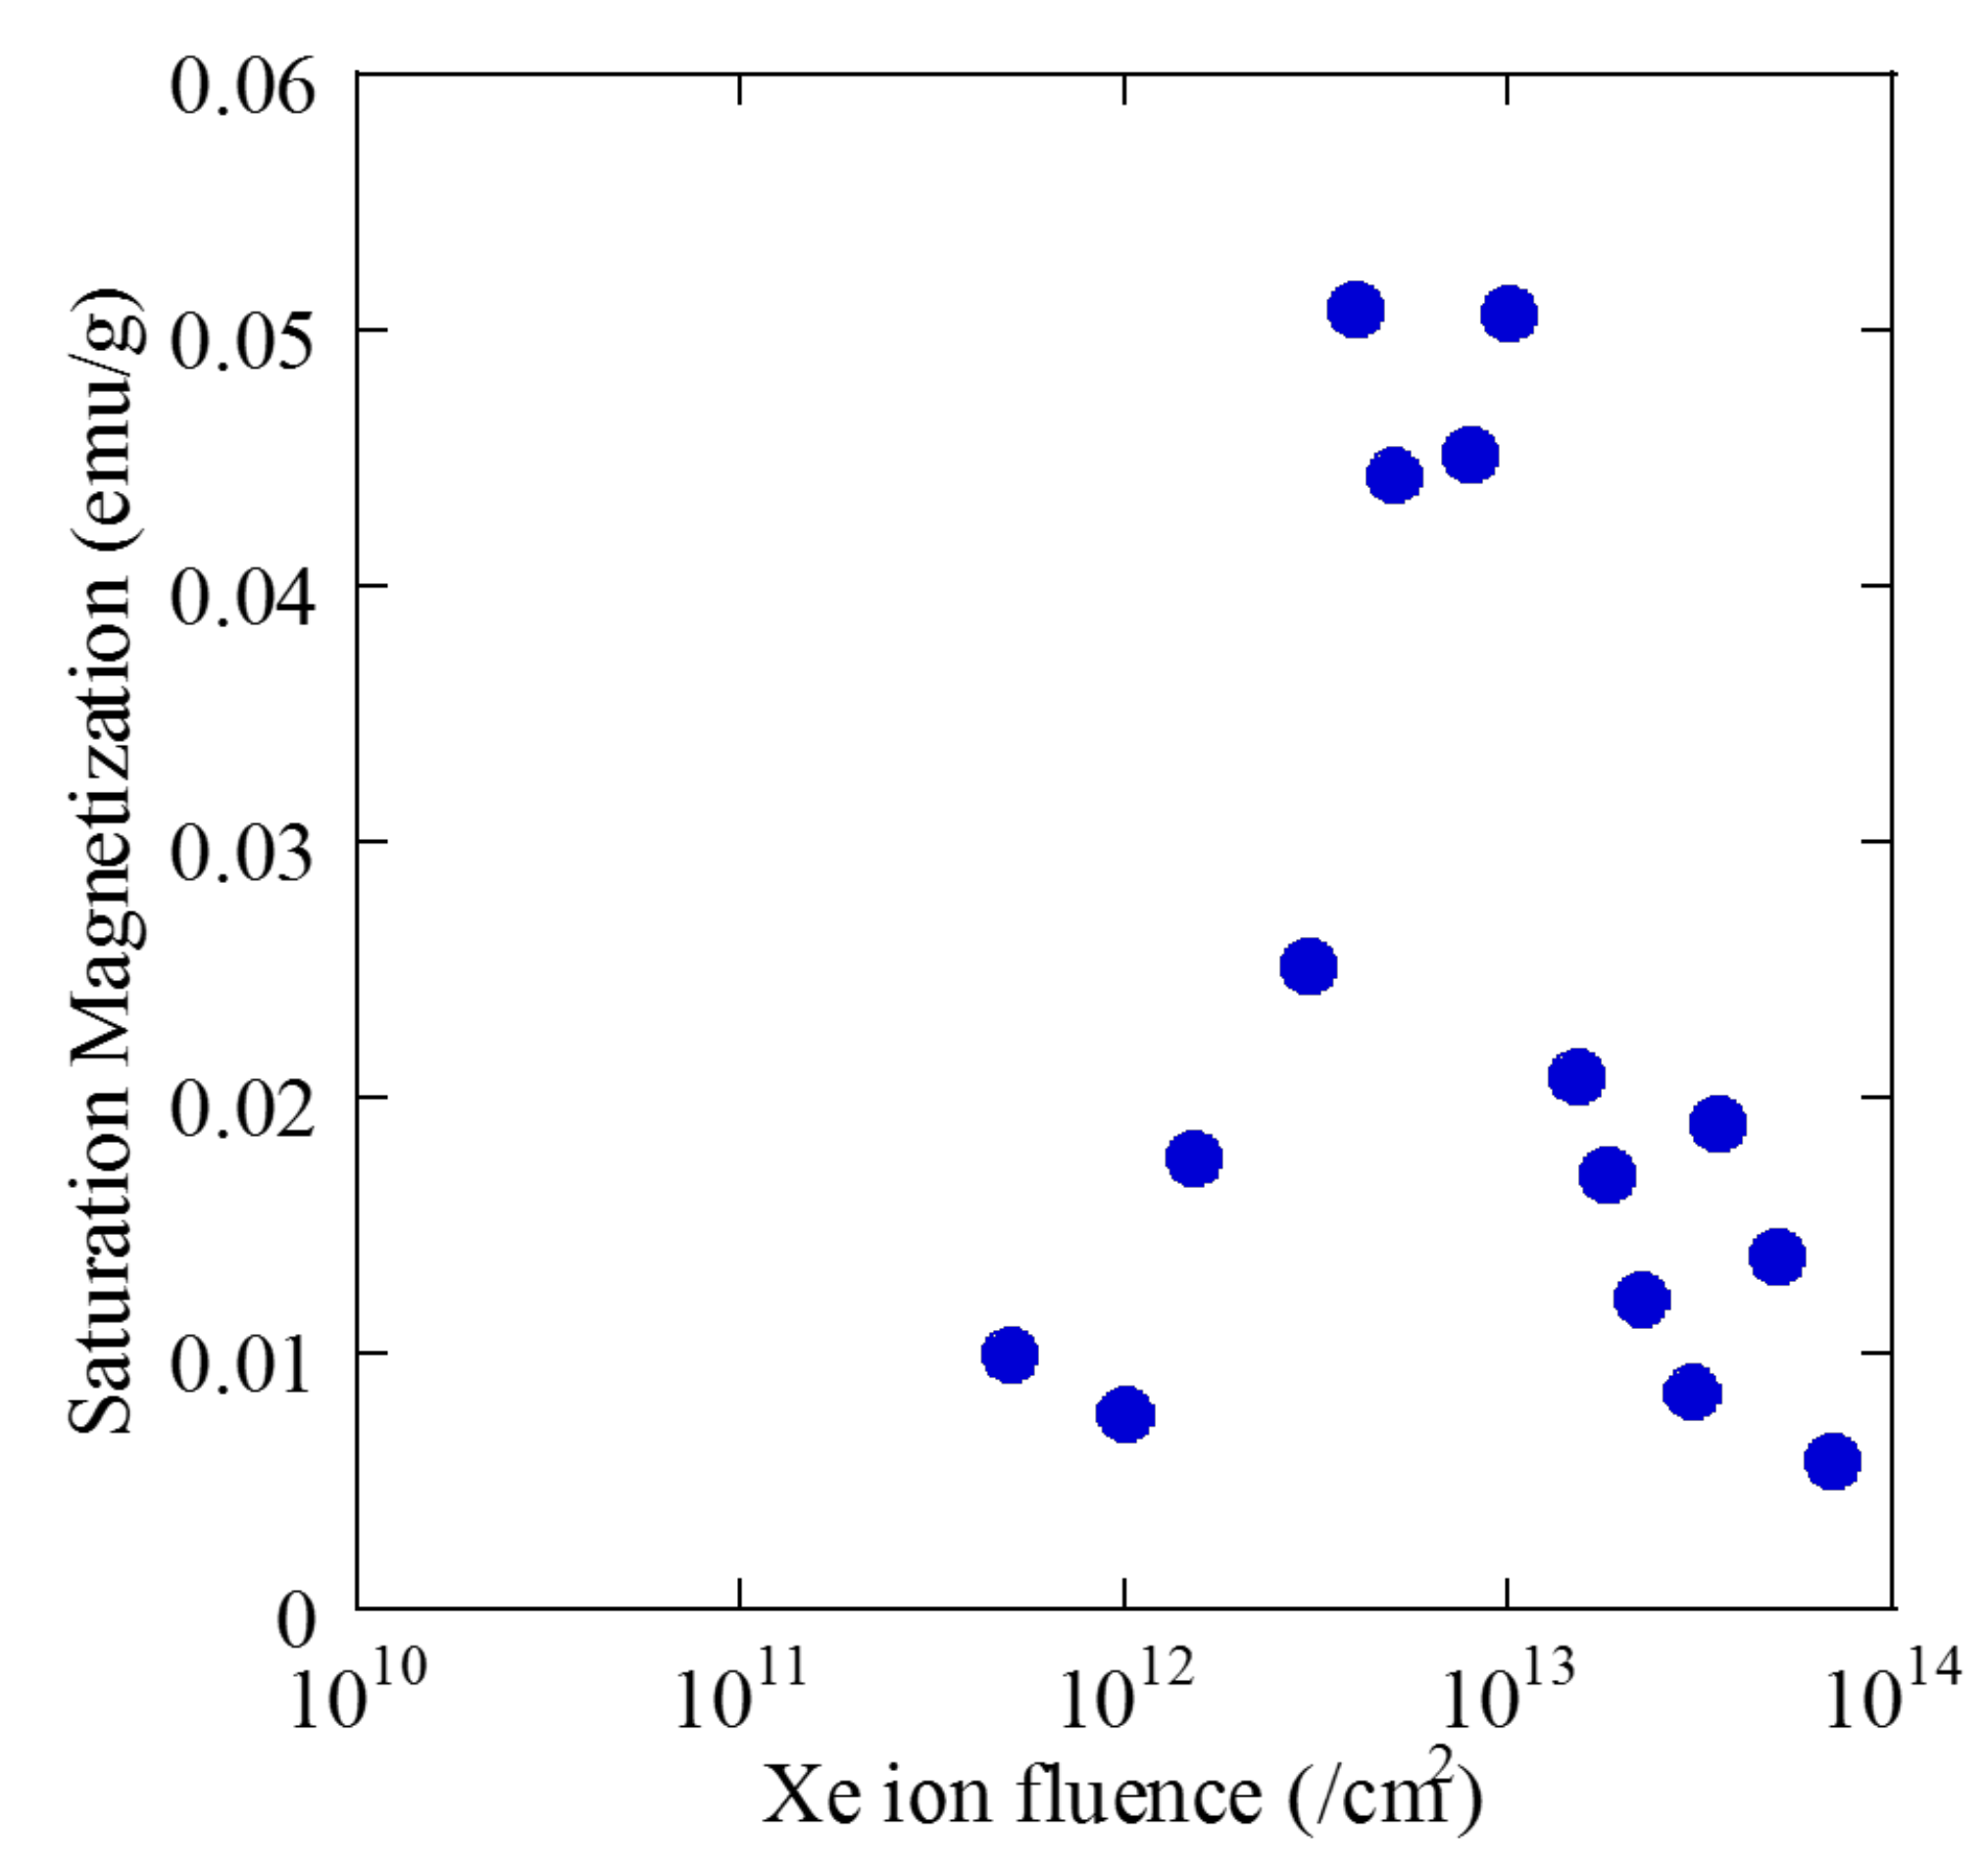
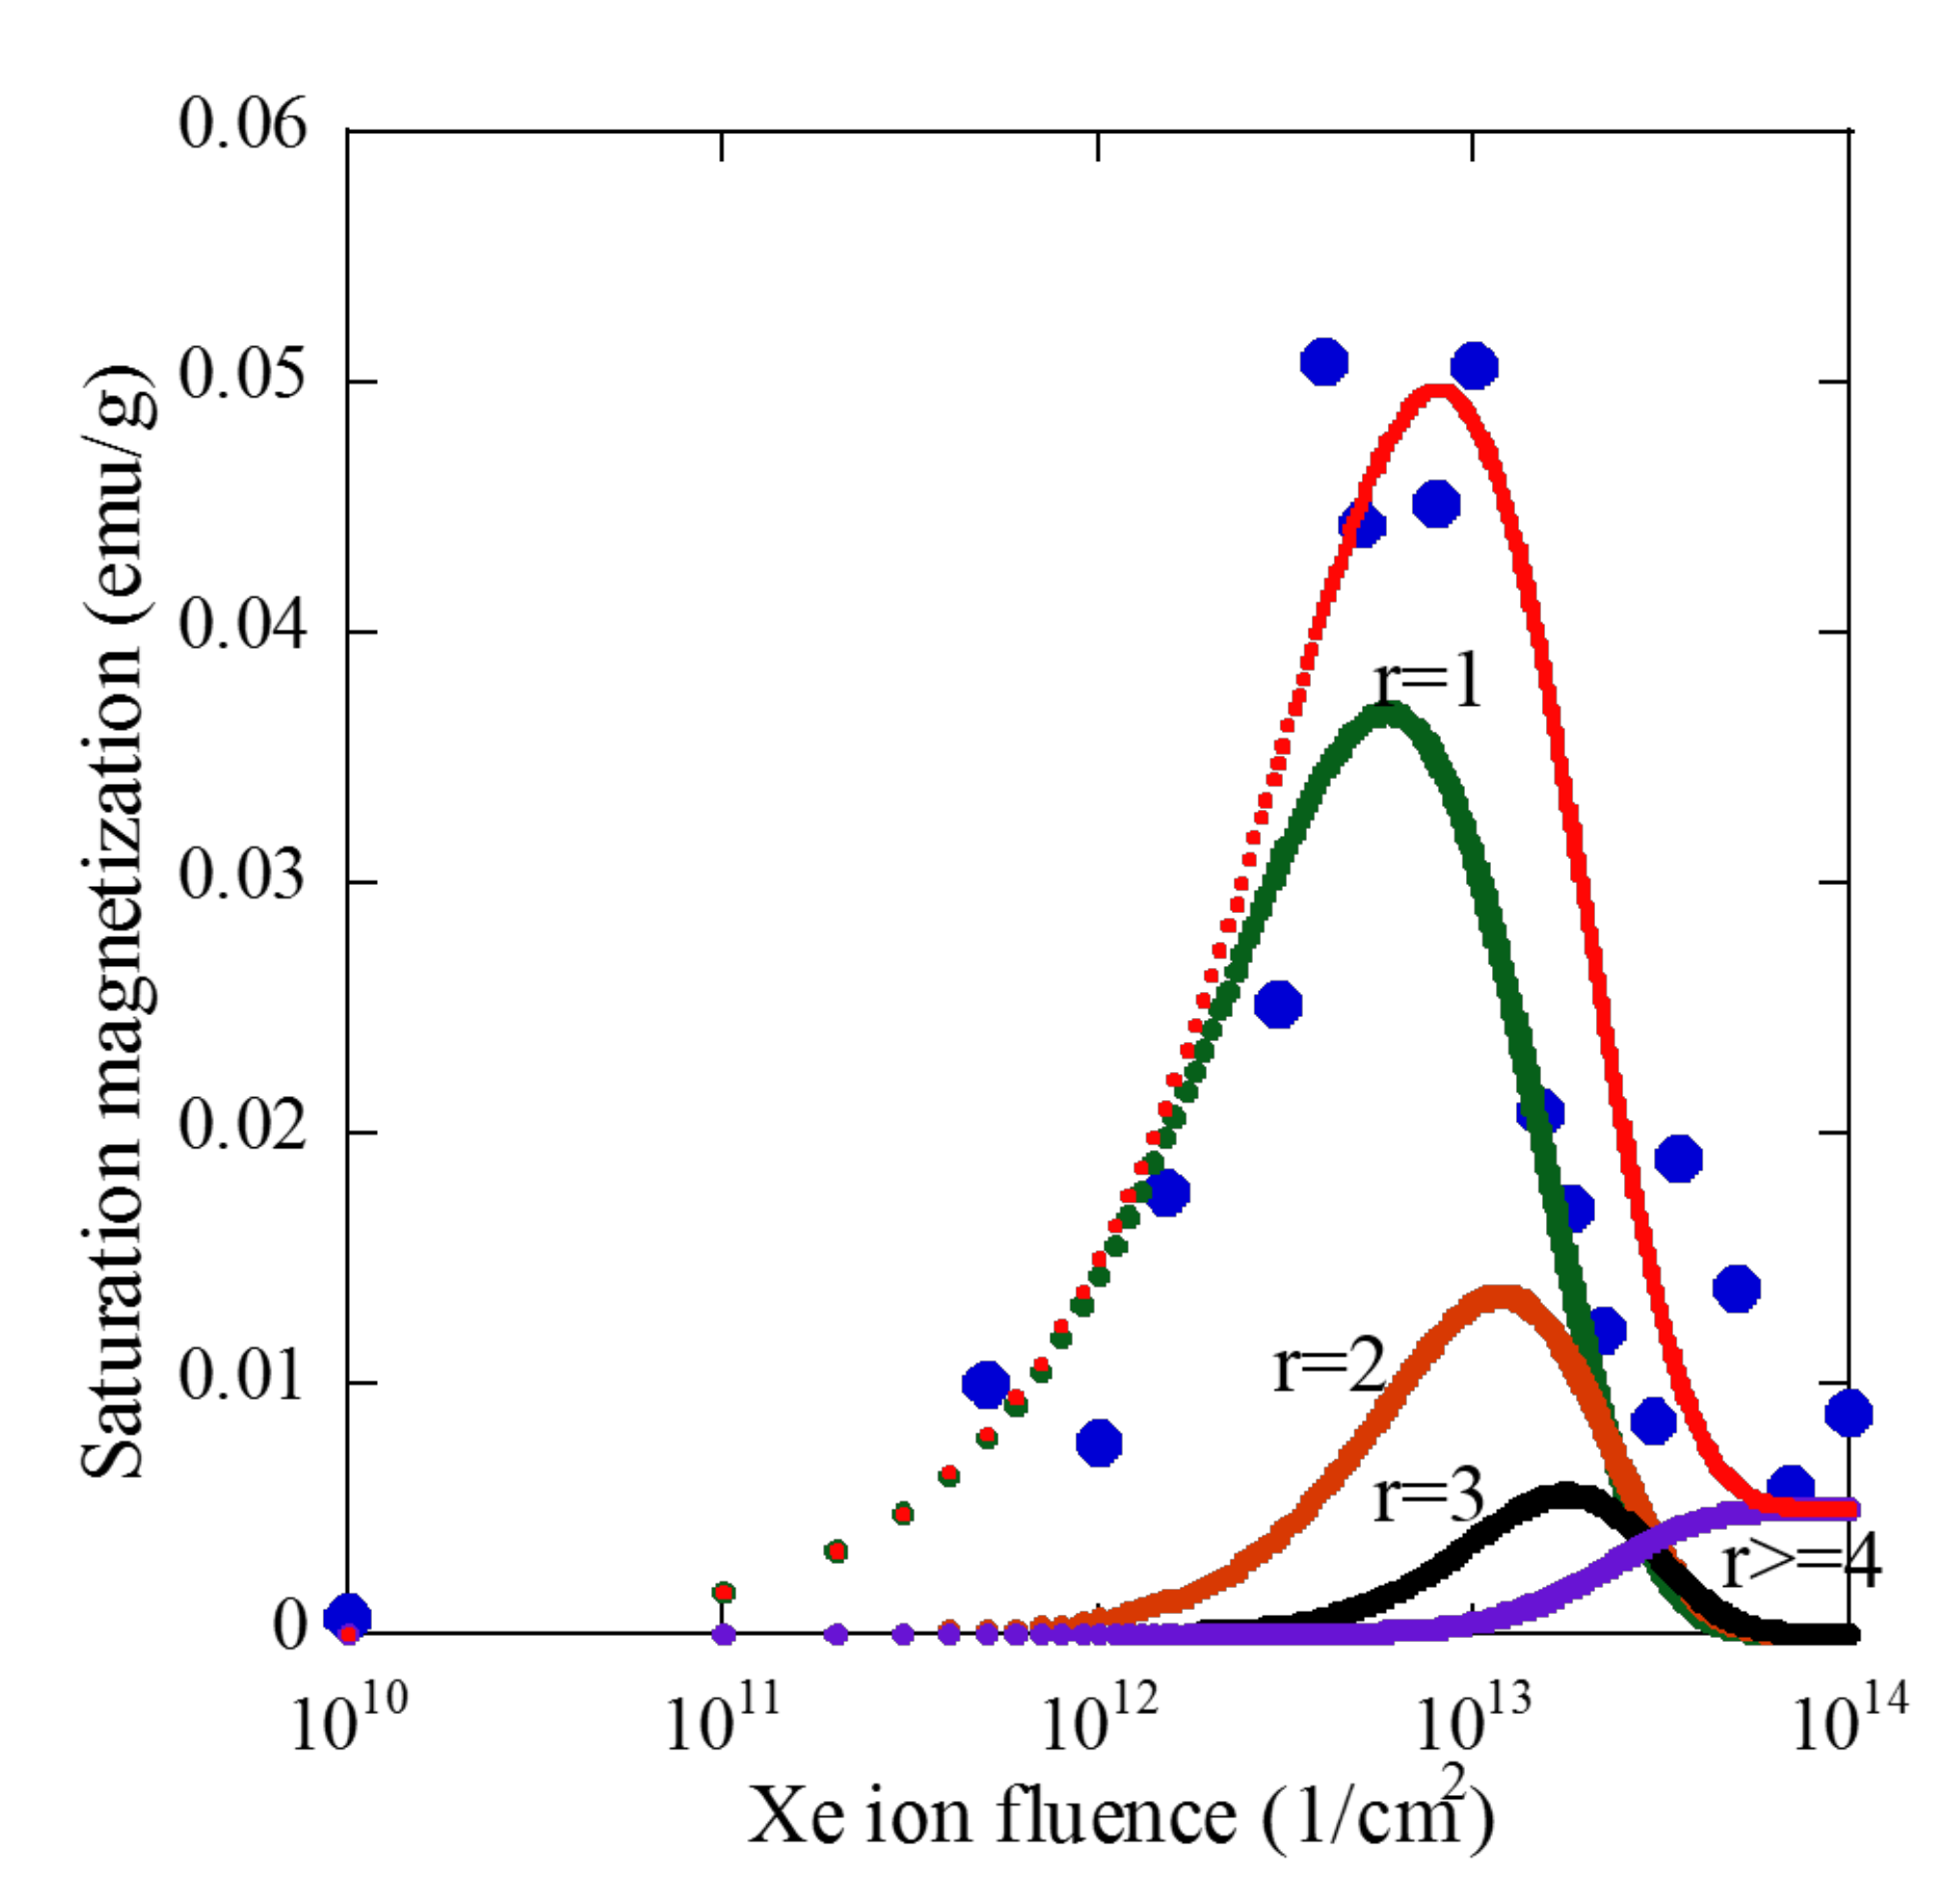
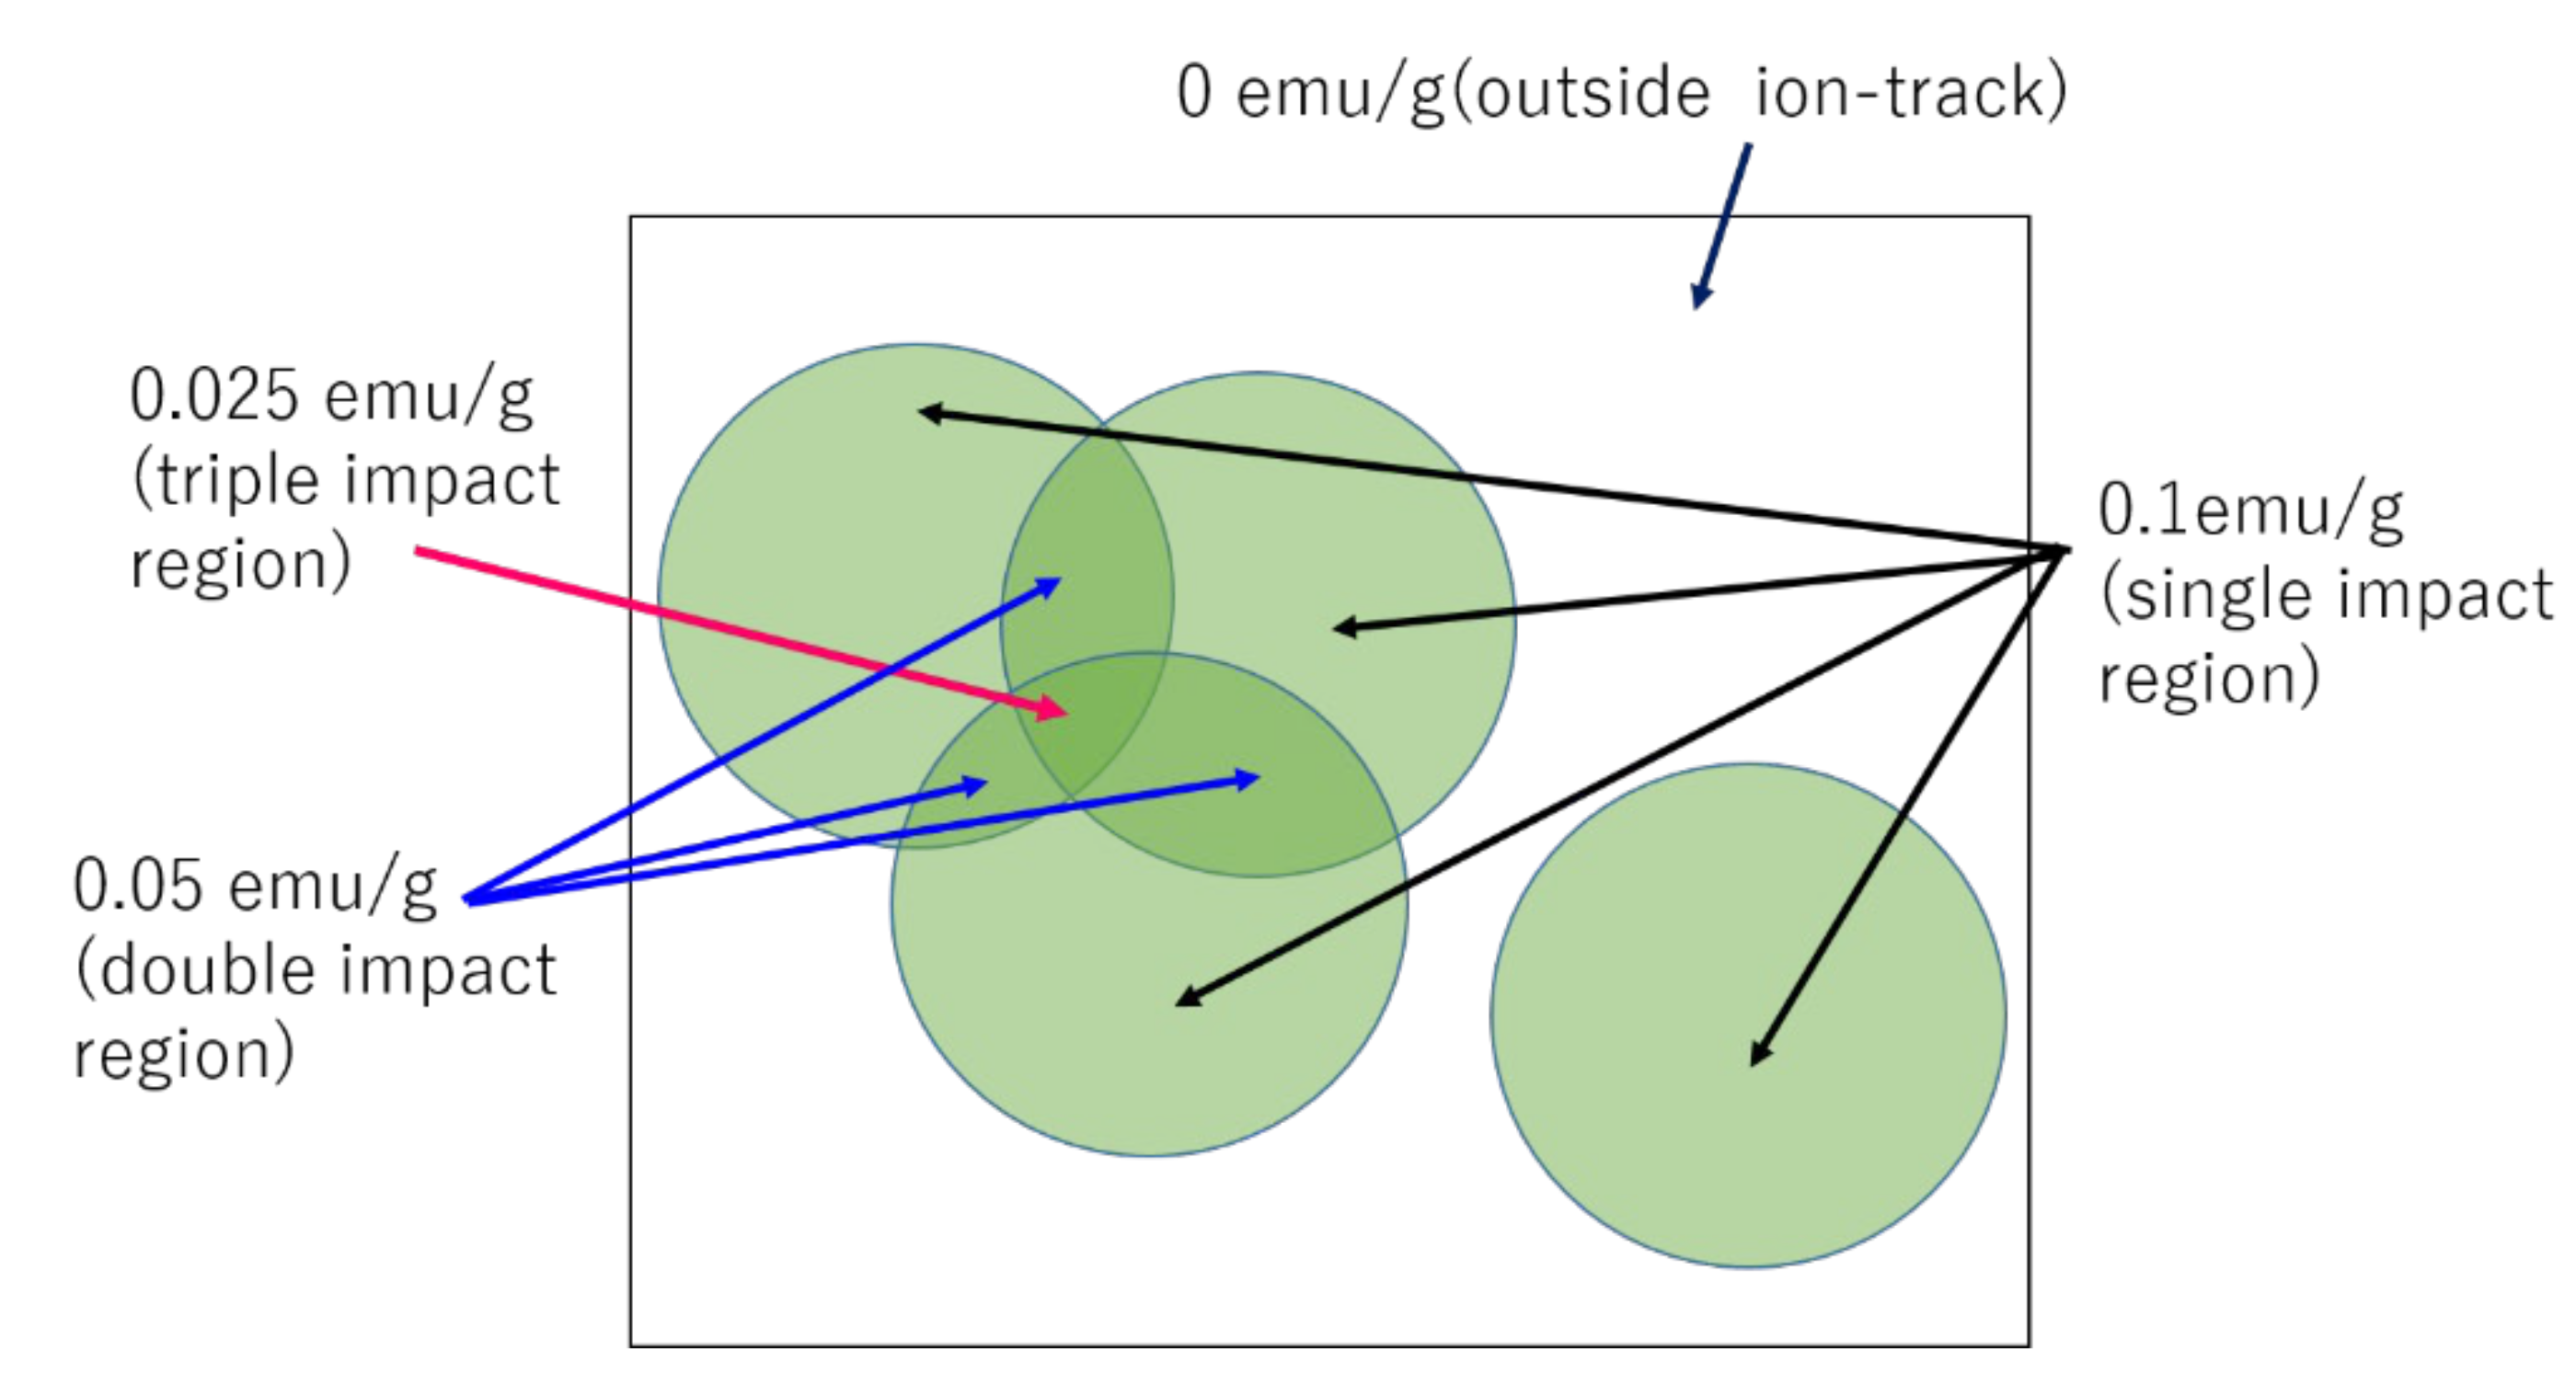
4.3. Analysis of Ion Fluence Dependence of Saturation Magnetization for CeO2 by Using the Poisson Distribution Function

For low Xe ion fluences, the saturation magnetization increases with increasing the ion fluence, which is similar to the case of a lattice constant change. This result means that the finite magnetization appears inside the ion-track, and the increase in the number of ion tracks causes the increase in the observed magnetization. For higher ion fluences, however, unlike in the case of a lattice constant, the saturation magnetization decreases with increasing the ion fluence. With increasing the ion fluence (or the number of ion tracks), the probability of ion-track overlapping increases. Therefore, this ion fluence dependence implies that the ion-track overlapping decreases the magnetization inside the ion-tracks. For the analysis of the experimental result (Figure 5), we assume the following overlapping effect on the magnetization inside the ion-track. The value of the saturation magnetization is M1 in the region of a single impact (non-overlapped region, r = 1), M2 for the double impact region (r = 2), M3 for the triple impact region (r = 3), and M4 for more than three times the impact regions (r >= 4). Outside the ion-tracks (r = 0), the value of the irradiation-induced magnetization, M0, is zero. According to the Poisson distribution function (Equation (2)), each area, A(ϕ,r), is given by the following equations.
A ( ϕ , 0 ) = exp ( S ϕ )   for   outside   of   ion - tracks
A ( ϕ , 1 ) = ( S ϕ ) exp ( S ϕ )   for   sin gle   impact
A ( ϕ , 2 ) = ( S ϕ ) 2 2 exp ( S ϕ )   for   double   impact
A ( ϕ , 3 ) = ( S ϕ ) 3 6 exp ( S ϕ )   for   triple   impact
A ( ϕ , r > = 4 ) = 1 r = 0 3 A ( ϕ , r )   for   more   than   three   times   impact
In this case, the symbol, n, is replaced with ϕ, which is a common symbol for the ion fluence. Equation (7e) can be deduced by using Equation (3). The value, which is measured as the irradiation-induced saturation magnetization, M(ϕ), is, therefore, given as:
M ( ϕ ) = M 1 A ( ϕ , 1 ) + M 2 A ( ϕ , 2 ) + M 3 A ( ϕ , 3 ) + M 4 A ( ϕ , r > = 4 )
To compare the experimental result (Figure 5) with Equation (8), four parameters of M1, M2, M3, and M4 have to be determined. Up to the present, the best parameters for the curve fitting with the experimental result are M1 = 0.1, M2 = 0.05, M3 = 0.025, and M4 = 0.005. From the lattice constant measurement, the value of S has already been determined as 1.7 × 10⁻¹³/cm2. By using such parameters and Equation (8), the values of M(ϕ) were calculated and are compared with the experimental result in Figure 9. In the figure, the contribution to the total magnetization from each area (r = 1, 2, 3, and >=4) is also plotted.
Figure 10 shows the schematic drawing of the effect of ion-track overlapping on the irradiation-induced magnetization.

5. Discussion

In Section 4, we have shown that the Xe fluence dependence of the irradiation-induced lattice expansion and the magnetization can be reproduced by using the Poisson distribution function. For the lattice expansion, the fitting parameters (S and L1) can be easily decided and the penetration depth of Cu Kα X-ray is much smaller than the range of 200 MeV Xe ion in CeO2. Therefore, the result of the XRD can provide the exact information about ion track structures, and, as can be seen in Figure 7, the calculated curve is well-fitted with the experimental result. On the other hand, the SQUID magnetometer measures the whole magnetic moment of the specimen, and the experimental result for the irradiation-induced magnetization shows the average value from the surface to the range of the 200 MeV Xe ion. The electronic stopping power of the Xe ion, and then the ion-track diameter largely varies until the ion stops near the ion range. Although the present analysis for the irradiation-induced magnetization can explain the trend of the ion fluence dependence, the parameters of Mi (i = 1–4) remain as roughly estimated values. In order to obtain more exactly the data for the one-dimensional magnetic track structures and their overlapping effect in swift heavy ion-irradiated specimens, we have to use thin specimens in which the thickness is much smaller than the ion range, or perform the XMCD (X-ray magnetic circular dichroism) measurements at synchrotron radiation facilities. The XMCD measurement detects the magnetic states near a specimen surface. We will perform such experiments in the near future.
Lastly, we will discuss the relationship between the lattice structure and the magnetic state inside the ion-tracks. Figure 11 shows the correlation of the lattice constant with the FWHM (full width half maximum) of the (331) XRD peaks. The upper axis of the figure represents the ion fluence. The value of FWHM corresponds to the degree of lattice disordering. Below the ion fluence of 5 × 10¹²/cm2, the lattice constant increases with increasing the ion fluence. However, the value of FWHM rarely changes. Above the ion fluence of 5 × 10¹²/cm2, the lattice constant still increases and tends to be saturated (see also Figure 3), and the value of FWHM rapidly increases with increasing the ion fluence (and also the lattice constant). Figure 12 shows that, below the ion fluence of 5 × 10¹²/cm2, the saturation magnetization rises when increasing the lattice constant and ion fluence. However, above the ion fluence of 5 × 10¹²/cm2, the saturation magnetization decreases with increasing the lattice constant and the ion fluence (see Figure 5). Figure 11 and Figure 12 clearly show that the increase in irradiation-induced magnetization for lower ion fluences is correlated with the increase in the lattice constant. The decrease in irradiation-induced magnetization for higher ion fluences is attributed to the lattice disordering.
Schwab et al. have shown that oxygen vacancies in CeO2 contribute to the increase in the lattice constant because of the mutual repulsion of Ce cations around oxygen vacancies [16]. Takaki and Yasuda have revealed by HAADF (High-Angle Annular Dark-Field) and ABF(Annular Bright Field)-STEM (Scanning Transmission Electron Microscopy) observations that the crystal structure is retained, but oxygen sublattice disordering and the formation of oxygen vacancies occur inside the non-overlapped ion tracks in CeO2 irradiated with 200 MeV Xe ions [8,9]. The disordering of oxygen sublattice inside the ion-track of CeO2 has also been confirmed by the MD (molecular dynamics) calculation [17]. Through the EXAFS (extended X-ray absorption fine structure) measurement near the Ce-K absorption edge, Ohno et al. have shown that the atomic arrangement of oxygen atoms around Ce atoms is disordered by 200 MeV Xe ion irradiation [18]. When oxygen vacancies are produced in CeO2 lattice, the valence state of Ce atoms near the oxygen vacancies changes from +4 to +3 as a result of the charge balance. The appearance of Ce3+ charge state in CeO2 irradiated with 200 MeV Xe ions has been observed by the XPS (X-ray photoelectron spectroscopy) measurement [19]. Iwasawa et al. have shown, by the first principles calculation for the CeO2 supercell including oxygen vacancies and interstitials, that electrons are localized at Ce atoms near the oxygen vacancies, which causes the appearance of Ce3+ valence state [20]. The change in valence state from Ce4+ to Ce3+ induces an unpaired 4f electron at each Ce3+ atom. From the present experimental result and the previous results mentioned above, we can arrive at a conclusion that unpaired electrons localized near Ce3+ atoms likely contribute to the irradiation-induced ferromagnetic state, and such a ferromagnetic state is gradually destroyed by the lattice disordering, which is caused by the overlapping of ion-tracks.

6. Summary

The lattice expansion and the ferromagnetic state of CeO2 were induced by 200 MeV Xe ion irradiation. The experimental results were analyzed by using the Poisson distribution function. The analysis has shown that the irradiation-induced lattice expansion inside the ion-tracks is not affected by the overlapping of ion-tracks. The irradiation-induced ferromagnetic state inside the ion-tracks is gradually destroyed by the lattice disordering due to the accumulation of the ion-track overlapping. The present result shows that the Poisson distribution function is useful for the analysis of ion-track overlapping effects in materials irradiated with swift heavy ions.

Author Contributions

Specimen preparation, XRD (X-ray diffraction), and SQUID (superconducting quantum interference device) measurements, Y.Y. Ion irradiation, N.I. Data analysis, Y.Y. and A.I. Writing—original draft preparation, Y.Y and A.I. Writing—review and editing, N.I and F.H. All authors have read and agreed to the published version of the manuscript.

Funding

This research received no external funding.

Acknowledgments

The present study has been carried out under a collaboration between Osaka Prefecture University and Nuclear Science Research Center, Japan Atomic Energy Agency (JAEA-Tokai). The authors thank the technical staff of the accelerator division of JAEA-Tokai.

Conflicts of Interest

The authors declare no conflict of interest.

References

  1. Shimizu, K.; Kosugi, S.; Tahara, Y.; Yasunaga, K.; Kaneta, Y.; Ishikawa, N.; Hori, F.; Matsui, T.; Iwase, A. Change in magnetic properties induced by swift heavy ion irradiation in CeO2. Nucl. Istrum. Methods 2012, 286, 291–294. [Google Scholar] [CrossRef]
  2. Zhou, S.; Cizmar, E.; Potzger, K.; Krause, M.; Talut, G.; Helm, M.; Fassbender, J.; Zvyagin, S.A.; Wosnitza, J.; Schmidt, H. Origin of magnetic moments in defective TiO2 single crystals. Phys. Rev. B 2009, 79, 113201. [Google Scholar] [CrossRef] [Green Version]
  3. Coey, J.M.D.; Venkatesan, M.; Stamenov, P.; Fitzgerald, C.B.; Dorneles, L.S. Magnetism in hafnium dioxide. Phys. Rev. B 2005, 72, 024450. [Google Scholar] [CrossRef] [Green Version]
  4. Fernandes, V.; Massanek, R.J.O.; Schio, P.; Klein, J.J.; de Oliveira, A.J.A.; Ortiz, W.A.; Mattoso, N.; Varalda, J.; Schreiner, W.H.; Abbate, M.; et al. Dilute-Defect magnetism: Origin of magnetism in nanocrystalline CeO2. Phys. Rev. B 2009, 80, 035202. [Google Scholar] [CrossRef]
  5. Fernandes, V.; Schio, P.; de Oliveira, A.J.A.; Ortiz, W.A.; Fichtner, P.; Amaral, L.; Graff, I.L.; Varalda, J.; Mattoso, N.; Schreiner, W.H.; et al. Ferromagnetism induced by oxygen and cerium vacancies above the percolation limit in CeO2. J. Phys. Condens. Matter 2010, 22, 216004. [Google Scholar] [CrossRef] [PubMed]
  6. Wen, Q.-Y.; Zhang, H.-W.; Song, Y.-Q.; Yang, Q.-H.; Zhu, H.; Xiao, J.Q. Room-Temperature ferromagnetism in pure and Co doped CeO2 powders. J. Phys. Condens. Matter 2007, 19, 246205. [Google Scholar] [CrossRef] [PubMed]
  7. Liu, Y.; Lockman, Z.; Aziz, A.; MacManus-Driscoll, J. Size dependent ferromagnetism in cerium oxide (CeO2) nanostructures independent of oxygen vacancies. J. Phys. Condens. Matter 2008, 20, 165201. [Google Scholar] [CrossRef]
  8. Takaki, S.; Yasuda, K.; Yamamoto, T.; Matsumura, S.; Ishikawa, N. Atomic structure of ion tracks in Ceria. Nucl. Instrum. Methods 2014, 326, 140–144. [Google Scholar] [CrossRef]
  9. Takaki, S.; Yasuda, K.; Yamamoto, T.; Matsumura, S.; Ishikawa, N. Structure of ion tracks in ceria irradiated with high energy xenon ions. Prog. Nucl. Energy 2016, 92, 306–312. [Google Scholar] [CrossRef]
  10. Ziegler, J. SRIM—The Stopping and Range of Ions in Matter. Available online: http://www/srim.org/ (accessed on 1 June 2020).
  11. Benyagoub, A.; Couvreur, F.; Bouffard, S.; Levesque, F.; Dufour, C.; Paumier, E. Phase transformation induced in pure zirconia by high energy heavy ion irradiation. Nucl. Instrum. Methods 2001, 175–177, 417–421. [Google Scholar] [CrossRef]
  12. Ishikawa, N.; Ohhara, K.; Ohta, Y.; Michikami, O. Binomial distribution function for intuitive understanding of fluence dependence of non-amorphized ion-track area. Nucl. Instrum. Methods 2010, 268, 3273–3276. [Google Scholar] [CrossRef]
  13. Szenes, G.; Havancsak, K.; Skuratov, V.; Hanak, P.; Zsoldos, L.; Ungar, T. Application of the thermal spike model to latent tracks induced in polymers. Nucl. Instrum. Methods 2000, 166–167, 933–937. [Google Scholar] [CrossRef]
  14. Chailley, V.; Dooryhee, E.; Bouffard, S.; Balanzat, E.; Levalois, M. Observations by X-ray diffraction of structural changes in mica irradiated by swift heavy ions. Nucl. Instrum. Methods 1994, 91, 162–167. [Google Scholar] [CrossRef]
  15. Ishikawa, N.; Yamamoto, S.; Chimi, Y. Structural changes in anatase TiO2 thin films irradiated with high-energy heavy ions. Nucl. Instrum. Methods 2006, 250, 250–253. [Google Scholar] [CrossRef]
  16. Schwab, R.G.; Steiner, R.A.; Mages, G.; Beie, H.-J. Properties of CeO2 and CeO2-x films Part II. High temperature properties. Thin Solid Films 1992, 207, 288–293. [Google Scholar] [CrossRef]
  17. Sasajima, Y.; Ajima, N.; Osada, T.; Ishikawa, N.; Iwase, A. Molecular dynamics simulation of fast particle irradiation on the single crystal CeO2. Nucl. Instrum. Methods 2013, 314, 202–207. [Google Scholar] [CrossRef]
  18. Ohno, H.; Iwase, A.; Matsumura, D.; Nishihata, Y.; Mizuki, J.; Ishikawa, N.; Baba, Y.; Hirao, N.; Sonoda, T.; Kinoshita, M. Study on effects of swift heavy ion irradiation in cerium dioxide using synchrotron radiation X-ray absorption spectroscopy. Nucl. Instrum. Methods 2008, 266, 3013–3017. [Google Scholar] [CrossRef]
  19. Iwase, A.; Ohno, H.; Ishikawa, N.; Baba, Y.; Hirao, N.; Sonoda, T.; Kinoshita, M. Study on the behavior of oxygen atoms in swift heavy ion irradiated CeO2 by means of synchrotron radiation X-ray photoelectron spectroscopy. Nucl. Instrum. Methods 2009, 267, 969–972. [Google Scholar] [CrossRef] [Green Version]
  20. Iwasawa, M.; Ohmura, T.; Chen, Y.; Kaneta, Y.; Geng, H.Y.; Iwase, A.; Kinoshita, M. First-Principles study on cerium ion behavior in irradiated cerium dioxide. J. Nucl. Mater. 2009, 393, 321–327. [Google Scholar] [CrossRef]
Figure 1. Widely scanned XRD spectra for unirradiated and irradiated CeO2 specimens. Xe ion fluences are shown at the right side of the figure.
Qubs 04 00026 g001
Figure 2. (331) XRD peaks for unirradiated and irradiated CeO2 specimens. Xe ion fluences are shown at the right side of the figure.
Qubs 04 00026 g002
Figure 3. Lattice constant of CeO2 as a function of Xe ion fluence.
Qubs 04 00026 g003
Figure 4. Magnetization-magnetic field (M-H) curves of CeO2 for various Xe ion fluences, (a) for lower fluences, the magnetization increases with increasing ion fluence, and, (b) for higher fluences, the magnetization decreases with increasing ion fluence.
Qubs 04 00026 g004
Figure 5. Saturation magnetization of CeO2 as a function of Xe ion fluence.
Qubs 04 00026 g005
Figure 6. Schematic drawing of ion-track overlapping. Number of ion tracks is n, and the number of ion-track impacts is r. (a) production of single ion-track, (b) overlapping of ion-tracks by the production of second ion-track, and (c) overlapping of ion-tracks by the production of third ion-track.
Qubs 04 00026 g006
Figure 7. Curve fitting of the Xe ion fluence dependence of lattice constant of CeO2 by using the Poisson law. Solid circles are experimental results and the solid line is the fitting curve.
Qubs 04 00026 g007
Figure 8. Schematic drawing of the effect of ion-track overlapping on the lattice constant.
Qubs 04 00026 g008
Figure 9. Saturation magnetization of CeO2 as a function of Xe ion fluence. Solid circles represent the experimental data, and the red curve is the result of calculation using Equation (8). Contribution to the magnetization from each area is also shown.
Qubs 04 00026 g009
Figure 10. Schematic drawing of the effect of ion-track overlapping on the irradiation-induced saturation magnetization.
Qubs 04 00026 g010
Figure 11. Correlation of lattice constant with FWHM (full width half maximum) of (331) XRD peaks. Xe ion fluence is also shown at the upper x-axis.
Qubs 04 00026 g011
Figure 12. Correlation of a lattice constant with saturation magnetization. Xe ion fluence is also shown at the upper x-axis.
Qubs 04 00026 g012

