In Situ Observation for Deformation-Induced Martensite Transformation (DIMT) during Tensile Deformation of 304 Stainless Steel Using Neutron Diffraction. PART I: Mechanical Response


Abstract
:1. Introduction
2. Materials and Methods
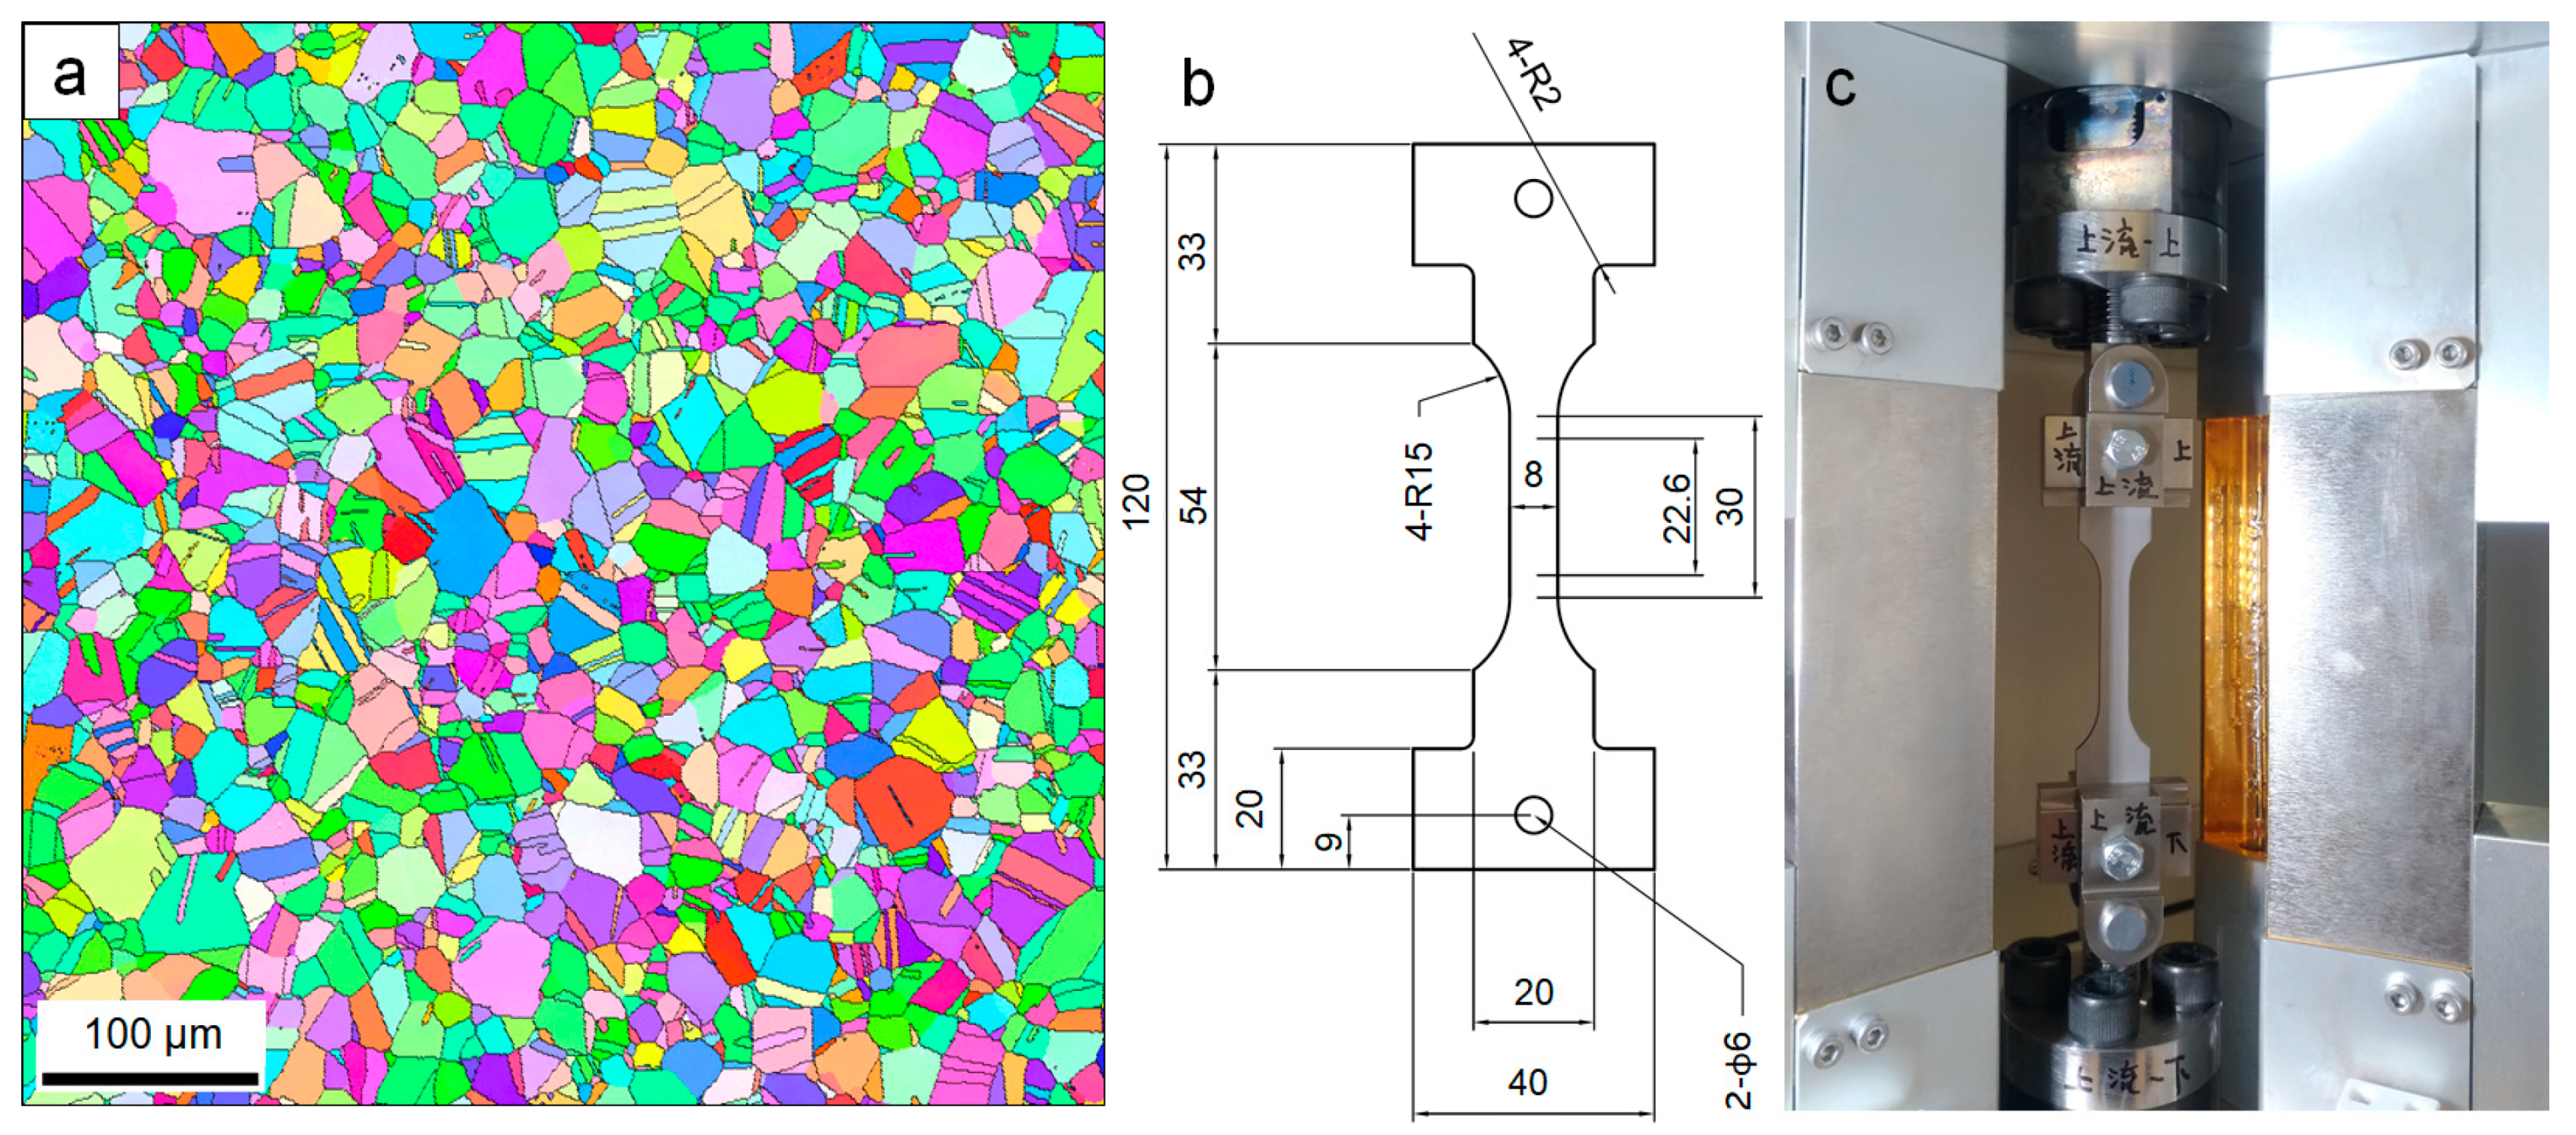
2.1. Materials
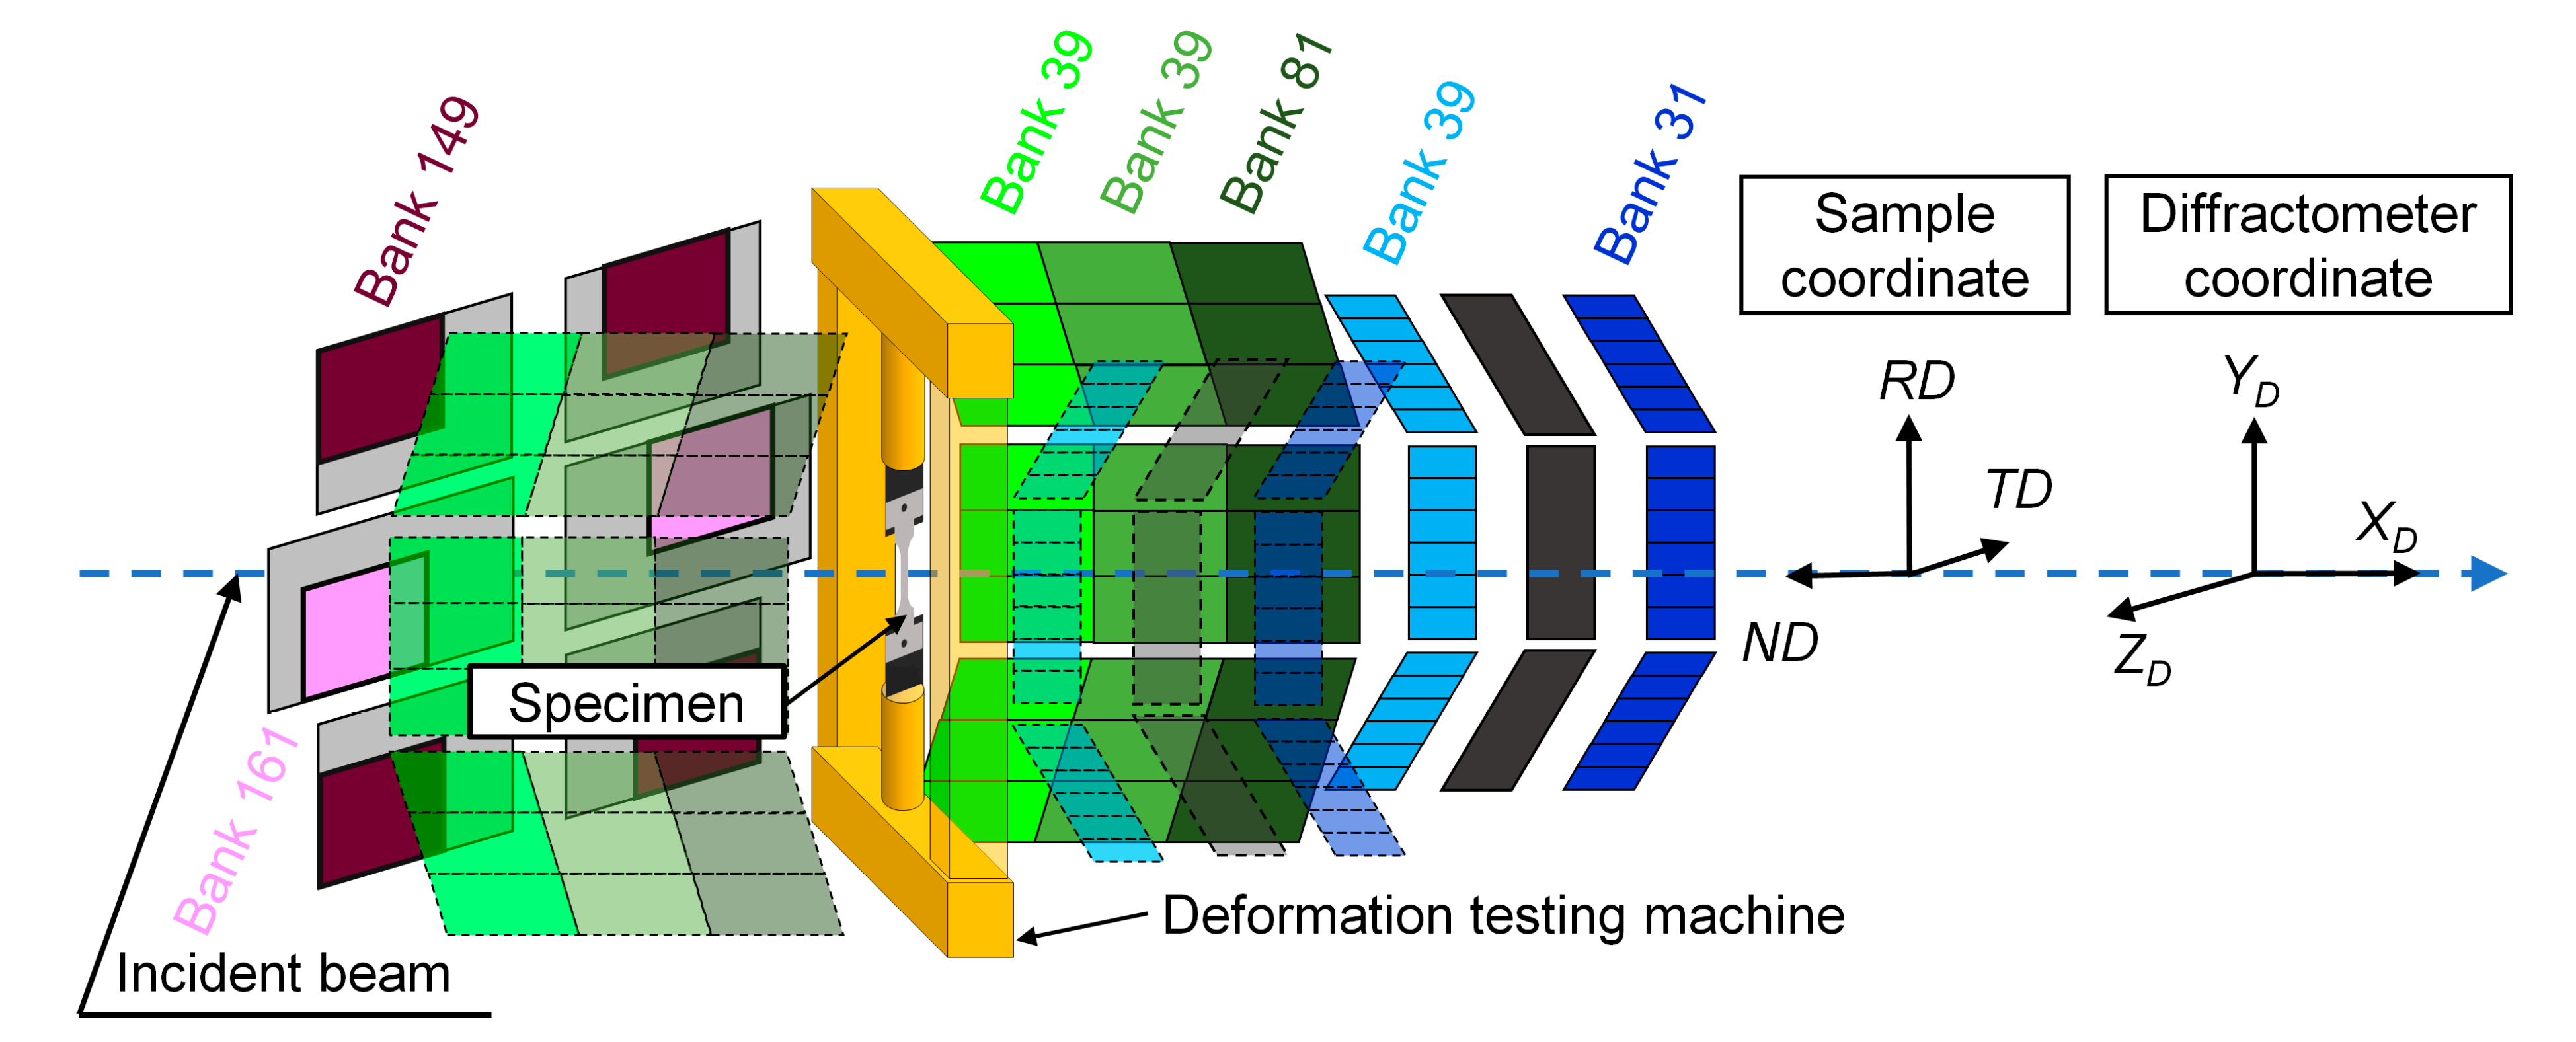
2.2. In Situ Neutron Diffraction Experiments
2.3. Analysis
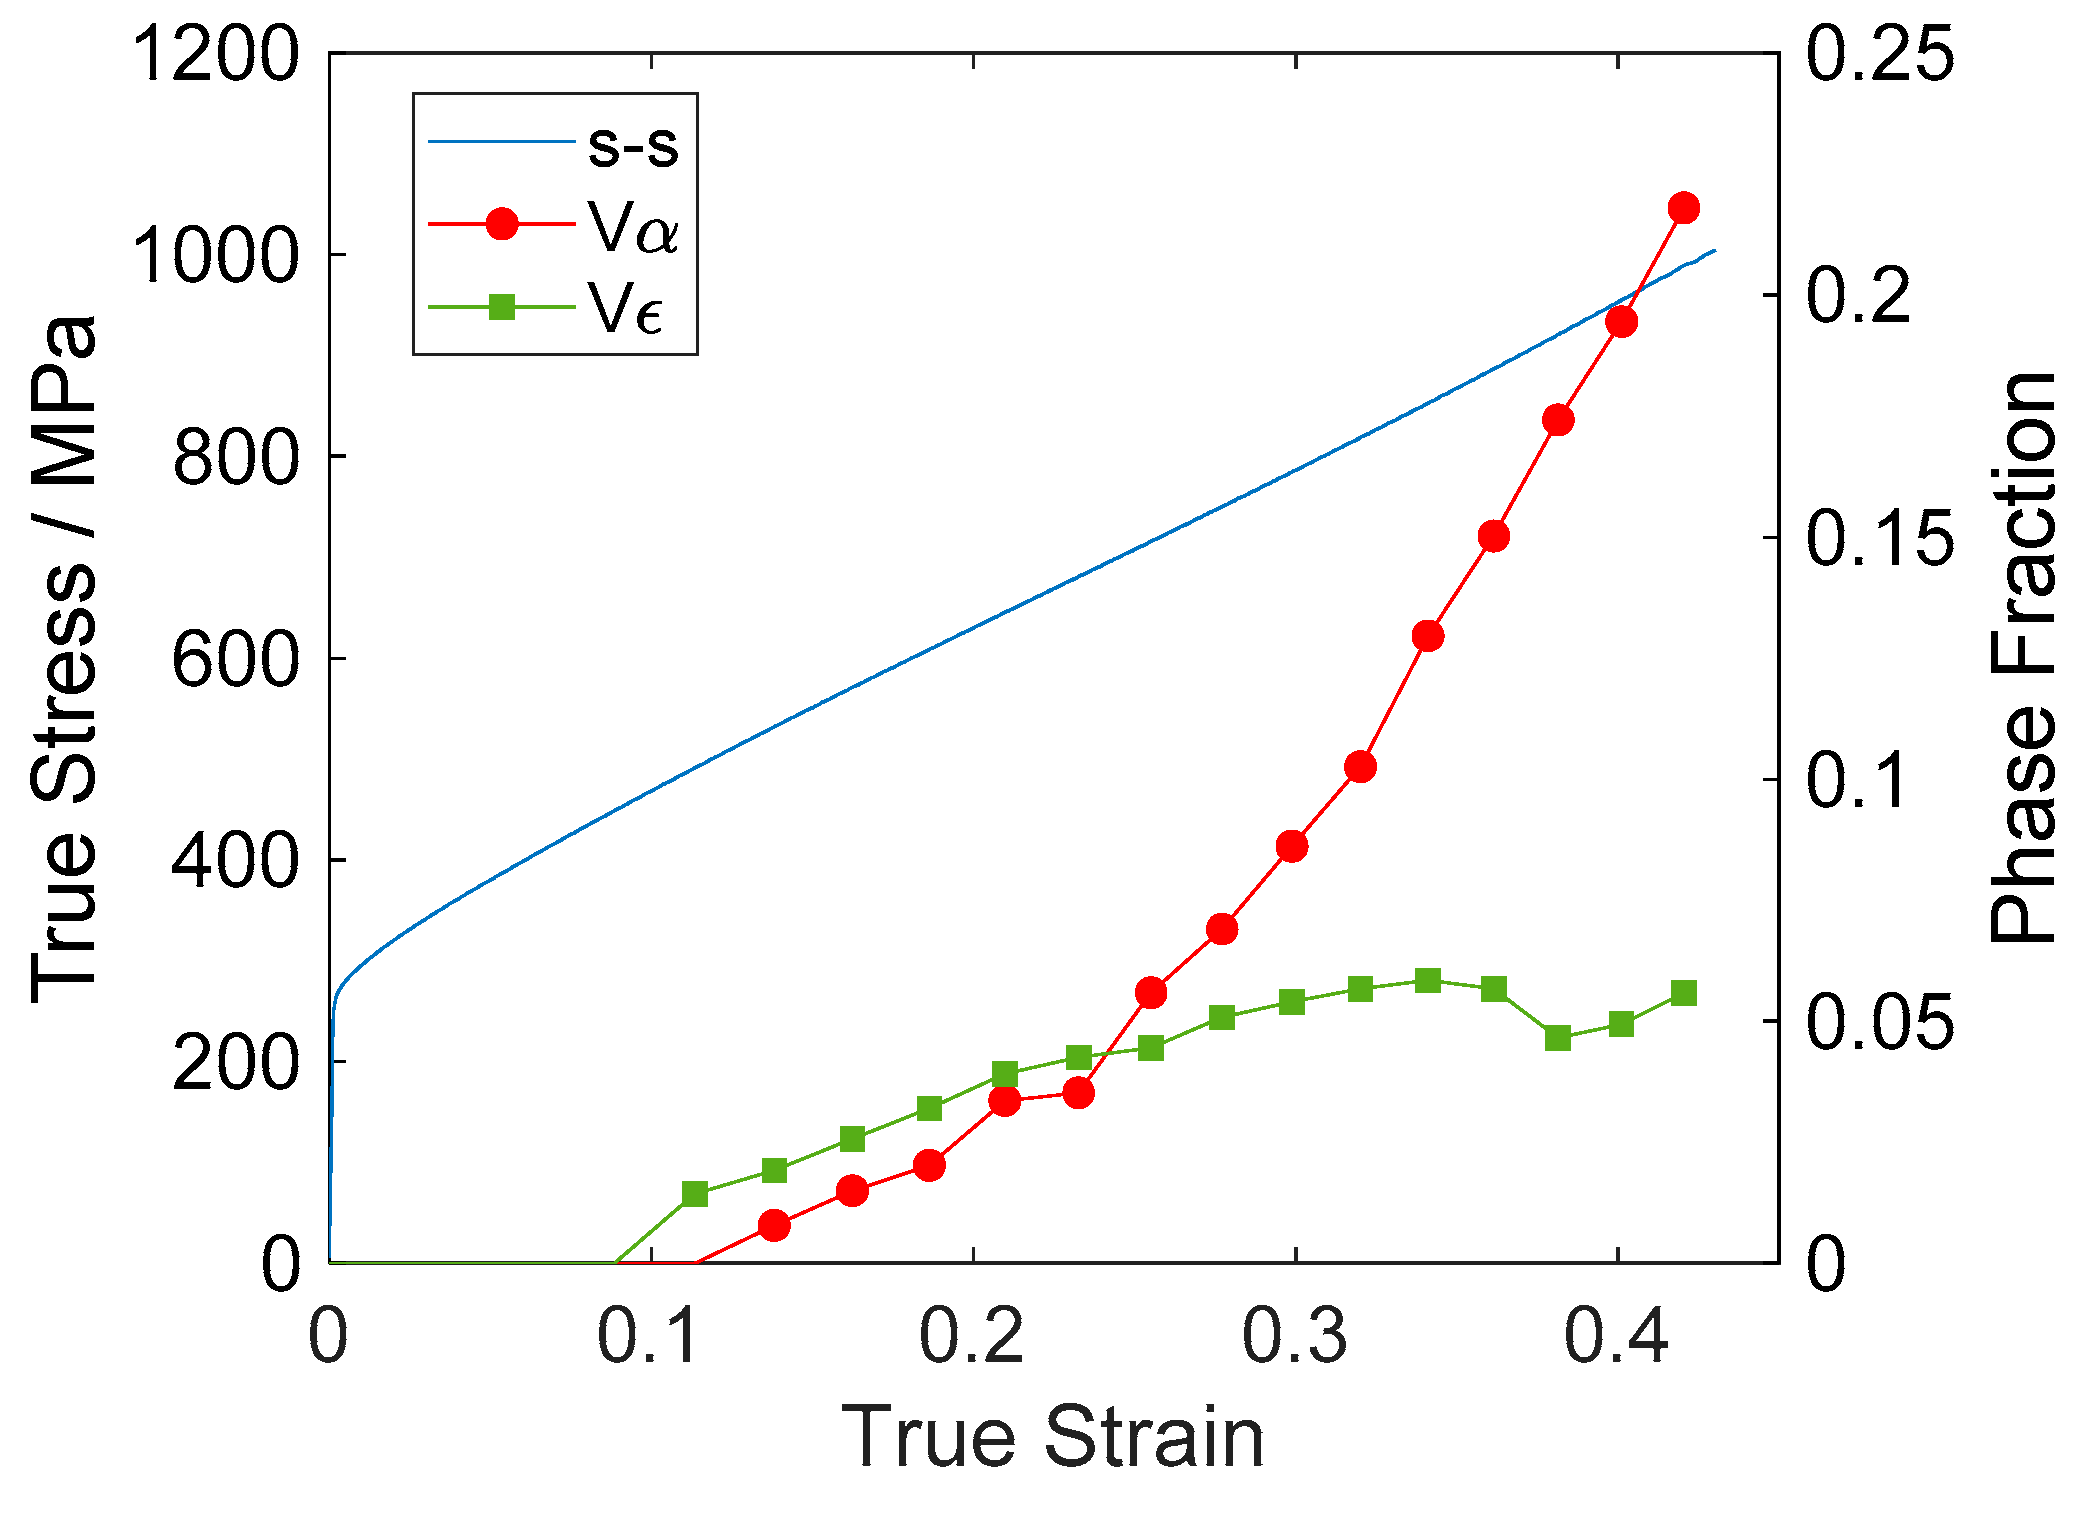
3. Results
4. Discussion
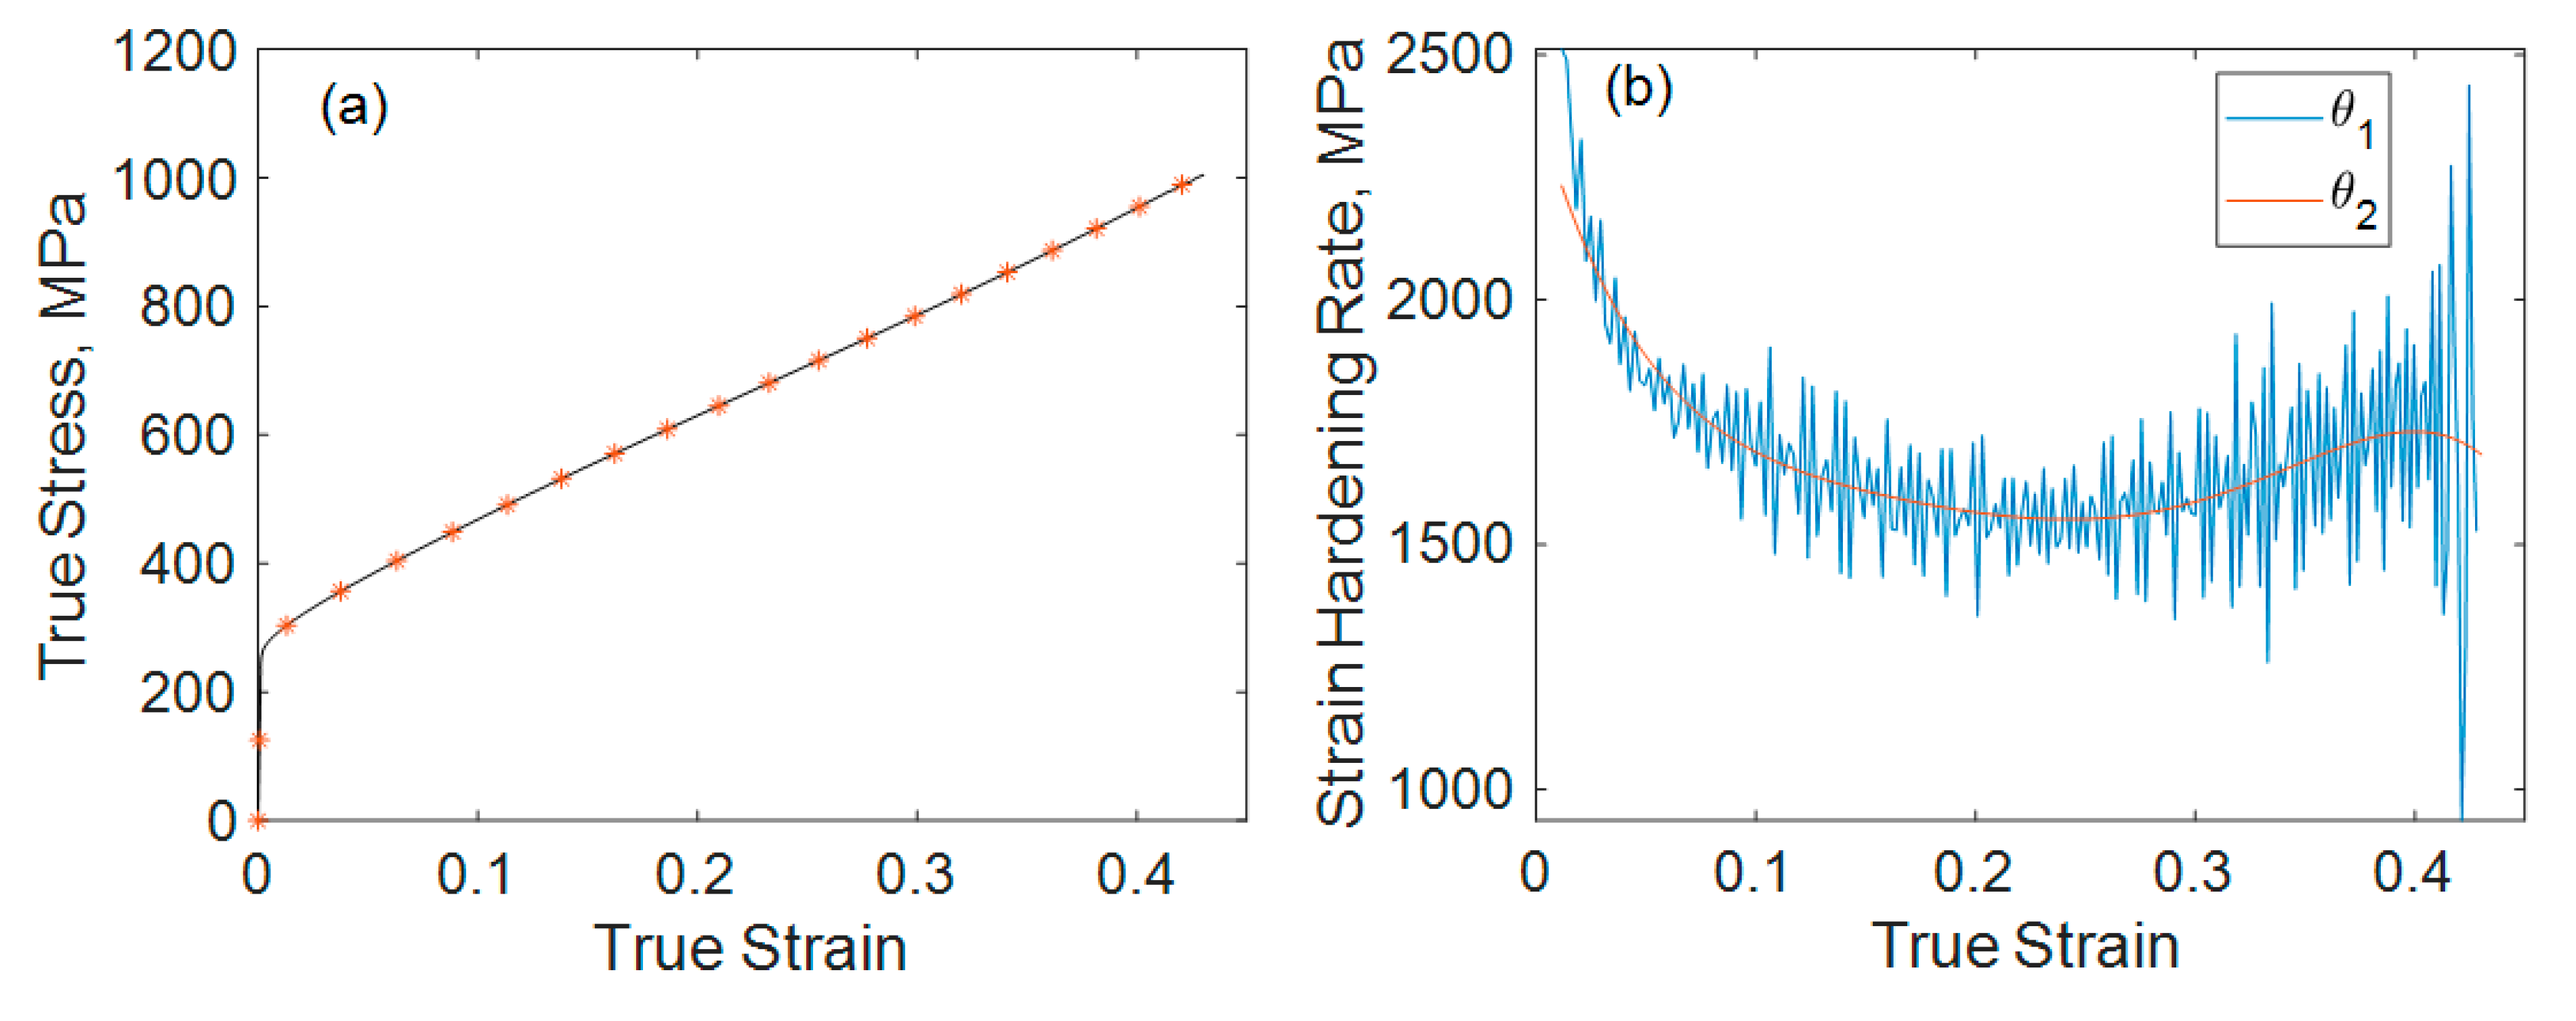
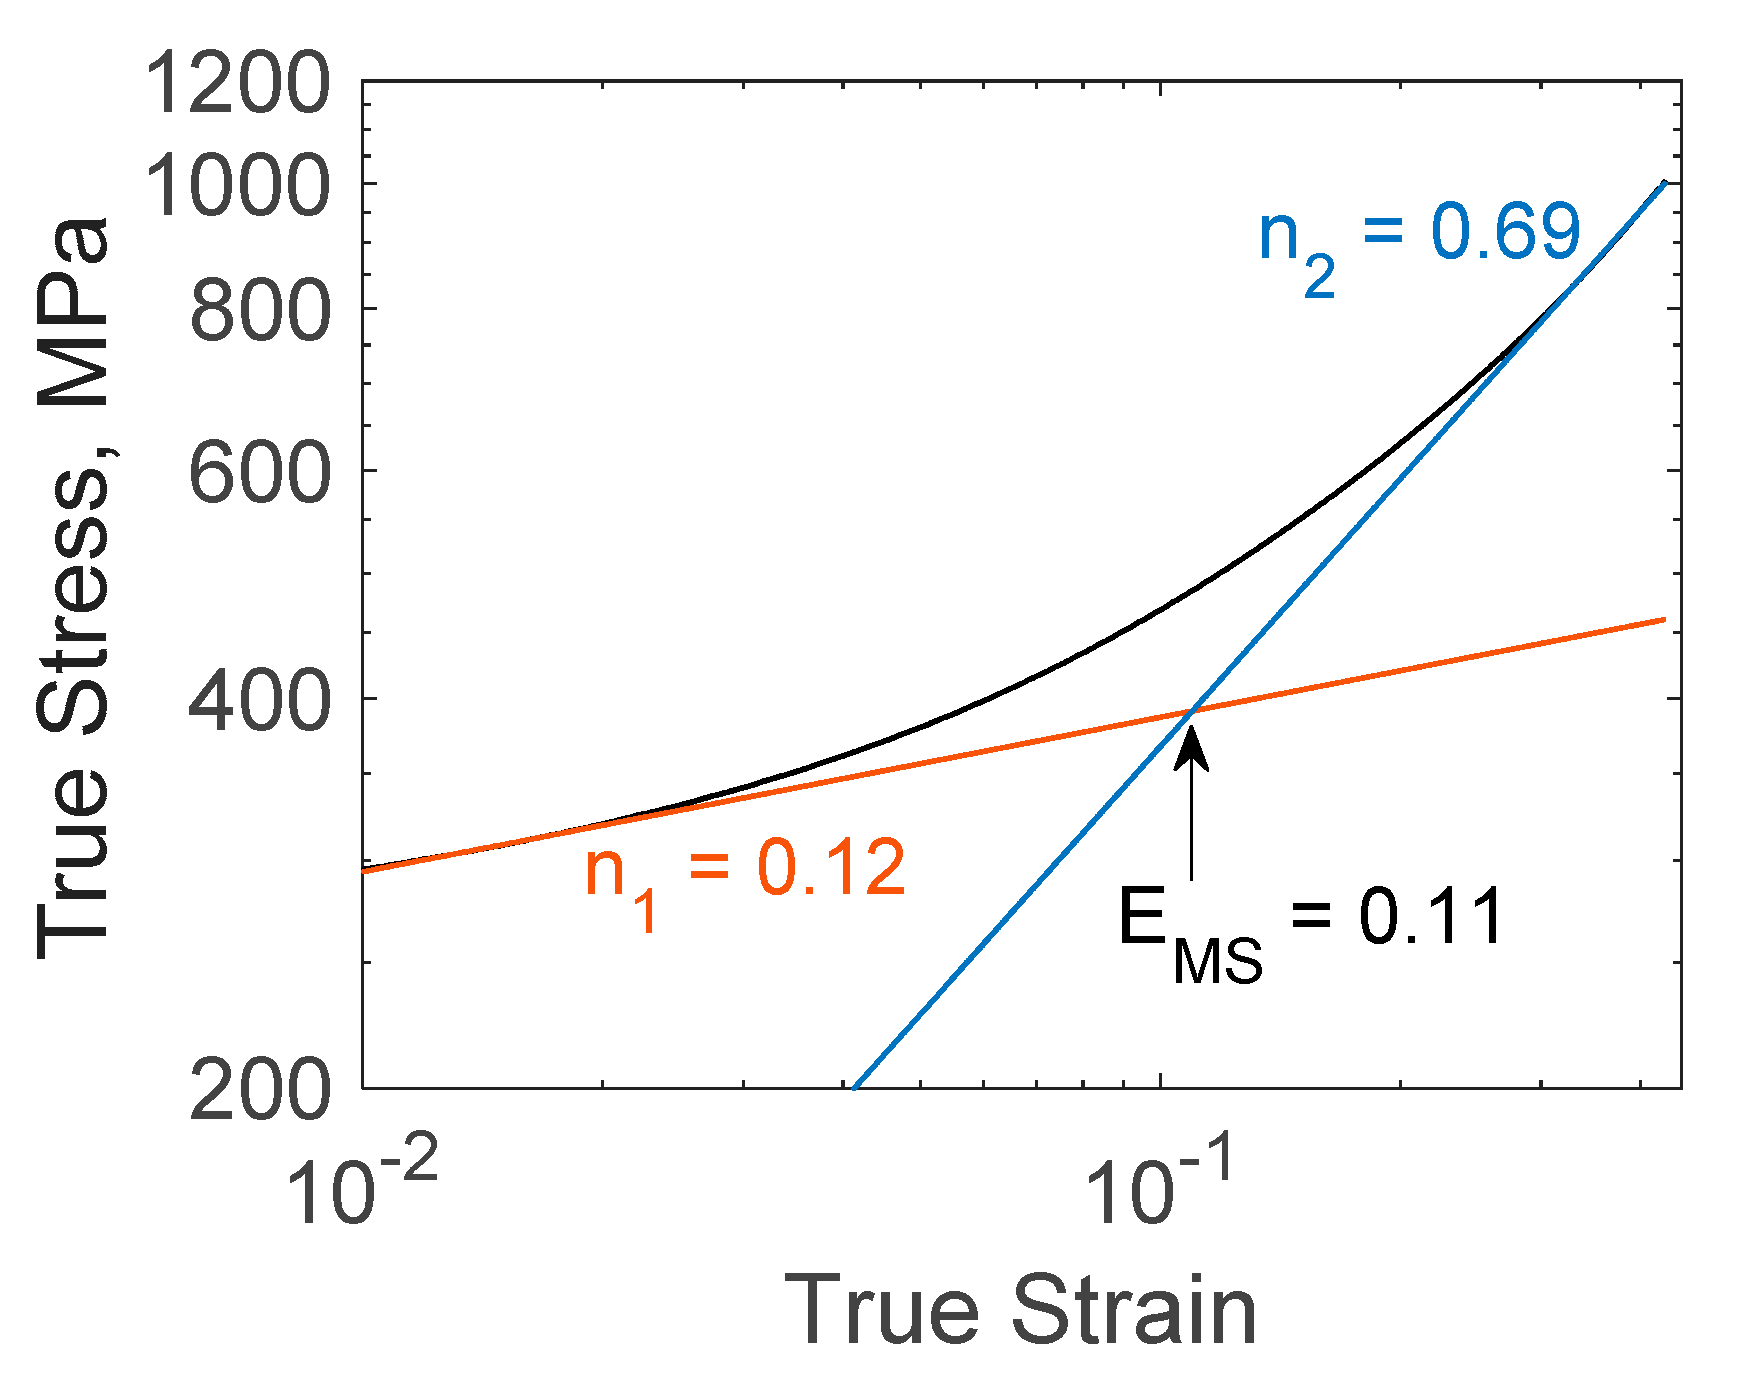
4.1. Analysis of Stress–Strain Curve
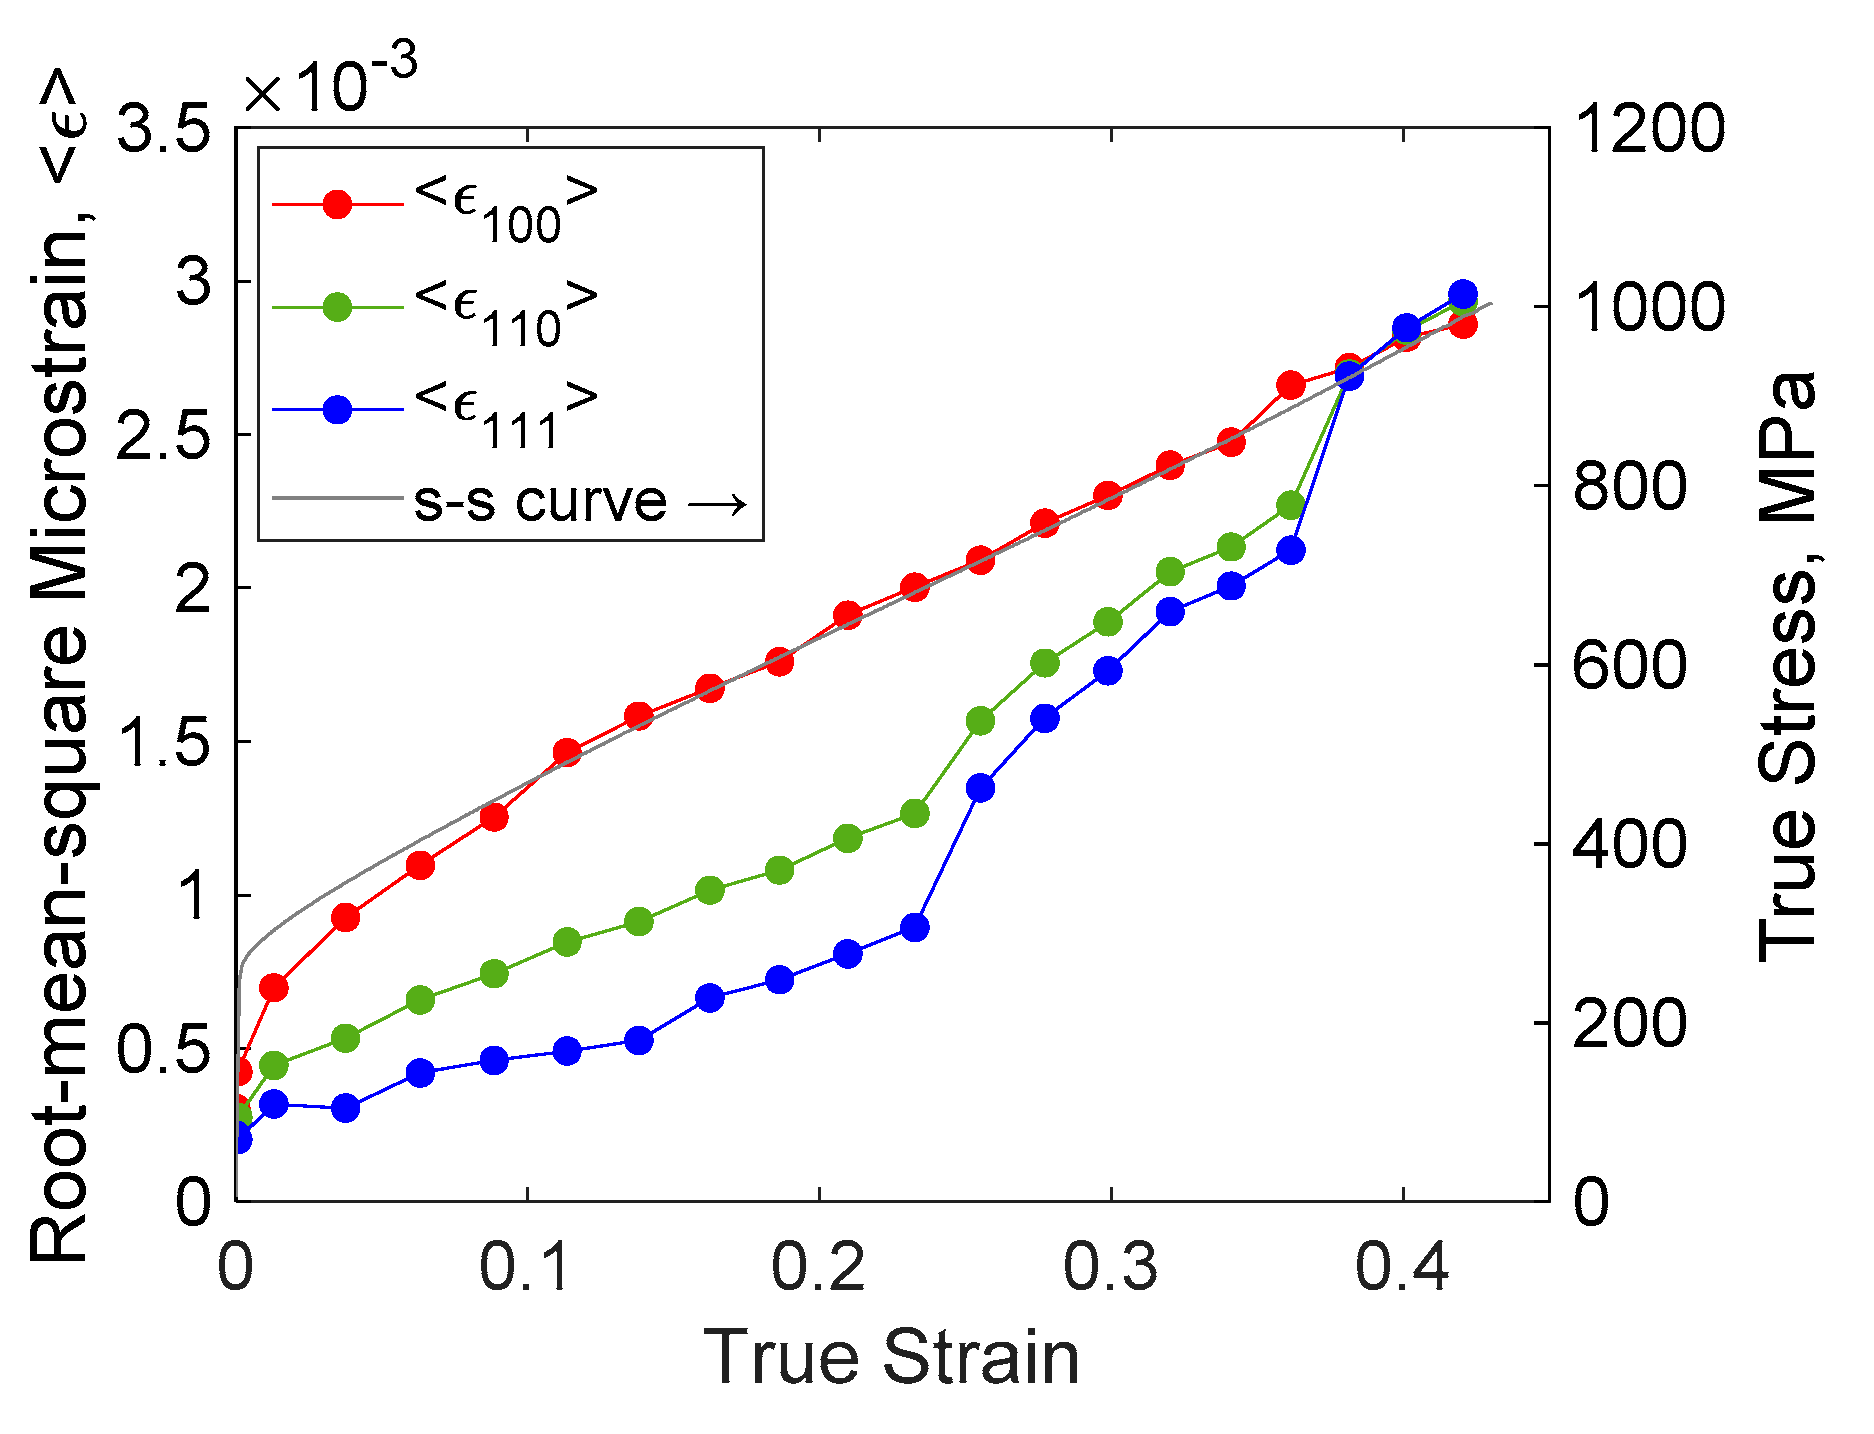
4.2. Dislocation Hardening
4.3. Chemical Stability of Austenite
5. Conclusions
Author Contributions
Funding
Acknowledgments
Conflicts of Interest
References
- Tsuchida, N.; Morimoto, Y.; Tonan, T.; Shibata, Y.; Fukaura, K.; Ueji, R. Stress-Induced Martensitic Transformation Behaviors at Various Temperatures and Their TRIP Effects in SUS304 Metastable Austenitic Stainless Steel. ISIJ Int. 2011, 51, 124–129. [Google Scholar] [CrossRef] [Green Version]
- Angel, T. Formation of Martensite in Austenitic Stainless Steels. J. Iron Steel Inst. 1954, 177, 165–174. [Google Scholar]
- Nishiyama, Z. Martensitic Transformation; Fine, M.E., Meshii, M., Wayman, C.M., Eds.; Academic Press Inc.: New York, NY, USA, 1978. [Google Scholar]
- Masumura, T.; Nakada, N.; Tsuchiyama, T.; Takaki, S.; Koyano, T.; Adachi, K. The difference in thermal and mechanical stabilities of austenite between carbon- and nitrogen-added metastable austenitic stainless steels. Acta Mater. 2015, 84, 330–338. [Google Scholar] [CrossRef]
- Onuki, Y.; Masumura, T.; Tsuchiyama, T.; Sato, S.; Tomida, T.; Takaki, S. Mutual Verification of Phase Fraction Analysis Techniques for Steels Comprising Deformation Induced Martensite Phases: Neutron-Diffraction-Based Rietveld Texture Analysis and Saturation Magnetization Measurement. Tetsu-to-Hagane 2020, 106, 457–464. [Google Scholar] [CrossRef]
- Grosse, M.; Kalkhof, D.; Niffenegger, M.; Keller, L. Influencing parameters on martensite transformation during low cycle fatigue for steel AISI 321. Mater. Sci. Eng. A 2006, 437, 109–113. [Google Scholar] [CrossRef]
- Kalkhof, D.; Grosse, M.; Niffenegger, M.; Leber, H.J. Monitoring fatigue degradation in austenitic stainless steels. Fatigue Fract. Eng. Mater. Struct. 2004, 27, 595–607. [Google Scholar] [CrossRef]
- Tiamiyu, A.; Tari, V.; Szpunar, J.; Odeshi, A.G.; Khan, A. Effects of grain refinement on the quasi-static compressive behavior of AISI 321 austenitic stainless steel: EBSD, TEM, and XRD studies. Int. J. Plast. 2018, 107, 79–99. [Google Scholar] [CrossRef]
- Onuki, Y.; Hoshikawa, A.; Sato, S.; Ishigaki, T. Rapid Measurement of Texture of Metals by Time-of-Flight Neutron Diffraction at iMATERIA and its Applications. Mater. Sci. Forum 2016, 879, 1426–1430. [Google Scholar] [CrossRef]
- Lutterotti, L.; Matthies, S.; Wenk, H.-R.; Schultz, A.S.; Richardson, J.W. Combined texture and structure analysis of deformed limestone from time-of-flight neutron diffraction spectra. J. Appl. Phys. 1997, 81, 594–600. [Google Scholar] [CrossRef]
- Lutterotti, L.; Chateigner, D.; Ferrari, S.; Ricote, J. Texture, residual stress and structural analysis of thin films using a combined X-ray analysis. Thin Solid Films 2004, 450, 34–41. [Google Scholar] [CrossRef]
- Wenk, H.-R.; Lutterotti, L.; Vogel, S.C. Rietveld texture analysis from TOF neutron diffraction data. Powder Diffr. 2010, 25, 283–296. [Google Scholar] [CrossRef] [Green Version]
- Onuki, Y.; Hoshikawa, A.; Sato, S.; Ishigaki, T.; Tomida, T. Quantitative phase fraction analysis of steel combined with texture analysis using time-of-flight neutron diffraction. J. Mater. Sci. 2017, 52, 11643–11658. [Google Scholar] [CrossRef]
- Murray, C.E. Equivalence of Kröner and weighted Voigt-Reuss models for X-ray stress determination. J. Appl. Phys. 2013, 113, 153509. [Google Scholar] [CrossRef]
- Ledbetter, H.M. Predicted Single-Crystal Elatic Constants of Stainless Steel 304; Reed, R.P., Simon, N.J., Eds.; U.S. Department of Commerce, National Bureau of Standards: Washington, DC, USA, 1981; p. 648.
- Kim, S.A.; Johnson, W.L. Elastic constants and internal friction of martensitic steel, ferritic-pearlitic steel, and α-iron. Mater. Sci. Eng. A 2007, 633–639. [Google Scholar] [CrossRef]
- Popa, N.C. The (hkl) Dependence of Diffraction-Line Broadening Caused by Strain and Size for all Laue Groups in Rietveld Refinement. J. Appl. Crystallogr. 1998, 31, 176–180. [Google Scholar] [CrossRef]
- Ungár, T.; Borbély, A. The effect of dislocation contrast on X-ray line broadening: A new approach to line profile analysis. Appl. Phys. Lett. 1996, 69, 3173–3175. [Google Scholar] [CrossRef]
- Williamson, G.; Hall, W. X-ray line broadening from filed aluminium and wolfram. Acta Met. 1953, 1, 22–31. [Google Scholar] [CrossRef]
- Takaki, S.; Masumura, T.; Tsuchiyama, T. Dislocation Characterization by the Direct-fitting/modified Williamson–Hall (DF/mWH) Method in Cold Worked Ferritic Steel. ISIJ Int. 2019, 59, 567–572. [Google Scholar] [CrossRef] [Green Version]
- Miura, R.; Ohnishi, K.; Nakajima, H.; Shimamoto, S. Effects of Carbon and Nitrogen on the Tensile Deformation Behavior of SUS304 and 316 Stainless Steels at Cryogenic Temperatures. Tetsu-to-Hagane 1987, 73, 715–722. [Google Scholar] [CrossRef]
- Yamashita, T.; Morooka, S.; Harjo, S.; Kawasaki, T.; Koga, N.; Umezawa, O. Role of retained austenite in low alloy steel at low temperature monitored by neutron diffraction. Scr. Mater. 2020, 177, 6–10. [Google Scholar] [CrossRef]
- Nohara, K.; Ono, Y.; Ohashi, N. Composition and Grain Size Dependencies of Strain-induced Martensitic Transformation in Metastable Austenitic Stainless Steels. Tetsu-to-Hagane 1977, 63, 772–782. [Google Scholar] [CrossRef] [Green Version]
- Masumura, T.; Fujino, K.; Tsuchiyama, T.; Takaki, S.; Kimura, K. Effect of Carbon and Nitrogen on Md30 in Metastable Austenitic Stainless Steel. Tetsu-to-Hagane 2019, 105, 1163–1172. [Google Scholar] [CrossRef] [Green Version]


| Element | C | Si | Mn | P | S | Ni | Cr | Cu | N | Fe |
|---|---|---|---|---|---|---|---|---|---|---|
| 0.042 | 0.52 | 0.92 | 0.030 | 0.002 | 8.08 | 18.26 | 0.22 | 0.052 | Balance |
© 2020 by the authors. Licensee MDPI, Basel, Switzerland. This article is an open access article distributed under the terms and conditions of the Creative Commons Attribution (CC BY) license (http://creativecommons.org/licenses/by/4.0/).
Share and Cite
Onuki, Y.; Sato, S. In Situ Observation for Deformation-Induced Martensite Transformation (DIMT) during Tensile Deformation of 304 Stainless Steel Using Neutron Diffraction. PART I: Mechanical Response. Quantum Beam Sci. 2020, 4, 31. https://0-doi-org.brum.beds.ac.uk/10.3390/qubs4030031
Onuki Y, Sato S. In Situ Observation for Deformation-Induced Martensite Transformation (DIMT) during Tensile Deformation of 304 Stainless Steel Using Neutron Diffraction. PART I: Mechanical Response. Quantum Beam Science. 2020; 4(3):31. https://0-doi-org.brum.beds.ac.uk/10.3390/qubs4030031
Chicago/Turabian StyleOnuki, Yusuke, and Shigeo Sato. 2020. "In Situ Observation for Deformation-Induced Martensite Transformation (DIMT) during Tensile Deformation of 304 Stainless Steel Using Neutron Diffraction. PART I: Mechanical Response" Quantum Beam Science 4, no. 3: 31. https://0-doi-org.brum.beds.ac.uk/10.3390/qubs4030031