Measurement of the X-ray Elastic Constants of Amorphous Polycarbonate

Department of Mechanical Engineering and Materials Science, Yokohama National University, 79-5 Tokiwadai, Hodogaya-ku, Yokohama 240-8501, Japan
*
Author to whom correspondence should be addressed.
Quantum Beam Sci. 2020, 4(4), 35; https://0-doi-org.brum.beds.ac.uk/10.3390/qubs4040035
Submission received: 26 August 2020
/
Revised: 2 October 2020
/
Accepted: 3 October 2020
/
Published: 9 October 2020
(This article belongs to the Special Issue Analysis of Strain, Stress and Texture with Quantum Beams)
Abstract
:In polymer materials, residual stress introduced during injection molding affects yield reduction due to deformation during molding and delayed fracture during operation, so the establishment of nondestructive stress evaluation of polymer products is desirable. The X-ray elastic constants of polycarbonate were measured for the purpose of obtaining fundamental data for X-ray stress measurement of amorphous polymer materials. The structural function was obtained from the diffraction data, and the strain measured by X-ray was determined from the shift of the first peak by the Q-space method. The peak position was determined using the pseudo-Voigt function approximation method and the diffraction line width method. The Young’s modulus measured by X-ray obtained by the diffraction line width method was close to the mechanical value. Although these values varied widely, they changed depending on the peak ratio. A simple and practical measurement method directly using the raw profile data was also discussed. The Young’s modulus determined by the diffraction line width method decreased with increasing peak ratio. On the other hand, the values determined by the pseudo-Voigt method were almost constant, irrespective of the peak ratio. The strain calculated by the line width method was determined more accurately than that by the pseudo-Voigt method.
1. Introduction
In recent years, the demand for constructing a sustainable society has been increasing. Weight reduction is an important key technology, as well as the use of renewable energy. The weight reduction directly and indirectly leads to high energy efficiency, energy saving, and environmental load reduction. From the viewpoint of material utilization, polymeric materials are promising candidates for lightweight materials.
Industrial products made of polymeric materials are molded by injection molding, extrusion molding, blow molding, injection blow molding, vacuum/pressure molding, etc. Injection molding is often used to produce large quantities of products with complex shapes. In this method, the molten material is pressed into a mold and then cooled for solidification. The occurrence of residual strain (residual stress) cannot be avoided in these molded components. This is because, when the component has a complicated shape, the molding pressure and the resin flow depend on the location, and the cooling rate becomes uneven. As a result, residual stresses are introduced due to different mold shrinkage rates at different locations. The existence of the residual stress in the component causes a decrease in yield due to the deformation of the product immediately after molding. In addition, as time passes, deformation progresses, and cracks occur. In particular, the prevention of environmental stress cracking is essential to ensure safety [1,2]. It is especially important to evaluate areas where residual stress is expected to occur, such as near gates and weld lines.
In crystalline materials, the X-ray diffraction method is extremely useful for nondestructive evaluation of residual stress in components. In particular, it has been standardized for steel materials, and is widely used in many industrial fields [3,4,5,6]. In addition to steel, it is possible to measure the stress of various crystalline materials such as ceramics [7], composites [8], thin films [9], and so on. Attempts have also been made to measure the stress on crystalline polymer materials [10,11,12].
In polymeric materials, there are many amorphous materials, as well as crystalline materials, such as polycarbonate, polyvinyl chloride, and polymethyl methacrylate. Since amorphous materials do not have periodic atomic regularity like crystals, there are no sharp diffraction peaks. However, it is known that broad halo patterns occur at low diffraction angles even in amorphous materials, and these patterns are employed to structural analysis. An attempt to evaluate the strains by using the halo pattern caused by the short-range order has been reported. Boukal evaluated strains in amorphous polycarbonate based on the shift of the halo peak [13]. Similarly, Pick et al. investigated a-Poly Methyl Methacrylate [14], and polystyrene was investigated by Nakamae et al. [15]. In addition, strain evaluation using the Q-space method and the direct space method has been reported for metallic glass using the atomic pair distribution function (PDF) [16,17,18].
In the X-ray method, the strain is calculated from the distances between the atoms based on the shift of the diffraction profile. Therefore, it is important to determine the diffraction peak position from the diffraction profile. In general, halo patterns are asymmetric, so care must be taken in data processing. However, from this point of view, research on the strain calculation method is not sufficient.
In this study, strain in an amorphous polycarbonate was measured by the X-ray diffraction method, and the X-ray elastic constants were determined under uniaxial tensile loading. The effectiveness of PDF analysis for strain determination was examined. The peak position of the structure function and the diffraction angle was determined by the split type pseudo-Voigt function method [19] and the diffraction line width method similar to the half-maximum breadth method [3,4,5,6]. The influence of the data range used for the profile processing on the X-ray elastic constants was examined. Furthermore, a simple method using raw profile data directly was also investigated for rapid stress evaluation for industrial use.
2. Experimental Procedure
2.1. Material and Specimen
The material used in this study is a polycarbonate, NOVAREX 7022R, fabricated by Mitsubishi Engineering-Plastic Corporation. The material was injection-molded into a 100 × 100 × 2 mm3 plate. The test specimens were cut out of the plate into strips of 9 × 50 × 2 mm3 using a thin abrasive cutting wheel. After machining, the specimens were annealed under industrially used conditions to remove the residual stress. The heating rate is 16.7 K/h and the holding condition is 403 K and 0.5 h. After the heat treatment, four strain gauges were glued to the specimen to measure the longitudinal and transverse strains on the front and back sides of the specimen, respectively.
It is known that polycarbonate crystallizes after a few days of heating or in special solvents [20]. In that case, the crystal structure is as follows: orthorhombic, a = 11.9 Å, b = 10.1 Å, c = 21.5 Å and monoclinic, a = 12.3 Å, b = 10.1 Å, c = 20.8 Å, γ = 84 deg.
2.2. X-ray Measurement
The X-ray equipment used is a MacScience M21X. In order to measure the average information of the whole specimen thickness by transmission geometry, a Mo rotating anode with excellent X-ray permeability was adopted. The X-ray measurement was performed with a parallel beam through a soller slit on the incident side. The size of the incident beam on the specimen surface was shaped to 3 × 10 mm by the limiting slit. By the fixed time mode, θ–2θ scan was performed in the 2θ range of 3.55 to 100 deg. The structure function, S(Q), and the atomic pair distribution function (PDF), G(r), were determined from the measured diffraction profiles using PDFgetX2 [21].
where Q is the magnitude of the scattering vector, <f> is the average scattering factor, r is the distance (see reference [21] for more information).
The PDF analysis was performed using data with a Q value of 0.54 to 13.5 Å−1. The X-ray conditions are summarized in Table 1.
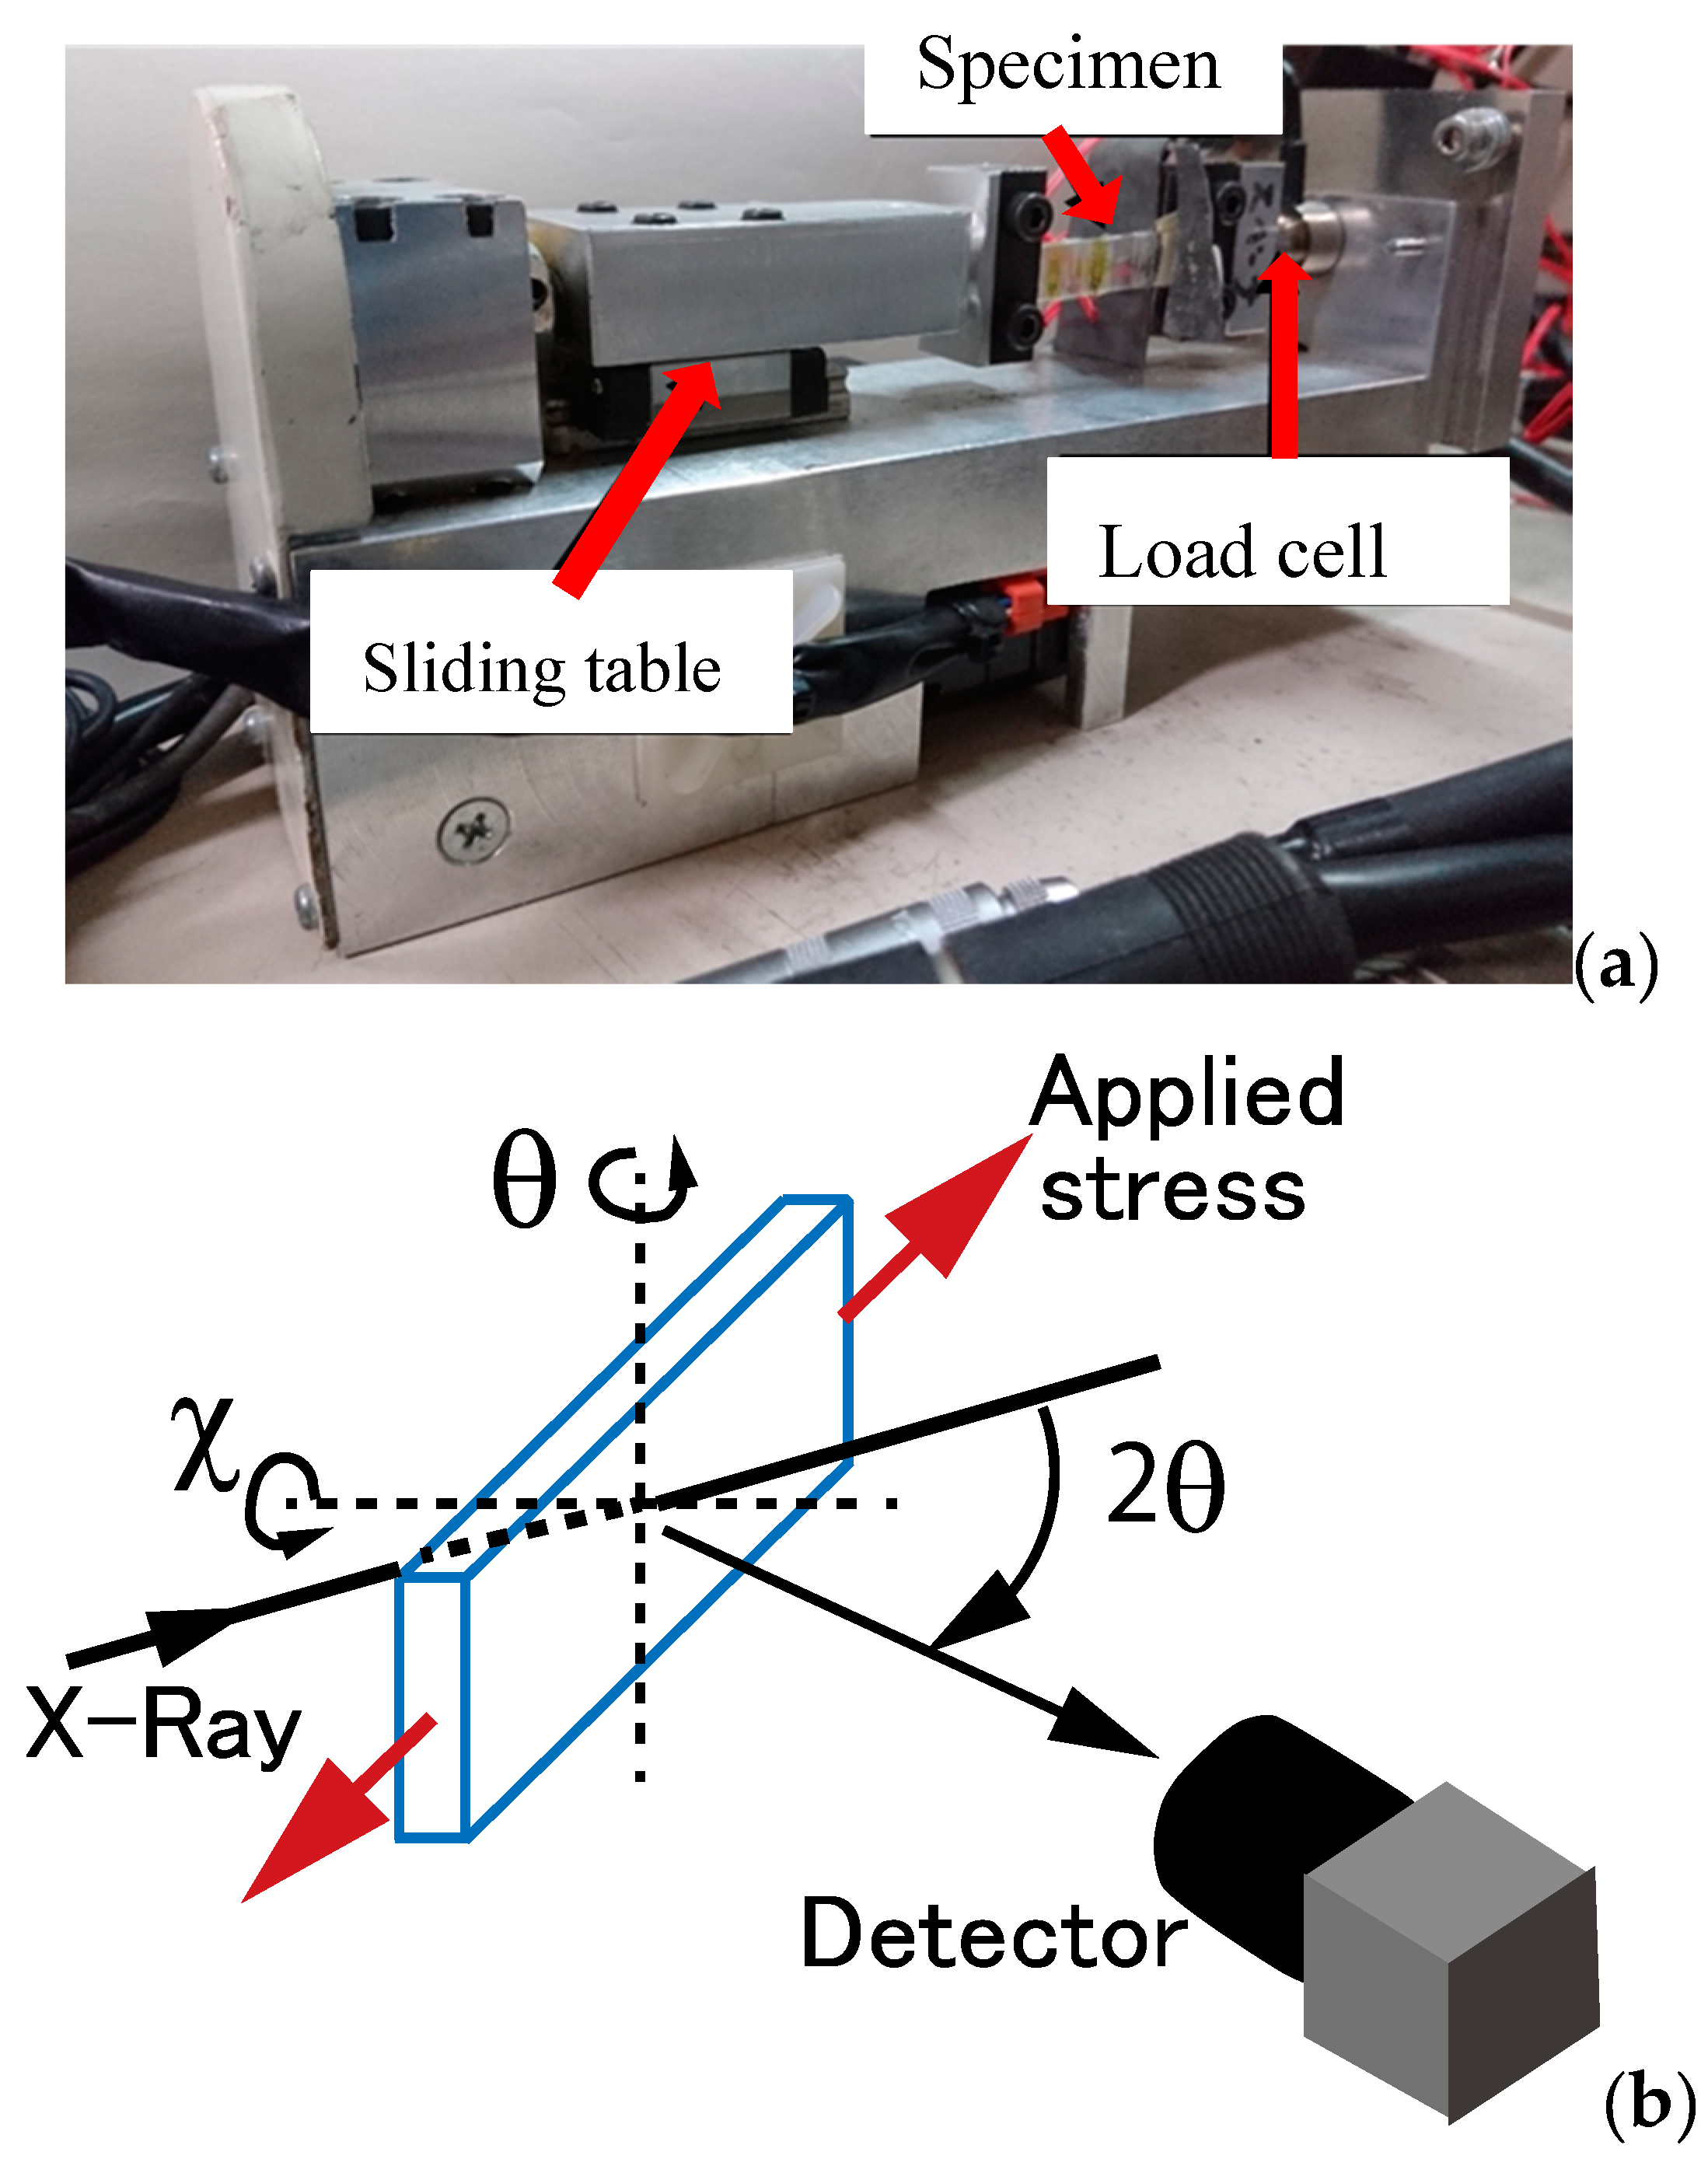
The stress was applied by the specially designed tensile device. Figure 1 shows the loading device used in this study. The sample was gripped between a load cell and a sliding table. The applied stress was set to three or four levels. The maximum applied stress was set to a value sufficiently lower than the yield stress, as described later. The applied stress during the X-ray measurements was controlled by moving the sliding table via a DC motor to keep the applied stress constant. The strain gauges attached to the surface of the sample confirmed that no bending stress was applied to the sample during tensile loading. The loading device was mounted on the goniometer of the X-ray equipment and the X-ray measurements were carried out by transmission geometry under constant applied stress as shown in Figure 1b. The sample was set so that the scattering vector and the load axis coincided (sin2χ = 0, where the χ-axis is parallel to the normal of the specimen surface). The change in the diffraction profile with respect to the applied stress level was extracted without changing the geometrical relationship between the sample and the X-ray.
In industrial use, it is important to consider a practical and convenient method for residual stress measurement. A method to directly obtain the diffraction angle from the measured raw profile data was examined. In order to improve the measurement accuracy, the scattering vector was rotated around the χ-axis in the sample plane, and data were obtained at sin2χ = 0 to 0.9. The longitudinal strain corresponds to the value of sin2χ = 0 and the transverse strain corresponds to the value of sin2χ = 1. The Young’s modulus is the slope of the linear relationship between the longitudinal strain and the applied stress. The Poisson’s ratio can be easily obtained from the ratio of the transverse strain to the longitudinal strain.
2.3. Determination of Diffraction Peak Position
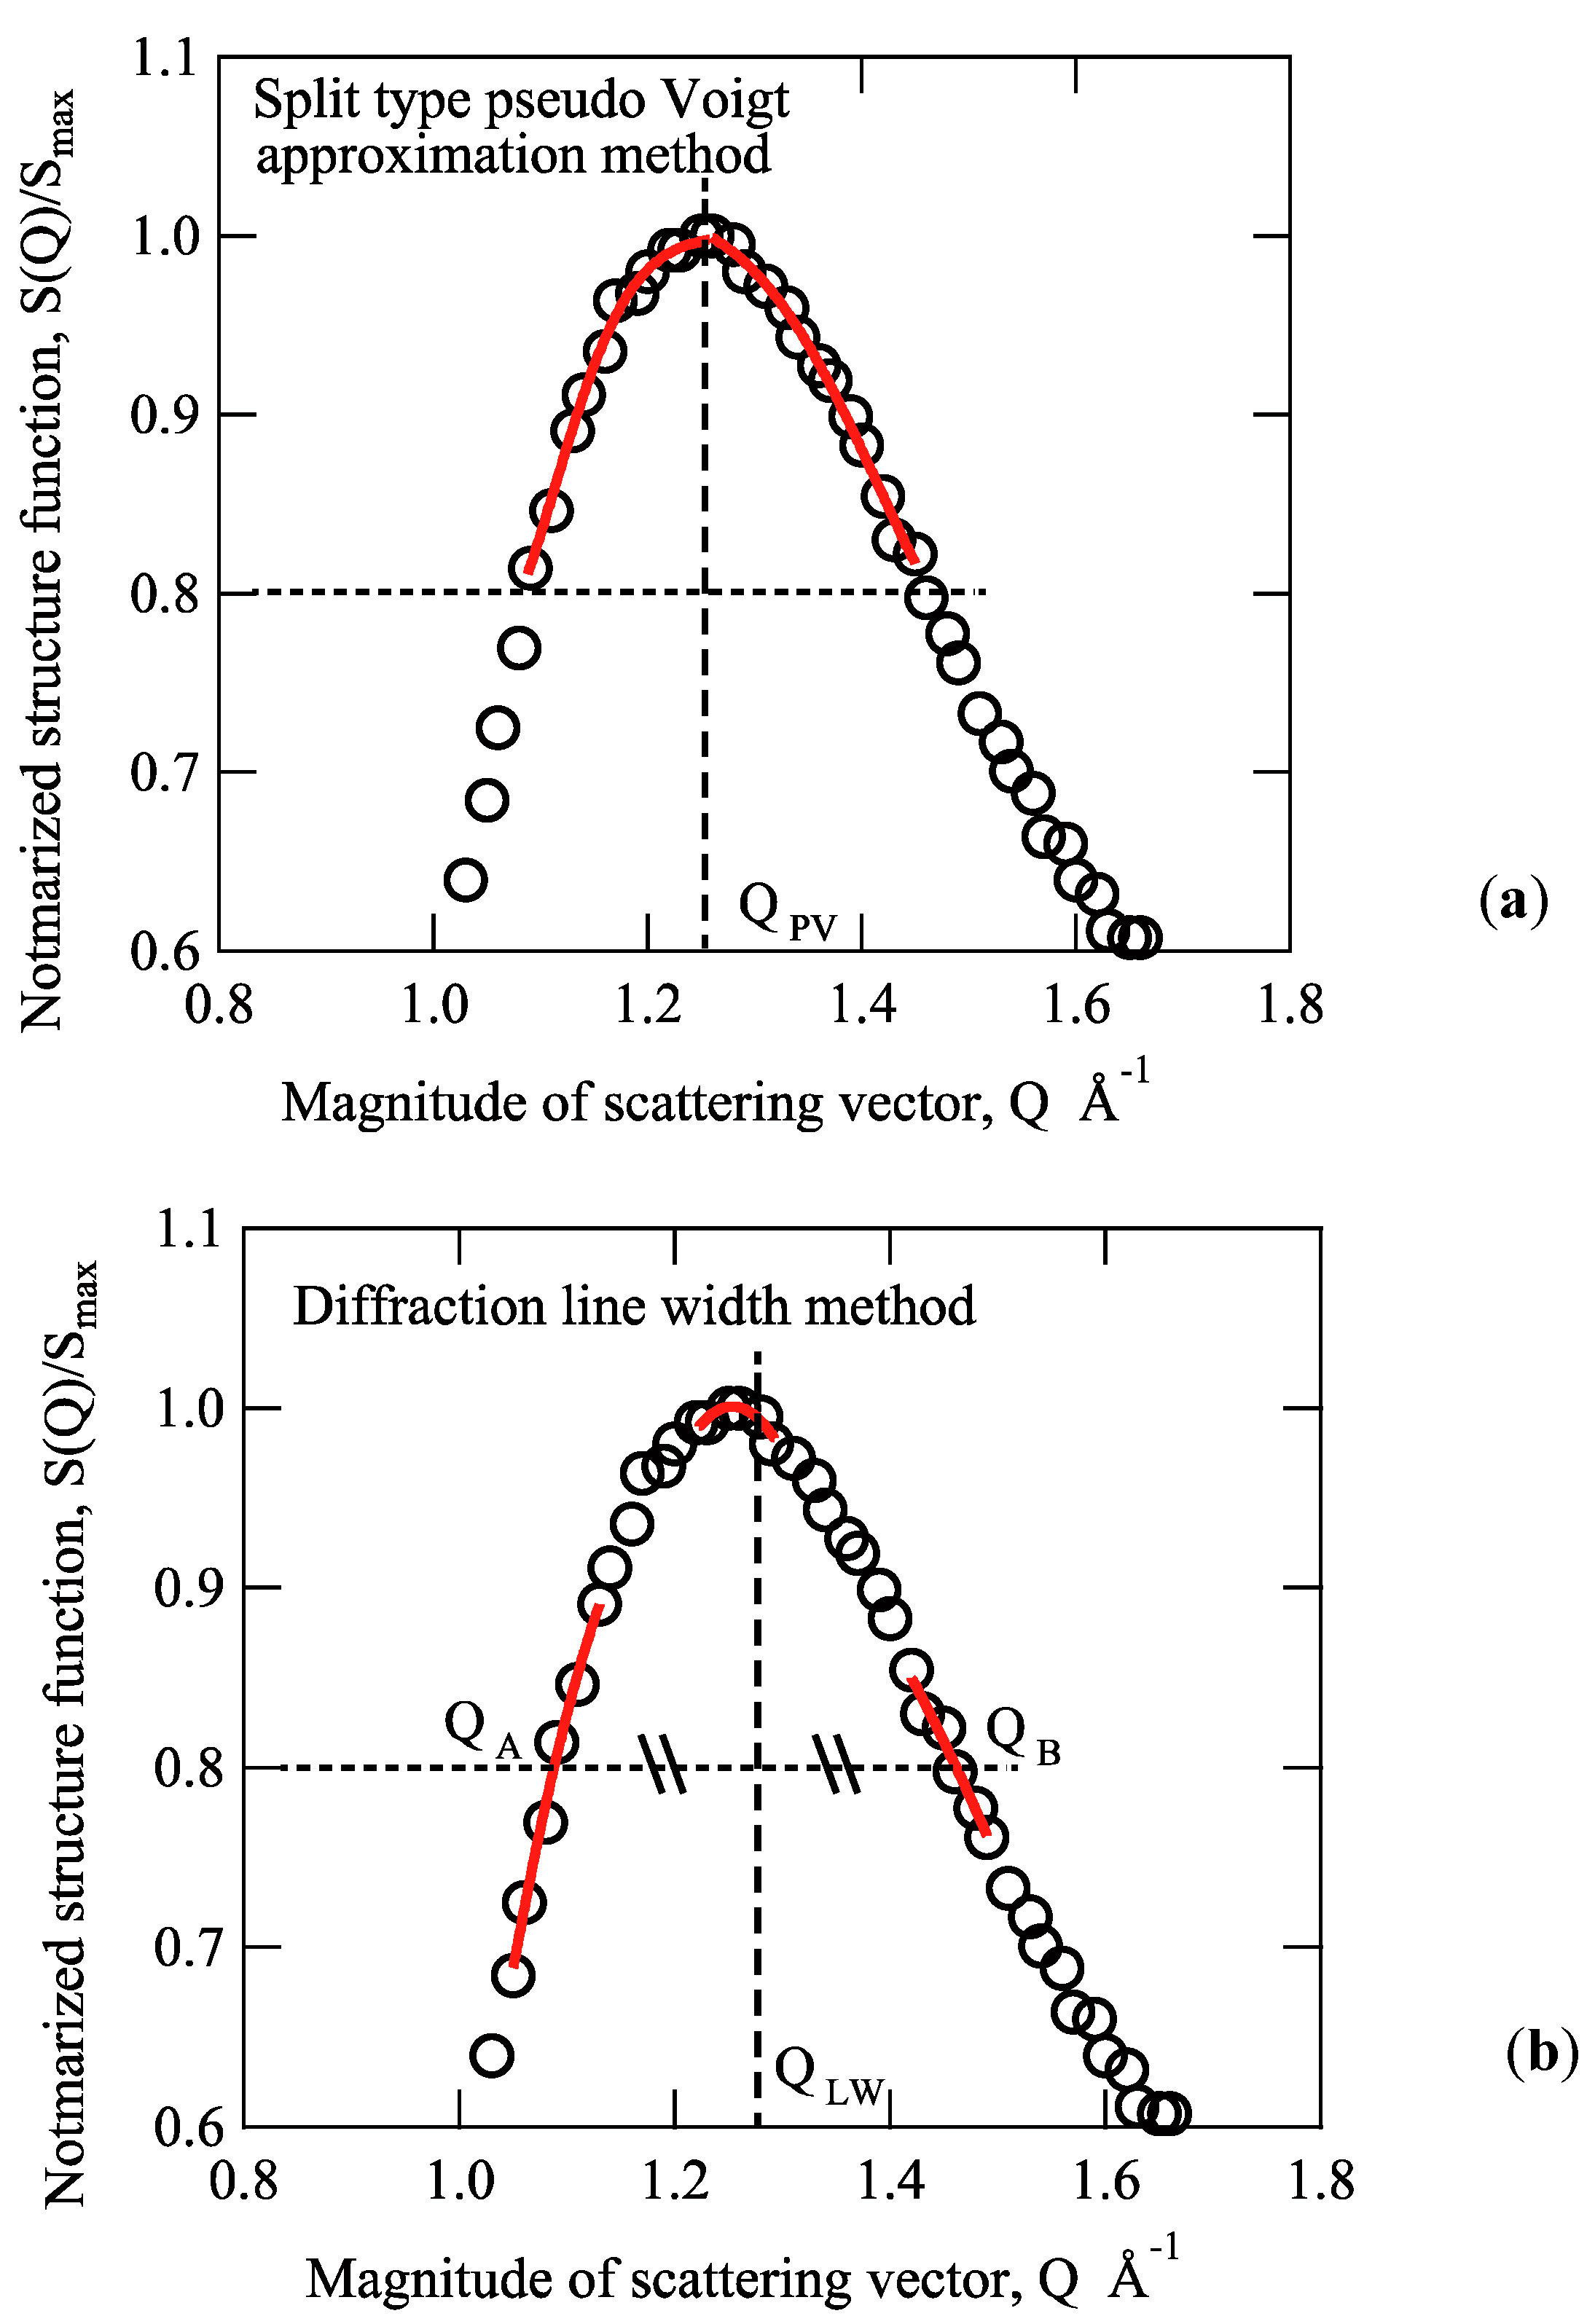
As discussed below, not only the diffraction profile shape but also the amount of profile shift due to the applied stress is asymmetric. Namely, the amount of profile shift is expected to depend on the range of data to be analyzed. Then, the peak position of the diffraction intensity and diffraction angle relation, and structure function and amount of scattering vector relation, was determined in two ways. Typical examples of the relation between the normalized structure function and the magnitude of the scattering vector are shown in Figure 2. The value of S(Q) was normalized by dividing by the maximum value of S(Q), Smax. (see Section 3.2). Since the profile shapes are asymmetric, the position of the maximum peak was determined by approximating with the split type pseudo-Voigt function [19]. Namely, two pseudo-Voigt functions were utilized to approximate the low Q value side and the high Q value side of the peak top value. When the target intensity is 80% of the maximum value, data above 0.8 are utilized to the approximation. The fitting curve in this case is a red curve. The data with an intensity of more than 0.8 were used. Then the peak position of QPV can be obtained. The target intensity used for the approximation was changed to 70% to 90% of the maximum value, and the influence of the approximation range on the peak data was examined. This method is hereafter called the pseudo-Voigt method, and the target intensity is called the peak ratio.
The other is similar to the half-maximum breadth method [3,4] as shown in Figure 2b. The maximum intensity is determined by a quadratic curve approximation using the data of maximum intensity and the data of three points on each low and high angle side. After that, the position of the intersection point is determined by a cubic curve approximation using six data points around the target intensity (peak ratio). Namely, the QA of the intersection on the low Q value side and the QB on the high Q value side can be obtained. Then, the average of QA and QB was determined as the peak position QLW. In this method, the number of data used for the approximation is not sufficient; however, there is no need to consider the suitability of the fitting function for the entire target data. This method is referred to below as the diffraction line width method.
The same method was also applied to the peak processing of the relation between the uncorrected raw diffraction intensity and the diffraction angle.
3. Results and Discussion
3.1. Diffraction Profile Change under Tensile Loading
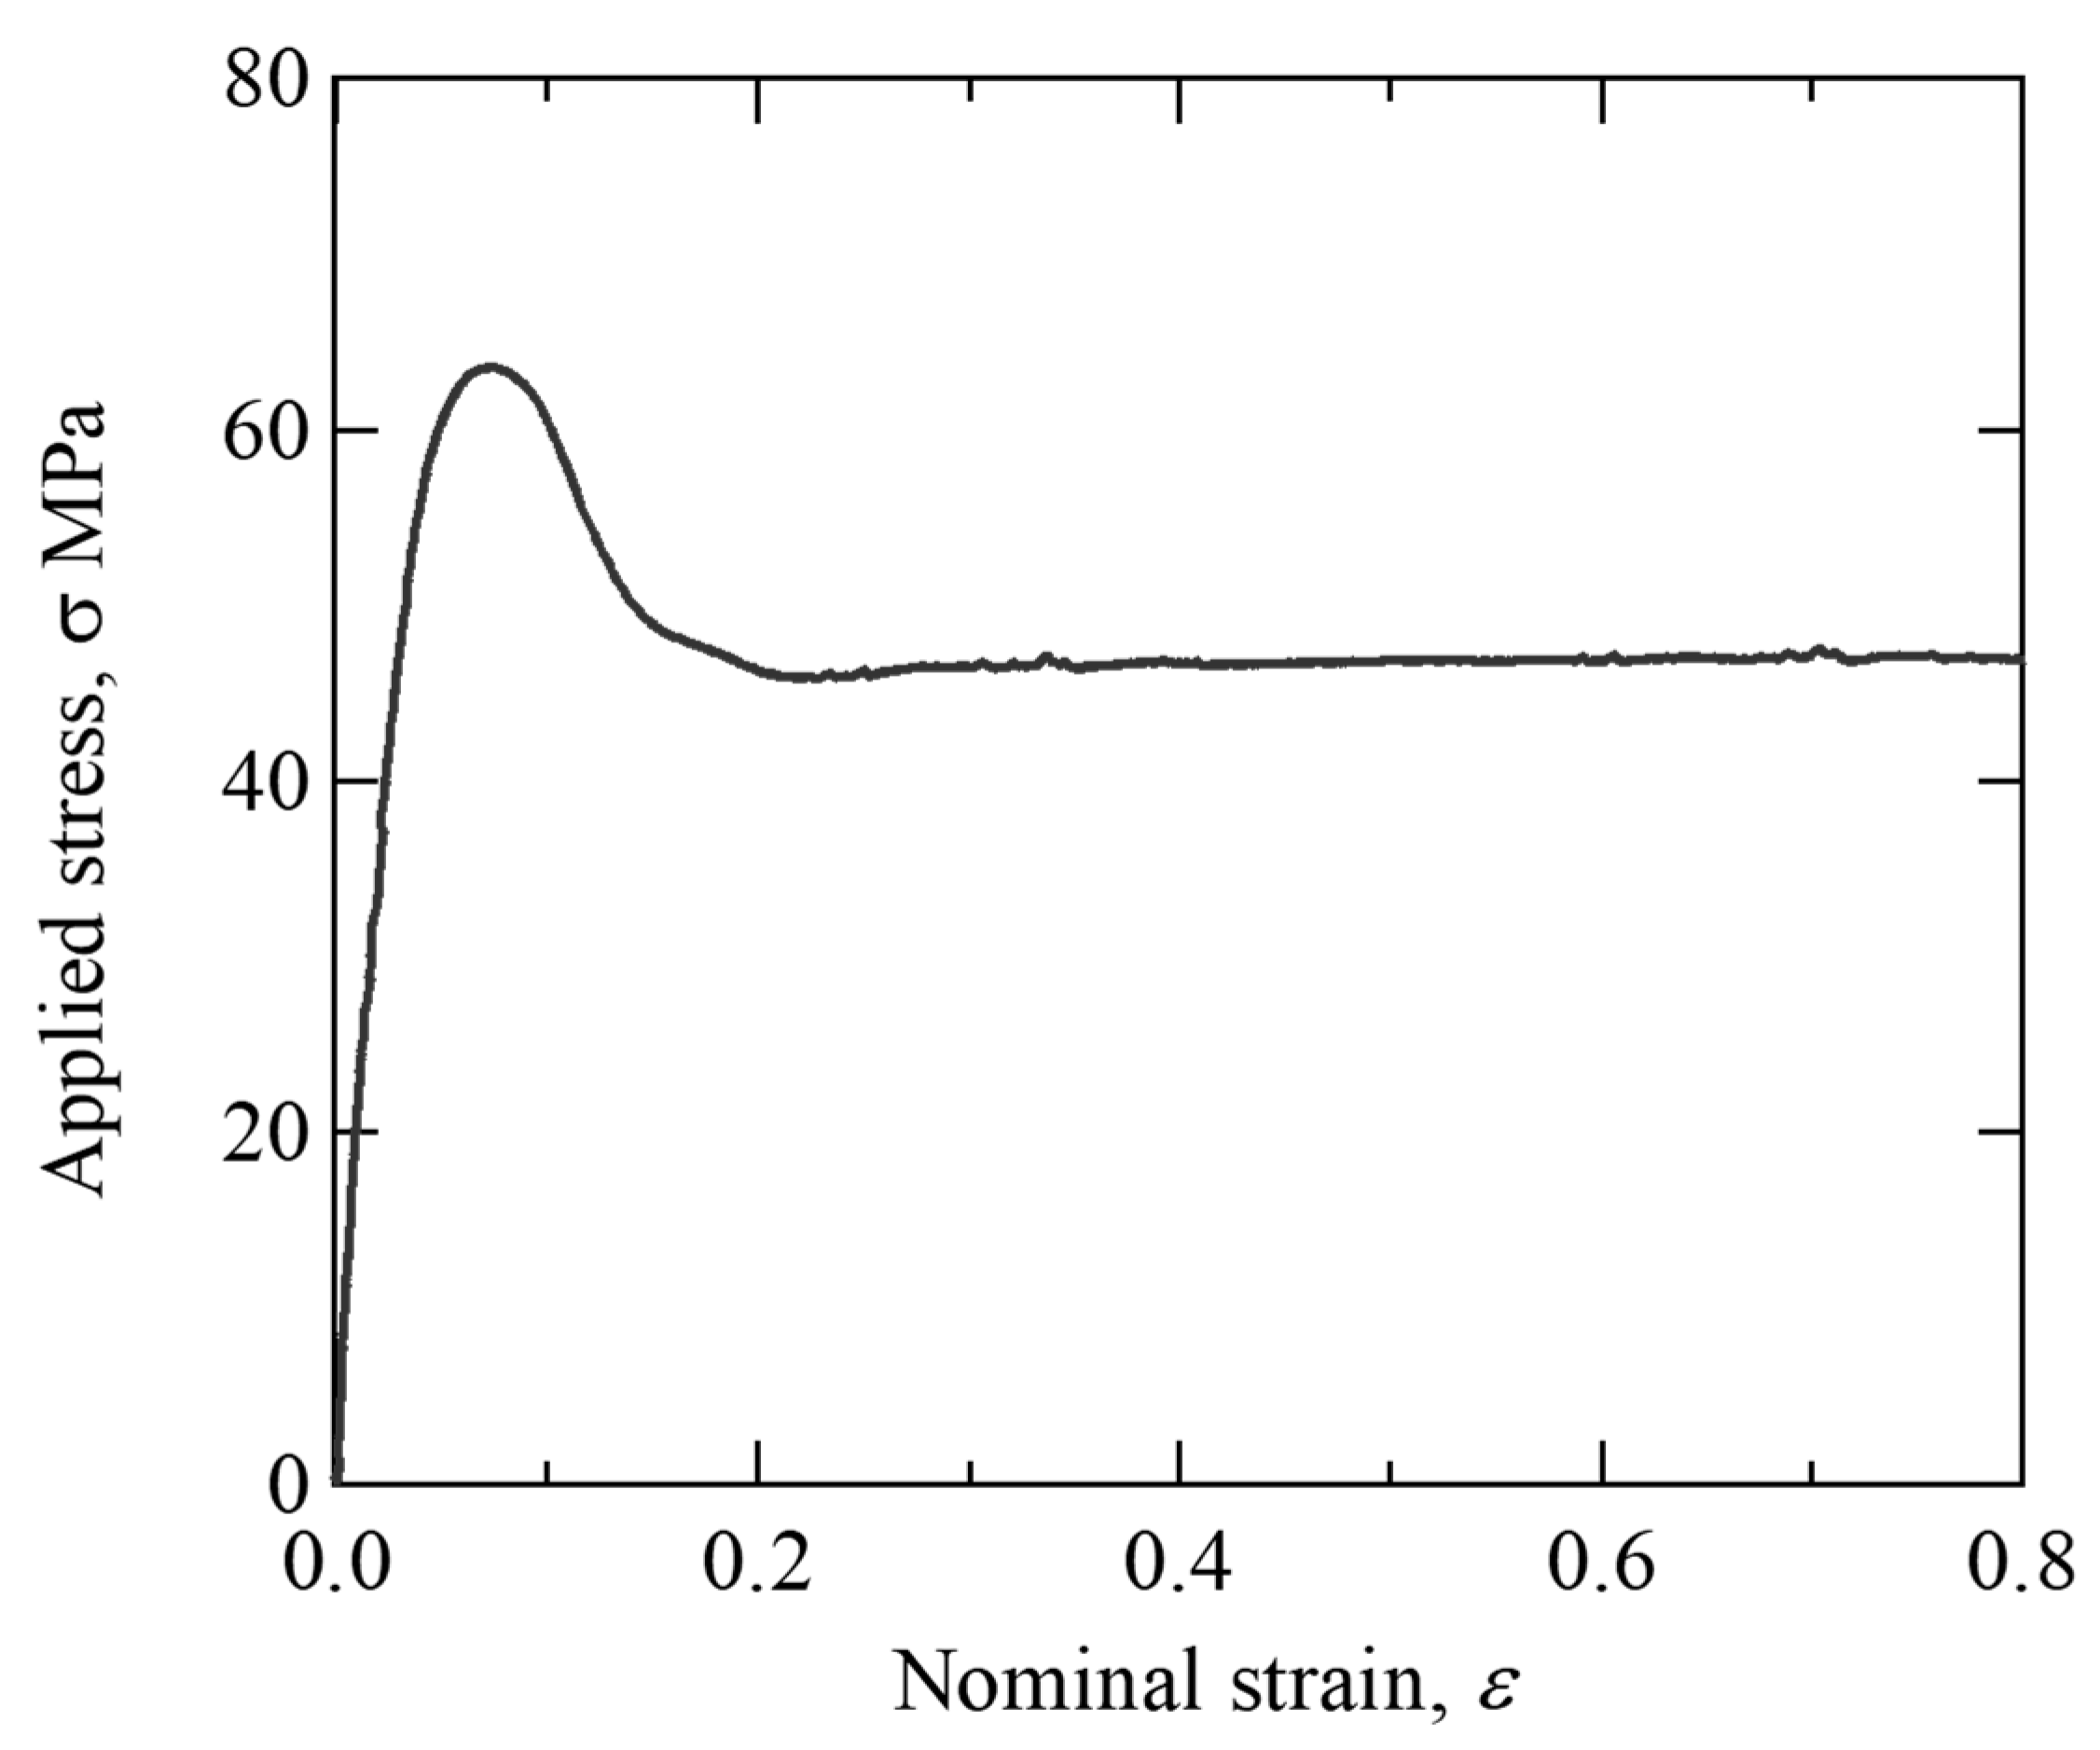
To determine the applied stress for X-ray elastic constant measurement in the elastic region, a tensile test of polycarbonate was performed. The gauge region of the tensile specimen has a length of 7 mm, a width of 2 mm, and a thickness of 2 mm. Figure 3 shows the relation between the applied stress and the nominal strain. In the elastic region, the relation between stress and strain is almost linear. Macroscopically, the nonlinearity becomes remarkable for the stress above about 50 MPa. When the nominal strain is 0.075, the stress reaches the maximum value of 64 MPa. After that, a necking phenomenon occurs in the tensile specimen, and the stress decreases as the nominal strain increases. When the nominal strain is larger than 0.2, the stress increases slightly. Strictly speaking, it is difficult to define the pure elastic region because polymer materials exhibit visco-elasto-plastic behavior. In this study, the stress was set so that the maximum stress does not exceed 35 MPa. The mechanical Young’s modulus obtained in the elastic region is 2279 MPa, and the mechanical Poisson’s ratio is 0.37.
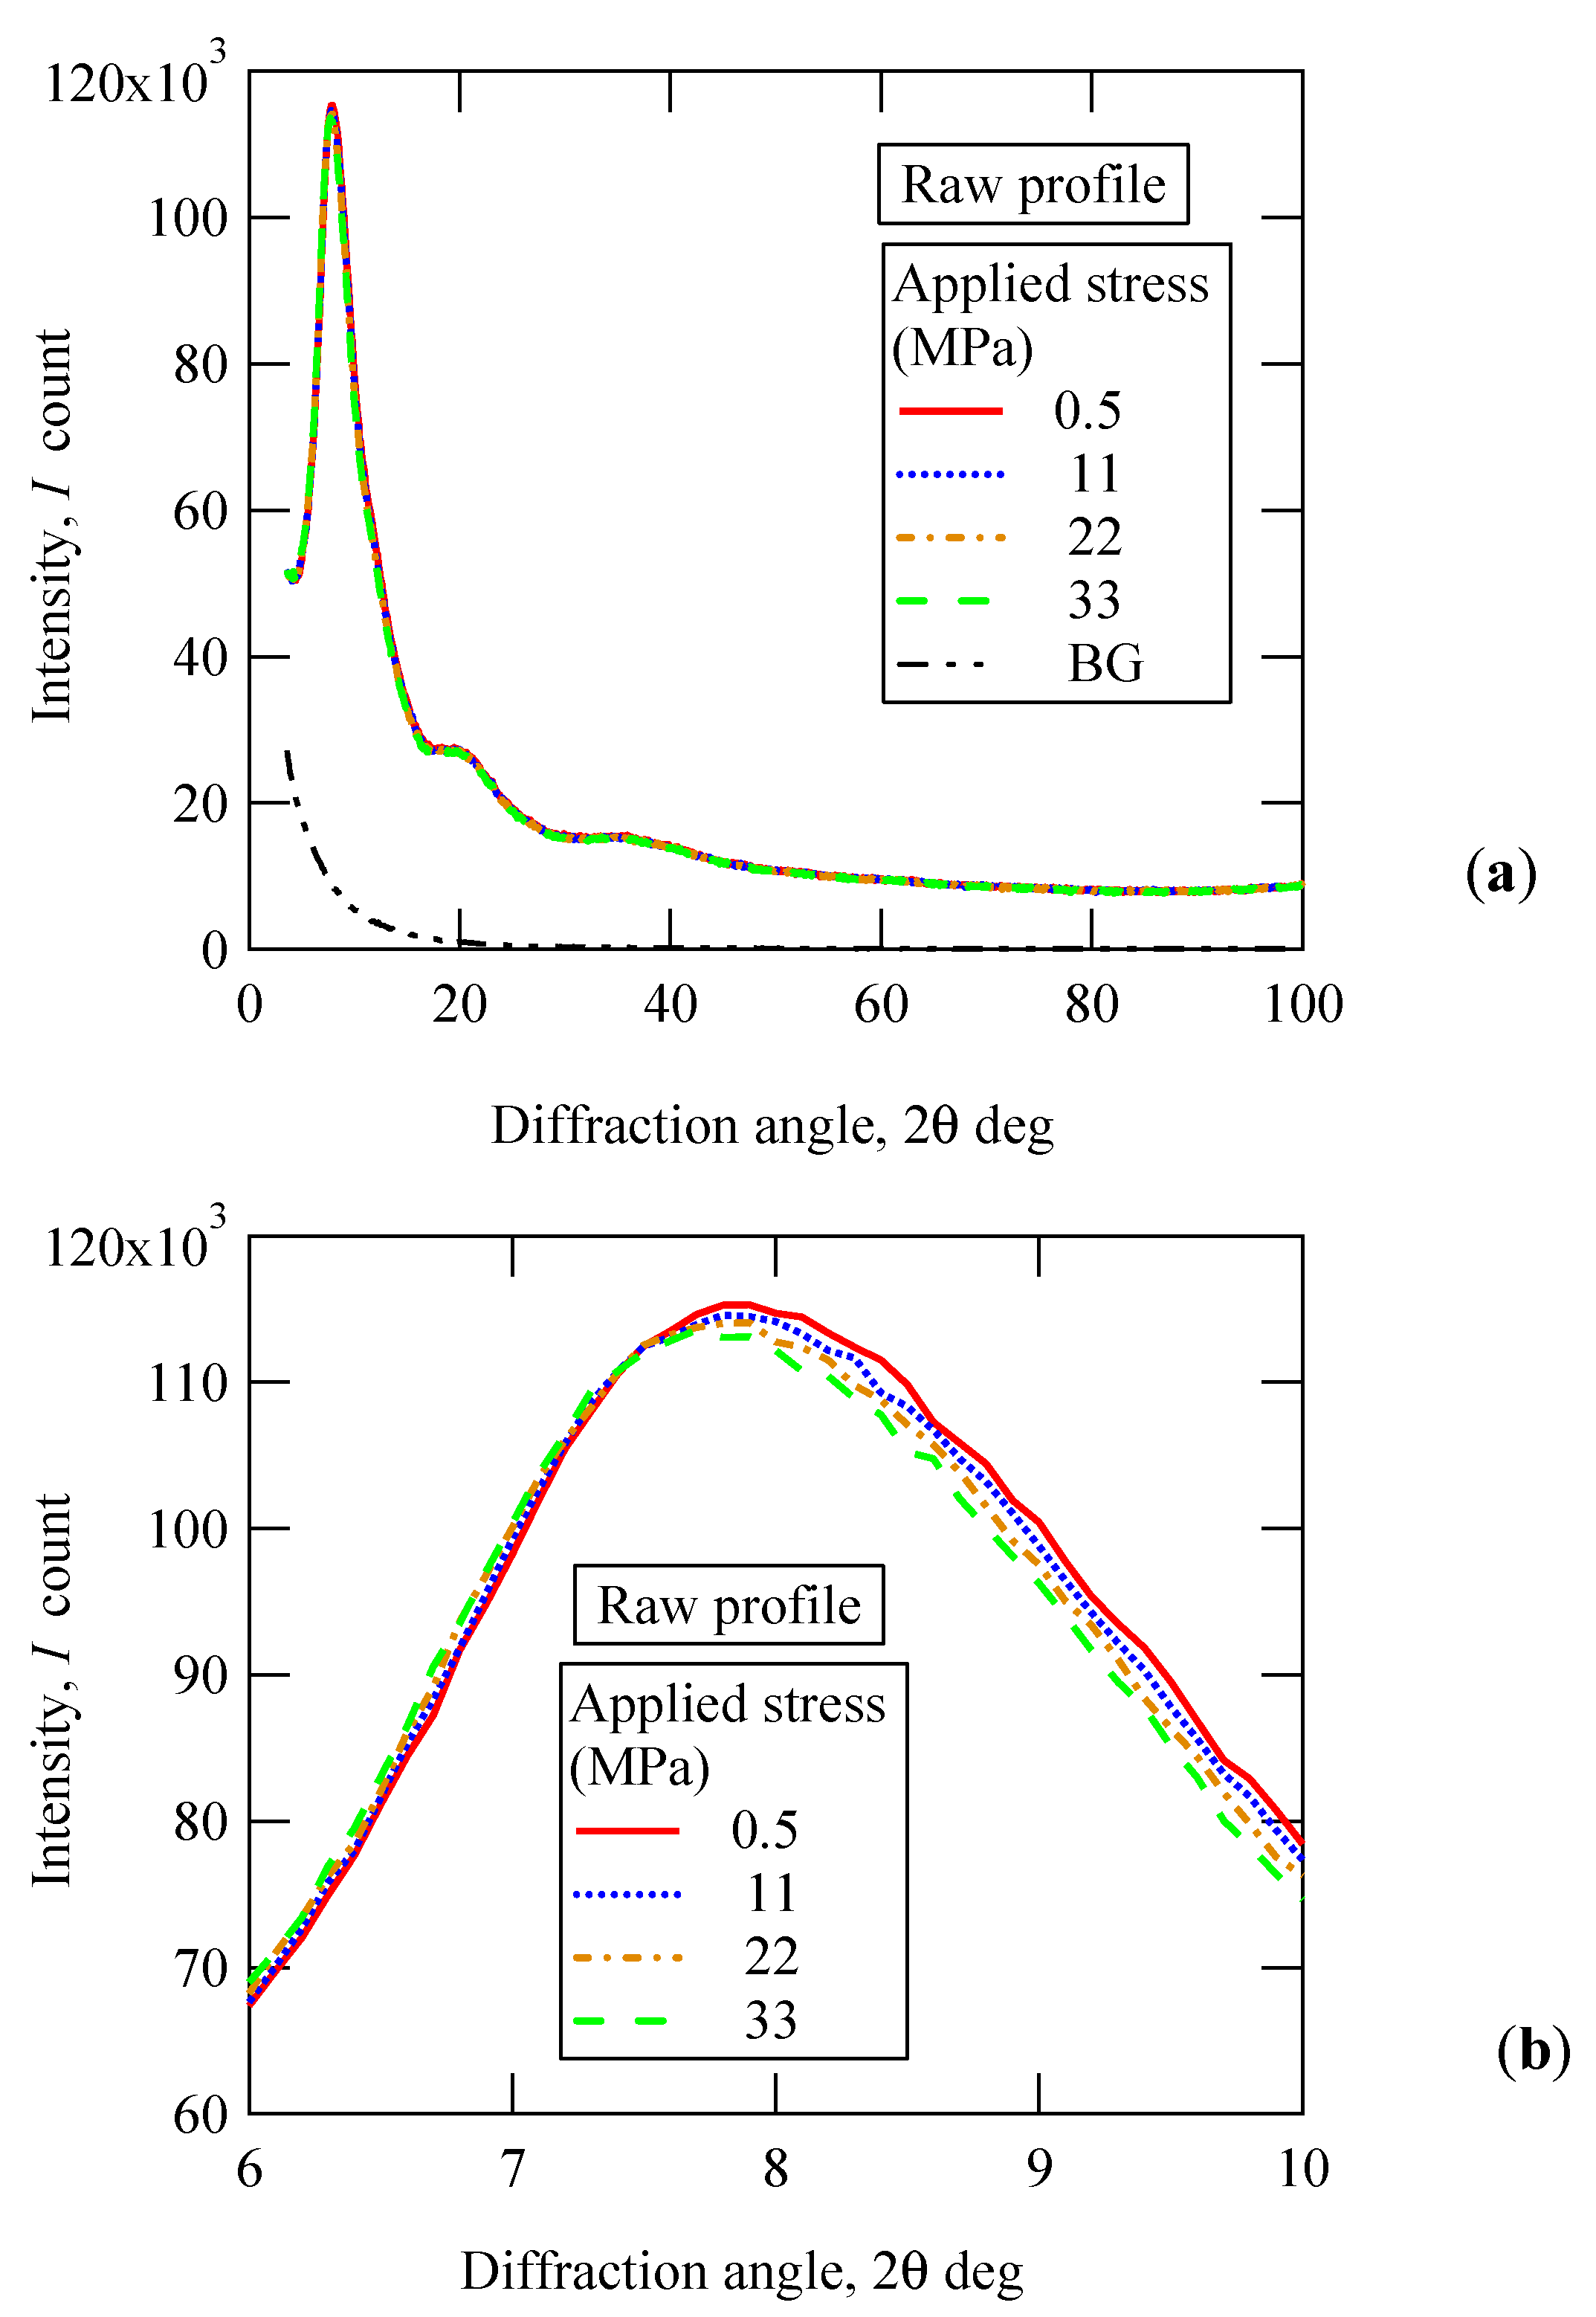
The diffraction profiles up to 100 deg in 2θ are shown in Figure 4a. The applied stresses are from 0.5 to 33 MPa. Three halo peaks specific to amorphous materials were found at 8 deg, 20 deg, and 35 deg. The first halo has the highest diffraction intensity, and its shape is asymmetric with respect to the maximum peak position. The diffraction intensity decreases gently on the high angle side. No sharp peak derived from crystalline is confirmed in the range up to 100 deg. The black dashed line in the figure shows the air-scattering profile detected by the X-ray equipment in the absence of the sample. This data was used as background data for PDF analysis.
Figure 4b is an enlarged view of the diffraction angle range from 6 deg to 10 deg in Figure 4a. The peak shape is asymmetric, and the absolute value of the gradient on the high angle side is smaller than that on the low angle side. The diffraction profile shifts to the lower angle side as the applied stress increases. This behavior is similar to the results reported by other researchers [13,14,22]. Focusing on the relationship between the profile shift amount and the diffraction angle, there is an asymmetry not only in the profile shape but also in the amount of profile shift. The amount of profile shift on the high angle side is larger than that on the low angle side.
3.2. PDF Analysis
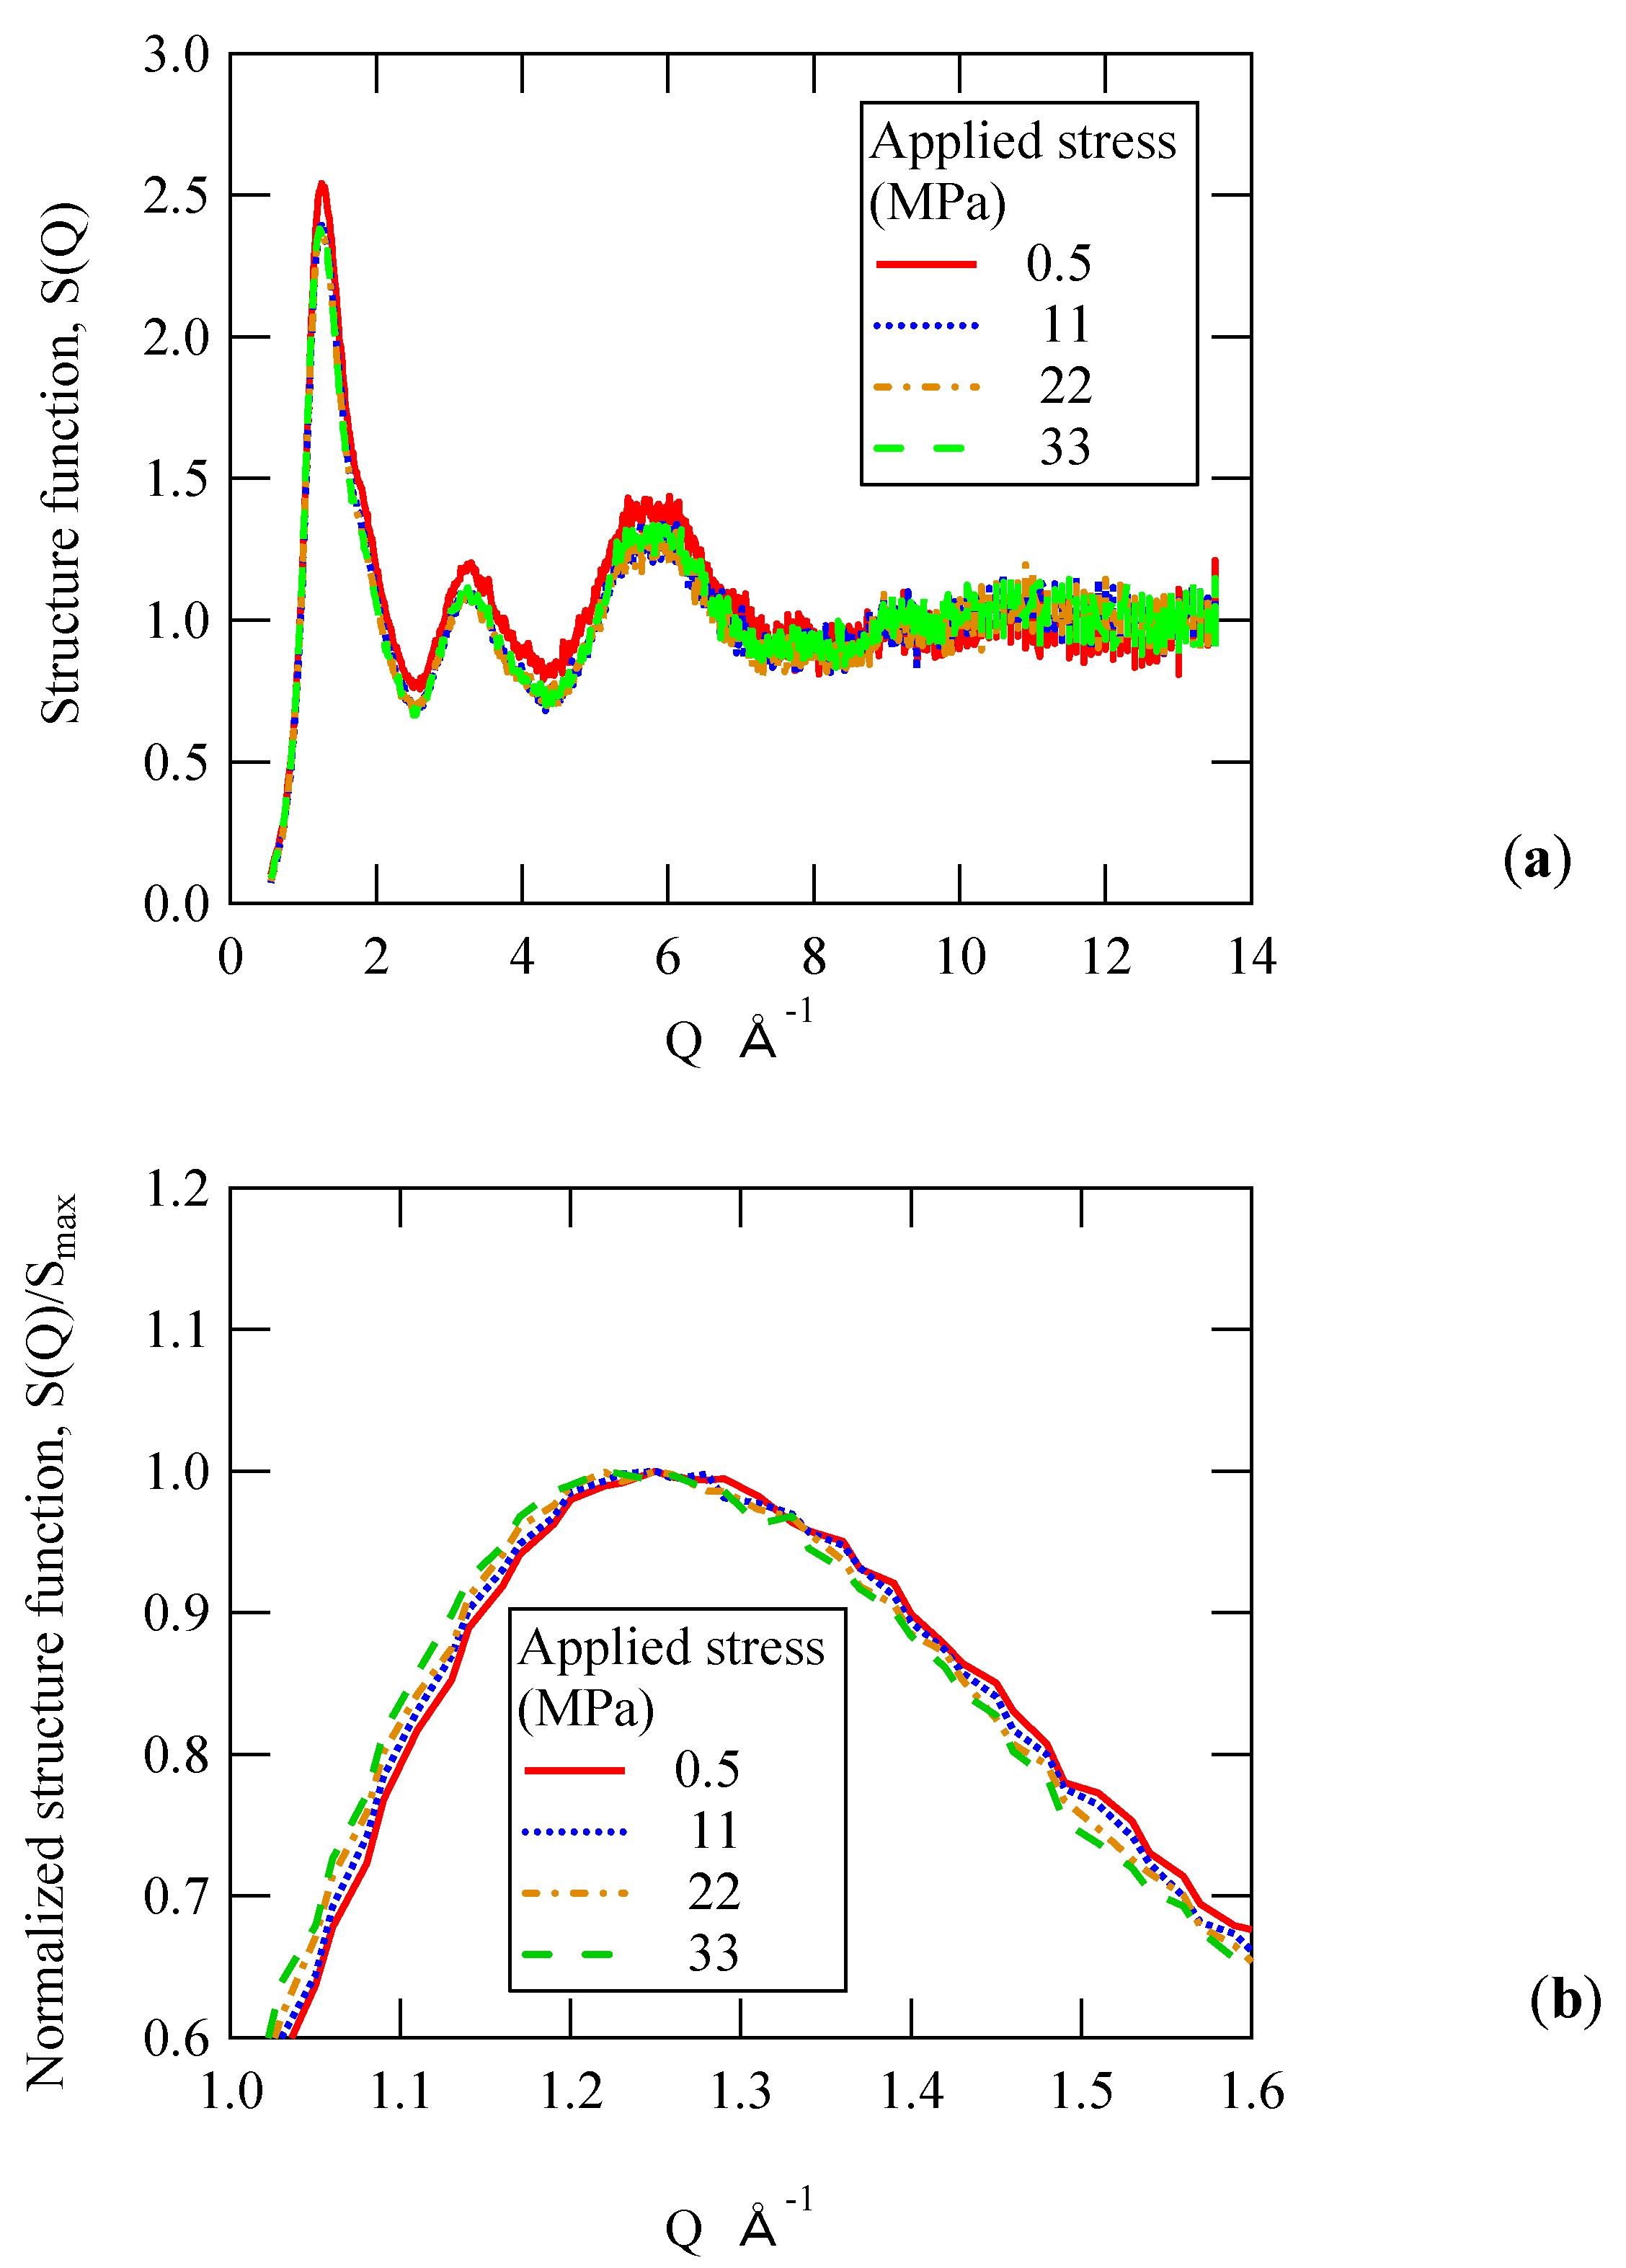
PDF analysis was carried out against the raw profile data shown in Figure 4 using PDFgetX2 [21]. Figure 5a shows the relationship between the structure function, S(Q), and the magnitude of the scattering vector, Q. As shown in Figure 4, three peaks appear for the structure function. The peak position of S(Q) corresponds to the peak diffraction angle of the raw profile data. As in the case of the raw profile data, the intensity of the first peak at Q = 1.2 Å−1 is the highest in the case of the structure function as well.
When focusing on the first peak with the highest intensity, the peak intensity is not constant with respect to the applied stress. The intensity of the 0.5 MPa is the highest. Therefore, the structure function is normalized by the maximum peak value in order to clarify the effect of the applied stress. Figure 5b shows the vicinity of the first peak of the normalized structure function profile. For example, for the applied stress of 0.5 MPa, S(Q) was normalized by dividing the maximum value Smax = 2.535. Even if it is converted into a structure function by various corrections, the asymmetry of the profile shape cannot be eliminated. Similar to Figure 4b, the absolute value of the slope on the high Q value side is smaller than that on the low Q value side. The movement of the profile data on the low Q value side is clearer than in the case of the raw profile data shown in Figure 4b, and the shift of the entire profile is confirmed.
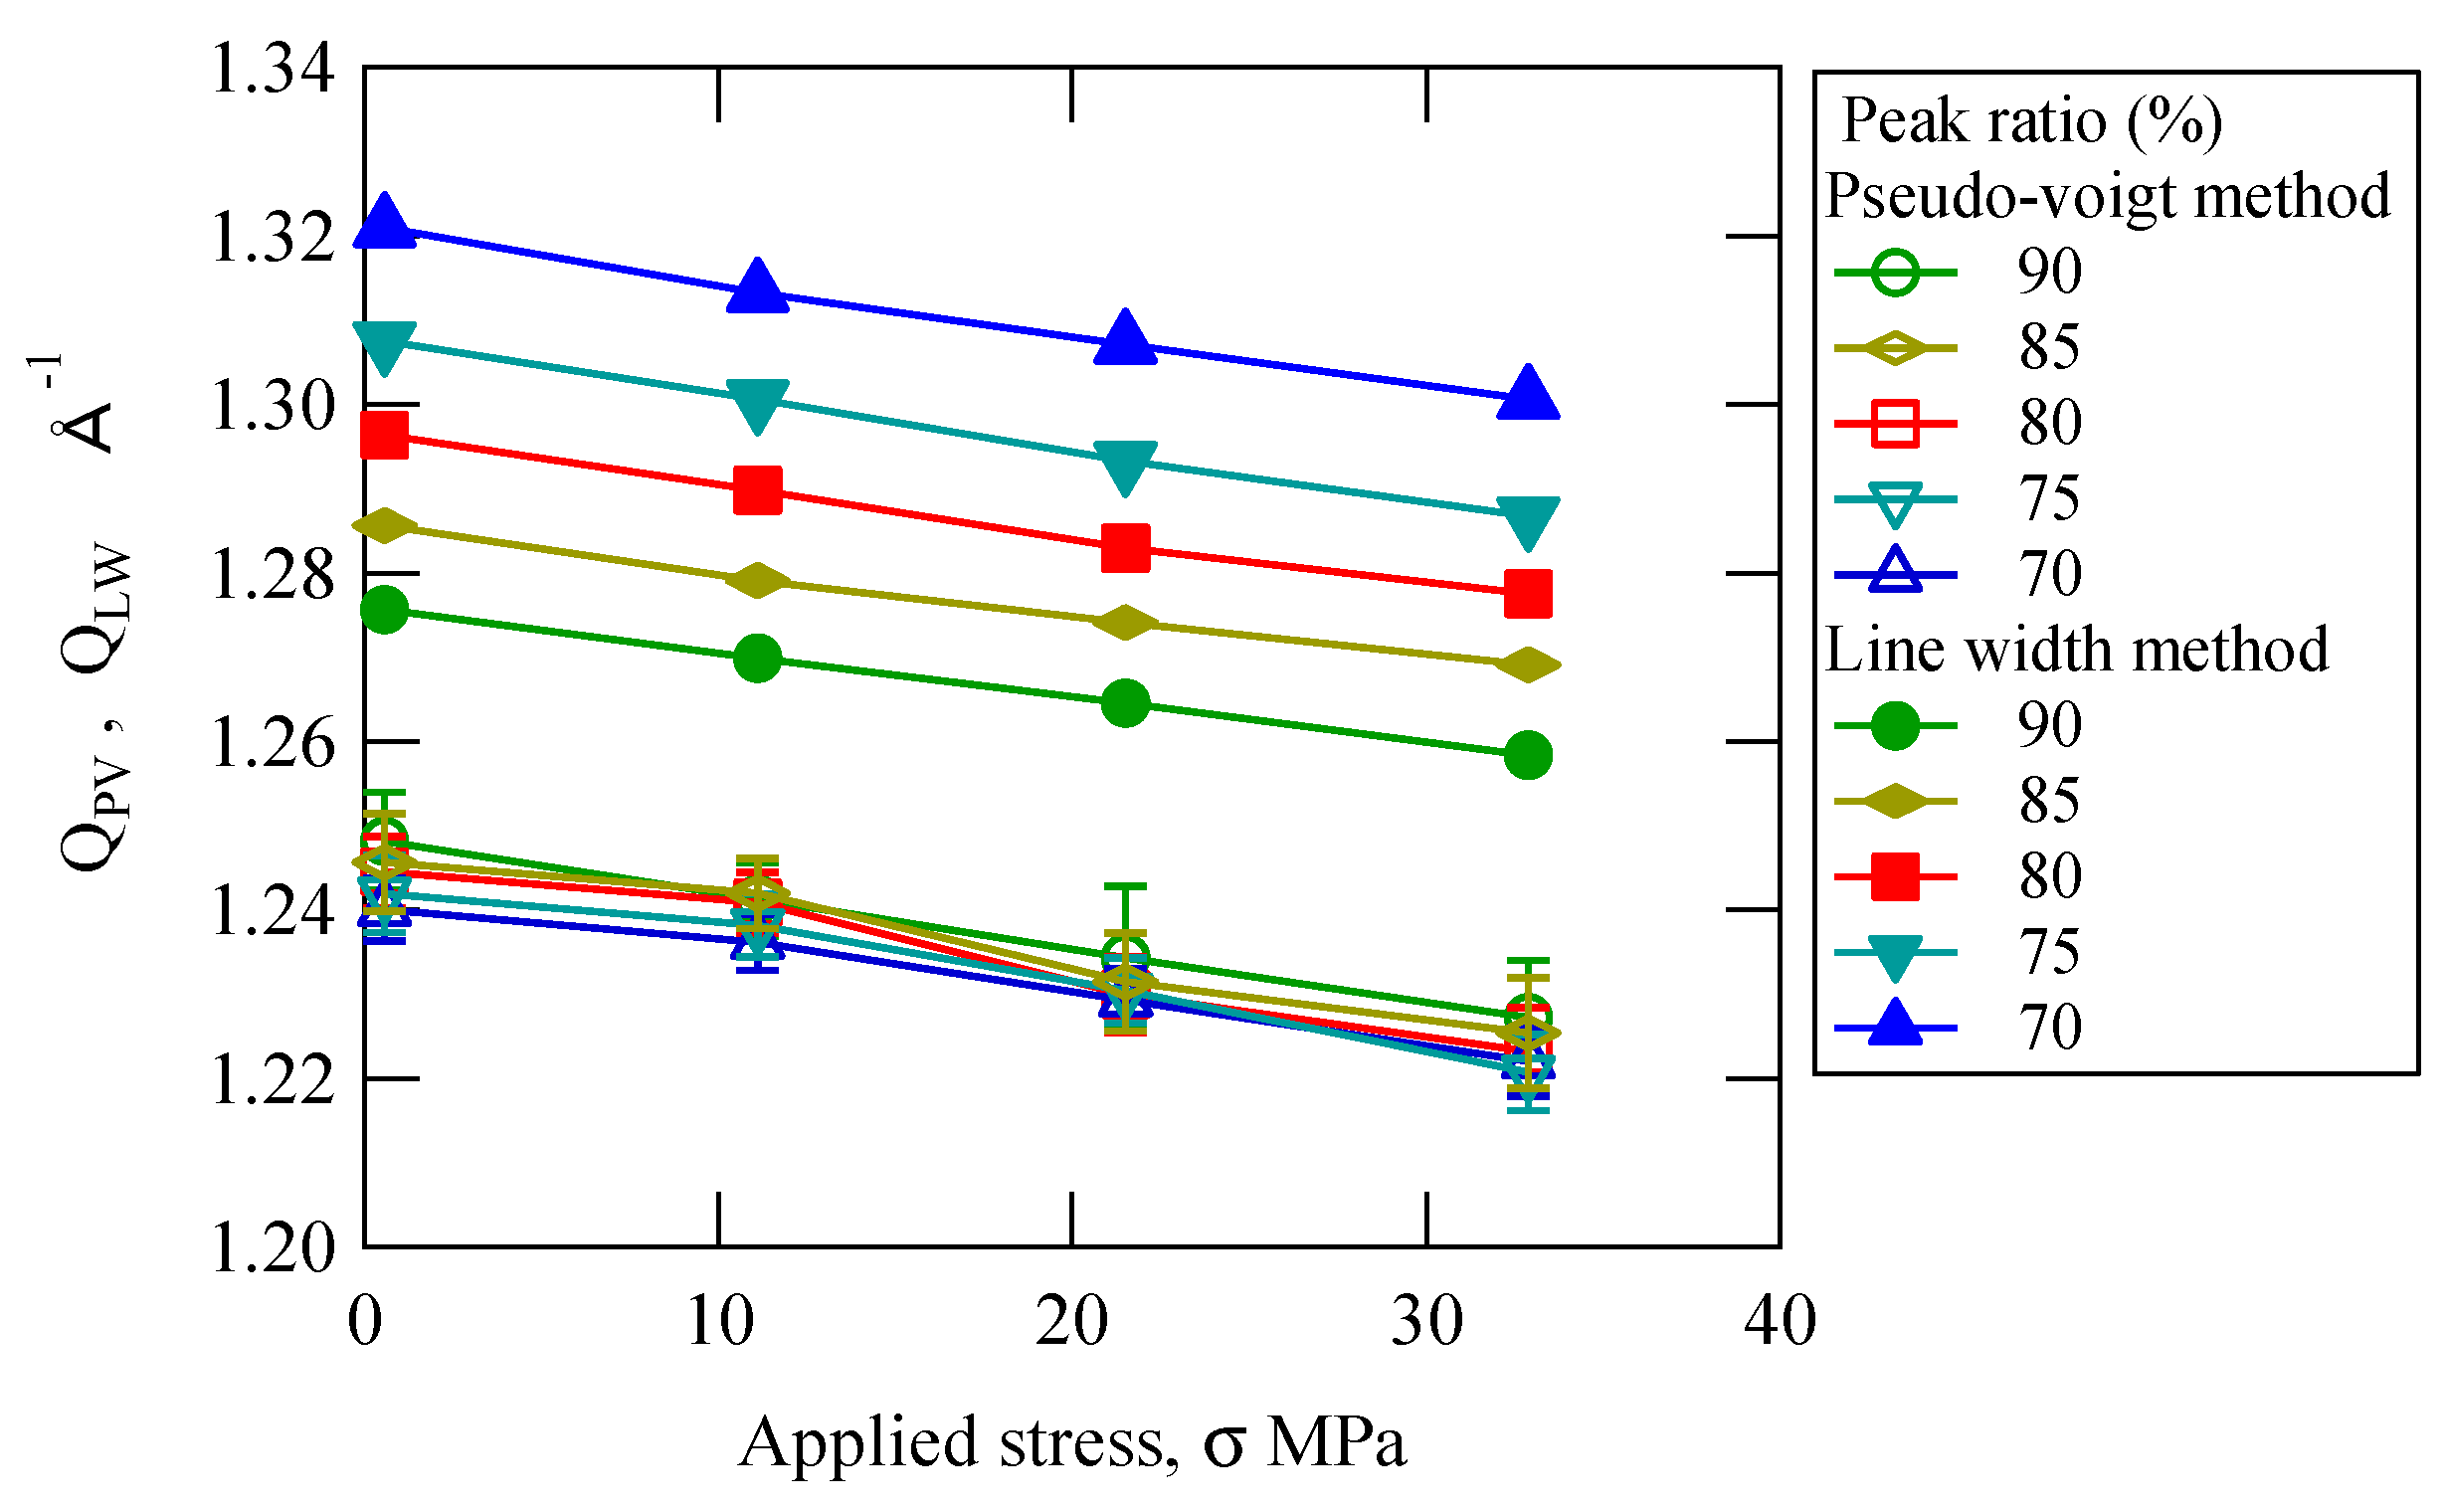
Using the normalized structure function shown in Figure 5b, the peak position was determined by the methods described in Section 2.3. Figure 6 shows the relation between the Q value of the first peak and the applied stress. In the figure, the open marks and solid marks indicate the values obtained by the pseudo-Voigt method, and the diffraction line width method, respectively. For the solid marks, the Q value decreases almost linearly with increasing applied stress. When compared at the same applied stress, the Q value decreases with increasing peak ratio, because the absolute value of the slope of the structure function profile on the high Q value side is smaller than that on the low Q value side, as shown in Figure 5b. Therefore, as the peak ratio increases, the Q value approaches the relation of the pseudo-Voigt method corresponding to the peak top value. The effect of the peak ratio on the slope of the relation between the Q value and the applied stress is not significant; however, it is important for evaluating the X-ray elastic constant, as described later. On the other hand, in the case of the pseudo-Voigt method, the tendency that the Q value decreases with increasing applied stress is the same as in the diffraction line width method. In this case, contrary to the diffraction line width method, the Q value increases slightly with increasing peak ratio. In the figure, the standard deviation for function fitting is shown by error bars. Although it is difficult to read from the figure, the error increased as the peak ratio increased.
If the Q value of the first peak is obtained as described above, the strain can be calculated by the Q-space method [16,17,18]. In this case, the Q value obtained at the applied stress of 0.5 MPa was adopted as the reference for strain calculation. Namely, if there is the residual strain that has not been removed by annealing, its value is ignored and the relative strain is discussed in this study.
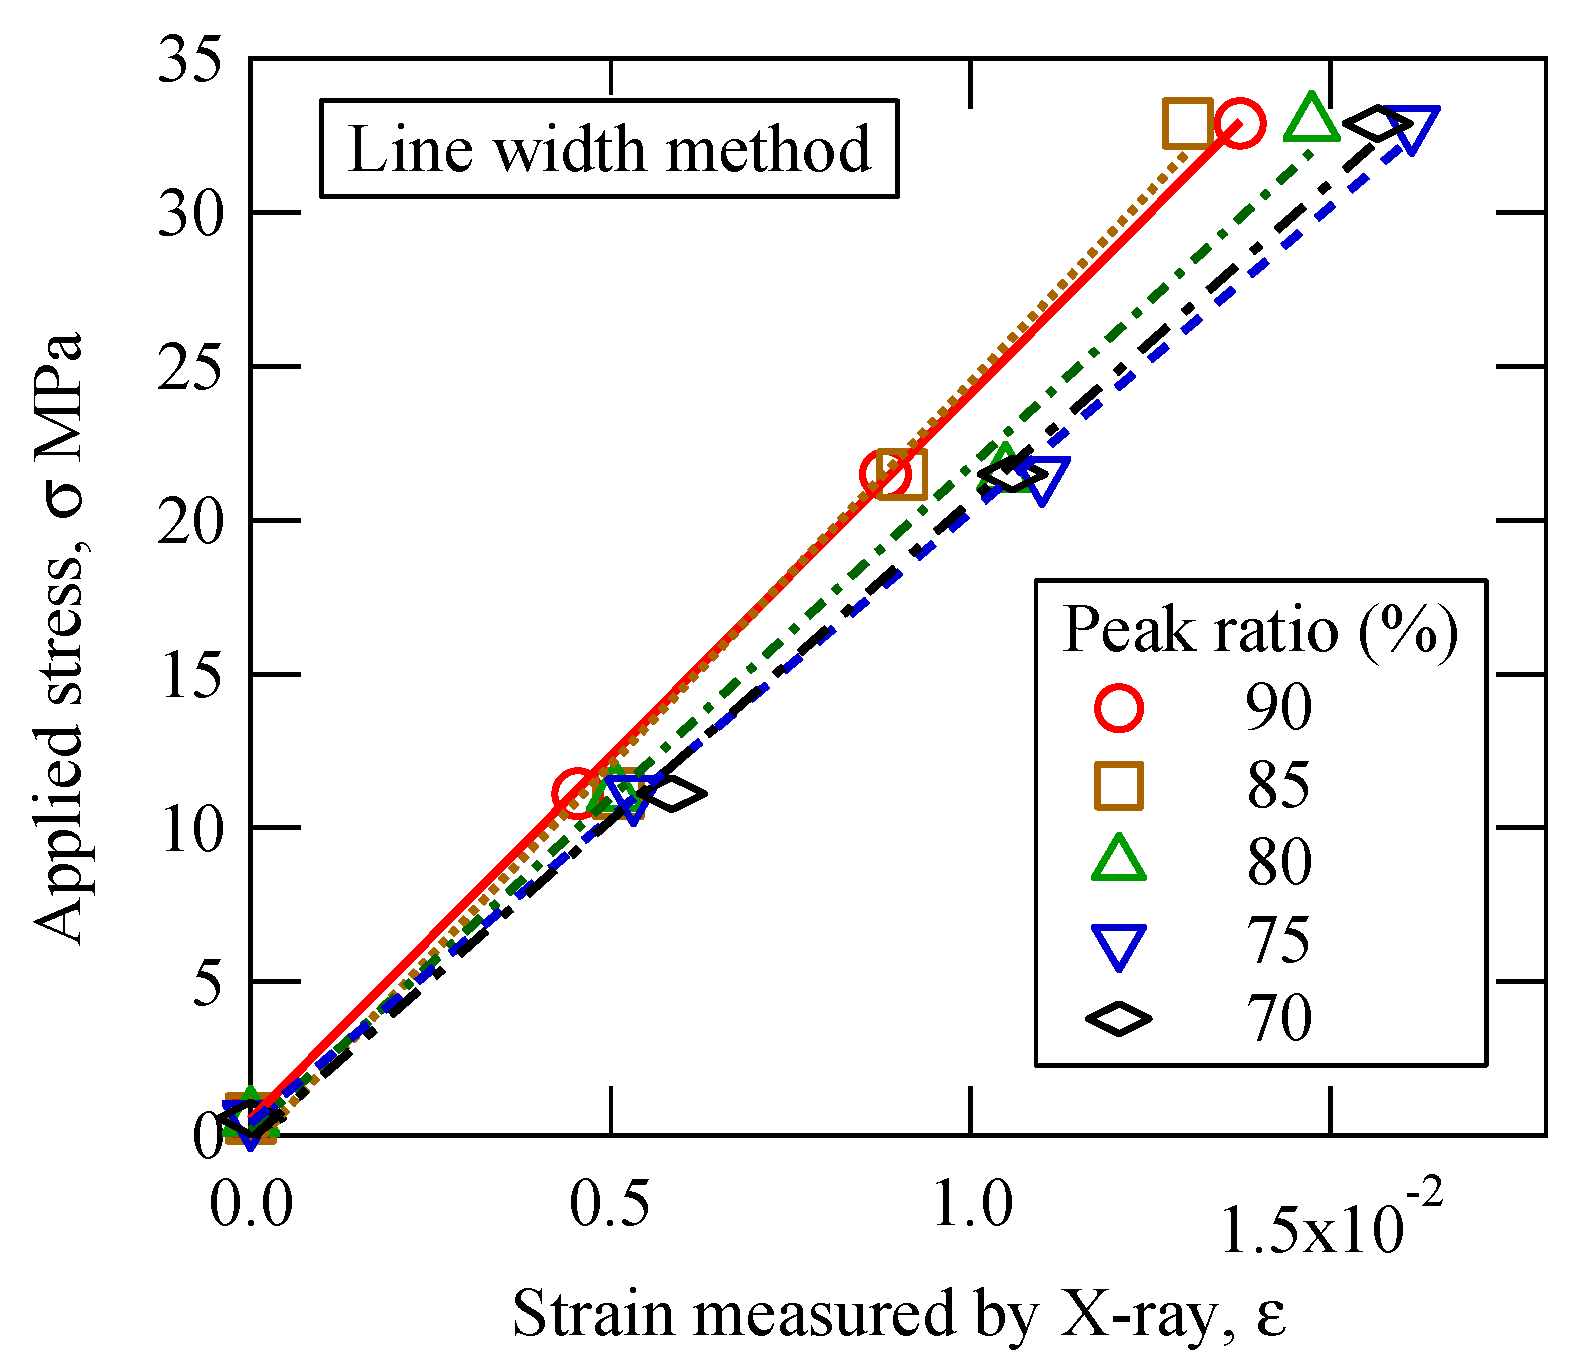
Figure 7 shows the relation between the applied stress and the strain measured by X-ray obtained by the diffraction line width method. The relationship between stress and strain shows very good linearity for each peak ratio. When compared at the same strain, the results with peak ratios of 90% and 85% are higher than other results. Although the presentation of the results is omitted, a similar linear relation was observed for each peak ratio for the results obtained by the pseudo-Voigt method. However, the linearity of the relation between the applied stress and the strain was lower than in Figure 7.
The X-ray elastic constant can be calculated from the slope of the fitted linear curve in Figure 7. The obtained Young’s modulus measured by X-ray is summarized in Figure 8. The circles in the figure indicate the Young’s modulus determined by the diffraction line width method. As expected from Figure 7, the Young’s modulus at peak ratios of 85% and 90% are greater than the values for smaller peak ratios. The horizontal dashed line in the figure is the mechanical Young’s modulus of 2279 MPa determined from the average strain measured by the strain gauge glued on the front and back surfaces of the sample. At low peak ratios of 70% and 75%, the Young’s modulus measured by X-ray is about 10% smaller than the mechanical value. On the other hand, at 85% and 90%, it is about 5% larger. In this method, the peak position depends on the peak ratio.
In the pseudo-Voigt function method, the Young’s modulus measured by X-ray is smaller than the mechanical value. The effect of the peak ratio on the Young’s modulus is smaller than that of the diffraction line width method. The Young’s modulus measured by X-ray is not large except for the peak ratio of 70%. It should be noted that the slope of the high Q-value side changes with a peak ratio of about 70% as shown in Figure 5a. The average of the four values is 1793 MPa, which is 79% smaller than the mechanical Young’s modulus. The error bar in the figure is the standard deviation of the slope of the fitting line in Figure 7. The standard deviation of the pseudo-Voigt method is larger than that of the diffraction line width method. Although the error in the value of the 90% peak ratio obtained by the pseudo-Voigt method is quite small, the error is the value for the linear approximation for the relationship in Figure 7. As shown in Figure 6, it should be noted that the fitting error to the pseudo-Voigt function becomes larger as the peak ratio increases.
In the analysis of halo profiles, attention should be paid to the fact that the accuracy of the calculation of the peak shift is not sufficient due to the broad halo peaks at low diffraction angles. As shown in Figure 8, since the Young’s modulus measured by X-ray depends on the method of determining the peak position, it is necessary to adopt the same method of the elastic constant measurement for stress measurement. This matter will be mentioned again in a simple method described below using raw profile data.
Strains were also evaluated by the direct space method, using the atomic pair distribution function [16]. However, the Young’s modulus for the first peak finally obtained was 1288 MPa, which was much smaller than the mechanical Young’s modulus and the above values. Since the accuracy is considered to be insufficient, details are omitted here. In the case of strain measurement using PDF, highly accurate evaluation can be expected by obtaining data in a wider Q value range. For that purpose, it is effective to use Ag anode and synchrotron radiation.
3.3. Simple Evaluation Method
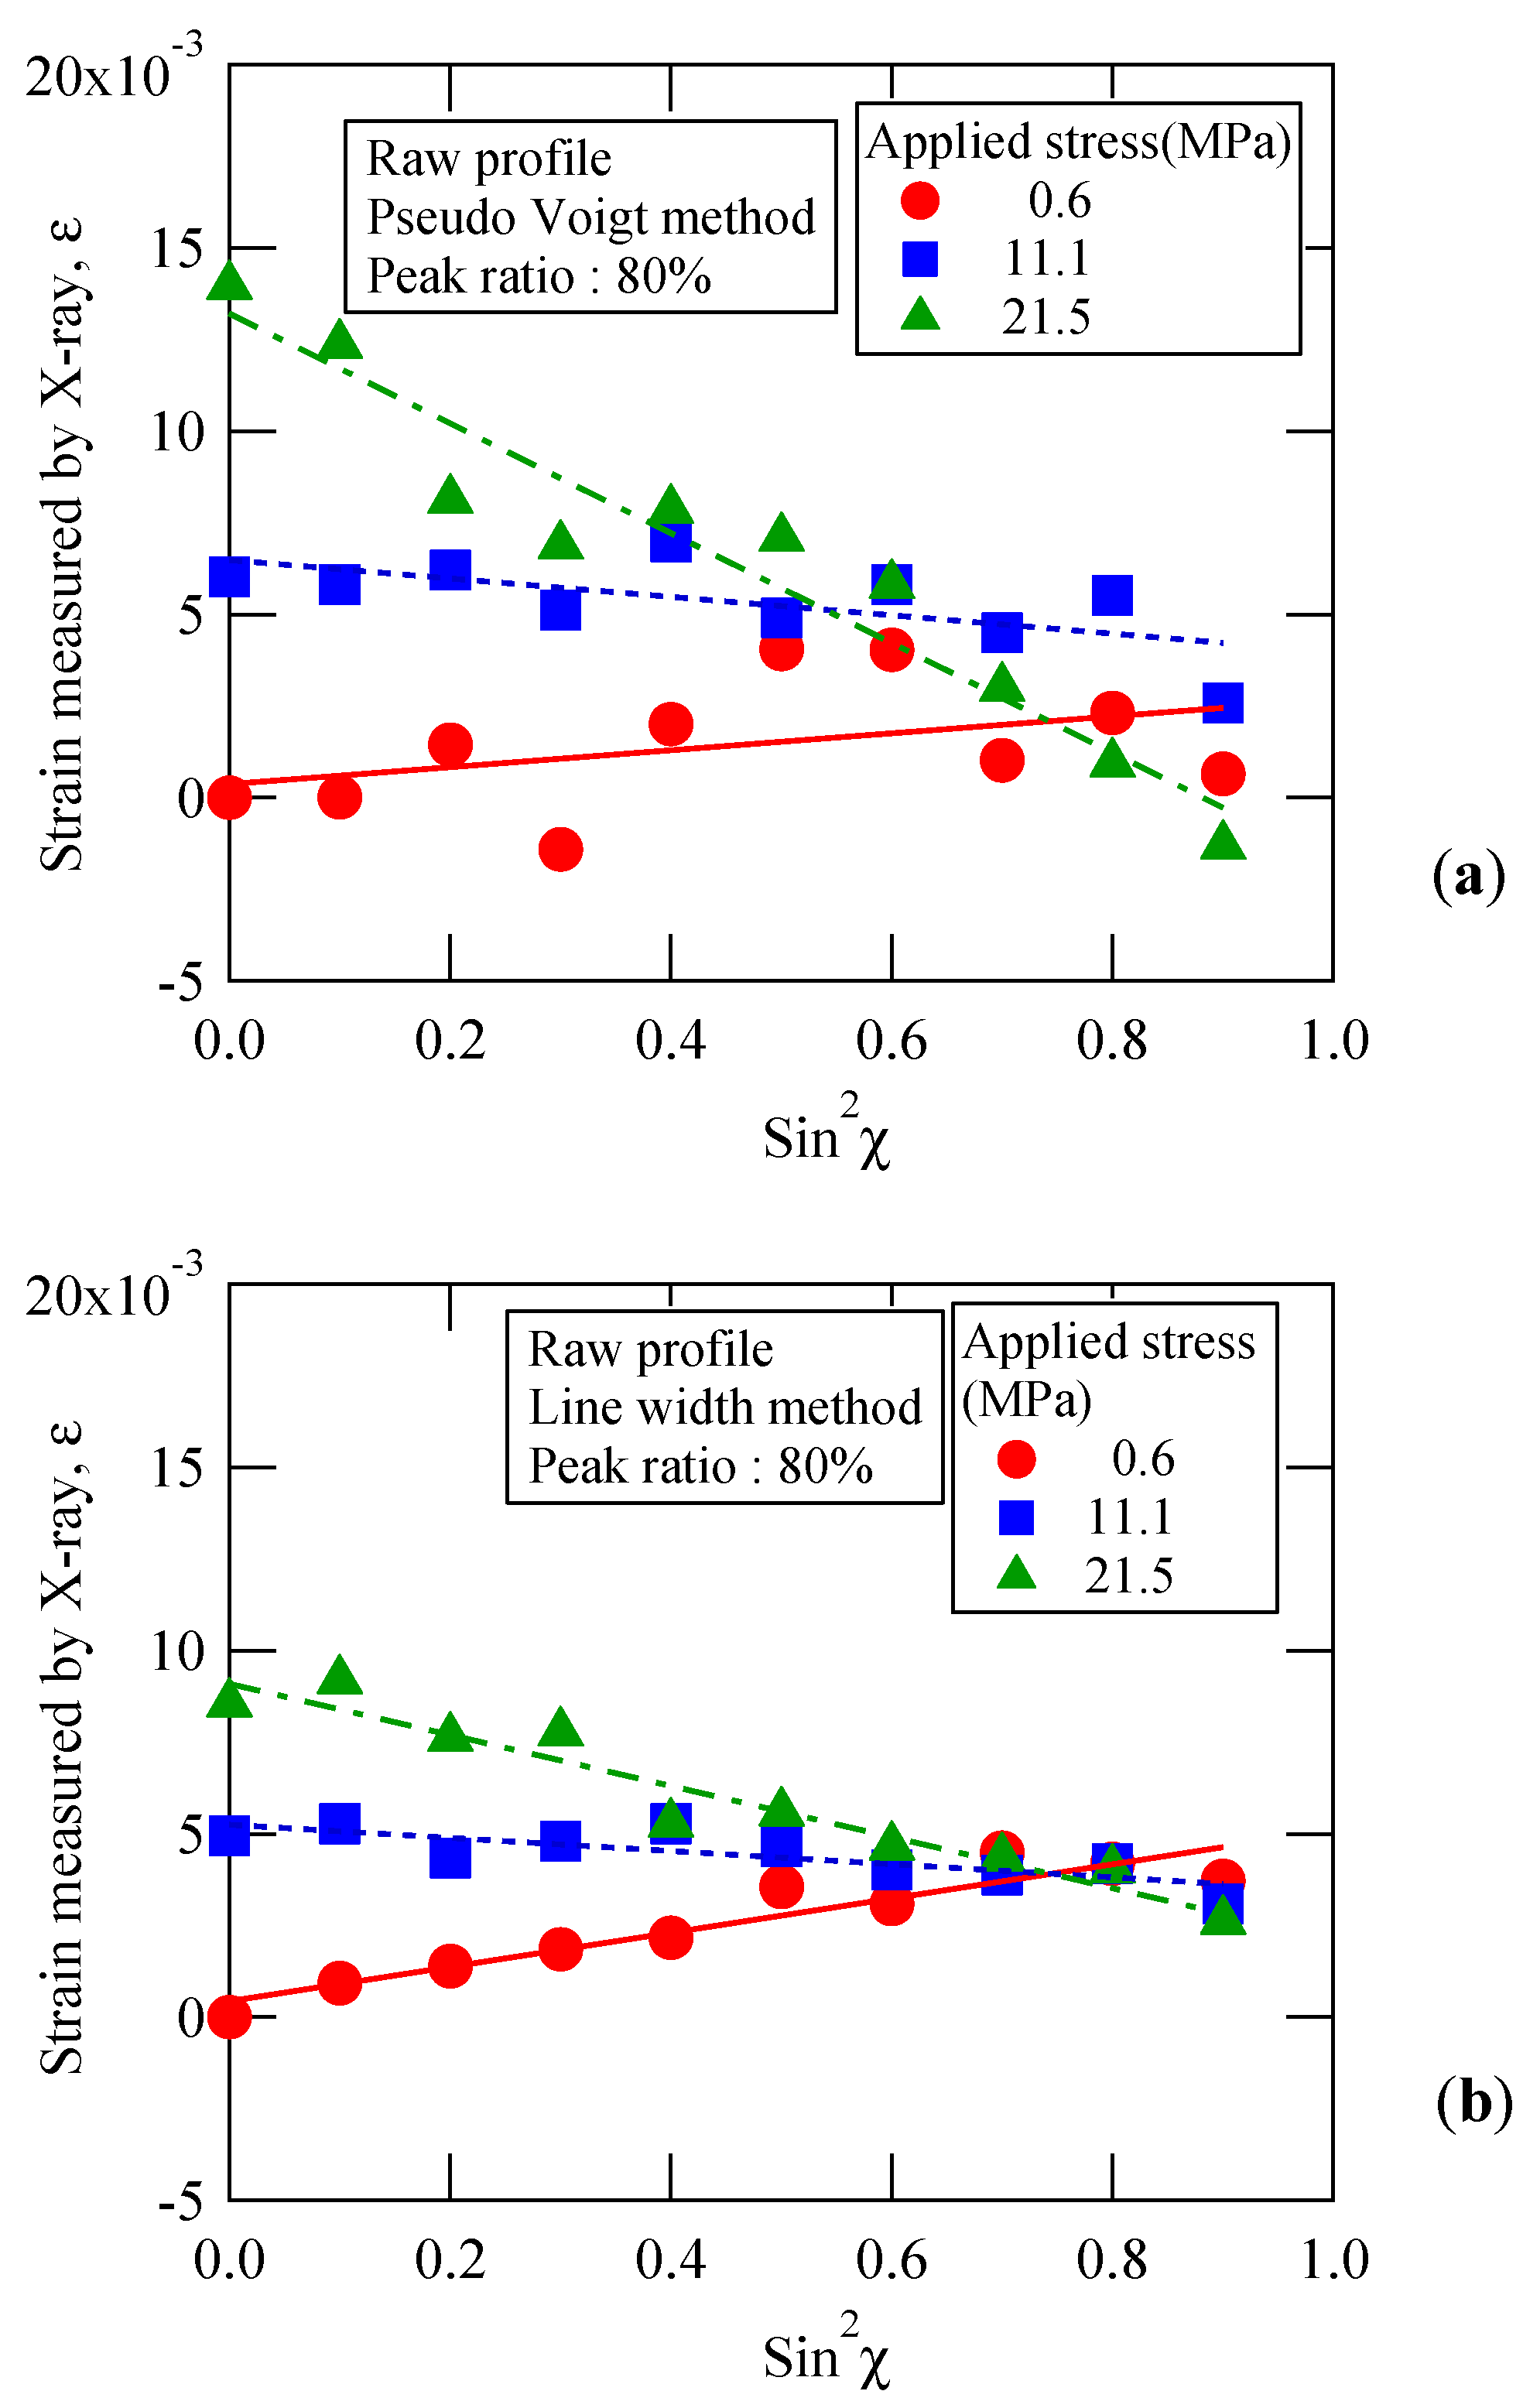
The structure function is the data obtained by correcting the raw profile data by background, polarization, atomic scattering factors, absorption, Compton scattering, etc. Practically, it is important to confirm the effectiveness of the method using raw profile data. In order to suppress the data scatter, another experiment with χ-axis rotation was conducted. Figure 9a shows the relation between the strain measured by X-ray and the value of sin2χ. The diffraction peak angle of the 1st halo was determined by the pseudo-Voigt method for the relation between the raw diffraction intensity and the diffraction angle. This figure summarizes the results corresponding to the peak ratio of 80% as a typical example. The results for other peak ratios were almost the same. The strain was determined by the Q-space method. The Q value used as a reference for the strain calculation was taken as the diffraction peak angle at sin2χ = 0 of 0.6 MPa. Namely, as mentioned above, the strain measured by X-ray means relative value. The residual strain, if existing, is ignored. In terms of stress loading, the applied stress was set to three levels from 0.6 to 21.5 MPa.
The circles in the figure indicate the results obtained for the applied stress of 0.6 MPa. Although the scatter is relatively large, it can be approximated by a straight line. The strain at sin2χ = 0 means the value in the loading direction. By using the intercept of the approximate straight line at sin2χ = 0, the influence of the scatter can be reduced. The slope of the fitted linear curve obtained for the applied stress of 0.6 MPa is positive. The slope in the unloaded state should be zero. The reason for the positive slope is considered to be the existence of the compressive residual strain. Furthermore, it is well known that injection-molded products of polymeric materials have a skin-core structure due to the fountain flow [23]. Since the molecular orientation depends on that structure, it is necessary to clarify the effect of the elastic modulus in detail. This is a subject for future work.
Data for other applied stresses can also be approximated by straight lines. The slope changes from positive to negative with increasing applied stress. The strains for sin2χ = 1 are the transverse strain perpendicular to the loading direction. By extrapolating the approximate line in Figure 9 to sin2χ = 1, not only the Young’s modulus, but also the Poisson’s ratio measured by X-ray can be determined. In the case of the uniaxial loading of a homogeneous material, these three lines in Figure 9a intersect at a specific point. The intersection point corresponds to sin2χ = 1/(1 + v). However, the intersection of the three straight lines in Figure 9 has a large difference, and the accuracy is extremely insufficient.
On the other hand, Figure 9b summarizes strain for the peak ratio of 80% by the diffraction line width method. The circles in the figure also indicate the data for the applied stress of 0.6 MPa, and the scatter is smaller than that of the pseudo-Voigt method as shown in Figure 9a. The slope is positive (as in Figure 9), and regardless of the method of peak determination, this result has intrinsic significance. The gradient change obtained from approximate lines is smaller than that in Figure 9a; however, they intersect at one particular point. The Poisson’s ratio calculated from the intersection point of sin2χ = 0.74 becomes 0.35. The value is close to the mechanical Poisson’s ratio of 0.37. The diffraction line width method is expected to be more accurate than the pseudo-Voigt method. These results were similar to other peak ratio data. It is suggested that the split type pseudo-Voigt function may not be suitable for the approximation of raw profile data. On the other hand, in the diffraction line width method, the target data are limited to a narrow range, and it is not necessary to approximate the entire profile. Therefore, it is a practical and general-purpose method to evaluate the shift of the raw profile data because of its high flexibility to profile shapes.
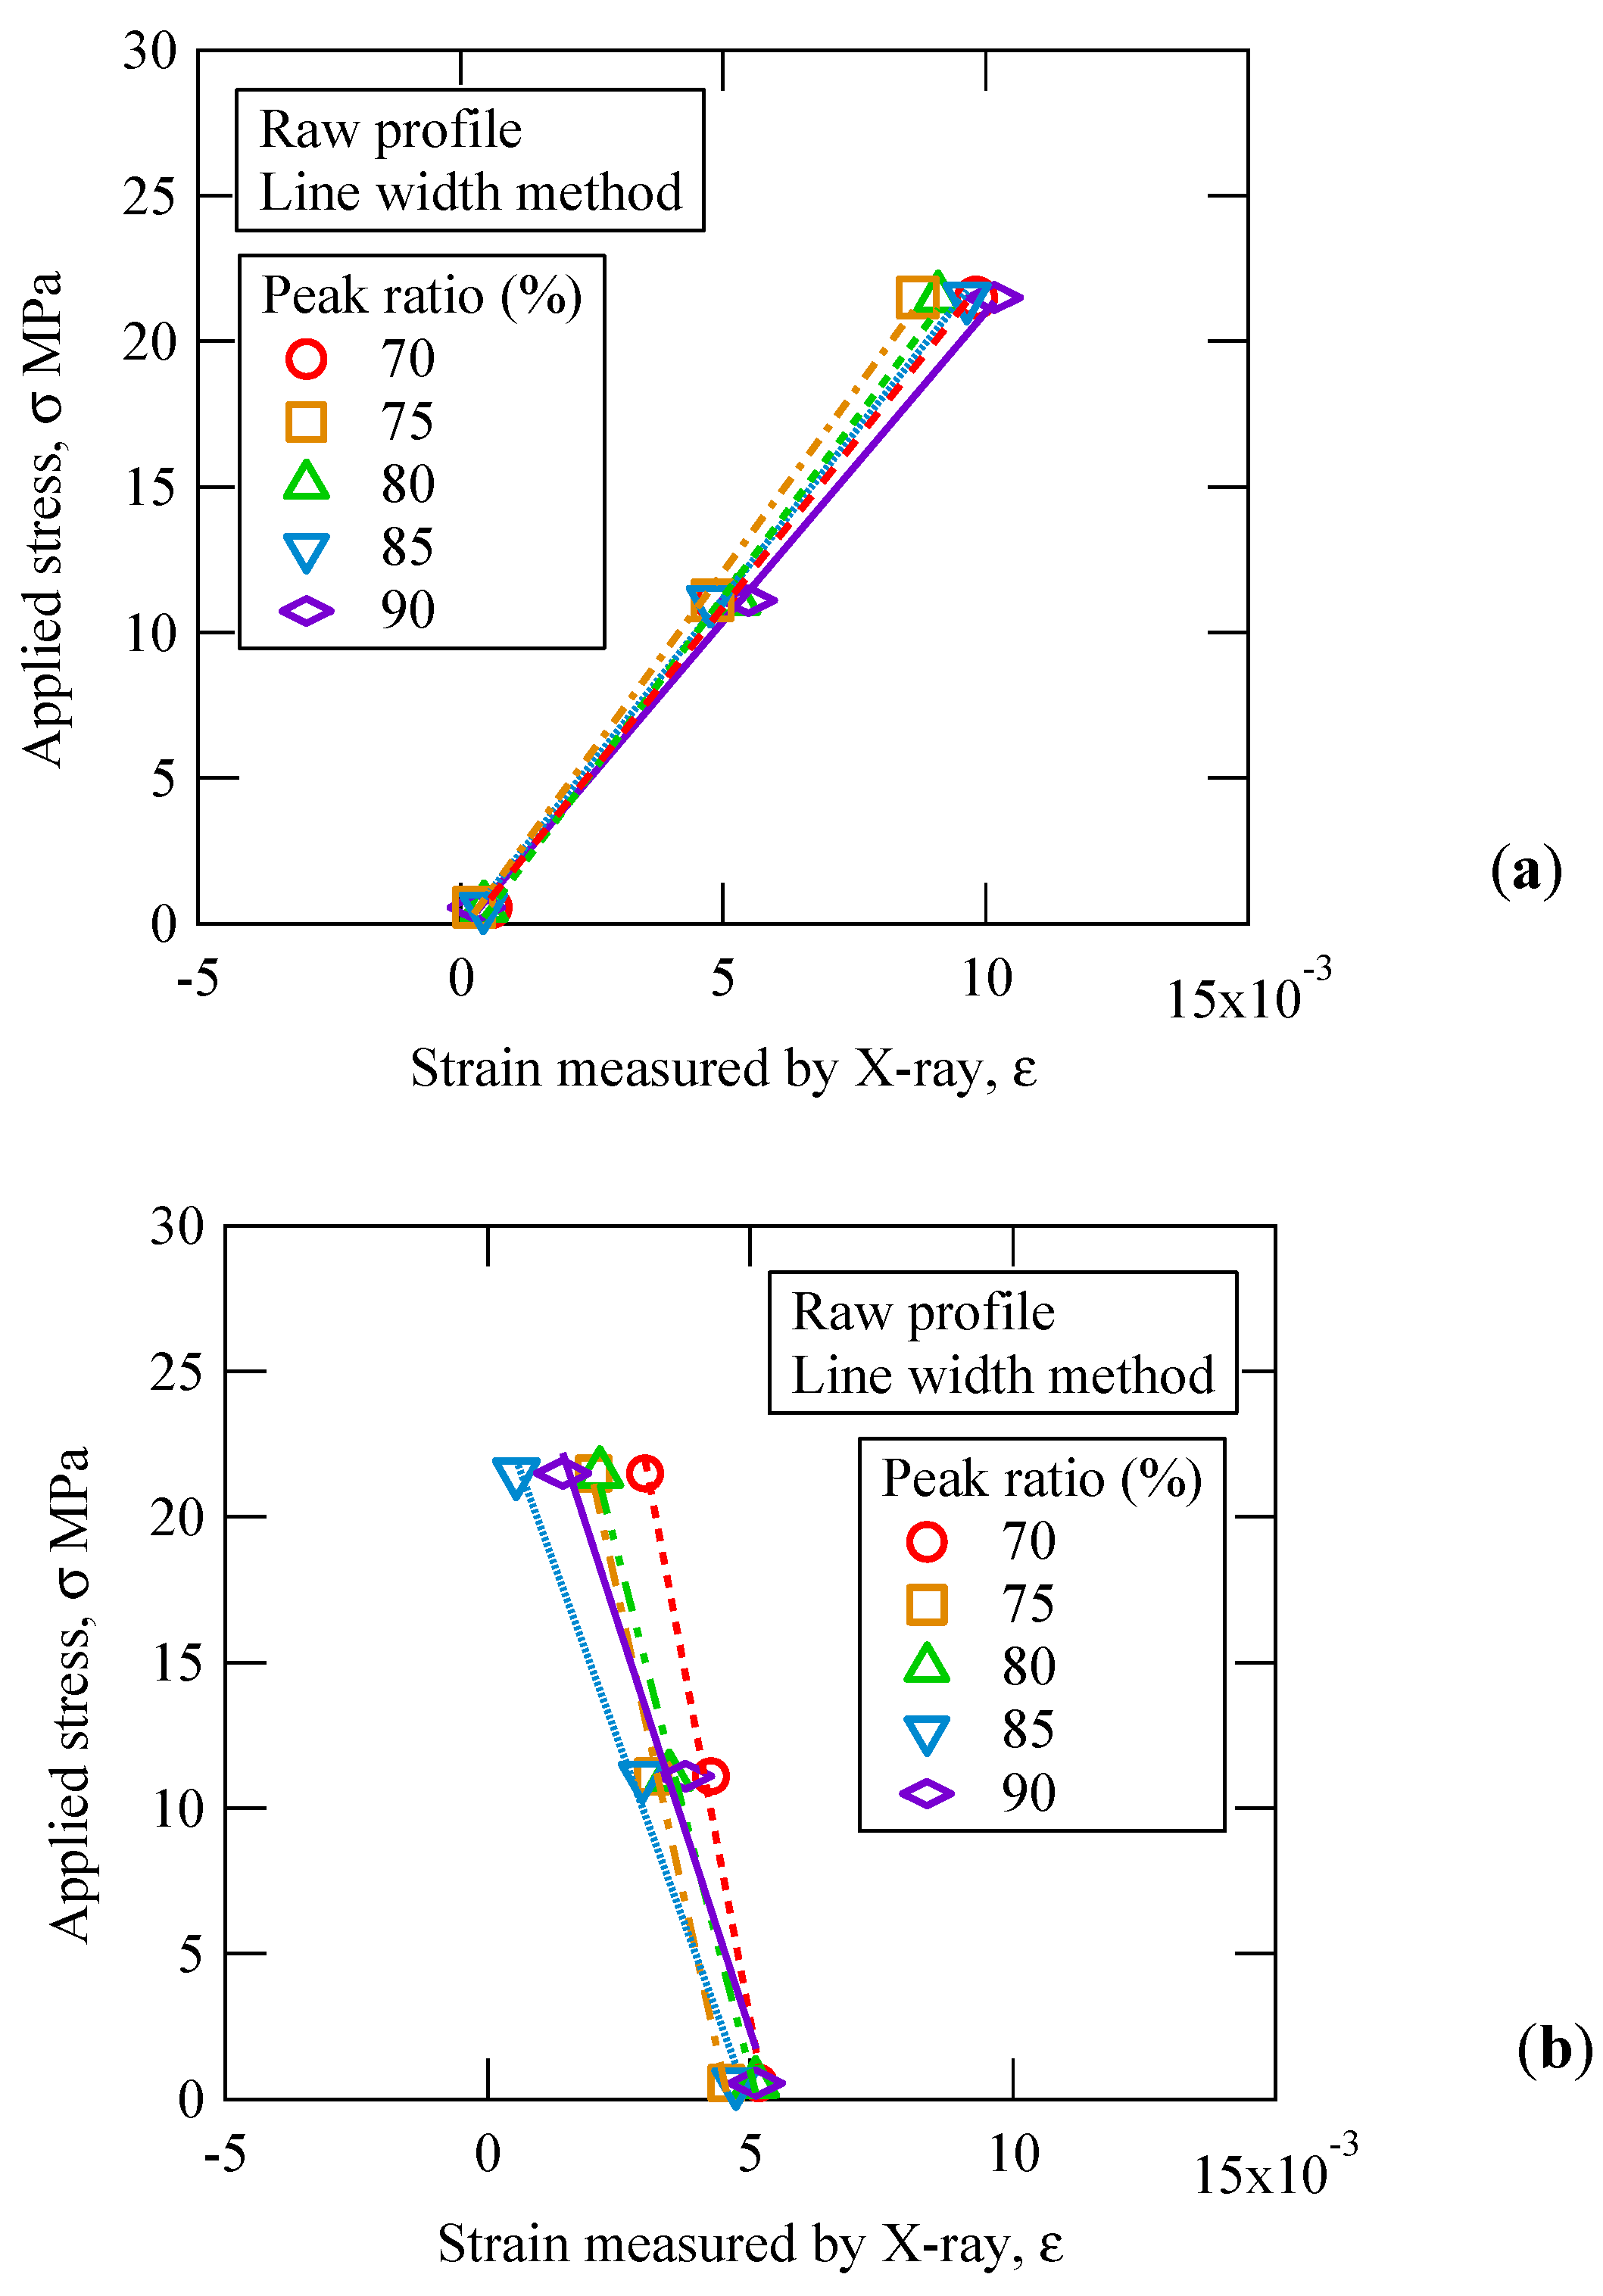
Figure 10a shows the relation between the applied stress and the longitudinal strain obtained by the diffraction line width method for peak ratios of 70 to 90%. The strain value of the intercept at sin2χ = 0 of the fitted linear curve in Figure 9b was plotted. Although there are only three data points, the results for each peak ratio can be approximated by a straight line. Figure 10b shows the relationship between the applied stress and the transverse strain measured by X-ray. As described previously, the reference applied to calculate the strain is the diffraction angle for sin2χ = 0 of 0.6 MPa. Therefore, the transverse strain at zero applied stress varies around 5 × 10⁻³. The transverse strain decreases with increasing applied stress, and of course, the slope becomes negative.
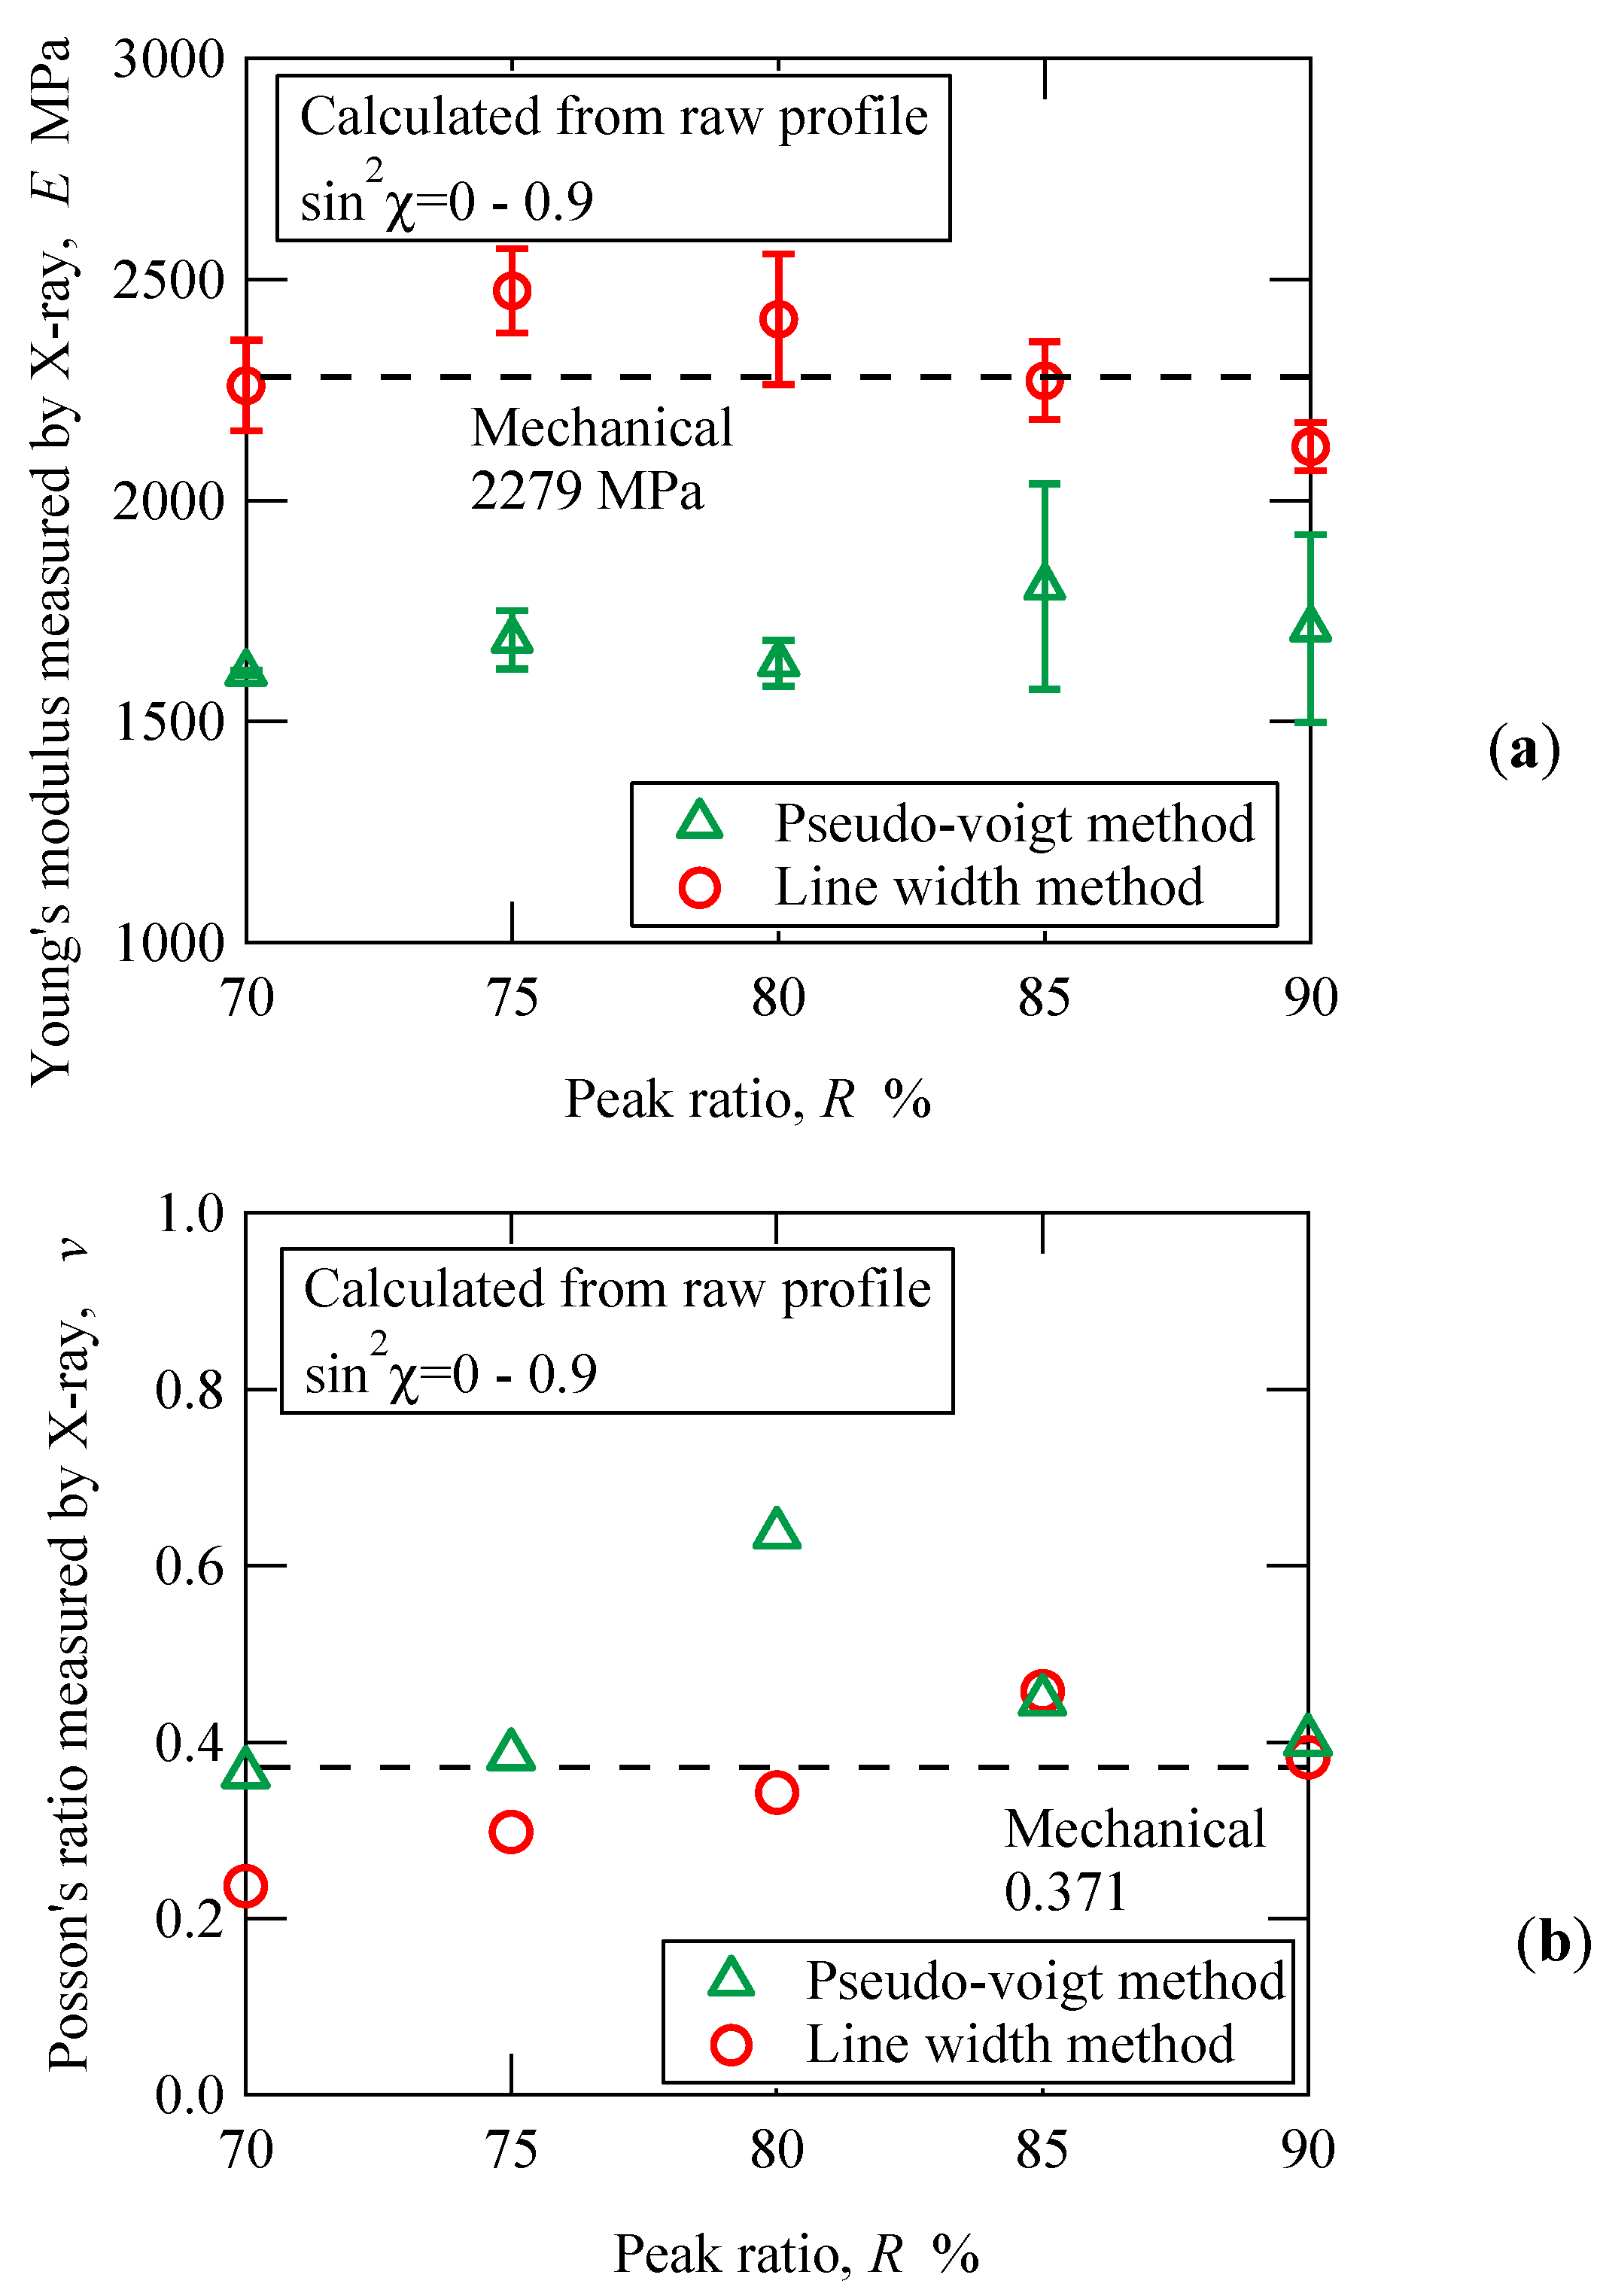
Figure 11a shows the relation between the Young’s modulus measured by X-ray and the peak ratio obtained from the slope in Figure 10a. The results obtained by the pseudo-Voigt method and the diffraction line width method were summarized. The dashed line in the figure shows the mechanical Young’s modulus, and the error bar is the standard deviation of the slope of the fitting line in Figure 10. As in Figure 8, the Young’s modulus measured by X-ray of the diffraction line width method is larger than that of the pseudo-Voigt method. In the pseudo-Voigt method, the dependence of the peak ratio is small, and it is almost constant, or increases slightly, as the peak ratio increases. However, the error bars of 85% and 90% data are large in this case. The average of the five values is 1688 MPa, which is 74.1% of the mechanical Young’s modulus. On the other hand, Young’s modulus determined by the diffraction line width method decreases as the peak ratio increases, except for a peak ratio of 70%. The maximum value is for a peak ratio of 75%, which is 1.17 times higher than the 90% value. The average of five points is 2319 MPa, which is 1.02 times of the mechanical Young’s modulus. In the simple method, the effect of the peak position determination method is remarkable. This is due to the diffraction angle dependence of the peak shift and suggests that the profile shape changes with loading. From the viewpoint of the accuracy of strain measured by X-ray, the application of the diffraction line width method can be expected as a practical strain evaluation method.
Figure 11b shows the relation between the Poisson’s ratio measured by X-ray and the peak ratio. In contrast to the Young’s modulus measured by X-ray in Figure 11a, the results of the pseudo-Voigt method are larger than those of the diffraction line width method. In the diffraction line width method, the Poisson’s ratio increases with the increase in the peak ratio. Namely, if it is necessary to determine the stresses, the same peak ratios must be used as when the elastic constants are determined. The average of the five points is 0.344, which is 0.93 times of the mechanical Poisson’s ratio. In the case of the pseudo-Voigt method, 80% of the data are obviously too large. The average of the four points excluding the data of 80% is 0.399, which is 1.308 times of the mechanical Poisson’s ratio.
In this study, a method for determining the X-ray elastic constants by transmission geometry is investigated for X-ray stress measurement of polymer materials. In the industrial field, the stress near the surface is often important, so the measurement by the reflection method is necessary. Particularly near the surface of the products, the effect of molecular orientation of the skin layer is expected to be large. It is desirable to establish a highly accurate nondestructive stress measurement method to improve the yield rate due to the deformation of injection-molded products and to ensure safety against environmental stress cracking.
4. Conclusions
In this study, the effect of the peak determination method on the X-ray elastic constants of amorphous polymers was investigated in order to obtain basic data for stress measurement. Strains were calculated by the Q-space method for the raw diffraction profile and structure function profile of polycarbonate to determine the X-ray elastic constants. The peak position of the profile was determined by the method of approximating with the split type pseudo-Voigt function and the diffraction line width method. The main results obtained are summarized below.
- (1)
- The first peak of the structure function shifts to the lower Q value side with increasing the applied stress, and the strain obtained from the amount of the peak shift can be approximated by a straight line with respect to the loading stress in the elastic region.
- (2)
- The Young’s modulus measured by X-ray determined from the strains determined by the pseudo-Voigt method is smaller than the value determined by the diffraction line width method. The Young’s modulus obtained by the diffraction line width method is close to the mechanical value, however, it varied depending on the peak ratio.
- (3)
- In the simple method using raw profile data, the Young’s modulus measured by X-ray determined by the diffraction line width method decreased with increasing peak ratio. The value determined by the pseudo-Voigt method was smaller than the mechanical value and was almost constant.
- (4)
- The Poisson’s ratio determined by the diffraction line width method increased with increasing peak ratio, in contrast to the Young’s modulus.
- (5)
- In the simple method, the diffraction line width method can be used to determine the elastic constants with sufficient accuracy for industrial use. When the stress evaluation is required, the same conditions must be used as determining the elastic constants.
Author Contributions
Conceptualization, Y.A.; Experiments and Data Analysis, Y.K.; Writing—Original Draft Preparation, Y.A. and Y.K. All authors have read and agreed to the published version of the manuscript.
Funding
This work was supported by JSPS KAKENHI Grant Number 18H01333.
Acknowledgments
We are grateful to K. Iwahori of DENSO Co. for providing us the polycarbonate plates. We also thank H. Kimura of Toyota Central R&D Labs., Inc. and R. Yokoyama of Rigaku Co. for useful discussion on X-ray stress measurement.
Conflicts of Interest
The authors declare that they have no competing interests.
References
- Kambour, R.P.; Gruner, C.L.; Romagosa, E.E. Biphenol-A polycarbonate immersed in organic media. Swelling and response to stress. Macromolecules 1974, 7, 248–253. [Google Scholar] [CrossRef]
- Robeson, L.M. Environmental stress cracking: A review. Polym. Eng. Sci. 2013, 53, 453. [Google Scholar] [CrossRef] [Green Version]
- Society of Materials Science. Standard for X-ray Stress Measurement =Iron and Steel =(JSMS-SD-5-02); Society of Materials Science: Kyoto, Japan, 2002. (In Japanese) [Google Scholar]
- Society of Materials Science. Standard Method for X-ray Stress Measurement (JSMS-SD-10-05); Society of Materials Science: Kyoto, Japan, 2005. [Google Scholar]
- ASTM E1426—14 (2019) e1. Standard Test Method for Determining the X-ray Elastic Constants for Use in the Measurement of Residual Stress Using X-ray Diffraction Techniques; American Society for Testing and Materials: West Conshohocken, PA, USA, 2019. [Google Scholar]
- ASTM E915—19. Standard Test Method for Verifying the Alignment of X-ray Diffraction Instrumentation for Residual Stress Measurement; American Society for Testing and Materials: West Conshohocken, PA, USA, 2019. [Google Scholar]
- Tanaka, K.; Matsui, E.; Akiniwa, Y. X-ray Stress Measurement of Sintered Alumina. J. Soc. Mater. Sci. Jpn. 1986, 35, 749–754. [Google Scholar] [CrossRef]
- Tanaka, K. X-ray Stress measurement of alumina/zirconia composites. Curr. Jpn. Mater. Res. 1993, 10, 1–27. [Google Scholar]
- Tanaka, K.; Ishihara, K.; Akiniwa, Y.; Ohta, H. Residual stress of aluminum thin films measured by X-ray and curvature methods. Mater. Sci. Res. Int. 1996, 2, 153–159. [Google Scholar] [CrossRef]
- Tanaka, K.; Tokoro, S.; Koike, Y.; Egami, N.; Akiniwa, Y. New method of X-ray measurement of residual stress in short-fiber reinforced plastics. J. Soc. Mater. Sci. Jpn. 2014, 63, 514–520. [Google Scholar] [CrossRef] [Green Version]
- Ida, K.; Akiniwa, Y. X-ray stress measurement of heat treated polyetheretherketone. In Proceedings of the 53rd Symposium on X-ray Studies on Mechanical Behavior of Materials, Osaka, Japan, 11 July 2019. [Google Scholar]
- Yokoyama, R.; Akiniwa, Y. Residual stress measurement of polymeric materials. In Proceedings of the 53rd Symposium on X-ray Studies on Mechanical Behavior of Materials, Osaka, Japan, 11 July 2019. [Google Scholar]
- Boukal, I. The use of X-ray diffraction under stress for the study of the structure of amorphous polycarbonate. Eur. Polym. J. 1970, 6, 17–24. [Google Scholar] [CrossRef]
- Pick, M.; Lovell, R.; Windle, A.H. Detrection of elastic strain in an amorphous polymaer by X-ray scattering. Nature 1979, 281, 658–659. [Google Scholar] [CrossRef]
- Nakamae, K.; Nishino, T.; Hata, K.; Matsumot, T. Measurement of the elastic moduli of amorphous atactic polystyrene by X-ray diffraction. Kobunshi Ronbunshu 1985, 42, 211–217. [Google Scholar] [CrossRef]
- Poulsen, H.F.; Wert, J.A.; Neuefeind, J.; Honkimaki, V.; Daymond, M. Measuring strain distributions in amorphous materials. Nat. Mater. 2005, 4, 33–36. [Google Scholar] [CrossRef]
- Hufnagel, T.C.; Ott, R.T.; Almer, J. Structural aspects of elastic deformation of a metallic glass. Phys. Rev. B 2006, 73, 1–8. [Google Scholar] [CrossRef]
- Suzuki, H.; Yamada, R.; Tsubaki, S.; Imafuku, M.; Sato, S.; Watanuki, T.; Machida, A.; Saida, J. Investigation of elastic deformation mechanism in As-Cast and annealed eutectic and hypoeutectic Zr–Cu–Al metallic glasses by multiscale strain analysis. Metals 2016, 6, 12. [Google Scholar] [CrossRef] [Green Version]
- Toraya, H. Whole-powder-pattern fitting without reference to a structural model: Application to X-ray powder diffraction data. J. Appl. Crystallogr. 1986, 19, 440–447. [Google Scholar] [CrossRef]
- Radhakrishnan, S.; lyert, V.S.; Sivaramt, S. Structure and morphology of polycarbonate synthesized by solid state polycondensation. Polymer 1994, 35, 3789–3791. [Google Scholar] [CrossRef]
- Qiu, X.; Thompson, J.W.; Billinge, S.J.L. PDFgetX2: A GUI driven program to obtain the pair distribution function from X-ray powder diffraction data. J. Appl. Crystallogr. 2004, 37, 678. [Google Scholar] [CrossRef] [Green Version]
- Engqvist, J.; Hall, S.A.; Wallin, M.; Ristinmaa, M.; Plivelic, T.S. Multi scale measurement of (amorphous) polymer deformation: Simultaneous X-ray scattering, Digital image correlation and in-situ loading. Exp. Mech. 2014, 1373–1383. [Google Scholar] [CrossRef]
- Coyle, D.J.; Blake, J.W.; Macosko, C.W. The kinematics of fountain flow in mold filling. AIChE J. 1987, 33, 1168–1177. [Google Scholar] [CrossRef]
Figure 1.
Tensile loading and X-ray measurement. (a) Loading device for in situ X-ray measurement; (b) Optical system for transmission geometry.
Figure 1.
Tensile loading and X-ray measurement. (a) Loading device for in situ X-ray measurement; (b) Optical system for transmission geometry.

Figure 2.
Determination method of peak position: (a) Approximation by split type pseudo Voigt function using more than 0.8 Smax data; (b) Average of two intersection positions corresponding to the intensity of 0.8 Smax.
Figure 2.
Determination method of peak position: (a) Approximation by split type pseudo Voigt function using more than 0.8 Smax data; (b) Average of two intersection positions corresponding to the intensity of 0.8 Smax.

Figure 3.
Relation between applied stress and nominal strain.

Figure 4.
Change in diffraction profile due to applied stress: (a) Wide range of profiles; (b) Enlargement of figure (a).
Figure 4.
Change in diffraction profile due to applied stress: (a) Wide range of profiles; (b) Enlargement of figure (a).

Figure 5.
Change in structure function due to applied stress: (a) Wide range of profiles; (b) vicinity of the first peak of the normalized structure function.
Figure 5.
Change in structure function due to applied stress: (a) Wide range of profiles; (b) vicinity of the first peak of the normalized structure function.

Figure 6.
Relation between magnitude of the scattering vector and applied stress.

Figure 7.
Relation between applied stress and strain measured by X-ray for line width method.

Figure 8.
Relation between average Young’s modulus determined from all the four stress levels and peak ratio.
Figure 8.
Relation between average Young’s modulus determined from all the four stress levels and peak ratio.

Figure 9.
Change of strain measured by X-ray due to rotation of specimen around the χ-axis for the peak ratio of 80%: (a) Pseudo Voigt method; (b) Diffraction line width method.
Figure 9.
Change of strain measured by X-ray due to rotation of specimen around the χ-axis for the peak ratio of 80%: (a) Pseudo Voigt method; (b) Diffraction line width method.

Figure 10.
Relation between applied stress and strain measured by X-ray for diffraction line width method: (a) Longitudinal strain; (b) Transverse strain.
Figure 10.
Relation between applied stress and strain measured by X-ray for diffraction line width method: (a) Longitudinal strain; (b) Transverse strain.

Figure 11.
X-ray elastic constants: (a) Young’s modulus; (b) Poisson’s ratio.


Table 1.
X-ray conditions for measurement of X-ray elastic constants.
| X-ray Equipment | Mac Science M21X |
|---|---|
| Characteristic X-ray | Mo-Kα (17.45 keV, λ = 0.7107 Å) |
| Scan mode | Step scan |
| Tube voltage | 30 kV |
| Tube current | 200 mA |
| 2θ range | 3.55–30 or 100 deg |
| Exposure time | 5 s/step |
| sin2χ | 0–0.9 (0.1 interval) |
© 2020 by the authors. Licensee MDPI, Basel, Switzerland. This article is an open access article distributed under the terms and conditions of the Creative Commons Attribution (CC BY) license (http://creativecommons.org/licenses/by/4.0/).
Share and Cite
MDPI and ACS Style
Kawamura, Y.; Akiniwa, Y. Measurement of the X-ray Elastic Constants of Amorphous Polycarbonate. Quantum Beam Sci. 2020, 4, 35. https://0-doi-org.brum.beds.ac.uk/10.3390/qubs4040035
AMA Style
Kawamura Y, Akiniwa Y. Measurement of the X-ray Elastic Constants of Amorphous Polycarbonate. Quantum Beam Science. 2020; 4(4):35. https://0-doi-org.brum.beds.ac.uk/10.3390/qubs4040035
Chicago/Turabian StyleKawamura, Yuki, and Yoshiaki Akiniwa. 2020. "Measurement of the X-ray Elastic Constants of Amorphous Polycarbonate" Quantum Beam Science 4, no. 4: 35. https://0-doi-org.brum.beds.ac.uk/10.3390/qubs4040035