Article

Enhanced Cell Inactivation and Double-Strand Break Induction in V79 Chinese Hamster Cells by Monochromatic X-Rays at Phosphorus K-Shell Absorption Peak

1
Single Cell Radiation Biology Group, Institute for Quantum Life Science, National Institutes for Quantum and Radiological Science and Technology, 4-9-1 Anagawa, Inage, Chiba 263-8555, Japan
2
Department of Basic Medical Sciences for Radiation Damages, National Institute of Radiological Sciences, National Institutes for Quantum and Radiological Science and Technology, 4-9-1 Anagawa, Inage, Chiba 263-8555, Japan
3
Department of Life Science, Rikkyo (St. Paul’s) University, 3-34-1 Nishi-Ikebukuro, Toshimaku, Tokyo 171-8501, Japan
4
Proton Medical Research Division, Research and Development Department, The Wakasa Wan Energy Research Center, 64-52-1 Nagatani, Tsuruga, Fukui 914-0192, Japan
5
Photon Factory, Institute of Materials Structure Science, High Energy Accelerator Research Organization, 1-1 Oho, Tsukuba, Ibaraki 305-0801, Japan
*
Author to whom correspondence should be addressed.
Quantum Beam Sci. 2020, 4(4), 38; https://0-doi-org.brum.beds.ac.uk/10.3390/qubs4040038
Submission received: 19 September 2020 / Revised: 16 October 2020 / Accepted: 16 October 2020 / Published: 20 October 2020

Abstract

:
The cell inactivation and DNA double-strand break (DSB) induction by K-shell ionization of phosphorus atoms and Auger electrons were investigated. Monochromatic X-rays of on and below the phosphorus K-shell absorption peak, 2.153 keV and 2.147 keV were exposed to Chinese hamster lung fibroblast V79 cells. Survival fractions were plotted against exposure, Ψ [nC/kg] and the linear-quadratic model was adapted to estimate the parameters, α and β, of the survival curves. DSB induction rate [DSB/cell/Ψ] was estimated from the measured fractions of induced DNA fragments below 4.6 Mbp (Find(k < 4.6)), which were determined using pulse field gel electrophoresis. As results, cell inactivation and DSB induction rate of on the peak were significantly higher compared to that of the below. However, when converting Ψ to absorbed dose (Gy) of cell nucleus, the enhanced effect was only observed for parameter α, and not for a survival dose (Gy) of 37%, 10%, and 1% nor for a DSB induction rate. Our findings indicate that enhancement of cell inactivation and DSB induction were due to the additional dose delivered to the DNA and more complex DSB lesions were induced due to the release of phosphorus K-shell photoelectrons and Auger electrons.

1. Introduction

Photoelectric absorption by the inner shell electrons dominate for the low energy X-rays of several keV, and it is followed by the emission of one or several low energy Auger electrons [1,2,3]. Phosphorus undergoes an Auger cascade, ejecting several Auger electrons following K-shell photoabsorption [3]. The K-shell photoabsorption of phosphorus induces a multiply charged phosphorus atom and a local dense energy deposition at the vicinity of the absorption site [3]. As reported earlier, the photoabsorption cross-section of pBR322 plasmid DNA at the K-shell absorption peak of phosphorus (P-Kpeak) at the X-ray energy of 2.153 keV is over 3-fold that at 6 eV [4] or 7 eV [3] below the peak (P-Kbelow). In other words, monochromatic X-rays tuned at P-Kpeak are efficiently absorbed by the pBR322 plasmid DNA compared to P-Kbelow. Thus, the biological effectiveness of P-Kpeak and P-Kbelow can be compared to investigate the mechanisms underlying radiation-induced damage related to the primary radio-physical events of photoabsorption at the K-shell, and following Auger processes. Moreover, synchrotron radiation (SR) is a suitable source of radiation for tunable monochromatic X-rays with sufficiently a narrow bandwidth and a high intensity, which can be used to study the radiobiological effects of the K-shell absorption of phosphorus [5,6,7,8].
Several studies reported that monochromatic X-rays tuned at the K-shell absorption peak of phosphorus enhances their killing effect on various types of cells. This lethal effect (ratio of the effect at P-Kpeak to that at P-Kbelow) was previously found to be enhanced by 1.32–1.54 in Escherichia coli [9], 2.35 in dry Bacillus subtilis spores [10], 1.4 in Saccharomyces cerevisiae [11], and 1.8 in Syrian golden hamster embryo cells [12]. This enhancement is mainly attributed to the emission of Auger electrons, which induce additional DNA damage. Other biological effects were also found to be enhanced by photoabsorption at the K-shell of phosphorus, including mutations in B. subtilis spores [13], gene conversion in yeast cells [14], mutation in mammalian cells [3], and chromosome aberrations in mammalian cells [15]. The survival curves of mammalian cells around the K-shell absorption peak of phosphorus were previously reported by Watanabe et al. [3] and Tomita et al. [16]. The quantitative analysis of DNA double-strand break (DSB) induction is necessary to clarify the effectiveness of the radio-physical process of the K-shell absorption peak of phosphorus and elucidate the mechanism underlying the enhancement of cell inactivation, as well as other biological effects, in mammalian cells. Further studies are needed to analyze the enhancement of cell inactivation more comprehensively, as well as its correlation with the induction of DSBs on the K-shell absorption peak of phosphorus.
In this study, monochromatic X-rays around K-shell absorption peak of phosphorus were used to obtain the survival curves of V79 Chinese hamster cells, with higher doses resulting in survival fraction of less than 1%. The survival curves were fitted using the linear-quadratic model. The exposures and doses resulting in survival rates of 37%, 10%, and 1% were calculated using fitted parameters and compared quantitatively. DSBs were measured using the pulse field gel electrophoresis method, and compared with the inactivation of cells with the aim of elucidating the mechanisms underlying the enhancement of the lethal effect by K-shell photoabsorption of phosphorus.

2. Materials and Methods

2.1. Cell Line and Culture Media

Chinese hamster lung fibroblast V79 cells (RCB0008) were provided by the RIKEN BioResource Center, Japan. V79 cells were cultured at 37 °C in 95% air and 5% CO2 condition with Minimum Essential Medium Eagle (M4655; Merck KGaA, Darmstadt, Germany) supplemented with 10% fetal bovine serum (FBS) (JRH Biosciences) and antibiotics (100 U/mL penicillin and 100 µg/mL streptomycin) (Thermo Fisher Scientific K.K., Tokyo, Japan).

2.2. Irradiation Setup

Irradiation with monochromatic X-rays was performed using beam line 27A (BL-27A) at the Photon Factory in the High Energy Accelerator Research Organization (KEK) in Tsukuba, Japan. The detailed characteristics of BL-27A have been described previously by Konishi et al. [7]. Briefly, an indium antimony (InSb) double-crystal monochromator was used to obtain monochromatic X-rays, with an energy resolution (ΔE/E) of less than 0.1%. Monochromatic X-rays were transported out of the vacuum beam line into the atmosphere through a thin Kapton film. For each experiment, an absorption spectrum of calf thymus DNA film was measured to irradiate monochromatic X-rays at the absorption peak (2.153 keV) [4,17], corresponding to a transition from 1s to t2* of phosphorus [18]. The cells were irradiated by monochromatic X-rays at the peak (2.153 keV; P-Kpeak) and at 6 eV lower than the peak (2.147 keV; P-Kbelow). The exposure rate was measured using an especially designed free-air ionization chamber, which was then converted to the exposure rate at the sample surface using the correction factor for the attenuation of soft X-rays by air [5,11].
Since X-ray beams were adjusted to 1~2 mm in height and 4~5 mm in width, samples were scanned uniformly over a 20 mm × 20 mm area for the measurement of cell survival and a 40 × 40 mm area for the measurement of the DSBs. Irradiation was performed in air at 22 ± 2 °C and completed within 5 min for the survival curves and 25 min for the measurement of the DSBs, respectively. The exposures, Ψ (C/kg), were converted into absorbed dose D (Gy = J/kg) in the cells using Equation (1):
D = Ψ × W × ( μ e n ρ ) c e l l   n u c l e u s ( μ e n ρ ) a i r                                        
where W (33.97 J/C) is the mean energy required to produce an ion pair in air, (μen/ρ)air is the mass energy-absorption coefficient of air, and (μen/ρ cell nucleus) [19] is the mass energy-absorption coefficient of cell nucleus. The exposures were also converted into fluence F (X-ray photon/m2) using Equation (2):
F = Ψ × W × 1 / E × 1 ( μ e n ρ ) a i r
where E is the energy of an X-ray photon. The mass energy-absorption coefficients of air, water, soft tissue, cell nucleus, and DNA-Na of P-Kpeak and P-Kbelow are summarized in Table 1, which were obtained by interpolating the tabulated values at 2 and 3 keV by Hubbell [20].

2.3. Colony Formation Assay for Survival Curves

For the measurement of the survival curves, the samples were prepared as described in a previous study [21]. Briefly, a cell suspension of 0.1 mL containing 5.0 × 10⁴ cells was spread over a diameter of 10–12 mm at the center of 35-mm plastic dish (CORNING, Corning, NY, USA), and then incubated for approximately 24 h, at which point the cells reached a sub-confluent state of approximately 1.0 × 10⁵ cells. The dishes were sealed with 5-µm thick Mylar film (Chemplex Industries, INC., Palm City, FL, USA) to prevent the cells from drying and being contaminated during irradiation. Irradiated and control cells were harvested using 0.25% trypsin solution (0.25% trypsin with 1 mM EDTA-4Na) (Thermo Fisher Scientific K.K., Tokyo, Japan) and plated in a 60-mm plastic dish (BD Falcon) after diluting to obtain approximately 100 surviving cells. After incubation for 7 days, the cells were fixed with a 10% formalin solution (FUJIFIM Wako Pure Chemical Corporation, Osaka, Japan) in PBS and stained with 1% methylene blue solution (FUJIFIM Wako Pure Chemical Corporation, Osaka, Japan). Colonies that contained over 50 cells were classified as survivors. A total of 200~300 colonies were counted for the control and all irradiated samples. The survival curves were analyzed using the linear-quadratic (LQ) Equation (3). Data were fitted using Equation (4);
S = exp (−αΨ − βΨ2)
−ln(S) = αΨ − βΨ2
where Ψ is exposure in C/kg, and α and β are parameters being fitted.

2.4. Pulse Field Gel Electrophoresis (PFGE) and DSB Measurements

For the measurement of DNA DSBs, cell samples were prepared as in the colony formation assay, except for the number of cells spread over a dish: 1.0 × 10⁶ cells in 2 mL. After irradiation, the cells were harvested with trypsin solution (Thermo Fisher Scientific K.K., Tokyo, Japan) on ice to minimize the activity of DNA repair enzymes. The cell concentration was measured with a coulter counter (Z1, Beckman Coulter K.K., Tokyo, Japan), and approximately 5.0 × 10⁵ cells were centrifuged and resuspended in 40 µL of cell suspension buffer (10 mM Tris, pH7.2, 20 mM NaCl, 50 mM EDTA-2Na). After an equal volume of 1.6% low-gelling and melting point agarose (InCert Agarose, Lonza Rockland, Rockland, ME, USA) were mixed, 40 µL of the cell suspension was immediately pipetted into a plug mold (10 × 2 × 5 mm) (1703706; Bio-Rad) and stored at 4 °C for 30 min.
The plugs were carefully removed from the molds and lysed in a proteinase K reaction buffer (100 mM EDTA-2Na, 2% sodium deoxycholate acid, 1% N-lauryl sarcosine sodium acid, 1 mg/mL proteinase K solution; FUJIFIM Wako Pure Chemical Corporation, Osaka, Japan) for 1 h at 4 °C, followed by 24 h at 50 °C. The plugs were then washed in the cell suspension buffer twice and stored at 4 °C. The plugs were embedded in an 0.8% (v/w) chromosomal grade agarose gel (Bio-Rad Laboratories, Inc., Hercules, CA, USA) and electrophoresed in 0.5× TBE buffer (50 mM Tris, 48.5 mM boric acid, 2 mM EDTA pH 8.0; FUJIFIM Wako Pure Chemical Corporation, Osaka, Japan) at 14 °C for 5000 s using a Bio-Rad CHEF-DRIII unit (Bio-Rad Laboratories, Inc., Hercules, CA, USA)under a CHEF electrophoresis condition: 1.5 V/cm at an angle of 106° and a pulse time of 50 s. Along with the cell samples, three DNA size markers from Bio-Rad, namely Saccharomyces cerevisiae chromosomes (0.225–2.2 Mbp; No. 170-3605), Hansenula wingei chromosomes (1.0–3.1 Mbp; No. 170-3667), and Schizosaccharomyces pombe chromosome (3.5–5.7 Mbp; No. 170-3633), were electrophoresed to determine the molecular size of the fragmented DNA. After electrophoresis, the gels were stained in 1 µg/mL ethidium bromide overnight, followed by destaining three times in fresh buffer for 1 h. The Gels were scanned using a SYGB laser (532 nm) at 100 µm/pixel resolution with 16-bit gray scale using a laser image analyzer (Typhoon™ Variable Mode Imager 9210; GE Healthcare Bio-Sciences Corp. Marlborough, MA, USA). For each lane, the fluorescence intensity versus the migration distance was calculated using software Image Quant TL (Version 7.0, GE Healthcare Bio-Sciences Corp. Marlborough, MA, USA, 2006). The migration distance was converted to Mbp of DNA using the fitted curves for the three DNA size markers electrophoresed simultaneously.
To calculate the DSB induction rate, we adopted the random breakage model proposed by Blöcher [22]. The amount of DNA was assumed to be proportional to the fluorescence intensity measured by the laser image analyzer. The fraction of DNA migrated further than k Mbp, which is smaller than k Mbp, F(k), was calculated for k = 4.6 Mbp, which corresponds to one of the chromosomes of S. pombe, and was denoted as the optimal size region for this PFGE protocol. The fluorescent intensity was integrated down to 0.1 Mbp, where the fluorescent intensity was almost background level. Thus, F(k)s were practically the fractions between 0.1 and 4.6 Mbp. The fraction of DNA fragments induced by X-ray irradiation, Find(k), was calculated by (Firr(k) − Fcon(k))/(1 − Fcon(k)), where Firr(k) and Fcon(k) were the fractions for the irradiated and control samples, respectively. The number of DSBs per unit length of DNA (Mbp) and exposure Ψ (C/kg), R [DSB/Mbp/Ψ], was determined by fitting Equation (5) with Find(k) using the least squares method, where Ψ is exposure (C/kg) and L is the average chromosome size of Chinese hamster cell, 245 Mbp, as given by Blöcher [22].
F ind ( k ) = 1 { 1 + Rk Ψ × ( 1 k L ) } exp ( Rk Ψ )

3. Results

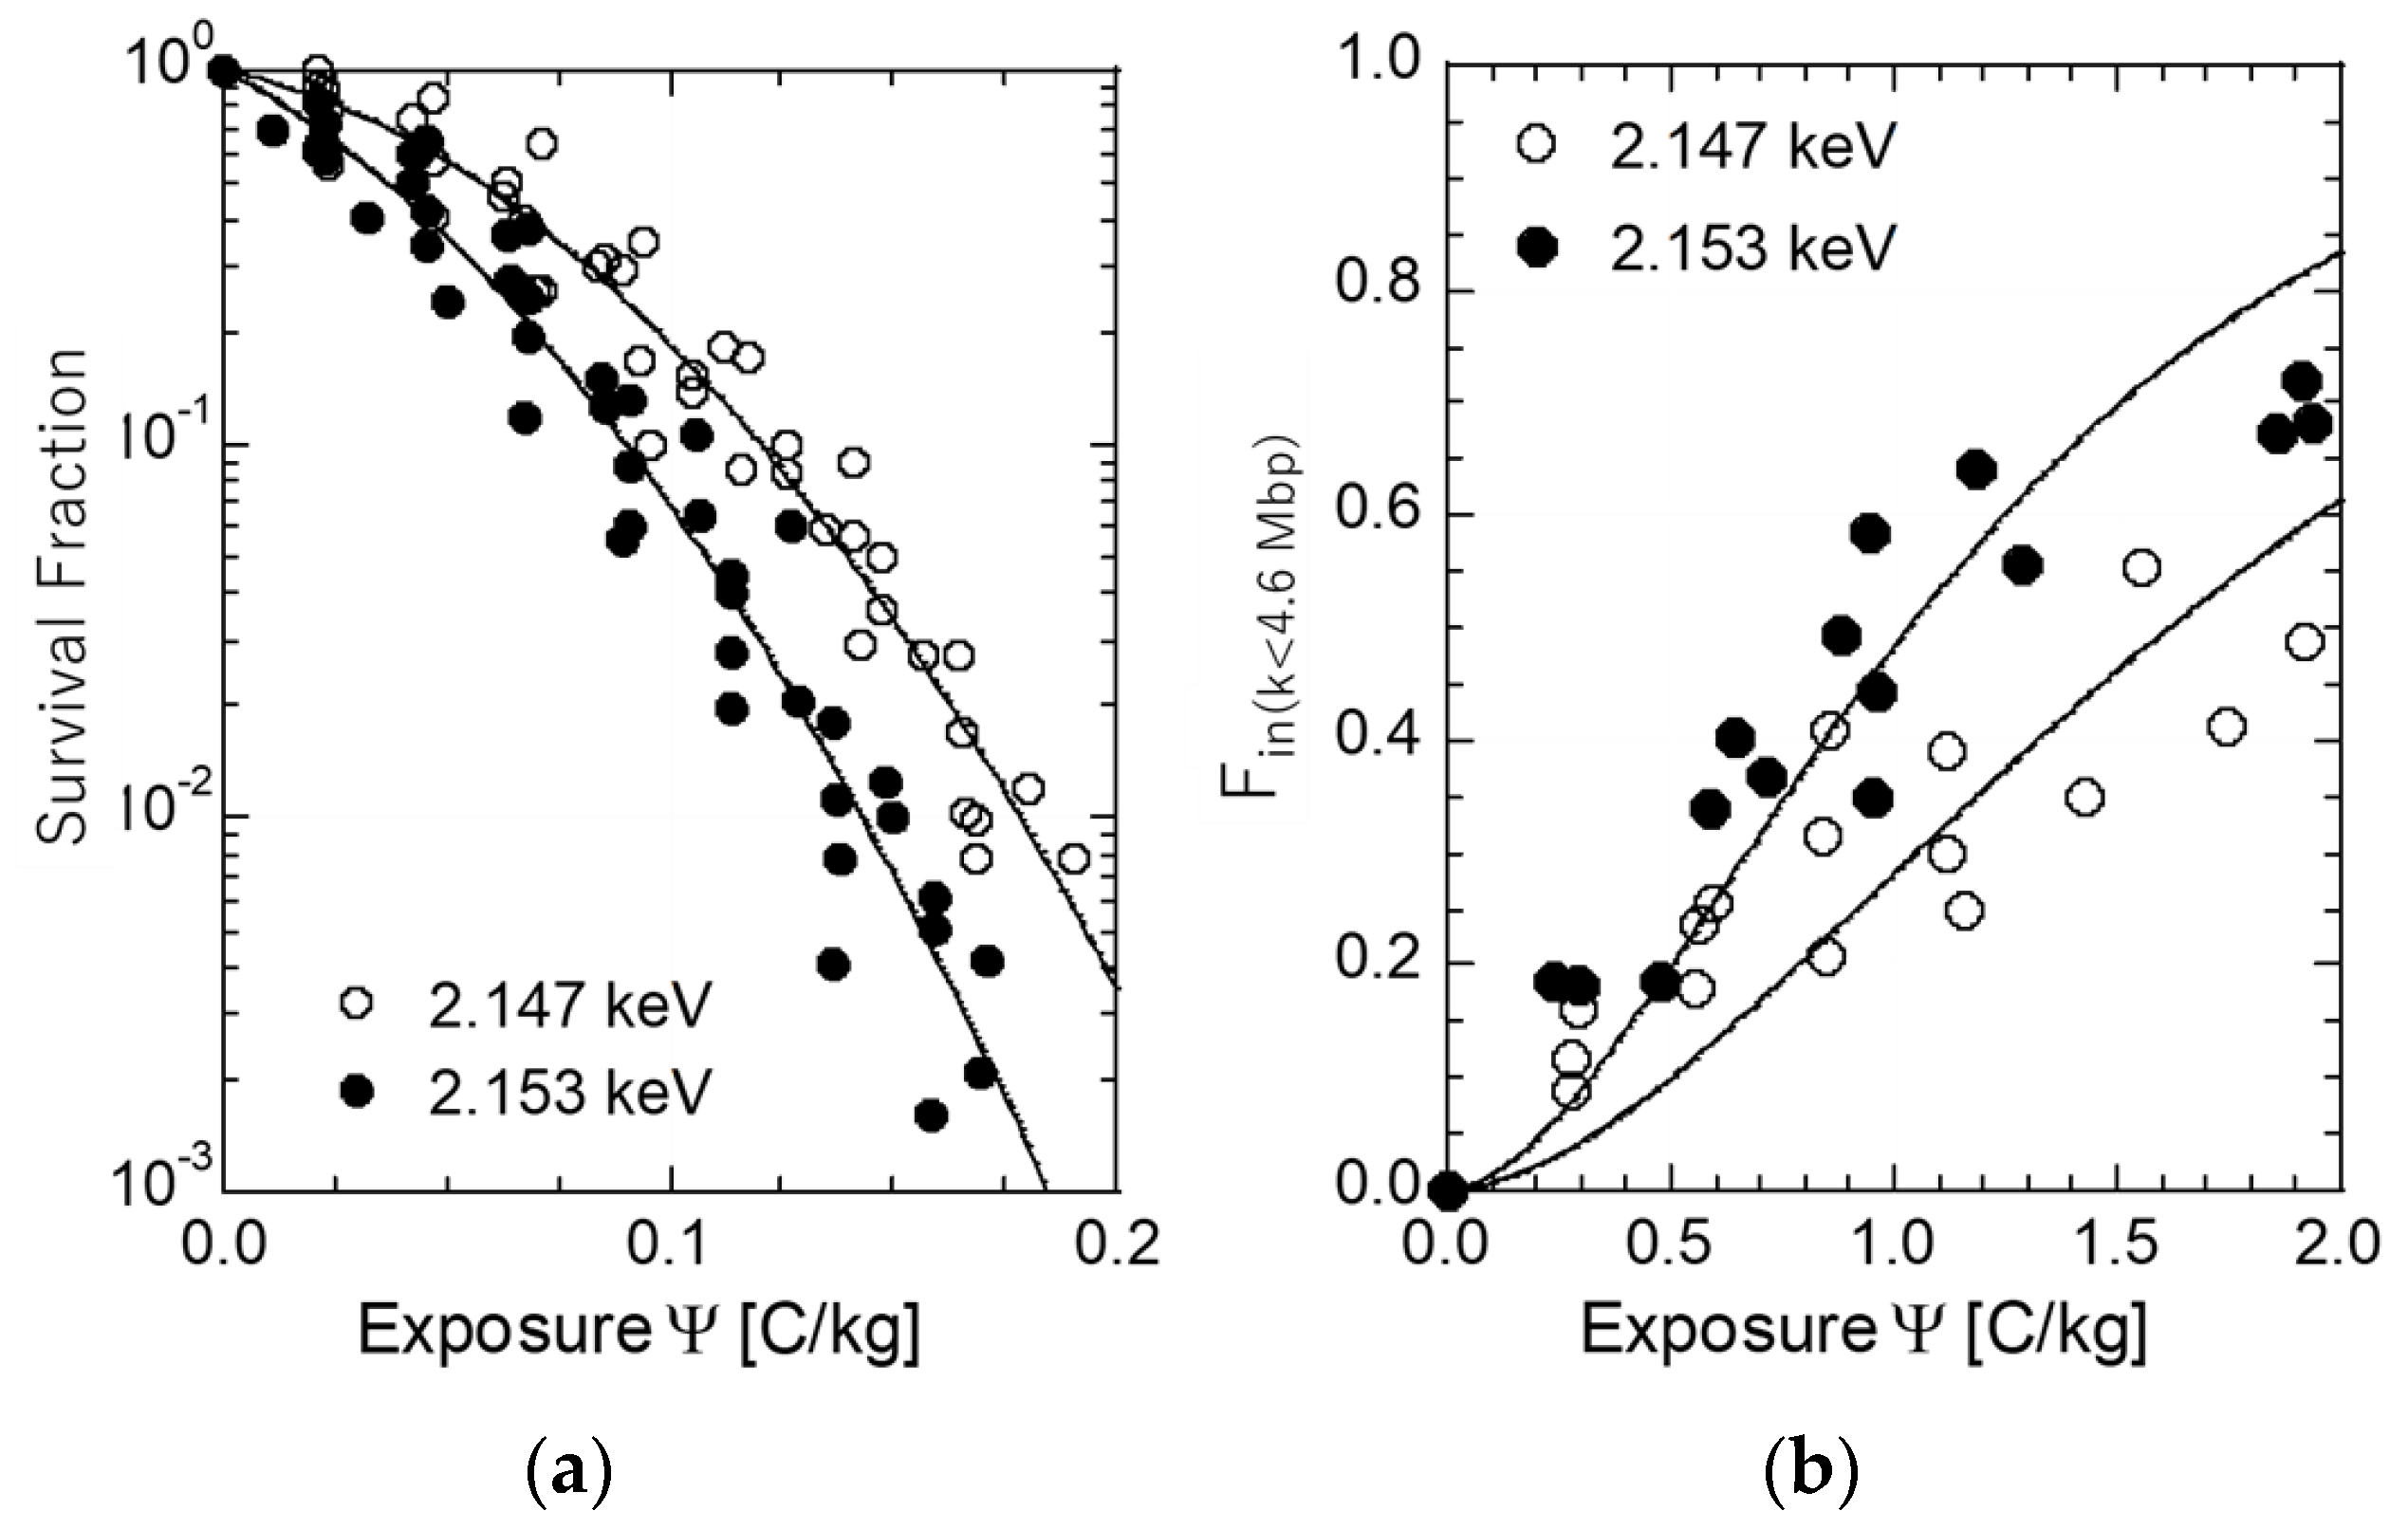
3.1. Cell Inactivation on and Below the Phosphorous K-Shell Peak

Figure 1a shows the survival curves obtained using the colony formation assay after monochromatic X-ray exposure at P-Kpeak and P-Kbelow. The survival fractions were plotted against exposure Ψ [C/kg], and the results showed that P-Kpeak was more effective than P-Kbelow in inducing cell death. To perform a quantitative comparison, the survival curves were fitted with the linear-quadratic Equation (4); the fitted parameters α and β are listed in Table 2. The enhancement ratio, f, for α and β was calculated as the ratio of P-Kpeak/P-Kbelow, which was 2.60 ± 0.93 and 1.09 ± 0.20, respectively. The enhanced cell inactivation was mainly due to the parameter α, as will be discussed later. In Table 2, the exposure, Ψi, resulting in survival fractions, i, of 37%, 10%, and 1% are indicated as Ψ37, Ψ10, and Ψ1, respectively. The values were calculated using the fitted parameters of α and β. The enhancement ratios, P-Kbelow/P-Kpeak, were in the range of 1.25–1.49.
Figure 2a shows the survival curve plotted against the absorbed dose in Gy, in which Ψ of Figure 1a was converted to Gy using the mass energy-absorption coefficients, μencell nucleus. The survival curve of P-Kpeak was found to be above P-Kbelow, and the enhanced effect observed in Figure 1a was abolished. Table 3 shows the dose (Gy) resulting in survival rates of i, 37%, 10% and 1%, indicated as D37, D10, and D1, respectively. For all Di of the survival curve, the enhancement ratio, f, was found to be nearly equivalent or below 1.0. However, for the parameter α, f remained at 1.67, but fell to 0.45 for the parameter β, indicating that the process of cell killing differs between P-Kpeak and P-Kbelow.

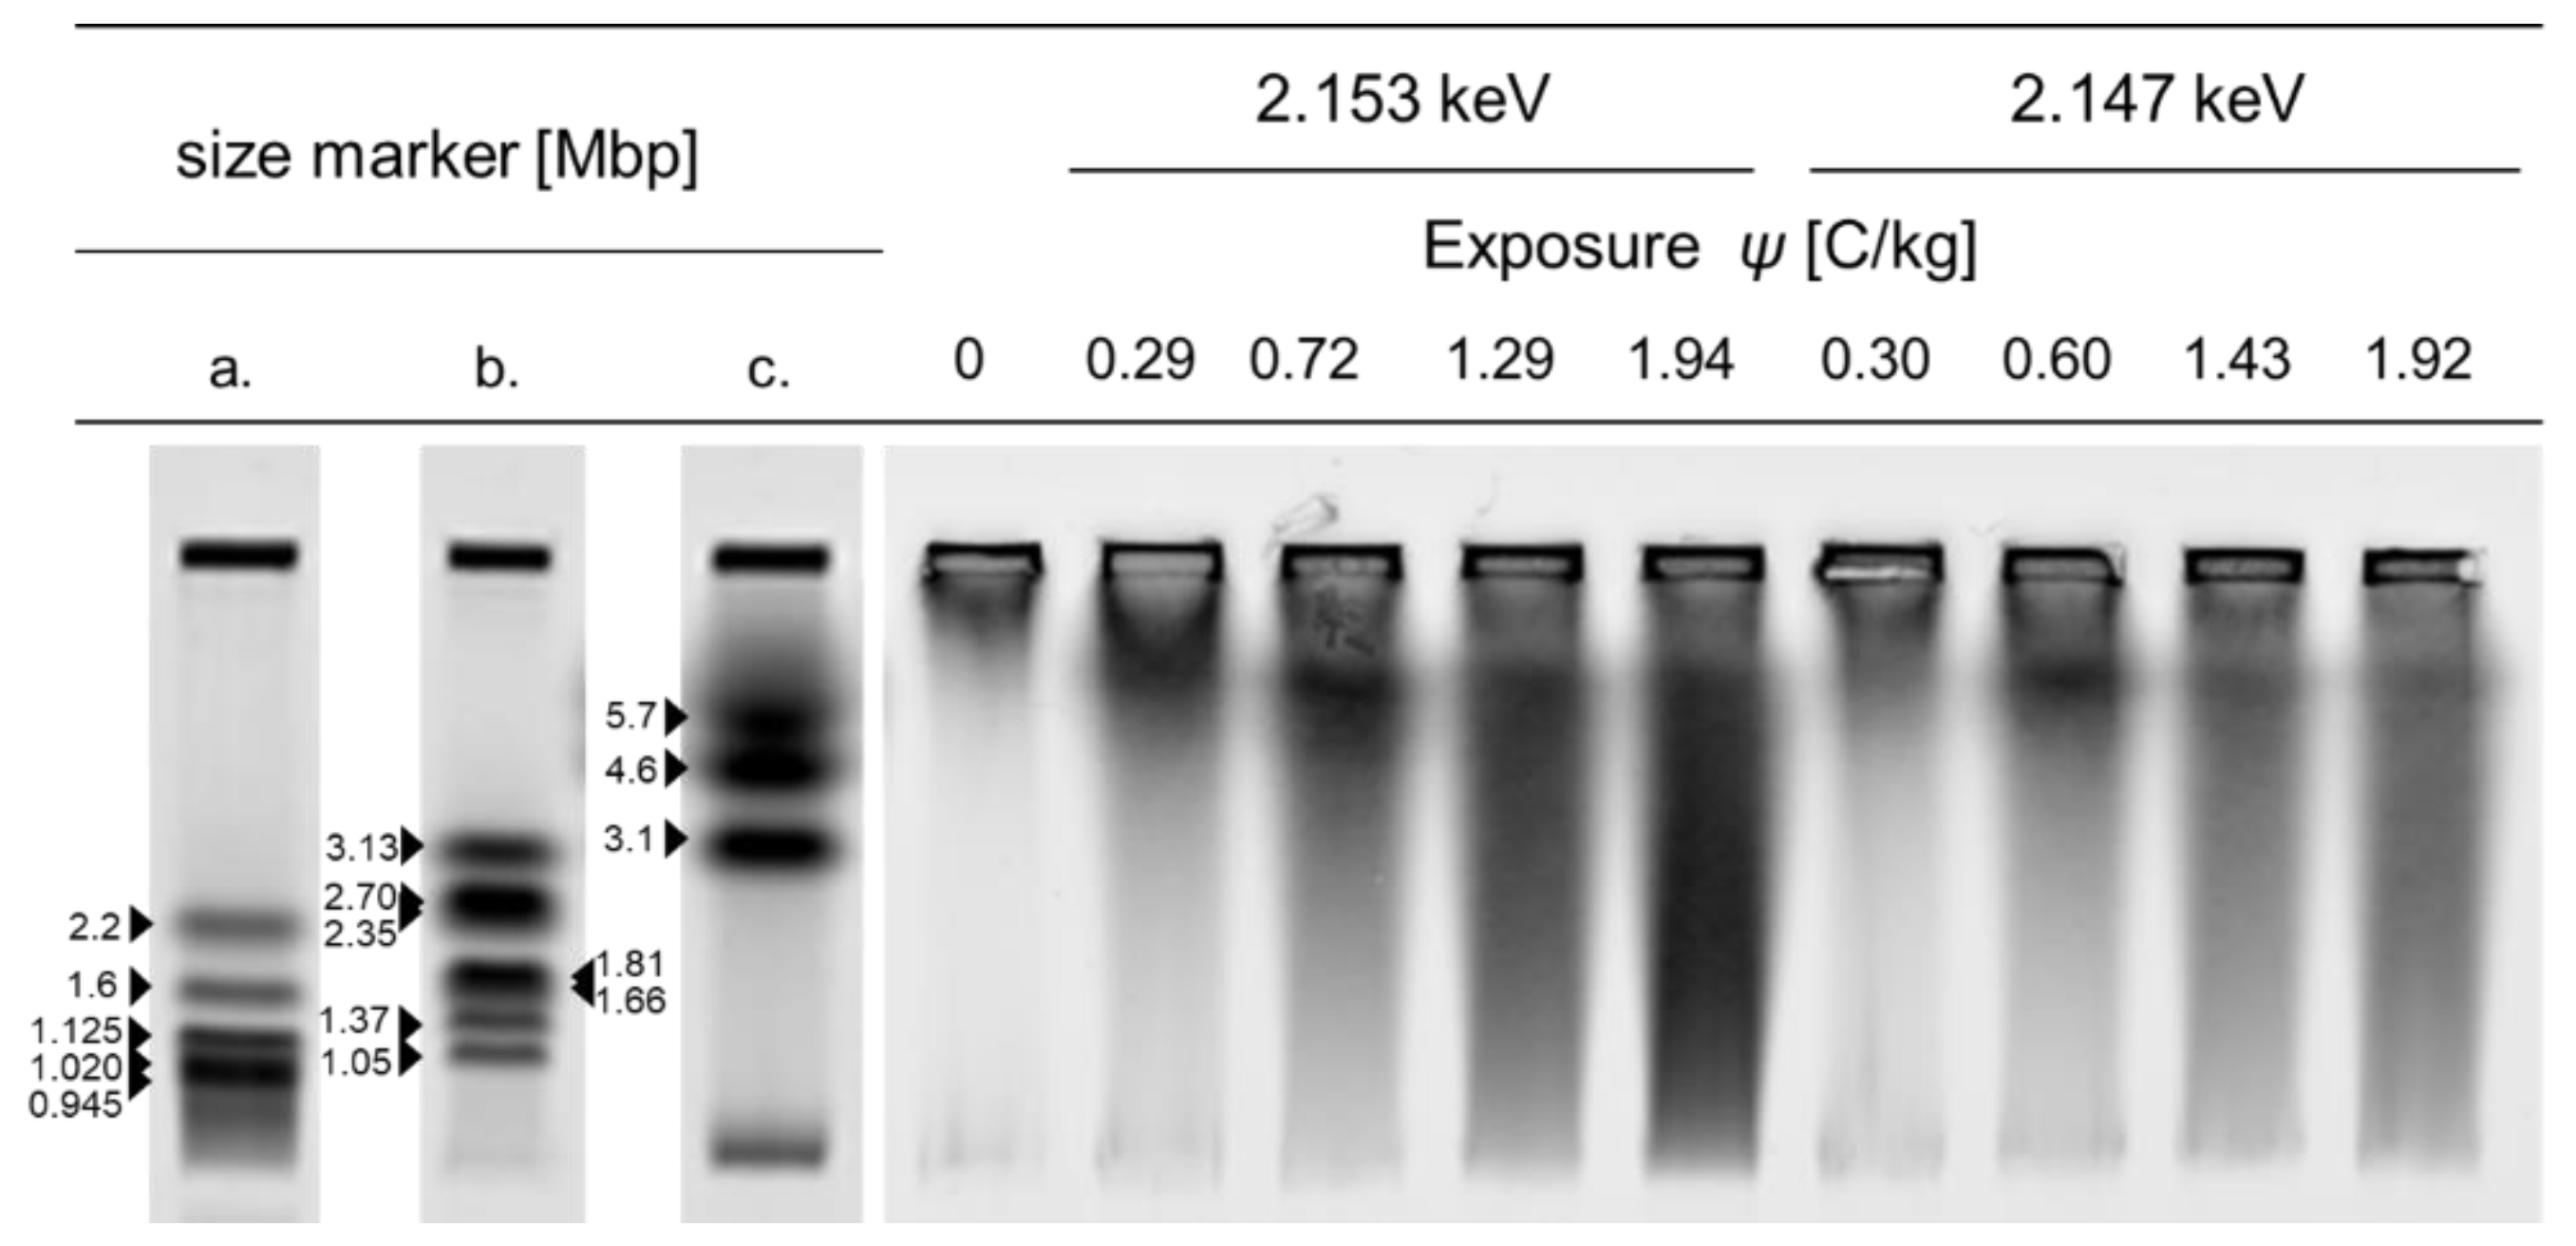
3.2. Induction of DSBs

The induction of DSBs was estimated by measuring DNA fragmentation using PFGE. Figure 3 shows an example of the migration pattern of fragmented cellular DNA produced by monochromatic X-rays. Using the fluorescent intensity of EtBr measured for each lane, fractions of induced DNA fragments below 4.6 Mbp (Find(k < 4.6)) were quantified and plotted against exposure, Ψ, as shown in Figure 1b. The data were fitted using Equation (5), based on the random breakage model [22], using the least squares method to estimate the parameter R, which represents the number of DSBs per Mbp per Ψ. The curves in Figure 1b were drawn using an R value of 0.350 DSB/Ψ/Mbp and 0.224 DSB/Mbp/Ψ for P-Kpeak and P-Kbelow, respectively. The number of DSBs per Ψ per Mbp was 1.56 times higher for P-Kpeak than P-Kbelow, while the ratio P-Kpeak/P-Kbelow of DSBs per cell per Ψi (i = 37%, 10%, and 1%) ranged from 1.10 to 1.50.
Figure 2b shows the Find(k < 4.6) of Figure 1b plotted against the absorbed dose (Gy), while Table 4 shows the R value converted to R’ (DSBs per Mbp per absorbed dose in Gy) using μencell nucleus shown in Table 1. Then, parameter R’ was converted into R” (DSBs per cell per Gy) using the number of base pairs per V79 cell, which was calculated as follows: (average number of base pairs per chromosome (245 Mbp [22])) × (number of chromosomes, n = 21 [23]). The enhancement factor, f, of R” was 1.02, which was considered to be equivalent between P-Kpeak and P-Kbelow. However, the DSBs pers cell per Di, for i = 37%, 10%, and 1% survival rates, showed a ratio of P-K peak/P-Kbelow that ranged from 1.1 to 1.5, indicating that more DSBs were induced at P-K peak for an equivalent survival fraction.

3.3. Cross-Section of DSB Induction and Quantum Yield

Table 5 shows the action cross-section of DSB induction (σDSB), absorption cross-section of V79 cell DNA (σaborption), and the quantum yield calculated for the phosphorus K-shell peak. The value of σDSB was calculated by converting Ψ of parameter R [DSBs/Ψ/cell] to photon fluence using Equation (2). The values of σphotoaborption of cellular DNA were calculated as follow: σaborption (cell nucleus) = σabsorption (pBR322 DNA) × MWV79/MWpBR322, where the absorption cross-section of the pBR322 plasmid DNA, σabsorption (pBR322 DNA) (= 6.89 × 10⁻¹⁹ m2) was obtained from Hieda et al. [4]. The MWV79 and MWpBR322 denoted the molecular weight of V79 DNA (5.15 Mbp) and pBR322 plasmid DNA (4.361 kbp), respectively. The cross-sections, σP-K DSB and σP-K absorption, for the K-shell of phosphorus were calculated as the partial cross-section between P-Kpeak and P-Kbelow, and were 2.77 × 10⁻¹³ [m2] and 5.71 × 10⁻¹³ [m2], respectively. The difference in the absorption cross-sections of other elements and the L-shell of phosphorus were disregarded since that of P-Kpeak was estimated to be only 1% smaller than that of P-Kbelow [4]. As a result, the quantum yield of phosphorus K-shell-induced DSBs, calculated as the ratio of the partial cross-section of σDSB and σabsorption, was 0.49.

4. Discussion

4.1. Evaluation of Enhanced Cell Inactivation on Phosphorus K-Shell Peak from Linear-Quadratic Model

The linear-quadratic relationship between the minus logarithm of the survival and dose, −ln(S) = αD + βD2, fits well with the continually downward bending form of cell survival. Thus, this relationship can be regarded as the simplest mathematical formula, which describes a survival curve. However, several biophysical models for cell survival, such as the theory of dual radiation action [24], the molecular theory of radiation action [25], the repair-misrepair model [26], and the lethal-potentially lethal model [27,28], were found to give a linear-quadratic relationship for low doses under certain restrictions. In fact, Alpen stated that the linear-quadratic model is an adequate approximation for survival fractions greater than 10−3 [29]. Along with these biophysical models, the linear-quadratic model can be used to estimate the underlying radiobiological mechanisms, according to interpretations of the experimental results [30,31,32]. In line with the lethal-potentially lethal model [27,28], which is assumed to produce two different types of lesions (i.e., repairable that are potentially lethal and irreparable that are lethal), it is generally accepted that the linear parameter α reflects the induction of the complex clustered DNA lesions, which the cell cannot repair properly, leading to the formation of severe chromosomal aberrations, and that the quadratic parameter β is consistent with the pairwise interaction of sub-lesions (e.g., less complex clustered DNA damage) that become lethal.
This interpretation is supported by several studies of the K-shell X-ray irradiation in comparison with irradiation below the peak: a lower rate of recovery of yeast cell inactivation [11], the slower repair of DSBs in mammalian cells [16], and a higher ratio of complex DSBs to total DSBs, which is an indicator of the quality of DNA damage [3]. Our results showed that the linear parameter α was 2.6 times larger on P-Kpeak than P-Kbelow. Saigusa et al. previously reported the exposure-response curves of dicentric chromosome aberrations, which is one of the lethal types of chromosomal damage [15]. Their α parameters ratio of P-Kpeak/P-Kbelow was 2.4, which is consistent with ours [15]. Moreover, our results showed that the exposure giving rise to a survival fraction of 37% (Ψ37) of P-Kpeak was 0.67-fold that of P-Kbelow, indicating that the cell killing effect was enhanced 1.49-fold compared to that of P-Kbelow. This enhancement was consistent with results published by Watanabe et al. [12], who observed an enhancement of 1.78 at Ψ37 in Syrian golden hamster embryo cells. Thus, exposure on P-Kpeak induced efficiently irreparable lethal lesions compared to exposure at P-Kbelow.
It is worth noting that the large difference between X-ray absorption P-Kpeak and P-Kbelow is due to the difference in the K-shell absorption of phosphorus; a large K-shell absorption on the peak but no K-shell absorption below the peak. Hieda et al. [4], reported the photoabsorption cross-sections of pBR322 plasmid DNA, σ absorption (pBR322 DNA), to be 6.89 × 10⁻¹⁹ m2 for 2.153 keV and 2.05 × 10⁻¹⁹ m2 for 2.147 keV, which were the values used in this study. Watanabe et al. [3] similarly reported σ absorption (pBR322 DNA) to be 6.42 × 10⁻¹⁹ m2 and 1.83 × 10⁻¹⁹ m2 for 2.153 keV and 2.146 keV, respectively. They also reported the fractional contribution of the DNA constituent atoms to photoabsorption cross-section. The fractions of C, N, O, and P were 0.32, 0.17, 0.45, and 0.06 for 2.146 keV (the X-ray energy below the peak was 2.147 keV in this paper) and 0.09, 0.05, 0.13, and 0.74 for 2.153 keV. The fraction of P at 2.146 keV corresponds to the absorption at the L-shell, and thus the fraction of P at 2.153 keV can be divided into the L-shell and K-shell, assuming that the photoabsorption cross-sections for C, N, O, and the L-shell of phosphorus are the same at both energies: the fraction of phosphorus 0.74 is divided into 0.02 (= 0.06 × 1.83 × 10−19/6.42 × 10−19) of the L-shell and 0.72 (= 0.74 − 0.02) of the K-shell, which can be considered to be the main cause of the enhanced radiobiological effects of P-Kpeak compared to P-Kbelow. In addition, Watanabe et al. [3] described the yields of single strand breaks (SSBs), DSBs, and “complex” DSBs, which were calculated per photoabsorption event, and compared the ratios of the yields of SSBs to those of DSBs and complex DSBs to total DSBS as the indicators of the degree of DNA damage complexity. Complex DSBs were defined as a DSB with an additional strand break within 10 bp from one of the breaks forming the DSBs. The ratio SSBs/DSBs of P-Kpeak was 1.36-fold that of P-Kbelow, while the ratio “complex” DNA/total DSBs of P-Kpeak was 1.29-fold that of P-Kbelow. As shown in Figure 1a and Table 2, the enhanced cell inactivation can be attributed to the increased amount of DSBs per exposure, while the higher linear parameter α on the peak can be attributed to the increased fraction of complex DSBs that were induced effectively at P-Kpeak compared to P-Kbelow. In contrast, the quadratic parameter β was only 1.09-fold different, i.e., essentially the same, between P-Kpeak and P-Kbelow (Table 2). Saigusa et al. reported the dose-response curves of dicentric chromosome aberrations, as mentioned above, and found β parameter ratio between P-Kpeak/P-Kbelow of 1.1, which was consistent with our result [15]. These findings indicate that potentially lethal lesions are induced in the same degree by the K-shell absorption of phosphorus and the photoabsorption at the L-shell of phosphorus and at other atoms.

4.2. Enhance Induction of DNA DSBs

Several researchers studied the induction of DSBs by monochromatic X-rays around the K-shell resonant peak of phosphorus using isolated plasmid DNA [4,17,33,34]. However, to the best of our knowledge, this study is the first to report on the rate of DSB induction in mammalian cells exposed to P-Kpeak (Figure 1b). V79 cells were exposed to X-rays to measure the efficiency of DSB induction: the number of DSBs per unit length of DNA per exposure (Ψ), R, and R for P-Kpeak was 1.56-fold that of P-Kbelow, indicating that DSBs were more effectively induced on P-Kpeak than P-Kbelow (Table 4). To further understand the mechanistic aspect of how P-Kpeak enhanced the induction of DSBs, we calculated the cross-section of DSB induction (σDSB), the absorption cross-section (σabsorption) of V79 cell DNA, and the partial cross-section in reference to that of P-Kpeak (Table 5). Using these values, the quantum yield was calculated as 0.49. In other words, one event of phosphorus K-shell absorption followed by Auger processes resulted in 0.49 DSBs. Thus, although the K-shell photoabsorption of phosphorus induced multiply charged phosphorus atoms and dense energy deposition locally at the vicinity of the absorption site, it was not effective enough to induce one DSB. Therefore, two or more events would be needed to induce one DSB.

4.3. Conversion of Exposure ψ (C/kg) to Absorbed Dose D (Gy): Mass Energy-Absorption Coefficient μen

We used the mass energy-absorption coefficient μen cell nucleus [19] and Equation (1) to convert exposure Ψ to absorbed dose in Gy. As a result, the observed enhanced cell inactivation (Figure 1a) and enhanced DSB induction rate (Figure 1b) were both abolished (Figure 2a,b), which was practically possible due to the μen/ρ cell nucleus used in this study. Needless to say, μencell nucleus of 2.153 keV (and not of 2.147 keV) strongly depends on the fraction of phosphorus in the targeted material, with an absorbed dose that would be proportional to μen. The phosphorus content in the soft tissue and cell nucleus were 0.003 and 0.026, respectively. Therefore, the μen ratio between 2.153 keV and 2.147 keV would be higher in the order of water, soft tissue, cell nucleus, and DNA. For example, the ratio of μencell nucleus between P-Kpeak/P-Kbelow was 1.54, where μenwater and μensoft tissue was 0.99 and 1.06, respectively. Saigusa et al. [15] reported on the dose-response relationships of chromosomal aberrations estimated based on the elemental composition of soft tissue, cell nucleus, and DNA, and found that the difference between P-Kpeak and P-Kbelow was still evident for soft tissue, but was reversed for cell nucleus and DNA. Other studies have used μenwater or μen/ρ soft tissue for the dose conversion of mammalian cells exposed to P-Kpeak and P-Kbelow [12,16,35]. In this study, we chose μencell nucleus for dose conversion for two reasons. Firstly, the lethal target for cell activation is the cell nucleus, the radiobiological response of which strongly depends on the quantity and quality of DNA damage, as well as cell repairability. Secondly, many research groups used highly advance microbeams [36,37,38] to target only the cytoplasm to investigate the cellular response against cytoplasmic damage, and the absorbed dose in the cytoplasm is negligible compared to that of the cell nucleus for cell inactivation. For example, Wu et al. [39] reported that over 70% of the cells survived with 32 alpha particles in the cytoplasm, which was an equivalent survival fraction to 0.35 traversal in the nucleus. Moreover, Maeda et al. [40] reported that only nucleus-targeted irradiation was more effective in terms of cell inactivation compared to whole cell irradiation, indicating that protective signaling may be triggered by cytoplasmic damage. As for the induction of DSBs, cytoplasm irradiation triggers a slight increase in the levels of γ-H2AX in the cell nucleus indirectly from the direct energy deposition of radiation [41], while simultaneously activating the Keap1- NRF2 oxidative stress response pathway and up-regulating the XRCC4 and RAD51 DSB repair proteins, which promote cell protection [42,43]. Therefore, using μencell nucleus is the most appropriate for estimating the effect of monochromatic X-rays around the K-shell peak of phosphorus.

4.4. Cell Inactivation and DSB Induction per Absorbed Dose in Gy

Figure 2a shows the survival curves of P-Kpeak and P-Kbelow plotted against dose in Gy. Compared to Figure 1a, in which the survival curves were plotted against exposure (Ψ), enhanced cell inactivation was abolished, and the P-Kpeak became less effective per dose, becoming reversed compared to P-Kbelow. As mentioned earlier, Saigusa et al. [15] also reported an enhancement ratio between the P-Kpeak and P-Kbelow depending on the value of μen used for the dose conversion. All D37, D10, and D1 of P-Kpeak were larger than those of P-Kbelow, where the P-Kpeak/P-Kbelow ratio was smaller with an increasing dose. As for α parameter of exposure-survival relationship, the P-Kpeak/P-Kbelow ratio of α parameter was 2.6, which decreased to 1.7 when exposure was converted absorbed dose. This discrepancy observed in α ratio can be explained by the additional absorbed dose from the Auger electrons induced from the P-Kpeak photoabsorption. Furthermore, parameter β decreased to 0.45-fold of P-Kbelow, and the DSB induction rate per Gy of P-Kpeak and P-Kbelow were equivalent (Figure 2b, Table 3). However, the α parameter of P-Kpeak was markedly different, with an observed value of 1.67-fold that of P-Kbelow. Despite an equivalent DSB induction rate, the enhancement of parameter α and reduction of parameter β associated with P-Kpeak can be attributed to the fact that the enhanced lethal effect on the peak did not correspond to the number of simple DSBs, but rather to additional complex irreparable clustered DNA lesions produced by monochromatic X-rays on the phosphorus K-shell peak. However, when there was a sufficient number of simple DSBs with complex DSB in higher doses, the contribution of the phosphorus K-shell process to the formation of complex DSBs became insignificant.

5. Conclusions

Our findings show that enhanced biological effects at on the phosphorus K-shell peak observed in exposure-effect relationship were due to the to the additional dose delivered by phosphorus K-shell photoelectrons and Auger electrons to the DNA. Furthermore, a single event of phosphorus K-shell photoelectrons or Auger electrons was not enough to produce 1 DSB. However, single events were able to induce additional DNA damage, resulting in irreparable DSBs, so-called complex DSBs. Thus, although the effectiveness of cell inactivation by the absorbed dose was nearly equivalent, more complex DSB lesions were induced by the release of phosphorus K-shell photoelectrons and Auger electrons.

Author Contributions

Conceptualization, T.K. and K.H.; methodology, M.M., D.Y., T.K., N.U.; formal analysis, T.K., D.O., and K.H.; investigation and data curation, T.K., M.M. and D.Y.; writing—original draft preparation, D.O. and T.K.; writing—review and editing and supervision, K.H. All authors have read and agreed to the published version of the manuscript.

Funding

This research received no external funding.

Acknowledgments

We would like to thank Tengku Ahbrizal Farizal Tengku Ahmad of Malaysia Nuclear Agency and Ryoichi Hirayama of National Institute of Radiological Sciences for their invaluable discussion and their critical reading of the manuscript. This work was performed with the approval of the Photon Factory Advisory Committee (Proposal No. 2000G160).

Conflicts of Interest

The authors declare no conflict of interest.

References

  1. Attix, F.H. Introduction to Radiological Physics and Radiation Dosimetry; Wiley-VCH Verlag GmbH & Co, KGaA: Weinheim, Germany, 1986. [Google Scholar] [CrossRef]
  2. Humm, J.; Pomplun, E.; Booz, J.; Charlton, D.E. Energy and Number Distributions of Electrons and Photons Emitted After Photoelectric Interactions of X-rays With Phosphorus in DNA. In Radiation Protection: Eighth Symposium on Microdosimetry; Booz, J., Ebert, H., Eds.; Commission of the European Communities: Jülich, Germany, 1983; pp. 187–198. [Google Scholar]
  3. Watanabe, R.; Yokoya, A.; Fujii, K.; Saito, K. DNA strand breaks by direct energy deposition by Auger and photo-electrons ejected from DNA constituent atoms following K-shell photoabsorption. Int. J. Radiat. Biol. 2004, 80, 823–832. [Google Scholar] [CrossRef] [PubMed]
  4. Hieda, K.; Hirono, T.; Azami, A.; Suzuki, M.; Furusawa, Y.; Maezawa, H.; Usami, N.; Yokoya, A.; Kobayashi, K. Single- and double-strand breaks in pBR322 plasmid DNA by monochromatic X-rays on and off the K-absorption peak of phosphorus. Int. J. Radiat. Biol. 1996, 70, 437–445. [Google Scholar] [CrossRef] [PubMed]
  5. Kobayashi, K.; Hieda, K.; Maezawa, H.; Ando, M.; Ito, T. Monochromatic X-ray irradiation system (0.08–0.4 nm) for radiation biology studies using synchrotron radiation at the photon factory. J. Radiat. Res. 1987, 28, 243–253. [Google Scholar] [CrossRef] [PubMed] [Green Version]
  6. Hieda, K.; Ito, T. Radiobiological Experiments in the X-ray Region with Synchrotron Radiation Ch 13. In Handbook on Synchrotron Radiation; Ebashi, S., Koch, M., Rubenstein, E., Eds.; North-Holland: Amsterdam, The Netherlands, 1991; Volume 4, pp. 431–465. [Google Scholar]
  7. Konishi, H.; Yokoya, A.; Shiwaku, H.; Motohashi, H.; Makita, T.; Kashihara, Y.; Hashimoto, S.; Harami, T.; Sasaki, T.A.; Maeta, H.; et al. Synchrotron radiation beamline to study radioactive materials at the Photon factory. Nucl. Instrum. Methods Phys. Res. Sect. A Accel. Spectrometers Detect. Assoc. Equip. 1996, 372, 322–332. [Google Scholar] [CrossRef]
  8. Kobayashi, K. Photon-Induced Biological Consequences. In Charged Particle and Photon Interactions with Matter: Chemical, Physicochemical, and Biological Consequences with Applications; Mozumder, A., Hatano, Y., Eds.; Taylar & Francis Group: London, UK, 2003; pp. 471–490. [Google Scholar] [CrossRef]
  9. Maezawa, H.; Furusawa, Y.; Kobayashi, K.; Hieda, K.; Suzuki, M.; Usami, N.; Yokoya, A.; Mori, T. Lethal effect of K-shell absorption of intracellular phosphorus on wild-type and radiation sensitive mutants of Escherichia coli. Acta Oncol. 1996, 35, 889–894. [Google Scholar] [CrossRef] [Green Version]
  10. Munakata, N.; Hieda, K.; Usami, N.; Yokoya, A.; Kobayashi, K. Inactivation action spectra of Bacillus subtilis spores with monochromatic soft X rays (0.1–0.6 nm) of synchrotron radiation. Radiat. Res. 1992, 131, 72–80. [Google Scholar] [CrossRef]
  11. Usami, N.; Yokoya, A.; Ishizaka, S.; Kobayashi, K. Reparability of lethal lesions produced by phosphorus photoabsorption in yeast cells. J. Radiat. Res. 2001, 42, 317–331. [Google Scholar] [CrossRef] [Green Version]
  12. Watanabe, M.; Suzuki, M.; Watanabe, K.; Suzuki, K.; Usami, N.; Yokoya, A.; Kobayashi, K. Mutagenic and transforming effects of soft-X-rays with resonance energy of phosphorus K-absorption edge. Int. J. Radiat. Biol. 1992, 61, 161–168. [Google Scholar] [CrossRef]
  13. Takahashi, N.; Hieda, K.; Morohoshi, F.; Munakata, N. Base substitution spectra of nalidixylate resistant mutations induced by monochromatic soft X and 60Co gamma-rays in Bacillus subtilis spores. J. Radiat. Res. 1999, 40, 115–124. [Google Scholar] [CrossRef] [Green Version]
  14. Kobayashi, K.; Hieda, K.; Maezawa, H.; Furusawa, Y.; Suzuki, M.; Ito, T. Effects of K-shell X-ray absorption of intracellular phosphorus on yeast cells. Int. J. Radiat. Biol. 1991, 59, 643–650. [Google Scholar] [CrossRef]
  15. Saigusa, S.; Ejima, Y.; Kobayashi, K.; Sasaki, M.S. Induction of chromosome aberrations by monochromatic X-rays with resonance energy of phosphorus K-shell absorption edge. Int. J. Radiat. Biol. 1992, 61, 785–790. [Google Scholar] [CrossRef] [PubMed]
  16. Tomita, M.; Maeda, M.; Usami, N.; Yokoya, A.; Watanabe, R.; Kobayashi, K. Enhancement of DNA double-strand break induction and cell killing by K-shell absorption of phosphorus in human cell lines. Int. J. Radiat. Biol. 2016, 92, 724–732. [Google Scholar] [CrossRef] [PubMed]
  17. Maeda, M.; Kobayashi, K.; Hieda, K. Efficiencies of induction of DNA double strand breaks in solution by photoabsorption at phosphorus and platinum. Int. J. Radiat. Biol. 2004, 80, 841–847. [Google Scholar] [CrossRef]
  18. Sekiyama, H. P K Absorption Spectra of PO43−, PHO32−, PH2O2−, P2O74− and P3O105−. In Photon Factory Activity Report 1984/1985, Part B Users’ Reports, National Laboratory for High Energy Physics; KEK: Hong Kong, 1986; p. 198. [Google Scholar]
  19. White, D.R.; Booz, J.; Griffith, R.V.; Spokas, J.J.; Wilson, I.J. Report 44. J. Int. Comm. Radiat. Units Meas. 2016, 22. [Google Scholar] [CrossRef]
  20. Hubbell, J.H. Photon mass attenuation and energy-absorption coefficients. Int. J. Appl. Radiat. Isot. 1982, 33, 1269–1290. [Google Scholar] [CrossRef]
  21. Konishi, T.; Takeyasu, A.; Yasuda, N.; Natsume, T.; Nakajima, H.; Matsumoto, K.; Asuka, T.; Sato, Y.; Furusawa, Y.; Hieda, K. Number of Fe ion traversals through a cell nucleus for mammalian cell inactivation near the bragg peak. J. Radiat. Res. 2005, 46, 415–424. [Google Scholar] [CrossRef] [Green Version]
  22. Blocher, D. In CHEF electrophoresis a linear induction of dsb corresponds to a nonlinear fraction of extracted DNA with dose. Int. J. Radiat. Biol. 1990, 57, 7–12. [Google Scholar] [CrossRef]
  23. Fox, M.; Boyle, J.M. Factors affecting the growth of Chinese hamster cells in halt selection media. Mutat. Res. Mol. Mech. Mutagen. 1976, 35, 445–464. [Google Scholar] [CrossRef]
  24. Kellerer, A.M.; Rossi, H.H. The Theory of Dual Radiation Action. In Current Topics in Radiation Research; Ebert, M., Howard, A., Eds.; North-Holland Publishing Company: Amsterdam, The Netherlands, 1974; Volume 8, pp. 85–158. [Google Scholar]
  25. Tobias, C. The Repair-Misrepair Model of Cell Survival. In Radiation Biology and Cancer Research; Meyn, R., Withers, H., Eds.; Raven Press: New York, NY, USA, 1980; pp. 195–230. [Google Scholar]
  26. Chadwick, K.; Leenhouts, H. The Molecular Theory of Radiation Biology; Springer: Berlin, Germany, 1981. [Google Scholar] [CrossRef]
  27. Curtis, S.B. Lethal and potentially lethal lesions induced by radiation--a unified repair model. Radiat. Res. 1986, 106, 252–270. [Google Scholar] [CrossRef]
  28. Curtis, S.B. The Lethal and Potentially Lethal Model—A Review and Recent Development. In Quantitative Mathematical Models in Radiation Biology; Springer: Berlin/Heidelberg, Germany, 1988; pp. 137–146. [Google Scholar] [CrossRef]
  29. Alpen, E. Radiation Biophysics; Elsevier: Amsterdam, The Netherlands, 1998. [Google Scholar] [CrossRef]
  30. Barendsen, G.W. Mechanisms of Cell Reproductive Death and Shapes of Radiation Dose-survival Curves of Mammalian Cells. Int. J. Radiat. Biol. 1990, 57, 885–896. [Google Scholar] [CrossRef]
  31. Barendsen, G.W. Parameters of linear-quadratic radiation dose-effect relationships: Dependence on LET and mechanisms of reproductive cell death. Int. J. Radiat. Biol. 1997, 71, 649–655. [Google Scholar] [CrossRef] [PubMed] [Green Version]
  32. Chapman, J.D. Single-hit mechanism of tumour cell killing by radiation. Int. J. Radiat. Biol. 2003, 79, 71–81. [Google Scholar] [CrossRef] [PubMed]
  33. Sech, C.L.; Frohlich, H.; Saint-Marc, C.; Charlier, M. DNA Breakage upon K-Shell Excitation of Phosphorus as a Model for Direct Effects in Radiation Biology. Radiat. Res. 1996, 145. [Google Scholar] [CrossRef]
  34. Yokoya, A.; Cunniffe, S.M.; Watanabe, R.; Kobayashi, K.; O’Neill, P. Induction of DNA strand breaks, base lesions and clustered damage sites in hydrated plasmid DNA films by ultrasoft X rays around the phosphorus K edge. Radiat. Res. 2009, 172, 296–305. [Google Scholar] [CrossRef]
  35. Maezawa, H.; Indo, H.P.; Usami, N.; Majima, H.J.; Ito, H.; Ohnishi, K.; Kobayashi, K. Enhancement of membrane lipid peroxidation in lung cancer cells irradiated with monoenergetic X-rays at the K-shell resonance absorption peak of phosphorus. J. Radiat. Res. 2020, 61, 237–242. [Google Scholar] [CrossRef]
  36. Bigelow, A.W.; Randers-Pehrson, G.; Garty, G.; Geard, C.R.; Xu, Y.; Harken, A.D.; Johnson, G.W.; Brenner, D.J. Ion, X-ray, UV and Neutron Microbeam Systems for Cell Irradiation. AIP Conf. Proc. 2010, 1336, 351–355. [Google Scholar] [CrossRef] [Green Version]
  37. Konishi, T.; Oikawa, M.; Suya, N.; Ishikawa, T.; Maeda, T.; Kobayashi, A.; Shiomi, N.; Kodama, K.; Hamano, T.; Homma-Takeda, S.; et al. SPICE-NIRS microbeam: A focused vertical system for proton irradiation of a single cell for radiobiological research. J. Radiat. Res. 2013, 54, 736–747. [Google Scholar] [CrossRef] [Green Version]
  38. Tomita, M.; Maeda, M. Mechanisms and biological importance of photon-induced bystander responses: Do they have an impact on low-dose radiation responses. J. Radiat. Res. 2015, 56, 205–219. [Google Scholar] [CrossRef] [PubMed] [Green Version]
  39. Wu, L.J.; Randers-Pehrson, G.; Xu, A.; Waldren, C.A.; Geard, C.R.; Yu, Z.; Hei, T.K. Targeted cytoplasmic irradiation with alpha particles induces mutations in mammalian cells. Proc. Natl. Acad. Sci. USA 1999, 96, 4959–4964. [Google Scholar] [CrossRef] [Green Version]
  40. Maeda, M.; Usami, N.; Kobayashi, K. Low-dose hypersensitivity in nucleus-irradiated V79 cells studied with synchrotron X-ray microbeam. J. Radiat. Res. 2008, 49, 171–180. [Google Scholar] [CrossRef] [Green Version]
  41. Konishi, T.; Kobayashi, A.; Tengku Ahmad, T.F.; Wang, J. Enhanced DNA double strand break repair triggered by microbeam irradiation induced cytoplasmic damage. J. Radiat. Cancer Res. 2018, 9, 183–189. [Google Scholar] [CrossRef]
  42. Wang, J.; Konishi, T. Nuclear factor (erythroid-derived 2)-like 2 antioxidative response mitigates cytoplasmic radiation-induced DNA double-strand breaks. Cancer Sci. 2019, 110, 686–696. [Google Scholar] [CrossRef] [PubMed] [Green Version]
  43. Wang, J.; Kobayashi, A.; Ohsawa, D.; Oikawa, M.; Konishi, T. Cytoplasmic Radiation Induced Radio-Adaptive Response in Human Lung Fibroblast WI-38 Cells. Radiat. Res. 2020, 194, 288–297. [Google Scholar] [CrossRef] [PubMed]
Figure 1. Survival curve of V79 Chinese hamster cells after irradiation of monochromatic X-rays at the absorption peak (2.153 keV, solid circles) of the phosphorus K-shell and at 6 eV below the peak (2.147 keV, open circles). Panel (a): Survival curves plotted against exposure. Panel (b): Fraction of DNA fragments below 4.6 Mbp (Find(k < 4.6)) plotted against exposure. Solid circles: Results after X-ray irradiation on the phosphorus K-shell absorption peak (2.153 keV). Open circles: below the peak (2.147 keV).
Qubs 04 00038 g001
Figure 2. Survival curve of V79 Chinese hamster cells after irradiation of monochromatic X-rays at the absorption peak (2.153 keV, solid circles) of the phosphorus K-shell and at 6 eV below the peak (2.147 keV, open circles). Panel (a): Survival curves plotted against absorbed dose in Gy. Panel (b): Fraction of DNA fragments below 4.6 Mbp (Find(k < 4.6)) plotted against absorbed dose in Gy. Solid circles: Results after X-ray irradiation on the phosphorus K-shell absorption peak (2.153 keV). Open circles: below the peak (2.147 keV).
Qubs 04 00038 g002
Figure 3. Representative PFGE gel image. Cellular DNA of V79 cells were electrophoresed under a pulse field conditions and stained with ethidium bromide. Size markers a, b, and c were DNA from S. cerevisiae (0.225–2.2 Mbp), H. wingei (1.05–3.13 Mbp), and S. pombe (3.5–5.7 Mbp), respectively. Molecular sizes in mega base pair (Mbp) are indicated by numerals with triangles.
Qubs 04 00038 g003
Table 1. Mass energy absorption coefficients, μen/ρ at the energy on the absorption peak of phosphorus K-shell (2.153 keV) and 6 eV below the peak (2.147 keV).
Materialsμen [m2/kg]
2.147 keV2.153 keV
Air (1)42.7942.45
Water (1)50.1749.77
Soft tissue (2)45.6648.75
Cell nucleus (2)46.1171.05
DNA (3)41.8140.4
(1)μen values were obtained by interpolating the values at 2 and 3 keV tabulated by Hubbell [20]. (2) Elemental compositions were taken from ICRU Report 44 [19]. (3) The values for DNA-Na salt are taken from Hieda et al. [4].
Table 2. The parameters (α and β) of the linear-quadratic equation fitted to the survival curves in Figure 1a, and the exposures (Ψ37, Ψ10, and Ψ1) resulting in survival levels of i, 37%, 10%, and 1%, calculated using fitted parameters.
Energy
[keV]
α
[C/kg]−1
β
[C/kg]−2
Ψ37
[C/kg]
Ψ10
[C/kg]
Ψ1
[C/kg]
2.1475.54 ± 1.7113.5 ± 11.90.07230.1200.179
2.15314.4 ± 2.5124.2 ± 19.20.04860.0900.143
f12.60 ± 0.931.09 ± 0.21.491.331.25
1f: enhancement factor for 2.153 keV compared to 2.147 keV.
Table 3. The parameters α and β of the linear-quadratic equation fitted to the survival curves in Figure 2a and dose resulting in survival levels of i, 37%, 10%, and 1%, calculated using the fitted parameters.
Energy
[keV]
α
[Gy]−1
β
[Gy]−2
D37
[Gy]
D10
[Gy]
D1
[Gy]
2.1470.152 ± 0.0470.085 ± 0.0092.644.386.51
2.1530.254 ± 0.0450.039 ± 0.0062.755.108.11
f11.67 ± 0.590.45 ± 0.070.960.860.80
1f: enhancement factor for 2.153 keV compared to 2.147 keV.
Table 4. DNA double strand break (DSB) induction rates in per exposure Ψ (C/kg) and per absorbed dose, D (Gy), calculated using the number of DSBs per cell per Ψi and Di resulting in survival levels, i, of 37%, 10%, and 1% in Table 2.
Energy
[keV]
R
DSB/Mbp
/Ψ
R′ × 10−3
DSB/Mbp
/Gy
R″
DSB/Cell
/Gy
DSB/Cell/Ψi (or Di)
Ψ37
(D37)
Ψ10
(D10)
Ψ1
(D1)
2.1470.224 ± 0.0156.10 ± 0.4031.4 ± 2.120.046.390.7
2.1530.350 ± 0.0206.20 ± 0.4031.9 ± 2.122.161.5135.8
f11.56 ± 0.131.02 ± 0.261.02 ± 0.261.101.331.50
1f: enhancement factor for 2.153 keV compared to 2.147 keV.
Table 5. The cross-section of DSB induction (σDSB), the absorption cross-section (σabsorption) of V79 cellular DNA, and the partial cross-section of phosphorus K-shell.
Energy
[keV]
Cross-Section 10−13 [m2]Quantum
Yield ***
σDSBσabsorption *
2.1475.02 ± 0.332.42 ± 0.46-
2.1537.79 ± 0.338.13 ± 0.16-
phosphorus K-shell **2.77 ± 0.555.71 ± 0.490.49 ± 0.18 #
* σabsorption were estimated from the absorption cross-section of pBR322 DNA [4] × 1.18 × 106 (= 5.15 Mbp/4.361 kbp where bp of V79 DNA and pBR322 DNA, respectively). ** The cross-sections for the K-shell of phosphorus were calculated as the difference between the cross-sections at 2.153 keV and 2.147 keV. *** Quantum yield was calculated as σDSBabsorption. As for 2.147 and 2.153 keV were omitted due to σDSB were induced by secondary electrons produced outside of the molecule and the quantum yields has no physical meaning. # Quantum yield of phosphorus K-shell was calculated as σDSBabsorption of partial cross-section.
Publisher’s Note: MDPI stays neutral with regard to jurisdictional claims in published maps and institutional affiliations.

