Irradiation Effects of Swift Heavy Ions Detected by Refractive Index Depth Profiling


1
National Institute for Materials Science (NIMS), Tsukuba, Ibaraki 305-0003, Japan
2
School of Physics, State Key Laboratory of Crystal Materials, Shandong University, Jinan 250100, China
3
Japan Atomic Energy Agency (JAEA), Tokai, Ibaraki 319-1195, Japan
*
Author to whom correspondence should be addressed.
Quantum Beam Sci. 2020, 4(4), 39; https://0-doi-org.brum.beds.ac.uk/10.3390/qubs4040039
Submission received: 25 September 2020
/
Revised: 6 November 2020
/
Accepted: 10 November 2020
/
Published: 16 November 2020
(This article belongs to the Special Issue The Modifications of Metallic and Inorganic Materials by Using Energetic Ion/Electron Beams)
Abstract
:Evolution of depth profiles of the refractive index in Y3Al5O12 (YAG) crystals were studied under 200 MeV 136Xe14+ ion irradiation, since the index can be related with the stress change and/or the defect formation by the irradiation. Using the prism-coupling and the end-surface coupling methods, various waveguide (WG) modes were detected. Then, the index depth profiles were determined by reproducing the observed WG modes. The index changes were observed at three different depth regions; (i) a sharp dip at 13 μm in depth, which is attributed to the nuclear stopping Sn peak, (ii) a plateau near the surface between 0 and 3 μm in depth, which can be ascribed to the electronic stopping Se, since Se has a very broad peak at the surface, and (iii) a broad peak at 6 μm in depth. Since the last peak is ascribed to neither of Se nor Sn peak, it could be attributed to the synergy effect of Se and Sn.
1. Introduction
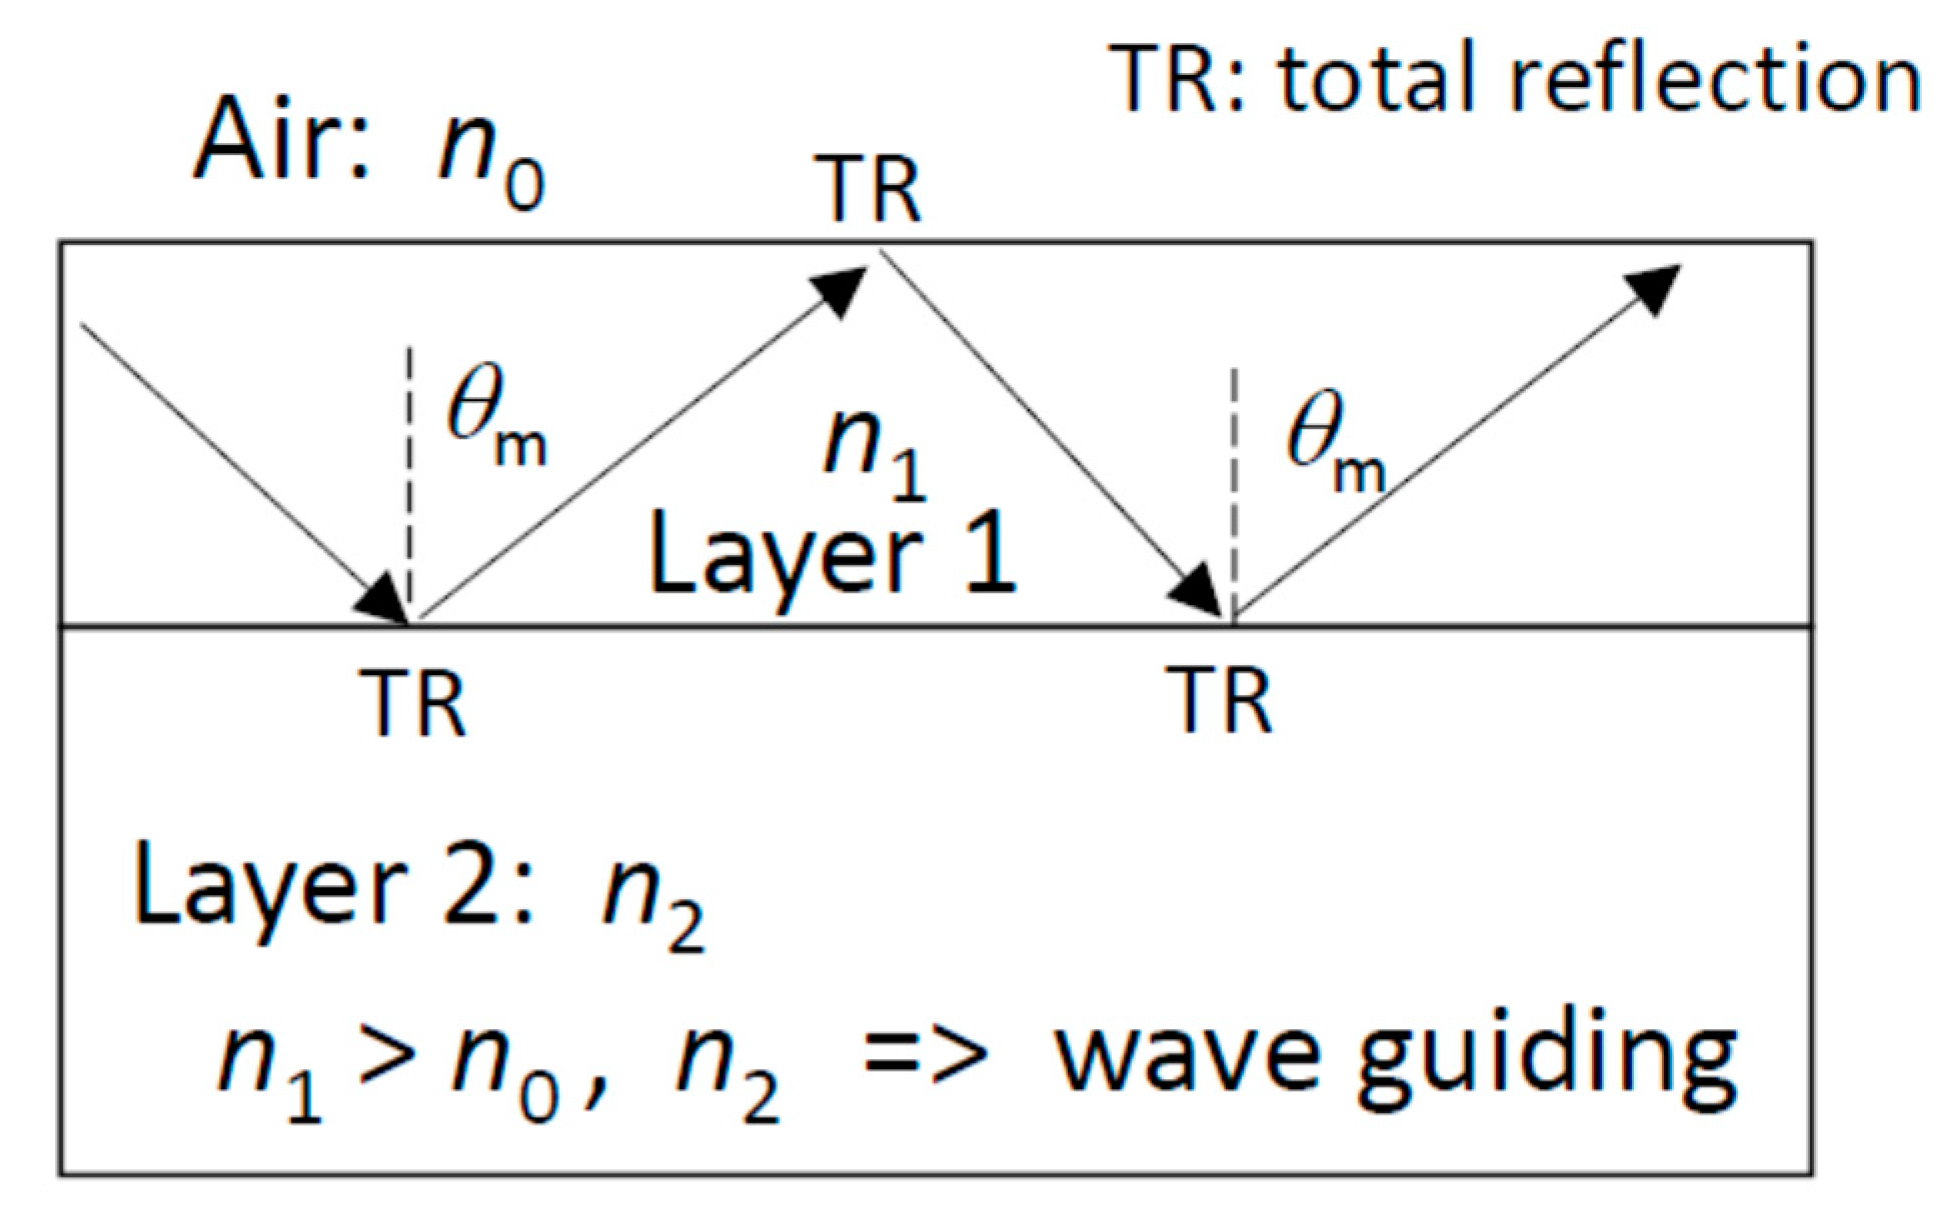
Optical waveguides (WGs) are elements to confine light wave inside and to guide the waves along them, which are considered as important parts for future optical integrate circuits [1]. Some special WGs possess additional functions such as lasing [2,3], the second harmonic generation [3,4], and the photorefractive effect [3,5]. While the most known WGs are optical fibers, here we discuss WGs of the slab type, which consist of thin film layer(s) on a substrate (See Figure 1). The optical WGs of the slab type are easily formed, when a transparent material B (guiding layer), having the highest index (nB), is sandwiched with materials A (cladding layer: nA) and C (substrate layer: nC), both having lower indices than the material B (the guiding layer), i.e., nA, nC < nB. At the boundaries A–B and B–C, the total reflections are repeated with the reflection angles higher than certain values. Light could be confined in the material B due to the total reflections at both the boundaries A–B and B–C. The material A (cladding layer) can be replaced by air or a vacuum, since either of them has the index of ~1, i.e., lower than most of the guiding layer material B. Consequently, the simplest WGs consist of two layers: (i) a higher index layer deposited on a lower index substrate can act as a slab-type WG. (ii) another strategy is to decrease the refractive index of a certain depth region of a transparent material without decreasing the index of the shallower layer.
Ion irradiation can realize the latter structures (ii). According to the Lorentz–Lorenz’s (LL) formula (Equation (1)), the relative change of the refractive index Δn/n is described as the following relation [3],
or approximately
where ΔV/V, Δα/α, and F denote relative changes of volume, of polarizability, and of other factors such as phase transition, respectively. From the first term in the right side of Equation (1), it is expected that the ensemble of Frenkel pairs, i.e., pairs of vacancies and interstitial atoms, could induce local volume expansion (ΔV > 0), which results in the index reduction (Δn < 0) in some transparent solids. Moreover, lattice expansion and contraction (ΔV > 0 and < 0) results in the index reduction and enhancement (Δn > 0 and < 0), respectively.
Of course, ion irradiation could exchange atomic arrangements so that newly formed chemical bonds may change the (bond) polarizability α, i.e., the second term of Equation (1). Furthermore, some phase transitions, e.g., amorphization, could suddenly change the relative index (the third term of Equation (1)).
In this paper, however, the first term in the right side of Equation (1) is only considered as an approximation, and the second and the third terms are, at the moment, neglected. Therefore, instead of the Equation (1), the Equation (2) is used in this paper. Our main concern is the detection of the defect formation and/or the stress generation via the index changes. We will not discuss the volume changes quantitatively.
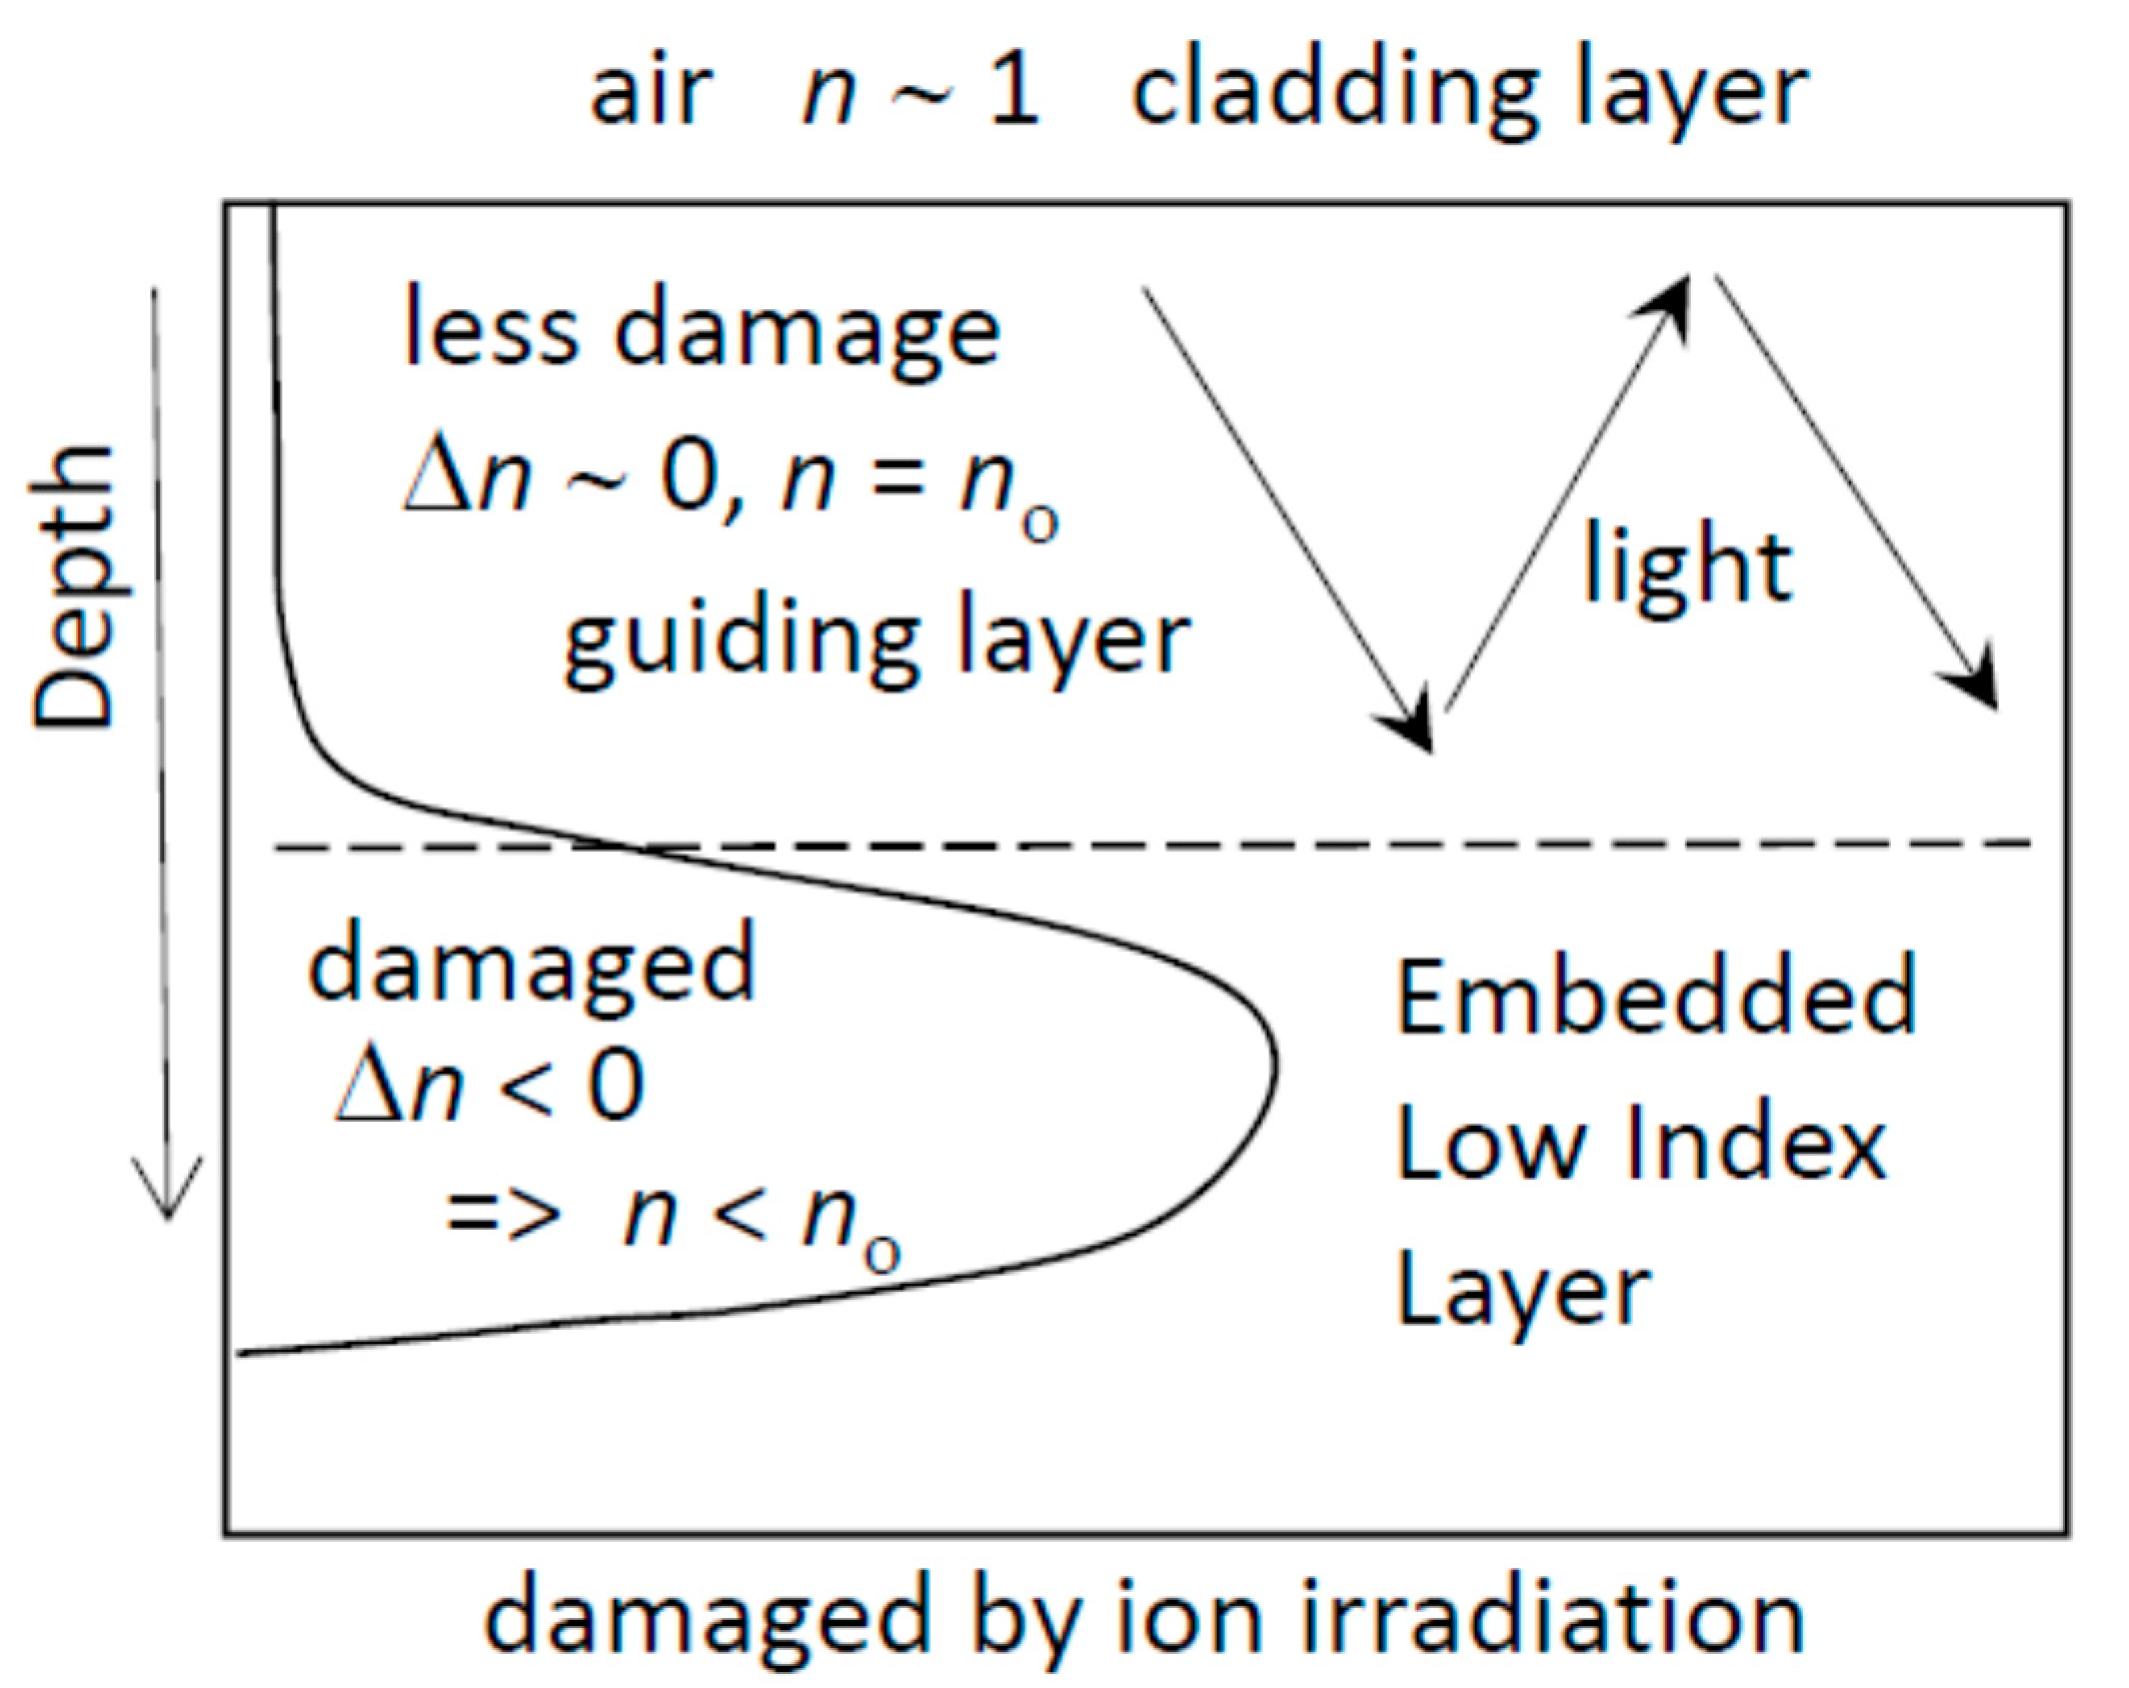
The original idea to produce optical WGs in transparent crystals by ion beams, was to utilize the nuclear stopping process of light ions, e.g., ~1–2 MeV He ions [6]. As schematically shown in Figure 2, the nuclear energy loss (Sn) reaches the maximum at several micrometers beneath the crystal’s surface, i.e., the Bragg peak, and leaves serious damage. Much shallower region than the Bragg peak is preserved negligible damage. From Equation (2), the refractive index decreases (Δn < 0) around the Bragg peak depth due to serious damage, i.e., ΔV > 0, while the index almost preserves in the layer shallower than the Bragg peak. This is the WG structures of the type (ii).
Since the first optical WG was successfully formed by ion irradiations [6], various studies have been developed: This methodology has been applied in various materials [3,7]. In some glasses, it was confirmed that ion irradiation induced the increase of the density, i.e., ΔV < 0, i.e., Δn > 0 [8].
Olivares et al. clarified that not only the nuclear energy loss (Sn) but also the electronic energy loss (Se) of swift heavy ions reduces the refractive index of crystals [9]. Rodriguez et al. studied ion tracks in Nd-doped yttrium aluminum garnet (Nd:YAG) formed by 2.2 GeV Au ion irradiation, using transmission electron microscopy (TEM) and small angle X-ray scattering (SAXS) [10]. They concluded that the ion tracks were in an amorphous phase with a hard-cylinder density distribution, other than the core/shell types. We have confirmed the refractive index changes of Nd:YAG induced by 15 MeV Au5+ irradiation to 8 × 10¹⁴ ions/cm2, and found that the amorphous phase showed a lower index [11].
As shown in Equation (2), the studies of the refractive index change provide information on the density changes, which are induced by ion irradiation, via damage or stress change. According to a naive image of WG shown in Figure 1, the waveguiding is possible for any angles higher than a certain value. However, this is not correct. Because of the interference of light, the guiding is possible only for discrete values of the angles, each of which corresponds to the WG mode. Furthermore, when the light confinement is surely maintained between the cladding and the substrate layer, the guiding is possible for inhomogeneous index profile in the guiding layer, with different distribution of the modes. Contrary, with measuring the mode angles using, e.g., the prism coupling method, the depth profile of the refractive index can be reconstructed. This paper reports the fluence dependence of the refractive index profiles of yttrium-aluminum-garnet (YAG) crystals irradiated with swift heavy ions (SHIs) of 200 MeV Xe14+ ions, at various fluences ranging from 1 × 10¹¹ to 5 × 10¹³ ions/cm2.
2. Materials and Methods
2.1. Material
Single crystals of undoped yttrium-aluminum-garnet (Y3Al5O12, YAG) with the dimensions of 10 mm by 10 mm by 1 mm were purchased from ATOM Optics Co. Ltd., Shanghai, China. The double sides of them were mirror-polished. Here the “undoped YAG” means that Nd ions or other rare-earth impurities have not been intentionally doped. While the samples were single crystals in unirradiated state, they seemed to transform to polycrystalline and finally to amorphous, as shown later. The crystalline structure of YAG (Y3Al5O12) is the garnet type, i.e., in the cubic symmetry but including many atoms in a unit cell.
2.2. Ion Irradiation
The {0 0 1} plane of the single crystals of YAG was irradiated at room temperature with 200 MeV 136Xe14+ ions from the tandem accelerator in the Japan Atomic Energy Agency (JAEA), Tokai Research and Development Center. The fluence ranged from 1 × 10¹¹ to 5 × 10¹³ ions/cm2, with maintaining the beam current density at ~60 nA/cm2, except the fluences of 1 × 10¹¹ and 3 × 10¹¹ ions/cm2 at ~5 nA/cm2 to avoid inaccurate fluences due to too short irradiation time. Noted that the particle current density is 1/14 of the above-described values. The beam was rasterized at ~40 Hz (horizontal) and ~2 Hz (vertical). An important point was the frequencies were approximated values, which were not commensurate. The area of 10 mm square was irradiated through a square slit.
The stopping powers and the projected range of the 200 MeV Xe ions in YAG was calculated using SRIM 2013 code [12] with the mass density of 4.56 g/cm3, and shown in Table 1. The displacement energy, the bulk binding energy, and the surface binding energy of each element used for the calculations were summarized in Table 2. The 200 MeV Xe ion provides the electronic stopping power Se of 24.3 keV/nm, which was much higher than the track formation threshold of 7.5 keV/nm [13].
2.3. FIA-XRD
The fixed incident angle X-ray diffractometry (FIA-XRD) was carried out by RINT 2500 MDG, (Rigaku Co., Ltd., Tokyo, Japan), with a fixed incident angle of 15° from the sample surface using the Cr Kα line (λ = 0.22896 nm) from an X-ray source. Different from the conventional θ-2θ method, the penetration depth of the incoming X-ray is constant for FIA-XRD, irrespective of the scattering angle 2θ. Since the ion irradiation effects often depend on the sample depth, the FIA-XRD method could be advantageous. The incident angle of 15° corresponds to the X-ray penetration depth of 2.76 μm normal from the sample surface. Here, the penetration depth defines where the incident X-ray intensity decreases to 1/e, where e is the Napier’s constant. The density of 4.56 g/cm3 was used for the penetration calculation.
2.4. Index Measurements
Depth profiles of the refractive index was determined by two methods, i.e., the prism-coupling and the end-face coupling. In former, all the WG mode angles were consistently fitted. Instead of the mode angles θm, the effective refractive index nm is usually used in this community,
where n1 denotes the index in the guiding layer.
nm = n1 sinθm
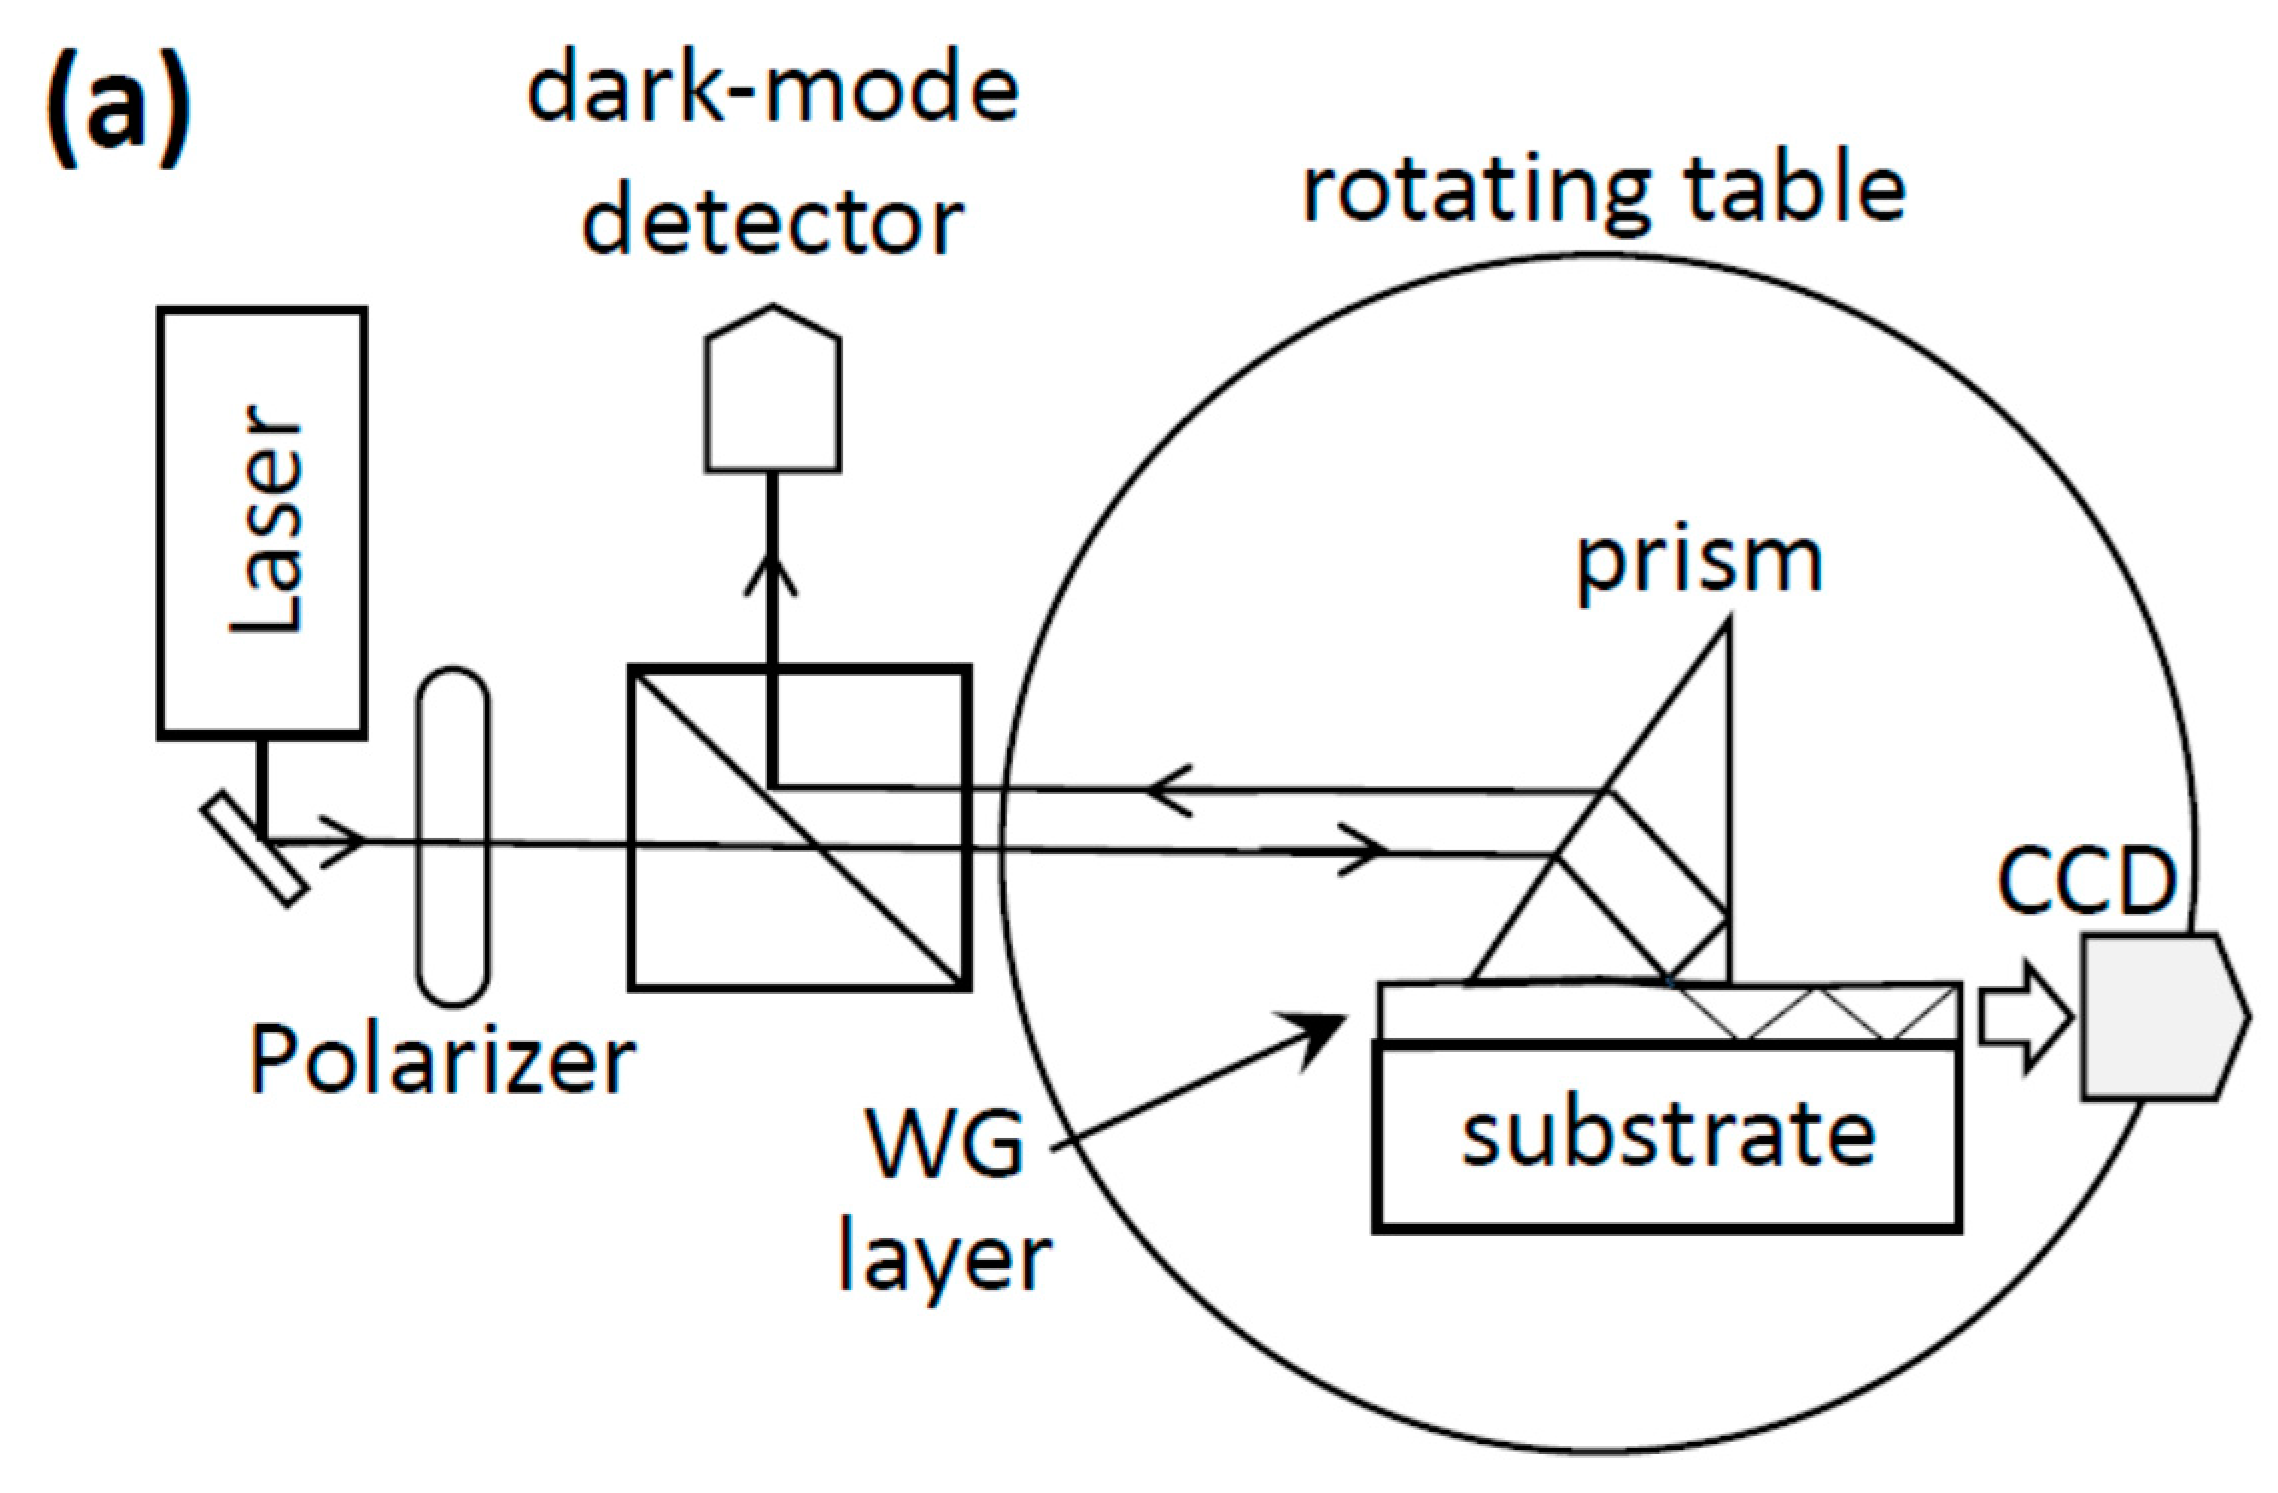
After measuring the angles or the effective refractive indices where WG modes are excited, a depth profile of the index is determined in order to reproduce all the mode angles using the reflectivity calculation method (RCM). See Reference [3] for the RCM. The mode angles where WG modes are excited were measured by the prism-coupling method. Figure 3a schematically depicts a setup of the prism-coupling apparatus. A laser line of 632.8 nm from a He-Ne laser was used as a light source. A polarizer was inserted to select a polarization plan of the WG mode from the transverse electric (TE) or the transverse magnetic (TM). In this paper, most of the data were detected in the TM configuration. A prism was attached on a part of the WG sample in order to couple with the light in air (a vacuum) and the light in the WG via evanescent wave in a gap between the prism and the WG. The prism, the sample, and a charge-coupled device (CCD) detector facing at the end-surface of the sample, were attached on a rotating table, in order to change an incident angle of the laser light to the WG layer without changing the configurations of the prism, the sample, and the CCD detector. The light intensity reflected at the boundary between the prism and the WG was monitored with inserting a beam splitter between the polarizer and the prism. The reflected light was transferred via the beam splitter and detected by “a dark-mode detector”. When a mode is excited with adjusting the modal angle θm, the light intensity detected at the CCD detector facing the end-surface increases because a part of light is guided to the end-surface. Simultaneously, when the mode is matched, the incident light is efficiently introduced into the WG. Consequently, the reflection intensity at the prism-WG boundary decreases, i.e., the signal at the dark-mode detector decreases.
The WG modes were searched with scanning the WG angle or equivalently the effective index. Figure 3b shows an example of the effective index (i.e., the WG angle) dependence of the light intensity detected by the dark-mode detector. In this case, dips in the signal correspond to the WG modes. In principle, the same modes should be detected also by the “bright-mode detection” using the CCD detector facing at the end-surface. However, as a rule of thumb, the dark-mode detection provides sharper dips and more sensitive. We applied this method.
As schematically shown in Figure 3c, the end-face coupling method was also applied. With controlling the polarization of laser by a half-wave plate, the laser light was introduced by the objective lens 1. The guided light pattern was detected through the objective lens 2. The spatial intensity patterns at the end-surface were another important information, which were experimentally detected by a CCD camera and calculated by the beam propagation method (BPM) using BeamPROP code (RSoft, Co. Ltd., Tokyo, Japan).
3. Experimental Results
3.1. X-ray Diffraction
Figure 4 shows FIA-XRD patterns from undoped YAG crystals irradiated with 200 MeV Xe14+ ions to various fluences ranging from 0 to 5 × 10¹³ ions/cm2. Before the irradiation, relatively strong four peaks were observed, all of which were assigned to diffractions from the garnet structure: 55.8° for (4 2 2), 124.6° for (9 2 1), 135.7° for (9 3 2), and 150.3° for (7 7 2) [14]. Because the garnet structure includes many atoms in a unit cell, many peaks are reported in the powder diffraction patterns. However, our samples showed only limited peaks due to high crystallinity. After the irradiation to 1 × 10¹¹ ions/cm2, the same peaks were observed, while the intensity ratios and the diffraction angles slightly changed. At the fluence of 1 × 10¹² ions/cm2, new four peaks were added, which were also assigned to the garnet structure: 65.1° to (4 4 0), 72.0° to (5 3 2), 88.6° to (5 5 2), and 105.2° to (6 5 3) [14]. Because of the partial amorphization, the single crystal was partly broken down to smaller grains facing various directions, i.e., poly-crystallization. Consequently, the new peaks were allowed to be observed. At the fluence of 1 × 10¹³ ions/cm2 and higher, all the peaks disappeared indicating the full amorphization of the YAG crystal. Amorphization of Nd-doped YAG crystals was already reported by Rutherford backscattering spectrometry (RBS)-channeling [15] and TEM [10].
3.2. Refractive Index Profiling
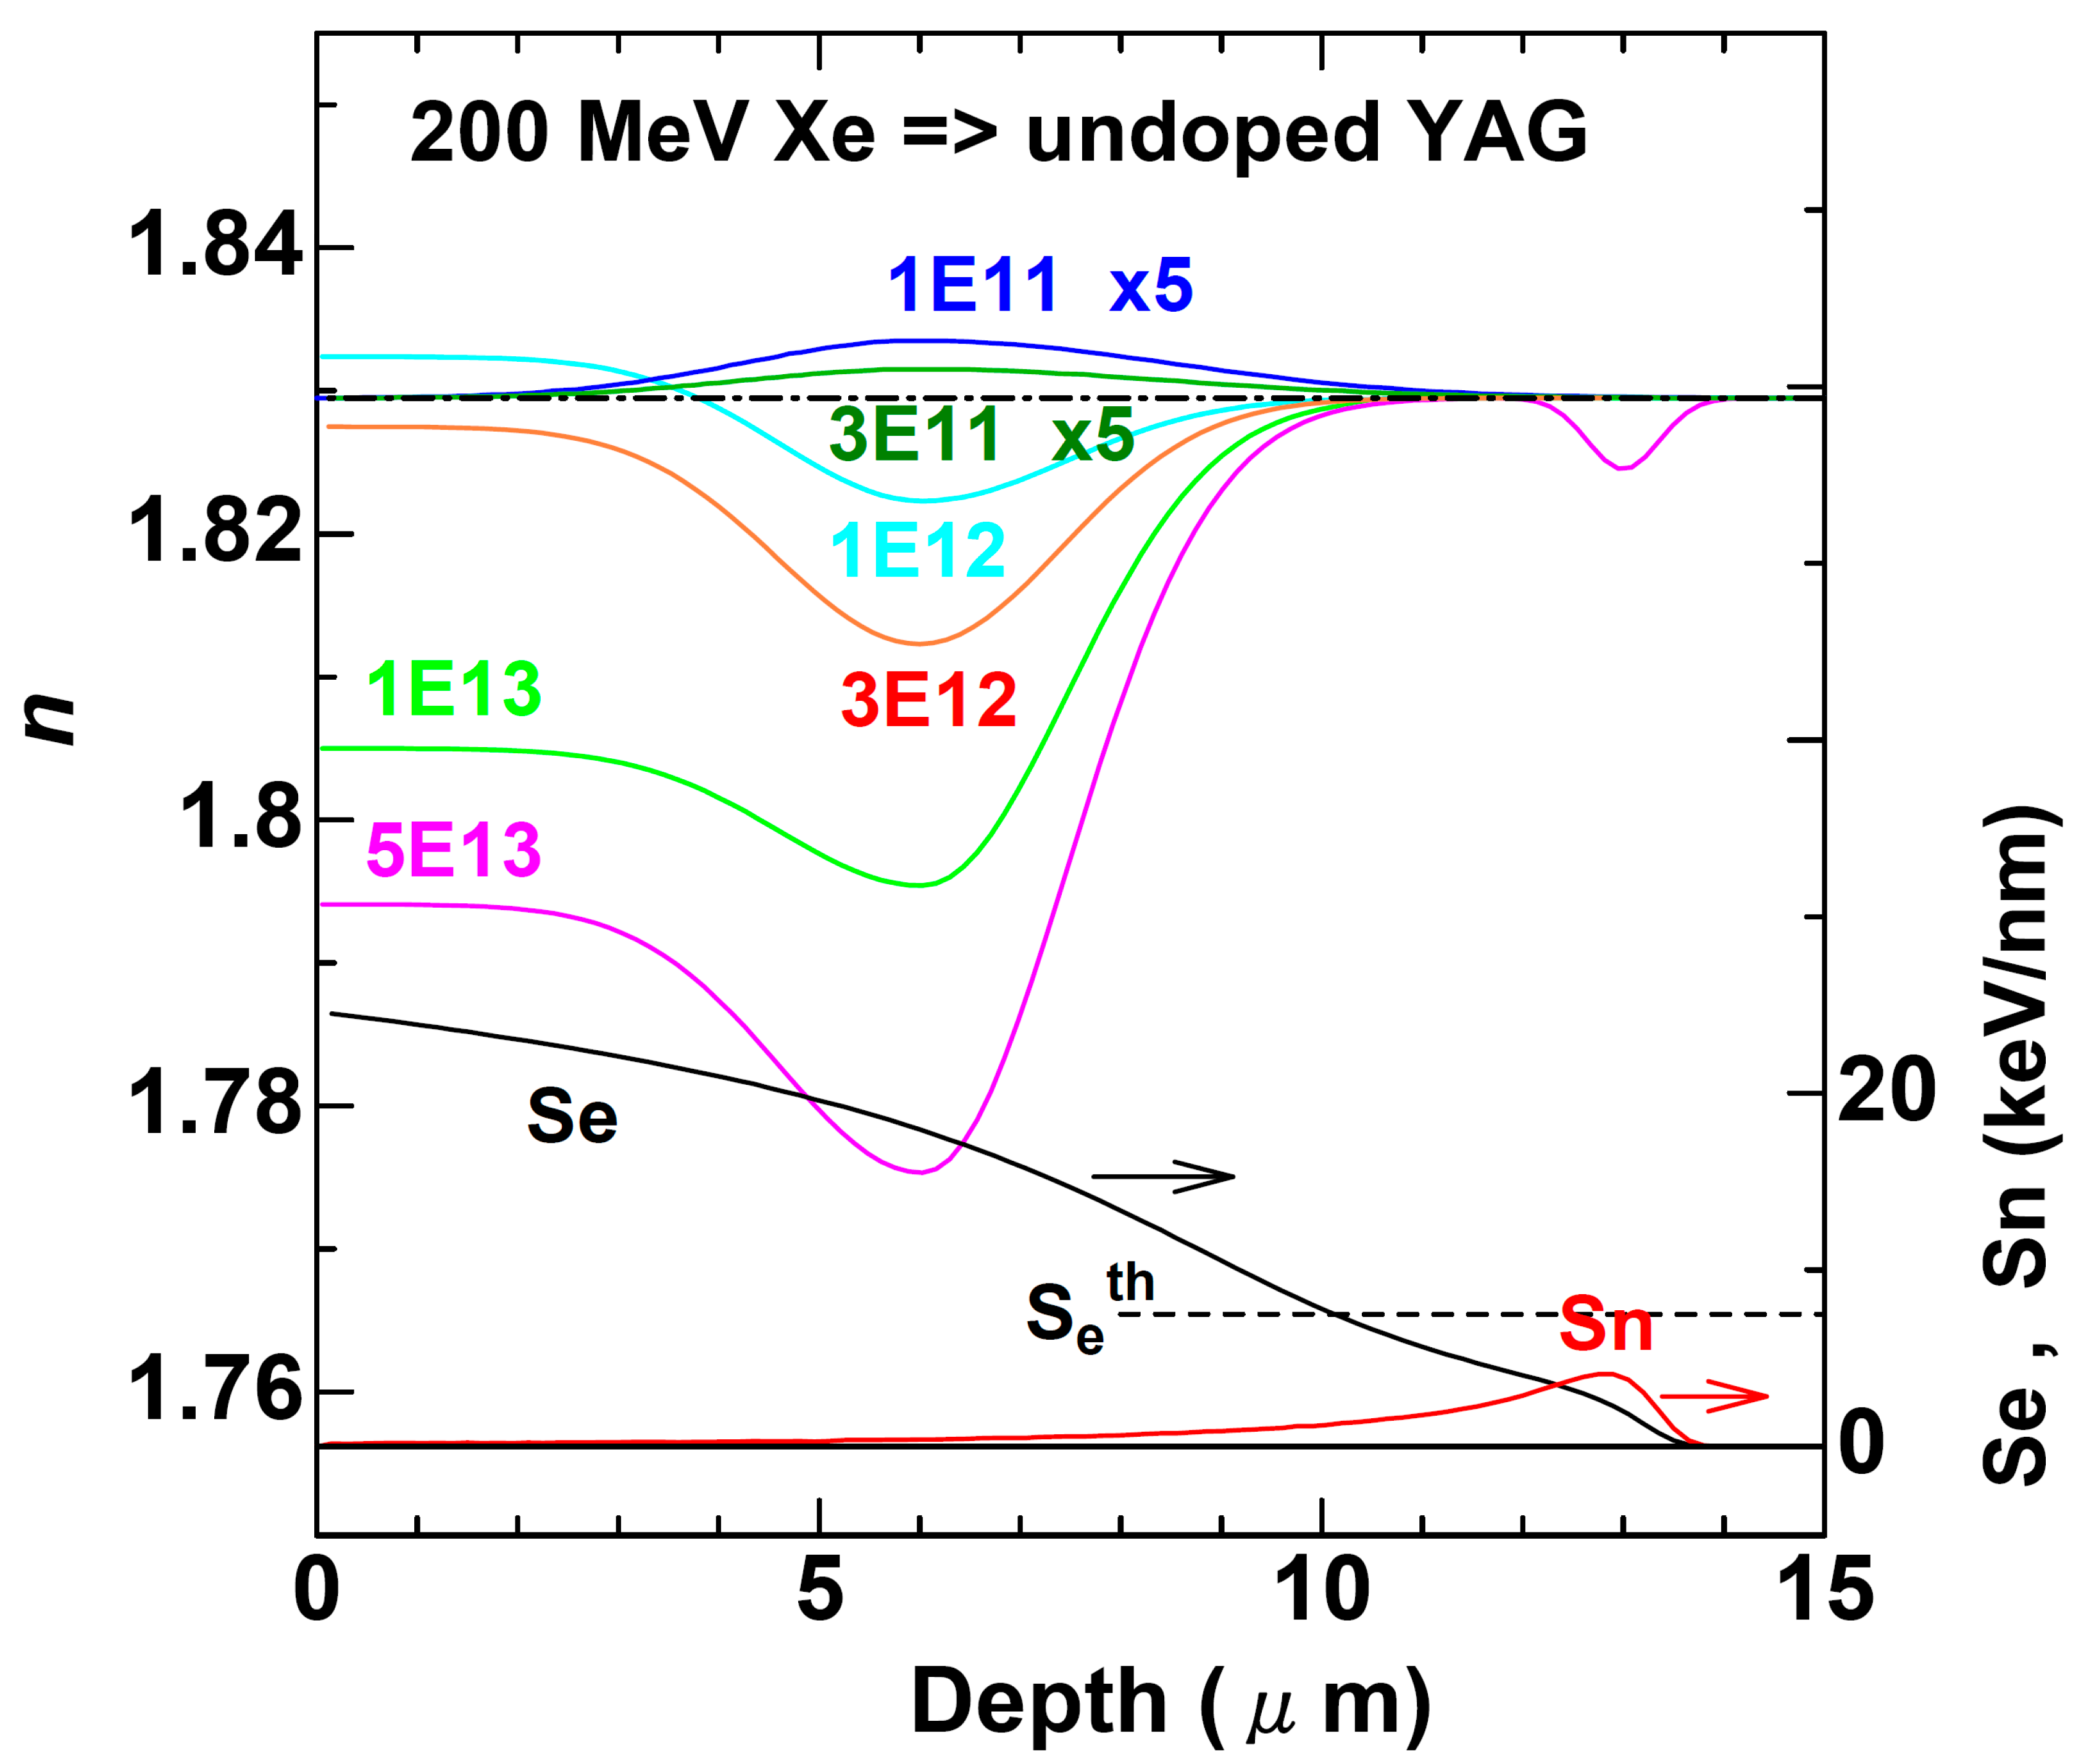
Figure 5 exhibits depth profiles of the refractive index in undoped YAG crystals at various ion fluences. The data in the TM configuration are shown, while those in the TE mode are mentioned later. A chained horizontal line at 1.8295 indicates the index in the unirradiated state at the wavelength of 632.8 nm from literature [16]. After the irradiation to 1 × 10¹¹ ions/cm2, a very weak and broad enhancement peak was observed at 6 μm in depth with the full width at half maximum (FWHM) of ~4 μm. Since the deviation from the unirradiated value was so small for the data at 1 × 10¹¹ and 3 × 10¹¹ ions/cm2 that the deviation from the unirradiated value was plotted with five times magnification around the unirradiated value.
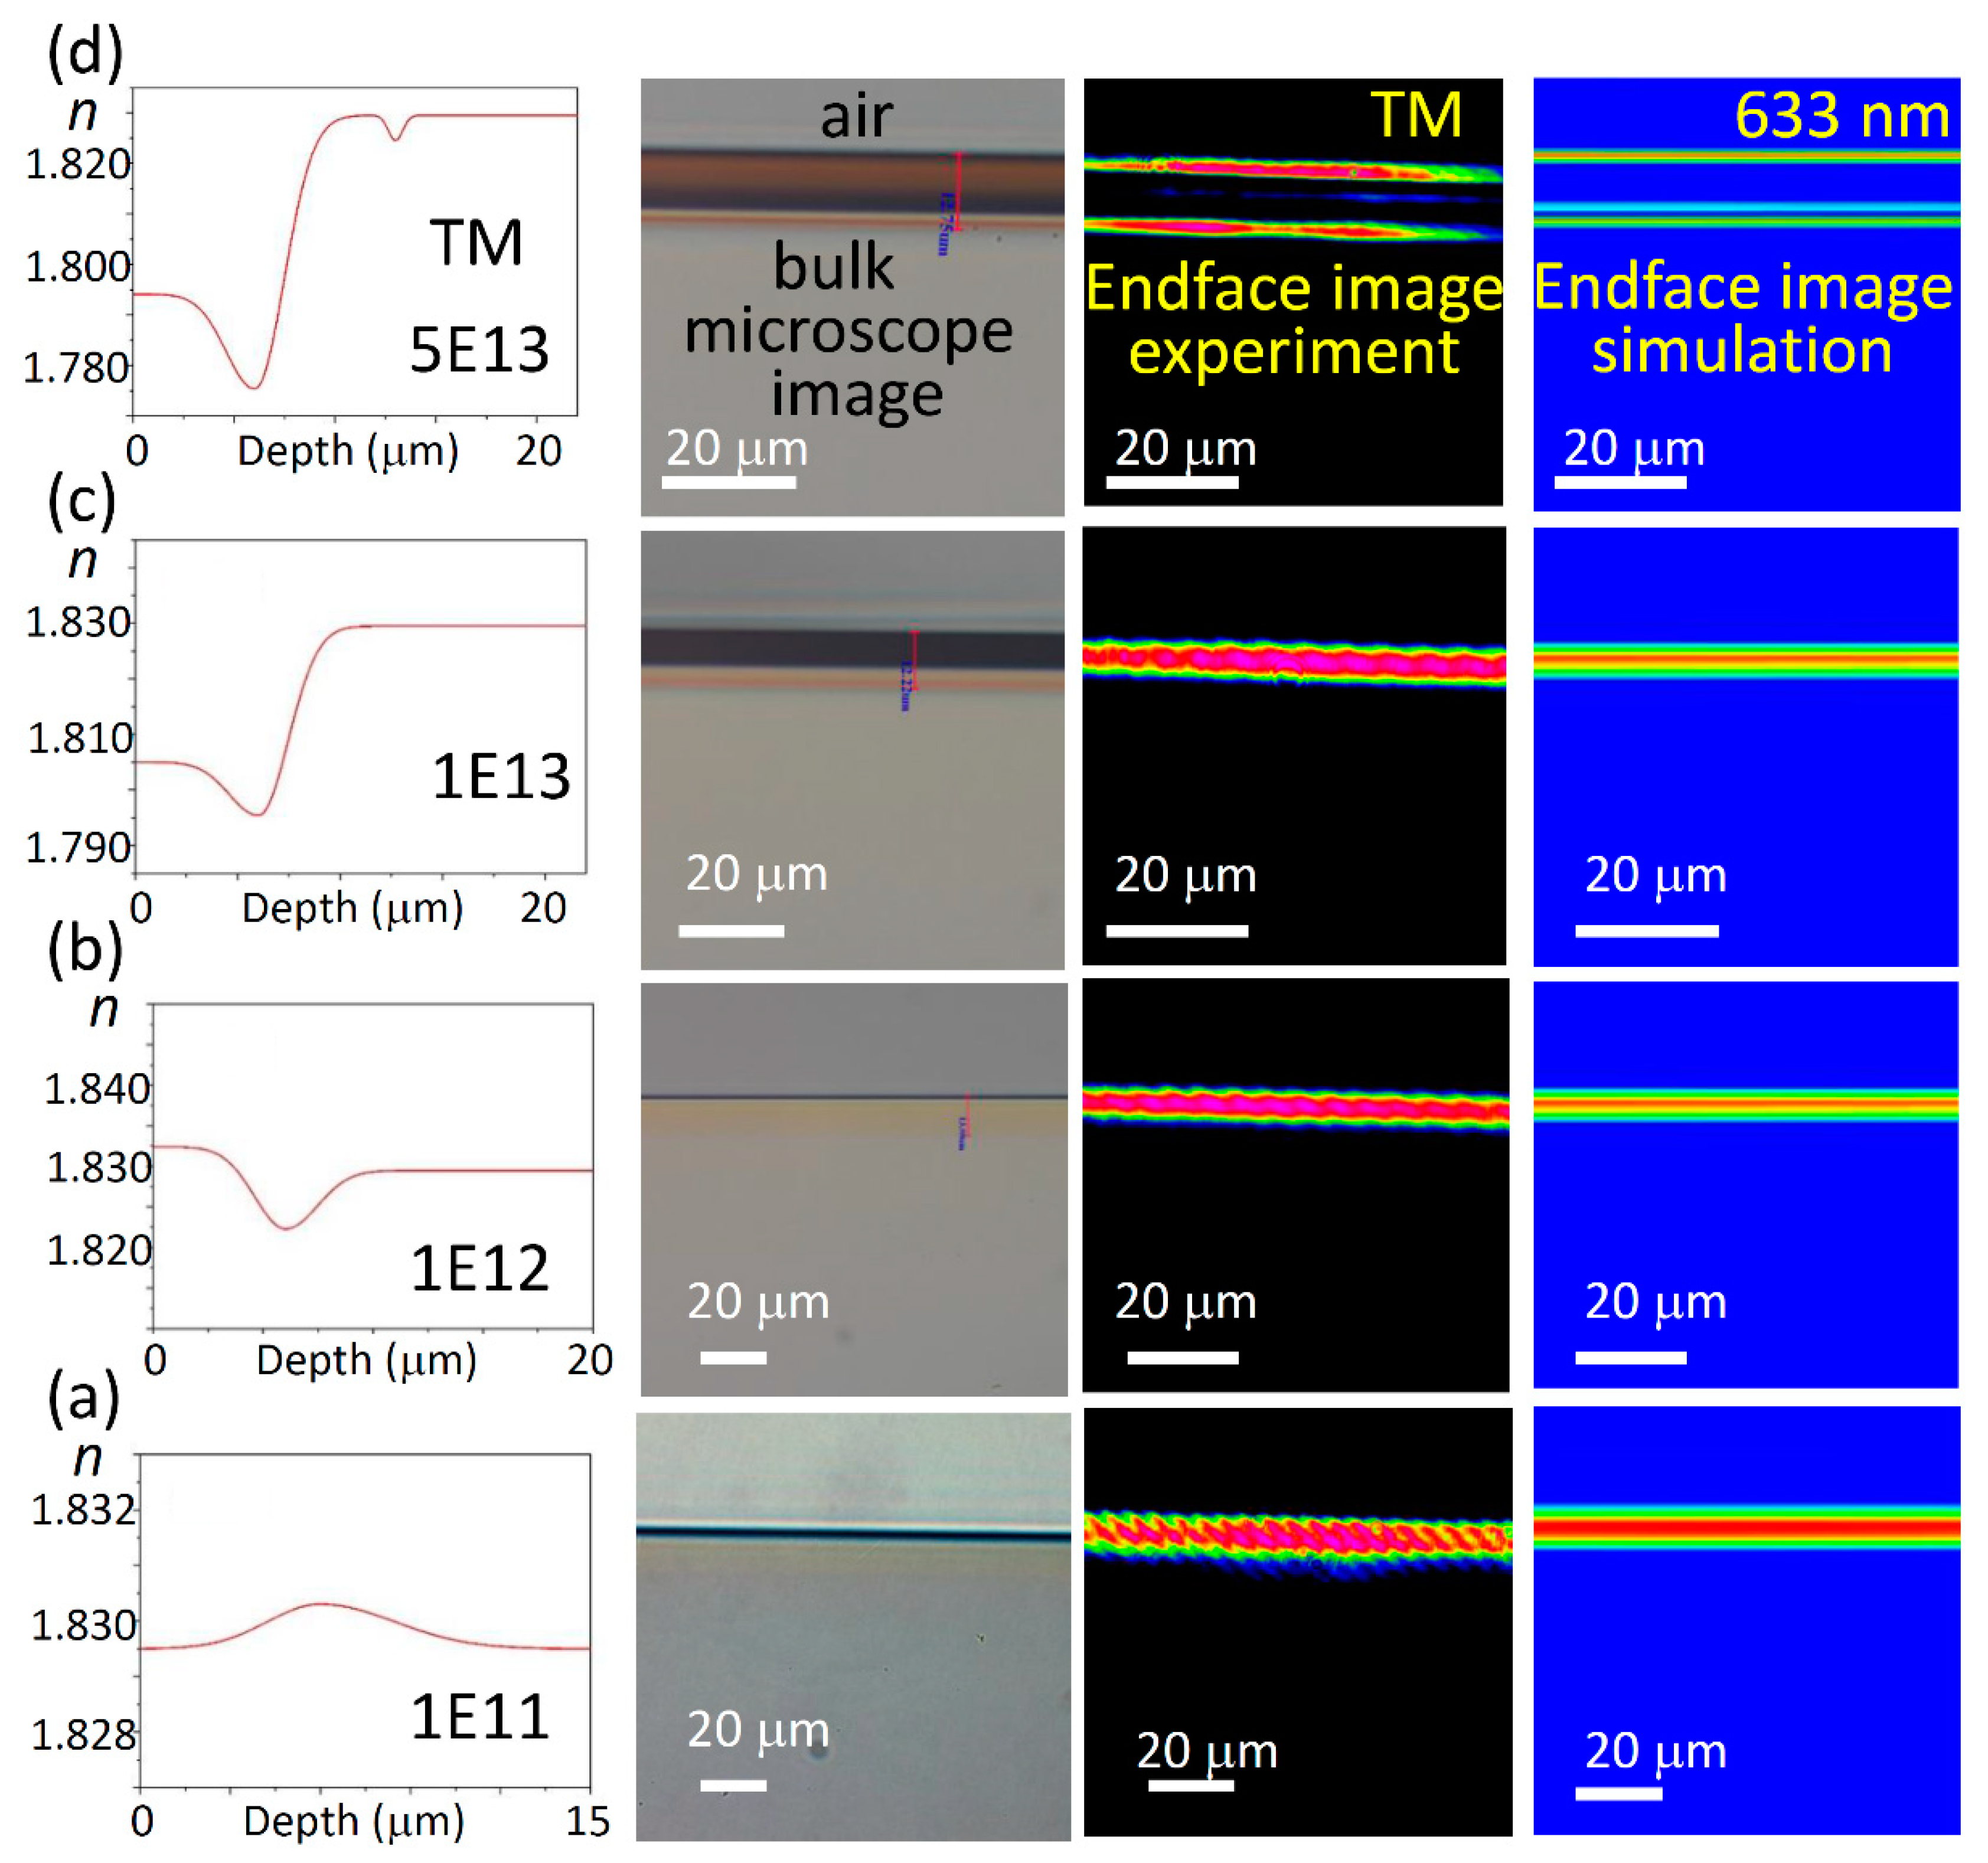
Figure 6 shows four different images (i)–(iv) at four different fluences (1 × 10¹¹, 1 × 10¹², 1 × 10¹³, and 5 × 10¹³ ions/cm2). From left to right, (i) the experimental index depth profiles used for the end-surface intensity calculations, which are the same as shown in Figure 5, (ii) the optical microscopy images of the end-surface without the guided light, (iii) experimental, and (iv) calculated results of the spatial distributions of the guided light intensity at the end-surfaces. In the optical images of the end-surfaces without the guided light (ii), the near surface regions exhibit different color compared with the bulk parts, which are ascribed to the different indices induced by the ion irradiation. Color changes are stronger for higher ion fluences.
As shown in Figure 6a, the wave guiding is induced even at the lowest fluence of 1 × 10¹¹ ions/cm2, since the guided light is buried beneath the surface. The irradiation made index enhancement of 0.001 around the depth of 6 μm as shown in Figure 5. Even though the very small change in the index, the wave guiding was confirmed from the experimental emission image at the end-surface. Furthermore, the calculation shows that the observed index profile predicted the same emission image from the small change of the index profile.
The peak at 6 μm reduced the height at the fluence of 3 × 10¹¹ ions/cm2. At 1 × 10¹² ions/cm2, the peak further decreased and turned to a dip. Simultaneously, the index at the surface region (0–3 μm in depth) became slightly higher than the unirradiated value. However, the index at the surface region turned to decrease and became lower than the unirradiated value at 3 × 10¹² ions/cm2. Likewise, the bottom value at the dip at 6 μm further decreased. Since the index at the surface region steeply decreased at 1 × 10¹³ ions/cm2, the low index region near the surface and the 6 μm dip were almost merged. The WG function of SHI-irradiated YAG crystals is also confirmed at 1 × 10¹² and 1 × 10¹³ ions/cm2, as shown in Figure 6b,c. The spatial images of the guided light at the end-surface by experiments are well matched with those calculated from the index profiles. Similarly, the microscopy images show further color changes due to the further index changes.
At the fluence of 5 × 10¹³ ions/cm2, the index further decreased. Moreover, a new dip appeared at 13 μm in depth, which could be ascribed to the collisional damage, because the depth of the dip well matches with the peak of the nuclear energy loss Sn. As shown in Figure 6d, the index profile of the sample irradiated with 5 × 10¹³ ions/cm2 exhibits interesting waveguiding different from other fluences. Two WG modes are propagated in shallow and deep layers, which were, respectively, formed by the electronic and the nuclear damages. The two-branch guiding at the end-surface was also confirmed by the calculations. The calculated emission image is very similar with the experimental one.
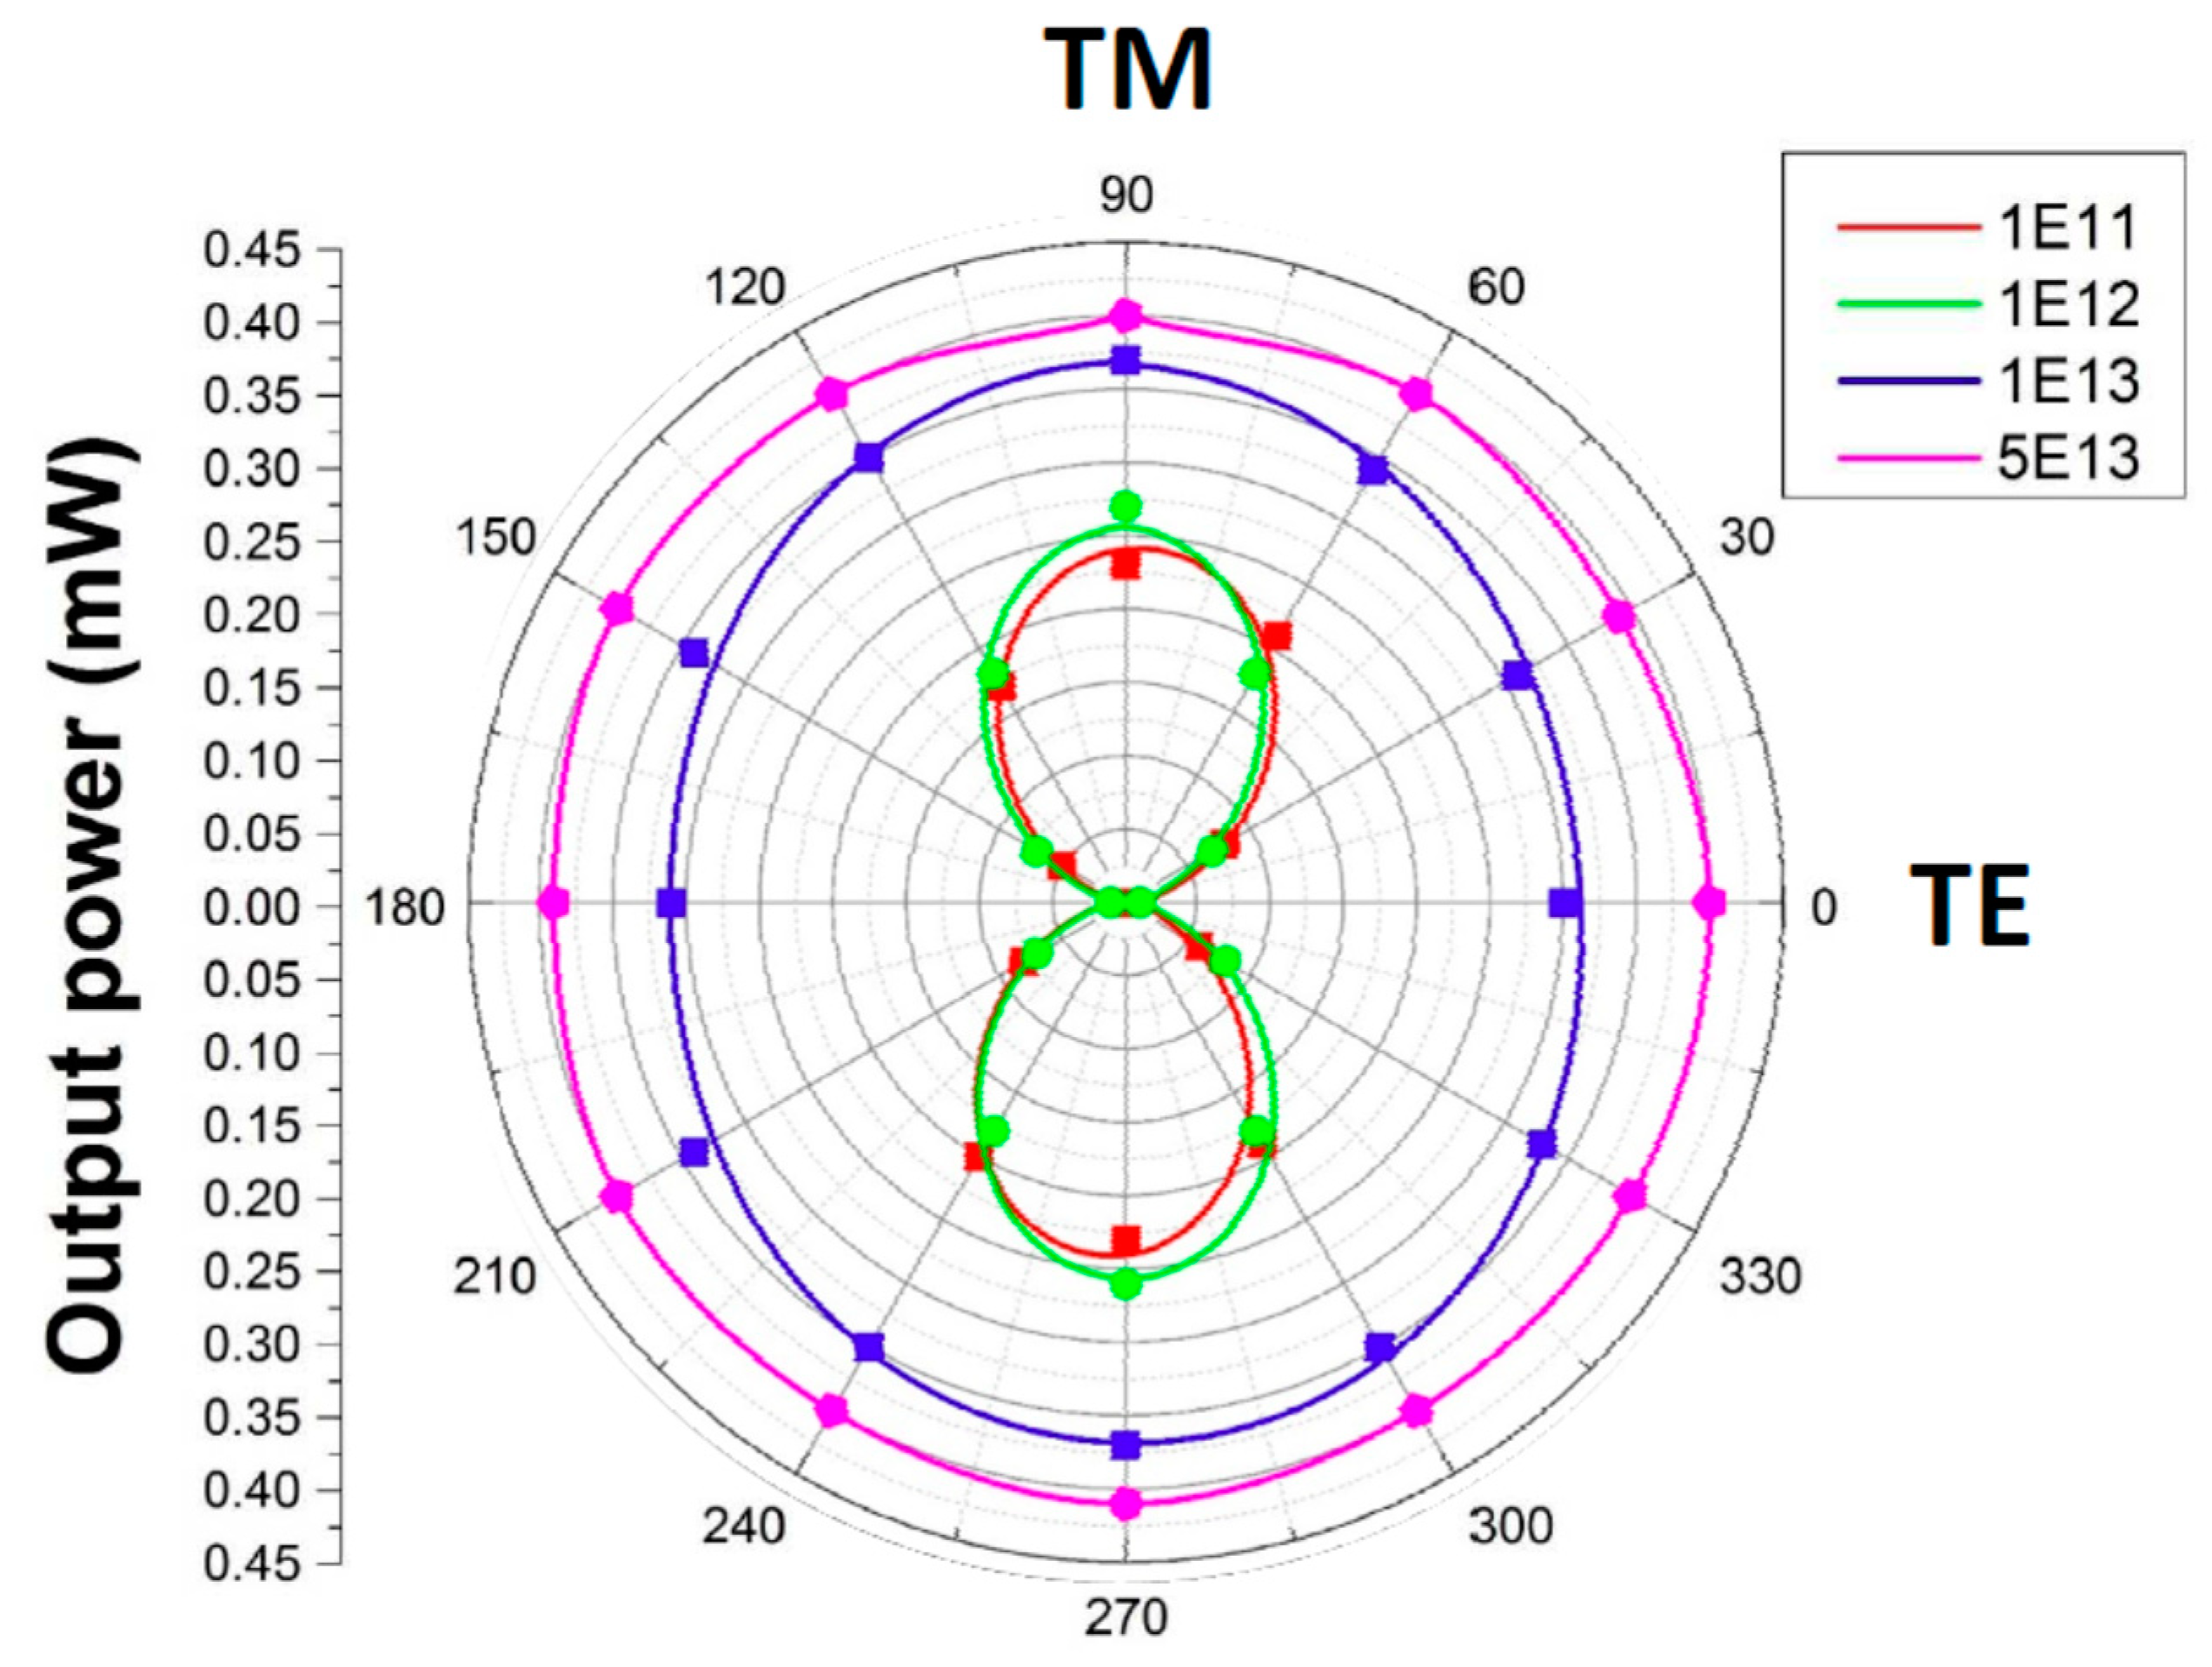
Figure 7 shows the incident polarization dependence of the output power at the end-surface of the WGs. These data were collected with rotating a half-wave plate in the end-face coupling schematically shown in Figure 3c. The low fluence samples (1 × 10¹¹ and 1 × 10¹² ions/cm2) show the “8”-shaped (i.e., dipole-shaped) polarization angle dependence. While the strongest power was observed for the TM polarization, little signal (no WG modes) was observed for the TE polarization. Contrary, the high fluence samples (1 × 10¹³ and 5 × 10¹³ ions/cm2) exhibit nearly isotropic angle dependences, i.e., the output power almost does not depend on the polarization angle. At the moment, the mechanism has not been clarified yet. It should be noted that Figure 4 showed that the low fluence samples (1 × 10¹¹ and 1 × 10¹² ions/cm2) are cubic symmetry crystals but the high fluence samples (1 × 10¹³ and 5 × 10¹³ ions/cm2) are amorphous. Amorphization could be an origin of the change of the polarization angle dependence. However, the detailed mechanism is under investigation.
4. Discussion
As shown in Figure 5, the index dip at 13 μm in depth was only observed at the high fluence of 5 × 10¹³ ions/cm2 and higher fluence (not shown in this paper) by end-face coupling, which well matches at the peak of the nuclear energy loss Sn. Consequently, the index reduction at 13 μm in depth is ascribed to the damage induced by the nuclear energy loss. Since Sn is much lower than Se, the dip appeared only at high fluences. The existence of this mode is clearly evidenced by the deep WG mode shown in Figure 6d.
The index reduction in the surface plateau region between 0 and ~3 μm can be ascribed to the electronic energy loss Se, which has the highest at the surface. Consequently, both Se and Sn contribute the index reduction. However, the origin of the dip/peak at 6 μm in depth is not clear. Neither of Se nor Sn has a peak around 6 μm. Rather, Se decreases and Sn increases around 6 μm.
It is known that amorphous ion tracks are formed in YAG crystals. The amorphization was confirmed by XRD as shown in Figure 4. The track threshold is reported as 7.5 keV/nm. The Se of 200 MeV Xe ions in YAG crystal calculated by SRIM 2013 amounts to 24.3 keV/nm at the surface. With increasing the depth, the Se gradually decreases with making a track. The Se finally becomes below the threshold value of 7.5 keV/nm [13] and stops forming the tracks around the depth of ~10 μm. The threshold value of 7.5 keV/nm is indicated by a broken line in Figure 5. Deeper than the depth of ~10 μm, tracks are no longer formed. As shown in Figure 5, no index changes are induced in the region deeper than ~10 μm, except the dip at 13 μm. This is another evidence that the dip at 13 μm is not due to Se but Sn.
Consequently, the index reductions at the surface plateau region and the dip at 13 μm can be described to the electronic and nuclear energy losses, because either of them matches with the maximum depths of Se and Sn, respectively. However, the origin of the dip/peak at 6 μm is not clear. Neither of Se nor Sn has a peak around 6 μm. Since the enhancement of the index was firstly observed, the irradiation introduces density increase around 6 μm depth. The density enhancement soon turns to the density reduction probably introduction of defects. Further the index at 6 μm decreases combined with the reduction in the surface plateau. Since the 6 μm peak matches neither of the peaks of Se and Sn, a possible candidate could be the synergy effects between Se and Sn. Since the synergy effects are not included in SRIM code, the deviation at 6 μm between the index profiles and SRIM calculations is a matter of course.
The refractive index profiling is a relatively new method to study the irradiation effects of SHIs, which is sensitive to defect formation and/or stress (strain) generation, and detectable the depth profiles at any fluences. Figure 5 clearly shows complex evolutions of the index, i.e., the defect formation and/or the stress generation, along the fluence. At the fluence of 1 × 10¹¹ ions/cm2, a weak index enhancement, i.e., compressive stress, is generated around 6 μm in depth due to the synergy effect. At 1 × 10¹² ions/cm2, the index turns to decrease, i.e., the compressive stress turns to the defect formation. At the same fluence, the index enhancement, i.e., the compressive stress is induced at 0–3 μm by Se, but turns to decrease at higher fluences, i.e., the defect formation. At 5 × 10¹³ ions/cm2, Sn also contributes the index change via the defect formation. This kind of complex evolutions are only accessible by the index profiling.
5. Conclusions
The evolution of the depth profiles with the fluence of the refractive index in YAG crystals were studied under 200 MeV 136Xe14+ ion irradiation by the prism-coupling and the end-face coupling methods, in which various WG modes were detected. The index depth profiles were determined so that the observed WG modes were reproduced. Since the index can be changed with the damage and/or the stress change induced by the irradiation, the index depth profiles provide the depth profiles of damage and/or stress changes induced by ion irradiation and the evolutions with the ion fluence.
At the lowest fluence of 1 × 10¹¹ ions/cm2, a weak index enhancement was induced at the depth of 6 μm, which does not match either of Se maximum nor Sn maximum. With increasing the fluence, the peak turns to decrease. At 1 × 10¹² ions/cm2, the index enhancement is induced at the index plateau near the surface. The enhancement soon turned to decrease with the fluence. Then both the surface plateau and the 6 μm dip reduce the index with the fluence. At the highest fluence of 5 × 10¹³ ions/cm2, a new dip appeared at the depth of 13 μm, which matched to the peak of Sn.
Index changes were perceived at three different depth regions; (i) a sharp dip at 13 μm in depth, which is ascribed to the nuclear stopping Sn peak, (ii) a plateau near the surface at 0–3 μm, which can be ascribed to the electronic stopping Se, since Se has a very broad peak at the surface, and (iii) a broad peak at 6 μm in depth. Since the last peak is ascribed to neither of Se nor Sn peak, it could be attributed to the synergy effect of Se and Sn.
Author Contributions
Conceptualization, XRD measurements, Manuscript writing, H.A.; Sample preparation, F.C.; SHI irradiation, N.O. and N.I.; Refractive index measurements, R.L. and F.C. All authors have read and agreed to the published version of the manuscript.
Funding
This study was supported by JSPS-KAKENHI Grant Number 18K04898.
Acknowledgments
A part of the study was supported by the Inter-organizational Atomic Energy Research Program through an academic collaborative agreement among JAEA, QST, and the Univ. of Tokyo. Also the other part was carried out under the Common-Use Facility Program of JAEA. The authors are grateful to the staff of the accelerator facility at JAEA-Tokai for their help. The authors thank China Scholarship Council for supporting RL to stay for one year in NIMS, Japan.
Conflicts of Interest
The authors declare no conflict of interest.
References
- Nishihara, H.; Haruna, M.; Suhara, T. Optical Integrated Circuits; McGraw-Hill: New York, NY, USA, 1989. [Google Scholar]
- Field, S.J.; Hanna, D.C.; Large, A.C.; Shepherd, D.P.; Tropper, A.C.; Chandler, P.J.; Townsend, P.D.; Zhang, L. An efficient, diode-pumped, ion-implanted Nd: GGG planar waveguide laser. Opt. Commun. 1991, 86, 161. [Google Scholar] [CrossRef] [Green Version]
- Townsend, P.D.; Chandler, P.J.; Zhang, L. Optical Effects of Ion Implantation; Cambridge University Press: Cambridge, UK, 1994. [Google Scholar]
- Fluck, D.; Binder, B.; Küpfer, M.; Looser, H.; Buchal, C.; Günter, P. Phase-matched second harmonic blue light generation in ion implanted KNbO3 planar waveguides with 29% conversion efficiency. Optics Commun. 1992, 90, 304. [Google Scholar] [CrossRef]
- Youden, K.E.; James, S.W.J.; Eason, R.W.; Chandler, P.J.; Zhang, L.; Townsend, P.D. Photorefractive planar waveguides in BaTiO3 fabricated by ion-beam implantation. Opt. Lett. 1992, 17, 1509. [Google Scholar] [CrossRef] [PubMed] [Green Version]
- Townsend, P.D. Ion implantation in optical materials. Inst. Phys. Conf. Ser. 1976, 28, 104. [Google Scholar]
- Chen, F. Micro- and submicrometric waveguiding structures in optical crystals produced by ion beams for photonic applications. Laser Photonics Rev. 2012, 6, 622. [Google Scholar] [CrossRef]
- Devine, R.A.B. Ion Implantation-Induced and Radiation-Induced Structural Modifications in Amorphous SiO2. J. Non-Cryst. Solids 1993, 152, 50. [Google Scholar] [CrossRef]
- Olivares, J.; García-Navarro, A.; Méndez, A.; Agulló-López, F.; García, G.; García-Cabañes, A.; Carrascosa, M. Novel optical waveguides by in-depth controlled electronic damage with swift ions. Nuclear Instrum. Methods Phys. Res. Sect. B Beam Interact. Mater. Atoms 2007, 257, 765. [Google Scholar] [CrossRef]
- Rodriguez, M.D.; Li, W.X.; Chen, F.; Trautmann, C.; Bierschenk, T.; Afra, B.; Schauries, D.; Ewing, R.C.; Mudie, S.T.; Kluth, P. SAXS and TEM investigation of ion tracks in neodymium-doped yttrium aluminium garnet. Nuclear Instrum. Methods Phys. Res. Sect. B Beam Interact. Mater. Atoms 2014, 326, 150. [Google Scholar] [CrossRef]
- Amekura, H.; Akhmadaliev, S.; Zhou, S.; Chen, F. A possible new origin of long absorption tail in Nd-doped yttrium aluminum garnet induced by 15 MeV gold-ion irradiation and heat treatment. J. Appl. Phys. 2016, 119, 173104. [Google Scholar] [CrossRef]
- Ziegler, J.F.; Biersack, J.P.; Ziegler, M.D. SRIM—The Stopping and Range of Ions in Matter; SRIM Co.: Chester, MD, USA, 2008. [Google Scholar]
- Itoh, N.; Duffy, D.M.; Khakshouri, S.; Stoneham, A.M. Making tracks: Electronic excitation roles in forming swift heavy ion tracks. J. Phys. Condens. Matter 2009, 21, 474205. [Google Scholar] [CrossRef] [PubMed] [Green Version]
- Ovanesyan, K.L.; Petrosyan, A.G.; Shirinyan, G.O.; Avetisyan, A.A. Optical dispersion and thermal expansion of garnets Lu3Al5O12, Er3Al5O12, and Y3Al5O12. Inorg. Mater. 1981, 17, 308. [Google Scholar]
- Meftah, A.; Djebara, M.; Khalfaoui, N.; Stoquert, J.P.; Studer, F.; Toulemonde, M. Thermal Spike Description of the Damage Creation in Y3Al5O12 Induced by Swift Heavy Ions. Mater. Sci. Forum (Proc. of ICDS-18) 1997, 53, 248–249. [Google Scholar]
- Zelmon, D.E.; Small, D.L.; Page, R. Refractive-index measurements of undoped yttrium aluminum garnet from 0.4 to 5.0 μm. Appl. Opt. 1998, 37, 4933. [Google Scholar] [CrossRef] [PubMed]
Figure 1.
Schematically depicted cross-section of a slab waveguide consisting two layers: An upper layer with higher refractive index and lower one with lower index. Air (or vacuum) on the upper layer acts as a cladding layer. At light-propagating angles at discrete values, the total reflections are induced at the boundaries between air and the layer 1 and between layers 1 and 2. Consequently light in the layer 1 is confined inside of the layer 1 and guided along the inside of the layer.

Figure 2.
Schematically depicted depth profiles of damage induced by a few MeV light ions. The refractive index is reduced around the depth of the Bragg peak due to strong damage, while the index in shallower region seldom changes. Consequently, a slab-type waveguide is formed only by the irradiation of a few MeV light ions.

Figure 3.
(a) a setup for detection of waveguide modes using prism coupling and the dark-mode detection. See text for details. (b) a typical data of the dark-mode detection from YAG sample irradiated with 200 MeV Xe ions in the TE mode. Each dip corresponds to a waveguides (WG) modes. (c) a setup of the end-face coupling. The polarization of the laser is controlled by a half-wave plate.


Figure 4.
FIA-XRD patterns of undoped YAG samples in unirradiated state and irradiated with 200 MeV Xe14+ ions to various fluences ranging from 1 × 10¹¹ to 5 × 10¹³ ions/cm2. The patterns are shifted for vertical direction for clarity.
Figure 4.
FIA-XRD patterns of undoped YAG samples in unirradiated state and irradiated with 200 MeV Xe14+ ions to various fluences ranging from 1 × 10¹¹ to 5 × 10¹³ ions/cm2. The patterns are shifted for vertical direction for clarity.

Figure 5.
Depth profiles of refractive indices of YAG irradiated with 200 MeV Xe14+ ions to various fluences ranging from 1 × 10¹¹ ions/cm2 to 5 × 10¹³ ions/cm2, determined by the prism coupling and the end-face coupling method. All the polarizations are in the transverse magnetic (TM) configuration. A chained horizontal line indicates the index in the unirradiated state of 1.8295 at the wavelength of 632.8 nm from literature. Since the deviation from the unirradiated value was so small for the data of 1 × 10¹¹ and 3 × 10¹¹ ions/cm2, the deviations were 5 times multiplied and added to the unirradiated value. For references, the depth profiles of electronic and nuclear stopping powers Se and Sn are plotted with the right axis in the units of keV/nm. A horizontal broken line denotes the threshold Se value for the track formation in YAG.

Figure 6.
(Left to right) Index profiles used for the calculations of the intensity profile at the end-surfaces; optical microscopy images at the end-surface without wave guiding laser; experimental spatial intensity profiles of the wave guiding laser at the end-surface; and corresponding calculation results, for four different ion fluences (a) 1 × 10¹¹, (b) 1 × 10¹², (c) 1 × 10¹³, and (d) 5 × 10¹³ ions/cm2. The spatial intensity profiles were calculated by the beam propagation method (BPM) using BeamPROP code.

Figure 7.
The total output power of the waveguide through the end-surface was plotted with changing the polarization angle of the incident laser. The incident laser power was set to 1.8 mW. The samples were irradiated with 200 MeV Xe14+ ions at four different fluences; 1 × 10¹¹, 1 × 10¹², 1 × 10¹³, and 5 × 10¹³ ions/cm2.


Table 1.
Electronic and nuclear stopping powers (at the surface), and the projected range of 200 MeV 136Xe14+. ions in yttrium-aluminum-garnet (YAG) crystal, calculated by SRIM 2013. The track formation threshold and the X-ray penetration depth of the Cr Kα line used for fixed incident angle X-ray diffractometry (FIA-XRD) are also shown.
| 200 MeV 136Xe14+ => Undoped YAG | |
|---|---|
| Electronic stopping power (keV/nm) | 24.3 |
| Track formation threshold (keV/nm) | 7.5 |
| Nuclear stopping power (keV/nm) | 0.091 |
| Projected Range (µm) | 13.2 |
| X-ray penetration used for FIA-XRD measurements at 15 incidence (µm) | 2.76 |
Table 2.
The displacement energies, the bulk binding energies, and the surface binding energies of Y, Al, and O atoms in YAG crystal, used for the SRIM 2013 calculations.
Table 2.
The displacement energies, the bulk binding energies, and the surface binding energies of Y, Al, and O atoms in YAG crystal, used for the SRIM 2013 calculations.
| Element | Y | Al | O |
|---|---|---|---|
| Displacement energy (eV) | 25 | 25 | 28 |
| Bulk binding energy (eV) | 3 | 3 | 3 |
| Surface binding energy (eV) | 4.24 | 3.36 | 3 |
Publisher’s Note: MDPI stays neutral with regard to jurisdictional claims in published maps and institutional affiliations. |
© 2020 by the authors. Licensee MDPI, Basel, Switzerland. This article is an open access article distributed under the terms and conditions of the Creative Commons Attribution (CC BY) license (http://creativecommons.org/licenses/by/4.0/).
Share and Cite
MDPI and ACS Style
Amekura, H.; Li, R.; Okubo, N.; Ishikawa, N.; Chen, F. Irradiation Effects of Swift Heavy Ions Detected by Refractive Index Depth Profiling. Quantum Beam Sci. 2020, 4, 39. https://0-doi-org.brum.beds.ac.uk/10.3390/qubs4040039
AMA Style
Amekura H, Li R, Okubo N, Ishikawa N, Chen F. Irradiation Effects of Swift Heavy Ions Detected by Refractive Index Depth Profiling. Quantum Beam Science. 2020; 4(4):39. https://0-doi-org.brum.beds.ac.uk/10.3390/qubs4040039
Chicago/Turabian StyleAmekura, Hiroshi, Rang Li, Nariaki Okubo, Norito Ishikawa, and Feng Chen. 2020. "Irradiation Effects of Swift Heavy Ions Detected by Refractive Index Depth Profiling" Quantum Beam Science 4, no. 4: 39. https://0-doi-org.brum.beds.ac.uk/10.3390/qubs4040039