
Multiple Wavelengths Texture Measurement Using Angle Dispersive Neutron Diffraction at WOMBAT


1
Materials Sciences Research Center, Japan Atomic Energy Agency, Ibaraki 319-1195, Japan
2
Guangdong Technion - Israel Institute of Technology, 241 Daxue Lu, Shantou 515603, China
3
Technion - Israel Institute of Technology, Haifa 32000, Israel
4
Australian Nuclear Science and Technology Organisation, Lucas Heights, Sydney, NSW 2234, Australia
5
School of Mechanical, Materials, Mechatronic and Biomedical Engineering, Northfields Avenue, University of Wollongong, Wollongong, NSW 2522, Australia
*
Author to whom correspondence should be addressed.
Quantum Beam Sci. 2021, 5(2), 11; https://0-doi-org.brum.beds.ac.uk/10.3390/qubs5020011
Submission received: 30 March 2021
/
Revised: 25 April 2021
/
Accepted: 26 April 2021
/
Published: 30 April 2021
(This article belongs to the Special Issue Analysis of Strain, Stress and Texture with Quantum Beams)
Abstract
:In contrast to conventional angle dispersive neutron diffractometers with a single-tube detector or a small-size linear position-sensitive detector, the WOMBAT diffractometer of the Australian Nuclear Science and Technology Organisation (ANSTO) is equipped with a large-area curved position-sensitive detector, spanning 120° for the scattering angle 2θ and 15° for the azimuth η, respectively. Here, WOMBAT was employed in establishing a texture measurement environment for complex textured samples, through measuring neutron diffractograms at two selected wavelengths on a typical reference sample of martensite–austenite multilayered steel sheet. All neutron patterns were simultaneously Rietveld analyzed using the software, Materials Analysis Using Diffraction (MAUD). The shorter wavelength (λ1 = 1.54 Å, k1 = 4.08 Å−1) enabled collecting the martensite reflections α-110, α-200, α-211, α-220, α-310, and α-222, as well as the austenite peaks γ-111, γ-200, γ-220, γ-311, γ-222, and γ-331 simultaneously, by pre-setting the detector range to 2Θ = 30~150°. The longer wavelength (λ2 = 2.41 Å, k2 = 2.61 Å−1) enabled separating the overlapping strong martensite α-110 and austenite γ-111 Laue–Bragg interferences more reliably. Moreover, the detector panel division along the vertical direction has a good stereographic coverage in the azimuthal angle η,. Such a combination of multiple-wavelength neutron diffraction combined with simultaneous Rietveld texture analysis was confirmed as being very valuable for realizing high precision measurements for complex textured samples at an orientation distribution graticule of 5°, and in a much shorter beam time than the conventional angle dispersive method.
1. Introduction
Texture is the orientation distribution of the crystallites in a polycrystalline material, whether they are metallic, mineral, ceramic, polymeric, geologic, or even biological [1]. The main motivations for studying texture are: (i) because texture influences almost all macroscopic properties of a material that is crystallographic anisotropic; and (ii) because textures are formed or modified by all kinds of orientation-dependent physical or mechanical processes that have taken place during the material manufacturing and preparation process [1]. Although X-ray diffraction and electron backscatter diffraction are usually used for texture evaluation, neutron diffraction can directly measure the bulk textures of a wide range of polycrystalline materials without any polishing or other treatment of the sample surface. The first texture observations with neutrons go back to their early days, as far as Brockhouse’s doctoral thesis at the NRX reactor in Chalk River [2,3]. Owing to the high penetration into materials and large beam size, it provides a high statistical accuracy in textural information, even in coarse-grained materials, for predicting the material’s anisotropic properties [4,5,6,7] and it also helps to clarify the in situ microstructural evolution under various loading [8,9] temperature [10,11,12], and magnetic environments [13].
In fact, the problem of texture measurement is a three-dimensional reciprocal-space mapping, with radial direction Q, the momentum transfer, and two independent azimuthal orientations or solid angle Ω. Crystallography discretizes radially: Q = Ghkl, where G is the modulus of a reciprocal lattice vector with Miller indices h, k, l, while its orientation is given by an element of Ω. In the extreme case of a single crystal, this mapping results in a three-dimensional reciprocal lattice, which is arbitrarily oriented, and from which three Eulerian orientation angles (ϕ1, φ, ϕ2) can be extracted. The orientations between the given of various h, k, l are fixed by crystallography. In a poly-crystalline material, the discrete smear out azimuthally onto Debye–Scherrer distributions, whose sections can be easily pictured by two-dimensional synchrotron high-energy X-ray diffraction [14] and selected area electron diffraction, due to their small scattering angles. In conventional X-ray and neutron diffraction, mappings through the concentric Debye–Scherrer orientation spheres are more complex and less evident, traditionally leading to an independent and sequential measurement of those spheres, mapped onto pole figures. The accompanying mathematical problem is pole figure inversion, by mapping reciprocal space distribution onto an orientation distribution function, describing the probability of finding crystallites in any given orientation, which map the vector space ℝ3 → ℝ3 [15]. For this purpose, a certain number of sampling points in 3D reciprocal space have to be measured to realize a good pole figure coverage for a specific reflection, and a reasonable combination between radial and azimuthal sampling in contemporary multi-dimensional machines for collecting other plane orientations for crystallographic redundancy. Those full-pattern samplings can then be analyzed in modern Rietveld fitting software, such as Materials Analysis Using Diffraction (MAUD) [16]. Historically, texture analysis, including measurement and theory, has been gradually established from the bottom up [17,18] while the mathematics has been rounded out in a larger context only in the last decade [19,20].
According to the different characteristics of neutron sources, the diffractometers are generally divided into the nuclear-reactor based angle-dispersive instruments [8,21] and the proton accelerator-based spallation time-of-flight instruments [8,22], enabling the development of complementary texture evaluation techniques. For angle dispersive neutron diffraction, single tube (0D) detectors [23,24], and small-size [23,25] and large-size [26,27] linear position-sensitive (1D) detectors, are conventionally employed to collect pole figure intensities using individual or non-overlapping peaks, while large-size two-dimensional (2D) position-sensitive detectors at KOWARI [28] and STRESS-SPEC [29] are employed to extract the pole figure intensities of several neighboring diffraction peaks. Moreover, the spallation-source based time-of-flight diffractometers, covering large position-discriminated solid angle coverage, truly probe reciprocal space in three dimensions (3D) by recording a full diffractogram in the radial Q-direction at each detector pixel [30,31]. The measurement reliability of the latter has been examined by Xu et al. [32] on two time-of-flight neutron diffractometers, namely iMATERIA, equipped with multiple large detector banks, and TAKUMI, featuring two detector banks at 2Θ = ±90° at J-PARC [22]. Recently, the RIKEN accelerator-driven compact neutron source (RANS) has been employed to establish a reliable time-of-flight texture measurement technique using three orders of magnitude weaker neutron beams than those at spallation sources [33]. These results confirmed that proper improvement of stereographic resolution through dividing the active regions of neutron detector banks is valuable for realizing a high reliability of texture evaluation, while simultaneous multiple-sample-orientation time-of-flight measurements are effective for reducing the necessary number of sample rotations [31,32,33].
Furthermore, high intensity powder diffractometers with curved position sensitive detectors ranging over 120°, such as D19 and D20 at the Institut Laue Langevin (ILL) [13,34], have been employed to further improve the texture measurement efficiency and obtain usable crystal structure information for multiphase materials, large crystal unit cell materials, and low-symmetry materials, and for addressing the peak-overlapping problem [1,4,5,6]. Texture analysis has been established at the Open Pool Australian Lightwater reactor (OPAL) [35] with the WOMBAT neutron diffractometer [36], hosting a wide angle spanning curved 2D cylindrical detector and an improved capability for high-speed diffraction over the historic HIFAR instruments [37], because of the maximum neutron flux at about 108 vs. 105 n·s−1·cm−2, respectively. Consequently, WOMBAT is suitable for in situ real-time texture measurements through scanning necessary sample orientations. For example, field-induced crystallographic textures have been measured through simply integrating the 2D diffraction patterns in the azimuth direction at constant 2Θ angles [38].
Here we present a high-precision angle dispersive neutron diffraction texture measurement with a good balance between stereographic resolution and diffractogram collection efficiency, carried out at WOMBAT by using two different neutron wavelengths for coverage of momentum transfer and resolving peak overlap. Simultaneous Rietveld texture analysis was employed to evaluate the multiphase textures of a martensite–austenite multilayered steel composite. The obtained textures for each phase were examined by quantitative comparison with recalculated pole figures and orientation distribution functions obtained from other instruments, to examine the texture reliability for complex materials.
2. Experimental Procedures
2.1. Investigated Steel
A sheet of SUS301/SUS420J2 austenite–martensite multilayered steel [25] was employed here as the textured sample for reference. The chemical compositions were Fe-0.10C-0.66Si-0.97Mn-7.02Ni-17.02Cr in mass% (SUS301) and Fe-0.32C-0.79Si-0.60Mn-13.52Cr in mass% (SUS402J2), respectively. These steels were 90% multipass hot rolled followed by 50% cold rolling to get the 1 mm-thick steel sheets, followed by 1273 K rapid annealing for 120 s. Cube-shaped specimens of 10 × 10 × 10 mm3 were prepared from these steel sheets by spark cutting and stacking along the same rolling direction. Figure 1 displays the microstructure and the inverse pole figure mapping of the multilayered steel. As a reference, quarter pole figures of the austenite γ-111, γ-200, and γ-220 reflections and the martensite α-110, α-200, and α-211 reflections were measured on RESA-2, a conventional angle-dispersive neutron diffractometer with a position-sensitive detector spanning 6°, after an accurate orientation alignment and step-by-step orientation scanning of 5° × 5°. The neutron beam size was 20 × 20 mm2 to ensure the sample was completely bathed in the neutron beam [23].
2.2. Experimental Setup for Neutron Diffraction Texture Measurements
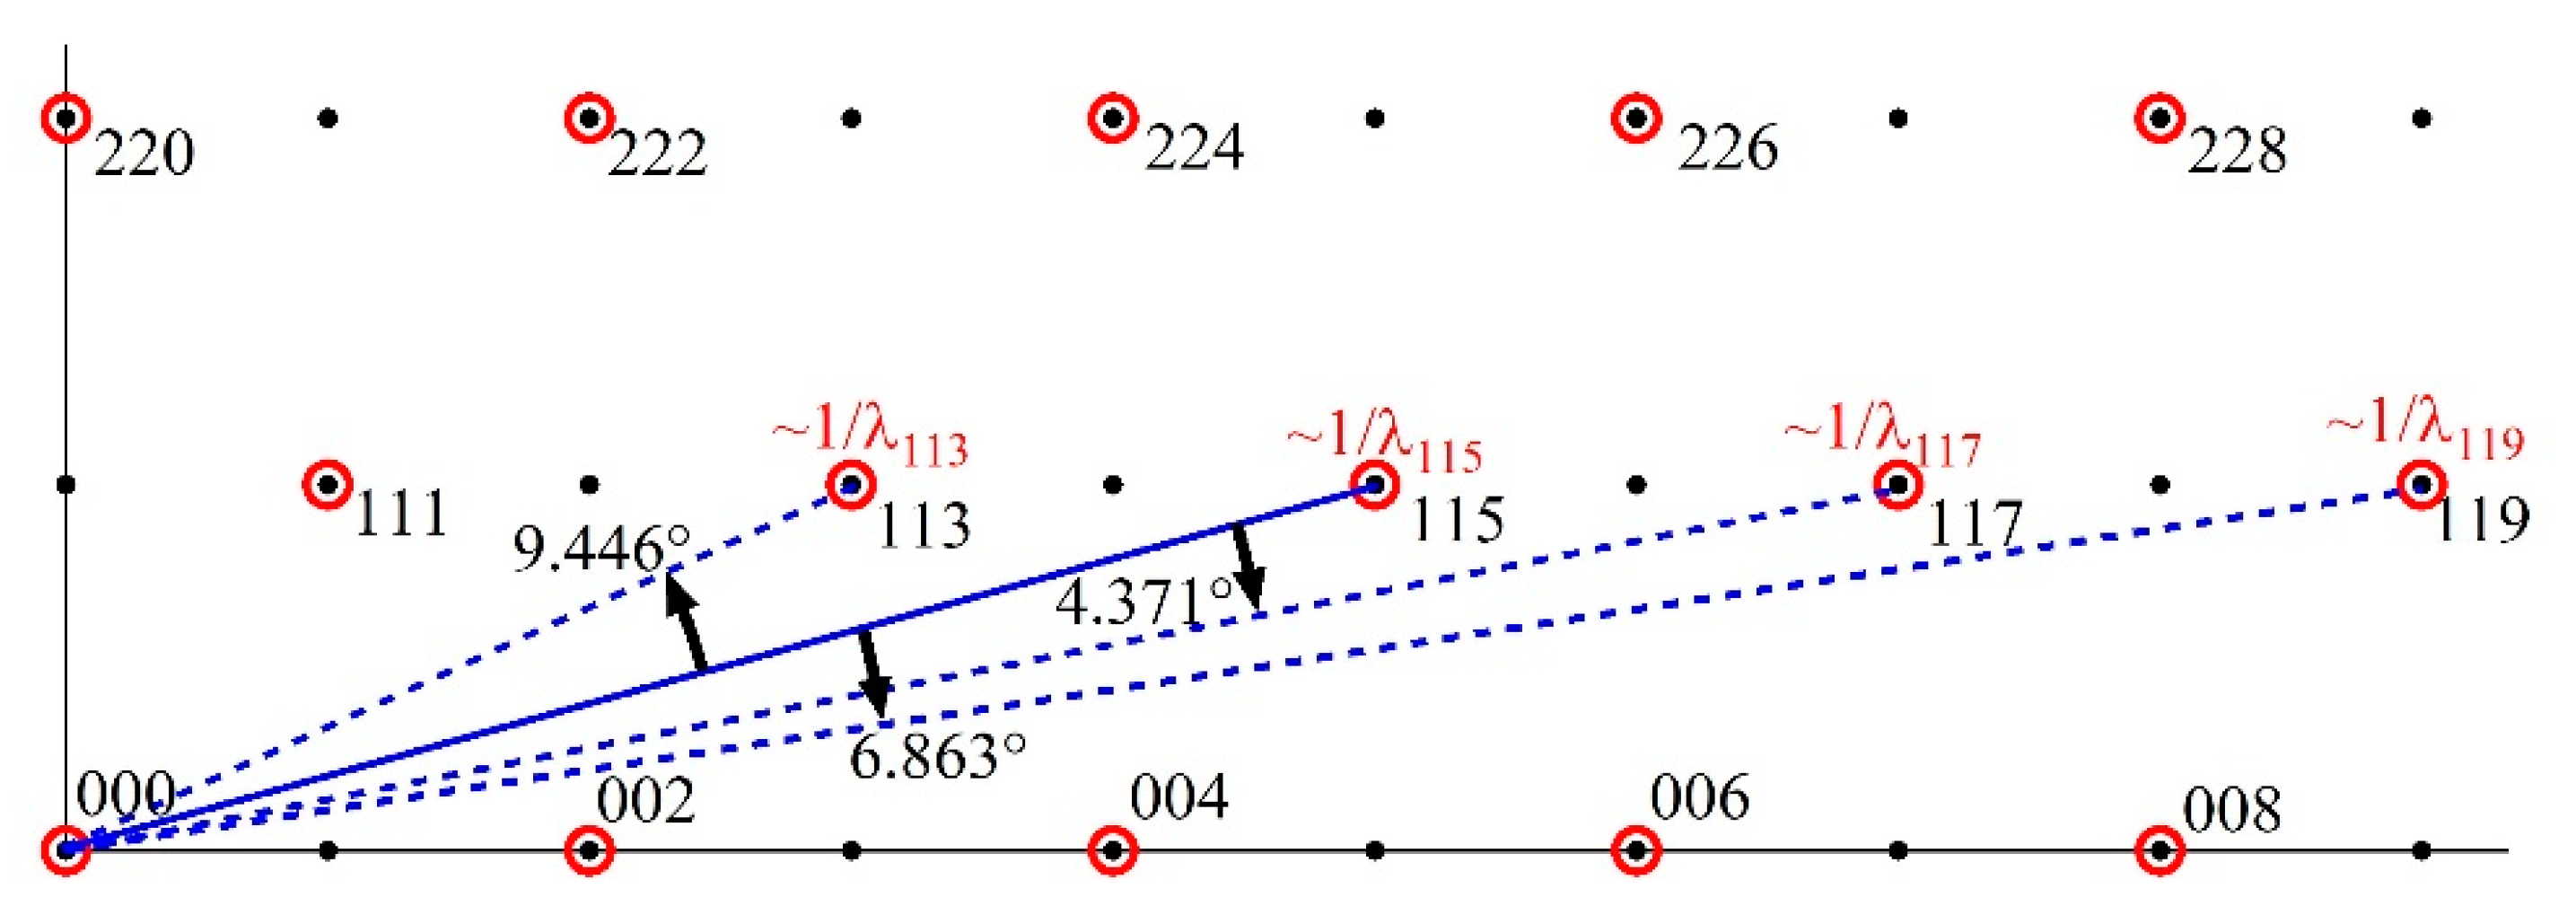
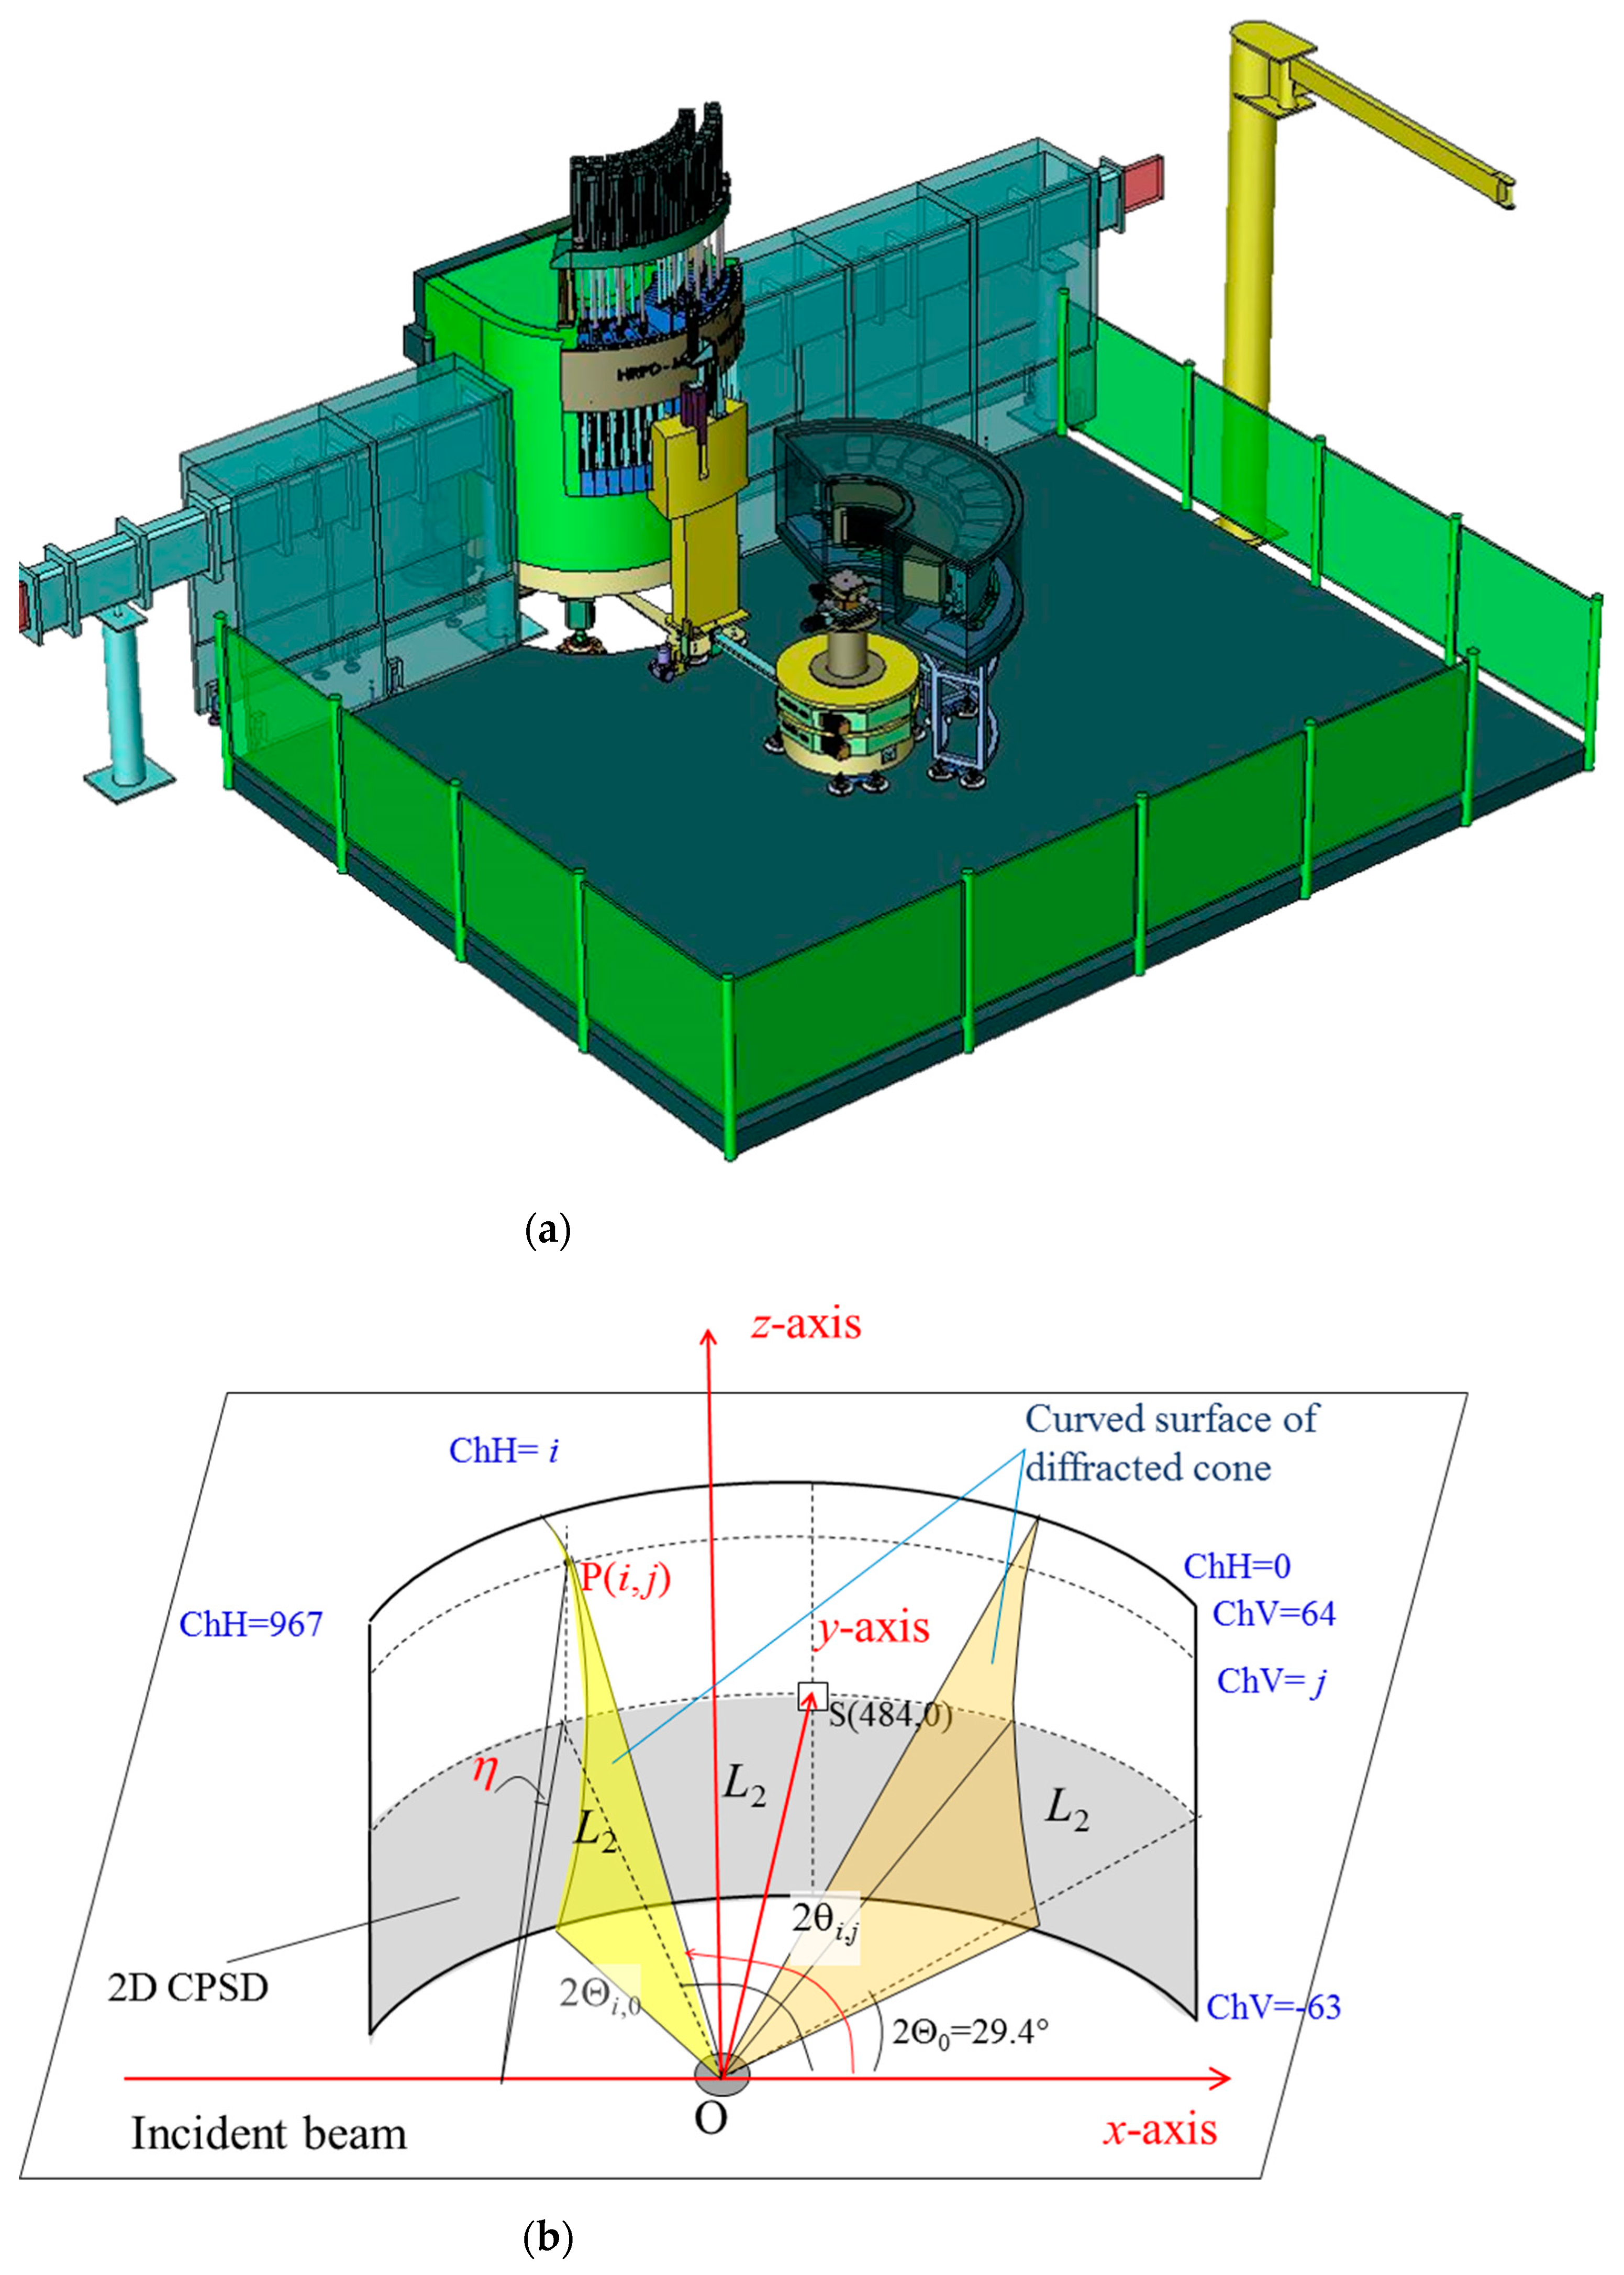
The WOMBAT instrument is a high intensity powder diffractometer equipped with a two-dimensional position-sensitive cylindrical detector, consisting of eight curved panels filled with partial pressures of 7.1 × 10⁵ Pa 3He and 2.5 × 10⁵ Pa propane [36], and employing the geometry of a Debye–Scherrer camera [17]. The instrument can choose from multiple available monochromators: a focusing Ge-115 cut, a flat Ge-113 cut, and a highly oriented pyrolytic graphite 002 crystal setup. The Ge-115 was processed using the “bent wafer” technique to generate an anisotropic mosaic spread in the crystals. The vertical zone axes of the Ge monochromator is [10] so that multiple reflections from that zone can be obtained and the wavenumber changed by simple rotation, as illustrated in Figure 2. At a given take-off angle, the wavenumbers scale with the ratio of the scattering vectors, e.g., changing from the symmetric cut to needs a rotation of 9.446°. Their lengths were = 5.7716 Å−1, = 3.6839 Å−1 at a take-off angle of 90°, corresponding to wavenumbers k = 4.0811 Å−1 and 2.6049 Å−1 and wavelengths λ = 2π/k = 1.5396 Å and 2.4120 Å, respectively. A similar concept has been implemented at WOMBAT’s neighboring instrument, the high-resolution diffractometer, ECHIDNA [39]. For further reducing the background, a dedicated radial collimator was enabled to oscillate back and forth, sweeping (−1°~1°) for integer numbers of periodicity during the collection of the diffraction pattern at each sample orientation.
The radius of the cylindrical detector to the sample center is L2 = 728 mm. In its standard setting, the detector pixels divide horizontally into 968 channels, with ΔX = 1.58825 mm or corresponding to Δ2Θx = 0.125° per pixel, and vertically into 128 channels, with ΔZ = 1.5875 mm per pixel, and a total coverage of 121° and ±7.94°, respectively.
Figure 3 illustrates the two-dimensional cylindrical position-sensitive detector on WOMBAT, together with the axis convention of an arbitrary pixel P(i, j) → P(x, y, z) → P(2θ, η) mapping onto the Cartesian coordinate system and then angular coordinate system, correspondingly. In the horizontal diffractometer plane, the detector angles 2Θ are directly stored in the NeXus file format [40], according to the relation 2Θi,0 = 2Θ0 + i Δ2Θx, where 2Θ0 is the offset angle to the first pixel in the equatorial plane, and i is the channel number. For any arbitrary pixel P(i, j), the conversion from its space coordinate P(x, y, z) to its angle coordinate P(2θi,j, η) with the true scattering angle different from the aforementioned detector angle 2Θ, and the scattering vector Qi,j, were calculated as follows for each pixel:
Cartesian coordinates:
xi,j = L2 cos(2Θi,0) = L2 cos(2Θ0 + i Δ2Θx)
yi,j = L2 sin(2Θi,0) = L2 sin(2Θ0 + i Δ2Θx)
zi,j = j ΔZ
Spherical coordinates:
and the modulus of the scattering vector, for each pixel (i,j)
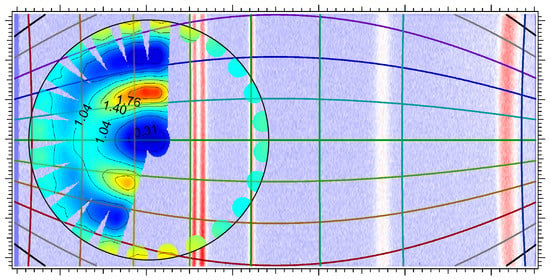
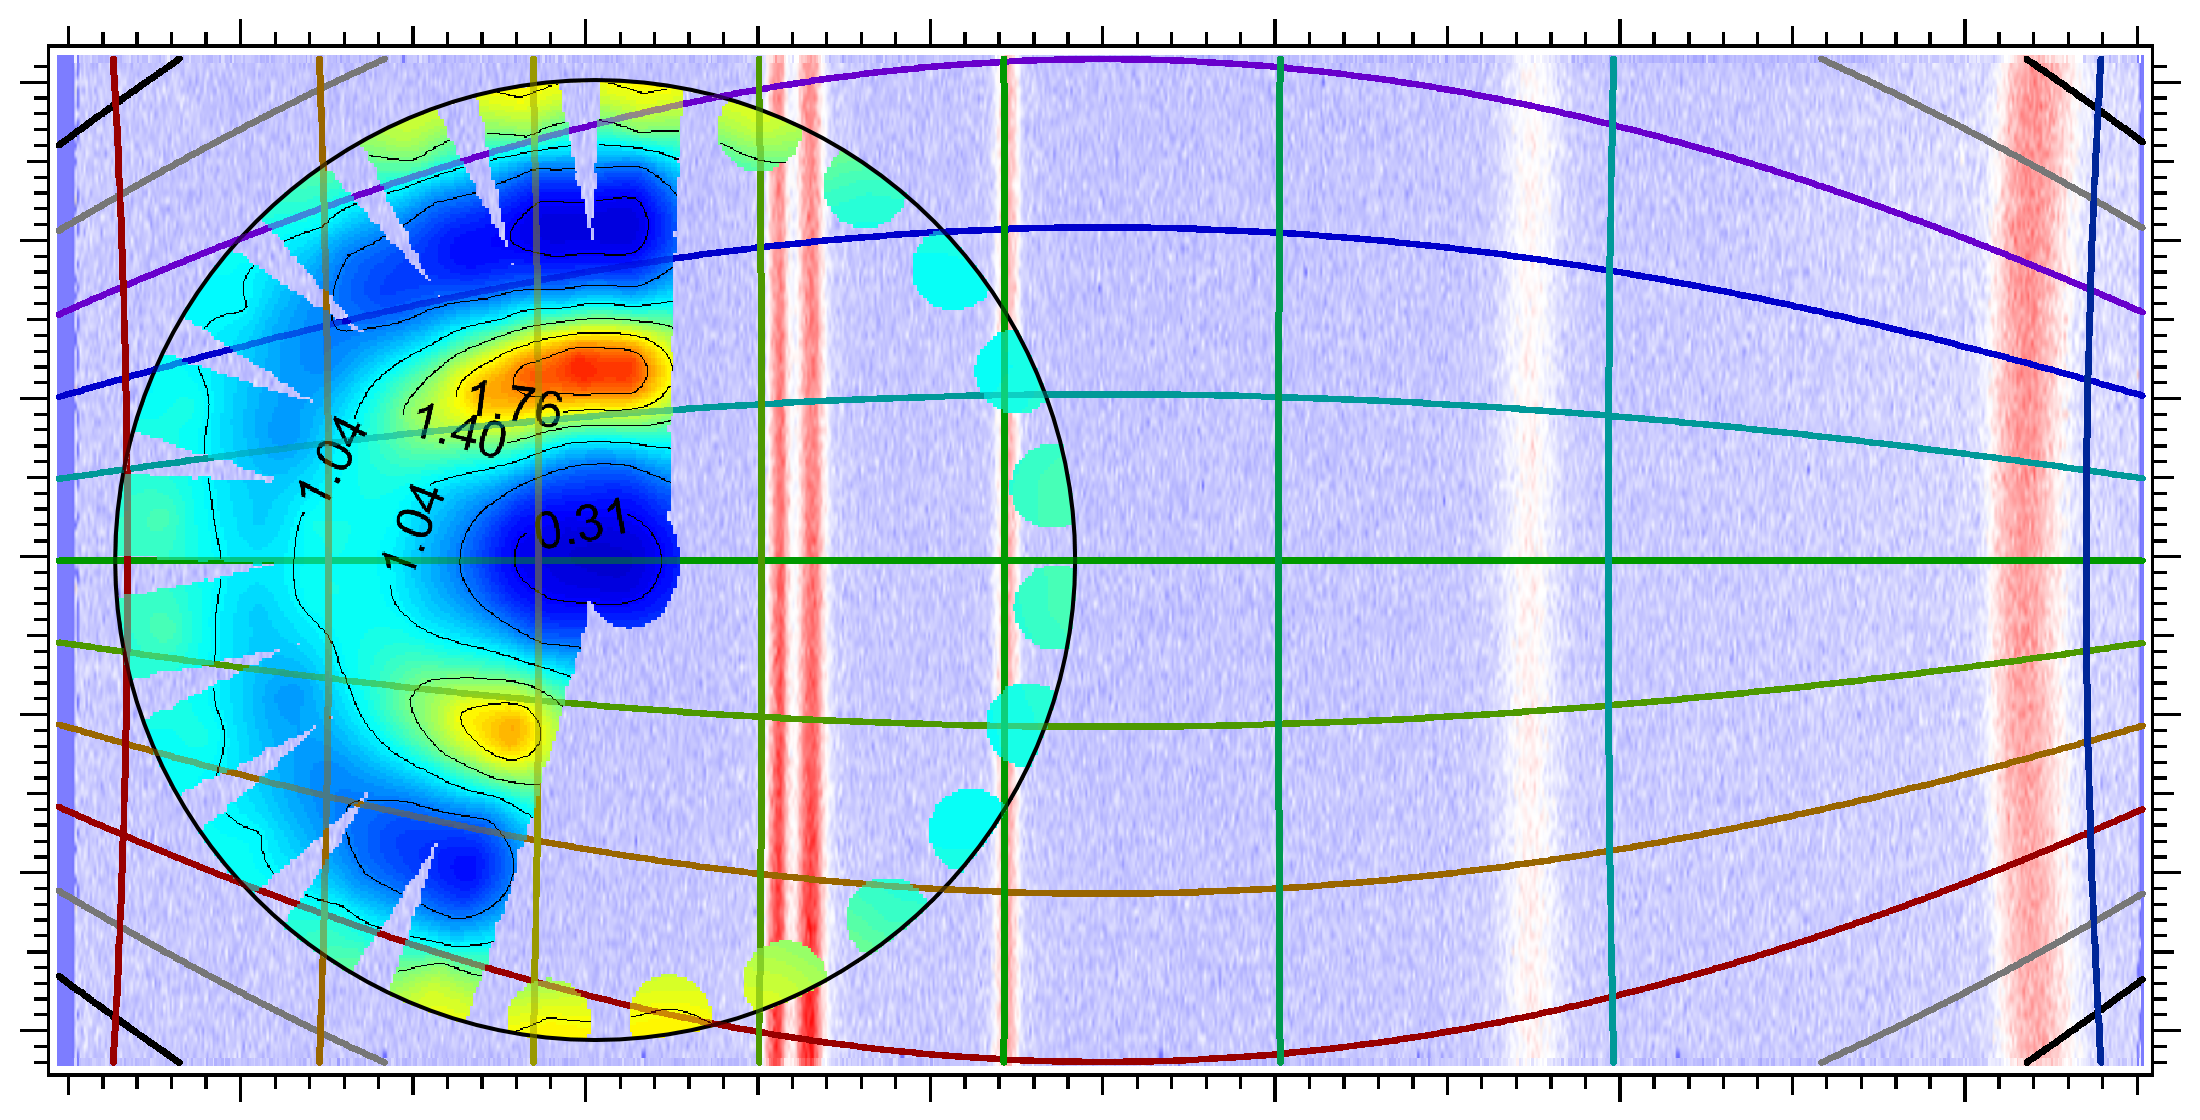
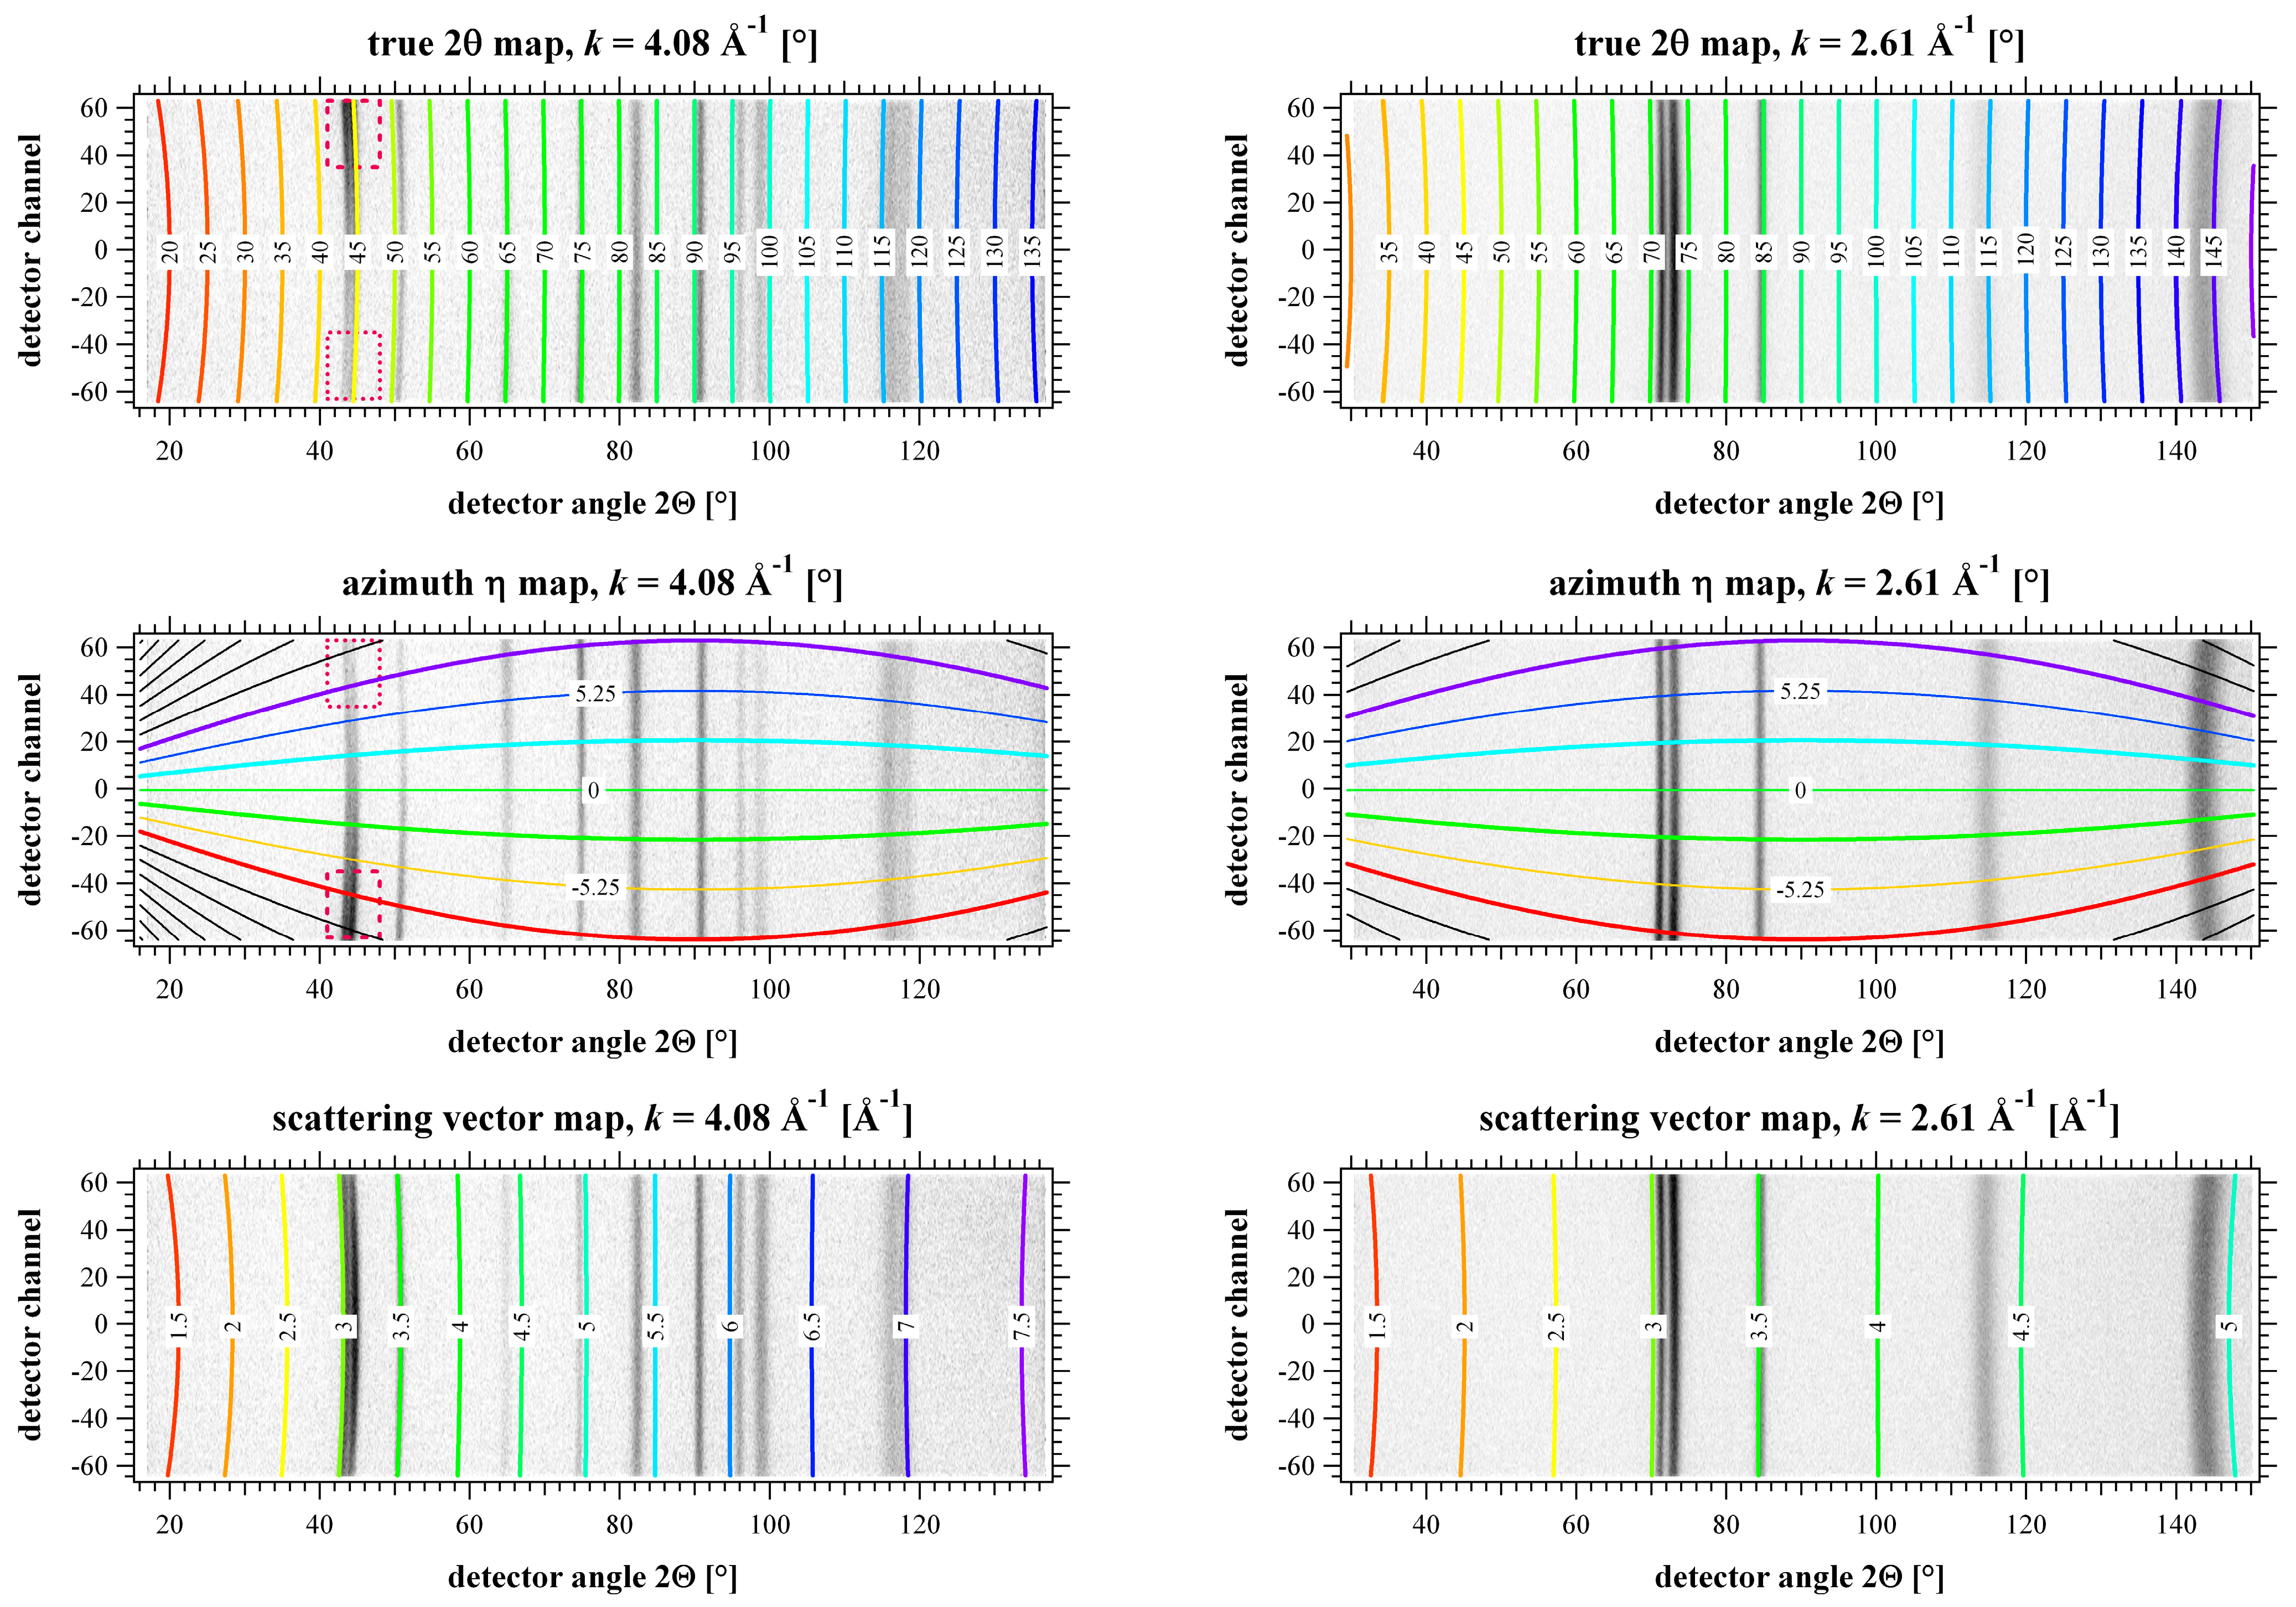
where k is the neutron beam wavenumber selected here as 2.61 Å−1 or 4.08 Å−1, through the 113 and 115 reflections of the Ge monochromator, respectively. Our detector offset angles were 2Θ0 = 29.4° and 16.0°, respectively, as indicated in Figure 3b, Δz = ΔZ, i ∈ {0, 1, … 967} and j ∈ {−63, −62, …, 64}. Figure 4 shows the calculated contour line mappings for a true scattering angle 2θ, azimuth angle η, and the corresponding momentum transfer (i.e., modulus of scattering vector) Q of an arbitrary pixel position P(i,j) on the unrolled cylinder detector image at the two selected angular settings. It is clear that the detector angle 2Θ is different from the true scattering angle 2θ, and a simple integration of diffraction intensity along the azimuthal angle η in the literature [38] eventually resulted in a lower angle resolution in 2θ. Figure 4 also shows that the γ-111 and α-110 reflections appear as a well-separated double-line around a detector-angle of 72° for the k2 = 2.61 Å−1 map, while blurring into each other around 44° for k1 = 4.08 Å−1.
2θi,j = cos−1(x/(x2 + y2 + z2)1/2)
ηi,j = tan−1(z/(L2 sin(2Θi,0))
Qi,j = 2 k sin(½ 2Θi,0 )
The current setting with k2 = 2.61 Å−1 and 2Θ0 = 29.4° enables us to obtain the best reciprocal space resolution for the overlapping γ-111 and α-110 peaks, while k1 = 4.08 Å−1 allows accessing more reflections simultaneously. A clear lateral variation in peak intensities appears between the dashed and dotted line areas marked on the maps at k1 = 4.08 Å−1 due to the texture, demonstrating a distinct distribution along the azimuth angle, and suggesting that a proper detector panel division along the azimuth is valuable for improving the orientation resolution of the diffractometer. By lowering the detector offset 2Θ0 at a smaller wavenumber, such variations in peak intensities can be observed in a wider azimuthal range.
2.3. Data Conversion from 2D Image Data to Divided 1D Neutron Diffractograms
An internal C-language routine was developed within the package dataRring to re-bin each 2D image data into the corresponding 2θ and Q distribution curves of several 1D diffraction intensities. A mask matrix of equal size can be prepared to consider only specific areas of the detector, for example to exclude bad pixels or, moreover, only include data within a given azimuth η range from the maps, as shown in Figure 4. Considering that the maximum fully covered azimuth η range was ±7.94° at the scattering angle of 2Θ = 90°, the detector panel-region area was divided into three azimuthal stripes with a width of Δη = 5.25°, which is a good match with typical texture sampling, i.e., three raw neutron diffractograms were obtained from the intervals −7.875° η < −2.625°, −2.625° < η ≤ 2.625°, 2.625° < η ≤ 7.875° simultaneously for each sample rotation. The chosen intervals are depicted by the thicker contour lines in the azimuth maps of Figure 4, and it is demonstrated that intensity variations occur in the underlying detector recordings.
The 2D image data was re-binned into one-dimensional diffractograms depending on 2θ and Q through defining a detector mask and considering a given azimuth coverage. We selected same horizontal samplings of the output data 2θ0 + m Δ2θ, in which 2θ0 = 2Θ0, and Δ2θ = Δ2Θx are the instrument given step size in detector pixels (e.g., 0.125°), and a same-size, linear sampling in the corresponding interval [Qmin … Qn … Qmax]; m,n ∈ {0,1,…967}. Each detector pixel (i,j) within the mask is then transformed via Equations (4) and (6) to 2θi,j and Qi,j, respectively, accumulating the pixel intensity Ii,j to the closest bins in 2θm and Qn. Counting vectors of same binning sizes are incremented for each hit m or n, to which the accumulated histograms are normalized. Therefore, the output data-vectors 2θ and Q contain the average intensity per pixel in the masked region. To obtain more realistic counts, results can be scaled by a meaningful number, i.e., by 128 vertical pixels for an unmasked detector or by 128/3 when divided into three azimuthal stripes. Such simple scaling may overestimate a little the low-Q and high-Q data, which is irrelevant for further analysis, as the same Qn has the same scaling. With such data reduction, the Debye–Scherrer rings near the maximum and minimum scattering angles (2Θmax, 2Θmin) show a wider azimuthal angle range, Δη, (Figure 4) than those near 2Θ = 90°, i.e., the former has a lower azimuthal angle resolution than the latter. In the present study, the above geometric conversion was carried out to remove the artificial uncertainty of 1D diffraction pattern appearing at D19 [34].
2.4. Rietveld Texture Analysis with MAUD
Texture analysis is undertaken by measuring orientation-dependent diffractograms in a four-circle diffractometer setting, using a Eulerian cradle with axes φ on top of χ on top of ω (Θ), together with a curved detector at angle 2Θ, herewith vertically split into azimuths η. Angles are leaned to the Busing–Levy settings [41], however in a right-handed system and with the x-axis along the incident beam. Diffractograms in true 2θ from various sample orientations are taken into the MAUD Rietveld analysis package, which allows full crystallographic refinement, including texture orientations.
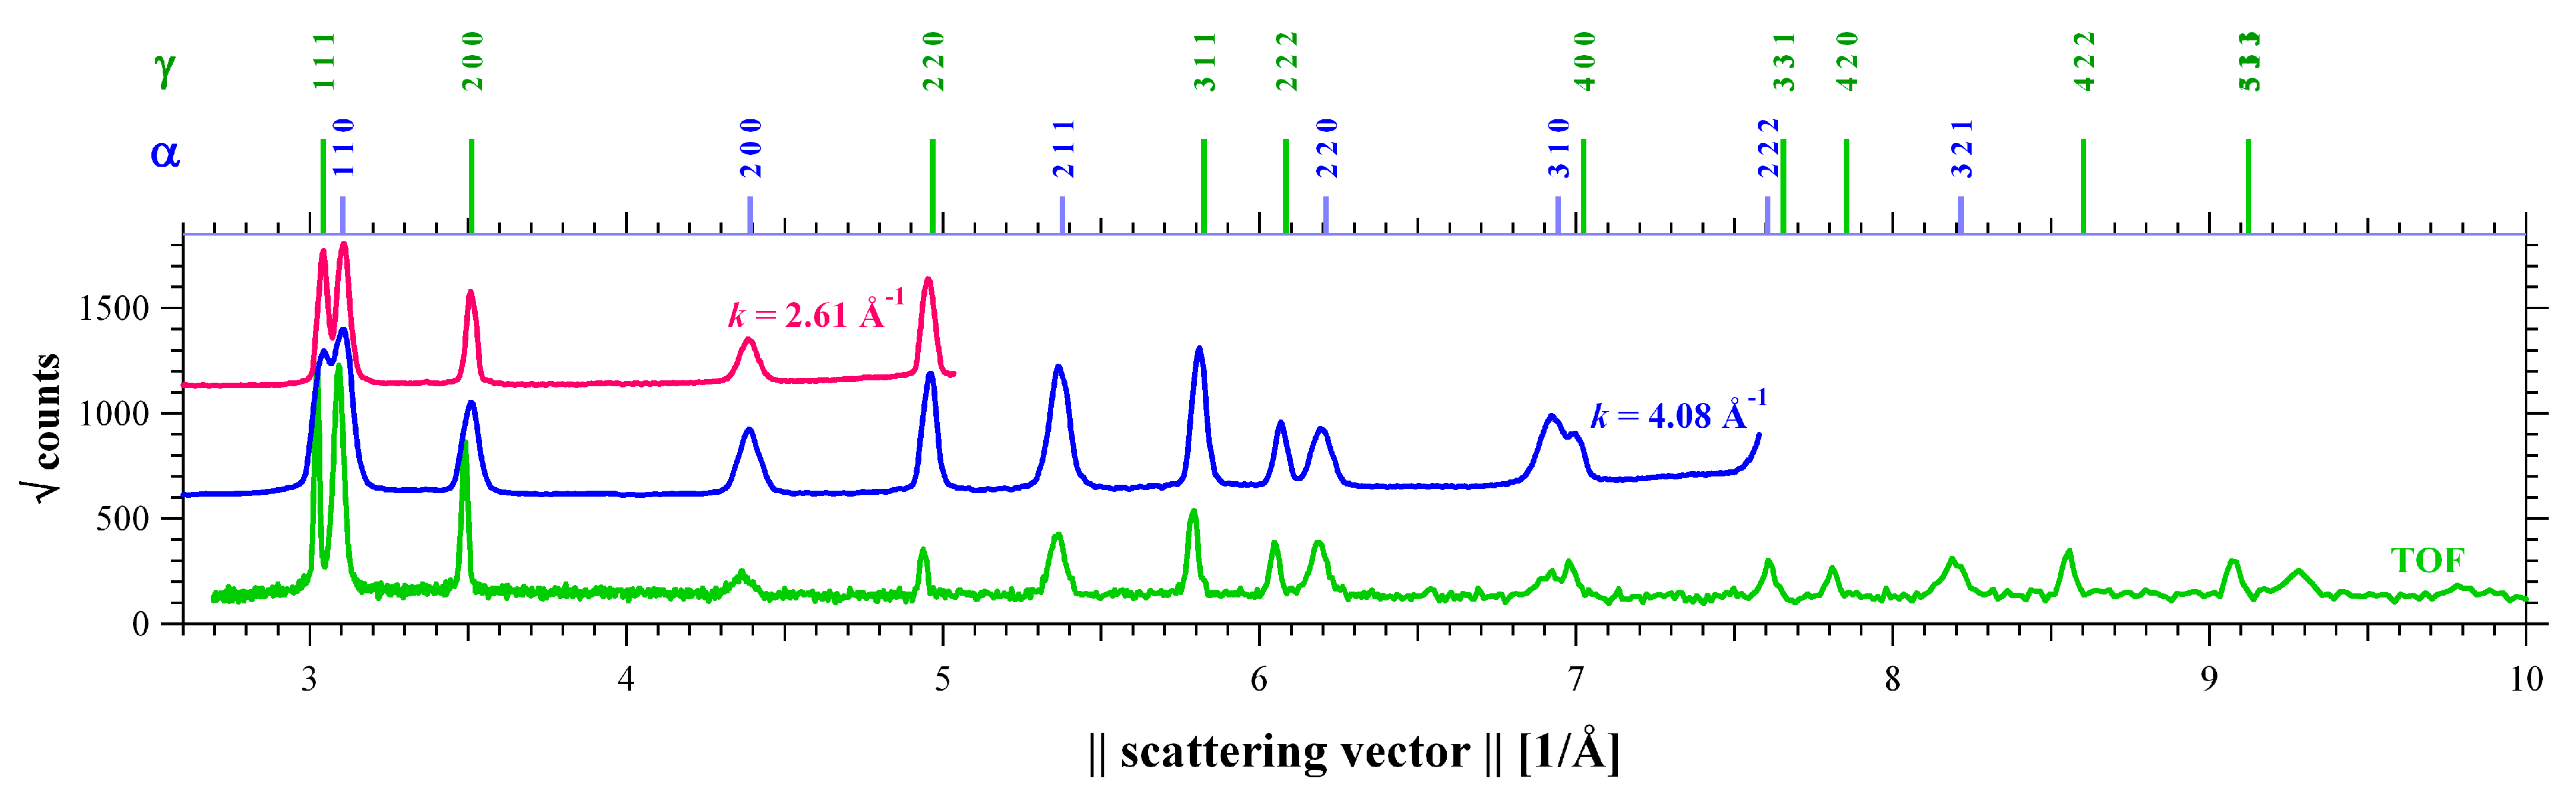
Selected two-dimensional diffractograms for wavenumbers of k1 = 4.08 Å−1 and k1 = 2.61 Å−1 are shown in Figure 4 underlying the contour plots. Figure 5 shows their rebinned one-dimensional patterns as examples, both obtained from ω = 2Θ0 = 30°, χ = 90°, φ = −180°, η = 0° and in comparison with TAKUMI data. Obviously, the range of momentum space Q is extended for the larger incident wavenumber k, covering 5 and 11 diffraction peaks, respectively, namely for austenite: γ-111, γ-200, γ-220, γ-311, γ-222, γ-400, and for martensite: α-110, α-200, α-211, α-220, α-310. The compromise of the Q-range covered is the resolution, because, to a major contribution, the pattern for each wavenumber is spread over the same detector range; see background images in Figure 4. There is a better separation of the γ-111 and α-110 lines when recording with k2 = 2.61 Å−1 rather than k1 = 4.08 Å−1, expressed in the higher Q-resolution demonstrated in Figure 5.
We scanned orientation angles for k1 = 4.08 Å−1 in 72 φ-steps by 5° from −180° to 175°, in seven χ-steps of 15° from 0° to 90°. Through the 3 η divisions, this results in 1512 orientations from 504 exposures of 63 s. For k2 = 2.61 Å−1, we implemented 12 φ-steps of 15° from −180° to −15°, and the other equally, resulting into 252 orientations from 84 exposures of 63 s. This choice ensured a wide peak coverage on the larger Q-range, i.e., the majority of reflections, and a coarse coverage at low-Q with excellent peak separation of γ-111 and α-110. The above-described division of the detector panel in three stripes around the η ∈ {−5.25°, 0°, 5.25°} probes orientation space close to the χ axis, allowing a reduction of instrumental χ steps by a factor of 3, resulting in Δχ = 15° rather than the conventional 5° per step. Experimental coverages and pole figures for the γ-111 reflection are displayed in Figure 6, together with an all-over refinement. No sample symmetry was adopted for the MAUD Rietveld texture analysis, and the resolution of the orientation distribution function (ODF) was selected as 5°.
3. Results and Discussion
3.1. Bulk Texture Evaluation Using WOMBAT Neutron Diffraction
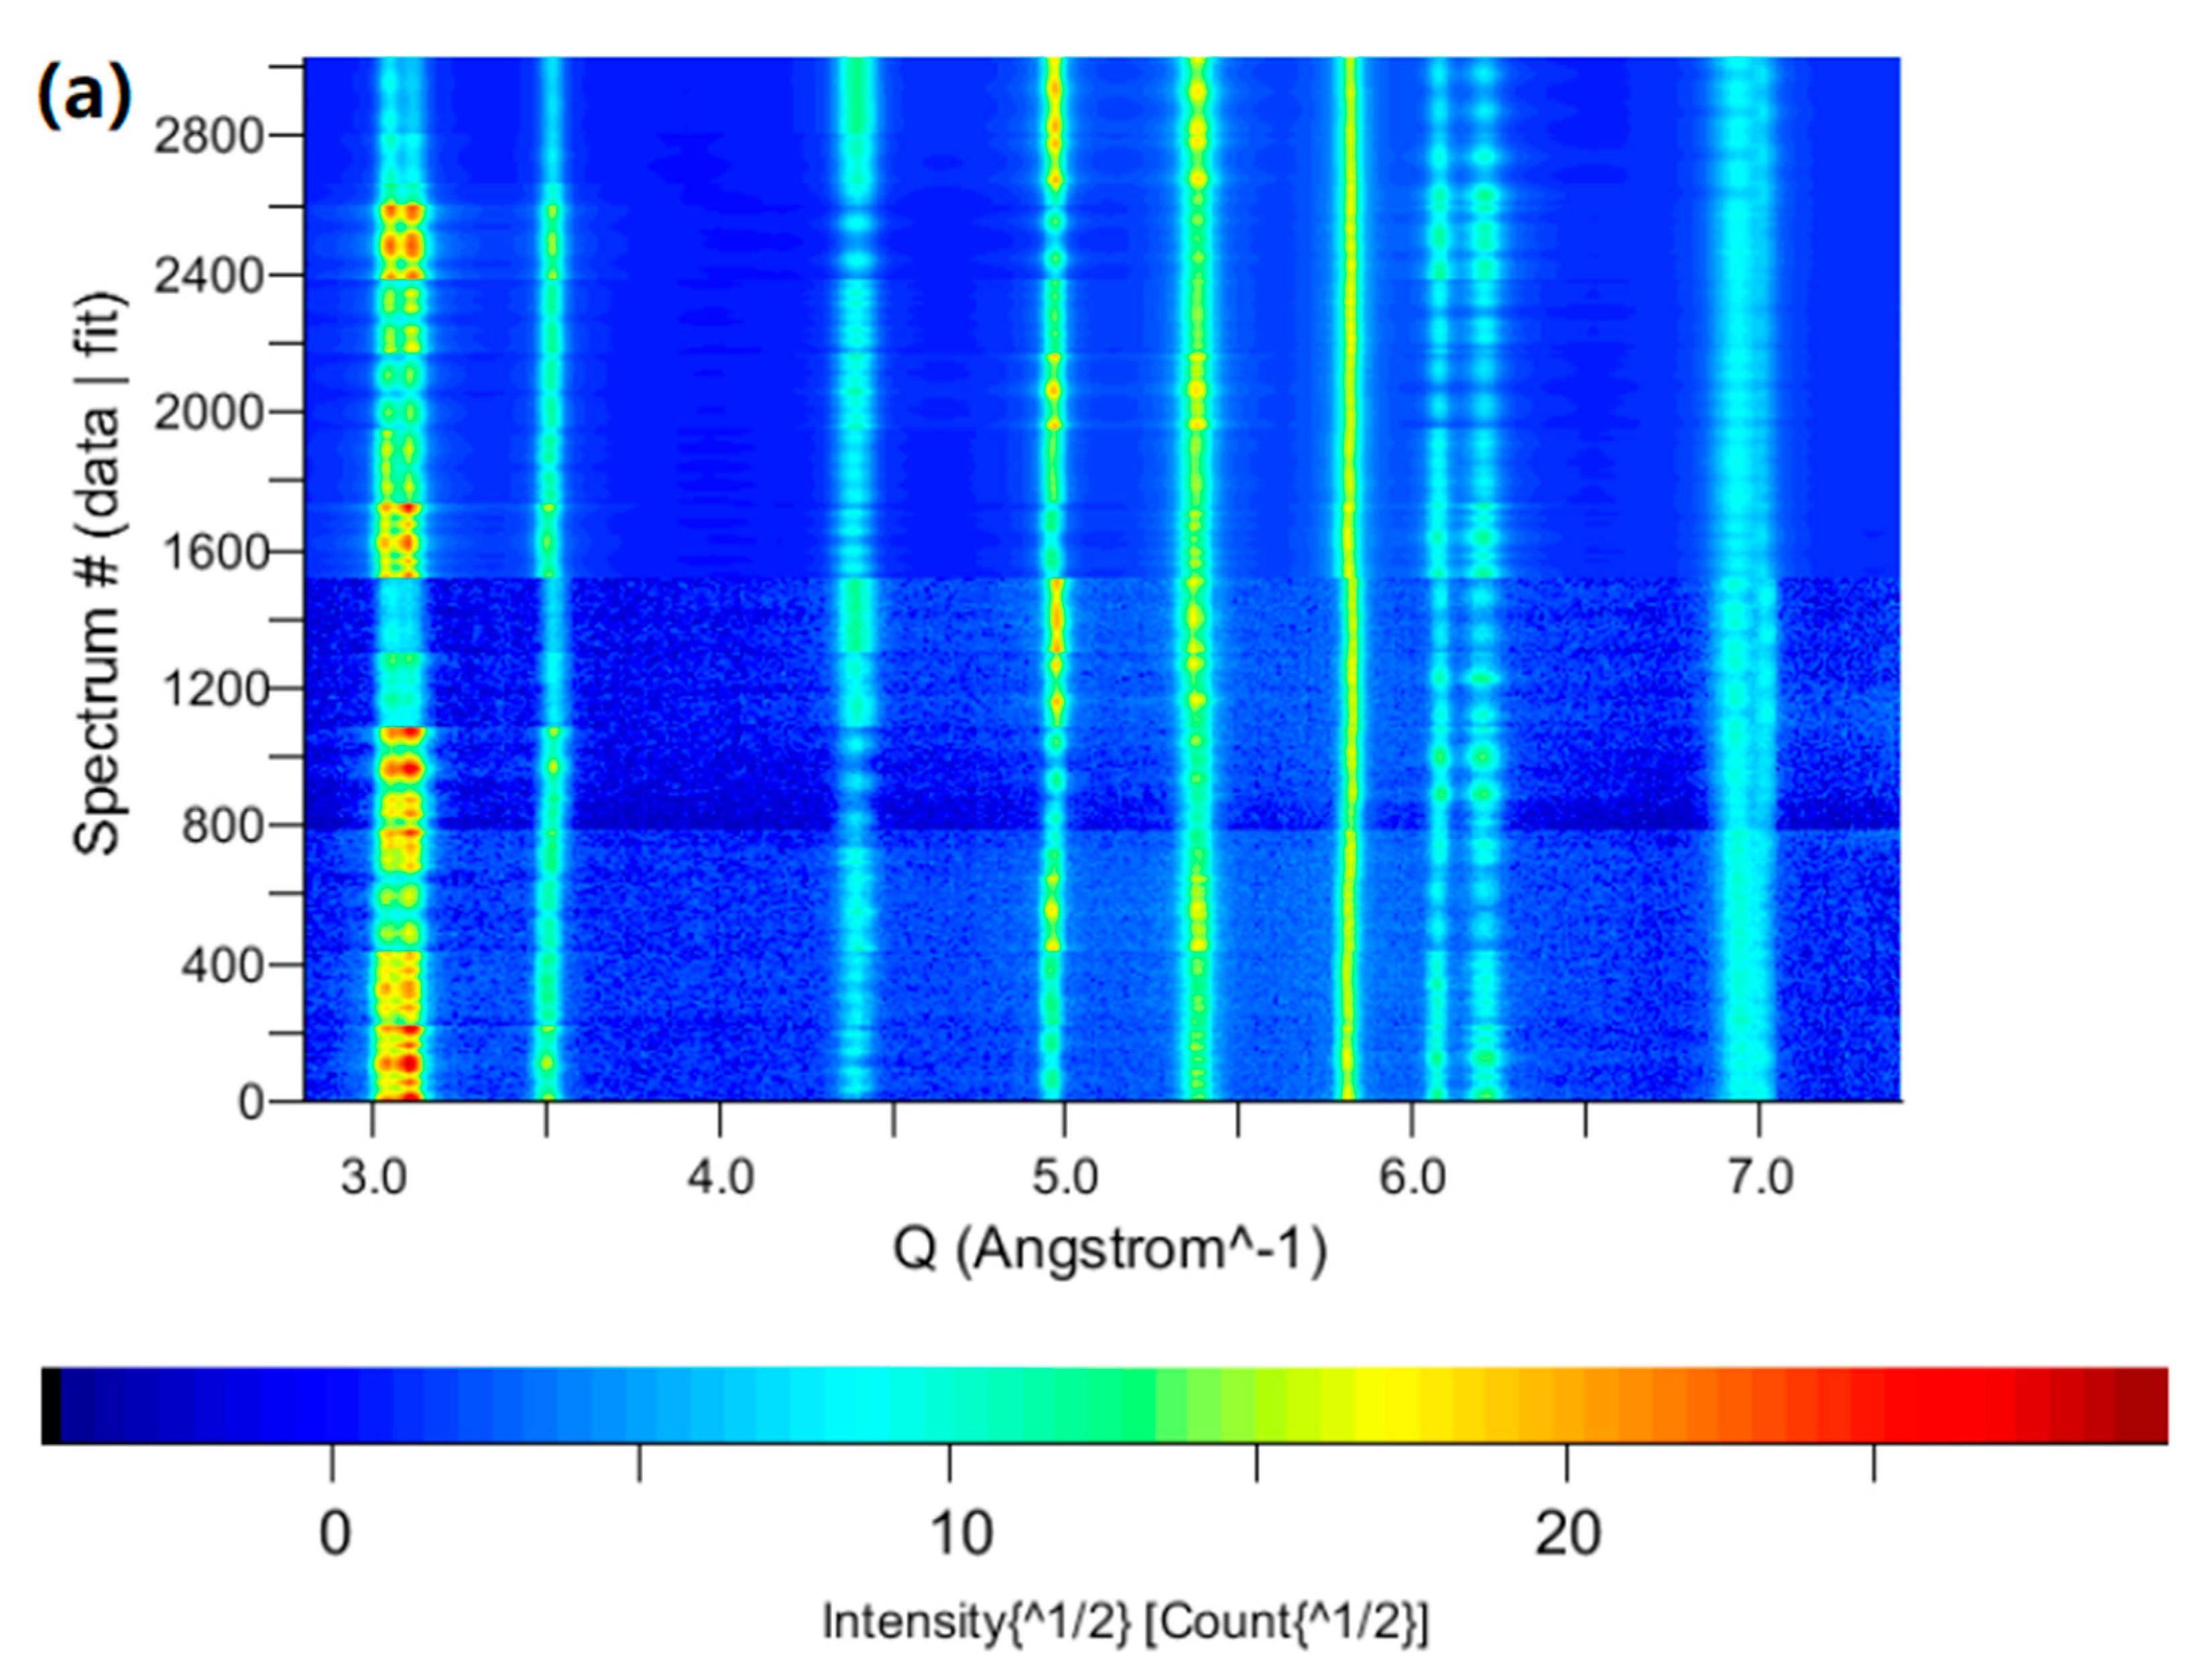
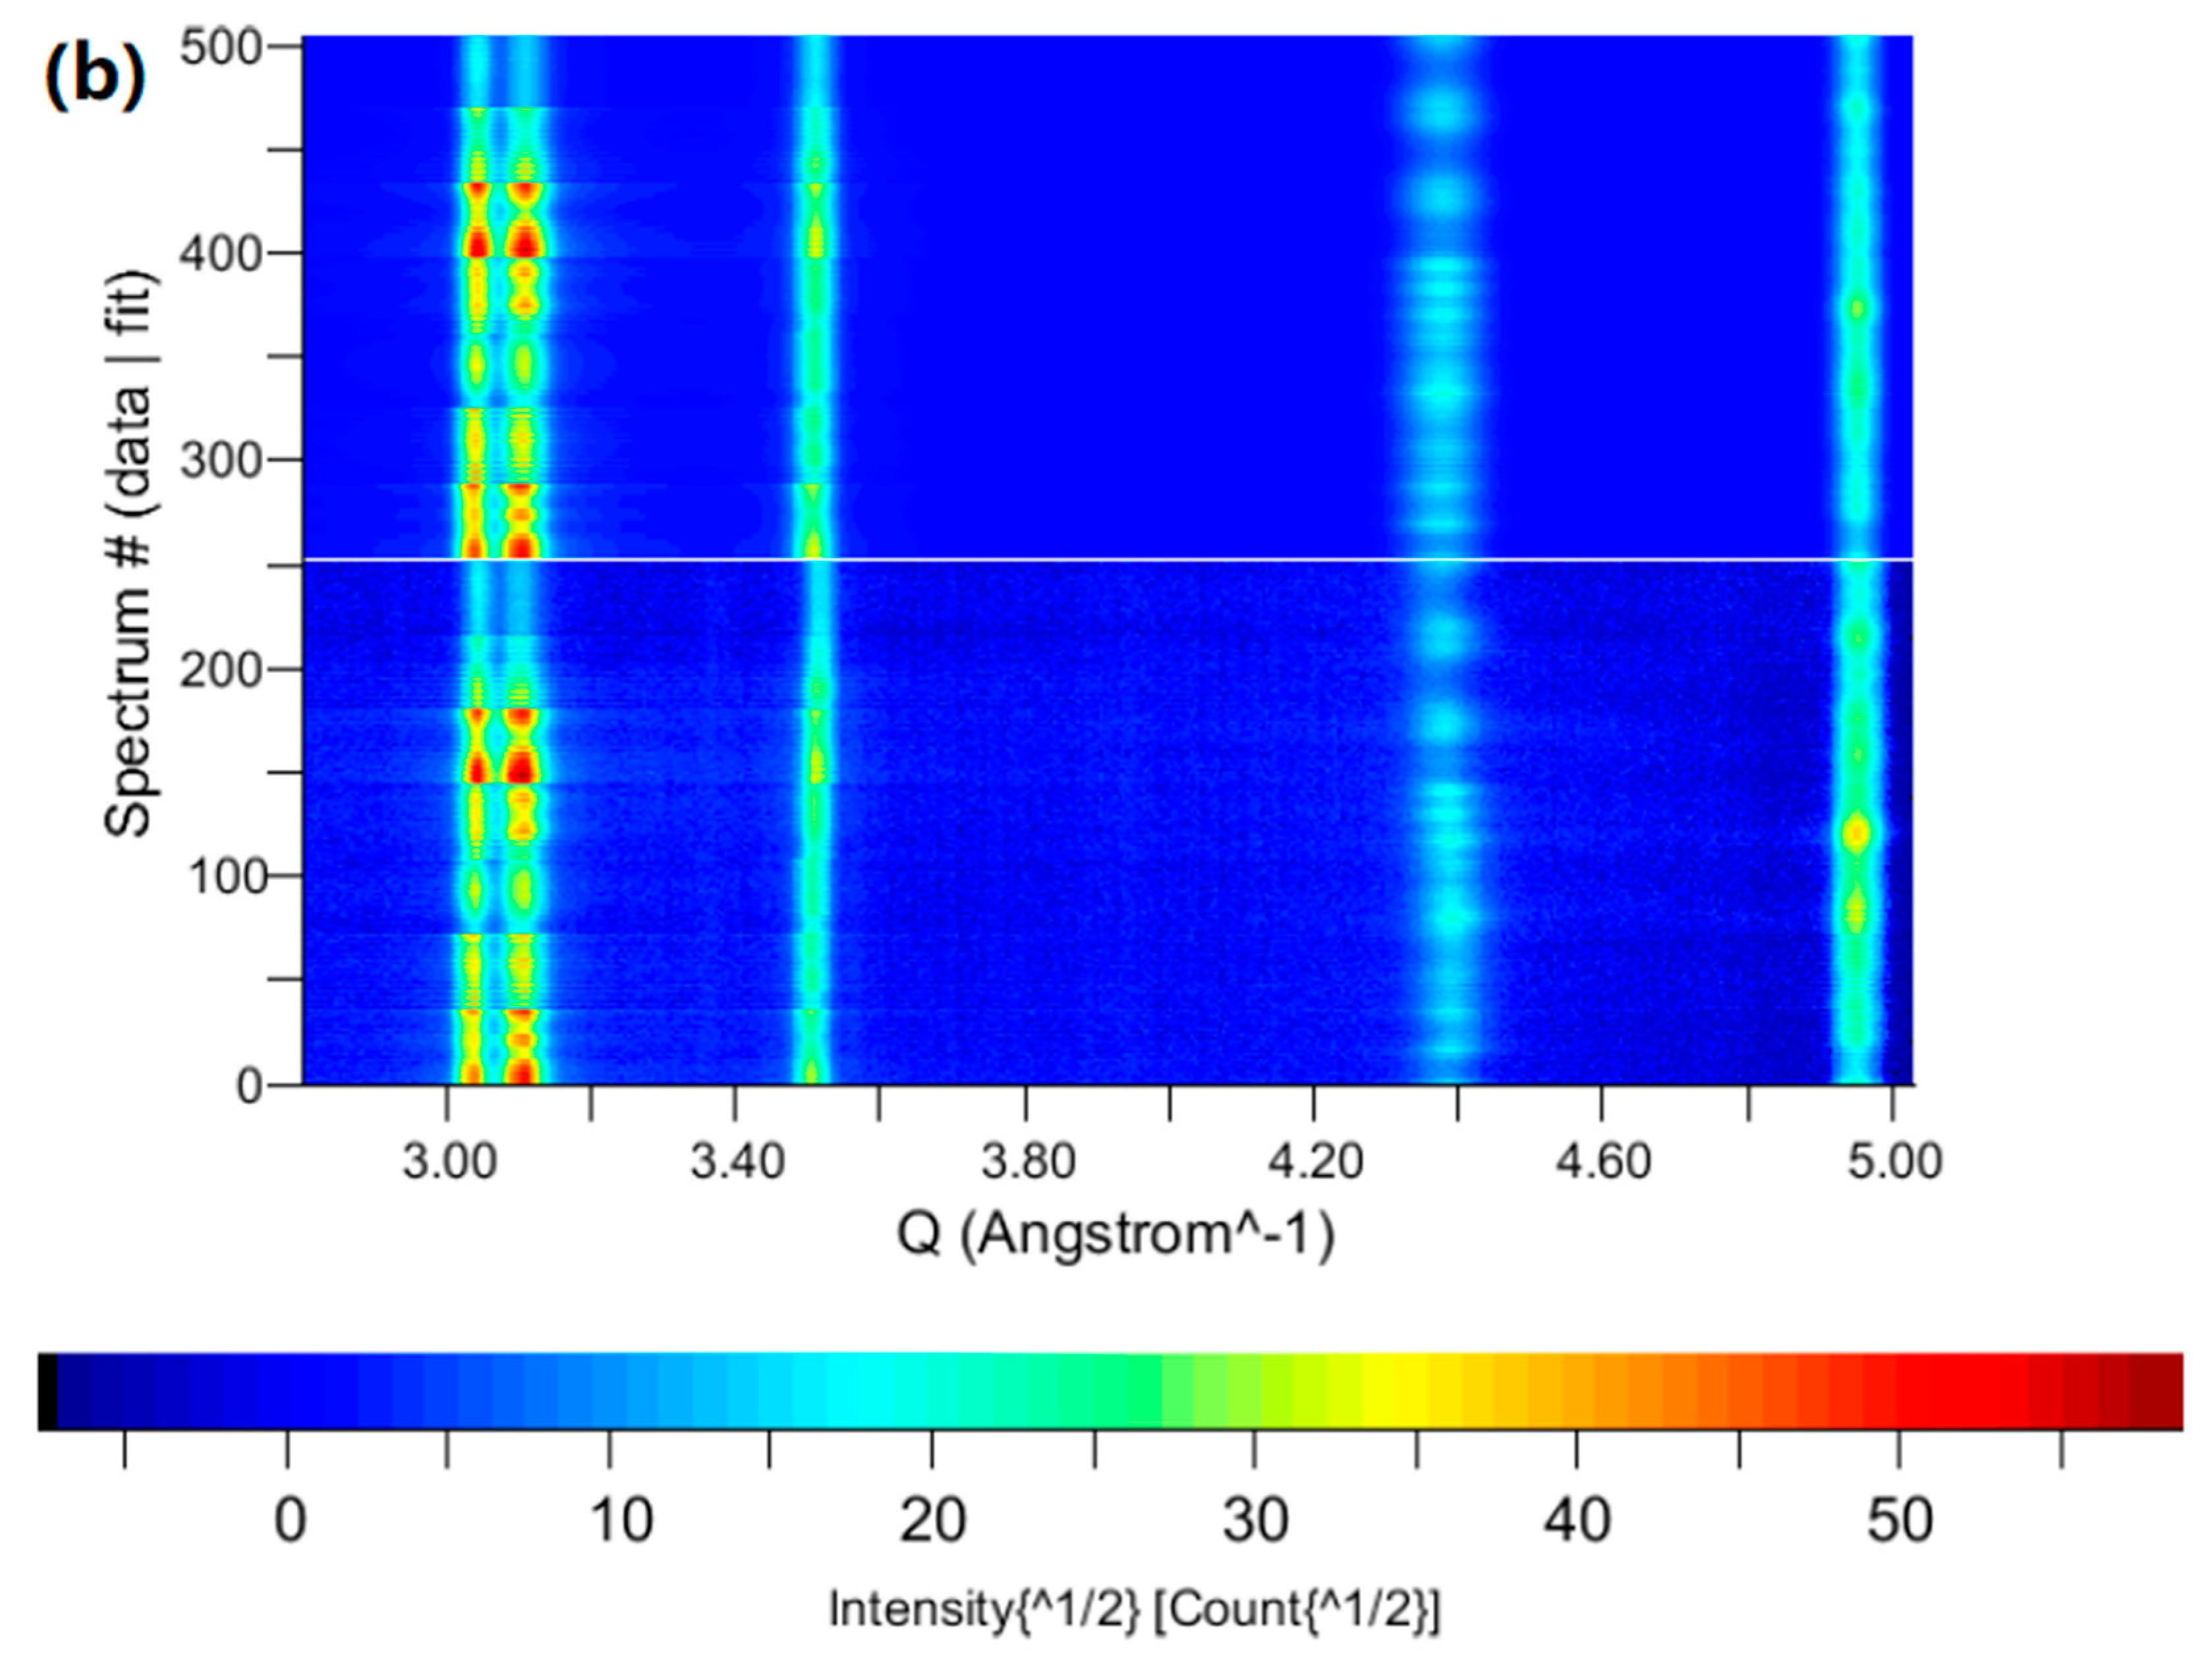
Figure 7 displays the 2D line-plots for the measured diffractograms (lower half) and the Rietveld fitted profiles (upper half) of the multilayered steel sheets obtained during combined MAUD–Rietveld texture analysis, simultaneously using patterns collected from a larger wavenumber (a) and smaller wavenumber (b) through panel-region divisions and various sample rotations. The obtained volume fraction of martensite was about 50.24(5)%, and its mass fraction was about 49.71(5)%. The corresponding data from TAKUMI were 50.06(3)% and 49.94(3)%, respectively [32]. Considering an acceptable absolute error of phase fraction of about 1.0%, such a difference in the error of about 0.2% reveals a good precision for phase fraction analysis of textured steel materials at WOMBAT.
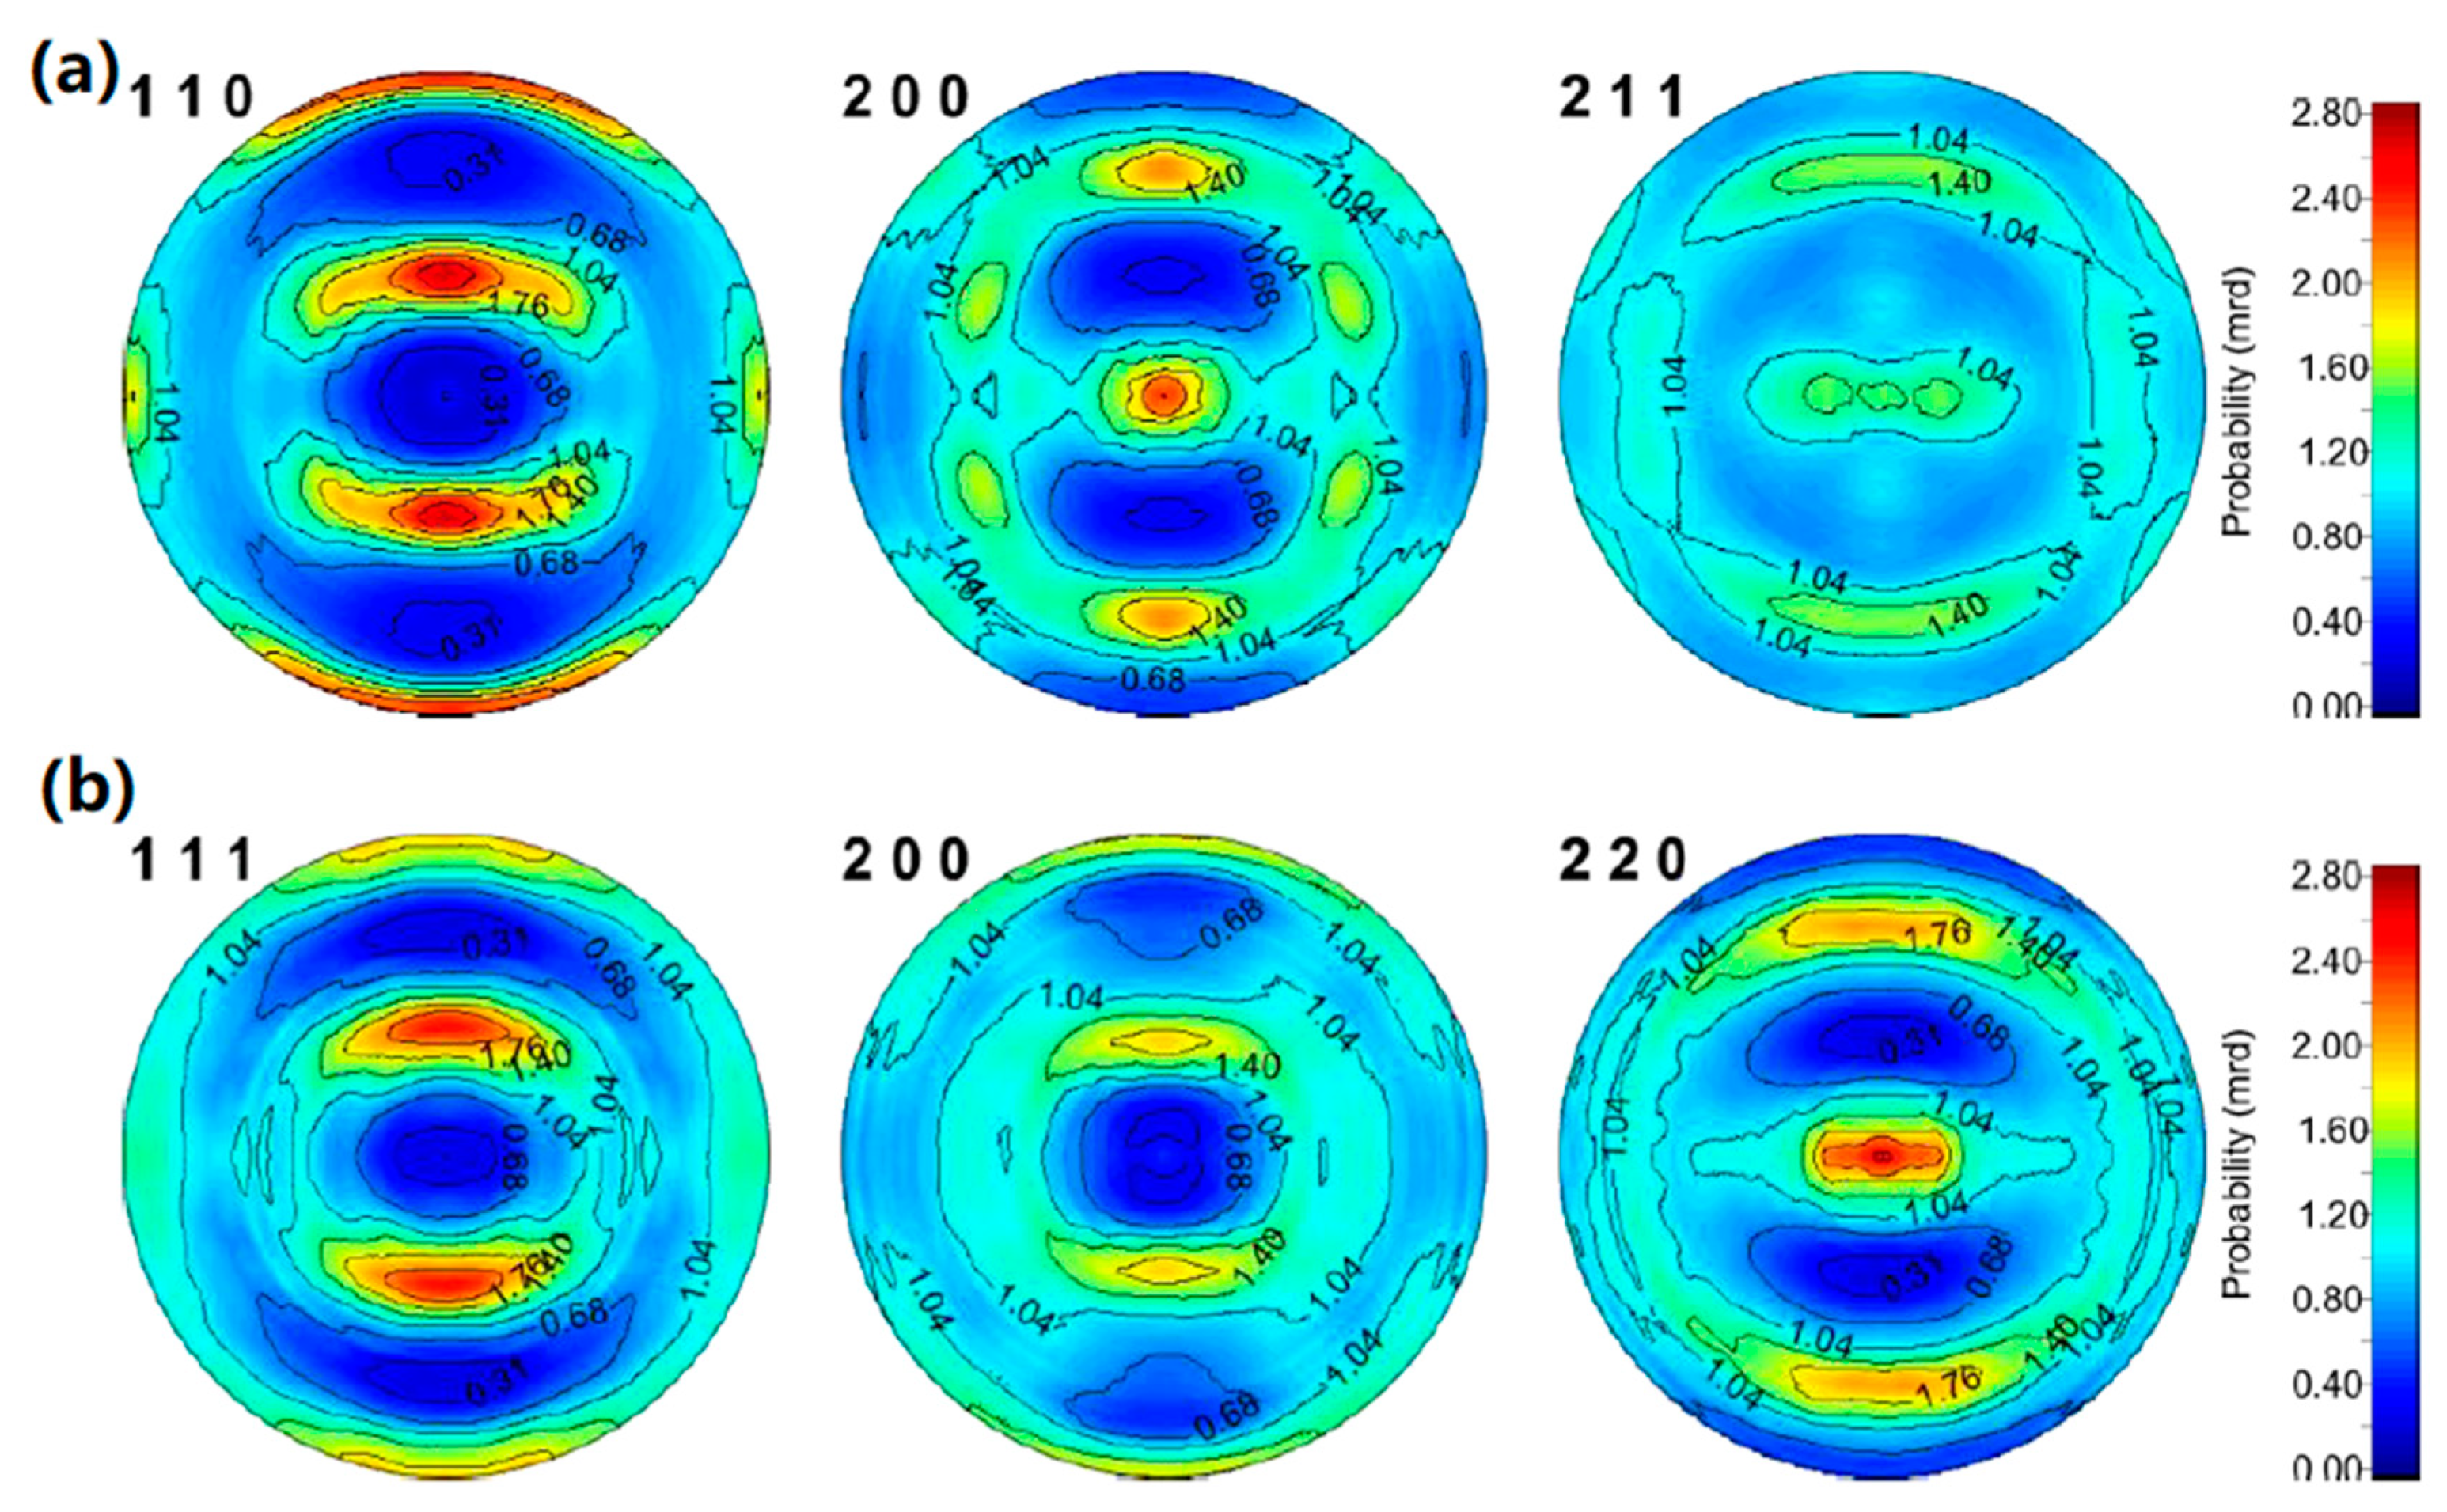
Figure 8 shows the recalculated pole figures of martensite layers in multilayered steel obtained at an ODF resolution of 5°. The good crystallographic symmetry, the smooth pole density distribution, and lack of evident ghost orientation suggest that a reliable analysis was realized through multiple-wavelength neutron diffraction at WOMBAT.
3.2. High Resolution Texture Reliability from Different Neutron Diffractometers
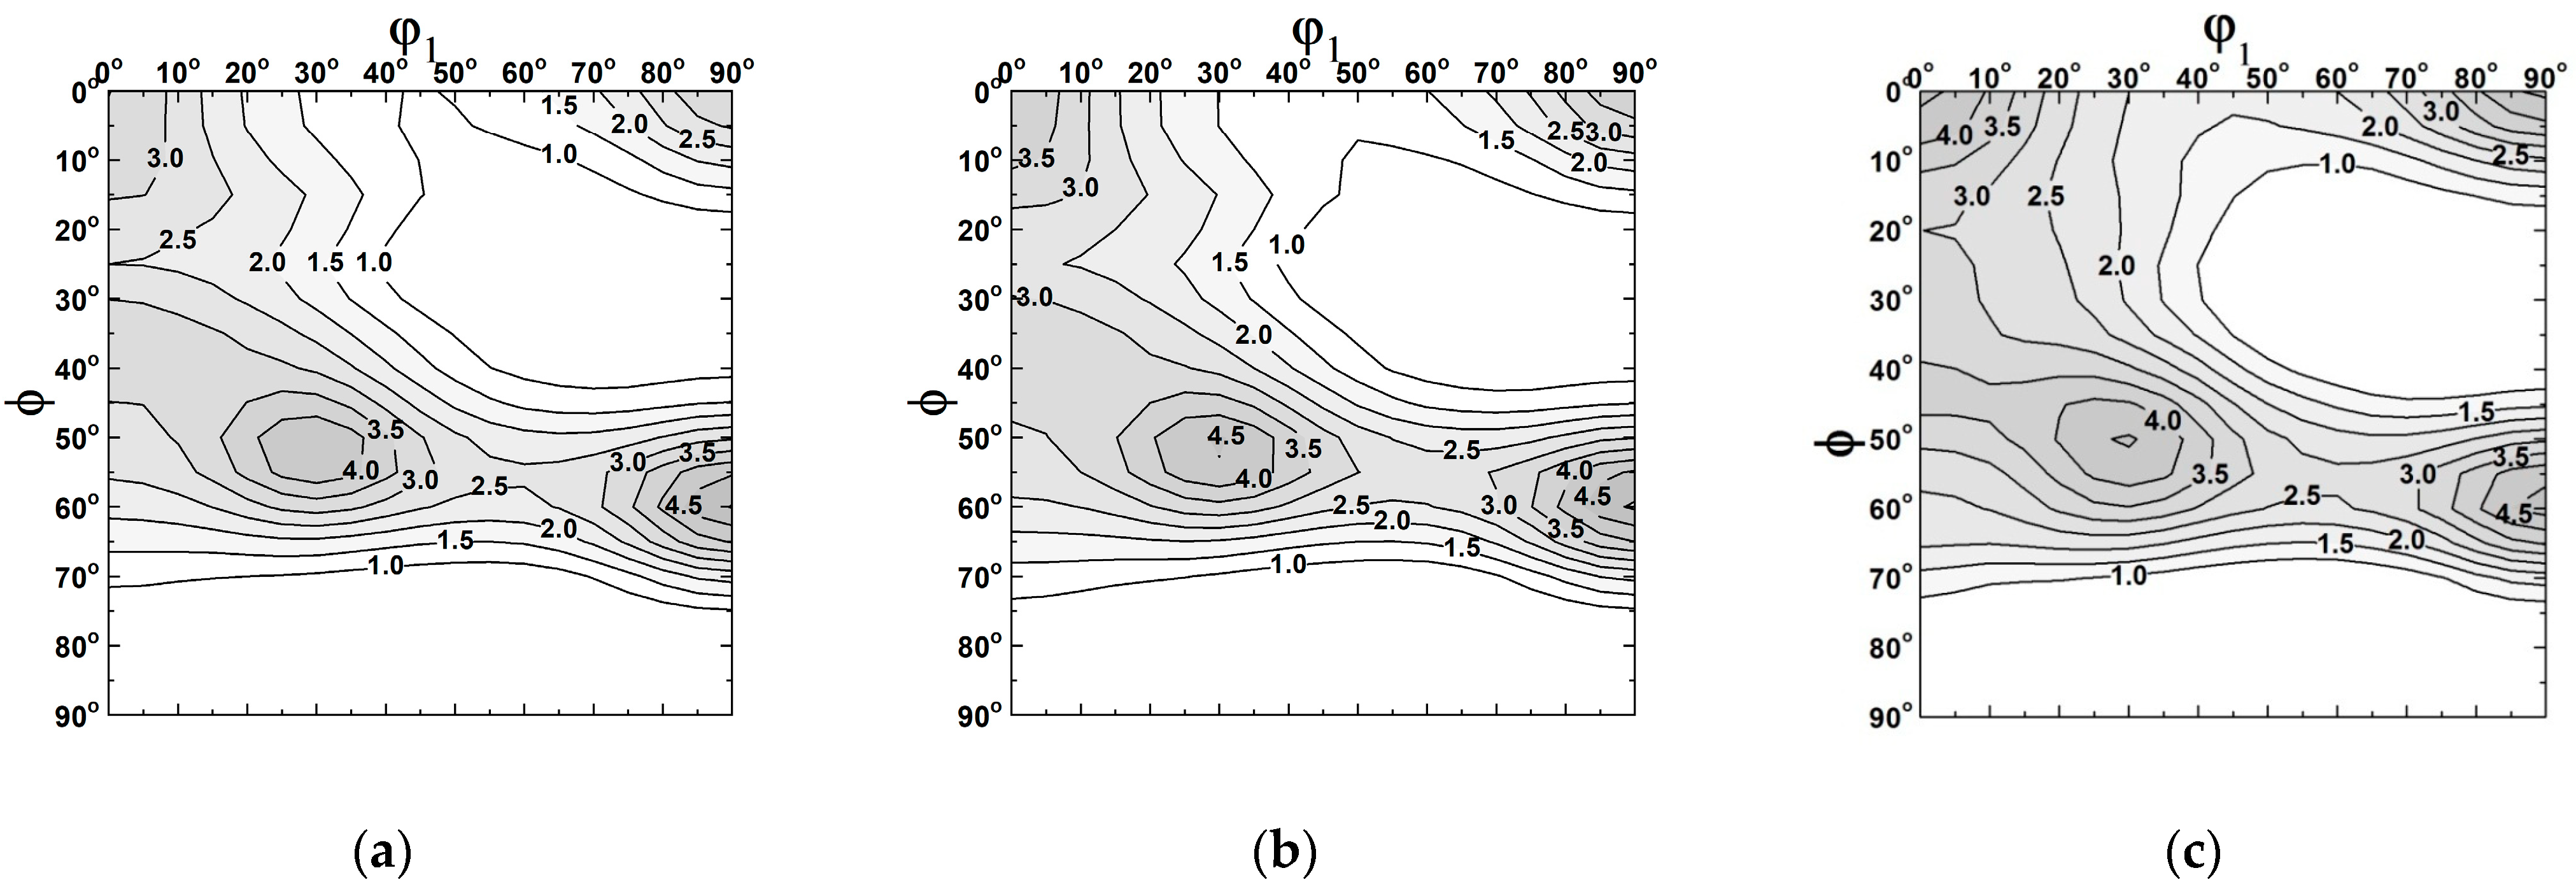
For further comparison of the martensite bulk textures quantitatively obtained from WOMBAT and a series of other instruments, Figure 9 displays φ2 = 45° orientation distribution sections calculated by the serial expansion method. The consistent orientation distribution suggests a satisfactory texture analysis can be obtained by both time-of-flight and multiple-wavenumber angle-dispersive techniques, and may further improve the texture reliability (Figure 9a vs. Figure 9b). Such a good repeatability of texture measurement using neutron diffraction suggests that a complementary neutron texture measurement technical platform was established between JAEA, J-PARC, and ANSTO for comprehensive application studies of engineering materials.
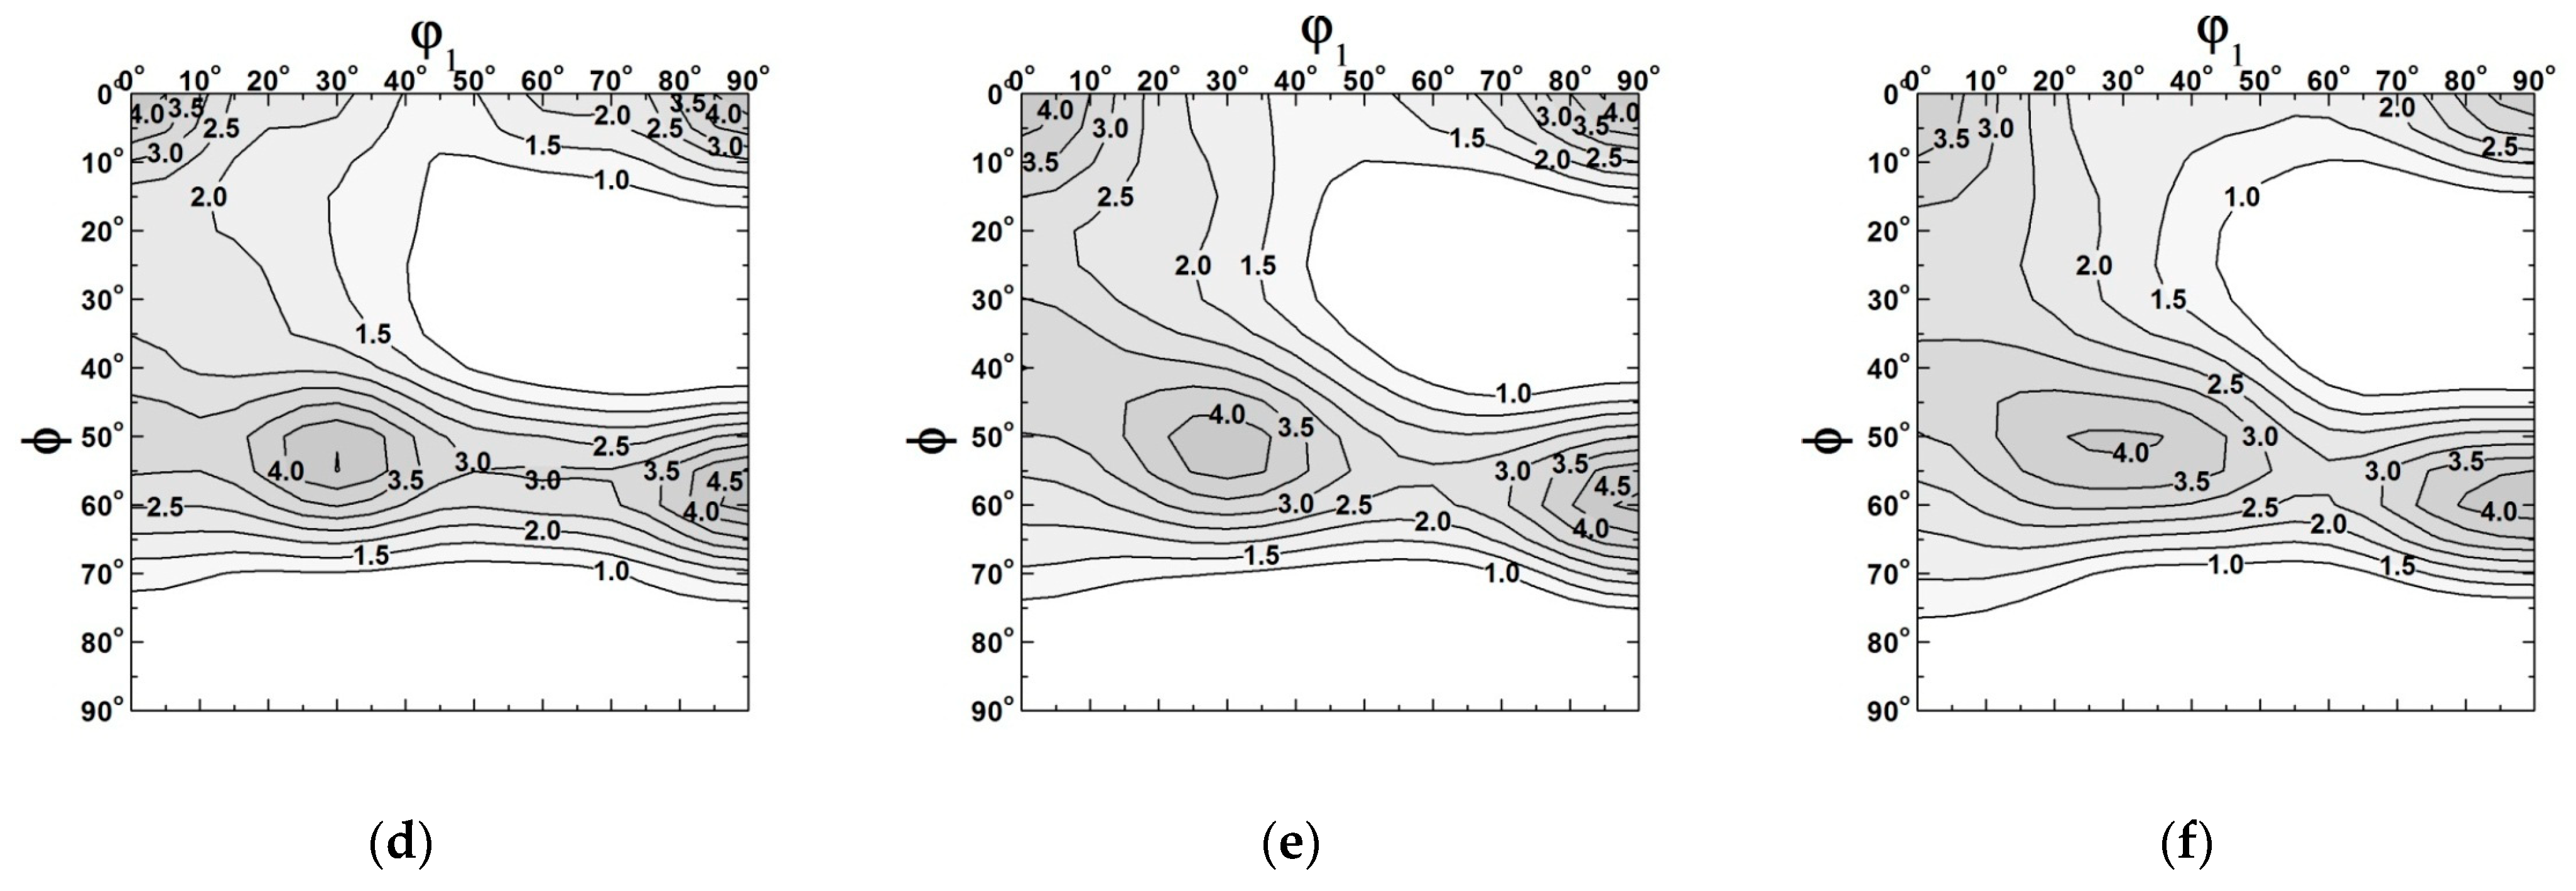
Moreover, it is known that the large solid stereographic angle coverage of time-of-flight neutron diffraction may significantly reduce the necessary time for texture measurement, e.g., TAKUMI vs. iMATERIA (Figure 9c vs. Figure 9d). Comparably, conventional angle dispersive neutron diffraction usually needs a much longer time for each pole figure measurement to collect the individual diffraction intensities using a single-tube neutron detector (e.g., MUSASI-L: 48 h for seven complete pole figures) and the 1-D diffraction peak profiles using a Δ2Θx = 10°/256 channels = 0.04° per channel position sensitive detector (e.g., RESA-2: 22 h for six quarter pole figures) with an Euler cradle at each orientation scanning χ by φ sample rotations [23]. In the present study, WOMBAT enabled collecting several diffraction peaks simultaneously at three neighboring azimuthal angles η, as described in Section 2.4, reducing the number of χ steps, and eventually finishing the precise multiphase texture measurement in about 11 h (including time for motor positioning, which could be sped up considerably). If sample and texture symmetries were employed together with the equal area scanning strategy of sample orientations [26], the measurement time at WOMBAT may be reduced significantly, to enable valuable in situ texture evolution experiments. Moreover, the employed counting time of 63 s can be reduced to about 10 s for a reliable pattern for such steel reference samples, i.e., the total measurement time may be optimized to about 1 h.
Moreover, a sandwich-stacked monochromator to deliver simultaneously two wavelengths from differently cut crystals, e.g., Si-220 and Si-111 has already been developed [42]. Such a multiple-wavelength angle-dispersive neutron diffraction technique can increase the measurement efficiency for advanced materials analysis and texture measurements, forming a good complement to accelerator-based time-of-flight neutron diffraction texture measurement [31,32,33].
4. Conclusions
Rapid bulk texture evaluation using neutron diffraction has attained much attention for fundamental and applied investigations of high-value engineering materials. In this paper, the WOMBAT angle-dispersive neutron diffractometer was employed to investigate the possibility of high stereographic resolution bulk texture measurement through proper azimuthal division of the neutron detector panel. It was demonstrated that the panel division increases the instrumental orientation resolution and the orientation coverage, while a proper sample rotation strategy improved the pole figure coverage of the neutron histograms for high stereographic resolution in bulk texture evaluation. In such a manner, WOMBAT has achieved a high stereographic sampling density, to enable an orientation distribution function with a 5° kernel resolution. Moreover, two successive measurements using different neutron wavelengths at the same sample goniometer mount are beneficial to balance the needs of separate well overlapping peaks (using a longer wavelength beam) and obtaining more texture information in a limited measurement time (using a shorter wavelength beam) of high-value textured materials.
Author Contributions
P.G.X. and K.-D.L. planned this research project together; K.-D.L. carried out the neutron diffraction experiment at WOMBAT and established the numerical calculation programs for extracting the 1D diffractograms and angles from the raw data recorded by the 2D position-sensitive detector; P.G.X. proposed the novel Rietveld texture analysis method using multiple wavelengths neutron diffraction patterns and verified the analysis reliability; P.G.X. and K.-D.L. prepared the original draft; K.-D.L. and P.G.X. further revised the final draft before submission. K.-D.L. undertook the experiments while being employed at ANSTO, and undertook the analyses and writing at the present institution. All authors have read and agreed to the published version of the manuscript.
Funding
This research received no external funding.
Data Availability Statement
The WOMBAT raw data files are archived at the Australian Nuclear Science and Technology Organisation under file numbers WBT0045778-WBT0045784 for k1 = 4.08 Å−1 and WBT0045785-WBT0045791 for k2 = 2.61 Å−1.
Acknowledgments
The WOMBAT experiment was carried out as a part of Discretionary Beamtime No. DB3631 in December 2014 and March 2015, at the Bragg Institute of Australian Nuclear Science and Technology Organisation (ANSTO), Australia.
Conflicts of Interest
The authors declare no conflict of interest.
References
- Bunge, H. Textures in Ceramics. Textures Microstruct. 1995, 24, 1–12. [Google Scholar] [CrossRef] [Green Version]
- Brockhouse, B.N. The initial magnetization of nickel under tension. Can. J. Phys. 1953, 31, 339–355. [Google Scholar] [CrossRef]
- Holden, T.M. The First Two Decades of Neutron Scattering at the Chalk River Laboratories. Quantum Beam Sci. 2021, 5, 3. [Google Scholar] [CrossRef]
- Bunge, H. Textures in Multiphase Alloys. Z. Met. 1985, 76, 92–101. [Google Scholar]
- Schäfer, W.; Merz, P.; Jansen, E.; Will, G. Neutron Diffraction Texture Analysis of Multiphase and Low-Symmetry Materials Using the Position-Sensitive Detector Julios and Peak Deconvolution Methods. Textures Microstruct. 1991, 14, 65–71. [Google Scholar] [CrossRef] [Green Version]
- Lazik, S.; Esling, C. Textures in Multiphase Materials: A Review. Textures Microstruct. 1993, 22, 1–15. [Google Scholar] [CrossRef] [Green Version]
- Wang, Y.-D.; Tian, H.; Stoica, A.D.; Wang, X.-L.; Liaw, P.K.; Richardson, J.W. The development of grain-orientation-dependent residual stresses in a cyclically deformed alloy. Nat. Mater. 2003, 2, 101–106. [Google Scholar] [CrossRef] [PubMed]
- Wenk, H.-R.; Houtte, P.V. Texture and anisotropy. Rep. Prog. Phys. 2004, 67, 1367–1428. [Google Scholar] [CrossRef]
- Onuki, Y.; Sato, S. In Situ Observation for Deformation-Induced Martensite Transformation during Tensile Deformation of SUS 304 Stainless Steel by Using Neutron Diffraction PART II: Transformation and Texture Formation Mechanisms. Quantum Beam Sci. 2021, 5, 6. [Google Scholar] [CrossRef]
- Wenk, H.-R.; Huensche, I.; Kestens, L. In-Situ Observation of Texture Changes during Phase Transformations in Ultra-Low-Carbon Steel. Metall. Mater. Trans. A 2007, 38, 261–267. [Google Scholar] [CrossRef]
- Xu, P.G.; Tomota, Y.; Vogel, S.C.; Suzuki, T.; Yonemura, M.; Kamiyama, T. Transformation strain and texture evolution during diffusional phase transformation of low alloy steels studied by neutron diffraction. Rev. Adv. Mater. Sci. 2013, 33, 389–395. [Google Scholar]
- Tomida, T.; Wakita, M.; Yasuyama, M.; Sugaya, S.; Tomota, Y.; Vogel, S.C. Memory effects of transformation textures in steel and its prediction by the double Kurdjumov–Sachs relation. Acta Mater. 2013, 61, 2828–2839. [Google Scholar] [CrossRef]
- Chateigner, D.; Ouladdiaf, B.; Léon, F. Magnetic Quantitative Texture Analysis Using Isotropic Thermal Neutron Beams. Solid State Phenom. 2010, 160, 75–82. [Google Scholar] [CrossRef]
- Liss, K.-D.; Bartels, A.; Schreyer, A.; Clemens, H. High-energy X-rays: A tool for advanced bulk investigations in materials science and physics. Textures Microstruct. 2003, 35, 219–252. [Google Scholar] [CrossRef]
- Hielscher, R.; Schaeben, H. A novel pole figure inversion method: Specification of the MTEX algorithm. J. Appl. Crystallogr. 2008, 41, 1024–1037. [Google Scholar] [CrossRef]
- Lutterotti, L. Total pattern fitting for the combined size–strain–stress–texture determination in thin film diffraction. Nucl. Instrum. Methods Phys. Res. Sect. B Beam Interact. Mater. At. 2010, 268, 334–340. [Google Scholar] [CrossRef]
- Wassermann, G.; Grewen, J. Texturen Metallischer Werkstoffe; Springer: Berlin/Heidelberg, Germany, 1962; ISBN 978-3-662-13128-2. [Google Scholar]
- Bunge, H.-J. (Ed.) Mathematische Methoden der Texturanalyse; Akademie-Verlag: New York, NY, USA, 1969. [Google Scholar]
- Kunze, K.; Schaeben, H. The Bingham Distribution of Quaternions and Its Spherical Radon Transform in Texture Analysis. Math. Geol. 2004, 36, 917–943. [Google Scholar] [CrossRef]
- Hielscher, R.; Mainprice, D.; Schaeben, H. Material Behavior: Texture and Anisotropy. In Handbook of Geomathematics; Freeden, W., Nashed, M.Z., Sonar, T., Eds.; Springer: Berlin/Heidelberg, Germany, 2014; pp. 1–36. ISBN 978-3-642-27793-1. [Google Scholar]
- McIntyre, G.J.; Holden, P.J. Neutron scattering at the OPAL research reactor. J. Phys. Conf. Ser. 2016, 746, 012001. [Google Scholar] [CrossRef] [Green Version]
- Nakajima, K.; Kawakita, Y.; Itoh, S.; Abe, J.; Aizawa, K.; Aoki, H.; Endo, H.; Fujita, M.; Funakoshi, K.; Gong, W.; et al. Materials and Life Science Experimental Facility (MLF) at the Japan Proton Accelerator Research Complex II: Neutron Scattering Instruments. Quantum Beam Sci. 2017, 1, 9. [Google Scholar] [CrossRef] [Green Version]
- Xu, P.G.; Akita, K.; Suzuki, H.; Metoki, N.; Moriai, A. Establishment and Optimization of Angle Dispersive Neutron Diffraction Bulk Texture Measurement Environments. Mater. Trans. 2012, 53, 1831–1836. [Google Scholar] [CrossRef] [Green Version]
- Li, M.J.; Liu, Y.T.; Liu, X.L.; Tian, G.F.; Chen, D.F. Neutron Texture Diffractometer at China Advanced Research Reactor. Mater. Sci. Forum 2014, 777, 71–77. [Google Scholar] [CrossRef] [Green Version]
- Xu, P.G.; Tomota, Y.; Suzuki, H.; Suzuki, T.; Machiya, S.; Yin, F.X. Bulk Texture Measurement of Interstitial-Free Annealed Steel Using Gaussian Integrated Intensities of Neutron Diffraction Spectra. Mater. Trans. 2008, 49, 2033–2039. [Google Scholar] [CrossRef]
- Bunge, H.J.; Wenk, H.R.; Pannetier, J. Neutron Diffraction Texture Analysis Using a 2θ-Position Sensitive Detector. Textures Microstruct. 1982, 5, 153–170. [Google Scholar] [CrossRef] [Green Version]
- Juul Jensen, D.; Kjems, J.K. Apparatus for Dynamical Texture Measurements by Neutron Diffraction Using a Position Sensitive- Detector. Textures Microstruct. 1983, 5, 239–251. [Google Scholar] [CrossRef] [Green Version]
- Zhang, J.; Kisi, E.H.; Kirstein, O. Quantitative neutron diffraction texture measurement applied to α-phase alumina and Ti3AlC2. J. Appl. Crystallogr. 2011, 44, 1062–1070. [Google Scholar] [CrossRef]
- Brokmeier, H.-G.; Gan, W.M.; Randau, C.; Völler, M.; Rebelo-Kornmeier, J.; Hofmann, M. Texture analysis at neutron diffractometer STRESS-SPEC. Nucl. Instrum. Methods Phys. Res. Sect. Accel. Spectrometers Detect. Assoc. Equip. 2011, 642, 87–92. [Google Scholar] [CrossRef] [Green Version]
- Wenk, H.-R.; Lutterotti, L.; Vogel, S. Texture analysis with the new HIPPO TOF diffractometer. Nucl. Instrum. Methods Phys. Res. Sect. Accel. Spectrometers Detect. Assoc. Equip. 2003, 515, 575–588. [Google Scholar] [CrossRef]
- Xu, P.G.; Harjo, S.; Ojima, M.; Suzuki, H.; Ito, T.; Gong, W.; Vogel, S.C.; Inoue, J.; Tomota, Y.; Aizawa, K.; et al. High stereographic resolution texture and residual stress evaluation using time-of-flight neutron diffraction. J. Appl. Crystallogr. 2018, 51, 746–760. [Google Scholar] [CrossRef]
- Xu, P.G.; Harjo, S.; Akita, K.; Hoshikawa, A.; Ishigaki, T.; Hayashi, M.; Minemura, T. Reliability of rapid bulk texture measurement using iMATERIA time-of flight neutron diffractometer. CAMP-ISIJ 2015, 28, 242. [Google Scholar]
- Xu, P.G.; Ikeda, Y.; Hakoyama, T.; Takamura, M.; Otake, Y.; Suzuki, H. In-house texture measurement using a compact neutron source. J. Appl. Crystallogr. 2020, 53, 444–454. [Google Scholar] [CrossRef] [Green Version]
- Léon, F.; Chateigner, D.; Ouladdiaf, B.; Richard, D. Quantitative texture analysis on D19 using the new 120° curved area PSD. In 2006 Annual Report; Institut Laue Langevin: Grenoble, France, 2006; pp. 92–93. [Google Scholar]
- Garbe, U.; Kirstein, O.; Studer, A.; Luzin, V.; Liss, K.D. Texture and Strain Experiments at OPAL. Mater. Sci. Forum 2010, 638–642, 2823–2828. [Google Scholar] [CrossRef]
- Studer, A.J.; Hagen, M.E.; Noakes, T.J. Wombat: The high-intensity powder diffractometer at the OPAL reactor. Phys. B Condens. Matter 2006, 385–386 Pt 2, 1013–1015. [Google Scholar] [CrossRef]
- Elcombe, M. Neutron Scattering at HIFAR—Glimpses of the Past. Quantum Beam Sci. 2017, 1, 5. [Google Scholar] [CrossRef] [Green Version]
- Simons, H.; Daniels, J.E.; Studer, A.J.; Jones, J.L.; Hoffman, M. Measurement and analysis of field-induced crystallographic texture using curved position-sensitive diffraction detectors. J. Electroceram. 2014, 32, 283–291. [Google Scholar] [CrossRef]
- Liss, K.-D.; Hunter, B.; Hagen, M.; Noakes, T.; Kennedy, S. Echidna—The new high-resolution powder diffractometer being built at OPAL. Phys. B Condens. Matter 2006, 385–386, 1010–1012. [Google Scholar] [CrossRef]
- Könnecke, M.; Akeroyd, F.A.; Bernstein, H.J.; Brewster, A.S.; Campbell, S.I.; Clausen, B.; Cottrell, S.; Hoffmann, J.U.; Jemian, P.R.; Männicke, D.; et al. The NeXus data format. J. Appl. Crystallogr. 2015, 48, 301–305. [Google Scholar] [CrossRef] [PubMed] [Green Version]
- Busing, W.R.; Levy, H.A. Angle calculations for 3- and 4-circle X-ray and neutron diffractometers. Acta Crystallogr. 1967, 22, 457–464. [Google Scholar] [CrossRef]
- Ahmed, F.U.; Tanaka, I.; Niimura, N. Performance of a multi-wavelength monochromator system for neutron single-crystal and powder diffraction. J. Appl. Crystallogr. 2000, 33, 291–295. [Google Scholar] [CrossRef] [Green Version]
Figure 1.
(a) Structural characteristics of the multilayered steel (black: martensite (M); gray: austenite (A)) along the thickness direction in one sheet, (b) microstructure morphology and grain orientation characteristics of martensite–austenite multilayered steel sheet [31].
Figure 1.
(a) Structural characteristics of the multilayered steel (black: martensite (M); gray: austenite (A)) along the thickness direction in one sheet, (b) microstructure morphology and grain orientation characteristics of martensite–austenite multilayered steel sheet [31].

Figure 2.
Reciprocal lattice with zone axis [10] of a single crystal germanium (115) cut, employed as a monochromator for WOMBAT, where the black points with red circles stand for the basic primary reflections and those without red circles designate forbidden reflections: when the take-off angle 2θM = 90° was set, the obtained incident beam wavevector and wavelength were k115 = 4.0811 Å−1 and λ115 = 1.5396 Å; when the crystal was rotated relatively along its zone axis about 9.446°, −4.371°, or −6.863° the corresponding wavenumbers and wavelengths were k113 = 2.6049 Å−1, k117 = 5.6090 Å−1, or k119 = 7.1554 Å−1 and λ113 = 2.4125 = Å, λ117 = 1.1204 Å, or λ119 = 0.8783 Å, respectively; the incident intensity of the latter, however, was very low because of the cut-off of the thermal spectrum, and practically unimportant.

Figure 3.
(a) Layout of WOMBAT, and (b) illustration of a two-dimensional cylindrical position-sensitive detector and the axis convention of an arbitrary pixel P(i, j) → P(x, y, z) → P(2θ,η) for both Cartesian lab space and angular coordinate systems, here at an offset angle of 2Θ0 = 29.4°. (i, j) are the channel numbers (ChV, ChH) of an arbitrary pixel position along the vertical and horizontal directions, respectively.

Figure 4.
WOMBAT detector maps for the two selected settings, k1 = 4.08 Å−1, 2Θ0 = 16.0° (left) and k2 = 2.61 Å−1, 2Θ0 = 29.4° (right), representing contour lines of true 2θ, azimuth η, and scattering vector Q. The contour maps are superimposed on various actual detector images showing different 2D diffraction patterns obtained from the texture measurements of the investigated steel, and demonstrating intensity variations on the Debye–Scherrer rings, as indicated in the square boxes. Indexing of the h, k, l reflections is given in Figure 5.

Figure 5.
Neutron diffractograms integrated over all orientations for incident wavenumbers k1 = 4.08 Å−1 and k2 = 2.61 Å−1, together with time-of-flight data acquired data at TAKUMI for comparison of instrumental resolution. The intensity scale of each neutron diffractogram was simply normalized according to its 110 reflection of martensite layers in the referred steel for easy comparison of peak overlapping.

Figure 6.
Experimental pole figures of γ-111 in textured martensite–austenite multilayered steel. (a): Open ○ and solid ● markers show orientation sampling coverage at large and small wavenumbers, k1 = 4.08 Å−1 and k2 = 2.61 Å−1, respectively. (b,d): Experimental sampled values at refined peak position. (c): Recalculated pole figure of refined texture on dual wavenumber complete dataset.

Figure 7.
Line-plots for the measured diffractograms (lower half) and their Rietveld fitted profiles (upper half) of the multilayered steel sheets obtained by combined MAUD–Rietveld texture analysis. (a) at short wavelength λ1 = 1.54 Å, large wavenumber k1 = 4.08 Å−1; (b) at long wavelength λ2 = 2.41 Å, small wavenumber k2 = 2.61 Å−1.


Figure 8.
Reconstructed pole figures of martensite–austenite multilayered steel analyzed using the neutron diffractograms obtained with multiple wavelengths, λ1 = 1.54 Å, k1 = 4.08 Å−1, and λ2 = 2.41 Å, k2 = 2.61 Å−1: (a) Martensite layers, minimum pole distribution density Imin = 0.16 multiples of mean random distribution (m.r.d.), maximum pole distribution density Imax = 2.98 m.r.d.; (b) Austenite layers, Imin = 0.14 m.r.d., Imax = 3.35 m.r.d.

Figure 9.
Comparison of orientation density function (ODF) at φ2 = 45° section of martensite layers in multilayered steel obtained at a kernel resolution of 5°: (a) WOMBAT angle dispersive neutron diffraction, Rietveld texture analysis, k1 = 4.08 Å−1; (b) WOMBAT dual wavenumber angle dispersive neutron diffraction, Rietveld texture analysis, k1 = 4.08 Å−1 and k2 = 2.61 Å−1. (c) TAKUMI time-of-flight neutron diffraction, Rietveld texture analysis [31]; (d) iMATERIA time-of-flight neutron diffraction, Rietveld texture analysis [32]; (e) RESA-2 angle-dispersive neutron diffraction with 1-D position-sensitive detector, single peak fitting [23]; (f) MUSASI-L angle dispersive neutron diffraction with a single tube detector, background-corrected diffraction intensity [23].


Publisher’s Note: MDPI stays neutral with regard to jurisdictional claims in published maps and institutional affiliations. |
© 2021 by the authors. Licensee MDPI, Basel, Switzerland. This article is an open access article distributed under the terms and conditions of the Creative Commons Attribution (CC BY) license (https://creativecommons.org/licenses/by/4.0/).
Share and Cite
MDPI and ACS Style
Xu, P.; Liss, K.-D. Multiple Wavelengths Texture Measurement Using Angle Dispersive Neutron Diffraction at WOMBAT. Quantum Beam Sci. 2021, 5, 11. https://0-doi-org.brum.beds.ac.uk/10.3390/qubs5020011
AMA Style
Xu P, Liss K-D. Multiple Wavelengths Texture Measurement Using Angle Dispersive Neutron Diffraction at WOMBAT. Quantum Beam Science. 2021; 5(2):11. https://0-doi-org.brum.beds.ac.uk/10.3390/qubs5020011
Chicago/Turabian StyleXu, Pingguang, and Klaus-Dieter Liss. 2021. "Multiple Wavelengths Texture Measurement Using Angle Dispersive Neutron Diffraction at WOMBAT" Quantum Beam Science 5, no. 2: 11. https://0-doi-org.brum.beds.ac.uk/10.3390/qubs5020011