Article

Simulation of Two-Dimensional Images for Ion-Irradiation Induced Change in Lattice Structures and Magnetic States in Oxides by Using Monte Carlo Method

The Wakasa Wan Energy Research Center (WERC), 64-52-1 Nagatani, Tsuruga, Fukui 914-0192, Japan
*
Author to whom correspondence should be addressed.
Quantum Beam Sci. 2021, 5(2), 13; https://0-doi-org.brum.beds.ac.uk/10.3390/qubs5020013
Submission received: 9 March 2021 / Revised: 5 May 2021 / Accepted: 10 May 2021 / Published: 13 May 2021

Abstract

:
A Monte Carlo method was used to simulate the two-dimensional images of ion-irradiation-induced change in lattice structures and magnetic states in oxides. Under the assumption that the lattice structures and the magnetic states are modified only inside the narrow one-dimensional region along the ion beam path (the ion track), and that such modifications are affected by ion track overlapping, the exposure of oxide targets to spatially random ion impacts was simulated by the Monte Carlo method. Through the Monte Carlo method, the evolutions of the two-dimensional images for the amorphization of TiO2, the lattice structure transformation of ZrO2, and the transition of magnetic states of CeO2 were simulated as a function of ion fluence. The total fractions of the modified areas were calculated from the two-dimensional images. They agree well with the experimental results and those estimated by using the Poisson distribution functions.

1. Introduction

It is well known that, in a lot of polymers, the energetic ion irradiation and the subsequent chemical etching produce one-dimensional holes with small diameters [1]. Resultant perforated membranes have been used as filters for small particles [1,2]. In some ceramics irradiated with swift heavy ions, one-dimensional areas, in which the lattice structures and the physical properties are strongly modified, are produced along the ion beam path. Such one-dimensional structures are called “ion-tracks” [3]. The ion-tracks originate from the energetic ion induced high-density electronic excitation, and their production mechanisms have been explained by using the thermal spike models [4,5,6] and by the Coulomb explosion model [7,8,9]. A lot of studies have been performed in order to investigate the individual ion-track structures and their dependence on the electronic stopping power, Se, of the irradiating ions [10,11,12,13,14,15]. The effects of the ion-track overlapping on lattice structures of target materials, which appear for the high fluence irradiation, have also been investigated so far [10,16,17,18,19,20,21,22].
Ishikawa et al. have explained the ion track overlapping effect on the TiO2 amorphization by using the binomial distribution function [23]. In our recent study, we analyzed the ion-track overlapping effect on the magnetization of CeO2 by using the Poisson distribution function, and succeeded in the reproduction of the experimentally observed ion-fluence dependence of the magnetization [24]. As shown later in this report, the Poisson distribution function, which is the approximated formula of the binomial distribution function under some extreme condition, can also describe the ion-track overlapping effects on the evolution of the amorphization in TiO2 and the lattice structure change in ZrO2. Such analytical methods, however, only reproduce the total fraction of the areas modified by high energy ions as a function of ion fluence. In the present study, we used the Monte Carlo method in order to simulate the two-dimensional images of the lattice structures and the magnetic states as a result of the ion -track overlapping for TiO2, ZrO2 and CeO2. The total fractions of the modified area were calculated from the two-dimensional images, and were compared with the experimental results and those estimated by using the Poisson distribution function.

2. Binomial and Poisson Distribution Functions for the Analysis of the Ion Track Overlapping Effect

The binomial distribution function,
f ( n , k , p ) = n ! k ! ( n k ) ! p k ( 1 p ) n k ,  
generally presents the discrete probability distribution of the number of successes, k, in a sequence of n independent trials, where p is the probability of the success and 1 − p, that of the failure for each trial. The paper of Ishikawa et al. [23] and our previous report [24] have shown that the probability of the ion-track overlapping can be described by the binomial distribution function. When the fluence of ions is Φ and the total area of the target is S0, the number of irradiating ions, n (=ΦS0) corresponds to the trial number. The ratio of the cross section of each ion track, S, to S0 (s = S/S0) and the number of track impacts, r, correspond to p and k in Equation (1), respectively. The probability of r times track impacts is given as
a ( n , r , s ) = n ! r ! ( n r ) ! s r ( 1 s ) n r
If the ion track overlapping is discussed for the unit irradiation area (S0 = 1 cm2), n is replaced by the ion fluence, Φ, and s is replaced by the track cross section itself, S. Then, the fraction of the area for the r times track impacts in the unit area of the target, A(Φ,r) is,
A ( Φ , r ) = Φ ! r ! ( Φ r ) ! S r ( 1 S ) Φ r   f o r   r = 1 , 2 , 3 , Φ
Although the dimensions of Φ and S are cm−2 and cm2 as experimental parameters, these parameters can be treated in Equation (3) and other equations in this paper as dimensionless.
For the usual irradiation experiments of the ion tracks in materials, as a value of Φ is very large and a value of S is very small, the binomial distribution function can be approximated by the following Poisson distribution function [25],
A ( Φ , r ) = ( Φ S ) r exp ( Φ S ) r !
We have confirmed that the result calculated by the Poisson distribution function (Equation (4)) is completely the same as that calculated by the binomial distribution function (Equation (3)) in the case of the irradiation studies referred in the present report [16,21,24]. Equation (4) will be used later for the comparison of the analytical result with that by the Monte Carlo simulation.

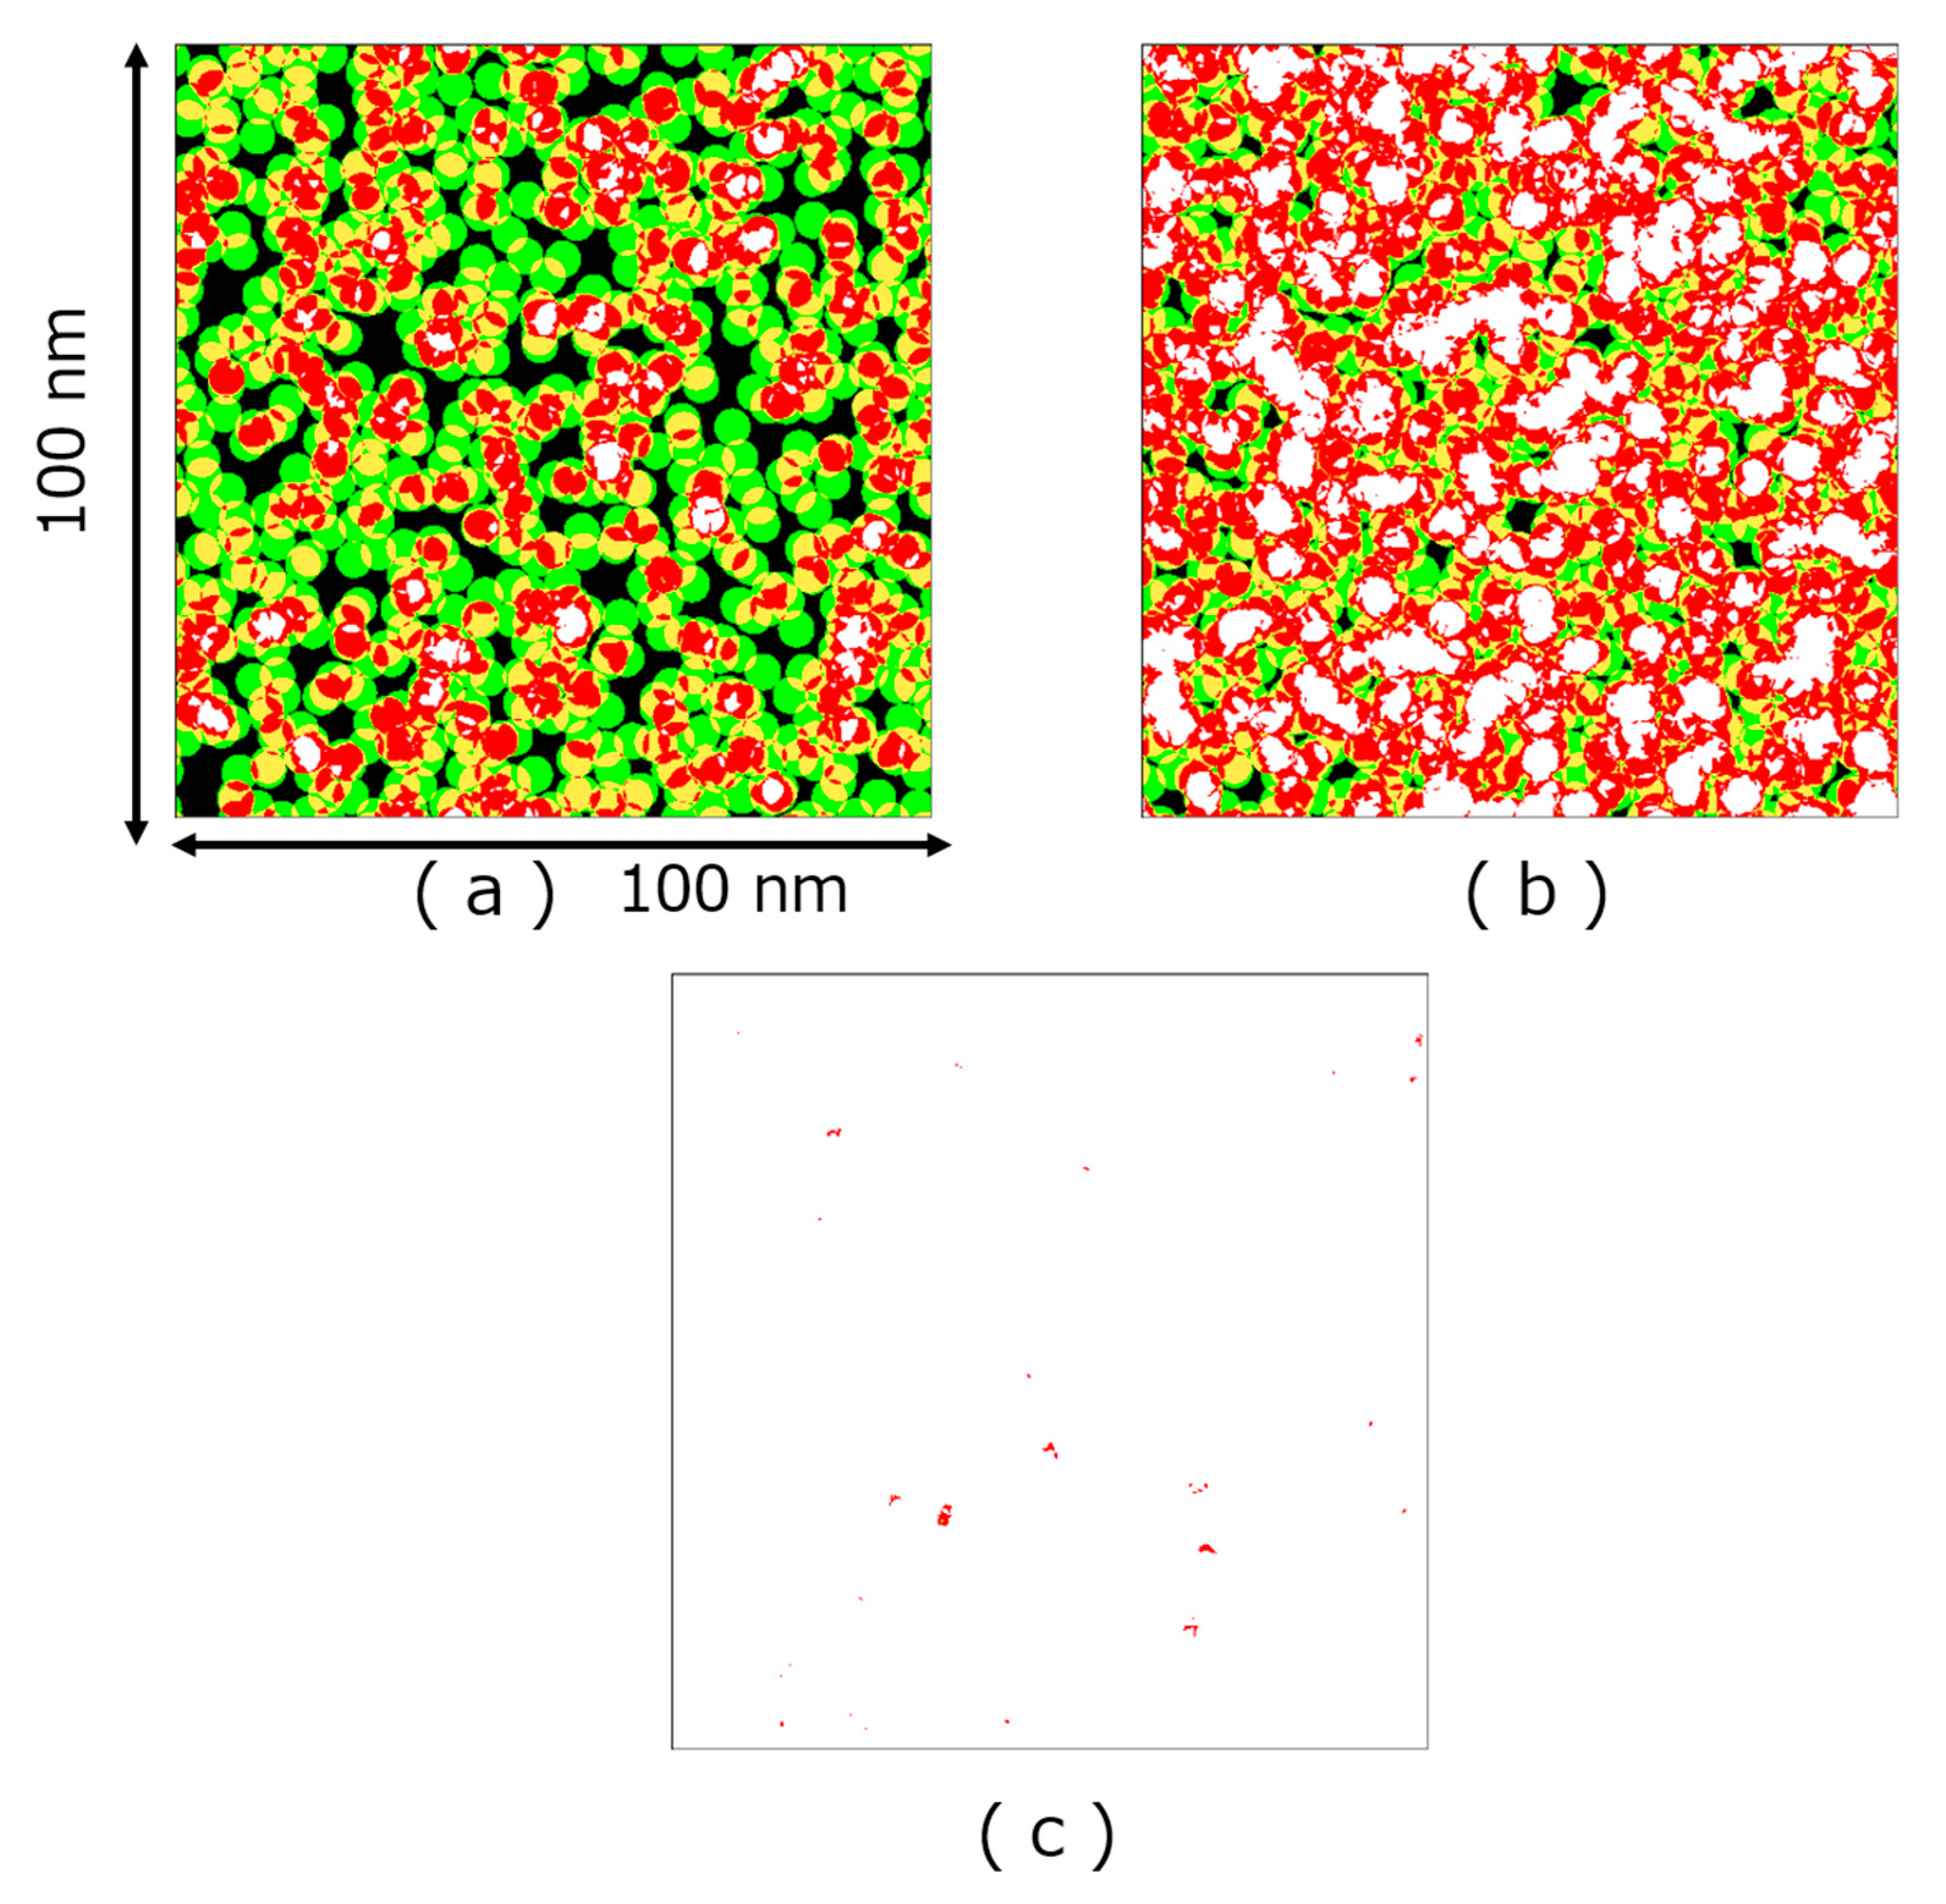
3. Monte Carlo Method for Two-Dimensional Imaging of Ion Track Overlapping Effect

We have developed the following Monte Carlo algorism for the present study. The target square for the Monte Carlo calculation consisted of 1000 × 1000 grid of cells. Its dimension was defined to be 100 nm × 100 nm throughout this work; a single impact on the target square was equivalent to the ion fluence of 1010 cm−2. The target was randomly bombarded with energetic ions until the ion fluence reached the given value, Φ .
Numbers of ion impacts for all cells were examined after every single bombardment to visualize the two-dimensional impact map and to calculate the fraction of ion overlapping area, A ( Φ , r ) for all the number of the impacts by the ion-track, r, to compare the results by using the Poisson distribution function. It is worth noting here that the analysis by using the Poisson distribution function ignores temporal decay and spatial distribution of an effect of an impact. Hence, these conditions can also be included in the Monte Carlo calculations.
All the Monte Carlo calculations were carried out with the homemade code written in LabVIEW 2019 (32 bit) for Windows.

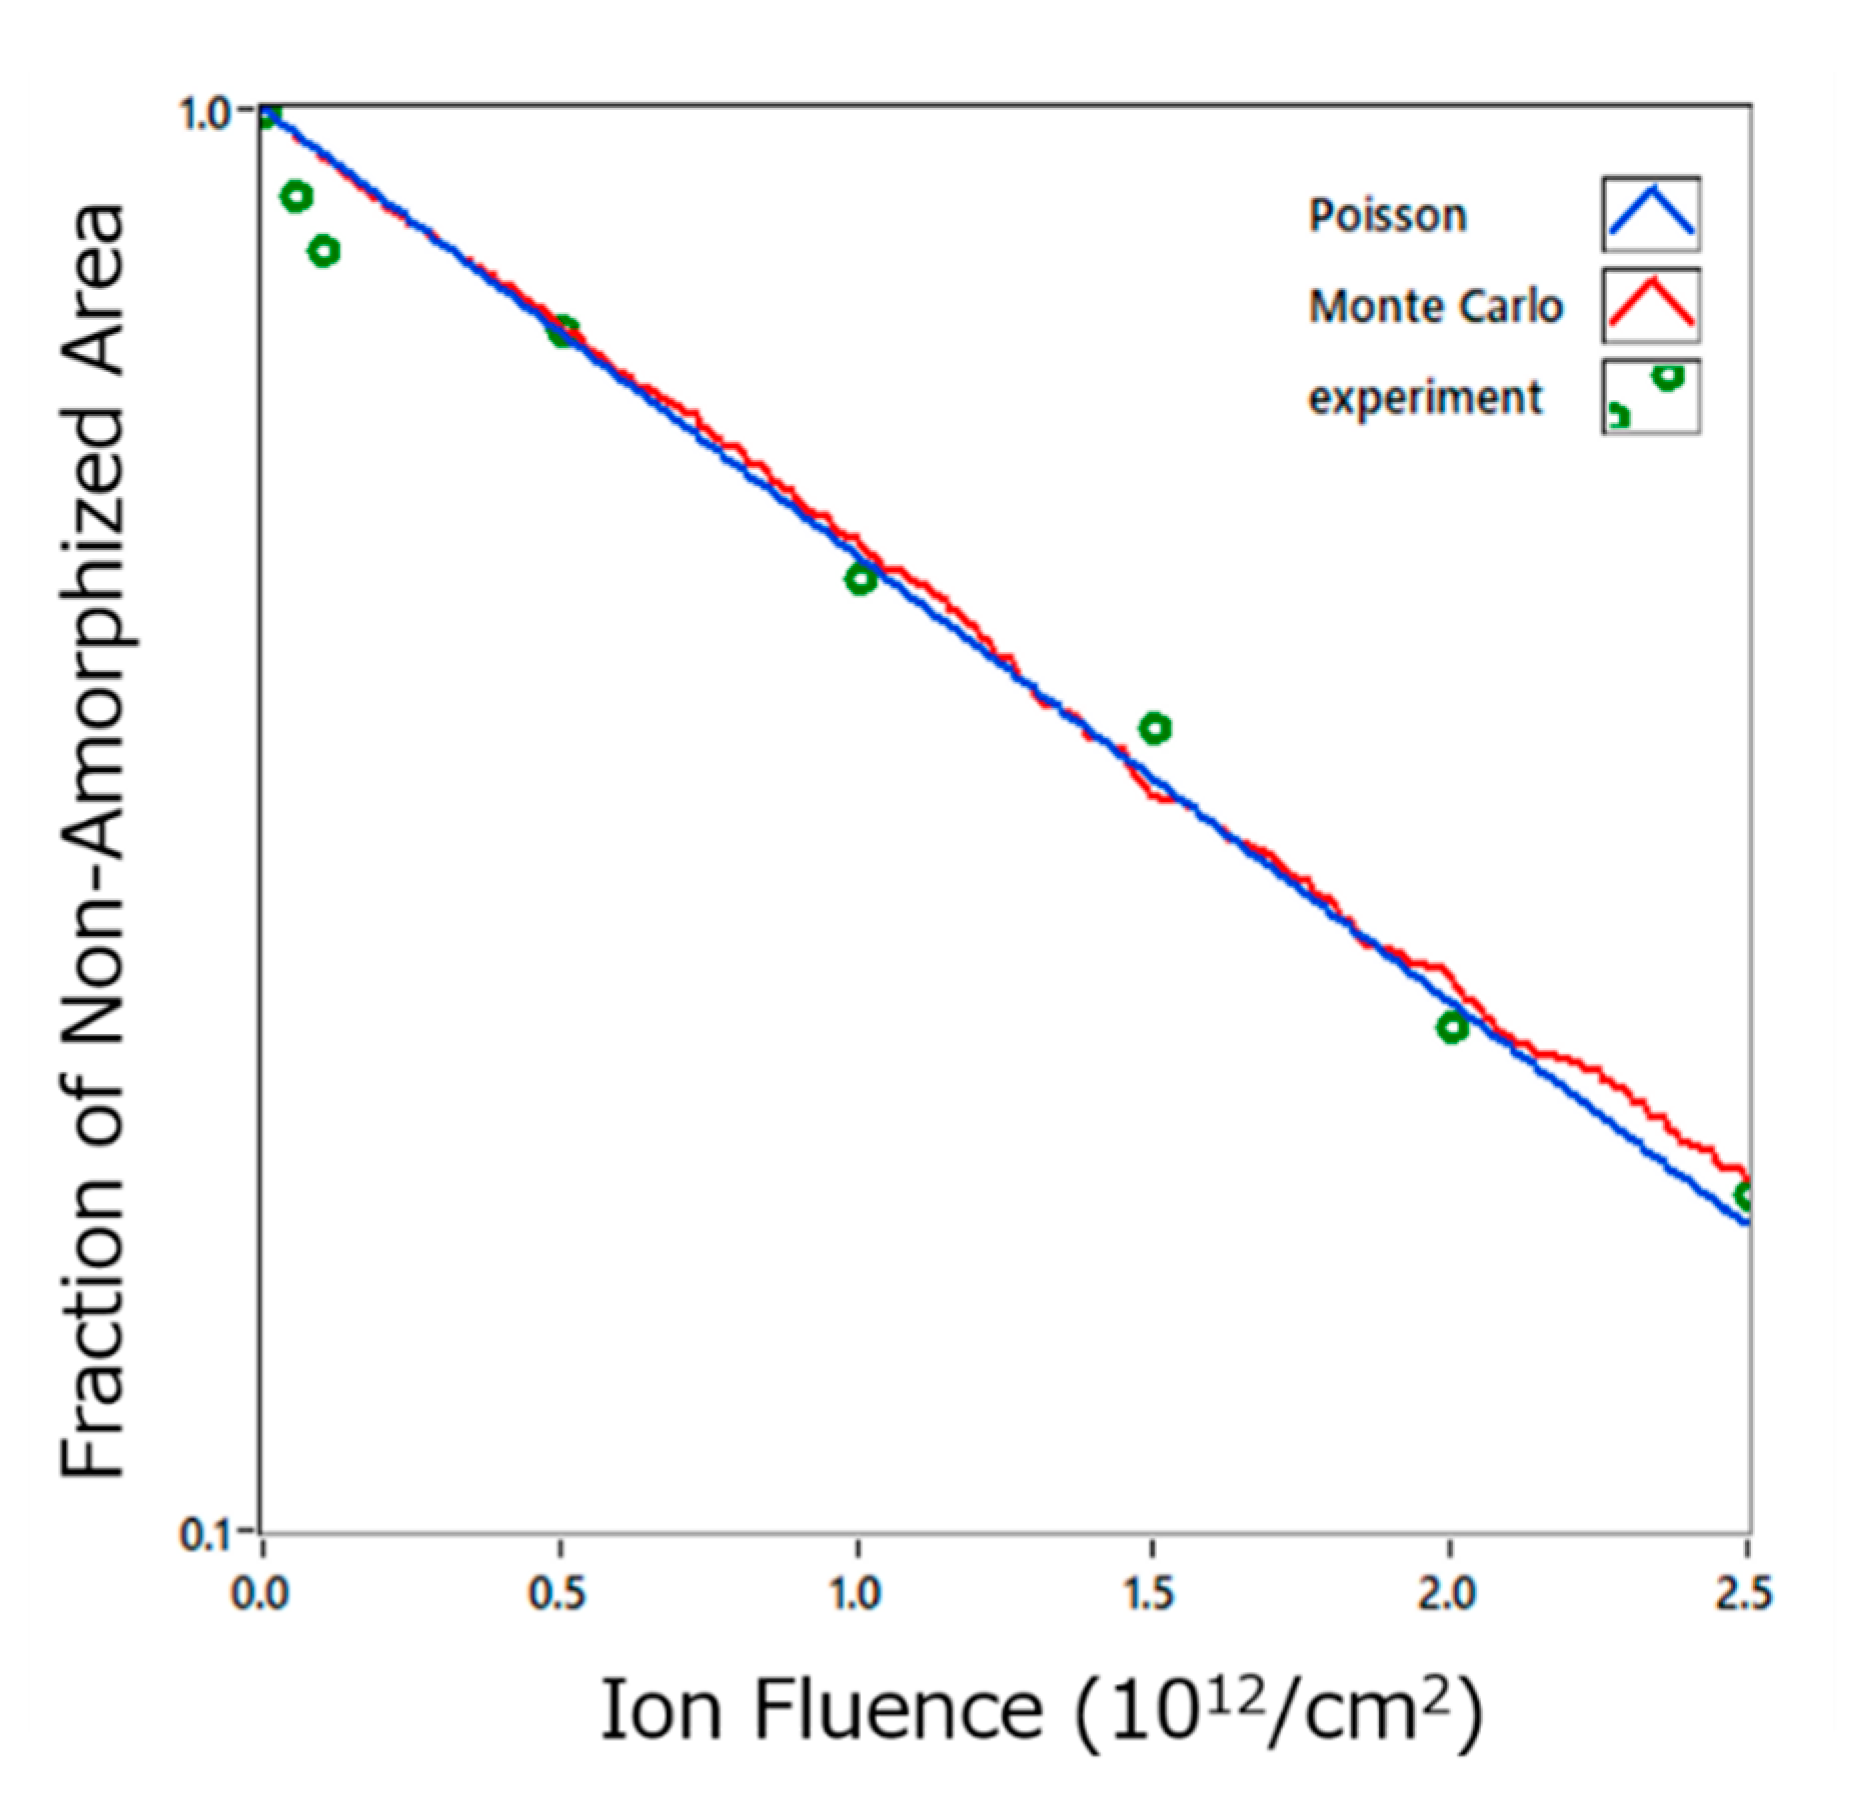
4. Results of the Monte Carlo Simulation and the Analysis Using the Poisson Distribution Function

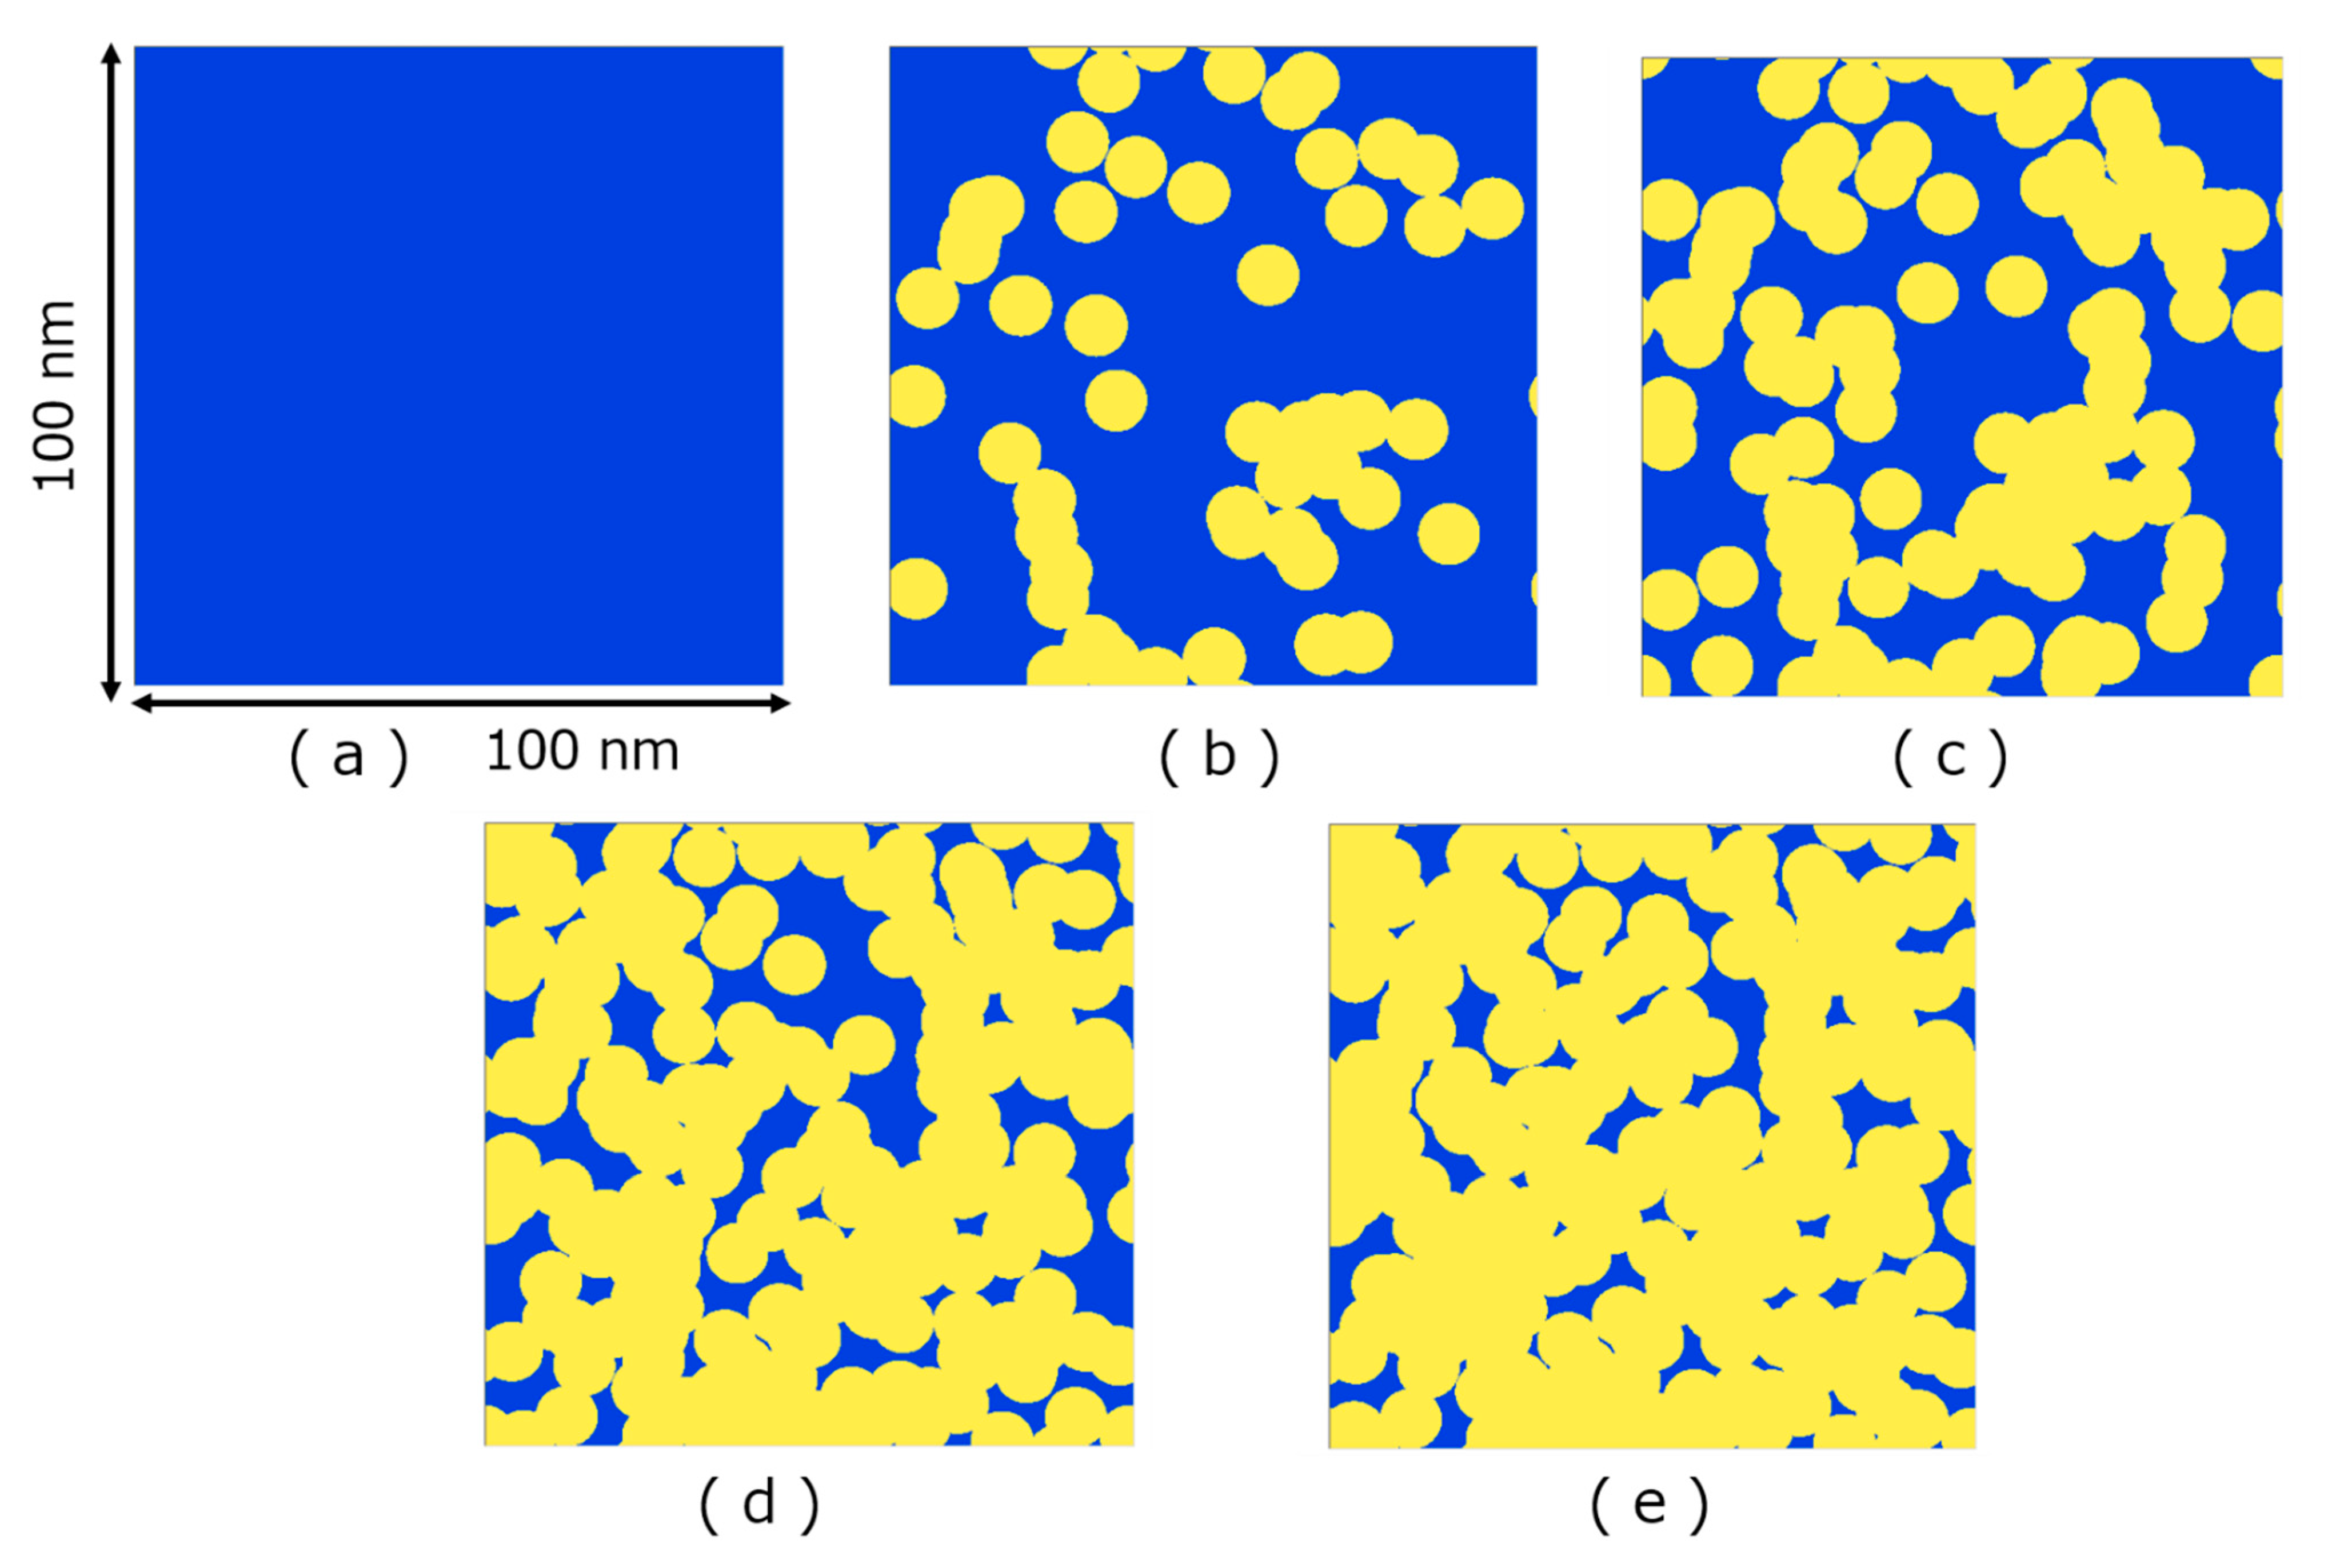
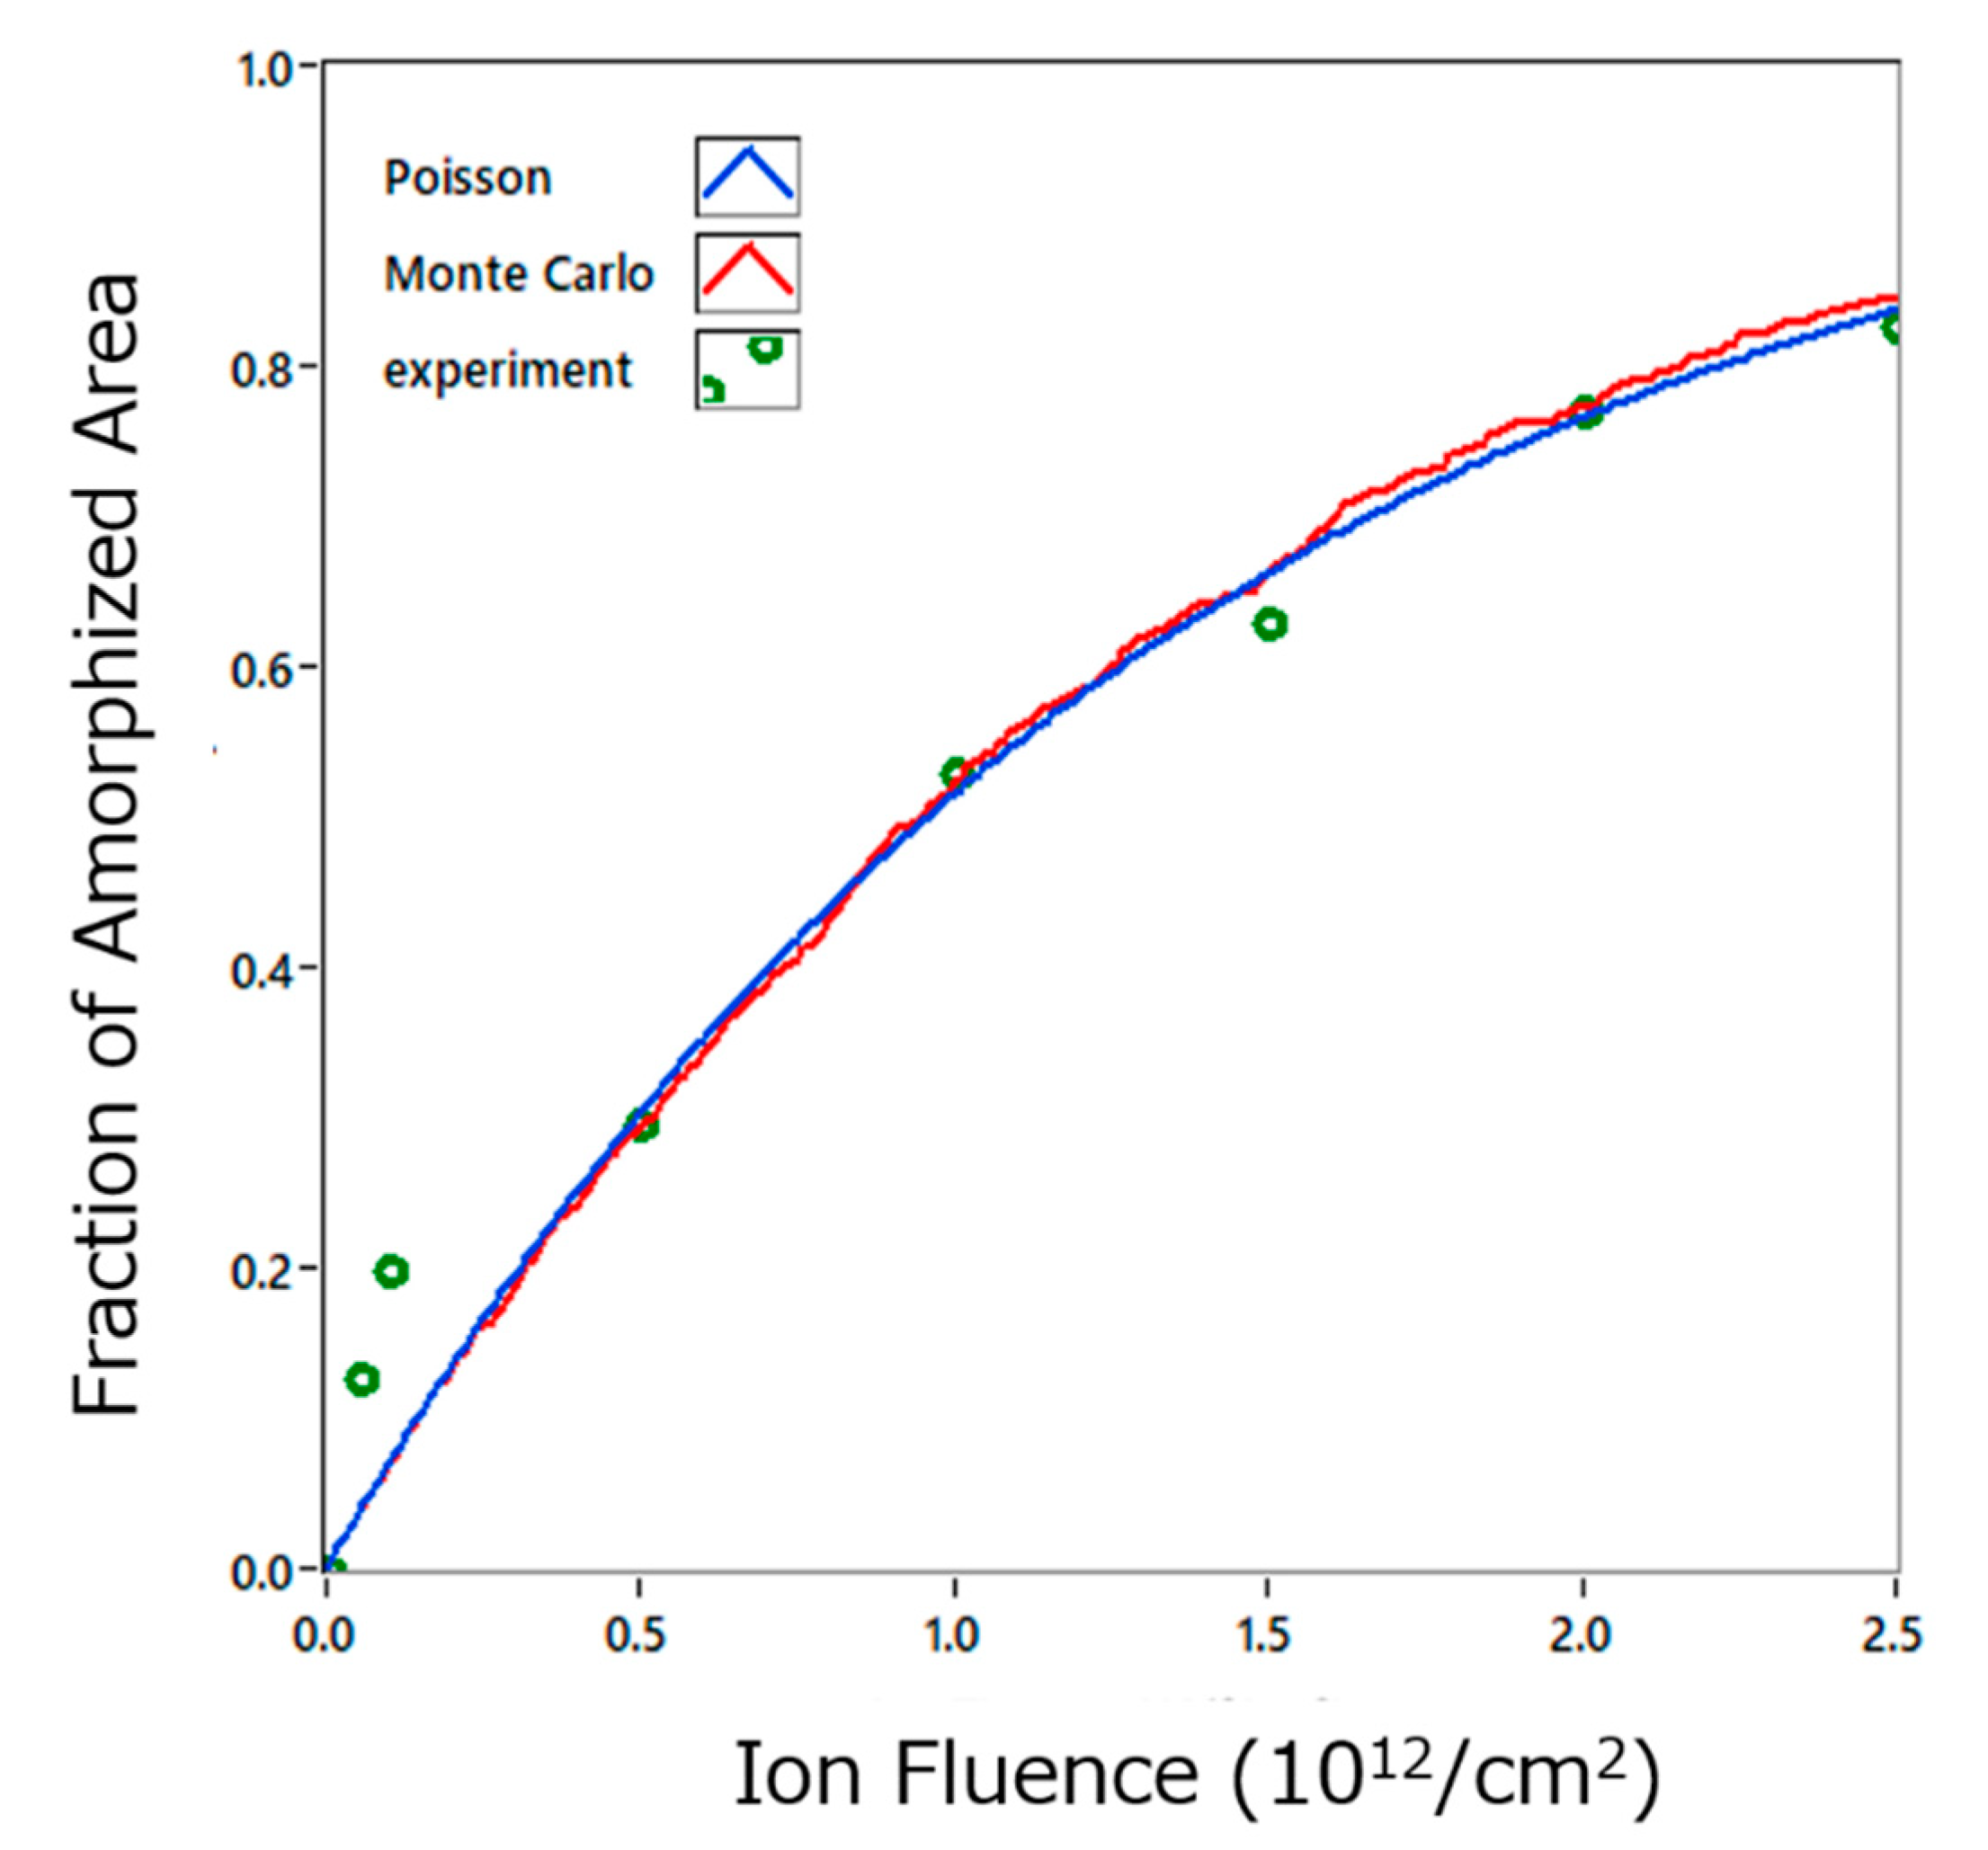
4.1. Amorphization of TiO2 by High Energy Heavy Ion Irradiation

Here, we refer the result of anatase TiO2 by Ishikawa et al. as an example of the ion irradiation induced amorphization [21]. They irradiated TiO2 films with 230 MeV Xe+15 ions and measured the x ray diffraction (XRD) spectra. They have shown that the XRD peak intensity decreases in an exponential manner as a function of ion fluence. This experimental result can be explained as a result of the overlapping of amorphous ion tracks. Along the ion beam path in TiO2, the crystal structure becomes amorphous, and the amorphous areas still remains amorphous irrespective of the number of impacts by ion-tracks. As only the non-amorphized area contributes to the x ray diffraction, the intensity of the XRD peak is proportional to the fraction of zero impact (r = 0) area, A ( Φ , 0 ) , which is not amorphized by the irradiation. By using Equation (4), the relative XRD peak intensity, I ( Φ ) / I ( 0 ) , is related to the ion-fluence, Φ , by the following function,
I ( Φ ) / I ( 0 ) = A ( Φ , 0 ) = exp ( S Φ )
or
ln ( I ( Φ ) / I ( 0 ) ) = ln A ( Φ , 0 ) = S Φ
where I ( 0 ) is the XRD peak intensity for the unirradiated target and I ( Φ ) , the XRD peak intensity after the irradiation with the fluence of Φ . From the slope of ln ( I ( Φ ) / I ( 0 ) ) Φ plot, the cross section of the ion track, S , has been determined as 72.3 nm2, which corresponds to the track diameter of 9.6 nm. Because the total fraction of amorphized and non-amorphized areas is unity, the fraction of the amorphized area is expressed as,
1 A ( Φ , 0 ) = 1 exp ( S Φ ) ,
which is well known as “the Poisson law”.
The above model that TiO2 sample is amorphized only inside the ion -track, and the amorphized region never contributes to the XRD diffraction seems to be too simple. The previous TEM (transmission electron microscope) observations, however, clearly show that just inside the ion-track in TiO2, the structure becomes amorphous, and outside the ion-track, the crystal structure is maintained [26,27]. The XRD peaks for TiO2 samples which are almost completely amorphized by high energy heavy ion irradiation are much smaller than for the unirradiated crystalline TiO2 and are scarcely observed [22]. These experimental results, therefore, justify the above model for the analysis of ion track overlapping in TiO2, and the fraction of amorphized area can be estimated by the decrease in XRD peak intensity.
The result of the Monte Carlo simulation for the Xe ion induced amorphization of TiO2 is shown in Figure 1. The figure represents the two-dimensional images of amorphized (yellow) and non-amorphized (blue) areas for the ion-fluences of 5 × 10¹¹, 1 × 10¹², 2 × 10¹² and 2.5 × 1012 cm−2. The track diameter is 9.6 nm which has been determined by the experiment.
Figure 2 shows the fraction of the non-amorphized area as a function of ion-fluence, which has been calculated from the two-dimensional images. The figure also shows the experimental result [21] and the result calculated using Equation (6). The result of the Monte Carlo simulation well agrees with the experimental result and that estimated by the Poisson distribution function. Figure 3 confirms that the ion fluence dependence of the fraction of the amorphous area is expressed by the Poisson law (Equation (7)).

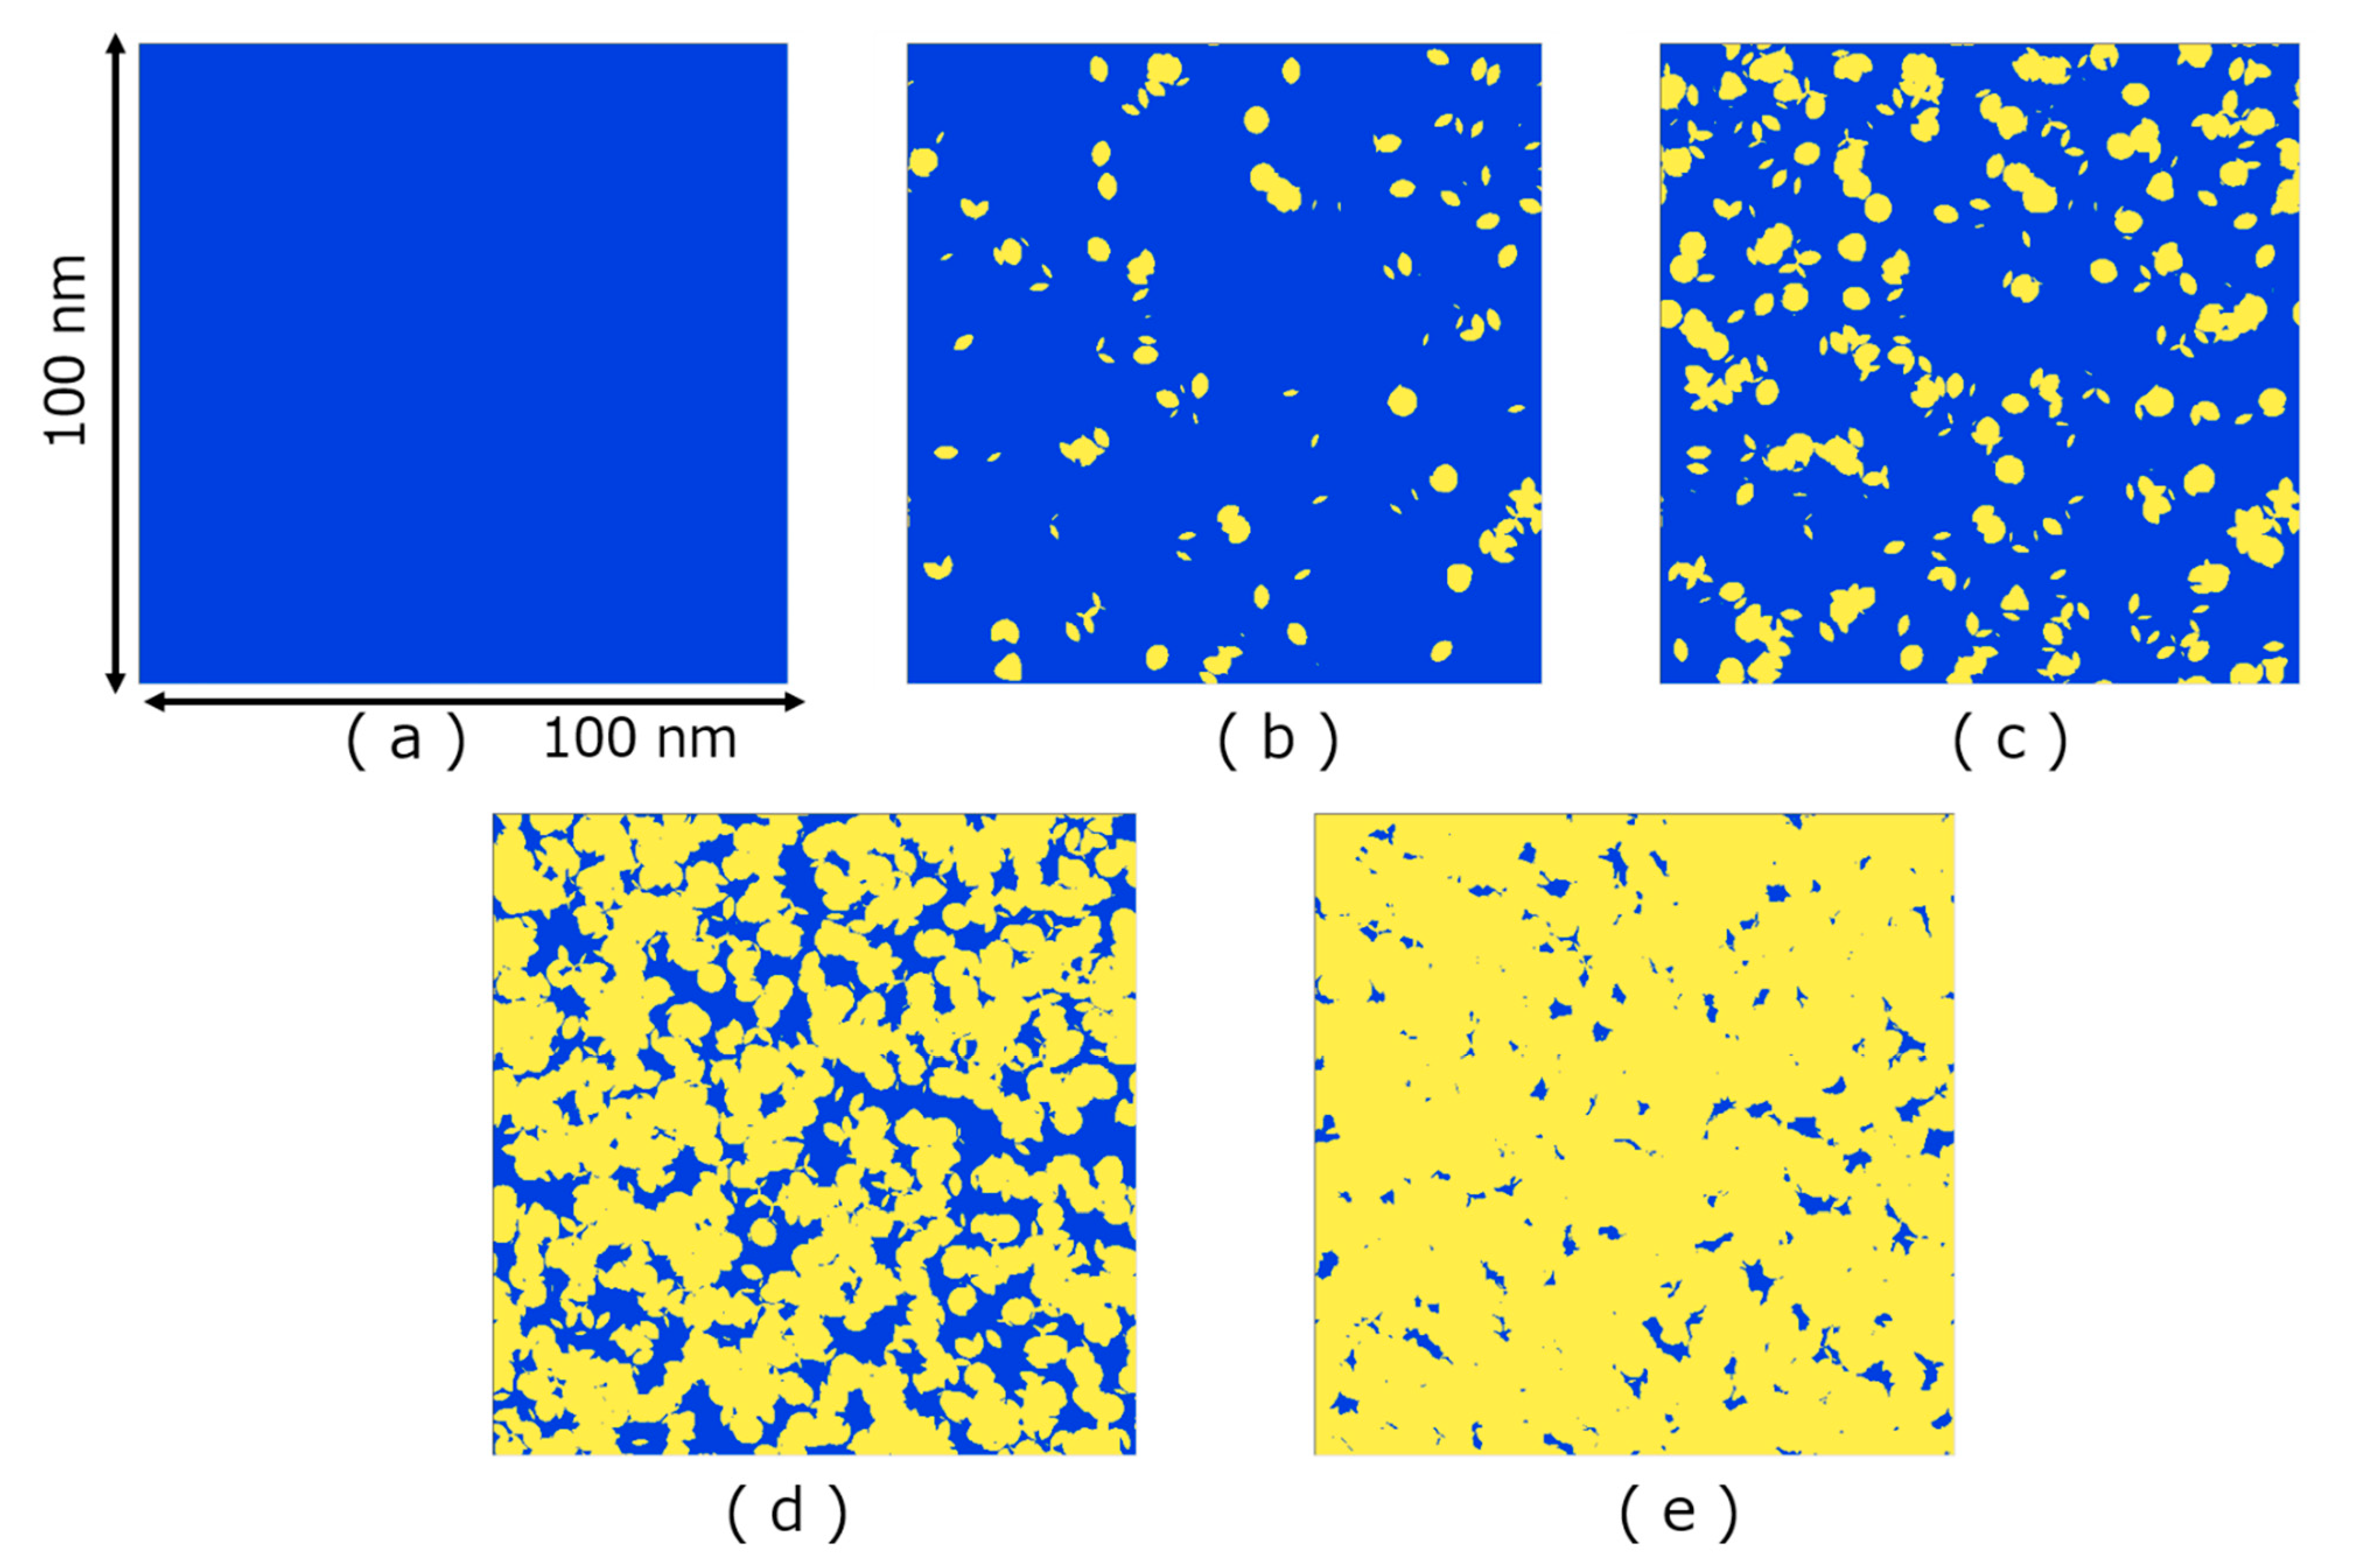
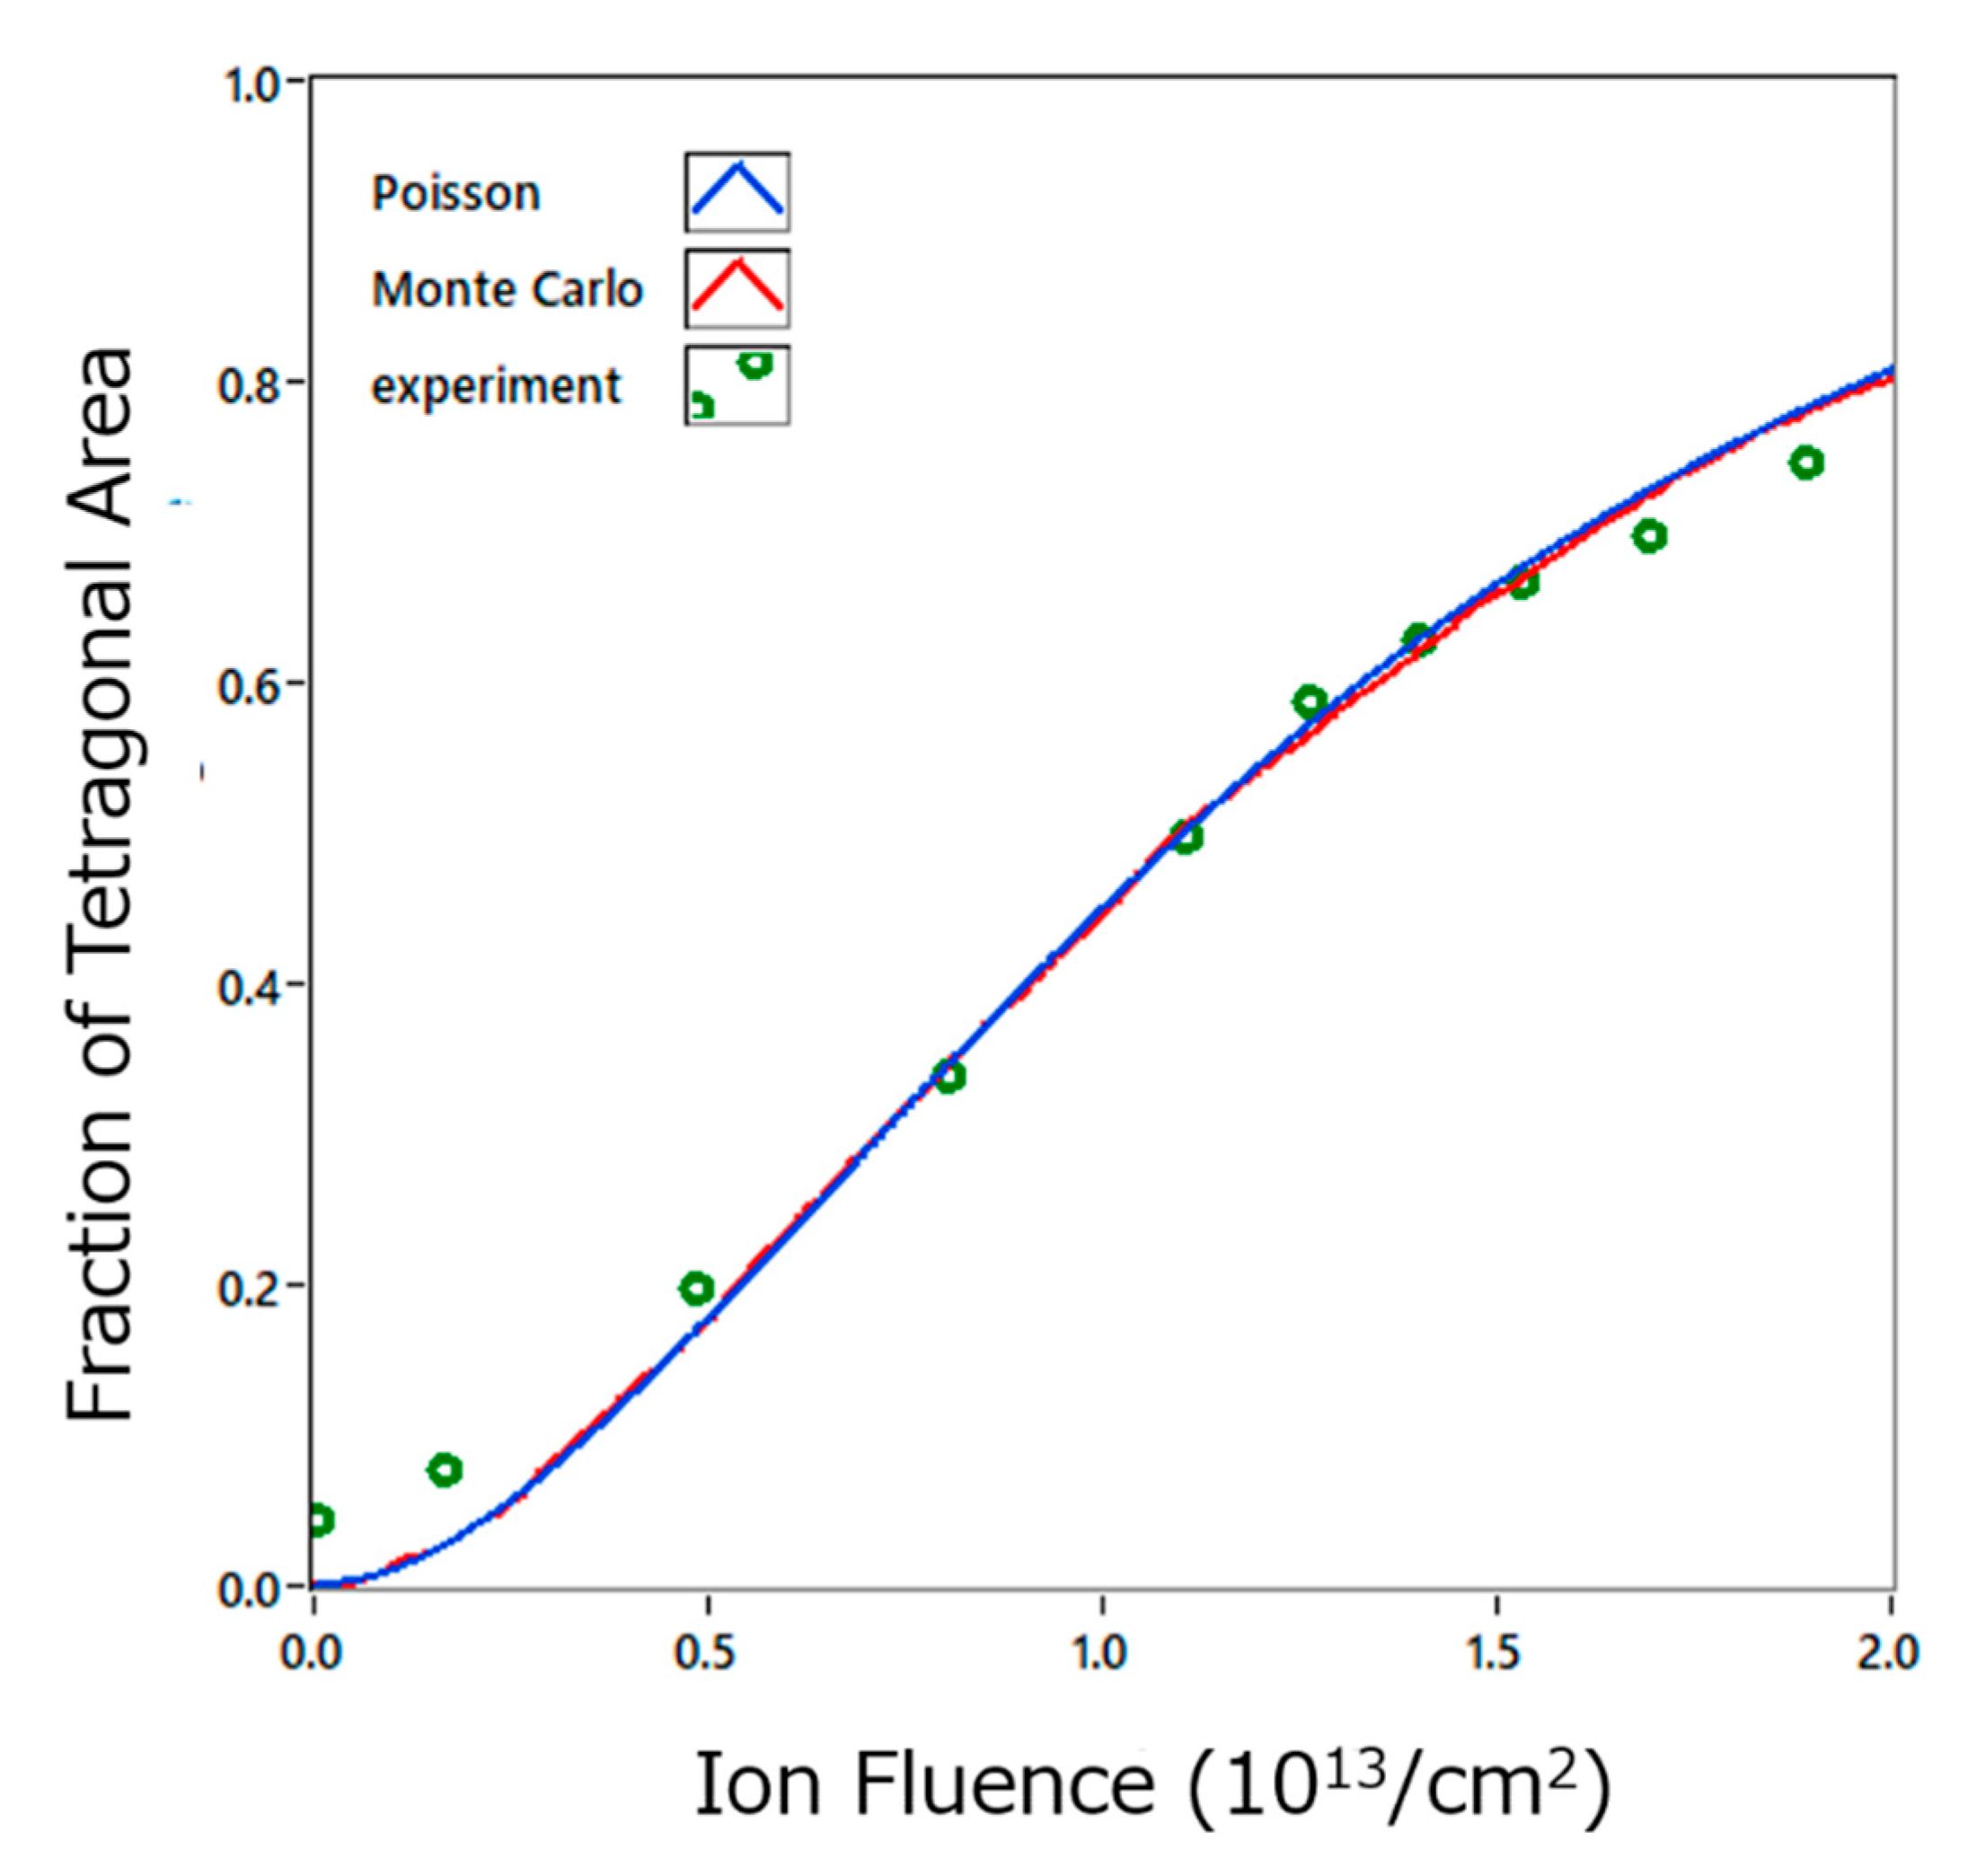
4.2. Lattice Structure Change of ZrO2 by High Energy Heavy Ion Irradiation

Next, one of the experimental results of the lattice structure transformation by high energy ion irradiation is referred. Benyagoub et al. irradiated monoclinic zirconia with 135 MeV Ni ions, and the lattice structures of the irradiated samples were characterized by XRD [16]. They have found that the lattice structure of monoclinic ZrO2 gradually changes to the tetragonal structure by the ion irradiation. They have also shown that the evolution of the fraction of the tetragonal phase with the ion fluence shows a sigmoidal shape. This experimental result suggests that only one impact of the ion track does not cause the lattice structure transformation, but two or more impacts of the ion tracks are needed for the lattice structure transformation. This phenomenon can be explained by using the Poisson distribution function (Equation (4)) as follows. Since the total fraction of areas which are affected and not affected by ion tracks is unity:
r = 0 Φ A ( Φ , r ) = A ( Φ , 0 ) + A ( Φ , 1 ) + r = 2 Φ A ( Φ , r ) = 1 .
According to Equation (4),
A ( Φ , 0 ) = exp ( S Φ )
and
A ( Φ , 1 ) = S Φ exp ( S Φ )
Therefore, the fraction of two or more impacted areas, or the area of the tetragonal structure is,
r = 2 Φ A ( Φ , r ) = 1 exp ( S Φ ) S Φ exp ( S Φ ) .
The result of the Monte Carlo simulation is shown in Figure 4 for the lattice structure transformation of ZrO2. The figure represents the two-dimensional images of monoclinic (blue) and tetragonal (yellow) areas for the ion-fluences of 2.5 × 10¹², 5 × 10¹², 1.5 × 10¹³ and 3 × 1013 cm−2. The track diameter is assumed to be 4.4 nm. This value was determined by the comparison of the experimental data and the result calculated by Equation (11).
Figure 5 shows the fraction of the tetragonal structure area as a function of ion-fluence, which has been calculated from the two-dimensional images. The figure also shows the experimental result and the result estimated using Equation (11). The result of the Monte Carlo simulation well agrees with the experimental result and that calculated by using the Poisson distribution function with the track cross section, S, of 1.5 × 10⁻¹³ cm2, or the track diameter of 4.4 nm. Benyagoub et al. have shown that the similar equation to Equation (11) can reproduce their experimental result for ZrO2 [16]. The equation used in ref. [16] was deduced through a quite complicated manner [28]. Meanwhile, in our case, Equation (11) can be simply given as an approximated formula of the binomial distribution function.

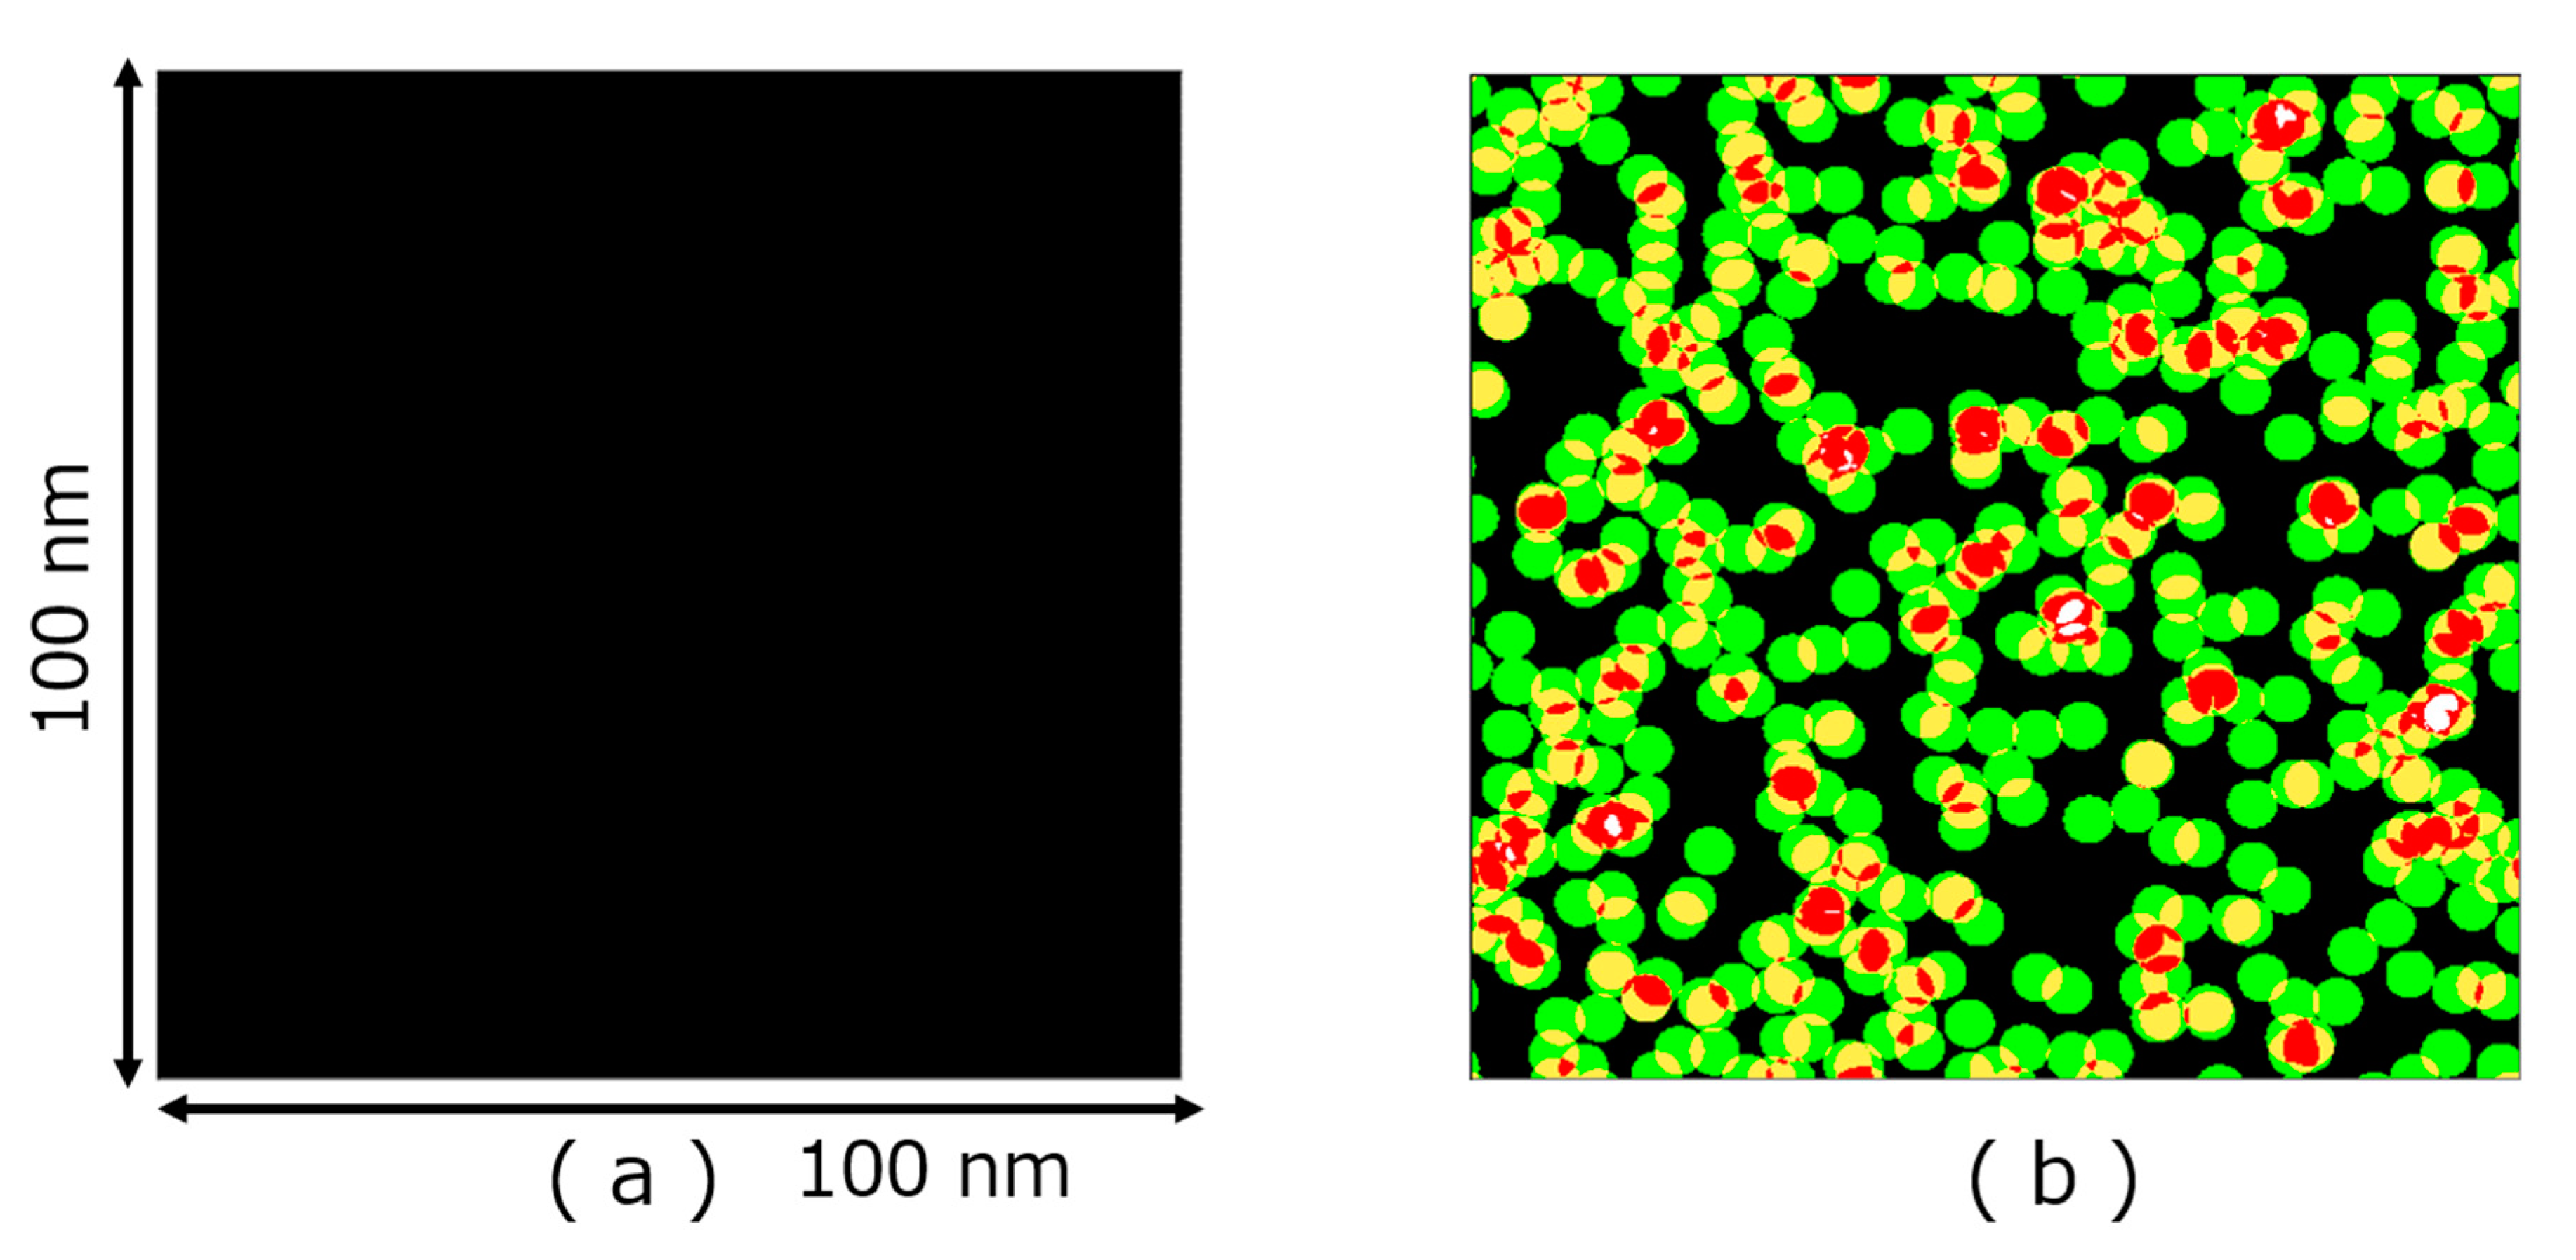
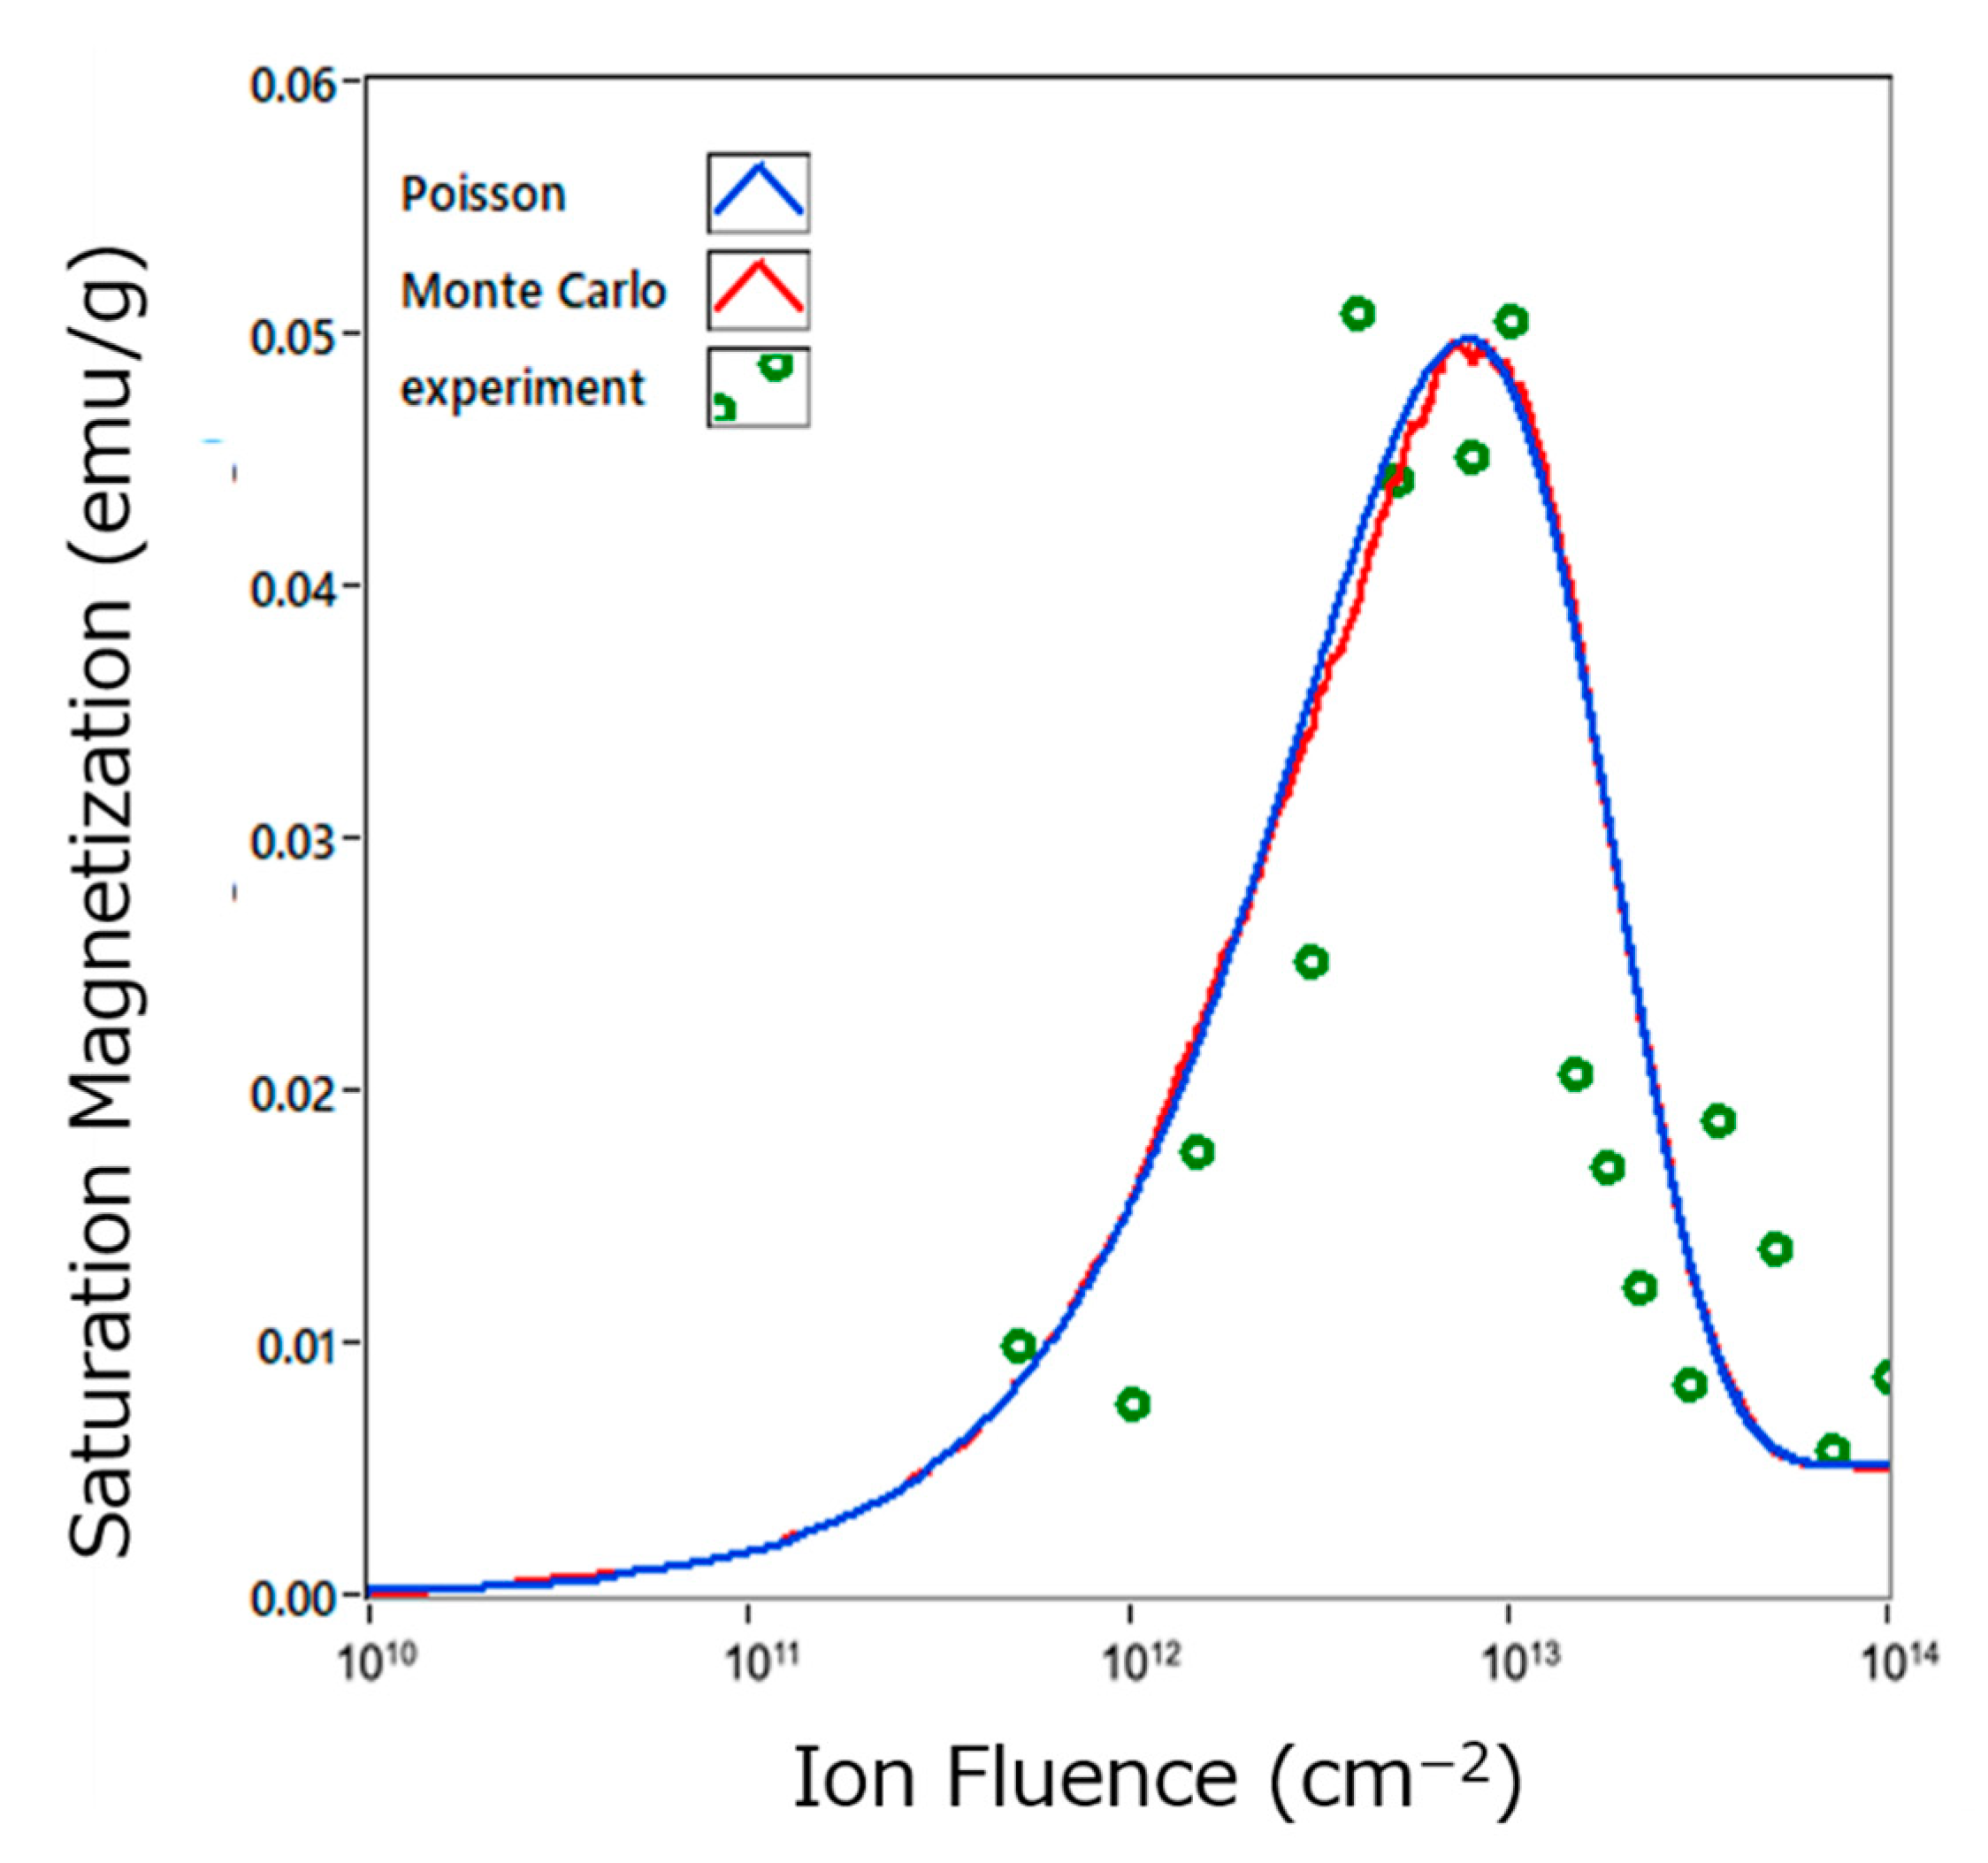
4.3. Change in Magnetic States of CeO2 by High Energy Heavy Ion Irradiation

Concerning the appearance of magnetism in CeO2 at room temperature, a lot of experimental and theoretical studies have been performed [29]. Although the mechanism of the appearance of the magnetism has never been fully clarified, previous studies have suggested that defects of O anions and Ce3+ state of cations somehow contribute to the magnetism of CeO2 [29]. The measurements of EXAFS (extended x-ray absorption fine structure) and XPS (X-ray photoelectron spectroscopy) using synchrotron radiation facilities have revealed that 200 MeV Xe ion irradiation induces the oxygen deficiency around Ce cations in CeO2, and the resultant change in valence state of cations from Ce4+ to Ce3+ [30,31]. The change in Ce valence state due to oxygen disorders has also been confirmed by the first principles calculation [32]. The SQUID (super quantum interference device) measurement shows that the irradiation with 200 MeV Xe ions induces the ferromagnetic state in CeO2 [24,33]. These experimental and theoretical results imply that the appearance of the magnetism is attributed to the magnetic moment of localized 4f electrons on Ce3+ cations. Takaki and Yasuda have shown by the TEM observations that 200 MeV Xe ion irradiation produces one-dimensional defective regions (ion-tracks) in CeO2 samples, and that only inside the ion-tracks, the arrangement of oxygen atoms is preferentially disordered [11]. Based on such previous results, we use the following model for the analysis of the ion-track overlapping effect on the magnetic state of Xe+14 ion irradiated CeO2. Only inside the ion track, disorders of oxygen atoms and the resultant Ce3+ valence state are produced, and the ferro magnetic state appears. Outside the ion track, the sample is still nonmagnetic. With increasing Xe ion fluence, arrangements of not only oxygen atoms, but also cerium atoms become disordered by the ion track overlapping, resulting in the decreases in magnetization [24,33]. The effect of the ion track overlapping on the magnetic states for CeO2 irradiated with 200 MeV Xe+14 ions is, therefore, more complicated than the cases of TiO2 or ZrO2. Our previous paper has shown that if the following effect of track overlapping on the saturation magnetization is assumed, the ion fluence dependence of the saturation magnetization calculated by using the Poisson distribution function well reproduces the experimental result [24]. The saturation magnetization is M0 = 0 emu/g, M1 = 0.1 emu/g, M2 = 0.05 emu/g, M3 = 0.025 emu/g and M4 = 0.005 emu/g for the non-impacted area (r = 0), one-impacted area (r = 1), two-impacted area (r = 2), three-impacted area(r = 3), and the area for four or more impacts (r > =4), respectively. From Equation (4), A ( Φ , r ) for r = 0, 1, 2, 3 and for r of 4 or more impacts, are given by,
A ( Φ , 0 ) = exp ( S Φ ) A ( Φ , 1 ) = ( S Φ ) exp ( S Φ ) A ( Φ , 2 ) = ( S Φ ) 2 2 exp ( S Φ ) A ( Φ , 3 ) = ( S Φ ) 3 6 exp ( S Φ ) A ( Φ , r > = 4 ) = 1 r = 0 3 A ( Φ , r )
and the irradiation induced saturation magnetization as a function of ion fluence is given as,
M ( Φ ) = M 1 A ( Φ , 1 ) + M 2 A ( Φ , 2 ) + M 3 A ( Φ , 3 ) + M 4 A ( Φ , r > = 4 )
Equation (13) will be used later for the comparison with the result of the Monte Carlo simulation.
The result of the Monte Carlo simulation is shown in Figure 6 and Figure 7 for the transition of the magnetic states of CeO2. The figure represents the two-dimensional images of areas having different saturation magnetization for the ion-fluence of 2.5 × 10¹², 5 × 10¹², 1.5 × 10¹³ and 3 × 1013 cm−2. The track diameter is 4.7 nm which has been determined by the experiment [24].
The correspondence relationship for colors in Figure 6 and Figure 7, the number of ion track impacts, and the saturation magnetization is shown in Table 1.
Figure 8 shows the saturation magnetization of CeO2 as a function of ion-fluence, which has been calculated from the two-dimensional images. The figure also shows the experimental result [24] and the result calculated using Equation (13). The result of the Monte Carlo simulation well agrees with the experimental result and that calculated by using the Poisson distribution function.

5. Discussion

In the previous section, by using the Monte Carlo method, we have simulated the two-dimensional images for the three kinds of the ion track overlapping effects on the oxides irradiated with high energy heavy ions. In the case of the amorphization of TiO2, as can be seen in Figure 1, the target is dotted with disk-shaped amorphized areas with the same diameter for small ion fluence, because only one impact of the ion-track can make a target amorphous. With increasing the ion fluence, the overlapping of amorphous tracks occurs more frequently, and for higher ion fluences, most part of the target becomes amorphous. For the crystal phase transformation of ZrO2, Figure 4 shows that the areas of the tetragonal phase, which are surrounded by the monoclinic area, appear for the small ion fluence. The tetragonal phase areas have various shapes, which are far from disk-shape. This is due to the fact that only one ion-track impact does not cause the crystal phase transformation, but two or more ion-track impacts are needed for the crystal phase transformation. As can be seen in Figure 1, Figure 4, Figure 6, and Figure 7, the overlapping of ion -tracks leads to the modulated lattice and magnetic structures with a nanometer scale. Therefore, the Monte Carlo simulation provides a good first approach for understanding the nanometer-sized two-dimensional structures of oxides, which are produced by the overlapping of the ion-tracks. Moreover, the complementary usage of the Monte Carlo simulation with some experimental techniques of precise imaging, such as TEM, AFM (atomic force microscope), MFM (magnetic force microscope), and PEEM (photo-emission electron microscope), will also be useful in order to promote the study of the effect of high energy ion irradiation in materials.
In the present report, we have only mentioned the lattice structure and magnetic property changes by the ion-track overlapping. If the electrical conductivity appears inside the ion–tracks in insulators, and the overlapping of the ion–tracks affects their electrical conductivity, the formation of continuous electron paths or the conducting network will drastically change the macroscopic electrical property of the insulators. The two-dimensional images of ion track overlapping, which are simulated by the Monte Carlo method, may also be helpful for the understanding of such the percolation behavior in ion-irradiated insulators.
The ion-track overlapping effects have been analyzed so far by using complicated manners [20,28,34]. In the present study, the Monte Carlo method has confirmed that the effects of the ion-track overlapping can surely be described by a much simpler formula, the Poisson distribution function, which is the approximated formula of the binomial distribution function.

6. Summary

The two-dimensional images of the ion-track overlapping effects on the amorphization of TiO2, the crystal phase transformation of ZrO2, and the transition of the magnetic states of CeO2 were simulated by the Monte Carlo method. From the two-dimensional images, the fractions of the areas which are modified by ion-tracks were calculated as a function of ion fluence. They agree well with the analytical result by using the Poisson distribution function.

Author Contributions

Monte Carlo simulation, S.N.; data analysis by Poisson distribution function, A.I.; data curation, S.N.; writing—original draft preparation, A.I.; writing—review and editing, A.I. and S.N. All authors have read and agreed to the published version of the manuscript.

Funding

This research received no external funding.

Data Availability Statement

The data presented in this study are available on request from the corresponding author.

Acknowledgments

One of the authors (A.I.) thanks N. Ishikawa and T. Yamaki for fruitful discussion.

Conflicts of Interest

The authors declare no conflict of interest.

References

  1. Spohr, R. Ion Tracks and Microtechnology; Bethge, K., Ed.; Vieweg Verlag: Brauschweig, Germany, 1990. [Google Scholar]
  2. Yamaki, T.; Nuryanthi, N.; Kitamura, A.; Koshikawa, H.; Sawada, S.; Voss, K.-O.; Severin, D.; Trautman, C. Fluoropoly-mer-based nanostructured membranes created by swift-heavy-ion irradiation and their energy and environmental applications. Nucl. Instrum. Methods Phys. Res. Sect. B 2018, 435, 162–168. [Google Scholar] [CrossRef]
  3. Fleisher, R.L.; Price, P.B.; Walker, R.M. Nuclear Tracks in Solids (Principles & Applications). Nucl. Technol. 1981, 54, 126. [Google Scholar] [CrossRef]
  4. Toulemonde, M. Nanometric phase transformation of oxide materials under GeV energy heavy ion irradiation. Nucl. Instrum. Methods Phys. Res. Sect. B 1999, 156, 1–11. [Google Scholar] [CrossRef]
  5. Toulemonde, M.; Assmann, W.; Dufour, C.; Meftah, A.; Studer, F.; Trautmann, C. Experimental Phenomena and Thermal Spike Model Description of Ion Tracks in Amorphisable Inorganic Insulators. Mat. Fys. Medd. 2006, 52, 263–292. [Google Scholar]
  6. Szenes, G. Information provided by a thermal spike analysis on the microscopic processes of track formation. Nucl. Instrum. Methods Phys. Res. Sect. B 2002, 191, 54–58. [Google Scholar] [CrossRef]
  7. Fleischer, R.L.; Price, P.B.; Walker, R.M. Ion Explosion Spike Mechanism for Formation of Charged-Particle Tracks in Solids. J. Appl. Phys. 1965, 36, 3645–3652. [Google Scholar] [CrossRef]
  8. Haff, P.K. Possible new sputtering mechanism in track registering materials. Appl. Phys. Lett. 1976, 29, 473–475. [Google Scholar] [CrossRef]
  9. Bringa, E. Molecular dynamics simulations of Coulomb explosion. Nucl. Instrum. Methods Phys. Res. Sect. B 2003, 209, 1–8. [Google Scholar] [CrossRef] [Green Version]
  10. Takaki, S.; Yasuda, K.; Yamamoto, T.; Matsumura, S.; Ishikawa, N. Structure of ion tracks in ceria irradiated with high energy xenon ions. Prog. Nucl. Energy 2016, 92, 306–312. [Google Scholar] [CrossRef]
  11. Takaki, S.; Yasuda, K.; Yamamoto, T.; Matsumura, S.; Ishikawa, N. Atomic structure of ion tracks in Ceria. Nucl. Instrum. Methods Phys. Res. Sect. B 2014, 326, 140–144. [Google Scholar] [CrossRef]
  12. Toulemonde, M.; Studer, F. Comparison of the radii of latent tracks induced by hjgh-energy heavy ions in Y3Fe5O12 by HREM, channeling Rutherford backscattering and Mossbauer spectrometry. Philos. Mag. A 1988, 58, 799–808. [Google Scholar] [CrossRef]
  13. Jozwik-Biala, I.; Jagielski, J.; Thome, L.; Arey, B.; Kovarik, L.; Sattonnay, G.; Debelle, A.; Monnet, I. HRTEM study of track evolution in 120-MeV U irradiated Gd2Ti2O7. Nucl. Instrum. Methods Phys. Res. Sect. B 2012, 286, 258–261. [Google Scholar] [CrossRef]
  14. Kuroda, N.; Ishikawa, N.; Chimi, Y.; Iwase, A.; Ikeda, H.; Yoshizaki, R.; Kambara, T. Effects of defect morphology on the properties of the vortex system in Bi2Sr2CaCu2O8+δ irradiated with heavy ions. Phys. Rev. B 2001, 63, 224502. [Google Scholar] [CrossRef]
  15. Ishikawa, N.; Iwase, A.; Chimi, Y.; Michikami, O.; Wakana, H.; Kambara, T. Defect Production Induced by Primary Ionization in Ion-Irradiated Oxide Superconductors. J. Phys. Soc. Jpn. 2000, 69, 3563–3575. [Google Scholar] [CrossRef]
  16. Benyagoub, A.; Couvreur, F.; Bouffard, S.; Levesque, F.; Dufour, C.; Paumier, E. Phase transformation induced in pure zirconia by high energy heavy ion irradiation. Nucl. Instrum. Methods Phys. Res. Sect. B 2001, 175-177, 417–421. [Google Scholar] [CrossRef]
  17. Bilgen, S.; Sattonnay, G.; Grygiel, C.; Monnet, I.; Simon, P.; Thomé, L. Phase transformations induced by heavy ion irradiation in Gd2O3: Comparison between ballistic and electronic excitation regimes. Nucl. Instrum. Methods Phys. Res. Sect. B 2018, 435, 12–18. [Google Scholar] [CrossRef]
  18. Rymzhanov, R.; Medvedev, N.; Volkov, A.; O’Connell, J.; Skuratov, V. Overlap of swift heavy ion tracks in Al2O3. Nucl. Instrum. Methods Phys. Res. Sect. B 2018, 435, 121–125. [Google Scholar] [CrossRef]
  19. Tracy, C.L.; Lang, M.; Zhang, F.; Trautmann, C.; Ewing, R.C. Phase transformations inLn2O3materials irradiated with swift heavy ions. Phys. Rev. B 2015, 92, 174101. [Google Scholar] [CrossRef] [Green Version]
  20. Garcia, G.; Rivera, A.; Crespillo, M.; Gordillo, N.; Olivares, J.; Agulló-López, F.; Garcia, N.G. Amorphization kinetics under swift heavy ion irradiation: A cumulative overlapping-track approach. Nucl. Instrum. Methods Phys. Res. Sect. B 2011, 269, 492–497. [Google Scholar] [CrossRef]
  21. Ishikawa, N.; Yamamoto, S.; Chimi, Y. Structural changes in anatase TiO2 thin films irradiated with high-energy heavy ions. Nucl. Instrum. Methods Phys. Res. Sect. B 2006, 250, 250–253. [Google Scholar] [CrossRef]
  22. Rath, H.; Dash, B.N.; Benyagoub, A.; Mishra, N.C. Sensitivity of Anatase and Rutile Phases of TiO2 to ion irradiation: Ex-amination of the applicability of Coulomb Explosion and Thermal Spike Models. Sci. Rep. 2018, 8, 11774. [Google Scholar] [CrossRef]
  23. Ishikawa, N.; Ohhara, K.; Ohta, Y.; Michikami, O. Binomial distribution function for intuitive understanding of fluence de-pendence of non-amorphized ion-track area. Nucl. Instrum. Methods Phys. Res. Sect. B 2010, 268, 3273–3276. [Google Scholar]
  24. Yamamoto, Y.; Ishikawa, N.; Hori, F.; Iwase, A. Analysis of Ion-Irradiation Induced Lattice Expansion and Ferromagnetic State in CeO2 by Using Poisson Distribution Function. Quantum Beam Sci. 2020, 4, 26. [Google Scholar] [CrossRef]
  25. Simons, G.; Johnson, N.L. On the Convergence of Binomial to Poisson Distributions. Ann. Math. Stat. 1971, 42, 1735–1736. [Google Scholar] [CrossRef]
  26. Awazu, K.; Wang, X.; Fujimaki, M.; Komatsubara, T.; Ikeda, T.; Ohki, Y. Structure of latent tracks in rutile single crystal of titanium dioxide induced by swift heavy ions. J. Appl. Phys. 2006, 100, 044308. [Google Scholar] [CrossRef]
  27. O’Connell, J.; Skuratov, V.; Van Vuuren, A.J.; Saifulin, M.; Akilbekov, A. Near surface latent track morphology of SHI irradiated TiO2. Phys. Stat. Sol. 2016, 253, 2144–2149. [Google Scholar] [CrossRef]
  28. Benyagoub, A.; Thomé, L. Amorphization mechanisms in ion-bombarded metallic alloys. Phys. Rev. B 1988, 38, 10205–10216. [Google Scholar] [CrossRef] [PubMed]
  29. Ackland, K.; Coey, J.M.D. Room temperature magnetism in CeO2—A review. Phys. Rep. 2018, 746, 1–39. [Google Scholar] [CrossRef]
  30. Ohno, H.; Iwase, A.; Matsumura, D.; Nishihata, Y.; Mizuki, J.; Ishikawa, N.; Baba, Y.; Hirao, N.; Sonoda, T.; Kinoshita, M. Study on effects of swift heavy ion irradiation in cerium dioxide using synchrotron radiation X-ray absorption spectroscopy. Nucl. Instrum. Methods Phys. Res. Sect. B 2008, 266, 3013–3017. [Google Scholar] [CrossRef]
  31. Iwase, A.; Ohno, H.; Ishikawa, N.; Baba, Y.; Hirao, N.; Sonoda, T.; Kinoshita, M. Study on the behavior of oxygen atoms in swift heavy ion irradiated CeO2 by means of synchrotron radiation X-ray photoelectron spectroscopy. Nucl. Instrum. Methods Phys. Res. Sect. B 2009, 267, 969–972. [Google Scholar] [CrossRef] [Green Version]
  32. Iwasawa, M.; Ohnuma, T.; Chen, Y.; Kaneta, Y.; Geng, H.-Y.; Iwase, A.; Kinoshita, M. First-principles study on cerium ion behavior in irradiated cerium dioxide. J. Nucl. Mater. 2009, 393, 321–327. [Google Scholar] [CrossRef]
  33. Shimizu, K.; Kosugi, S.; Tahara, Y.; Yasunaga, K.; Kaneta, Y.; Ishikawa, N.; Hori, F.; Matsui, T.; Iwase, A. Change in magnetic properties induced by swift heavy ion irradiation in CeO2. Nucl. Instrum. Methods Phys. Res. Sect. B 2012, 286, 291–294. [Google Scholar] [CrossRef]
  34. Khayat, O.; Afarideh, H. Heavy Charged Particle Nuclear Track Counting Statistics and Count Loss Estimation in High Density Track Images. IEEE Trans. Nucl. Sci. 2014, 61, 2727–2734. [Google Scholar] [CrossRef]
Figure 1. Two-dimensional images of amorphized (yellow) and non-amorphized (blue) areas for various ion fluences; (a) 0 cm2 (unirrradiated), (b) 5 × 1011 cm2, (c) 1 × 1012 cm2, (d) 2 × 1012 cm2 and (e) 2.5 × 1012 cm2. The diameter of ion track is assumed to be 9.6 nm.
Qubs 05 00013 g001
Figure 2. Fraction of non-amorphized area as a function of Xe ion fluence. Green circles, blue line, and red line represent the experimental result [21], result calculated by Equation (6) and the result from two-dimensional images, respectively. The logarithmic scale is used on the vertical axis.
Qubs 05 00013 g002
Figure 3. Fraction of amorphized area as a function of Xe ion fluence. Green circles, blue line, and red line represent the experimental result [21], result calculated by Equation (7) and the result from two-dimensional images, respectively.
Qubs 05 00013 g003
Figure 4. Two-dimensional images of tetragonal (yellow) and monoclinic (blue) areas for various ion fluences; (a) 0 cm2 (unirrradiated), (b) 2.5 × 1012 cm2, (c) 5 × 1012 cm2, (d) 1.5 × 1013 cm2 and (e) 3 × 1013 cm2. The diameter of ion track is assumed to be 4.4 nm.
Qubs 05 00013 g004
Figure 5. Fraction of tetragonal structure area of ZrO2 as a function of ion fluence. Green circles, blue line, and red line represent the experimental result [16], result calculated by Equation (11) and the result from two-dimensional images, respectively. The value of S used in Equation (11) is 1.5 × 10⁻¹³ cm2 which corresponds to the track diameter of 4.4 nm.
Qubs 05 00013 g005
Figure 6. Two-dimensional images of irradiation-induced saturation magnetization of CeO2 for ion fluences of (a) 0 cm2 (unirradiated), and (b) 2.5 × 1012 cm2. The diameter of ion track is assumed to be 4.7 nm. The correspondence relationship for colors and the values of magnetization is shown in Table 1.
Qubs 05 00013 g006
Figure 7. Two-dimensional images of irradiation-induced magnetization for ion fluences of (a) 5 × 1012 cm2, (b) 1.5 × 1013 cm2 and (c) 3 × 1013 cm2. The diameter of ion track is assumed to be 4.7 nm. The correspondence relationship for colors and the values of magnetization is shown in Table 1.
Qubs 05 00013 g007
Figure 8. Saturation magnetization of CeO2 as a function of ion fluence. Green circles, blue line, and red line represent the experimental result [24], result calculated by Equation (13) and the result from two-dimensional images, respectively. The value of S used in Equation (13) is 1.7 × 10⁻¹³ cm2 corresponding to the track diameter of 4.7 nm.
Qubs 05 00013 g008
Table 1. Correspondence relationship for colors in Figure 6 and Figure 7, the number of ion track impacts and saturation magnetization.
ColorNumber of Ion Track Impacts, rSaturation Magnetization (emu/g) Mi
black 00
green 10.1
yellow 20.05
red 30.025
white ≥40.005
Publisher’s Note: MDPI stays neutral with regard to jurisdictional claims in published maps and institutional affiliations.

