Global Significance of Mangrove Blue Carbon in Climate Change Mitigation


Tropical Coastal & Mangrove Consultants, 52 Shearwater Drive, Pakenham, VIC 3810, Australia
Sci 2020, 2(3), 67; https://0-doi-org.brum.beds.ac.uk/10.3390/sci2030067
Submission received: 9 July 2020
/
Accepted: 13 July 2020
/
Published: 21 August 2020
(This article belongs to the Special Issue Climate Change Impacts on Mangrove Ecosystems)
Abstract
:Mangrove forests store and sequester large area-specific quantities of blue carbon (Corg). Except for tundra and peatlands, mangroves store more Corg per unit area than any other ecosystem. Mean mangrove Corg stock is 738.9 Mg Corg ha−1 and mean global stock is 6.17 Pg Corg, which equates to only 0.4–7% of terrestrial ecosystem Corg stocks but 17% of total tropical marine Corg stocks. Per unit area, mangroves sequester 179.6 g Corg m−2·a−1 and globally about 15 Tg Corg a−1. Mangroves sequester only 4% (range 1.3–8%) of Corg sequestered by terrestrial ecosystems, indicating that mangroves are a minor contributor to global C storage and sequestration. CO2 emissions from mangrove losses equate to 0.036 Pg CO2-equivalents a−1 based on rates of C sequestration but 0.088 Pg CO2-equivalents a−1 based on complete destruction for conversion to aquaculture and agriculture. Mangrove CO2 emissions account for only 0.2% of total global CO2 emissions but 18% of CO2 emissions from the tropical coastal ocean. Despite significant data limitations, the role of mangrove ecosystems in climate change mitigation is small at the global scale but more significant in the tropical coastal ocean and effective at the national and regional scale, especially in areas with high rates of deforestation and destruction.
Keywords:
blue carbon; carbon; carbon stock; carbon sequestration; climate change; CO2 emissions; mangrove; mitigation1. Introduction
The concept of blue carbon was introduced in 2009 in an assessment report to a special collaboration of the United Nations Environmental Programme (UNEP), Food and Agriculture Organization of the United Nations (FAO) and the Intergovernmental Oceanographic Commission of the United Nations Educational, Scientific and Cultural Organization (IOC/UNESCO) [1] with the idea that the role of coastal ecosystems such as salt marshes, mangroves and seagrass meadows in absorbing carbon (C) to reduce emissions is of global significance and they should be protected and, if necessary, restored in order to maintain and expand their ability as critical C sinks. ‘Blue carbon’, defined as the coastal carbon sequestered and stored by ocean ecosystems [1], has been increasingly used as a concept to justify numerous studies describing C stocks and rates of C sequestration, especially in salt marsh, mangrove and seagrass ecosystems.
A detailed assessment was commissioned by the International Union for Conservation of Nature (IUCN) [2] to document the C management potential of salt marshes, mangrove forests, seagrass meadows, kelp forests and coral reefs. The report found that these coastal habitats are quantitatively and qualitatively important for numerous reasons, including a high potential for C management [2]. The report concluded that (1) sediments and soils in these ecosystems, while small in geographical extent, sequester proportionally more C than terrestrial ecosystems due to lower potential for emissions of greenhouse gases (CH4, CO2); (2) there is therefore a critical need for comprehensive C inventories from these habitats to properly assess their role in absorbing C emissions; (3) anthropogenic greenhouse gas emissions are being underestimated because such emissions from these coastal habitats are not being accounted for in national and international inventories, meaning their C savings from sequestration do not count towards meeting climate change commitments; and (4) these habitats continue to be destroyed and need to be protected and restored.
Subsequently published policy reports [3,4,5] indicated that when these habitats are converted their C is released back into the atmosphere, thus reversing the effect of fostering carbon sequestration in REDD+ (Reducing Emissions from Deforestation and Forest Degradation; + refers to conservation and sustainable management and enhancement of carbon stocks) and other rehabilitation projects. Policymakers need to understand that there are three components involved in C sequestration: (1) the annual sequestration rate, that is, the annual flux of organic carbon (Corg) transferred to anaerobic soils and sediments where it cannot undergo oxidation to CO2 and be released into the atmosphere; (2) the amount of C stored in above- and below-ground biomass; and (3) the total ecosystem C stock stored below-ground as a result of prior sequestration, that is, historical sequestration over a habitat’s lifetime.
Since the publication of these seminal publications, there has been an explosion of subsequent papers on blue carbon, with over 1000 papers published since 2009 [6]. This impressive growth reflects the need of NGOs and various agencies around the globe for more data, as well as a lot of enthusiasm for the idea that blue carbon storage and sequestration is of national and international significance in reducing carbon emissions.
Two publications have estimated that mangrove forests, especially if converted to aquaculture ponds, cattle pastures and infrastructure upon deforestation, would account for more than one half of the carbon lost (0.09–0.45 Pg CO2 a−1) [7] from coastal ecosystems to the atmosphere and account for at least as much buried C as salt marshes and seagrasses [8]. However, two more recent publications [6,9] have cast doubt on the global significance of mangroves as C sinks, while at least one other publication [10] concluded that mangrove C is nationally important to Indonesia, due in part to the nation’s large mangrove biomass and forest area.
This paper is an attempt to clarify the global and regional significance of mangrove forest C storage and sequestration in reducing and mitigating anthropogenic CO2 gas emissions. The most recent data will be used to better pinpoint the range of rates of C sequestration, C stocks and potential and actual losses from deforestation.
2. Carbon Stocks
Mangrove C stocks have been measured in 52 countries in Africa, Southeast Asia, South and East Asia, Central and North America, the Caribbean, South America, the Middle East, Australia, New Zealand and some Pacific Islands (Table 1). Total ecosystem Corg stocks average 738.9 ± 27.9 Mg Corg ha−1 (±1SE) with 224 measurements and a median value of 702.5 Mg Corg ha−1; above-ground biomass C (living and dead) averages 109.3 ± 5.0 Mg Corg ha−1 (±1SE) with 272 measurements, below-ground biomass C (live and dead roots) averages 80.9 ± 9.5 Mg Corg ha−1 (±1SE) with 76.5% of total C stocks vested in mangrove soils (mean = 565.4 ± 25.7 Mg Corg ha−1) to a depth of at least 1 m (Table 1). These values are considerably lower than the estimates of Alongi [11] and Kauffman et al. [12]. In most cases, minimum and maximum estimates varied by an order of magnitude. Above-ground and below-ground biomass C accounted for 14.8% and 8.7% of total ecosystem C stocks. There is considerable variability in these estimates, reflecting the wide range of ages and geomorphological types of forests, from young plantations to mature undisturbed forests. Also, it is highly likely that the soil C stocks are underestimated in most studies as other studies have measured considerable soil C stocks below 1 m depth (Supplementary Materials Table S1). Further, these data do not include possible inorganic C stocks, particularly in arid mangroves and those near coral reef and mixed terrigenous-carbonate environments [12].
Using the median of 702.5 Mg Corg ha−1 and the most recent estimate of global mangrove area of 83,495 km−2 [13], we derive a global C stock estimate for mangroves of 5.85 Pg C. This estimate is higher than the estimates of 5.0 Pg C by Jardine and Siilamäki [14] and 4.19 Pg C by Hamilton and Friess [15], lower than the estimates by Sanders et al. [16] of 11.2 Pg C and Alongi [6] but within the range (3.7–6.2 Pg C) estimated by Ouyang and Lee [17]. While some of these differences are due to the use of different ecosystem C stock estimates, the main difference is due to the large disparity in the use of estimates of global mangrove area. The higher estimates used the global area estimate of Giri et al. [18] of 137,760 km2 while the lower estimates used the global area estimate of 83,495 km of Hamilton and Casey [13]. The latter estimate is based on the newest and most accurate databases of the Global Forest Change database, the Terrestrial Ecosystems of the World database and the Mangrove Forests of the World database to extract mangrove forest cover at high spatial and temporal resolutions.
Regionally, total ecosystem C stocks are, on average, greatest on the Pacific Islands (mean = 987.4 Mg Corg ha−1) of Kosrae, Yap and Palau, followed by mangroves in Southeast Asia (mean = 860.9 Mg Corg ha−1), Central and North America and the Caribbean (mean = 777.7Mg Corg ha−1) and Africa (mean = 664.2 Mg Corg ha−1). Total ecosystem C stocks were considerably lower in Australia and New Zealand (mean = 563.4 Mg Corg ha−1), South America (mean = 424.0 Mg Corg ha−1), South and East Asia (mean = 395.5 Mg Corg ha−1) and the Middle East (mean = 248.4 Mg Corg ha−1). The size of mangrove C stocks is obviously related to climate, with higher estimates in forests of the humid tropics and lower estimates in the dry tropics and in subtropical and warm temperate regions. This interpretation is supported by the analysis of Sanders et al. [16] who found that 86% of observed variability in mangrove C stocks is associated with annual rainfall, which is the best predictor of mangrove ecosystem C stocks.
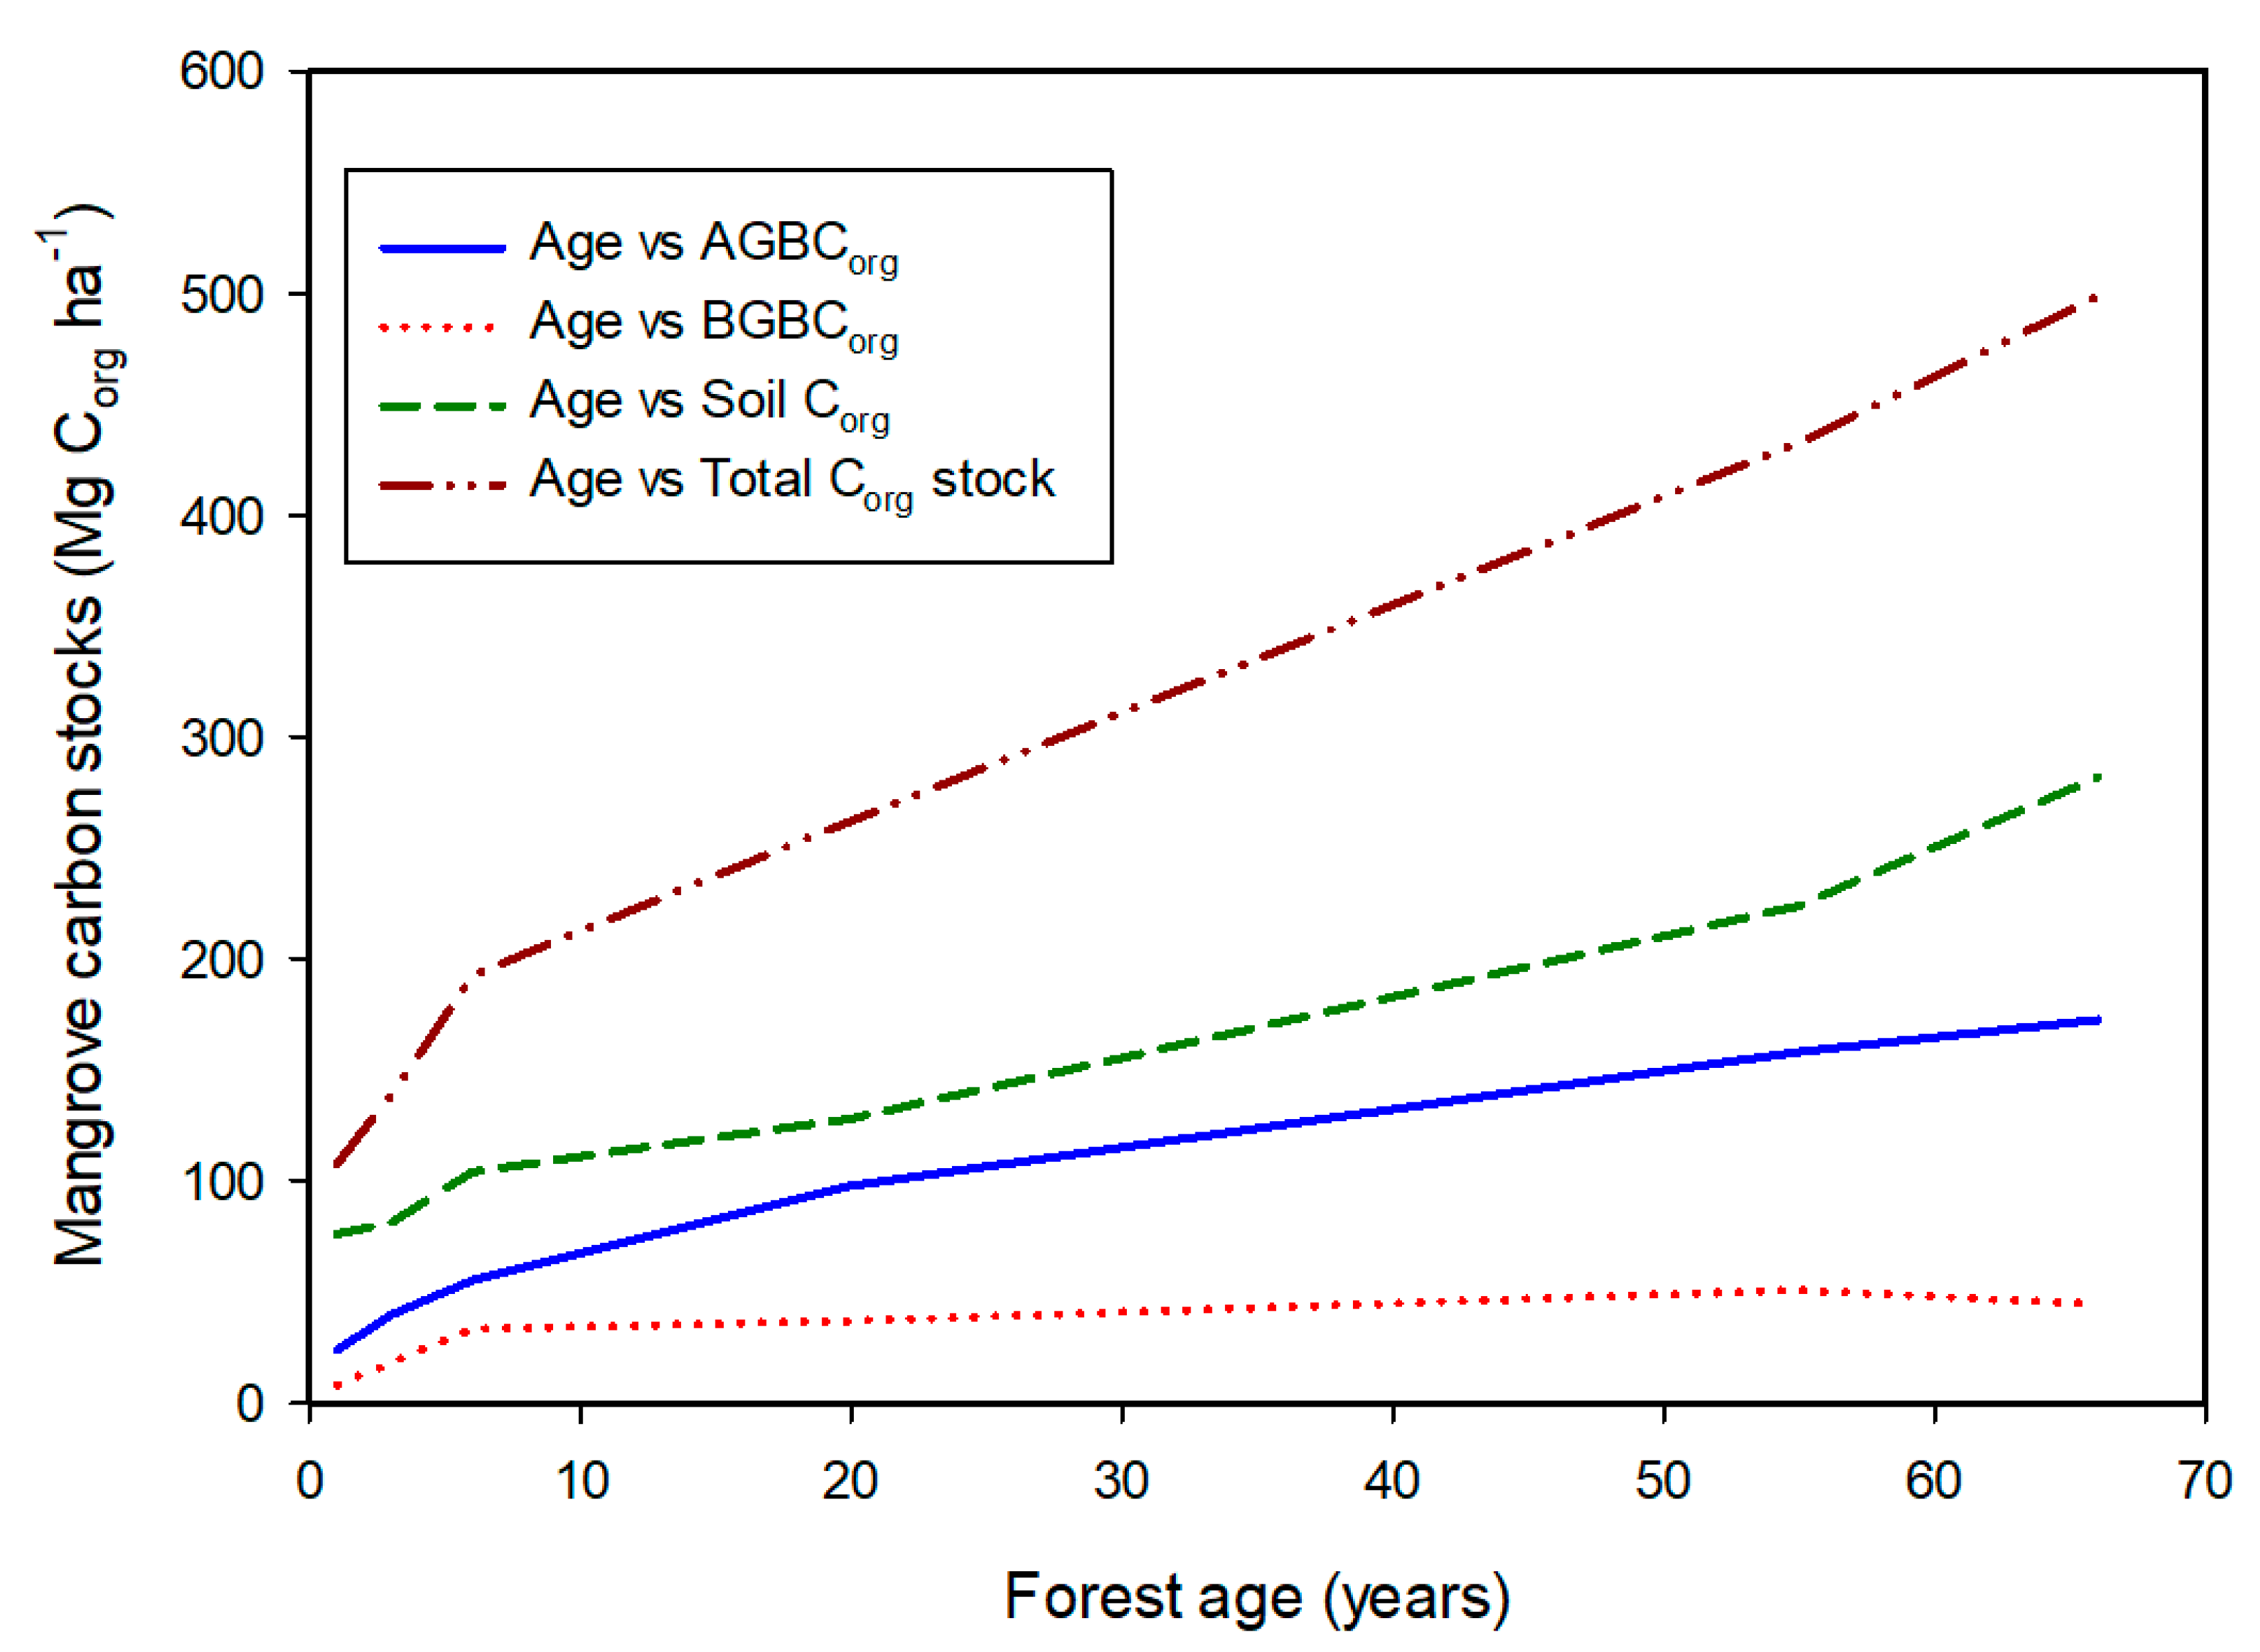
At the individual forest level, the smallest C stocks occur in small stands that occur in the arid tropics or are young plantation forests. As forests age, forest biomass and thus C stocks increase. A clear example is the mangrove forests of known age in French Guiana [19]. As the forests age, C stocks in above- and below-ground biomass, soil and the forest ecosystem increase with increasing age (Figure 1). Each of the four C stocks shows significant linear regression (r2 = 0.959, p < 0.001 for AGBCorg; r2 = 0.618, p = 0.039 for BGBCorg; r2 = 0.982, p < 0.001 for soil Corg; and r2 = 0.979, p < 0.001 for total ecosystem Corg). These data indicate that mangrove Corg levels increase in soils as roots grow and die and accumulate and the canopy continues to grow in size with increasing age, suggesting that mangrove C is best preserved if mature mangrove forests are conserved and left undisturbed. Plantation data from Vietnamese and Indonesian [20,21,22] mangroves similarly indicate increased C storage with increased stand age.
3. Carbon Sequestration Rates
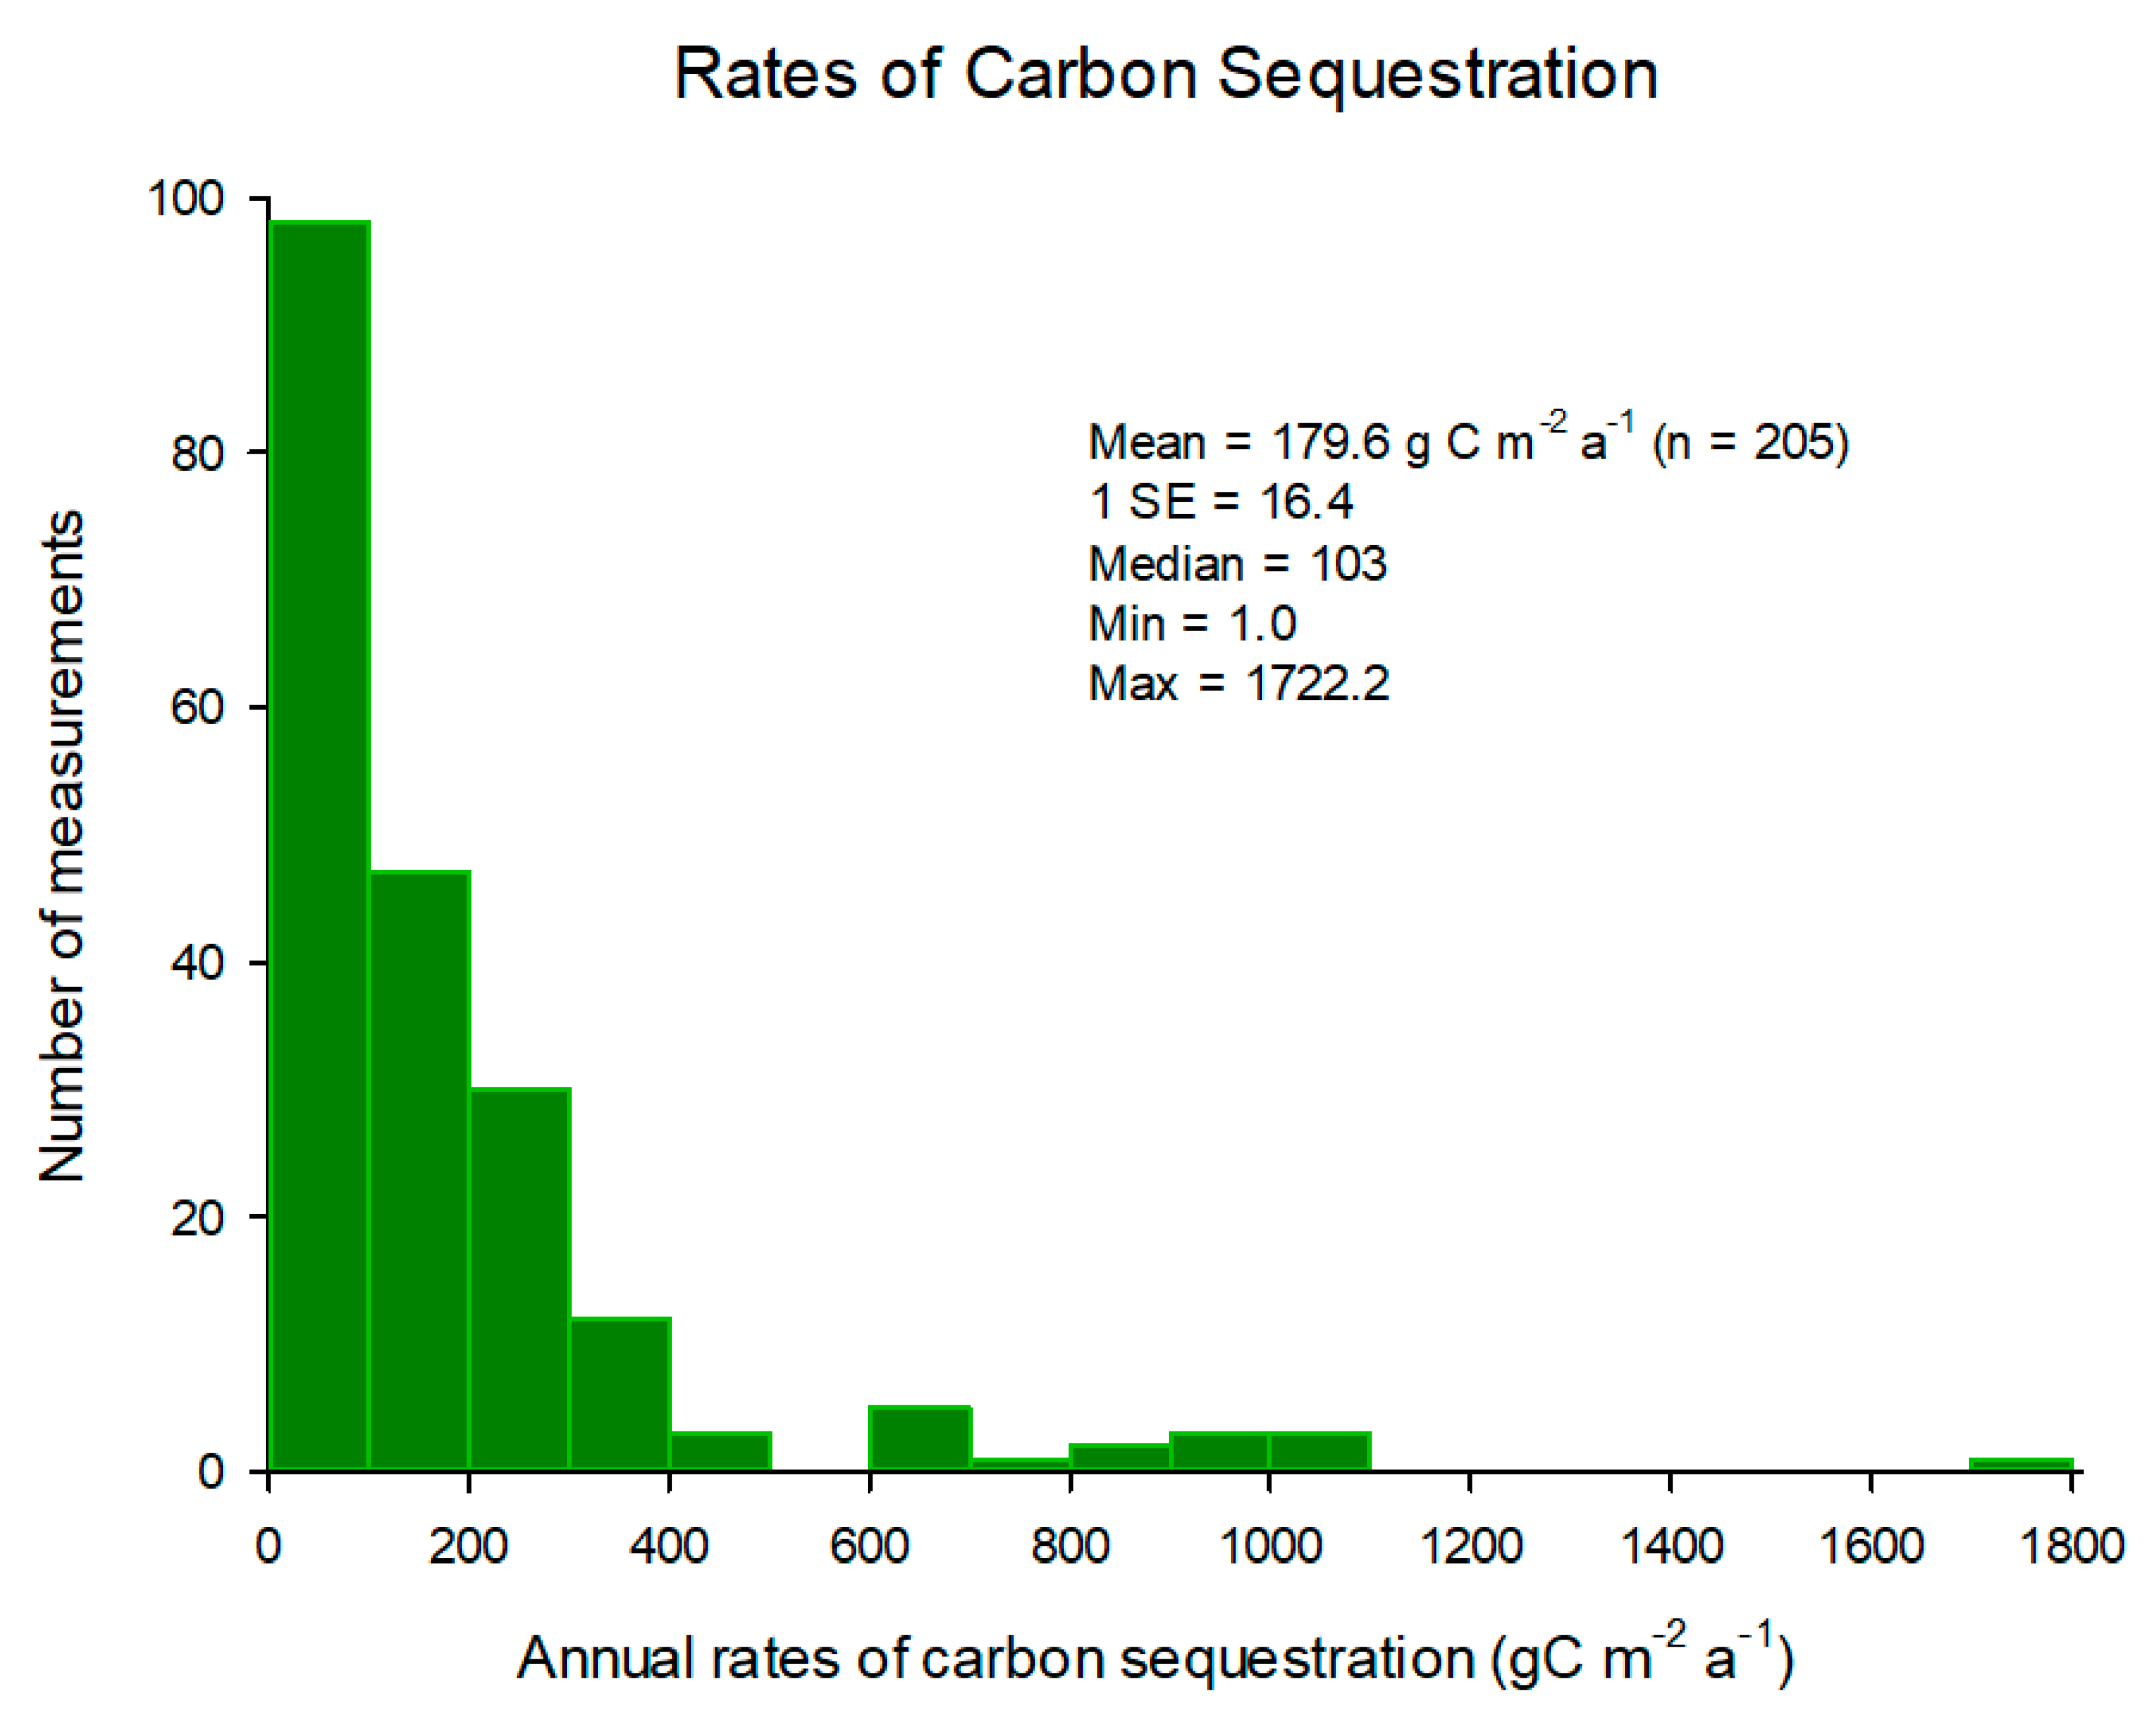
Rates of carbon sequestration, derived from soil accretion rates, in mangroves average 179.6 g Corg m−2·a−1 and a median of 103 g Corg m−2·a−1, with rates varying widely from 1 to 1722.2 g Corg m−2·a−1 (Figure 2). Half of all observations were in the range of 1–100 g Corg m−2·a−1 (Figure 2). The mean value is greater than the estimates of Breithaupt et al. [23], McLeod et al. [24] and Alongi [11]. Assuming a global area of 83,495 km−2 [13] and multiplying by the median value, carbon sequestration in the world’s mangrove forests equates to 8.6 Tg Corg a−1. This value is lower than the 23–25 Tg Corg a−1 calculated by Twilley et al. [25], Jennerjahn and Ittekot [26] and Duarte et al. [27] and the recent estimate of 14.2 Tg Corg a−1 by Alongi [6]. The standard deviation is greater than the mean, reflecting the high level of variability in soil accretion rates and rates of carbon sequestration among mangroves of different ages, types and locations. There was no clear relationship with latitude as it is likely that these rates are a function of several interrelated factors such as forest age, tidal inundation frequency, tidal elevation, geomorphology, species composition, soil grain size, catchment and river input and extent of anthropogenic inputs; most of the highest rates were measured in mature forests in close proximity to river deltas and in forests in highly impacted catchments.
4. Carbon Losses
Blue carbon storage in mangroves may be underestimated by considering soil Corg pools only to a depth of 1m but may be offset by losses of CH4 and oxidation of ancient Corg stored in deep soils [49,50]. Some of the soil Corg is decomposed and returned to the atmosphere as CH4. As CH4 has a higher global warming potential than CO2, it can offset the CO2 removed via Corg burial. Rosentreter et al. [49] calculated that high CH4 emissions from mangroves can partially offset blue carbon burial rates on average by 20% using the 20-year global warming potential. Corg buried in mangrove deposits not only releases CH4 but also century-old sequestered carbon in the form of exported dissolved inorganic carbon (DIC). In a subtropical mangrove system, ∆14C was measured in the DIC exported from the pore water and soil ∆14C profiles. Porewater exchange released isotopically depleted, old DIC to adjacent creek waters [50]. The DIC came from an average depth of 40 cm, equivalent to about a century of soil accumulation. Thus, 100-yr old DIC is still susceptible to remineralization and tidal export via pore water exchange or submarine groundwater discharge.
The loss of mangroves, irrespective of cause, results in significant loss of Corg inventory, especially if the soil horizon is removed or disturbed. This removal can be converted to CO2-eq (equivalent) emissions back to the atmosphere. Immediate removal of biomass and soil of destroyed mangrove forests to convert the area to aquaculture ponds, cattle pastures and other land uses results in extremely high losses (Table 2), with CO2 eq emissions averaging 1802.2 Mg ha−1·a−1 and ranging from 407.9 to 2781.5 Mg ha−1·a−1 [51,52] as estimated in Brazil, Mexico, the Philippines, Honduras, Dominican Republic, Indonesia and Costa Rica. Most of these emissions come from loss of the soil pool to a depth of 1 m. If soils deeper than 1 m are dredged, the estimated CO2 eq will be greater.
Hurricanes and typhoons can destroy significant areas of mangroves, as estimated in the Philippines, Honduras, Vietnam and in Florida (Table 2). Averaging the remaining estimates (n = 20), we derive an average emission of 65.2 ± 10.6 Mg CO2 eq ha−1·a−1 (±1SE) with a median of 46 Mg CO2 eq ha−1·a−1 (Table 2). Assuming total deforestation of mangroves (biomass + soils to 1 m depth) and using the mean CO2 eq emission of 1802.2 Mg CO2 eq ha−1·a−1 and multiplying by an annual average deforestation rate of 0.16% [13,15] and a global mangrove area of 83,495 km−2 [13], we can estimate an annual loss of 24.08 Tg CO2 eq a−1 or 0.0024 Pg CO2eq a−1. This estimate is considerably less than those of Pendleton et al. [7] and Alongi [6] mostly due to lower recent estimates of annual deforestation and less global mangrove area. Mangrove losses are small on a global scale, equating to just 2.2% of CO2 losses due to losses (1.1 Gt C a−1) of the world’s tropical terrestrial forests [69] and offsetting just 1.8% of the carbon sink (1.32 Pg a−1) in the global ocean’s continental margins [70]. However, mangrove losses offset 148.6% of total CO2-air-sea exchange (−16.21 Tg C a−1) by the world’s tropical coastal zone [71].
5. Assessment of Global Significance
Are mangrove blue C stocks and C sequestration rates globally significant? The global mean C stock for mangroves is estimated to be 6.17 Pg Corg, which is the largest C stock of any ecosystem in the global tropical ocean, constituting ~17% of total tropical marine C stocks (Table 3). Although mean mangrove C stocks per unit area are the largest among the world’s ecosystems (except tundra and peatlands), global mangrove C stocks equate to only 1.6% (range: 0.4–7%) of individual terrestrial ecosystem global C stocks (Table 3). Regarding C sequestration among coastal environments, seagrass meadows sequester slightly more than twice (35.3 Tg Corg a−1) the amount of mangroves (15Tg Corg a−1). Mangroves sequester ~50% of tropical peatlands globally but only 4% compared to other terrestrial ecosystems (range: 1.3–8%). CO2 emissions due to deforestation and other destructive land use practices result in large returns of CO2 to the atmosphere, for a total of roughly 51 Pg CO2-eq a−1 (Table 3). While the same calculations for mangroves result in an estimate of 0.036 Pg CO2-eq a−1, in some regions mangrove biomass and soils are entirely removed (Section 4) resulting in mean C losses of 1802.2 Mg Corg·ha−1 a−1. Assuming that all mangroves are so destroyed at a rate of 0.16% per year, total CO2 emissions equate to 0.088 Pg CO2-eq a−1 rather than the lower estimate based solely on losses of global C sequestration (see footnote b in Table 3).
While there is no doubt that mangroves store and sequester large amounts of carbon relative to their small global area, a perusal of Table 3 indicates that they play only a minor global role in storing Corg and in mitigating CO2 emissions. However, mangrove CO2 emissions were significant throughout the tropical coastal ocean (TCO). Mangrove CO2 emissions account for roughly 0.2% of total global CO2 emissions, but account for about 18% of CO2 emissions from the tropical coastal ocean (seagrasses account for 29% and coral reefs 0.1% of TCO emissions; the remaining 52.9% is accounted for by nearshore coastal waters and subtidal benthos). It must be noted that these C stock and C rate estimates are crude and can only point to relative differences, as there are significant data limitations.
Climate change mitigation is likely to be more significant and effective at the national scale especially in countries losing mangroves rapidly, such as in Indonesia and Brazil [9,10]. Taillardat et al. [9] estimated national mangrove sequestration potential showing that they can contribute to mitigation of CO2 emissions if deforestation rates remain low. For example, mangroves in countries such as Nigeria, Colombia, Bangladesh, Ecuador, and Cuba accounted for >1% of national CO2 emissions. In countries with high deforestation rates such as Malaysia and Myanmar the carbon storage potential of remaining mangroves was less than the carbon emissions generated by deforestation of mangroves. In some countries mangrove mitigation potential is a significant percentage of national losses, such as Papua New Guinea (34.9%), Gabon (11.3%), Panama (8.3%), Mozambique (8.3%), and Cameroon (8.4%) underscoring the importance of mangrove mitigation at the national scale.
Supplementary Materials
The following is available online at https://0-www-mdpi-com.brum.beds.ac.uk/2413-4155/2/3/67/s1, Table S1: Estimates of organic carbon stocks (Mg Corg ha−1) in mangrove above-ground (AGBCorg ha−1) and below ground root biomass (BGBCorg ha−1) and soils (SCorg ha−1) to a depth of 1 m, except where noted.
Funding
This research received no external funding.
Conflicts of Interest
The author declares no conflict of interest.
References
- Nelleman, C.; Corcoran, E.; Duarte, C.M.; Valdés, L.; DeYoung, C.; Foseca, L.; Grimsditch, G. (Eds.) Blue Carbon: A Rapid Response Assessment; United Nations Environmental Programme and GRID-Arendal: Arendal, Norway, 2009. [Google Scholar]
- Laffoley, D.d.A.; Grimsditch, G. (Eds.) The Management of Natural Coastal Carbon Sinks; IUCN: Gland, Switzerland, 2009. [Google Scholar]
- Herr, D.; Pidgeon, E.; Laffoley, D. (Eds.) Blue Carbon Policy Framework: Based on the Discussion of the International Blue Carbon Policy Working Group; IUCN: Gland, Switzerland, 2012. [Google Scholar]
- Sifleet, S.; Pendleton, L.; Murray, B.C. State of the Science on Coastal Blue Carbon: A Summary for Policy Makers. In Nicholas Institute for Environmental Policy Solutions Report NIR 11-06; Nicholas Institute, Duke University: Durham, NC, USA, 2011. [Google Scholar]
- IOC. A Blueprint for Ocean and Coastal Sustainability; IOC/UNESCO: Paris, France, 2011. [Google Scholar]
- Alongi, D.M. Blue Carbon: Coastal Sequestration for Climate Change Mitigation; Springer Briefs in Climate Studies, Springer Nature: Cham, Switzerland, 2018. [Google Scholar]
- Pendleton, L.; Donato, D.C.; Murray, B.C.; Crooks, S.; Jenkins, W.A.; Sifleet, S.; Craft, C.; Fourqurean, J.W.; Kauffman, J.B.; Marbá, N.; et al. Estimating global “blue carbon: emissions from conversion and degradation of vegetated coastal ecosystems. PLoS ONE 2012, 7, e43542. [Google Scholar] [CrossRef] [PubMed] [Green Version]
- Huxham, M.; Whitlock, D.; Githaiga, M.; Dencer-Brown, A. Carbon in the coastal seascape: how interactions between mangrove forests, seagrass meadows and tidal marshes influence carbon storage. Curr. Forest Rept. 2018, 4, 101–110. [Google Scholar] [CrossRef] [Green Version]
- Taillardat, P.; Friess, D.A.; Lupascu, M. Mangrove blue carbon strategies for climate change mitigation are most effective at the national scale. Biol. Lett. 2018, 14, 20180251. [Google Scholar] [CrossRef] [PubMed]
- Alongi, D.M.; Murdiyarso, D.; Fourqurean, J.W.; Kauffman, J.B.; Hutahaean, A.; Crooks, S.; Lovelock, C.E.; Howard, J.; Herr, D.; Fortes, M.; et al. Indonesia’s blue carbon: a globally significant and vulnerable sink for seagrass and mangrove carbon. Wetl. Ecol. Manag. 2016, 24, 3–13. [Google Scholar] [CrossRef]
- Alongi, D.M. Carbon sequestration in mangrove forests. Carbon Manag. 2012, 3, 313–322. [Google Scholar] [CrossRef]
- Saderne, V.; Geraldi, N.R.; Macreadie, P.I.; Maher, D.Y.; Middelburg, J.J.; Serrano, O.; Almahasheer, H.; Arias-Ortiz, A.; Cusack, M.; Eyre, B.D.; et al. Role of carbonate burial in blue carbon budgets. Nat. Commun. 2019, 10, 1066. [Google Scholar] [CrossRef] [Green Version]
- Hamilton, S.E.; Casey, D. Creation of a high spatio-temporal resolution global database of continuous mangrove forest cover for the 21st century (CGMFC-21). Glob. Ecol. Biogeogr. 2016, 25, 729–738. [Google Scholar] [CrossRef]
- Jardine, S.L.; Siikamäki, J.V. A global predictive model of carbon in mangrove soils. Environ. Res. Lett. 2014, 9, 104013. [Google Scholar] [CrossRef]
- Hamilton, S.; Friess, D.A. Global carbon stocks and potential emissions due to mangrove deforestation from 2000 to 2012. Nat. Clim. Chang. 2018, 8, 240–244. [Google Scholar] [CrossRef] [Green Version]
- Sanders, C.J.; Maher, D.T.; Tait, D.R.; Williams, D.; Holloway, C.; Sippo, J.Z.; Santos, I.R. Are global mangrove carbon stocks driven by rainfall? J. Geophys. Res. Biogeosci. 2016, 121, 2600–2609. [Google Scholar] [CrossRef]
- Ouyang, X.; Lee, S.Y. Improved estimates on global carbon stock and carbon pools in tidal wetlands. Nat. Commun. 2020, 11, 317. [Google Scholar] [CrossRef] [PubMed] [Green Version]
- Giri, C.; Ochieng, E.; Tiezen, L.L.; Zhu, Z.; Singh, A.; Loveland, T.; Masek, J.; Duke, N.C. Status and distribution of mangrove forests of the world using earth observation satellite data. Glob. Ecol. Biogeogr. 2011, 20, 154–159. [Google Scholar] [CrossRef]
- Walcker, R.; Gandois, L.; Proisy, C.; Corenblit, D.; Mougin, E.; Laplanche, C.; Ray, R.; Fromard, F. Control of “blue carbon” storage by mangrove ageing: Evidence from a 66-year old chronosequence in French Guiana. Glob. Chang. Biol. 2018, 6, 2325–2338. [Google Scholar] [CrossRef] [PubMed]
- Hieu, P.V.; Dung, L.V.; Tue, N.T.; Omori, K. Will restored mangrove forests enhance sediment organic carbon and ecosystem carbon storage? Reg. Stud. Mar. Sci. 2017, 14, 43–52. [Google Scholar]
- Ha, T.H.; Marchand, C.; Aimé, J.; Dang, H.N.; Phan, N.H.; Nguyen, X.T.; Nguyen, T.K.C. Belowground carbon sequestration in mature planted mangroves (Northern Viet Nam). For. Ecol. Manag. 2018, 407, 191–199. [Google Scholar] [CrossRef]
- Arif, A.M.; Guntur, G.; Ricky, A.B.; Novianti, P.; Andik, I. Mangrove ecosystem C-stocks of Lamongan, Indonesia and its correlation with forest age. Res. J. Chem. Environ. 2017, 21, 1–8. [Google Scholar]
- Breithaupt, J.L.; Smoak, J.M.; Smith, T.J., III; Sanders, C.J.; Hoare, A. Organic carbon burial rates in mangrove sediments: strengthening the global budget. Glob. Biogeochem. Cycles 2012, 26, GB3011. [Google Scholar] [CrossRef]
- McLeod, E.; Chmura, G.L.; Bouillon, S.; Björk, M.; Duarte, C.M.; Lovelock, C.E.; Schlesinger, W.H.; Silliman, B.R. A blueprint for blue carbon: toward an improved understanding of the role of vegetated coastal habitats in sequestering CO2. Front. Ecol. Environ. 2011, 9, 552–560. [Google Scholar] [CrossRef] [Green Version]
- Twilley, R.R.; Chen, R.H.; Hargis, T. Carbon sinks in mangroves and their implications to carbon budget of tropical coastal ecosystems. Water Air Soil Pollut. 1992, 64, 265–288. [Google Scholar] [CrossRef]
- Jennerjahn, T.C.; Ittekot, V. Relevance of mangroves for the production and deposition of organic matter along tropical continental margins. Naturwissen. 2002, 89, 23–30. [Google Scholar] [CrossRef]
- Duarte, C.M.; Middelburg, J.J.; Caraco, N. Major role of marine vegetation on the oceanic carbon cycle. Biogeosciences 2005, 2, 1–8. [Google Scholar] [CrossRef] [Green Version]
- Almahasheer, H.; Serrano, O.; Duarte, C.M.; Arias-Ortiz, A.; Masque, P.; Irigoien, X. Low carbon sink capacity of Red Sea mangroves. Sci. Rep. 2017, 7, 1–10. [Google Scholar] [CrossRef] [PubMed] [Green Version]
- Pérez, A.; Libardoni, B.G.; Sanders, C.J. Factors influencing organic carbon accumulation in mangrove ecosystems. Biol. Lett. 2018, 14, 20180237. [Google Scholar] [CrossRef] [PubMed] [Green Version]
- Li, S.-B.; Chen, P.-H.; Huang, J.-S.; Hsueh, M.-L.; Hsieh, L.-Y.; Lee, C.-L.; Lin, H.-J. Factors regulating carbon sinks in mangrove ecosystems. Glob. Chang. Biol. 2018, 24, 4195–4210. [Google Scholar] [CrossRef]
- Cuellar-Martinez, T.; Ruiz-Fernández, A.C.; Sanchez-Cabeza, J.-A.; Pérez-Bernal, L.; Lopez-Mendoza, P.G.; Carnero-Bravo, V.; Agraz-Hernández, C.M.; van Tussenbroek, B.I.; Sandoval-Gil, J.; Cardoso-Mohedano, J.G.; et al. Temporal records of organic carbon stocks and burial rates in Mexican blue carbon coastal ecosystems throughout the Anthropocene. Glob. Planet. Chang. 2020, 192, 103215. [Google Scholar] [CrossRef]
- Lamont, K.; Saintilan, N.; Kelleway, J.J.; Mazumder, D.; Zawadzki, A. Thirty-year repeat measures of mangrove above- and below-ground biomass reveals unexpectedly high carbon sequestration. Ecosystems 2020, 23, 370–382. [Google Scholar] [CrossRef]
- Salmo, S.G., III; Malapit, V.; Garcia, M.C.A.; Pagkalinawan, H.M. Establishing rates of carbon sequestration in mangroves from an earthquake uplift event. Biol. Lett. 2019, 15, 20180799. [Google Scholar] [CrossRef] [Green Version]
- Bernardino, A.F.; Sanders, C.J.; Bissoli, L.B.; Gomes, L.E.D.O.; Kauffman, J.B.; Ferreira, T.O. Land use impacts on benthic bioturbation potential and carbon burial in Brazilian mangrove ecosystems. Limnol. Oceanogr. 2020. [Google Scholar] [CrossRef]
- Soper, F.M.; MacKenzie, R.A.; Sharma, S.; Cole, T.G.; Litton, C.M.; Sparks, J.P. Non-native mangroves support carbon storage, sediment carbon burial, and accretion of coastal ecosystems. Glob. Chang. Biol. 2019, 25, 4315–4326. [Google Scholar] [CrossRef]
- Pérez, A.; Machado, W.; Gutiérrez, D.; Borges, A.C.; Patchineelam, S.R.; Sanders, C.J. Carbon accumulation and storage capacity in mangrove sediments three decades after deforestation within a eutrophic bay. Mar. Pollut. Bull. 2018, 126, 275–280. [Google Scholar] [CrossRef]
- Shaltout, K.H.; Ahmed, M.T.; Alrumman, S.A.; Ahmed, D.A.; Eid, E.M. Evaluation of the carbon sequestration capacity of arid mangroves along nutrient availability and salinity gradients along the Red Sea coastline of Saudi Arabia. Oceanologia 2020, 62, 56–69. [Google Scholar] [CrossRef]
- Cusack, M.; Saderne, V.; Arias-Ortiz, A.; Masqué, P.; Krishnakumar, P.K.; Rabaoui, L.; Qurban, M.A.; Qasem, A.M.; Prihartato, P.; Loughland, R.A.; et al. Organic carbon sequestration and storage in vegetated coastal habitats along the western coast of the Arabian Gulf. Environ. Res. Lett. 2018, 13, 074007. [Google Scholar] [CrossRef]
- Sasmito, S.D.; Kuzyakov, Y.; Lubis, A.A.; Murdiyarso, D.; Hutley, L.B.; Bachri, S.; Friess, D.A.; Martius, C.; Borchard, N. Organic carbon burial and sources in soils of coastal mudflat and mangrove ecosystems. Catena 2020, 104414. [Google Scholar] [CrossRef]
- Breithaupt, J.L.; Smoak, J.M.; Sanders, C.J.; Troxler, T.G. Spatial variability of organic carbon, CaCO3 and nutrient burial rates spanning a mangrove productivity gradient in the Coastal Everglades. Ecosystems 2019, 22, 844–858. [Google Scholar] [CrossRef]
- Kusumaningtyas, M.A.; Hutahaean, A.A.; Fischer, H.W.; Pérez-Mayo, M.; Ransby, D.; Jennerjahn, T.C. Variability in the organic carbon stocks, sources, and accumulation rates of Indonesian mangrove ecosystems. Estuar. Coast Shelf Sci. 2019, 218, 310–323. [Google Scholar] [CrossRef]
- Hapsari, K.A.; Jennerjahn, T.C.; Lukas, M.C.; Karius, V.; Behling, H. Intertwined effects of climate and land use change on environmental dynamics and carbon accumulation in a mangrove-fringed coastal lagoon in Java, Indonesia. Glob. Chang. Biol. 2019, 26, 1414–1431. [Google Scholar] [CrossRef] [Green Version]
- Afefe, A.A.; Abbas, M.S.; Soliman, A.S.; Khedr, H.A.; Hatab, B.E. Tree biomass and soil carbon stocks of a mangrove ecosystem on the Egyptian—African Red Sea coast. Fund. Appl. Limnol. 2020, 193, 239–251. [Google Scholar] [CrossRef]
- Wilkinson, G.M.; Besterman, A.; Buelo, C.; Gephart, J.; Pace, M.L. A synthesis of modern organic carbon accumulation rates in coastal and aquatic inland ecosystems. Sci. Rep. 2018, 8, 15736. [Google Scholar] [CrossRef]
- Murdiyarso, D.; Hanggara, B.B.; Lubis, A.A. Sedimentation and soil carbon accumulation in degraded mangrove forests of North Sumatra, Indonesia. BioRxiv 2018, 32519. [Google Scholar] [CrossRef]
- Marchand, C. Soil carbon stocks and burial rates along a mangrove forest chronosequence (French Guiana). For. Ecol. Manag. 2017, 384, 92–99. [Google Scholar] [CrossRef]
- El-Hussieny, S.A.; Ismail, I.M. Role of Avicennia marina (Forssk.) Vierh. of south Sinai, Egypt in atmospheric CO2 sequestration. Int. J. Sci. Res. 2015, 6, 1935–1946. [Google Scholar]
- Eid, E.M.; Khedher, K.M.; Ayed, H.; Arshad, M.; Moatamed, A.; Mouldi, A. Evaluation of carbon stock in the sediment of two mangrove species, Avicennia marina and Rhizophora mucronata, growing in the Farasan Islands, Saudi Arabia. Oceanologia 2020, 62, 200–213. [Google Scholar] [CrossRef]
- Rosentreter, J.A.; Maher, D.T.; Erler, D.V.; Murray, R.H.; Eyre, B.D. Methane emissions partially offset “blue carbon” burial in mangroves. Sci. Adv. 2018, 4, eaao4985. [Google Scholar] [CrossRef] [PubMed] [Green Version]
- Maher, D.T.; Santos, I.R.; Schulz, K.G.; Call, M.; Jacobsen, G.E.; Sanders, C.J. Blue carbon oxidation revealed by radiogenic and stable isotopes in a mangrove system. Geophys. Res. Lett. 2017, 44, 4889–4896. [Google Scholar] [CrossRef]
- Kauffman, J.B.; Bernardino, A.F.; Ferreira, T.O.; Bolton, N.W.; Gomes, L.E.D.O.; Nobrega, G.N. Shrimp ponds lead to massive loss of soil carbon and greenhouse gas emissions in northeastern Brazilian mangroves. Ecol. Evol. 2018, 8, 5530–5540. [Google Scholar] [CrossRef] [PubMed]
- Kauffman, J.B.; Arifanti, V.B.; Trejo, H.H.; del Carmen Jesús García, M.; Norfolk, J.; Cifuentes, M.; Hadriyanto, D.; Murdiyarso, D. The jumbo carbon footprint of a shrimp: carbon losses from mangrove deforestation. Front. Ecol. Environ. 2017, 15, 183–188. [Google Scholar] [CrossRef]
- Lovelock, C.E.; Ruess, R.W.; Feller, I.C. CO2 efflux from cleared mangrove peat. PLoS ONE 2011, 6, e21279. [Google Scholar] [CrossRef] [Green Version]
- Bulmer, R.H.; Lundquist, C.J.; Schwendenmann, L. Sediment properties and CO2 efflux from intact and cleared temperate mangrove forests. Biogeosciences 2015, 12, 6169–6180. [Google Scholar] [CrossRef] [Green Version]
- Sharma, S.; MacKenzie, R.A.; Tieng, T.; Soben, K.; Tulyasuwan, N.; Resanond, A.; Blate, G.; Litton, C.M. The impacts of degradation, deforestation and restoration on mangrove ecosystem carbon stocks across Cambodia. Sci. Total Environ. 2020, 706, 135416. [Google Scholar] [CrossRef]
- Sidik, F.; Lovelock, C.E. CO2 efflux from shrimp ponds in Indonesia. PLoS ONE 2013, 8, e66329. [Google Scholar] [CrossRef] [Green Version]
- Kauffman, J.B.; Heider, C.; Norfolk, J.; Payton, F. Carbon stocks of intact mangroves and carbon emissions arising from their conversion in the Dominican Republic. Ecol. Appl. 2014, 24, 518–527. [Google Scholar] [CrossRef] [PubMed]
- Elwin, A.; Bukoski, J.J.; Jintana, V.; Robinson, E.J.Z.; Clark, J.M. Preservation and recovery of mangrove ecosystem carbon stocks in abandoned shrimp ponds. Sci. Rep. 2019, 9, 18275. [Google Scholar] [CrossRef] [PubMed] [Green Version]
- Arifanti, V.B.; Kauffman, J.B.; Hadriyanto, D.; Murdiyarso, D.; Diana, R. Carbon dynamics and land use carbon footprints in mangrove-converted aquaculture: The case of the Mahakam Delta, Indonesia. For. Ecol. Manag. 2019, 432, 17–29. [Google Scholar] [CrossRef]
- Lang’at, J.K.; Kairo, J.G.; Mencuccini, M.; Bouillon, S.; Skov, M.W.; Waldron, S.; Huxham, M. Rapid losses of surface elevation following tree girdling and cutting in tropical mangroves. PLoS ONE 2014, 6, e107868. [Google Scholar] [CrossRef] [PubMed] [Green Version]
- Cahoon, D.R.; Hensel, P.; Rybczyk, J.; McKee, K.L.; Proffitt, E.D.; Perez, B.C. Mass tree mortality leads to mangrove peat collapse at Bay Islands, Honduras after Hurricane Mitch. J. Ecol. 2003, 91, 1093–1105. [Google Scholar] [CrossRef]
- Lovelock, C.E.; Fourqurean, J.W.; Morris, J.T. Modeled CO2 emissions from coastal wetland transitions to other land uses: Tidal marshes, mangrove forests, and seagrass beds. Front. Mar. Sci. 2017, 4, 143. [Google Scholar] [CrossRef]
- Salmo, S.G., III; Gianan, E.L.D. Post-disturbance carbon stocks and rates of sequestration: Implications on “blue carbon” estimates in Philippine mangroves. Philipp. Sci. Lett. 2019, 12, 122–132. [Google Scholar]
- Peneva-Reed, E.I.; Krauss, K.W.; Bullock, E.L.; Zhu, Z.; Woltz, V.L.; Drexler, J.Z.; Conrad, J.R.; Stehman, S.V. Carbon stock losses and recovery observed for a mangrove ecosystem following a major hurricane in Southwest Florida. Estuar. Coast. Shelf Sci. 2020, 106750. [Google Scholar] [CrossRef]
- Lagomasino, D.; Fatoyinbo, T.; Lee, S.K.; Feliciano, E.; Trettin, C.; Shapiro, A.; Mangora, M.M. Measuring mangrove carbon loss and gain in deltas. Environ. Res. Lett. 2019, 14, 025002. [Google Scholar] [CrossRef]
- Duncan, C.; Primavera, J.H.; Pettorelli, N.; Thompson, J.R.; Loma, R.J.A.; Koldewey, H.J. Rehabilitating mangrove ecosystem services: A case study on the relative benefits of abandoned pond reversion from Panay Island, Philippines. Mar. Pollut. Bull. 2016, 109, 772–782. [Google Scholar] [CrossRef]
- Herrera-Silveira, J.A.; Pech-Cardenas, M.A.; Morales-Ojeda, S.M.; Cinco-Castro, S.; Camacho-Rico, A.; Sosa, J.P.C.; Mendoza-Martinez, J.E.; Pech-Poot, E.Y.; Montero, J.; Teutli-Hernandez, C. Blue carbon of Mexico, carbon stocks and fluxes: a systematic review. PeerJ 2020, 8, e8790. [Google Scholar] [CrossRef] [PubMed] [Green Version]
- Akhand, A.; Mukhopadhyay, A.; Chanda, A.; Mukherjee, S.; Das, A.; Das, S.; Hazra, S.; Mitra, D.; Choudhury, S.B.; Rao, K.H. Potential CO2 emission due to loss of above ground biomass from the Indian Sundarban mangroves during the last four decades. J. Indian Soc. Remote Sens. 2016, 8, 1–8. [Google Scholar] [CrossRef]
- Brinck, K.; Fischer, R.; Groeneveld, J.; Lehman, S.; De Paula, M.D.; Pütz, S.; Sexton, J.O.; Song, D.; Huth, A. High resolution analysis of tropical forest fragmentation and its impact on the global carbon cycle. Nat. Commun. 2017, 8, 14855. [Google Scholar] [CrossRef] [PubMed] [Green Version]
- Chen, C.-T.A. Cross-boundary exchanges of carbon and nitrogen in continental margins. In Carbon and Nutrient Fluxes in Continental Margins; Liu, K.-K., Atkinson, L., Quiñones, R., Talaue-McManus, L., Eds.; Springer: New York, NY, USA, 2010; pp. 561–574. [Google Scholar]
- Alongi, D.M.; Mukhopadhyay, S.K. Contributions of mangroves to coastal carbon cycling in low latitude seas. Agric. For. Meteorol. 2015, 213, 266–272. [Google Scholar] [CrossRef]
- Davidson, N.C.; Finlayson, C.M. Updating global coastal wetland areas presented in Davidson and Finlayson (2018). Mar. Freshw. Res. 2019, 70, 1195–1200. [Google Scholar] [CrossRef]
- Leadley, P.W.; Krug, C.B.; Alkemade, R.; Pereira, H.M.; Sumaila, U.R.; Walpole, M.; Marques, A.; Newbold, T.; Teh, L.S.L.; van Kolck, J.; et al. Progress Towards the Aichi Biodiversity Targets: An Assessment of Biodiversity Trends, Policy Scenarios and Key Actions; CBD Technical Series No. 78; Secretariat of the Convention on Biological Diversity: Montreal, QUE, Canada, 2014; Available online: http://www.cbd.int/doc/publications/1019-1020-cbd-ts-78-en.pdf (accessed on 22 June 2020).
- McKenzie, L.J.; Nordlund, L.M.; Jones, B.L.; Cullen-Unsworth, L.C.; Roelfsema, C.; Unsworth, R.K.F. The global distribution of seagrass meadows. Environ. Res. Lett. 2020. [Google Scholar] [CrossRef]
- Mora, C.; Andréfouët, S.; Costello, M.J. Coral reefs and the global network of marine protected areas. Science 2006, 312, 1750–1751. [Google Scholar] [CrossRef]
- Crossland, C.J.; Hatcher, B.G.; Smith, S.V. Role of coral reefs in global ocean production. Coral Reefs 1991, 10, 55–64. [Google Scholar] [CrossRef]
- Alongi, D.M. Coastal Ecosystem Processes; CRC Press: Boca Raton, FL, USA, 1998. [Google Scholar]
- Kinsey, D.W.; Hopley, D. The significance of coral reefs as global carbon sinks—Response to Greenhouse. Glob. Planet. Chang. 1991, 3, 363–377. [Google Scholar] [CrossRef]
- Selig, E.R.; Bruno, J.F. A global analysis of the effectiveness of marine protected areas in preventing coral loss. PLoS ONE 2010, 5, e9278. [Google Scholar] [CrossRef] [Green Version]
- Hedges, J.I.; Keil, R.G. Sedimentary organic matter preservation: an assessment and speculative synthesis. Mar. Chem. 1995, 49, 81–115. [Google Scholar] [CrossRef]
- Spalding, D.; Kendirli, E.; Loiver, C.D. The role of forests in global carbon budgeting. In Managing Forest Carbon in a Changing Climate; Ashton, M.S., Tyrrell, M.L., Spalding, D., Gentry, B., Eds.; Springer: Dordrecht, The Netherlands, 2012; pp. 165–179. [Google Scholar]
- Phillips, O.L.; Lewis, S.L. Evaluating the tropical forest carbon sink. Glob. Chang. Biol. 2014, 20, 2039–2041. [Google Scholar] [CrossRef] [PubMed]
- Tyrrell, M.L.; Ross, J.; Kelty, M. Carbon dynamics in the temperate forest. In Managing Forest Carbon in a Changing Climate; Ashton, M.S., Tyrrell, M.L., Spalding, D., Gentry, B., Eds.; Springer: Dordrecht, The Netherlands, 2012; pp. 77–107. [Google Scholar]
- Hansen, M.C.; Stehman, S.V.; Potapov, P.V. Quantification of global gross forest cover loss. Proc. Natl. Acad. Sci. USA 2010, 107, 8650–8655. [Google Scholar] [CrossRef] [PubMed] [Green Version]
- Milakovsky, B.; Frey, B.; James, T. Carbon Dynamics in the Boreal Forest. In Managing Forest Carbon in a Changing Climate; Ashton, M.S., Tyrrell, M.L., Spalding, D., Gentry, B., Eds.; Springer: Dordrecht, The Netherlands, 2012; pp. 109–135. [Google Scholar]
- Grace, J.; José, J.S.; Meir, P.; Miranda, H.S.; Montes, R.A. Productivity and carbon fluxes of tropical savannas. J. Biogeogr. 2006, 33, 387–400. [Google Scholar] [CrossRef]
- Sala, O.E. Temperate grasslands. In Global Biodiversity in a Changing Environment; Chapin, F., Sala, O.E., Huber-Sannwald, E., Eds.; Springer: New York, NY, USA, 2001; pp. 121–137. [Google Scholar]
- Dean, C.; Kirkpatrick, J.B.; Harper, R.J.; Eldridge, D.J. Optimising carbon sequestration in arid and semiarid rangelands. Ecol. Eng. 2015, 74, 148–163. [Google Scholar] [CrossRef]
- Jenkins, C.N.; Joppa, L. Expansion of the global terrestrial protected area system. Biol. Conserv. 2009, 142, 2166–2174. [Google Scholar] [CrossRef]
- Gibbon, A.; Silman, M.R.; Mahli, Y.; Fisher, J.B.; Meir, P.; Zimmermann, M.; Dargie, G.C.; Farfan, W.R.; Garcia, K.C. Ecosystem carbon storage across the grassland-forest transition in the High Andes of Manu National Park, Peru. Ecosystems 2010, 13, 1097–1111. [Google Scholar] [CrossRef]
- Mekonnen, A.; Tolera, M. Carbon stock estimation along altitudinal gradient in Sekele-Mariam dry evergreen montane forest, North-Western Ethiopia. Agric. For. Fish. 2019, 8, 48–53. [Google Scholar] [CrossRef] [Green Version]
- Angonese, J.G.; Grau, H.R. Assessment of swaps and persistence in land cover changes in a subtropical periurban region, NW Argentina. Landsc. Urban Plan 2014, 127, 83–93. [Google Scholar] [CrossRef]
- Martínez, M.L.; Pérez-Maqueo, O.; Vázquez, G.; Castillo-Campos, G.; García-Franco, J.; Mehltreter, K.; Equihua, M.; Landgrave, R. Effects of land use change on biodiversity and ecosystem services in tropical montane cloud forests of Mexico. For. Ecol. Manag. 2009, 258, 1856–1863. [Google Scholar] [CrossRef]
- Ray, D.K.; Nair, U.S.; Lawton, R.O.; Welch, R.M.; Pielke, R.A., Sr. Impact of land use on Costa Rican tropical montane cloud forests: Sensitivity of orographic cloud formation to deforestation in the plains. J. Geophys. Res. 2006, 111, D02108. [Google Scholar] [CrossRef] [Green Version]
- Kidane, Y.; Stahlmann, R.; Beierkuhnlein, C. Vegetation dynamics, and land use and land cover change in the Bale Mountains, Ethiopia. Environ. Monit. Assess. 2012, 184, 7473–7489. [Google Scholar] [CrossRef] [PubMed]
- Hailemariam, S.N.; Soromessa, T.; Teketay, D. Land use and land cover change in the Bale Mountain eco-region of Ethiopia during 1985–2015. Land 2016, 5, 41. [Google Scholar] [CrossRef] [Green Version]
- Kintz, D.B.; Young, K.R.; Crews-Meyer, K.A. Implications of land use/land cover change in the buffer zone of a national park in the tropical Andes. Environ. Manag. 2006, 38, 238–252. [Google Scholar] [CrossRef] [PubMed]
- Song, X.-P.; Hansen, M.C.; Stehman, S.V.; Potapov, P.V.; Tyukavina, A.; Vermote, E.F.; Townshend, J.R. Global land change 1982–2016. Nature 2018, 560, 639–643. [Google Scholar] [CrossRef]
- Evrendilek, F.; Berberoglu, S.; Taskinsu-Meydan, S.; Yilmaz, E. Quantifying carbon budgets of conifer Mediterranean forest ecosystems, Turkey. Environ. Monit. Assess. 2006, 119, 527–543. [Google Scholar] [CrossRef]
- Ruiz-Peinado, R.; Bravo-Oviedo, A.; Lopez-Senespleda, E.; Bravo, F.; del Rio, M. Forest management and carbon sequestration in the Mediterranean region: A review. For. Syst. 2017, 26, eR04S. [Google Scholar] [CrossRef]
- Bravo, F.; Bravo-Oviedo, A.; Diaz-Balteiro, L. Carbon sequestration in Spanish Mediterranean forests under two management alternatives: A modelling approach. Eur. J. For. Res. 2008, 127, 225–234. [Google Scholar] [CrossRef]
- Del Rio, M.; Barbeito, I.; Bravo-Oviedo, A.; Calama, R.; Cañellas, I.; Herrero, C.; Montero, G.; Moreno-Fernández, D.; Ruíz-Peinado, R.; Bravo, F. Mediterranean pine forests: management effects on carbon stocks. In Managing Forest Ecosystems: The Challenge of Climate Change; Bravos, F., Le May, V., Jandl, R., Eds.; Springer: Cham, Switzerland, 2017; pp. 301–327. [Google Scholar]
- Cañellas, I.; Sánchez-González, M.; Bogino, S.M.; Adame, P.; Herrero, C.; Roig, S.; Tomé, M.; Paulo., J.A.; Bravo, F. Silviculture and carbon sequestration in Mediterranean oak forests. In Managing Forest Ecosystems: The Challenge of Climate Change; Bravos, F., Le May, V., Jandl, R., Gadow, K., Eds.; Springer: Cham, Switzerland, 2008; pp. 315–336. [Google Scholar]
- Ruiz-Peinado, R.; Bravo-Oviedo, A.; Lopez-Senespleda, E.; Montero, G.; Río, M. Do thinnings influence biomass and soil carbon stocks in Meriterranean maritime pinewoods? Eur. J. For. Res. 2013, 132, 253–262. [Google Scholar] [CrossRef]
- Ylänne, H.; Olofsson, J.; Oksanen, L.; Stark, S. Consequences of grazer-induced vegetation transitions on ecosystem carbon storage in the tundra. Funct. Ecol. 2018, 32, 1091–1102. [Google Scholar] [CrossRef]
- Sørensen, M.V.; Strimbeck, R.; Nystuen, K.O.; Kapas, R.E.; Enquist, B.J.; Graae, B.J. Draining the pool? Carbon storage and fluxes in three alpine plant communities. Ecosystems 2017, 21, 316–330. [Google Scholar] [CrossRef]
- Dai, L.; Wu, G.; Zhao, J.; Kong, H.; Shao, G.; Deng, H. Carbon cycling of alpine tundra ecosystems on Changbai Mountain and its comparison with arctic tundra. Sci. China Ser. D Earth Sci. 2002, 45, 903–910. [Google Scholar] [CrossRef]
- Michaelson, G.J.; Ping, C.L.; Kimble, J.M. Carbon storage and distribution in tundra soils of Arctic Alaska, USA. Arct. Alp. Res. 1996, 28, 414–424. [Google Scholar] [CrossRef]
- Mack, M.C.; Schuur, E.A.G.; Bret-Harte, M.S.; Shaver, G.R.; Chapin, F.S., III. Ecosystem carbon storage in arctic tundra reduced by long-term nutrient fertilization. Nature 2004, 431, 440–445. [Google Scholar] [CrossRef] [PubMed]
- Campeau, A.B.; Lafleur, P.M.; Humphreys, E.R. Landscape-scale variability in soil organic carbon storage in the central Canadian Arctic. Can. J. Soil Sci. 2014, 94, 477–488. [Google Scholar] [CrossRef]
- Kaiser, C.; Meyer, H.; Biasi, C.; Rusalimova, O.; Barsukov, P.; Richter, A. Storage and mineralization of carbon and nitrogen in soils of a frost-boil tundra ecosystem in Siberia. Appl. Soil Ecol. 2005, 29, 173–183. [Google Scholar] [CrossRef]
- Sjögersten, S.; Wookey, P.A. The impact of climate change on ecosystem carbon dynamics at the Scadinavian mountain birch forest—Tundra heath ecotone. AMBIO 2009, 38, 2–10. [Google Scholar] [CrossRef]
- Kwon, H.-J.; Oechel, W.C.; Zullueta, R.C.; Hastings, S.J. Effects of climate variability on carbon sequestration among adjacent wet sedge tundra and moist tussock tundra ecosystems. J. Geophys. Res. 2006, 111, G03014. [Google Scholar] [CrossRef]
- Runkle, B.R.K.; Sachs, T.; Wille, C.; Pfeiffer, E.-M.; Kutzbach, L. Bulk partitioning the growing season net ecosystem exchange of CO2 in Siberian tundra reveals the seasonality of its carbon sequestration strength. Biogeosciences 2013, 10, 1337–1349. [Google Scholar] [CrossRef] [Green Version]
- Parmentier, F.J.W.; van der Molen, M.K.; van Huissteden, J.; Karsanaev, S.A.; Kononov, A.V.; Suzdalov, D.A.; Maximov, T.C.; Dolman, A.J. Longer growing seasons do not increase net carbon uptake in the northeastern Siberian tundra. J. Geophys. Res. 2011, 116, G04013. [Google Scholar] [CrossRef] [Green Version]
- Kutzbach, L.; Wille, C.; Pfeiffer, E.-M. The exchange of carbon dioxide between wet arctic tundra and the atmosphere at the Lena River Delta, northern Siberia. Biogeosciences 2007, 4, 1953–2005. [Google Scholar] [CrossRef] [Green Version]
- Leifeld, J.; Menichetti, L. The underappreciated potential of peatlands in global climate change mitigation strategies. Nat. Commun. 2018, 9, 1071. [Google Scholar] [CrossRef] [PubMed] [Green Version]
Figure 1.
The relationship of mangrove above- (AGBCorg) and below-ground (BGBCorg) biomass C, soil Corg and total ecosystem Corg stocks in different aged forests in French Guiana [19].
Figure 1.
The relationship of mangrove above- (AGBCorg) and below-ground (BGBCorg) biomass C, soil Corg and total ecosystem Corg stocks in different aged forests in French Guiana [19].

Figure 2.
Annual rates of carbon sequestration in mangrove forests globally. Refs. [6,11,19,28,29,30,31,32,33,34,35,36,37,38,39,40,41,42,43,44,45,46,47,48].


Table 1.
Estimates of organic carbon stocks (Mg Corg ha−1) in mangrove above-ground (AGBCorg) and below-ground root biomass (BGBCorg) and soils (SCorg) to a depth of 1 m. SCorg stock estimates taken from cores < 1 m depth are not presented. Some SCorg stocks were taken from cores > 1 m depth (see Supplementary Table S1). ND = no data. Only references with sufficiently detailed methods and replication were used. References are provided in Supplementary Table S1.
| Country | AGBCorg | BGBCorg | SCorg | Total Corg Stock |
|---|---|---|---|---|
| Africa | ||||
| Benin | 41.6 | 15.8 | ND | ND |
| Cameroon | 102.2 | 38.8 | 1961.1 | 2102.1 |
| Congo | 537.7 | 15.1 | 967.4 | 1520.2 |
| Gabon | 130.0 | 372.0 | 504.3 | 786.3 |
| Ghana | 165.1 | 37.5 | 310.9 | 466.0 |
| Guinea | 59.6 | 22.7 | ND | ND |
| Ivory Coast | 99.8 | 38.8 | ND | ND |
| Kenya | 101.1 | 68.8 | 643.6 | 806.7 |
| Liberia | 50.0 | 297.5 | 342.0 | 950.0 |
| Nigeria | 69.2 | 26.3 | ND | ND |
| Madagascar | 70.6 | 35.8 | 368.3 | 457.3 |
| Mozambique | 95.8 | 36.5 | 216.3 | 348.6 |
| Senegal | 34.0 | 401.0 | 240.0 | 675.0 |
| Sierra Leone | 62.7 | 23.8 | ND | ND |
| South Africa | 6.7 | ND | 228.1 | 234.8 |
| Tanzania | 55.7 | 50.2 | 293.4 | 397.1 |
| Togo | 42.9 | 16.3 | ND | ND |
| Southeast Asia | ||||
| Cambodia | ND | ND | ND | 657.4 |
| Indonesia | 142.0 | 335.9 | 420.1 | 794.9 |
| Malaysia | 119.7 | 5.9 | 763.0 | 894.4 |
| Myanmar | 20.7 | 18.4 | 167.0 | 206.1 |
| Philippines | 161.4 | 63.1 | 450.2 | 549.0 |
| Singapore | 105.0 | 39.9 | 307.3 | 452.3 |
| Thailand | 68.0 | 108.7 | 604.7 | 754.1 |
| Vietnam | 120.0 | 21.8 | 768.0 | 968.7 |
| South and East Asia | ||||
| Bangladesh | 81.4 | 42.3 | 438.9 | 565.6 |
| China | 89.5 | 30.3 | 380.1 | 499.9 |
| India | 88.0 | 33.6 | 81.3 | 248.5 |
| Japan | 57.9 | 27.0 | 154.2 | 239.1 |
| Pakistan | 93.3 | 39.0 | ND | ND |
| Sri Lanka | 151.7 | 30.0 | 362.1 | 543.7 |
| Central and North America and Caribbean | ||||
| Belize | 42.4 | 725.0 | 333.4 | 738.3 |
| Costa Rica | 101.4 | 484.0 | 480.5 | 845.0 |
| Dominican Republic | 50.5 | 112.3 | 690.8 | 853.5 |
| Honduras | 85.5 | 509 | 794.0 | 1222.4 |
| Mexico | 109.1 | 88.8 | 643.1 | 810.7 |
| Panama | 33.0 | 365.0 | 531.0 | 929.0 |
| USA | 62.7 | 12.6 | 201.4 | 272.5 |
| South America | ||||
| Brazil | 87.9 | 33.8 | 310.6 | 432.3 |
| Colombia | 84.2 | 382.2 | 159.0 | 648.2 |
| Ecuador | 100.7 | ND | 407.0 | 507.7 |
| French Guiana | 91.2 | 31.8 | 149.2 | 272.1 |
| Guyana | 176.5 | ND | ND | ND |
| Middle East | ||||
| Egypt | ND | ND | 389.4 | ND |
| Iran | 46.1 | 65.6 | 227.3 | 339.0 |
| Saudi Arabia | ND | ND | 92.0 | ND |
| United Arab Emirates | 25.4 | 31.7 | 123.2 | 180.4 |
| Australia and New Zealand | ||||
| Australia | 84.8 | 177.0 | 726.6 | 870.3 |
| New Zealand | 17.0 | 21.4 | 73.5 | 103.0 |
| Pacific Islands | ||||
| Hawaii | 179.3 | 78.3 | 197.1 | 464.0 |
| Kosrae | 256.4 | 237.9 | 694.1 | 1188.0 |
| Palau | 117.9 | 100.0 | 522.1 | 739.9 |
| Yap | 249.9 | 201.6 | 714.1 | 1165.7 |
| Global Means | ||||
| AGBCorg | BGBCorg | SCorg | Total Corg Stock | |
| Mean | 109.3 | 80.9 | 565.4 | 738.9 |
| ±1SE | 5.0 | 9.5 | 25.7 | 27.9 |
| n | 274 | 176 | 243 | 224 |
| Median | 94.1 | 34.1 | 500.5 | 702.5 |
| Min | 1.9 | 0.3 | 37.0 | 46.3 |
| Max | 537.7 | 866.0 | 2102.7 | 2205.0 |
Table 2.
Losses of blue carbon via CO2 eq (Mg ha−1·a−1) emissions from degraded mangroves worldwide. ND = no data. a = Mg CO2 eq ha−1 lost immediately upon conversion/hurricane disturbance; b = above-ground biomass C losses only.
Table 2.
Losses of blue carbon via CO2 eq (Mg ha−1·a−1) emissions from degraded mangroves worldwide. ND = no data. a = Mg CO2 eq ha−1 lost immediately upon conversion/hurricane disturbance; b = above-ground biomass C losses only.
| Disturbance | Location | Method for Estimating CO2 Emission | Years Since Disturbance | CO2 eq Emission | Reference |
|---|---|---|---|---|---|
| Deforestation | Belize | Flux chambers | 1 | 106 | [53] |
| 20 | 30 | ||||
| New Zealand | 0.1–8 | 21.4 | [54] | ||
| Cambodia | 10–15 | 48 | [55] | ||
| Conversion to aquaculture and/or cattle pastures | Indonesia | 25 | 16 | [56] | |
| Indonesia | 25 | 44 | |||
| Dominican Republic | Change in SCorg | 29 | 82 | [57] | |
| NE Brazil | Change in ecosystem Corg stock | 8–12 | 1392 a | [51] | |
| Mexico | 7–30 | 2610 a | [52] | ||
| Honduras | ND | 1068.4 a | |||
| Costa Rica | ND | 1811.9 a | |||
| Indonesia | ND | 2544.0 a | |||
| Dominican Republic | ND | 2781.5 a | |||
| Thailand | 10 | 179 | [58] | ||
| Mahakam delta, Borneo | 16 | 120 | [59] | ||
| Tree mortality | Kenya | Change in soil volume and gas flux | 2 | 25.3–35.6 | [60] |
| Hurricane/typhoon damage | Honduras | Difference in C inventory between disturbed and undisturbed mangroves | 2 | 18.7 | [61] |
| Global data | 30 | 33.9 | |||
| 30 | 27.2 | [62] | |||
| 30 | 20.4 | ||||
| Vietnam | Difference in C inventory between disturbed and undisturbed mangroves | 14 | 106.3 | [63] | |
| SW Florida | Loss total ecosystem Corg | 14 | 25.7–216.5 a | [64] | |
| Natural erosion, conversion to agriculture | Rufiji delta | C inventory and remote sensing | 16 | 119.7 | [65] |
| Zambezi delta | 16 | 98.9 | |||
| Ganges delta | 16 | 98.6 | |||
| Mekong delta | 16 | 88.4 | |||
| Abandoned fishponds | Philippines | ∆in C inventory abandoned and natural mangroves | 11–15 | 407.9 a | [66] |
| Various land use changes | Mexico | ∆in C inventory, loss of mangroves | 20 | 14.8 | [67] |
| Sundarbans, India | 38 | 3.7 b | [68] |
Table 3.
Estimated area-specific and global C stocks, C sequestration rates and CO2 emissions due to losses from mangrove forests, salt marshes, seagrass meadows, coral reefs, the tropical coastal ocean and terrestrial ecosystems.
Table 3.
Estimated area-specific and global C stocks, C sequestration rates and CO2 emissions due to losses from mangrove forests, salt marshes, seagrass meadows, coral reefs, the tropical coastal ocean and terrestrial ecosystems.
| Ecosystem | Area (106 ha) | Mean C Stock (Mg Corg ha−1) | Global Mean C Stock (Pg Corg) | Mean C Sequestration (g Corg m−2 a−1) | Global C Sequestration (Tg Corg a−1) | Current Conversion Rate (% a−1) | Carbon Emissions (Pg CO2-eq a−1) |
|---|---|---|---|---|---|---|---|
| Mangrove | 8.34 [6] | 738.9 a | 6.17 a | 179.6 a | 14.98 | 0.16 [13,15] | 0.088 b (0.036) |
| Salt Marsh | 5.50 [72] | 317.2 [6] | 1.74 | 212.0 [6] | 11.66 | 1.32 [73] | 0.084 |
| Seagrass | 16.0 [74] | 163.3 [6] | 2.61 | 220.7 [6] | 35.31 | 1.5 [7] | 0.144 |
| Coral Reef | 52.7 [75] | 0.6 [76,77] | 0.03 | 5.69 [78] | 3.0 | 0.43 [79] | 0.0005 |
| Tropical coastal ocean | 710.0 [71] | 50.7 [80] | 36.0 | 0.55 [71] | 3.9 | 0.93 c | 0.5 |
| Tropical forest | 1760 [81] | 314.2 [81] | 553.0 | 62.5 | 1100.0 [82] | 0.53 [83] | 10.8 |
| Temperate forest | 1040 [81] | 280.8 [81] | 292.1 | 28.9 | 300.0 [83] | 0.70 [84] | 7.5 |
| Boreal forest | 1370 [81] | 288.3 [85] | 395.0 | 18.0 [85] | 246.6 | 0.80 [84] | 11.6 |
| Tropical grassland/savanna | 2250 [81] | 202.4 [86] | 455.4 | 14.0 [86] | 315.0 | 0.70 [86] | 11.7 |
| Temperate grassland | 1250 [81] | 181.1 [86] | 226.4 | 16.8 | 210.0 [86] | 0.55 [87] | 4.6 |
| Desert and xericshrub land | 4550 [81] | 26.3 [88] | 119.7 | 9.5 [88] | 432.3 | 0.3 [88] | 1.3 |
| Montane grasslands/forests | 519 [89] | 173.9 [90,91] | 90.3 | ND | ND | 0.49 [92,93,94,95,96,97,98] | 1.6 |
| Mediterraneanforest | 322 [89] | 271.4 [99,100,101,102,103,104] | 87.4 | 65.8 [101,102,103] | 212.8 | ND | ND |
| Tundra | 835 [89] | 1779.6 [105,106,107,108,109,110,111] | 1486.0 | 63.2 [112,113,114,115,116] | 528.0 | ND | ND |
| Boreal peatlands | 361 [117] | 1182.8 | 427.0 [117] | 53.1 [117] | 191.7 | ND | 0.26 [117] |
| Tropical peatlands | 58.7 [117] | 2030.7 | 119.2 [117] | 54.2 [117] | 31.8 | ND | 1.48 [117] |
© 2020 by the author. Licensee MDPI, Basel, Switzerland. This article is an open access article distributed under the terms and conditions of the Creative Commons Attribution (CC BY) license (http://creativecommons.org/licenses/by/4.0/).
Share and Cite
MDPI and ACS Style
Alongi, D.M. Global Significance of Mangrove Blue Carbon in Climate Change Mitigation. Sci 2020, 2, 67. https://0-doi-org.brum.beds.ac.uk/10.3390/sci2030067
AMA Style
Alongi DM. Global Significance of Mangrove Blue Carbon in Climate Change Mitigation. Sci. 2020; 2(3):67. https://0-doi-org.brum.beds.ac.uk/10.3390/sci2030067
Chicago/Turabian StyleAlongi, Daniel M. 2020. "Global Significance of Mangrove Blue Carbon in Climate Change Mitigation" Sci 2, no. 3: 67. https://0-doi-org.brum.beds.ac.uk/10.3390/sci2030067