Article

Vascular Adhesion Protein 1 Mediates Gut Microbial Flagellin-Induced Inflammation, Leukocyte Infiltration, and Hepatic Steatosis

1
Institute of Biomedicine, Faculty of Medicine, University of Turku, 20014 Turku, Finland
2
Medicity Research Laboratory, University of Turku, 20014 Turku, Finland
3
Department of Clinical Microbiology and Immunology, Turku University Hospital, 20521 Turku, Finland
4
Turku Centre for Biotechnology, 20014 Turku, Finland
5
Faculty of Sport and Health Sciences, University of Jyväskylä, 40014 Jyväskylä, Finland
*
Author to whom correspondence should be addressed.
These authors contributed equally to this work.
Submission received: 7 November 2019 / Revised: 13 January 2021 / Accepted: 29 January 2021 / Published: 2 February 2021

Abstract

:
Toll-like receptor 5 ligand, flagellin, and vascular adhesion protein 1 (VAP-1) are involved in non-alcoholic fatty liver disease. This study aimed to determine whether VAP-1 mediates flagellin-induced hepatic fat accumulation. The effects of flagellin on adipocyte VAP-1 expression were first studied in vitro. Then, flagellin (100 ng/mouse) or saline was intraperitoneally injected into C57BL/6J (WT) and C57BL/6-Aoc3-/- (VAP-1 KO) mice on a high-fat diet twice a week every 2 weeks for 10 weeks. After that, the effects on inflammation, insulin signaling, and metabolism were studied in liver and adipose tissues. Hepatic fat was quantified histologically and biochemically. Because flagellin challenge increased VAP-1 expression in human adipocytes, we used VAP-1 KO mice to determine whether VAP-1 regulates the inflammatory and metabolic effects of flagellin in vivo. In mice, VAP-1 mediated flagellin-induced inflammation, leukocyte infiltration, and lipolysis in visceral adipose tissue. Consequently, an increased release of glycerol led to hepatic steatosis in WT, but not in KO mice. Flagellin-induced hepatic fibrosis was not mediated by VAP-1. VAP-1 KO mice harbored more inflammation-related microbes than WT mice, while flagellin did not affect the gut microbiota. Our results suggest that by acting on visceral adipose tissue, flagellin increased leukocyte infiltration that induced lipolysis. Further, the released glycerol participated in hepatic fat accumulation. In conclusion, the results describe that gut microbial flagellin through VAP-1 induced hepatic steatosis.

1. Introduction

Despite the high occurrence of non-alcoholic fatty liver disease (NAFLD), the exact causes of the disease remain largely unknown. However, it is increasingly accepted that the pathogenesis of NAFLD involves multiple simultaneous “hits” that are associated with environmental, host genetics, and physiological factors [1] including, for instance, inflammatory mediators [2], increased lipid storage, lipogenesis [3], and mitochondrial dysfunction [4]. Recent studies have also highlighted the importance of adipose tissue dysfunction and insulin resistance [5], as well as gut-derived signals [6], in the pathogenesis of NAFLD.
During the last decade, gut microbiota studies have advanced from detecting associations to show some of the underlying mechanisms that link microbes to NAFLD. Our findings indicated that human subjects with high hepatic fat content over-expressed several pathogen-associated molecular-pattern-recognizing toll-like receptor (TLR) signaling genes in subcutaneous adipose tissue [7]. Of the ten TLR family members that are present in humans [8], adipose tissue TLR5 associated positively with hepatic fat content and negatively with adipose tissue insulin sensitivity [9]. Further, our in vitro experiments suggested that by increasing lipolysis in adipocytes, TLR5 ligand flagellin (FLG) induced fat accumulation in hepatocytes [9]. Whether FLG induces hepatic fat accumulation in vivo is currently unknown.
Nevertheless, the role of TLR5 in hepatic health is not without controversies. In TLR5-deficient mice, gut-microbiota-dependent hepatic lipogenesis was reduced [10]. Another study reported that hepatic TLR5 prevented the onset of gut-microbiota-induced liver disease [11]. While these results suggest that TLR5 protects from liver diseases, prolonged exposure to circulating FLG has been linked to an increased risk for hepatocellular carcinoma [12], and, at high dosage, FLG was shown to induce liver injury [13]. Therefore, the physiological effects of FLG need further clarification.
We have also shown that pro-inflammatory vascular adhesion protein 1 (VAP-1) is involved in NAFLD [14]. VAP-1 is a multifunctional protein that supports leukocyte extravasation in adipocytes and endothelial cells by enzyme-activity-independent and -dependent mechanisms and has insulin-like effects on energy metabolism [15]. We have observed that the amine oxidase activity of VAP-1 was involved in a bacterial lipopolysaccharide-induced inflammation model [16], but, so far, it is unknown whether VAP-1 mediates the inflammatory effects of other bacterial surface molecules, including FLG. Therefore, in this study, we first determined whether FLG affects VAP-1 expression in cultured adipocytes, which are important mediators of hepatic fat accumulation. Indeed, FLG challenge increased the expression of VAP-1, which is in agreement with our previous findings, showing that FLG induced inflammation in adipocytes. Therefore, we further determined whether VAP-1 arbitrates the FLG-induced physiological changes in vivo.

2. Materials and Methods

2.1. Animals

The animal experiment was approved by the ethics committee of the Southern Finland Regional State Administrative Agency, Finland (ESAVI/6025/04.10.07/2017) and was performed in accordance with the relevant guidelines and regulations. Aged 8–10 weeks old, C57BL/6J (wild-type (WT)) female mice and C57BL/6-Aoc3-/- (VAP-1 KO, derived from C5BL/6J) female mice, back-grossed 13 times to their controls, were raised at the University of Turku, Finland. The mice were randomly divided into control (CTRL) and FLG groups (n = 6/group, 3 mice/cage) and were housed in IVC racks. The mice had food and water ad libitum and were kept on a 12/12-h light/dark cycle. The irradiated high-fat diet (HFD; #58126 DIO Rodent Purified Diet w/60% of energy) was purchased from Labdiet/Testdiet, UK. The ultrapure and endotoxin-free Salmonella typhimurium FLG was purchased from Invivogen (San Diego, CA, USA) and was dissolved in endotoxin-free H2O. FLG was injected intraperitoneally twice a week every 2 weeks for 10 weeks using a dosage of 100 ng/mouse dissolved in 100 µL of PBS. The CTRL group received 100 µL of PBS. After that, the mice were euthanized as described below to allow tissue-specific analyses.

2.2. Adipocyte Cell Cultures, FLG Exposure, and Protein Extraction

The human SGBS adipose cells were a kind gift from Professor Pamela Fischer-Posovszky [17]. The SGBS cells were maintained as preadipocytes in DMEM/F12 supplemented with 10% FBS (Invitrogen, Carslbad, CA, USA), 0.17 µM panthotenate plus 0.33 µM biotin (P/B, Sigma-Aldrich, St. Louis, MO, USA), and penicillin/streptomycin solution (Invitrogen). The preadipocytes were differentiated into the mature adipocytes by incubating them first for four days in DMEM/F12 supplemented with P/B, 0.01 mg/mL transferrin, 20 nM insulin, 100 nM cortisol, 0.2 nM triiodothyronine, 25 nM dexamethasone, 250 µM IBMX, and 2 µM rosiglitazone (all from Sigma-Aldrich). Afterwards, the medium was replaced by DMEM/F12 supplemented with P/B, 0.01 mg/mL transferrin, 20 nM insulin, 100 nM cortisol, and 0.2 nM triiodothyronine for ten days. To challenge the cells, endotoxin-free H2O as a vehicle or 10 ng/mL of FLG was added to the cultures for 4 h. The total proteins from the challenged adipocytes were extracted at +4 °C with ice-cold lysis buffer (10 mM Tris-HCl, 150 mM NaCl2, 2 mM EDTA, 1% Triton X-100, 10% glycerol, and 1 mM DTT) that was supplemented with protease and phosphatase inhibitors (Sigma-Aldrich). The supernatant was separated by centrifuging the homogenate at +4 °C for 20 min, 12,000× g.

2.3. Murine Tissue Collection, Multiplex ELISA, and Blood Analyses

After the 10-week treatment period, the overnight-fasted mice were anesthetized with CO2 and euthanized by cardiac puncture followed by cervical dislocation. Serum glycerol levels were analyzed using a Konelab20XTi analyzer (Diagnostic Products Corporation, Los Angeles, CA, USA).
The subcutaneous (SAT) and visceral (VAT) adipose tissue, liver, and colon (after emptying the colon contents, see below in Section 2.7) were harvested, weighted, immersed in liquid nitrogen, and stored at −80 °C. For the protein and gene expression analyses and functional measurements, the tissues were pulverized in liquid nitrogen to obtain a homogeneous mixture of the whole tissues.
A sixteen-plex cytokine ELISA (kit 110349MS) was completed from VAT protein homogenates (in 10 mM Tris-HCl pH 7.4, 150 mM NaCl2, 2 mM EDTA, 1% Triton X-100, 10% glycerol, and 1 mM DTT) using Quansys and Q-View software (Quansys Biosciences, Logan, UT, USA). The limit of detection for each cytokine was as follows: interleukin (IL)1a 0.93, IL1b 30, IL2 1.67, IL3 4.78, IL4 24.51, IL5 1.08, IL6 0.83, IL6 0.83, monocyte chemotactic protein 1 (MCP-1) 5.97, granulocyte–macrophage colony-stimulating factor (GM-CSF) 0.59, IL17 87.35, IL10 1.16, IL12 0.3, IL17 87.35, interferon γ (IFN-γ) 0.94, tumor necrosis factor α (TNFa) 0.49, macrophage inflammatory protein α (MIP-1a) 0.5, and RANTES pg/mL.

2.4. Liver Fat Content Measurement

The total hepatic lipids were extracted by homogenizing ~20 mg of pulverized liver in chloroform–methanol. The homogenates were then agitated, and the solvents were washed with 0.9% NaCl. After separating the phases by centrifugation, the organic phase was evaporated using a vacuum (Speedvac Savant, Thermo Scientific, Waltham, MA, USA). The dried lipid pellet was dissolved in ethanol, and the triglyceride and cholesterol content was determined with a Konelab 20XTi analyzer.

2.5. Real-Time Quantitative mRNA, Protein, Citrate Synthase, Xanthine Oxidase, 3-hydroxyacyl-CoA Dehydrogenase 8, and AST and ALT Analyses

The total RNA was extracted from ~100 mg of pulverized SAT and VAT and ~20 mg of pulverized liver and colon by homogenizing with TissueLyser (Qiagen, Valencia, CA, USA) in Trizol reagent (Invitrogen) according to the supplied protocol. The total RNA was reverse transcribed using the High-Capacity cDNA Synthesis Kit (Applied Biosystems, Foster City, CA, USA) according to the instructions of the manufacturer.
Real-time quantitative PCR (qPCR) analysis was performed according to MIQE guidelines using iQ SYBR Supermix and the CFX96™ Real-Time PCR Detection System (Bio-Rad Laboratories, Richmond, CA, USA). The sequences of the in-house designed primers are presented in Table 1. The expression levels of mRNA were normalized to mRNA levels of the housekeeping gene, β-actin (Actb), and the relative expression levels were calculated using a standard curve.
The total proteins from ~100 mg of pulverized SAT and VAT were extracted in ice-cold lysis buffer (10 mM Tris-HCl pH 7.4, 150 mM NaCl2, 2 mM EDTA, 1% Triton X-100, 10% glycerol, and 1 mM DTT). The proteins from ~20 mg of pulverized liver were extracted at +4 °C using 10 × weight of ice-cold lysis buffer (50 mM Tris-HCl pH 7.4, 150 mM NaCl2, 1% NP-40, and 0.5% sodium deoxycholate, 0.1% SDS, and 1 mM DTT). Each buffer was supplemented with protease and phosphatase inhibitors (Sigma-Aldrich, St. Louis, MO, USA). The tissues were homogenized with TissueLyser (Qiagen), kept on ice for 30 min, and centrifuged for 10 min at 12,000× g. To remove excess lipids, adipose tissue protein extracts were centrifuged twice.
A total of 20–40 micrograms of the proteins were separated using 4–20% Criterion gradient gels (Bio-Rad Laboratories) and transferred to nitrocellulose membranes. After blocking, the membranes were probed overnight at +4 °C with primary antibodies purchased from Cell Signaling Technology (Danvers, MA, USA) and Sigma-Aldrich (anti-GAPDH). Odyssey anti-rabbit IRDye 800CW or anti-rat IRDye 680RD (LI-COR Biosciences, Lincoln, NE, USA) was used as a secondary antibody. Finally, the blots were scanned and quantified using the Odyssey CLX Infrared Imager of LI-COR and the manufacturer’s software. All samples and results were normalized to two Ponceau S-stained bands due to differences in the expression levels of housekeeping GAPDH between the groups, except VAT and adipocyte VAP-1, which could be normalized to GAPDH.
To analyze the activities of citrate synthase (CS), xanthine oxidase (XO), 3-hydroxyacyl-CoA dehydrogenase 8 (β-HAD), aspartate aminotransferase (AST), and alanine aminotransferase (ALT), ~20 mg of pulverized liver tissues was homogenized using ice-cold lysis buffer (10 mM Tris-HCl, 150 mM NaCl2, 2 mM EDTA, 1% Triton X-100, 10% glycerol, and 1 mM DTT) that was supplemented with protease and phosphatase inhibitors (Sigma-Aldrich, St Louis, MO, USA) using TissueLyser (Qiagen, Valencia, CA, USA). After centrifugation at 12,000× g, the activity of CS, XO, AST, and ALT was measured from liver protein extracts with a Konelab 20XTi analyzer using commercial kits. β-HAD activity was measured with the Konelab 20XTi in a solution that contained 50 mM triethanolamine-HCl (pH 7.0), 4 mM EDTA, 0.04 mM NADH, and 0.015 mM S-acetoacyl CoA.

2.6. Histological and Immunohistochemical Analyses

Tris-buffered zinc fixative (2.8 mM calcium acetate, 22.8 mM zinc acetate, and 36.7 mM zinc chloride in 0.1 M Tris-buffer, pH 7.4) was used to fix the adipose tissues. After paraffin and endogenous peroxidase removal, the sections were stained with a Vectastain Elite ABC Kit (PK-6104 Vector Laboratories) as specified by the manufacturer. The primary antibody was anti-mouse CD45 (clone 30F11, BD 553076) 1 µg/mL (overnight at +4 °C) or a negative control antibody. Diaminobenzedine (DAKO) was used as a chromogen, and Mayer’s hematoxylin was used to counterstain the sections. CD45 cells were counted manually from 10 to 15 randomly selected fields, and the results are shown as the number of cells divided by the number of fields. The adipocyte sizes from 500 randomly selected cells in each sample were determined with CellProfiler 2.2.0 from the H&E-stained SAT sections. Then, the percentage (%) of 10–20, 20–30, and 30–40 µM-sized adipocytes of the selected cells was calculated.
The frozen liver sections were stained with Oil Red O as previously described [18]. The fat content was scored according to the droplet sizes as 0 (smallest), 1, 2, and 3 (largest). Fibrosis was studied with Van Gieson staining that was semi-quantitatively scored as follows: 0–0.5 (no damage), 1–2 (damage), and 3 (severe damage).

2.7. 16S rRNA Gene Amplicon Sequencing and the Analysis of the Gut Microbiota Composition

The colon contents were collected and snap-frozen immediately in liquid nitrogen. The samples were stored at −75 °C. DNA was extracted with the semi-automated GenoXtract and Stool Extraction Kit (Hain Lifesciences, Nehren, Germany) accompanied with an additional homogenization by bead-beating in 0.5 mm Glass PowerBead Tubes (Qiagen, Hilden, Germany) with the MO BIO PowerLyzer 24 Homogenizer (MO BIO Laboratories, Inc., San Diego, CA, USA). The microbiota composition was analyzed with next-generation sequencing as previously described [19]. Briefly, the V4 region of the bacterial 16S rRNA gene was amplified with barcoded primers, and the PCR products were purified with Agencourt AMPure XP magnetic beads (Beckman Coulter, Inc., Brea, CA, USA) utilizing the DynaMag™-96 magnetic plate (Invitrogen). The product length and DNA integrity were checked with TapeStation (Agilent Technologies Inc., Santa Clara, CA, USA), and the final DNA concentrations were measured with a Qubit 2.0 fluorometer (Invitrogen). The sequencing was performed with the Illumina Miseq system. The FastQC program (http://www.bioinformatics.babraham.ac.uk/projects/fastqc/) was used to check the quality of the sequence data, and the dataset and statistics were analyzed with the QIIME 1.9 pipeline [20].

2.8. Statistical Analyses

All statistical analyses were done using IBM SPSS Statistics version 24 for Windows (SPSS, Chicago, IL, USA). The group comparisons were carried out by analyzing the data with either an ANOVA or the Mann–Whitney U test depending on whether the data were normally distributed according to the Shapiro–Wilk test in SPSS. Group-wise comparisons were carried out between the WT CTRL and WT FLG, VAP-1 KO CTRL and VAP-1 KO FLG, WT CTRL and VAP-1 KO CTRL, as well as WT FLG and VAP-1 KO FLG. The group differences in the gut microbiota composition were analyzed by the Kruskal–Wallis test using the QIIME 1.9 pipeline followed by the Benjamini–Hochberg false discovery rate (FDR) correction [20]. The statistical significance was set at p < 0.05, unless otherwise stated.

3. Results

3.1. VAP-1 Mediated the FLG-Induced Inflammation and Lipolysis in VAT and Consequently Hepatic Fat Accumulation

FLG challenge increased the expression of VAP-1 monomer in cultured human adipocytes (p = 0.021) and in the VAT of the WT mice (p = 0.036, Figure 1a). As expected, no VAP-1 expression was detected in the VAT of the KO mice.
Because VAP-1 mediates leukocyte infiltration into the adipose tissue [21], we next determined the effects of FLG on VAT inflammation and lipolysis. Sixteen cytokines were analyzed from VAT protein homogenates. We found that in WT mice, FLG induced an increase in the concentrations of interleukin 1 beta (IL1β, p = 0.048), MCP-1 (CCL2, p = 0.01), and GM-CSF (CSF2, p = 0.016) (Figure 1b). These increases were not detected in KO mice, and FLG-injected groups did not differ from each other. The most remarkable increase was in MCP-1, which was undetected in WT CTRL (<5.97 pg/mL) and over 60 pg/mL in FLG-treated mice. VAP-1 also mediated the tendency of FLG to increase IL6 (p = 0.063, Figure 1c). No differences were observed in IL1a, IL3, IL4, IL5, IL12, IL17, or RANTES (data not shown). Under the detection limit remained IL2 (<1.67 pg/mL), IL10 (<1.16 pg/mL), IFN-γ (<0.97 pg/mL), and MIP-1a (CCL3 < 0.5 pg/mL). However, VAP-1 KO mice had higher levels of MCP-1 (p = 0.038) and GM-CSF (p = 0.01) than the WT CTRL mice, suggesting that only the FLG-induced increase in IL1β was truly VAP-1 mediated. Therefore, the increased expression of Il1b mRNA in FLG-treated WT mice was further confirmed by qPCR (p = 0.043, Figure 1b).
In agreement with the increased leukocyte-attracting cytokines in VAT, the FLG-treated WT mice had more CD45-positive inflammatory cells (p = 0.003, Figure 1c) in VAT that was impeded by VAP-1 KO. VAP-1 also regulated FLG-induced phosphorylation of the lipolysis-activating hormone-sensitive lipase (HSL) (p = 0.029, Figure 1d) and the FLG-suppressed mRNA expression of the lipid droplet membrane protein, Perilipin 1 (Plin1) (p = 0.01, Figure 1d). Consequently, the increased lipolysis was reflected in higher serum levels of the lipolysis end product, glycerol, in the FLG-injected WT mice compared to the CTRL mice (p = 0.009, Figure 1d). Because lipolysis was not increased in the VAP-1 KO mice, they had lower levels of serum glycerol than the WT mice (p = 0.006, Figure 1d). The higher serum glycerol, which serves for triglyceride synthesis in the liver, led to a higher hepatic fat content in FLG-treated WT mice (p = 0.005, Figure 2a), indicating steatosis that was regulated by VAP-1. The histological results were confirmed by extracting the total lipids from the liver. The FLG-injected WT mice had a higher hepatic triglyceride content than the WT CTRL mice (p = 0.002) and the FLG-injected KO mice (p < 0.001) (Figure 2b). We further determined whether the hepatic fat accumulation was accompanied with fibrosis. Van Gieson staining showed slight fibrotic lesions in the FLG-injected WT (p = 0.024) and KO (p = 0.002) mice compared to the controls (Figure 2c). VAP-1 also mediated the FLG-induced expression of Mmp9 mRNA (p = 0.004, Figure 2c), which has been previously linked to hepatic fibrosis [22].
The hepatic tricarboxylic acid cycle (TCA)cycle activity was assessed by determining the activities of CS, AST, and ALT from liver protein homogenates, and the beta-oxidation rate was estimated by measuring β-HAD activity. While no differences in the activity of CS or β-HAD were found (data not shown), both AST (p = 0.041) and ALT activity (p = 0.004, Figure 2d), which end up supplying substrates to the TCA cycle, were decreased in the livers of the FLG-injected WT mice, but, in the absence of VAP-1, FLG increased AST (p = 0.015, Figure 2d). We also determined whether the hepatic fat accumulation was accompanied with an increased redox state. The activity of XO, which produces superoxides, did not differ between the groups (Figure 2e), but the FLG-induced expression of the mRNA of superoxide dismutase (Sod1), which eliminates superoxides, was mediated by VAP-1 (p = 0.046, Figure 2e).

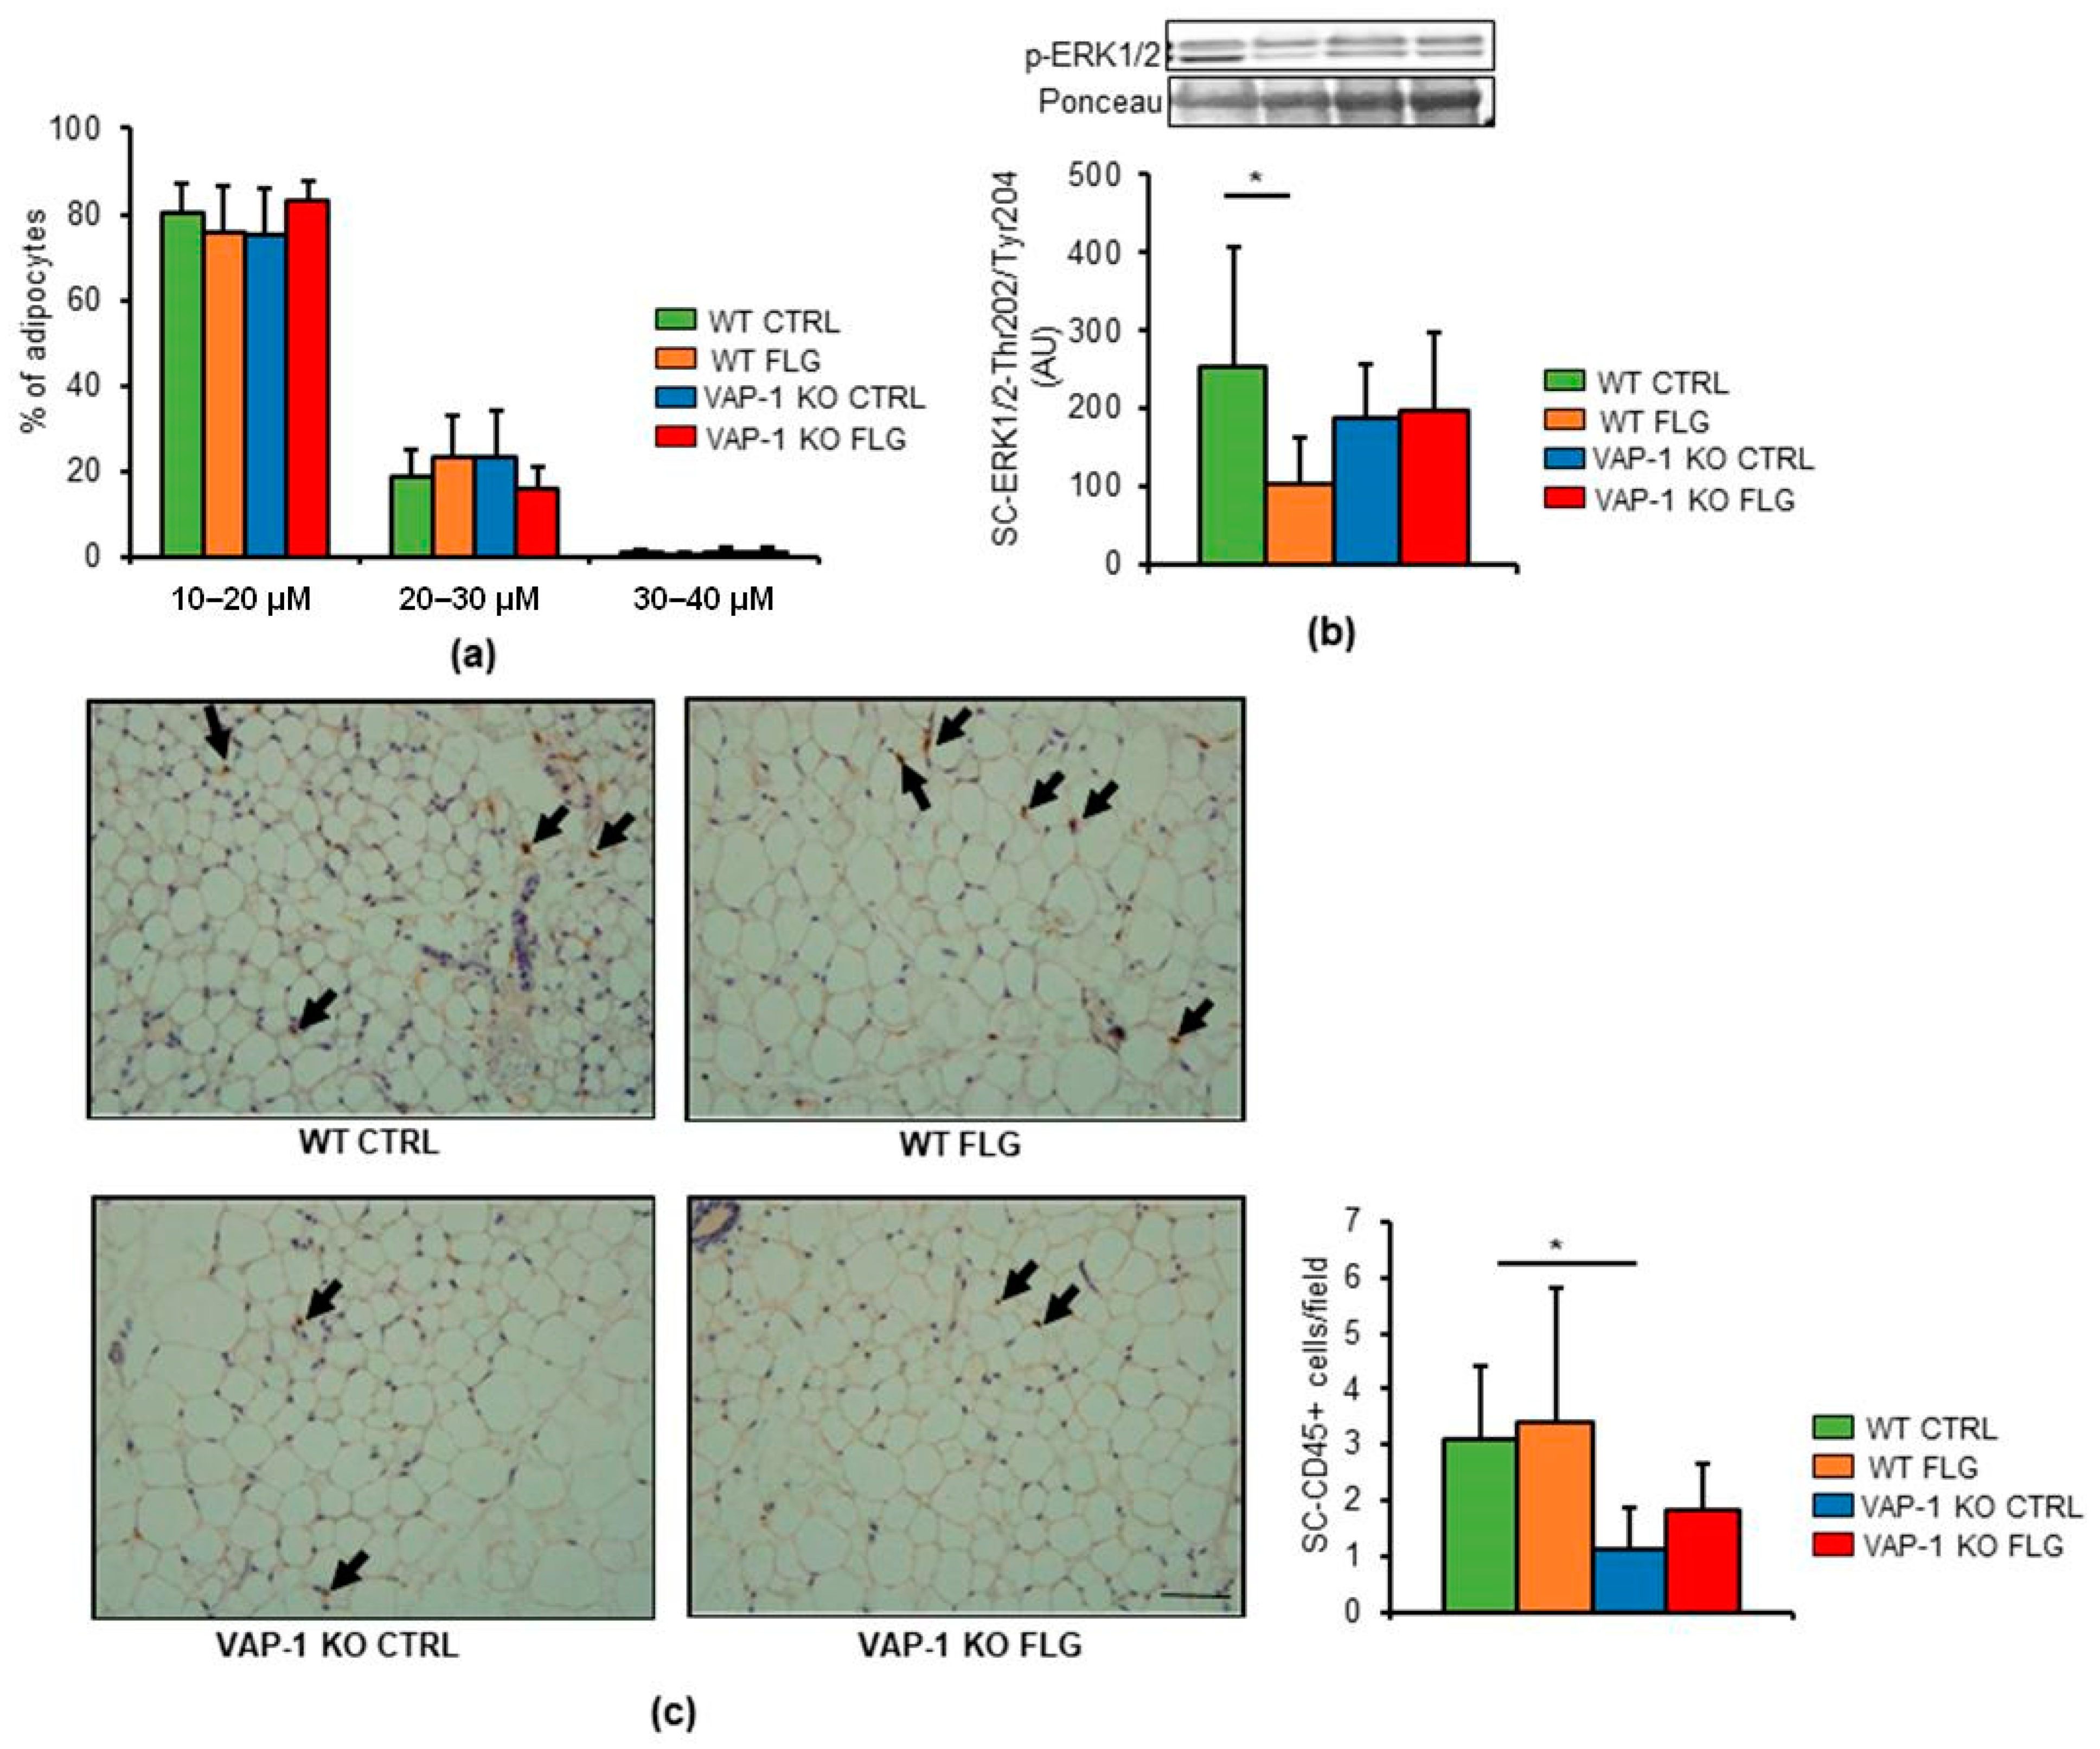
3.2. VAP-1 Mediated the FLG-Induced Decrease in ERK1/2 Phosphorylation in SAT

FLG did not increase SAT mass (data not shown) and neither did the groups differ from each other in adipocyte sizes (Figure 3a). VAP-1 mediated the decrease in the phosphorylation of ERK1/2 (p = 0.032, Figure 3b) caused by the FLG treatment. While FLG did not increase the number of CD45-positive cells in SAT, a reduced number of cells was detected in the KO CTRL compared to the WT CTRL (p = 0.042, Figure 3c).

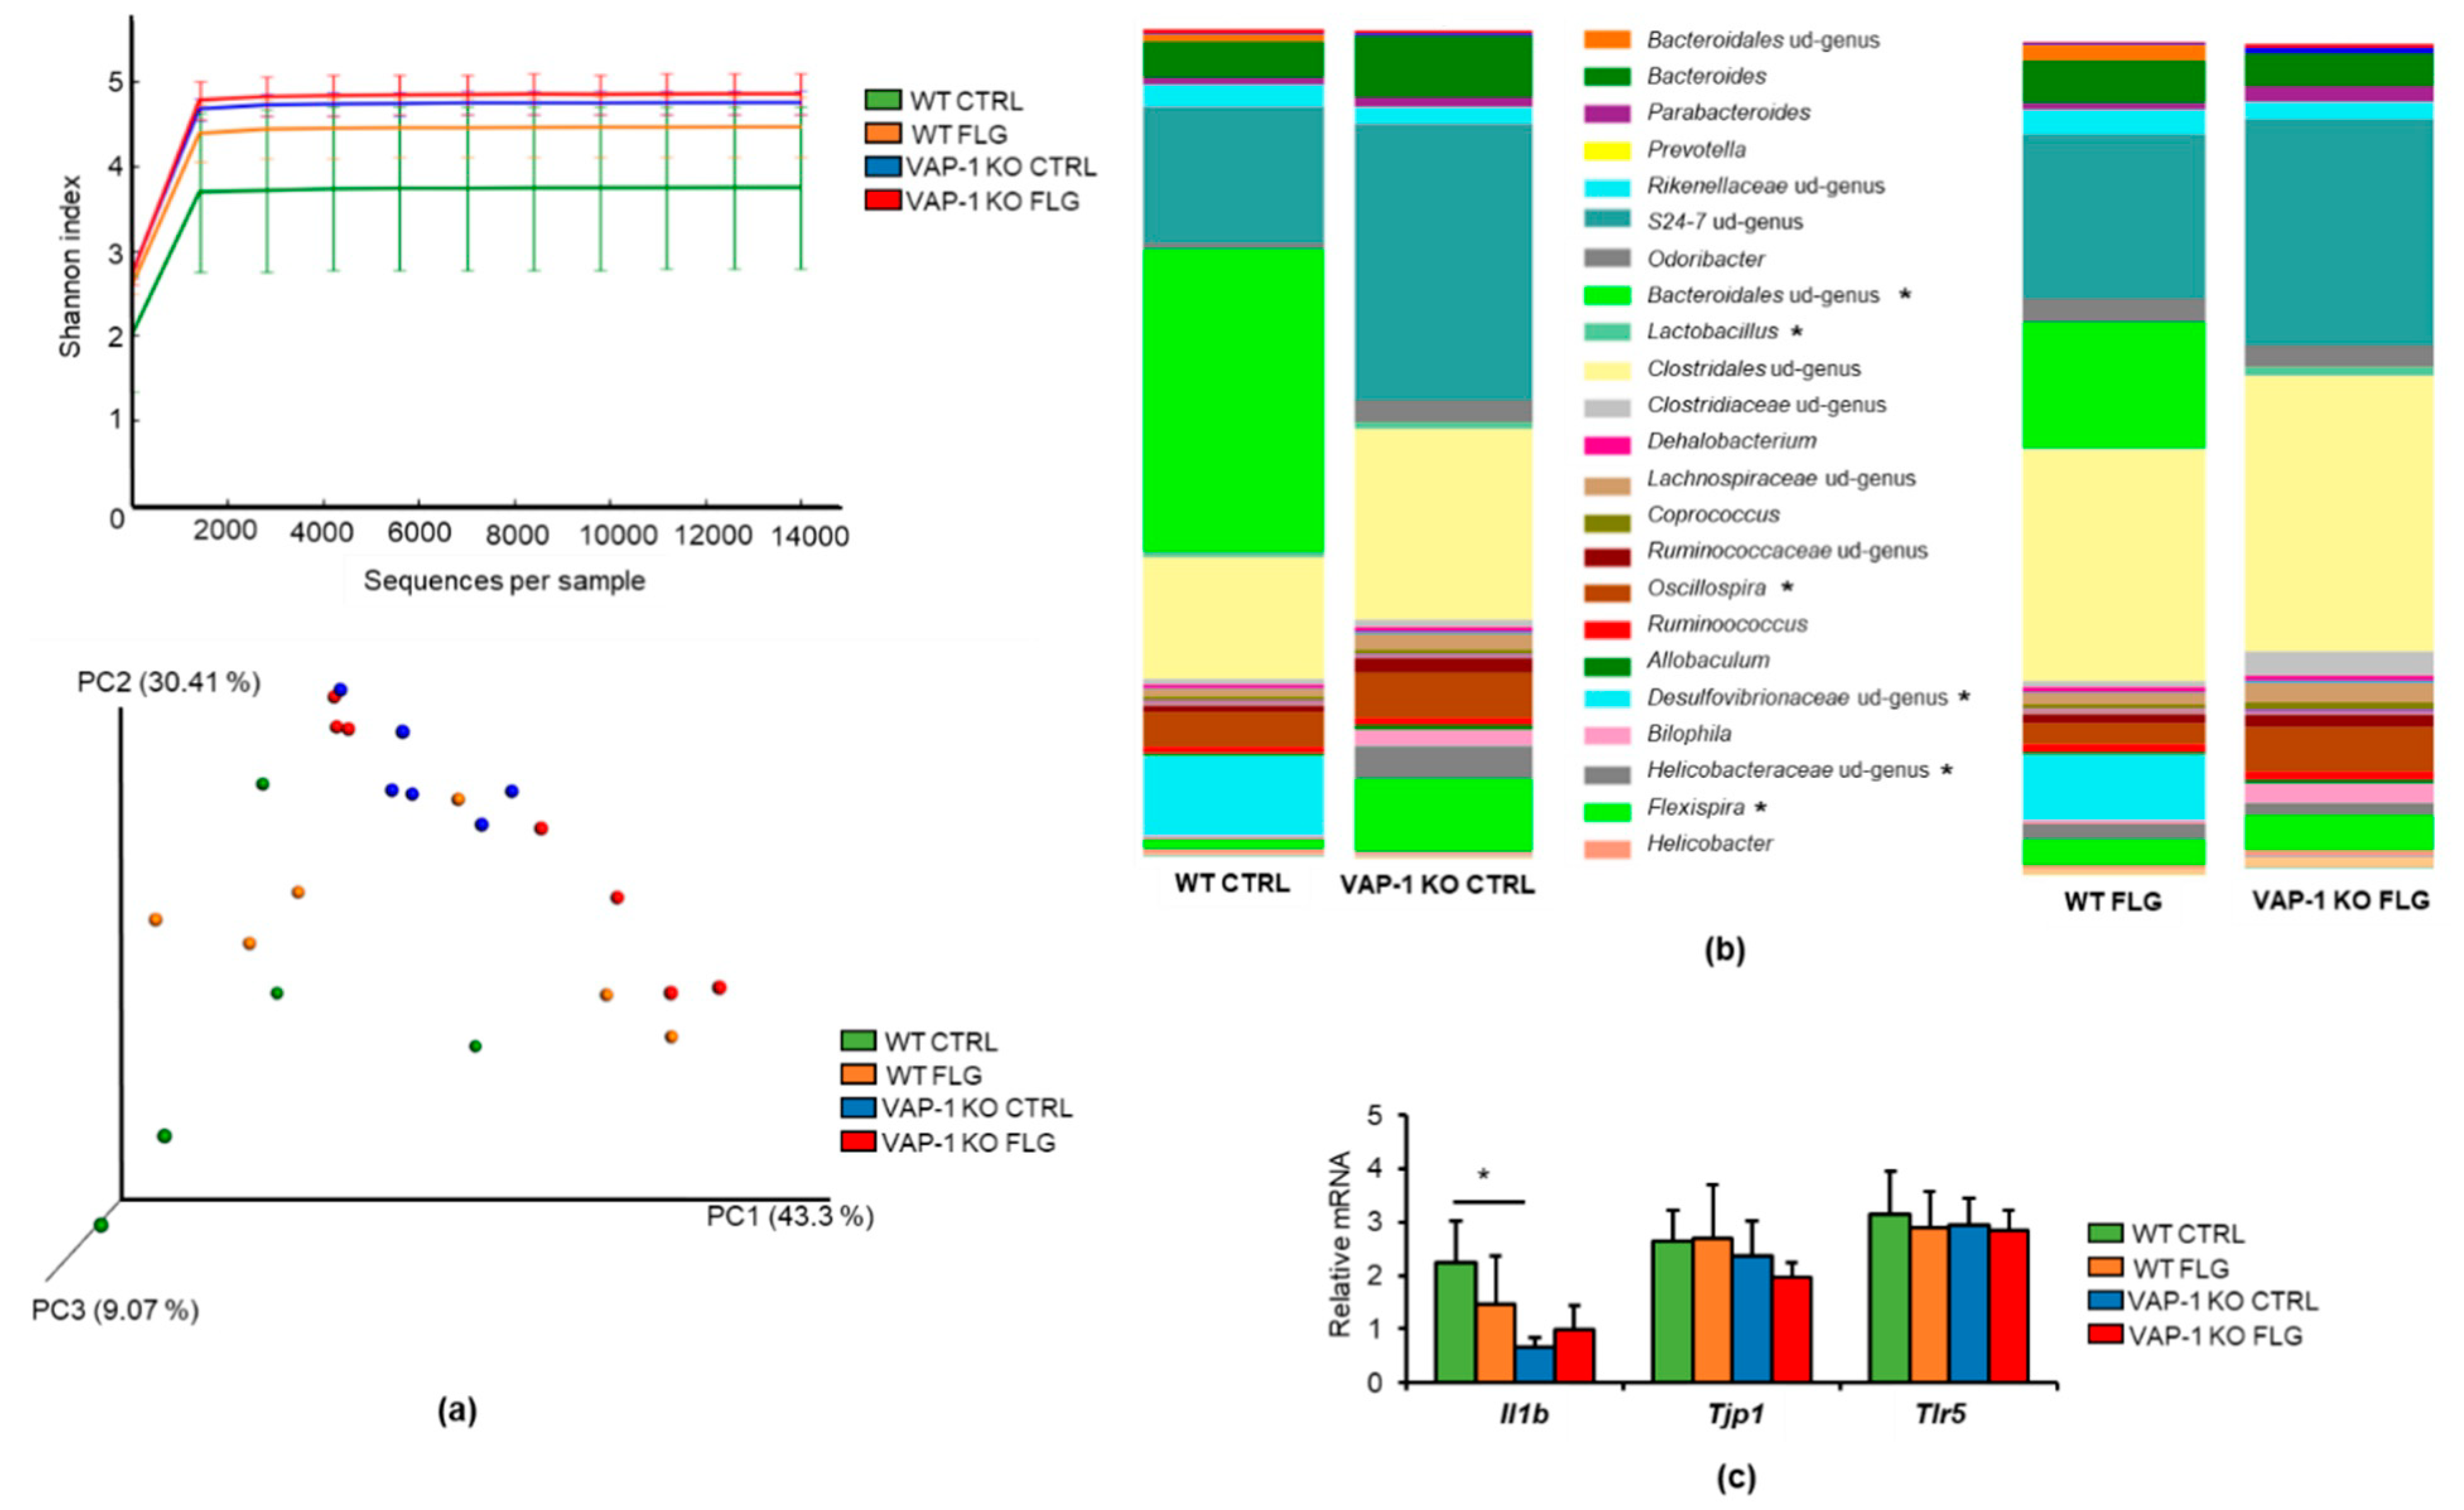
3.3. VAP-1 Knockout Modified the Gut Microbiota Composition and Intestinal Gene Expression

Because the gut microbiota has been shown to associate with liver fat content [7], we determined whether the gut microbiota had contributed to the FLG-induced steatosis. The 16S rRNA gene amplicon sequencing did not reveal any differences in alpha or beta diversity between the groups (Figure 4a) or any taxonomic changes in response to FLG. However, interestingly, VAP-1 KO mice differed significantly from the WT mice. The PBS-injected KO mice had a lower relative abundance of bacteria of an unidentified genus of the Bacteroidales order and the Desulfovibrionaceae family (p = 0.049 for both, Figure 4b) and more Flexispira and of an unidentified genus of Helicobacteriaceae (p = 0.049 for both, Figure 4b). The FLG-injected KO mice differed from their WT counterparts on the higher relative abundance of Lactobacillus and Oscillospira (p = 0.027 for both, Figure 4b) and lower relative abundance of an unidentified genus of Bacteroidales and Desulfovibrionaceae (p = 0.023 for both, Figure 4b). Due to the differences in inflammation-associated microbes, we determined whether VAP-1 affected intestinal inflammation or integrity. While no differences in the mRNA of tight junction protein 1 (Tjp1) were found between the groups, VAP-1 KO decreased the expression of Il1b mRNA (p = 0.006), which was independent of Tlr5 expression (Figure 4c).

4. Discussion

Our recent studies have suggested that FLG increases hepatocyte fat content in vitro by acting on adipocytes [9] and that the amine oxidase activity of VAP-1 is involved in NAFLD [14]. In this study, we extended our findings by demonstrating that VAP-1 mediated FLG-induced hepatic steatosis in vivo.
It is increasingly accepted that VAT and SAT inflammation and insulin resistance play an important role in the pathogenesis of NAFLD [23]. In this study, we found that in SAT VAP-1 mediated the FLG-induced decrease in ERK1/2 phosphorylation; however, we cannot say from the present data that the decrease associates with insulin resistance. No other major effects were detected in SAT. In contrast, VAT, which is more detrimental for metabolic health than SAT, was more inflamed and showed metabolic changes in the FLG-injected mice. VAP-1 regulated the FLG-induced elevations of IL1β, GM-CSF, and MCP-1 cytokines. However, VAP-1 KO mice had higher levels of MCP-1 and GM-CSF than the WT controls which partly hampers our findings. Thus, it may be that only the FLG-induced increase in IL1β is truly VAP-1 mediated. Nevertheless, in WT mice the stimulation of GM-CSF and MCP-1 by FLG is in agreement with previous studies [24,25]. In addition, the increase in MCP-1 and the circulating neutrophil-, monocyte-, and lymphocyte-recruiting GM-CSF may be associated with the increased infiltration of CD45-positive leukocytes into the VAT of FLG-treated mice that seemed to be VAP-1-mediated.
IL1β has been reported to accelerate lipolysis in VAT during an acute phase of inflammation [26]. While one evident lipolysis-increasing factor in the FLG-injected mice of this study was an enhanced phosphorylation of HSL, which is the rate-limiting enzyme of the catabolism of diacylglycerols [27], the other underlying cause for the increased release of glycerol was the decreased expression of PLIN1. Perilipins are membrane phosphoproteins of the triacylglycerol droplets, which act to prevent lipases from hydrolyzing triacylglycerol and, thus, prevent the release of glycerol and fatty acids from the droplets [26]. Our present results from mice are supported by our own findings showing that FLG increased inflammation [28], decreased Plin1 expression in cultured SGBS adipocytes, and consequently caused degradation of lipid droplets and the release of glycerol [9].
Due to the fact that VAT drains into the portal vein [29], the released glycerol can reach the liver to be used for triglyceride synthesis [30], which may be further exacerbated by circulating IL1β [31] and MCP-1 [32] even in the absence of hepatic inflammation [33]. VAT-secreted cytokines have recently been implicated in initiating and maintaining the systemic inflammatory state that is observed in NAFLD [33]. We recently showed that in vitro exposure of SGBS adipocytes to FLG increased fat accumulation in hepatocytes by increasing inflammation in adipocytes and releasing glycerol [9]. In this study, we confirmed in vivo that FLG increased lipolysis, glycerol release, and hepatic fat accumulation and further identified VAP-1 as a novel regulatory protein in this process. In addition to glycerol, triglyceride synthesis requires free fatty acids. Unfortunately, due to the scarcity of serum samples, we could not faithfully determine the levels of fatty acids, and therefore the exact underlying mechanisms of hepatic fat accumulation need to be fully determined in the future. In addition, data showing where glycerol enters hepatic metabolism should be produced. However, the hepatic fat accumulation in this study may be partly explained by decreased oxidation, because FLG decreased the activity of AST and ALT, which supply oxaloacetate and pyruvate, respectively, to the TCA cycle. We cannot fully explain why FLG increased their activity in VAP-1 KO mice or why the KO controls had lower activities than the WT controls. The latter may be a consequence of decreased glucose transport [34] due to the absence of VAP-1, which would result in lower gluconeogenesis, subsequently decreasing AST and ALT activities [35].
Upon liver fat accumulation, hepatic mitochondria produce more reactive oxygen species that can cause oxidative damage. The damage can be protected by SOD1, which scavenges oxygen radicals [36]. Therefore, the FLG-induced decrease in Sod1 mRNA may have an increased redox state in liver, but, unfortunately, due to the instability of lipid peroxidation products, such as malondialdehyde [37], we were unable to measure peroxidation. However, we have previously shown that FLG induced the production of reactive oxygen species in cultured hepatocytes [9] and that overexpression of VAP-1 increased the redox state [38]. In addition to steatosis, FLG slightly increased hepatic fibrosis in mice, according to Van Gieson staining. The state of fibrosis was also supported by the increased expression of Mmp9 in the liver of the FLG-treated mice. It has been shown that in steatotic and fibrotic liver MMP-9 increased extracellular matrix remodeling to promote leukocyte infiltration and angiogenesis [22]. In this study, the FLG-induced fibrosis was not mediated by VAP-1.
Interestingly, the absence of VAP-1 also modulated the composition of the gut microbiota, though the reasons for this are not clear. This may be due to decreased inflammation, as the KO mice expressed less intestinal Il1b, which is normally produced during an active infection and is critical for pathogen eradication [39]. Thus, the decreased Il1b may have allowed an increased growth of inflammation-associated Helicobacteriaceae and Oscillospira [40]. In the future, the mechanisms through which VAP-1 modifies the gut microbiota would be an interesting area of research.
Our study has some limitations. The sample size was relatively small and included only one sex. Thus, our findings may not be the same if male mice were used. However, we chose females because many metabolic diseases are more pronounced in females and females and males are known to differ from each other in some inflammatory variables and reactions. We did not perform an oral glucose tolerance test, and thus we cannot draw any conclusions related to possible insulin resistance/sensitivity in our study animals. Finally, more mechanistic studies will be needed in the future to understand the relationship between the adipose tissue cytokines and leukocytes as well as the possible influence of VAP-1 on the gut microbiota and the inflammatory microenvironment of the gut.

5. Conclusions

Based on the present findings, we propose that by acting on visceral adipose tissue FLG increased inflammation and leukocyte infiltration, which subsequently increased lipolysis. Lipolysis released glycerol, which can reach the liver to contribute to hepatic steatosis, due to defective TCA cycle activity. Importantly, all these effects of FLG were mediated by VAP-1. In addition, FLG slightly induced hepatic fibrosis, which may ultimately lead to more severe steatohepatitis.

Author Contributions

Conceptualization, R.T., S.P. (Satu Pekkala) and S.J.; methodology, R.T., S.V., M.H., A.K., E.M., S.P. (Sami Pietilä), S.P. (Satu Pekkala) and S.J.; validation, P.H., L.E., S.J. and S.P. (Satu Pekkala); resources, R.T., P.H., S.J. and S.P. (Satu Pekkala); data curation, A.K., S.P. (Sami Pietilä), S.J. and S.P. (Satu Pekkala); writing—original draft preparation, S.P. (Satu Pekkala); writing—review and editing, ALL AUTHORS; funding acquisition, R.T., S.J. and S.P. (Satu Pekkala). All authors have read and agreed to the published version of the manuscript.

Funding

This study was financially supported by the Academy of Finland with postdoctoral research fellowships for Raine Toivonen (285503) and Satu Pekkala (267719), by the Academy of Finland Researcher Fellowship for Satu Pekkala (308042), and by the Academy Professorship for Sirpa Jalkanen (272239). In addition, funding was granted to Satu Pekkala by the Finnish Diabetes Research Foundation, by the Finnish Culture Foundation, and by the Finnish Instrumentarium Research Foundation.

Institutional Review Board Statement

The animal experiment was approved by the ethics committee of the Southern Finland Regional State Administrative Agency, Finland (ESAVI/6025/04.10.07/2017).

Informed Consent Statement

Not applicable for studies not involving humans.

Data Availability Statement

The data presented in this study are available on request from the corresponding author, and will be deposited to public databases.

Acknowledgments

We thank Anna Takanen, Kaisa-Leena Tulla, Mervi Matero, Risto Puurtinen, and Heidi Isokääntä for their excellent technical assistance. We also thank Tuula Aaltonen and Eveliina Markkula from Immunodiagnostic for helping with the multiplex ELISA.

Conflicts of Interest

The authors declare no conflict of interest. The funders had no role in the design of the study; in the collection, analyses, or interpretation of data; in the writing of the manuscript; or in the decision to publish the results.

References

  1. Tilg, H.; Moschen, A.R. Evolution of inflammation in nonalcoholic fatty liver disease: The multiple parallel hits hypothesis. Hepatology 2010, 52, 1836–1846. [Google Scholar] [CrossRef] [PubMed]
  2. Tilg, H.; Moschen, A.R. Inflammatory mechanisms in the regulation of insulin resistance. Mol. Med. 2008, 14, 222–231. [Google Scholar] [CrossRef] [PubMed]
  3. Sha, H.; He, Y.; Chen, H.; Wang, C.; Zenno, A.; Shi, H.; Yang, X.; Zhang, X.; Qi, L. The IRE1alpha-XBP1 pathway of the unfolded protein response is required for adipogenesis. Cell Metab. 2009, 9, 556–564. [Google Scholar] [CrossRef] [PubMed] [Green Version]
  4. Begriche, K.; Massart, J.; Robin, M.-A.; Bonnet, F.; Fromenty, B. Mitochondrial adaptations and dysfunctions in nonalcoholic fatty liver disease. Hepatology 2013, 58, 1497–1507. [Google Scholar] [CrossRef]
  5. Bril, F.; Barb, D.; Portillo-Sanchez, P.; Biernacki, D.; Lomonaco, R.; Suman, A.; Weber, M.H.; Budd, J.T.; Lupi, M.E.; Cusi, K. Metabolic and histological implications of intrahepatic triglyceride content in nonalcoholic fatty liver disease. Hepatology 2017, 65, 1132–1144. [Google Scholar] [CrossRef] [Green Version]
  6. Henao-Mejia, J.; Elinav, E.; Thaiss, C.A.; Licona-Limon, P.; Flavell, R.A. Role of the intestinal microbiome in liver disease. J. Autoimmun. 2013, 46, 66–73. [Google Scholar] [CrossRef]
  7. Munukka, E.; Pekkala, S.; Wiklund, P.; Rasool, O.; Borra, R.; Kong, L.; Ojanen, X.; Cheng, S.M.; Roos, C.; Tuomela, S.; et al. Gut-adipose tissue axis in hepatic fat accumulation in humans. J. Hepatol. 2014, 61, 132–138. [Google Scholar] [CrossRef]
  8. Mahla, R.S.; Reddy, M.C.; Prasad, D.V.R.; Kumar, H. Sweeten PAMPs: Role of Sugar Complexed PAMPs in Innate Immunity and Vaccine Biology. Front. Immunol. 2013, 4, 248. [Google Scholar] [CrossRef] [Green Version]
  9. Munukka, E.; Wiklund, P.; Partanen, T.; Välimäki, S.; Laakkonen, E.K.; Lehti, M.; Fischer-Posovzsky, P.; Wabitsch, M.; Cheng, S.; Huovinen, P.; et al. Adipocytes as a Link Between Gut Microbiota-Derived Flagellin and Hepatocyte Fat Accumulation. PLoS ONE 2016, 11, e0152786. [Google Scholar] [CrossRef]
  10. Singh, V.; Chassaing, B.; Zhang, L.; Yeoh, B.S.; Xiao, X.; Kumar, M.; Baker, M.T.; Cai, J.; Walker, R.; Borkowski, K. Microbiota-dependent hepatic lipogenesis mediated by Stearoyl CoA Desaturase 1 (SCD1) promotes metabolic syndrome in TLR5-Deficient Mice. Cell Metab. 2015, 22, 983–996. [Google Scholar] [CrossRef] [Green Version]
  11. Etienne-Mesmin, L.; Vijay-Kumar, M.; Gewirtz, A.T.; Chassaing, B. Hepatocyte Toll-Like Receptor 5 Promotes Bacterial Clearance and Protects Mice Against High-Fat Diet-Induced Liver Disease. Cell. Mol. Gastroenterol. Hepatol. 2016, 2, 584–604. [Google Scholar] [CrossRef] [PubMed] [Green Version]
  12. Fedirko, V.; Tran, H.Q.; Gewirtz, A.T.; Stepien, M.; Trichopoulou, A.; Aleksandrova, K.; Olsen, A.; Tjønneland, A.; Overvad, K.; Carbonnel, F.; et al. Exposure to bacterial products lipopolysaccharide and flagellin and hepatocellular carcinoma: A nested case-control study. BMC Med. 2017, 15, 72. [Google Scholar] [CrossRef] [Green Version]
  13. Xiao, Y.; Liu, F.; Yang, J.; Zhong, M.; Zhang, E.; Li, Y.; Zhou, D.; Cao, Y.; Li, W.; Yu, J.; et al. Over-activation of TLR5 signaling by high-dose flagellin induces liver injury in mice. Cell. Mol. Immunol. 2015, 12, 729–742. [Google Scholar] [CrossRef] [PubMed] [Green Version]
  14. Weston, C.J.; Shepherd, E.L.; Claridge, L.C.; Rantakari, P.; Curbishley, S.M.; Tomlinson, J.W.; Hubscher, S.G.; Reynolds, G.M.; Aalto, K.; Anstee, Q.M.; et al. Vascular adhesion protein-1 promotes liver inflammation and drives hepatic fibrosis. J. Clin. Investig. 2015, 125, 501–520. [Google Scholar] [CrossRef] [Green Version]
  15. Salmi, M.; Jalkanen, S. Vascular Adhesion Protein-1: A Cell Surface Amine Oxidase in Translation. Antioxid. Redox Signal. 2018, 30, 314–332. [Google Scholar] [CrossRef]
  16. Yu, P.H.; Lu, L.-X.; Fan, H.; Kazachkov, M.; Jiang, Z.-J.; Jalkanen, S.; Stolen, C. Involvement of semicarbazide-sensitive amine oxidase-mediated deamination in lipopolysaccharide-induced pulmonary inflammation. Am. J. Pathol. 2006, 168, 718–726. [Google Scholar] [CrossRef] [Green Version]
  17. Fischer-Posovszky, P.; Newell, F.S.; Wabitsch, M.; Tornqvist, H.E. Human SGBS cells—A unique tool for studies of human fat cell biology. Obes. Facts 2008, 1, 184–189. [Google Scholar] [CrossRef]
  18. Aalto, K.; Maksimow, M.; Juonala, M.; Viikari, J.; Jula, A.; Kähönen, M.; Jalkanen, S.; Raitakari, O.T.; Salmi, M. Soluble vascular adhesion protein-1 correlates with cardiovascular risk factors and early atherosclerotic manifestations. Arterioscler. Thromb. Vasc. Biol. 2012, 32, 523–532. [Google Scholar] [CrossRef] [Green Version]
  19. Rintala, A.; Riikonen, I.; Toivonen, A.; Pietilä, S.; Munukka, E.; Pursiheimo, J.-P.; Elo, L.L.; Arikoski, P.; Luopajärvi, K.; Schwab, U.; et al. Early fecal microbiota composition in children who later develop celiac disease and associated autoimmunity. Scand. J. Gastroenterol. 2018, 53, 403–409. [Google Scholar] [CrossRef] [Green Version]
  20. Caporaso, J.G.; Kuczynski, J.; Stombaugh, J.; Bittinger, K.; Bushman, F.D.; Costello, E.K.; Fierer, N.; Gonzalez Peña, A.; Goodrich, J.K.; Gordon, J.I.; et al. QIIME allows analysis of high-throughput community sequencing data. Nat. Methods 2010, 7, 335–336. [Google Scholar] [CrossRef] [Green Version]
  21. Bour, S.; Caspar-Bauguil, S.; Iffiu-Soltesz, Z.; Nibbelink, M.; Cousin, B.; Miiluniemi, M.; Salmi, M.; Stolen, C.; Jalkanen, S.; Casteilla, L.; et al. Semicarbazide-sensitive amine oxidase/vascular adhesion protein-1 deficiency reduces leukocyte infiltration into adipose tissue and favors fat deposition. Am. J. Pathol. 2009, 174, 1075–1083. [Google Scholar] [CrossRef] [PubMed] [Green Version]
  22. Duarte, S.; Baber, J.; Fujii, T.; Coito, A.J. Matrix metalloproteinases in liver injury, repair and fibrosis. Matrix Biol. 2015, 44–46, 147–156. [Google Scholar] [CrossRef] [PubMed]
  23. Du Plessis, J.; van Pelt, J.; Korf, H.; Mathieu, C.; van der Schueren, B.; Lannoo, M.; Oyen, T.; Topal, B.; Fetter, G.; Nayler, S.; et al. Association of Adipose Tissue Inflammation with Histologic Severity of Nonalcoholic Fatty Liver Disease. Gastroenterology 2015, 149, 635–648. [Google Scholar] [CrossRef] [Green Version]
  24. Cao, Y.; Zhang, E.; Yang, J.; Yang, Y.; Yu, J.; Xiao, Y.; Li, W.; Zhou, D.; Li, Y.; Zhao, B.; et al. Frontline Science: Nasal epithelial GM-CSF contributes to TLR5-mediated modulation of airway dendritic cells and subsequent IgA response. J. Leukoc. Biol. 2017, 102, 575–587. [Google Scholar] [CrossRef] [Green Version]
  25. Nakamura, K.; Deyama, Y.; Yoshimura, Y.; Suzuki, K.; Morita, M. Toll like receptor 5 ligand induces monocyte chemoattractant protein-1 in mouse osteoblastic cells. Biomed. Res. 2012, 33, 39–44. [Google Scholar] [CrossRef] [Green Version]
  26. Greenberg, A.S.; Obin, M.S. Obesity and the role of adipose tissue in inflammation and metabolism. Am. J. Clin. Nutr. 2006, 83, 461S–465S. [Google Scholar] [CrossRef] [Green Version]
  27. Zechner, R.; Zimmermann, R.; Eichmann, T.O.; Kohlwein, S.D.; Haemmerle, G.; Lass, A.; Madeo, F. FAT SIGNALS—Lipases and lipolysis in lipid metabolism and signaling. Cell Metab. 2012, 15, 279–291. [Google Scholar] [CrossRef] [Green Version]
  28. Pekkala, S.; Munukka, E.; Kong, L.; Pöllänen, E.; Autio, R.; Roos, C.; Wiklund, P.; Fischer-Posovszky, P.; Wabitsch, M.; Alen, M.; et al. Toll-like receptor 5 in obesity: The role of gut microbiota and adipose tissue inflammation. Obesity 2015, 23, 581–590. [Google Scholar] [CrossRef]
  29. Klein, S. The case of visceral fat: Argument for the defense. J. Clin. Investig. 2004, 113, 1530–1532. [Google Scholar] [CrossRef] [Green Version]
  30. Saponaro, C.; Gaggini, M.; Carli, F.; Gastaldelli, A. The Subtle Balance between Lipolysis and Lipogenesis: A Critical Point in Metabolic Homeostasis. Nutrients 2015, 7, 9453–9474. [Google Scholar] [CrossRef] [Green Version]
  31. Negrin, K.A.; Roth Flach, R.J.; DiStefano, M.T.; Matevossian, A.; Friedline, R.H.; Jung, D.; Kim, J.K.; Czech, M.P. IL-1 signaling in obesity-induced hepatic lipogenesis and steatosis. PLoS ONE 2014, 9, e107265. [Google Scholar] [CrossRef] [PubMed] [Green Version]
  32. Kirovski, G.; Dorn, C.; Huber, H.; Moleda, L.; Niessen, C.; Wobser, H.; Schacherer, D.; Buechler, C.; Wiest, R.; Hellerbrand, C. Elevated systemic monocyte chemoattractrant protein-1 in hepatic steatosis without significant hepatic inflammation. Exp. Mol. Pathol. 2011, 91, 780–783. [Google Scholar] [CrossRef] [PubMed]
  33. Mirza, M.S. Obesity, Visceral Fat, and NAFLD: Querying the Role of Adipokines in the Progression of Nonalcoholic Fatty Liver Disease. ISRN Gastroenterol. 2011, 2011, 592404. [Google Scholar] [CrossRef] [PubMed] [Green Version]
  34. Marti, L.; Morin, N.; Enrique-Tarancon, G.; Prevot, D.; Lafontan, M.; Testar, X.; Zorzano, A.; Carpéné, C. Tyramine and vanadate synergistically stimulate glucose transport in rat adipocytes by amine oxidase-dependent generation of hydrogen peroxide. J. Pharmacol. Exp. Ther. 1998, 285, 342–349. [Google Scholar]
  35. Qian, K.; Zhong, S.; Xie, K.; Yu, D.; Yang, R.; Gong, D.-W. Hepatic ALT isoenzymes are elevated in gluconeogenic conditions including diabetes and suppressed by insulin at the protein level. Diabetes Metab. Res. Rev. 2015, 31, 562–571. [Google Scholar] [CrossRef] [Green Version]
  36. Nuno-Lambarri, N.; Barbero-Becerra, V.J.; Uribe, M.; Chávez-Tapia, N.C. Mitochondrial molecular pathophysiology of nonalcoholic fatty liver disease: A proteomics approach. Int. J. Mol. Sci. 2016, 17, 281. [Google Scholar] [CrossRef]
  37. Ayala, A.; Munoz, M.F.; Arguelles, S. Lipid peroxidation: Production, metabolism, and signaling mechanisms of malondialdehyde and 4-hydroxy-2-nonenal. Oxid. Med. Cell. Longev. 2014, 2014, 360438. [Google Scholar] [CrossRef]
  38. Stolen, C.M.; Yegutkin, G.G.; Kurkijarvi, R.; Bono, P.; Alitalo, K.; Jalkanen, S. Origins of serum semicarbazide-sensitive amine oxidase. Circ. Res. 2004, 95, 50–57. [Google Scholar] [CrossRef] [Green Version]
  39. Kamada, N.; Chen, G.Y.; Inohara, N.; Núñez, G. Control of pathogens and pathobionts by the gut microbiota. Nat. Immunol. 2013, 14, 685–690. [Google Scholar] [CrossRef]
  40. Konikoff, T.; Gophna, U. Oscillospira: A Central, Enigmatic Component of the Human Gut Microbiota. Trends Microbiol. 2016, 24, 523–524. [Google Scholar] [CrossRef]
Figure 1. Flagellin (FLG) increased vascular adhesion protein 1 (VAP-1) expression in visceral adipose tissue (VAT), which mediated the FLG-induced increase in inflammation and lipolysis in VAT (V, visceral). (a) On the left side, the graph and Western blot show the quantification of VAP-1 in the control and flagellin-treated adipocytes. On the right side, the graph and Western blot show the quantification of VAP-1 in the visceral (V) adipose tissue of the mice groups. The graphs represent the expression levels of VAP-1 presented as arbitrary units (AU) normalized to the glyceraldehydes 3-phosphate dehydrogenase (GAPDH) housekeeping protein. The samples run in different gels were further normalized to the calibrator sample. The membranes were cut horizontally to analyze several proteins of the samples in the same run. The data are presented as mean ± SD, n = 4–6/group. * indicates a statistically significant difference between the groups. (b) The bars on the left graph represent the concentrations of the cytokines in the visceral (V) adipose tissue of the mice groups. The bars on the right graph represent the mRNA levels of Il1b, which were calculated against a standard curve and are presented relative to Actb housekeeping mRNA. The data are presented as mean ± SD, n = 4–6/group. * indicates a statistically significant difference between the groups. (c) The photographs represent visceral adipose tissue sections stained for CD45-positive inflammatory cells. The cells in the photographs are indicated with arrows, and the scale bar is 100 µm. One entire section was scored for each mouse manually. Approximately five fields/sections were scored (range 4–9). The results in the bar graph are shown as the number of cells divided by the number of high power fields. * indicates a statistically significant difference between the groups. (d) Up on the left side, the graph and Western blot show the quantification of the lipolysis-activating phosphorylation of hormone-sensitive lipase (HSL) in the visceral (V) adipose tissue of the mice groups. The graphs represent the phosphorylation levels of HSL presented as arbitrary units (AU) normalized to the GAPDH housekeeping protein. The samples run in different gels were further normalized to the calibrator sample. The membranes were cut horizontally to analyze several proteins of the samples in the same run. The data are presented as mean ± SD, n = 4–6/group. * indicates a statistically significant difference between the groups. Up on the right side, the bar graph represents the mRNA levels of lipid droplet membrane protein, Plin1, which were calculated against a standard curve and are presented relative to Actb housekeeping mRNA. The data are presented as mean ± SD, n = 4–6/group. * indicates a statistically significant difference between the groups. Down on the left side, the bar graph represents the serum glycerol levels in the mice groups. The data are presented as mean ± SD, n = 4–6/group. * indicates a statistically significant difference between the groups. Abbreviations: PBS-injected wild type control, WT CTRL; flagellin (FLG)-injected wild type control, WT FLG; PBS-injected VAP-1 knockout (KO) control, VAP-1 KO CTRL; flagellin (FLG)-injected VAP-1 knockout (KO) control, VAP-1 KO FLG.
Sci 03 00013 g001
Figure 2. FLG increased liver (L) fat content, which was mediated by VAP-1. (a) The photographs represent frozen liver sections stained with Oil Red O, which stains all neutral lipids red. The scale bar is 100 µm. The hepatic fat content was scored according to the droplet sizes as 0 (smallest), 1, 2, and 3 (largest). (b) The bar graphs represent the biochemically measured amount (mmol/L) of cholesterol and triglycerides in the liver of the mice groups. The data are presented as mean ± SD, n = 4–6/group. * indicates a statistically significant difference between the groups. (c) The left graph shows the results and scoring of Van Gieson staining to estimate fibrosis in the liver of the mice. Van Gieson staining was semi-quantitatively scored: 0–0.5 (no damage), 1–2 (damage), and 3 (severe damage). The right graph shows the mRNA levels of Mmp9 in the liver (L) of the mice, which were calculated against a standard curve and are presented relative to Actb housekeeping mRNA. The data are presented as mean ± SD, n = 4–6/group. * indicates a statistically significant difference between the groups. (d) The bar graphs represent the activity (U/L/mg of total protein) of AST and ALT measured in the liver protein homogenates of the mice. The data are presented as mean ± SD, n = 4–6/group. * indicates a statistically significant difference between the groups. (e) The left graph represents the activity (U/L/mg of total protein) of xanthine oxidase measured in the liver protein homogenates of the mice. The data are presented as mean ± SD, n = 4–6/group. The right graph shows the expression levels of Sod1 mRNA in the liver (L) of the mice. The mRNA levels were calculated against a standard curve and are presented relative to Actb housekeeping mRNA. The data are presented as mean ± SD, n = 4–6/group. * indicates a statistically significant difference between the groups. Abbreviations: PBS-injected wild type control, WT CTRL; flagellin (FLG)-injected wild type control, WT FLG; PBS-injected VAP-1 knockout (KO) control, VAP-1 KO CTRL; flagellin (FLG)-injected VAP-1 knockout (KO) control, VAP-1 KO FLG.
Sci 03 00013 g002
Figure 3. VAP-1 mediated the FLG-induced decrease in ERK1/2 phosphorylation in subcutaneous adipose tissue (SAT). (a) The adipocyte sizes from 500 randomly selected cells in each sample were determined with CellProfiler 2.2.0 from the H&E-stained SAT sections. The bar graphs present the percentage (%) of 10–20, 20–30, and 30–40 µM-sized adipocytes of the selected cells in the SAT of the mice. The data are presented as mean ± SD, n = 4–6/group. (b) The graph and Western blot show the quantification of the ERK1/2 phosphorylation in the SAT (SC, subcutaneous) of the mice groups. The phosphorylation levels are presented as arbitrary units (AU) normalized to Ponceau staining. The samples run in different gels were further normalized to the calibrator sample. The membranes were cut horizontally to analyze several proteins of the samples in the same run. The data are presented as mean ± SD, n = 4–6/group. * indicates a statistically significant difference between the groups. (c) The photographs represent SAT sections stained for CD45-positive inflammatory cells. The cells in the photographs are indicated with arrows, and the scale bar is 100 µm. One entire section was scored for each mouse manually. Approximately 7.7 fields were scored (range 4–11). The results in the bar graph are shown as the number of cells divided by the number of high power fields. * indicates a statistically significant difference between the groups. Abbreviations: PBS-injected wild type control, WT CTRL; flagellin (FLG)-injected wild type control, WT FLG; PBS-injected VAP-1 knockout (KO) control, VAP-1 KO CTRL; flagellin (FLG)-injected VAP-1 knockout (KO) control, VAP-1 KO FLG.
Sci 03 00013 g003
Figure 4. VAP-1 KO mice differed from WT mice in the gut microbiota composition and intestinal Il1b mRNA expression. (a) The Shannon indices are shown as sequences per sample (upper graph) and correspond to the alpha diversity of the gut microbiota. The lower graph shows the principal component (PC) analysis plot of the beta diversity of the gut microbiota in the mice groups. (b) Average abundance of the gut microbiota genera in the mice groups. * indicates a significant difference in the given taxon (FDR < 0.05). (c) The graphs represent the relative mRNA levels of intestinal Il1b, Tjp1, Il1b, and Tlr5. The mRNA levels were calculated against a standard curve and are presented relative to Actb housekeeping mRNA. The gene expression data are presented as mean ± SD, n = 4–6/group. * indicates a significant difference between the groups. Abbreviations: PBS-injected wild type control, WT CTRL; flagellin (FLG)-injected wild type control, WT FLG; PBS-injected VAP-1 knockout (KO) control, VAP-1 KO CTRL; flagellin (FLG)-injected VAP-1 knockout (KO) control, VAP-1 KO FLG.
Sci 03 00013 g004
Table 1. The sequences of the primers used in real-time quantitative PCR.
Primer NamePrimer Sequence 5′ > 3′
mACTB fwdGGCTGTATTCCCCTCCATCG
mACTB revCCAGTTGGTAACAATGCCATGT
mIL1B fwdTGTGAAATGCCACCTTTTGA
mIL1B revGGTCAAAGGTTTGGAAGCAG
mMMP9 fwdAGACGACATAGACGGCATCC
mMMP9 revCTGTCGGCTGTGGTTCAGT
mPLIN fwdTGAAGCAGGGCCACTCTC
mPLIN revGACACCACCTGCATGGCT
mSOD1 fwdCAGGACCTCATTTTAATCCTCAC
mSOD1 revTGCCCAGGTCTCCAACAT
mTLR5 fwdAAGTTCCGGGGAATCTGTTT
mTLR revGCATAGCCTGAGCCTGTTTC
mTjp1 fwdGAGCGGGCTACCTTACTGAAC
mTjp1 revGTCATCTCTTTCCGAGGCATTAG
Notes: fwd, forward; rev, reverse.
Publisher’s Note: MDPI stays neutral with regard to jurisdictional claims in published maps and institutional affiliations.

