Article

Quantifying the Trends in Land Surface Temperature and Surface Urban Heat Island Intensity in Mediterranean Cities in View of Smart Urbanization

by
Anastasios Polydoros
*,
Thaleia Mavrakou
and
Constantinos Cartalis
Department of Physics, National and Kapodistrian University of Athens, 157 72 Athens, Greece
*
Author to whom correspondence should be addressed.
Urban Sci. 2018, 2(1), 16; https://doi.org/10.3390/urbansci2010016
Submission received: 23 December 2017 / Revised: 7 February 2018 / Accepted: 14 February 2018 / Published: 17 February 2018
(This article belongs to the Special Issue Urban Heat Island and Mitigation Technologies—Impact and Mitigation)

Abstract

:
Land Surface Temperature (LST) is a key parameter for the estimation of urban fluxes as well as for the assessment of the presence and strength of the surface urban heat island (SUHI). In an urban environment, LST depends on the way the city has been planned and developed over time. To this end, the estimation of LST needs adequate spatial and temporal data at the urban scale, especially with respect to land cover/land use. The present study is divided in two parts: at first, satellite data from MODIS-Terra 8-day product (MOD11A2) were used for the analysis of an eighteen-year time series (2001–2017) of the LST spatial and temporal distribution in five major cities of the Mediterranean during the summer months. LST trends were retrieved and assessed for their statistical significance. Secondly, LST values and trends for each city were examined in relation to land cover characteristics and patterns in order to define the contribution of urban development and planning on LST; this information is important for the drafting of smart urbanization policies and measures. Results revealed (a) positive LST trends in the urban areas especially during nighttime ranging from +0.412 °K in Marseille to +0.923 °K in Cairo and (b) the SUHI has intensified during the last eighteen years especially during daytime in European Mediterranean cities, such as Rome (+0.332 °K) and Barcelona (+0.307 °K).

1. Introduction

Urbanization is among the most evident aspects of human impact on the earth system. In the process of urbanization, natural landscapes are transformed into modern land use and land cover such as buildings, roads and other impervious surfaces, making urban landscapes fragmented and complex and affecting the inhabitability of cities [1,2,3]. This leads to modifications of the surface energy balance, which governs the momentum, heat and mass transfer between the surface and the atmosphere, thus impacts dynamic processes in the urban boundary layer, and ultimately influences the local, regional and even global climate. The increasing urbanization rate of cities in the coming decades [4] is an important concern as more than 66% of the world’s population is expected to reside in cities by 2050 [5,6,7], the total global urban land area is expected to increase by more than 1.5 million square kilometers by 2030 [8] and climate projections foresee an increase in the frequency and intensity of extreme events relevant to the vulnerability of urban areas, such as heavy rain, storm events and heat waves [4,9]. Moreover, the last reports highlight the Mediterranean as a vulnerable region to the impacts of global warming [4,10] and a review of climatic projections gives a collective picture of a substantial drying and warming of the Mediterranean region, especially in the warm season [11].
Air and surface temperatures are expected to further increase and the urban heat island (UHI) strength to be intensified, negatively influencing the sustainability and liveability of cities [12,13,14,15,16,17]. Surface urban heat island (SUHI), in particular, describes the land surface temperature (LST) differences between urban areas and their surroundings, and it is usually studied with the use of remote sensing data. The formation of SUHI can be mainly attributed to the increased absorption and trapping of solar radiation in urban areas associated with limited release of heat due to the low values of the thermal emission coefficients of manmade materials. Anthropogenic heat release from transport and the heating-cooling systems of the buildings further exacerbate the phenomenon [18,19,20]. Both UHI and SUHI can be detected throughout the year, but they are of particular public policy concern during the summer, because higher surface and air temperatures are associated with increases in electricity demand for air conditioning, air pollution, and heat stress-related mortality and illness [21,22,23,24,25]. Several SUHI studies have been performed in the Mediterranean area, most of them revealing that higher UHI intensities are found in the summer period [13,26,27,28,29,30].
Land surface temperature is a controlling factor for most of the physical, chemical and biological processes on the earth, and can be considered as a measure of climate change [31,32,33,34]. For the urban environment, LST is an important parameter for the monitoring of the energy exchange between the land surface and the atmosphere in terms of the sensible and latent heat fluxes [35,36,37,38] which are important when discussing the thermal effects of the cities on the regional climate. Sensible heat flux is determined by temperature difference between the land surface and the air above it and depends mainly on the LST variation. Therefore, LST is a suitable parameter for the analysis of the thermodynamic processes from the surface to the atmosphere [37]. Additionally, LST is also related to climatic variations caused by thermodynamic forcing, so the research on the variation and the LST trends of the cities is of climatological and meteorological significance. An understanding of LST is important for urban climatology, global environmental change and human-environment interactions [39,40] and the Intergovernmental Panel on Climate Change (IPCC) has pointed out the urgent need for the inclusion of long-term remote sensing–based LST data in global warming studies [37]. LST changes rapidly in space as well as in time [41,42] and it has been found that urbanization increases urban diurnal land surface temperature variation [43,44]; thus, an adequate characterization of LST spatial and temporal distribution requires measurements with detailed spatial and temporal resolution. Understanding the linkage between LST and urban surface characteristics is important for designing effective measures to mitigate the amplitude of SUHI [45]. Moreover, effective and sustainable urban management increasingly demands innovative concepts and techniques to obtain up-to-date and area-wide information on the characteristics and development of the urban system in support of smart urbanization policies and measures [46,47].
Earth observation offers a useful tool to gain an insight of the LST trends and variations within the urban environment. The main advantages of remote sensing are the wide area coverage, the high spatial resolution compared to meteorological ground stations networks and the variety of temporal resolution that can be used depending on the research needs. Various studies have been conducted by utilizing LST data from thermal infrared sensors like AVHRR (Advanced Very High Resolution Radiometer) [48,49,50,51], MODIS (Moderate Resolution Imaging Spectral Radiometer) [29,42,52,53,54,55], Landsat TM/ETM+/8 [56,57,58,59,60] and ASTER (Advanced Spaceborne Thermal Emission and Reflection Radiometer) [61,62]]. In [63] Benas et al. analyzed the annual nighttime LST trends for 17 large cities of the Mediterranean for the period 2001–2012 and found increasing LST trends in the majority of cities and large variations in SUHI trends. Other researchers have used MODIS LST time series in other parts of the world [64,65,66,67,68,69]. In this study, summer daytime and nighttime LST data were extracted from MODIS-Terra products for the period 2000–2017 and were analyzed for assessing LST and SUHI trends.

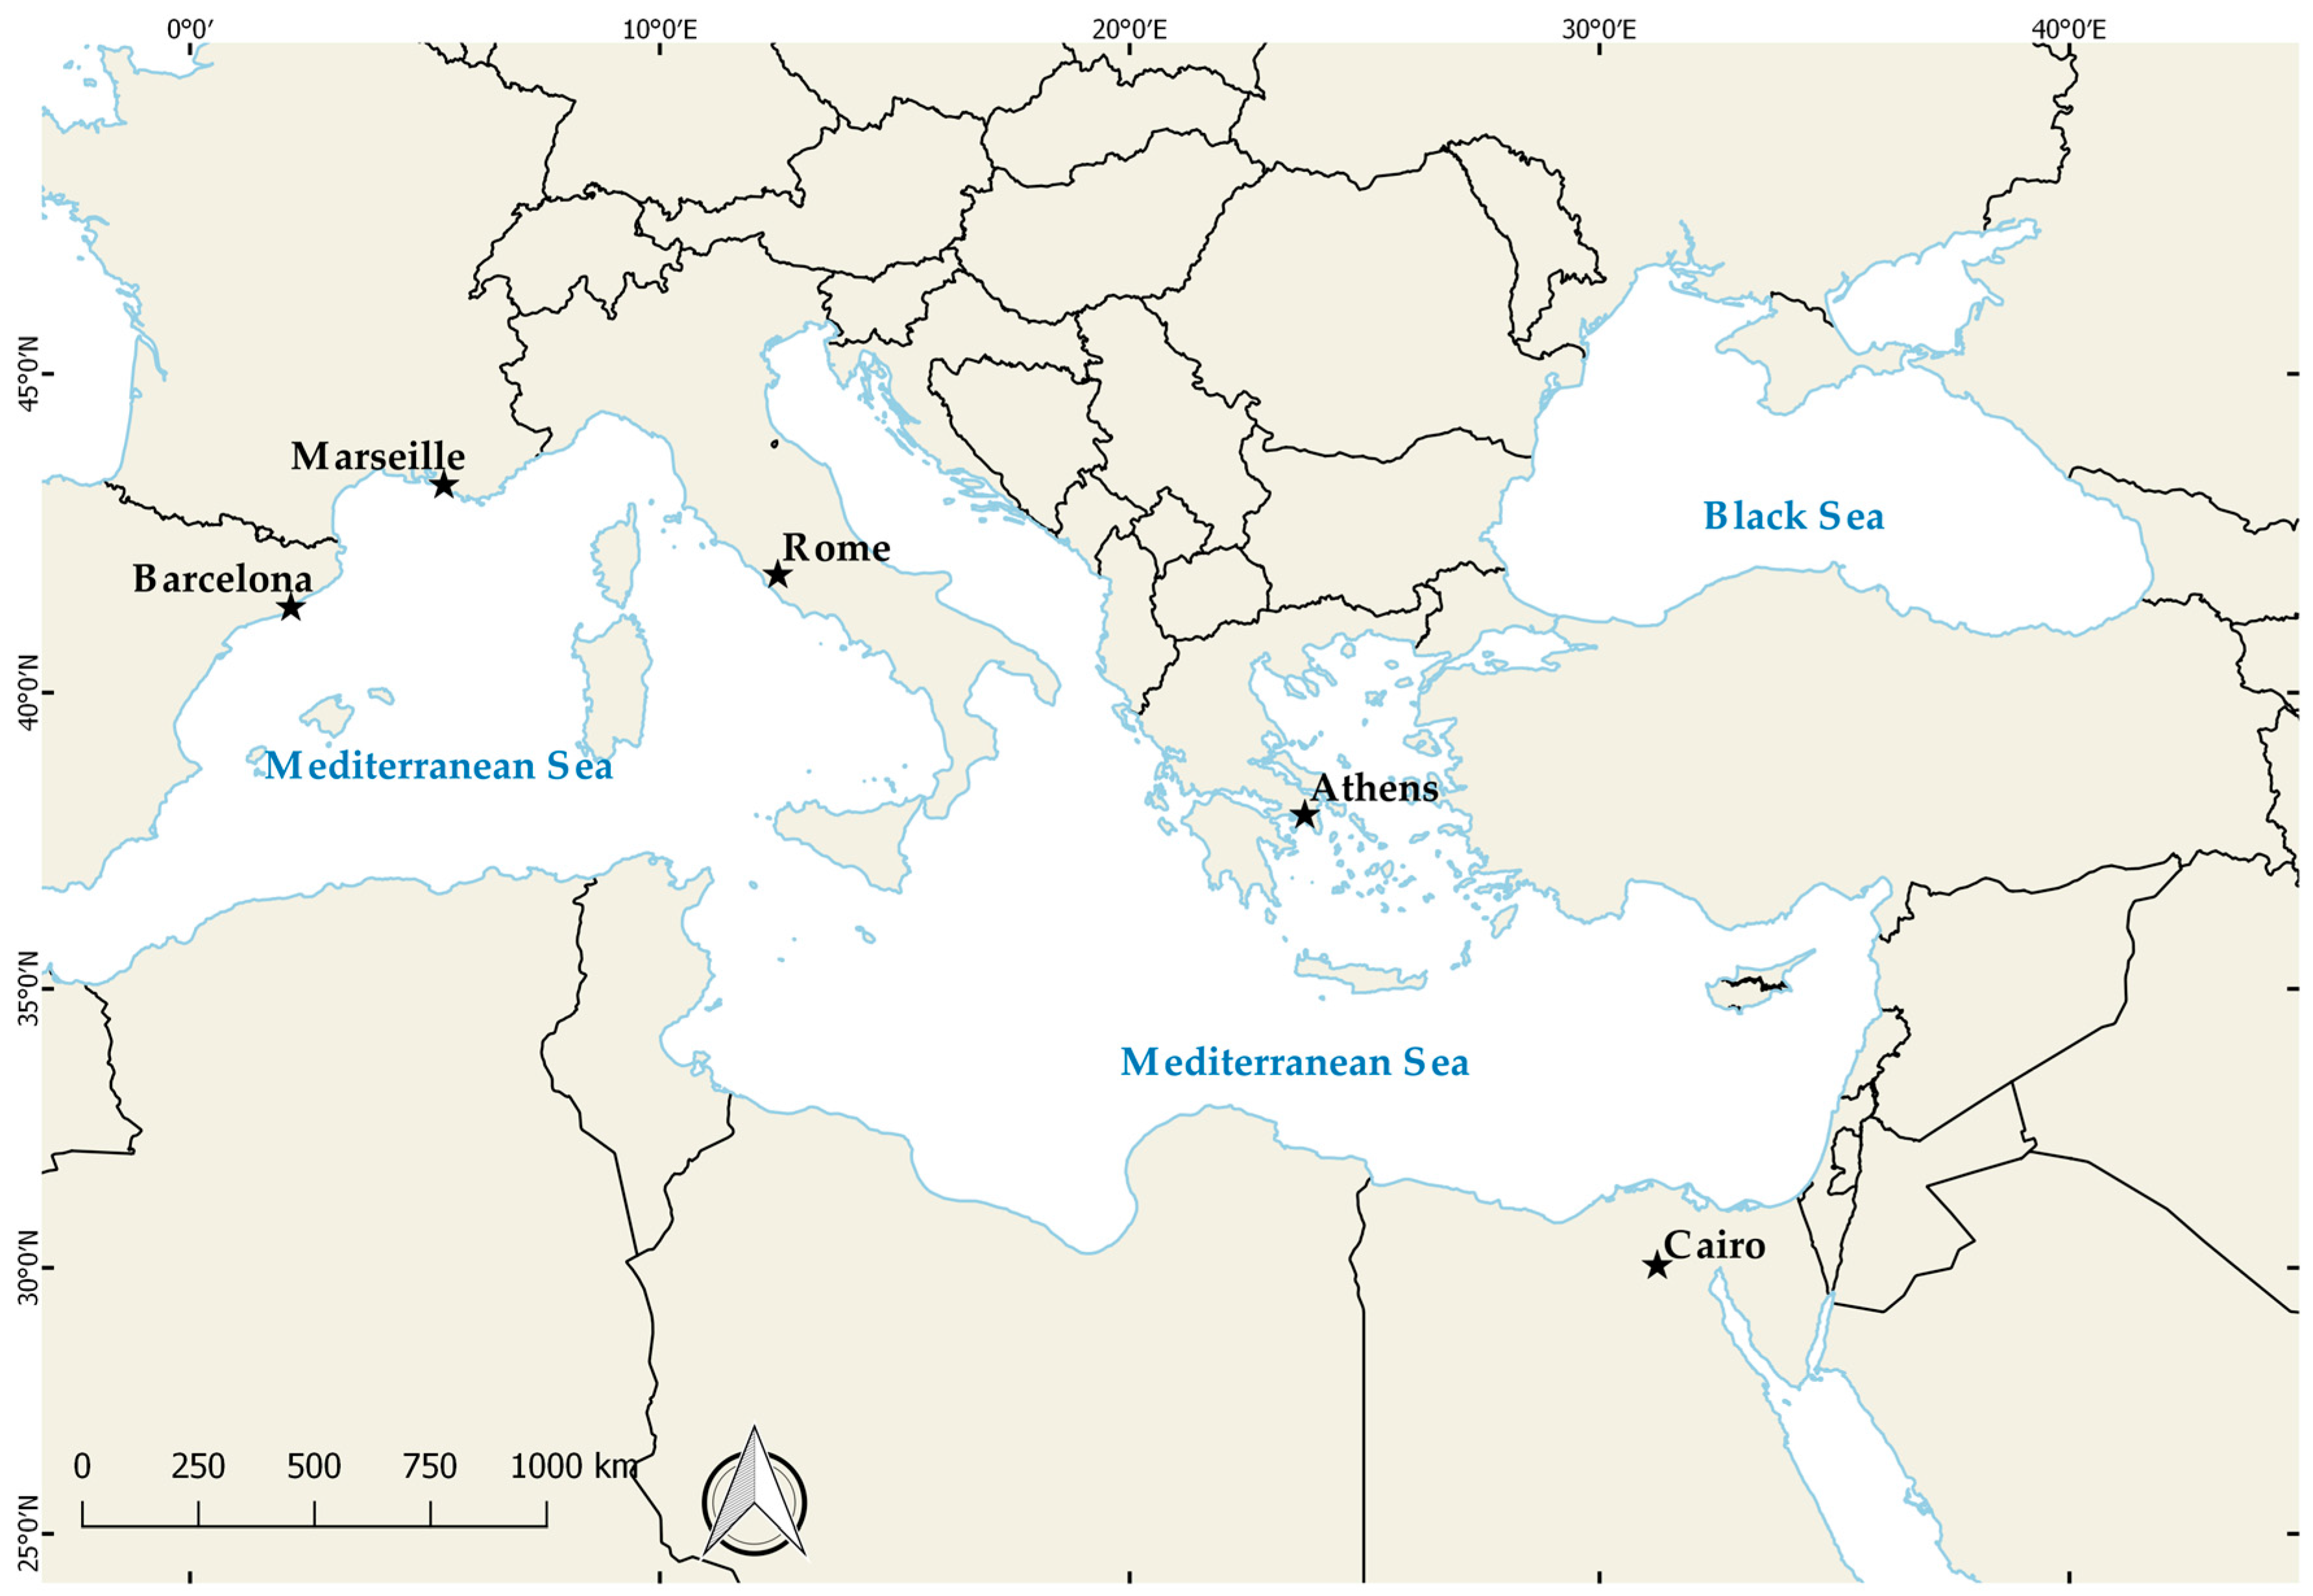
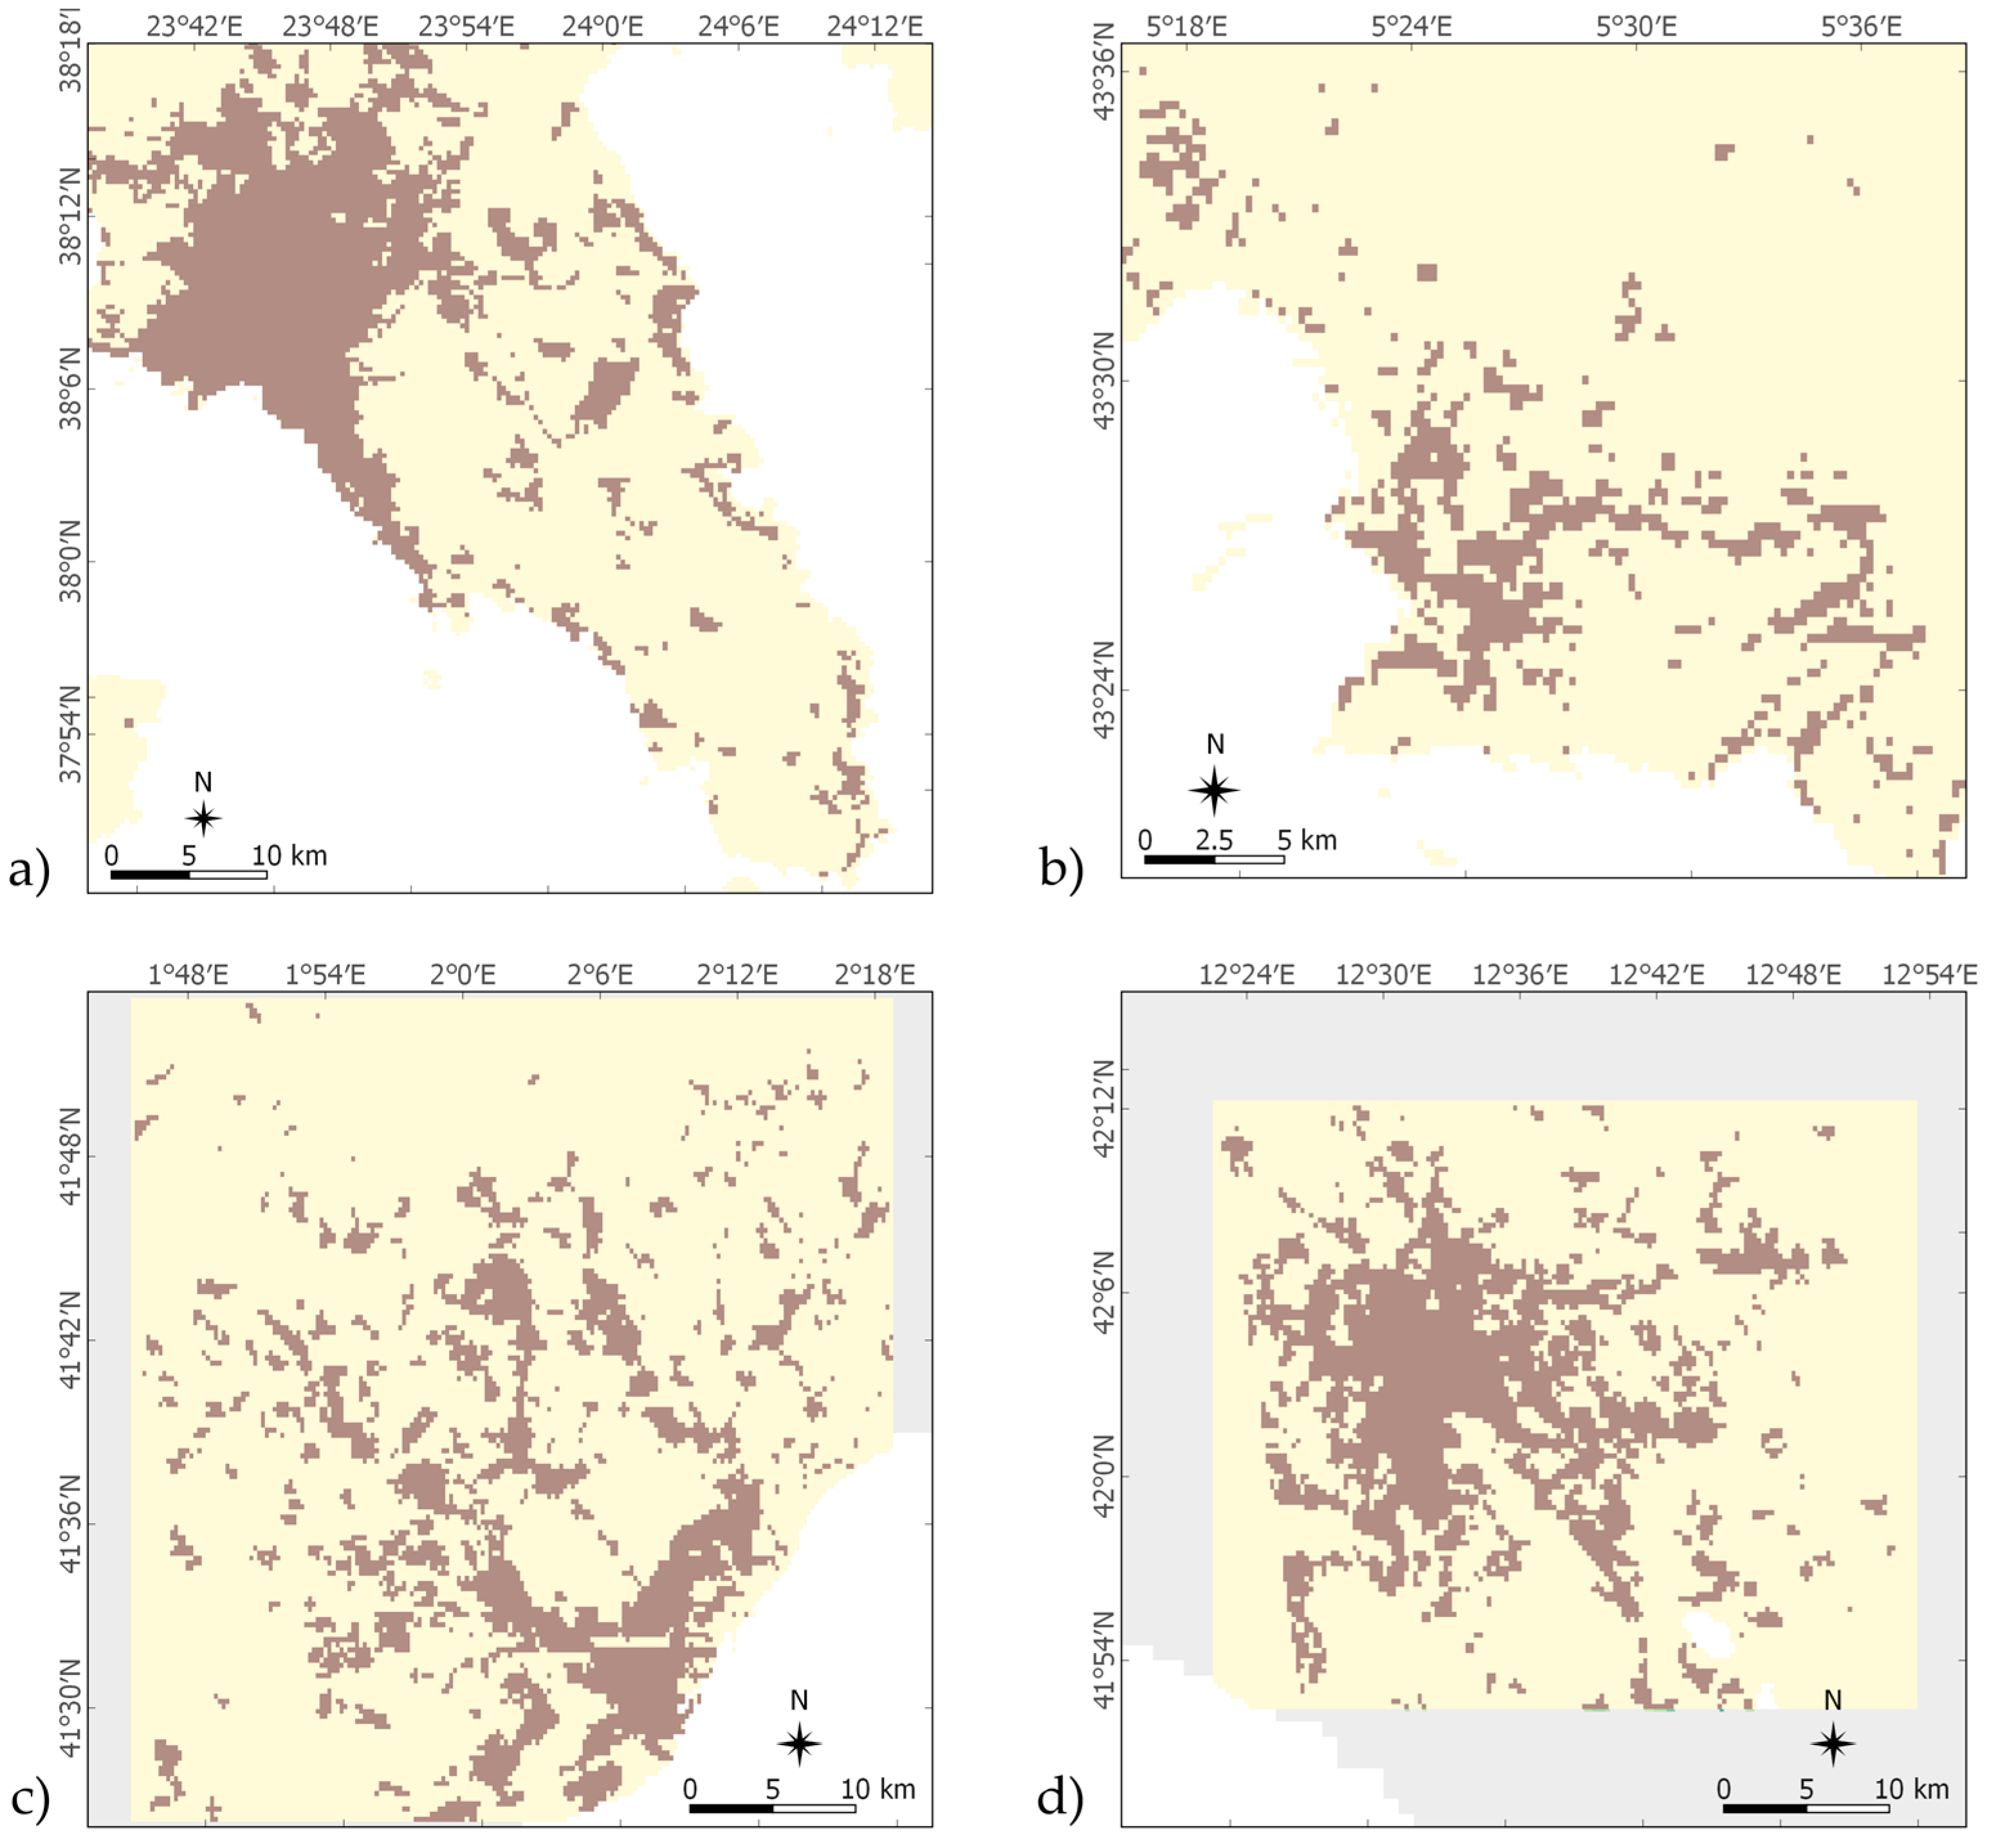
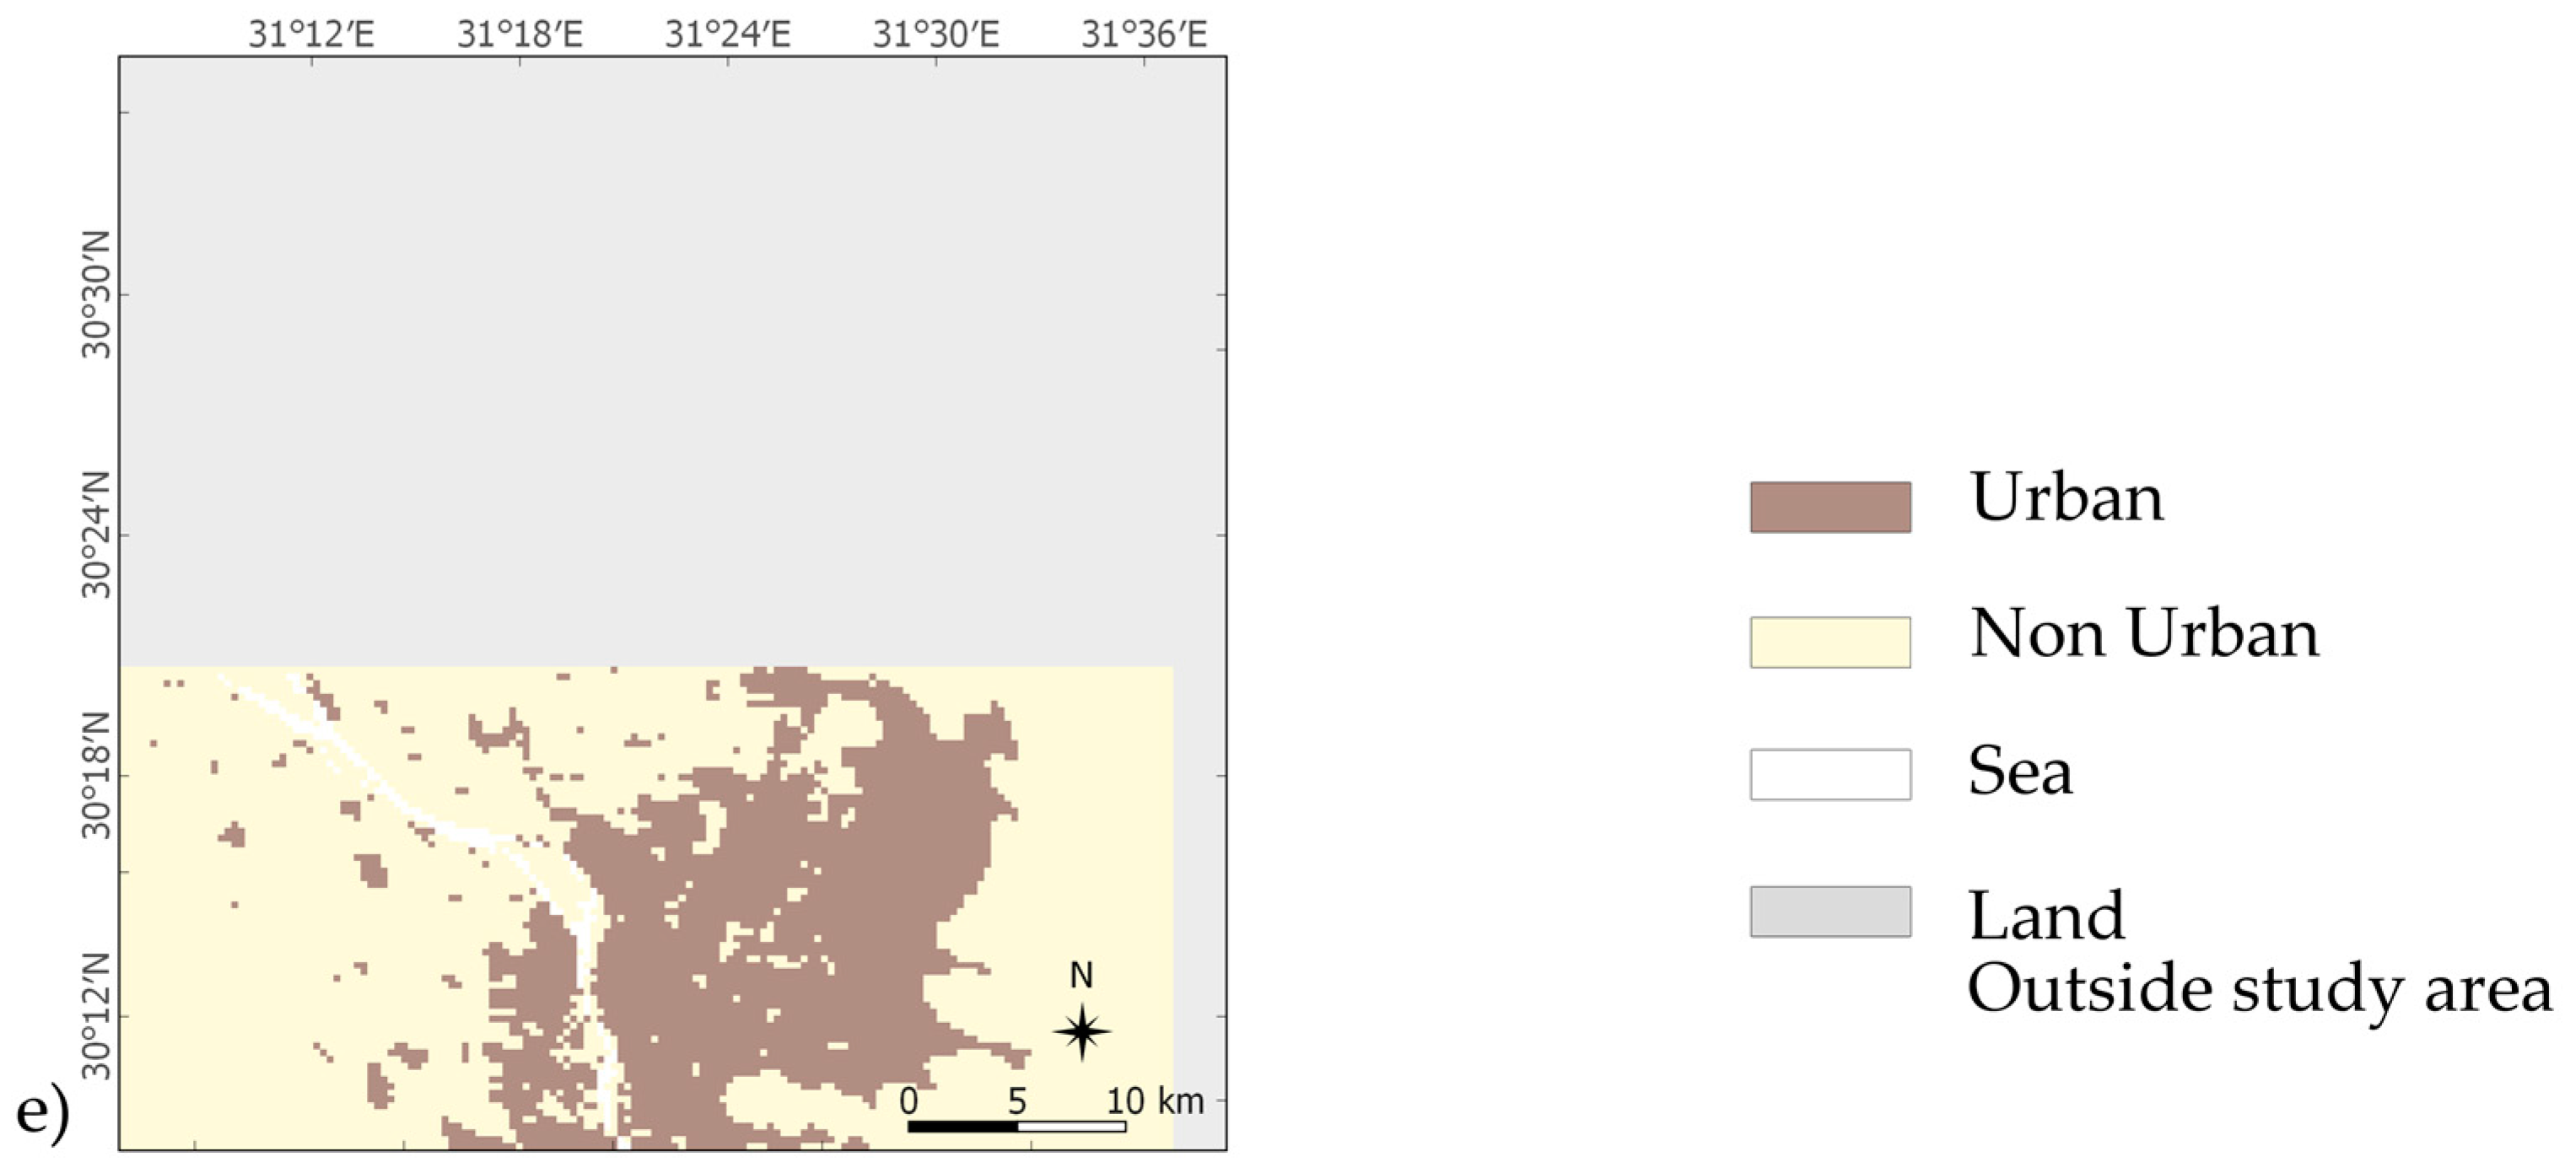
2. Materials and Methods

This study focuses on five major cities—Athens, Rome, Marseille, Barcelona and Cairo—lying around the Mediterranean Sea (Figure 1). The aforementioned cities were selected based on their urban population which is over 1.5 million (Table 1) and their Mediterranean climatic type. Mediterranean winter is characterized by moderate temperatures and variable, rainy weather, while Mediterranean summer is hot and dry. Although Cairo belongs to another climatic zone, according to Köppen climate classification, due to its geographic location the climate obtains regularly Mediterranean characteristics.
In this research study, MODIS Level 3 8-day LST products were used, available from NASA’s Terra satellite (product MOD11A2-Collection 6) [70]. The 8–day mean products are available at a 1 × 1 km spatial resolution and provide LST data for daytime (10:30 local solar time) and nighttime (22:30 local solar time). The MOD11A2 product has been validated and the accuracy was reported better than 1 K under clear sky conditions [70], however higher errors may occur at large viewing angles [71]. LST data used in the study cover the summer months (June to August) for the years 2000 to 2017.
Firstly, the monthly LST values for June, July and August, were computed from the MODIS-Terra 8-day product. Along with the LST data, the number of clear sky days and nights were used for the accurate estimation of the LST averages. In order to ensure the reliability of the monthly LST values, a minimum threshold of twelve clear sky days per month was set. Additionally, the quality assurance data sets were used and only good data quality pixels were selected, which have an average error for emissivity ≤ 0.01 and for LST ≤ 1 K [70]. Subsequently, the summer average LSTs were calculated for each year.
The 18-years LST trend for each city during day and night, was examined by means of a linear regression analysis as performed at pixel level, using the least squares method. A minimum threshold of fourteen annual summer LST values was set in order to ensure temporal homogeneity in the trend values. In addition, the LST time series were statistically analyzed pixel by pixel by means of the Mann-Kendall test, in order to assess the statistical significance of the trend.
Finally, and in order to assess the SUHI trends, ESA’s GlobCover product was used to classify the land cover to urban and non-urban. GlobCover classifies land cover for the year 2009 into 22 categories, using a spatial resolution of about 300 m × 300 m. The year 2009 is in the middle of the time series and taken that the cities under study have changed limitedly throughout the years we believe it is a good approximation for a fast and reliable methodology. Without doubt a year to year classification would be more accurate and could amend the land cover change impacts. Urban areas were determined from the land cover data and the average urban LST trend was calculated on this basis. According to GlobCover classification, urban areas are defined as the artificial surfaces and the associated areas covering more than 50% of the pixel considered. All the other land cover classes were merged and classified as non-urban and the average non-urban LST trend was also calculated. In Figure 2 the land cover classification to urban and non-urban areas is presented. The above results were converted from LST trend values as given in percentages to LST trend values in Kelvin for the period of eighteen years and the SUHI trend was then estimated by subtracting the average non-urban trend value from the urban one. Using the average values of all non-urban areas to extract the SUHI has some limitations as the non-urban areas will be greatly heterogeneous and very different between the cities. Finally, the extent of each study area was selected so that the number of non-urban pixels to be greater than the number of urban pixels in order to achieve meaningful results.

3. Results

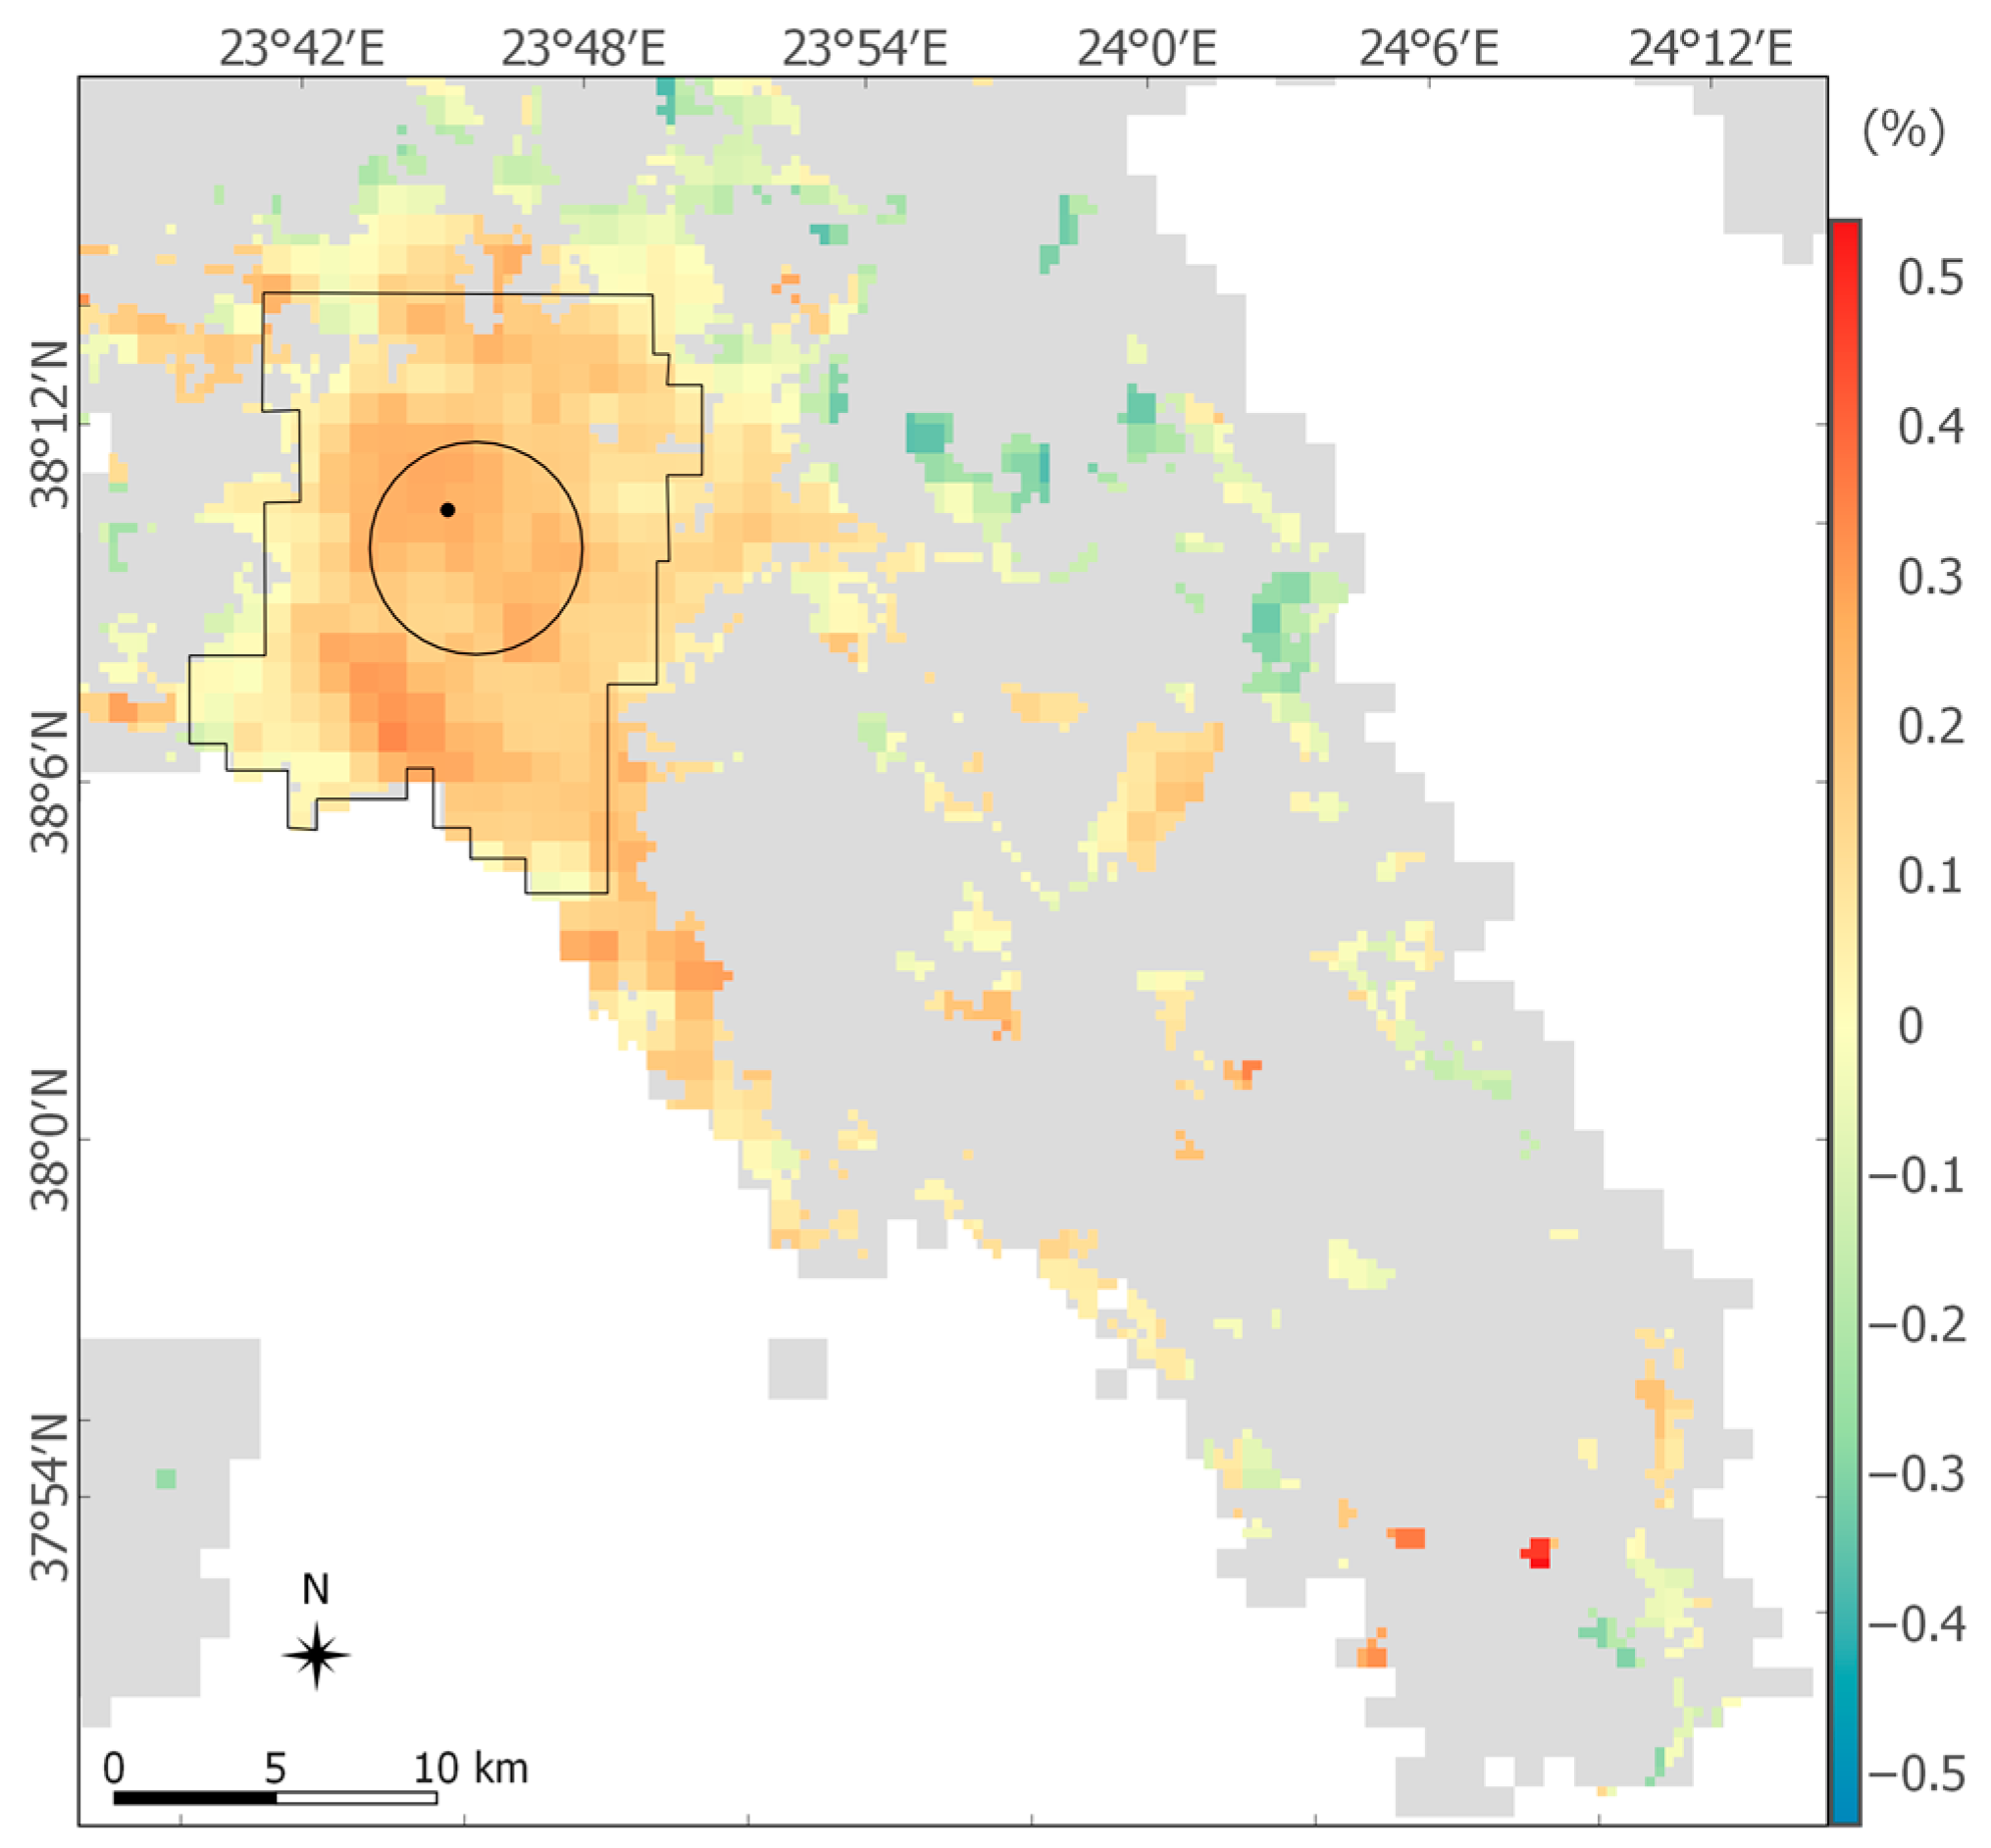
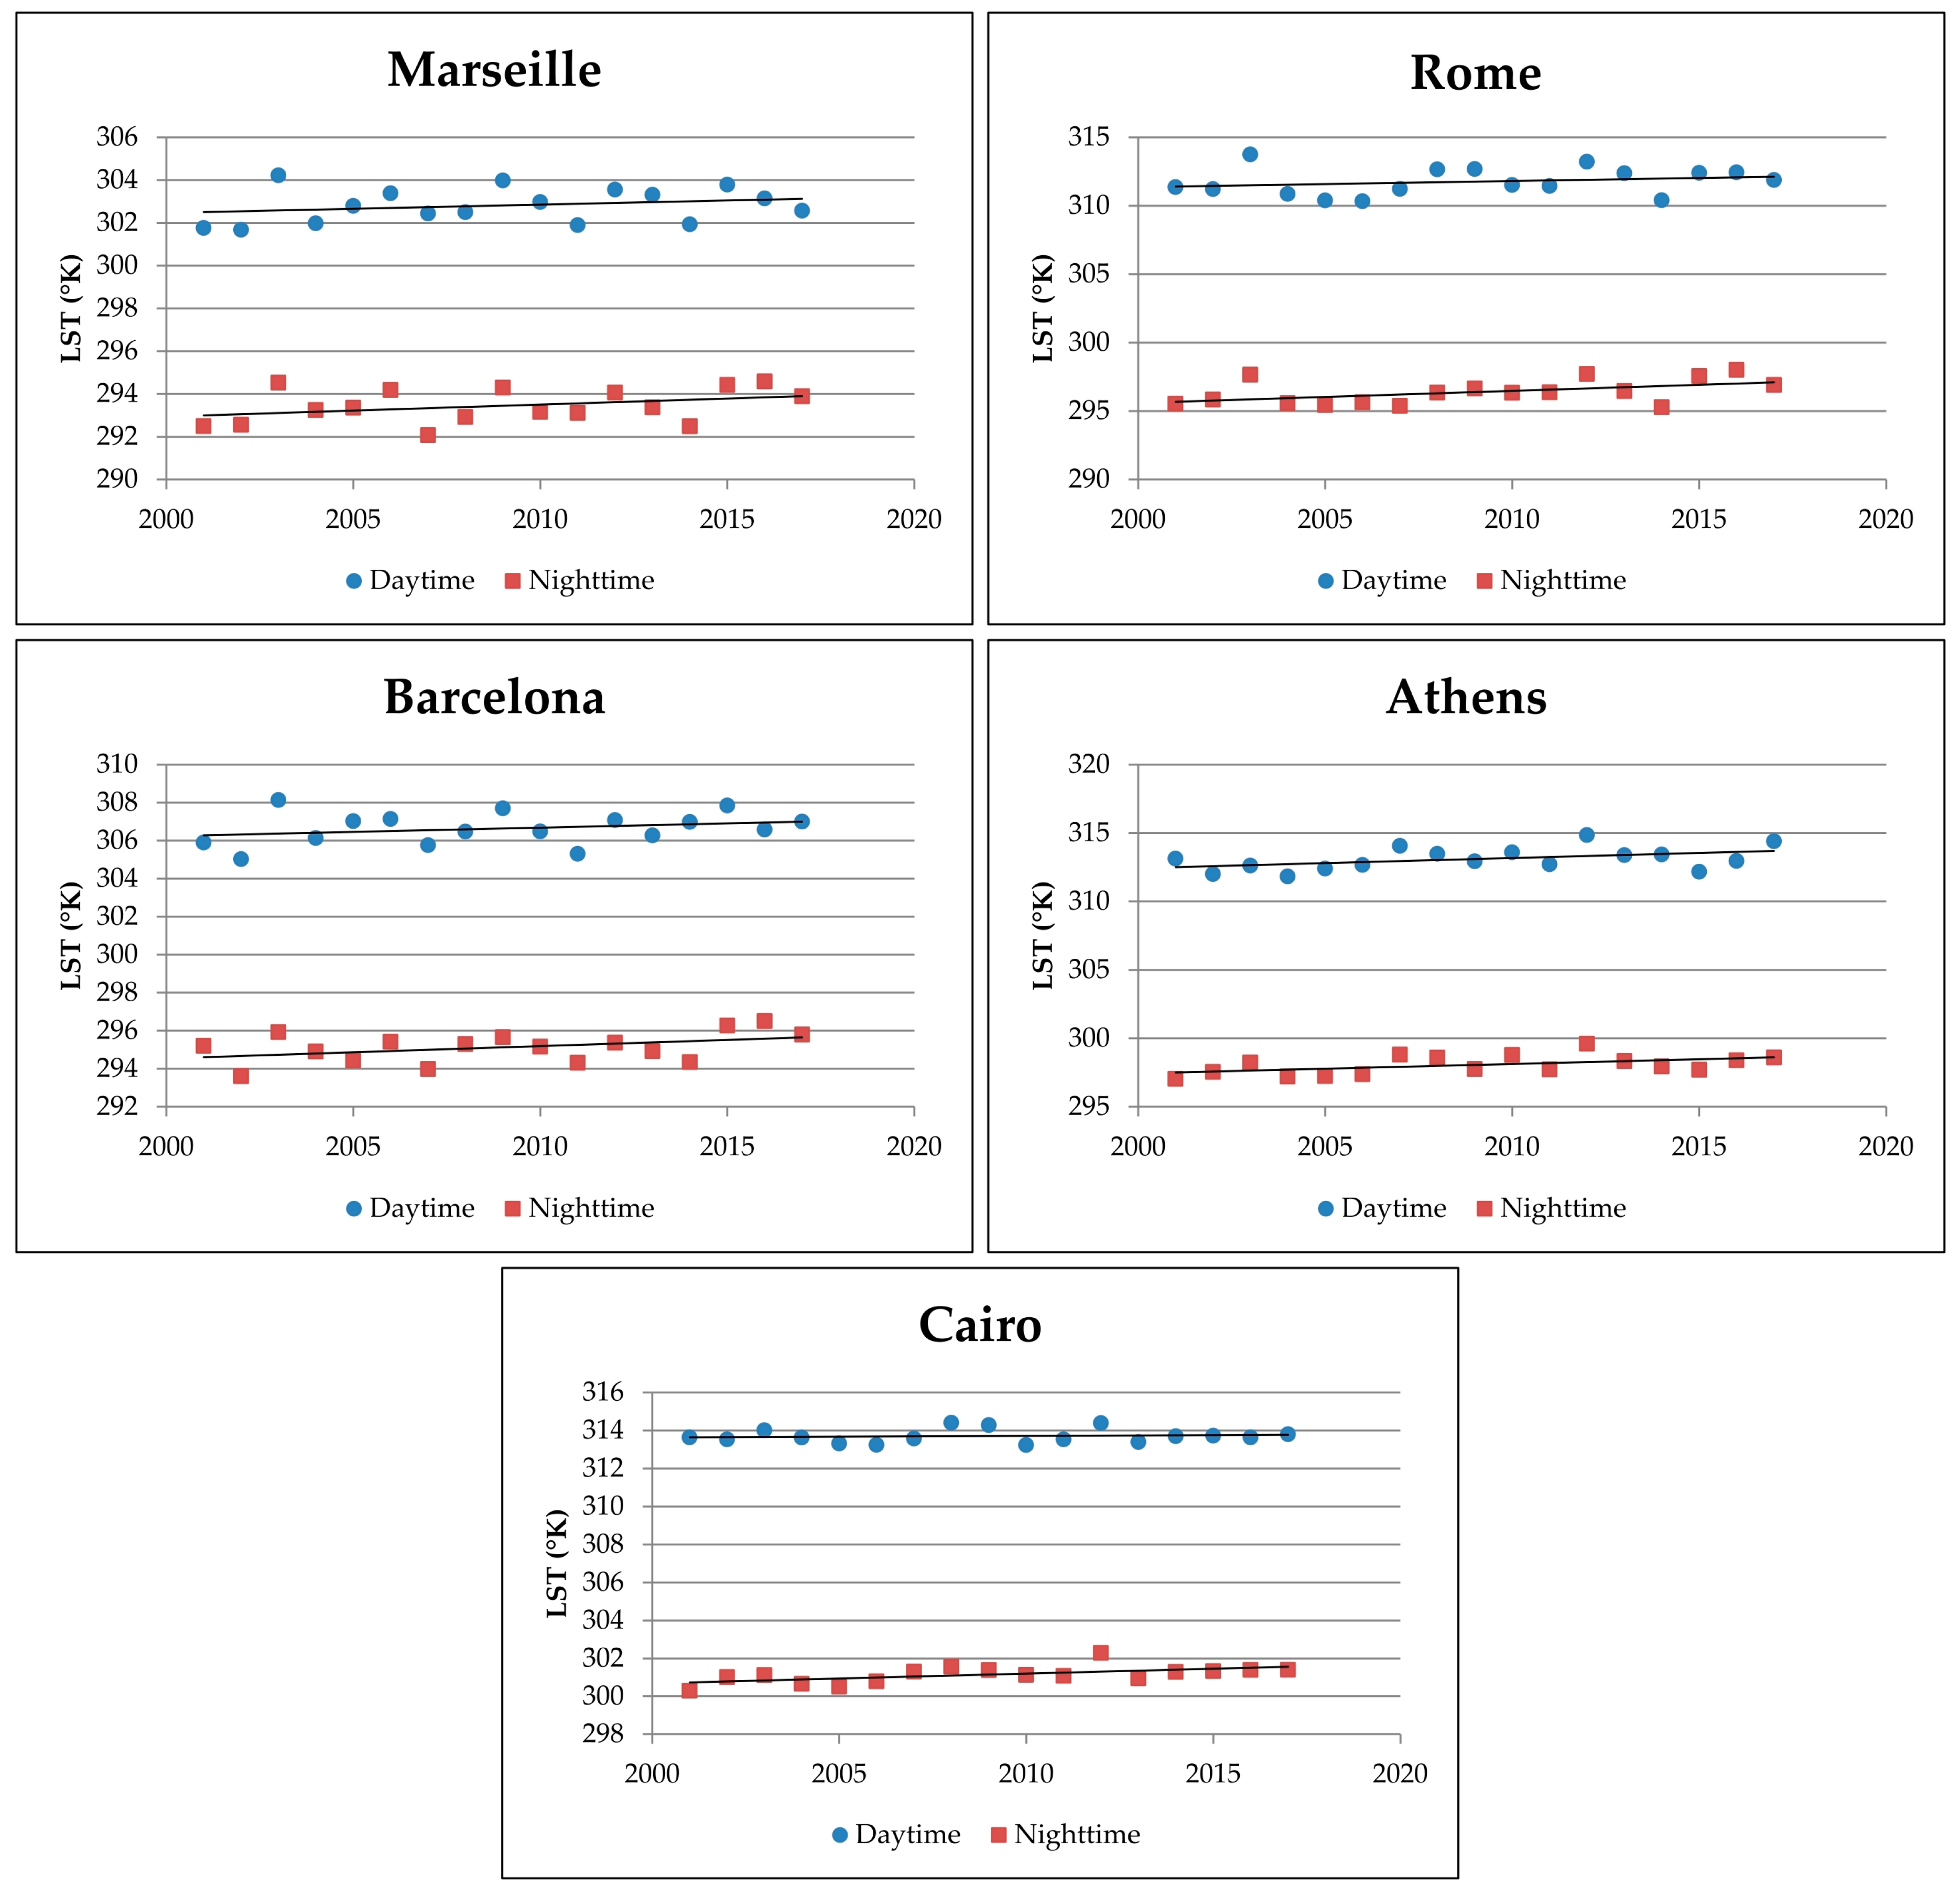
3.1. LST Trends Analysis

LST trend maps were developed for each city from the eighteen years LST time-series. Figure 3 and Figure 4 depict the LST trend maps for the urban pixels of the city of Athens during day and night respectively. Particularly, the majority of the daytime trends of the urban pixels (Figure 3) have positive values, while the highest trend values are found in the urban core, which is characterized by high built-up density. The average LST trend in the last eighteen years is +0.25% in the urban core and +0.06% in the entire urban agglomeration. As the distance from the city center increases, alongside with a decrease in the urban density, the LST trend values decrease reaching slightly negative trend values at the edges of the urban agglomeration.
In Figure 4 the nighttime LST trend map is presented for the urban pixels of the city of Athens. In general, during nighttime the spatial distribution of the LST trend values follows a different pattern as compared to the daytime one. In detail, urban core pixels have slightly smaller positive trend values compared to the urban pixels lying at the edges of the urban agglomeration. The aforementioned results can be attributed to the expansion of the city and the accompanied replacement of the natural materials with man-made ones, which have different thermal properties (i.e., heat capacity). In the outskirts of the city the land cover change that has occurred in the past eighteen years is more intense than the urban core which already had high urban densities back in 2000.
The daytime LST trend patterns of the other cities follow the pattern of Athens, as a clear connection between urban density and LST trend values is apparent (Figure 5a,c,e,g). The urban cores of Marseille, Barcelona and Rome exhibit the highest positive LST trend values reaching +0.3%, although the average urban LST trends have slightly negative values, due to the many urban pixels in the outskirts of the city characterized by different built-up densities than the urban core of the city. In Figure 6 the time series of one pixel inside the urban core of each city are presented. The selected pixels are located in the indicated urban core areas (see Figure 3 and Figure 5) and correspond to high positive daytime trends of the urban core.
Similar to Athens, the nighttime LST trend values of the other cities were found to have higher positive values than the daytime LST trend values (Figure 5b,d,f,h). In addition, the urban areas in the outskirt of these cities exhibit higher LST trends than the urban core of the cities following the nighttime pattern of Athens. The highest nighttime LST trends were found in Cairo where the average urban LST trend is +0.3%, with maximum trend values reaching +0.5%.
The Mann-Kendall test was performed for all cities under study on a pixel by pixel basis in order to assess the statistical significance of the results. The higher percentages of the statistically significant pixels (90% confidence level) were found during nighttime in Rome and in Cairo reaching 60% and 93% of the urban pixels respectively (Figure 7). In all other cases the majority of the LST trend values of the urban pixels were not significant at the 90% confidence level, especially at daytime. In the case of Marseille significant trends were not found at all. However, as a general remark most of the significant trend values were found in the outskirts of the cities. There, the possibility that a significant land cover change has occurred is greater, connecting the urban expansion with the significant positive LST trend values.

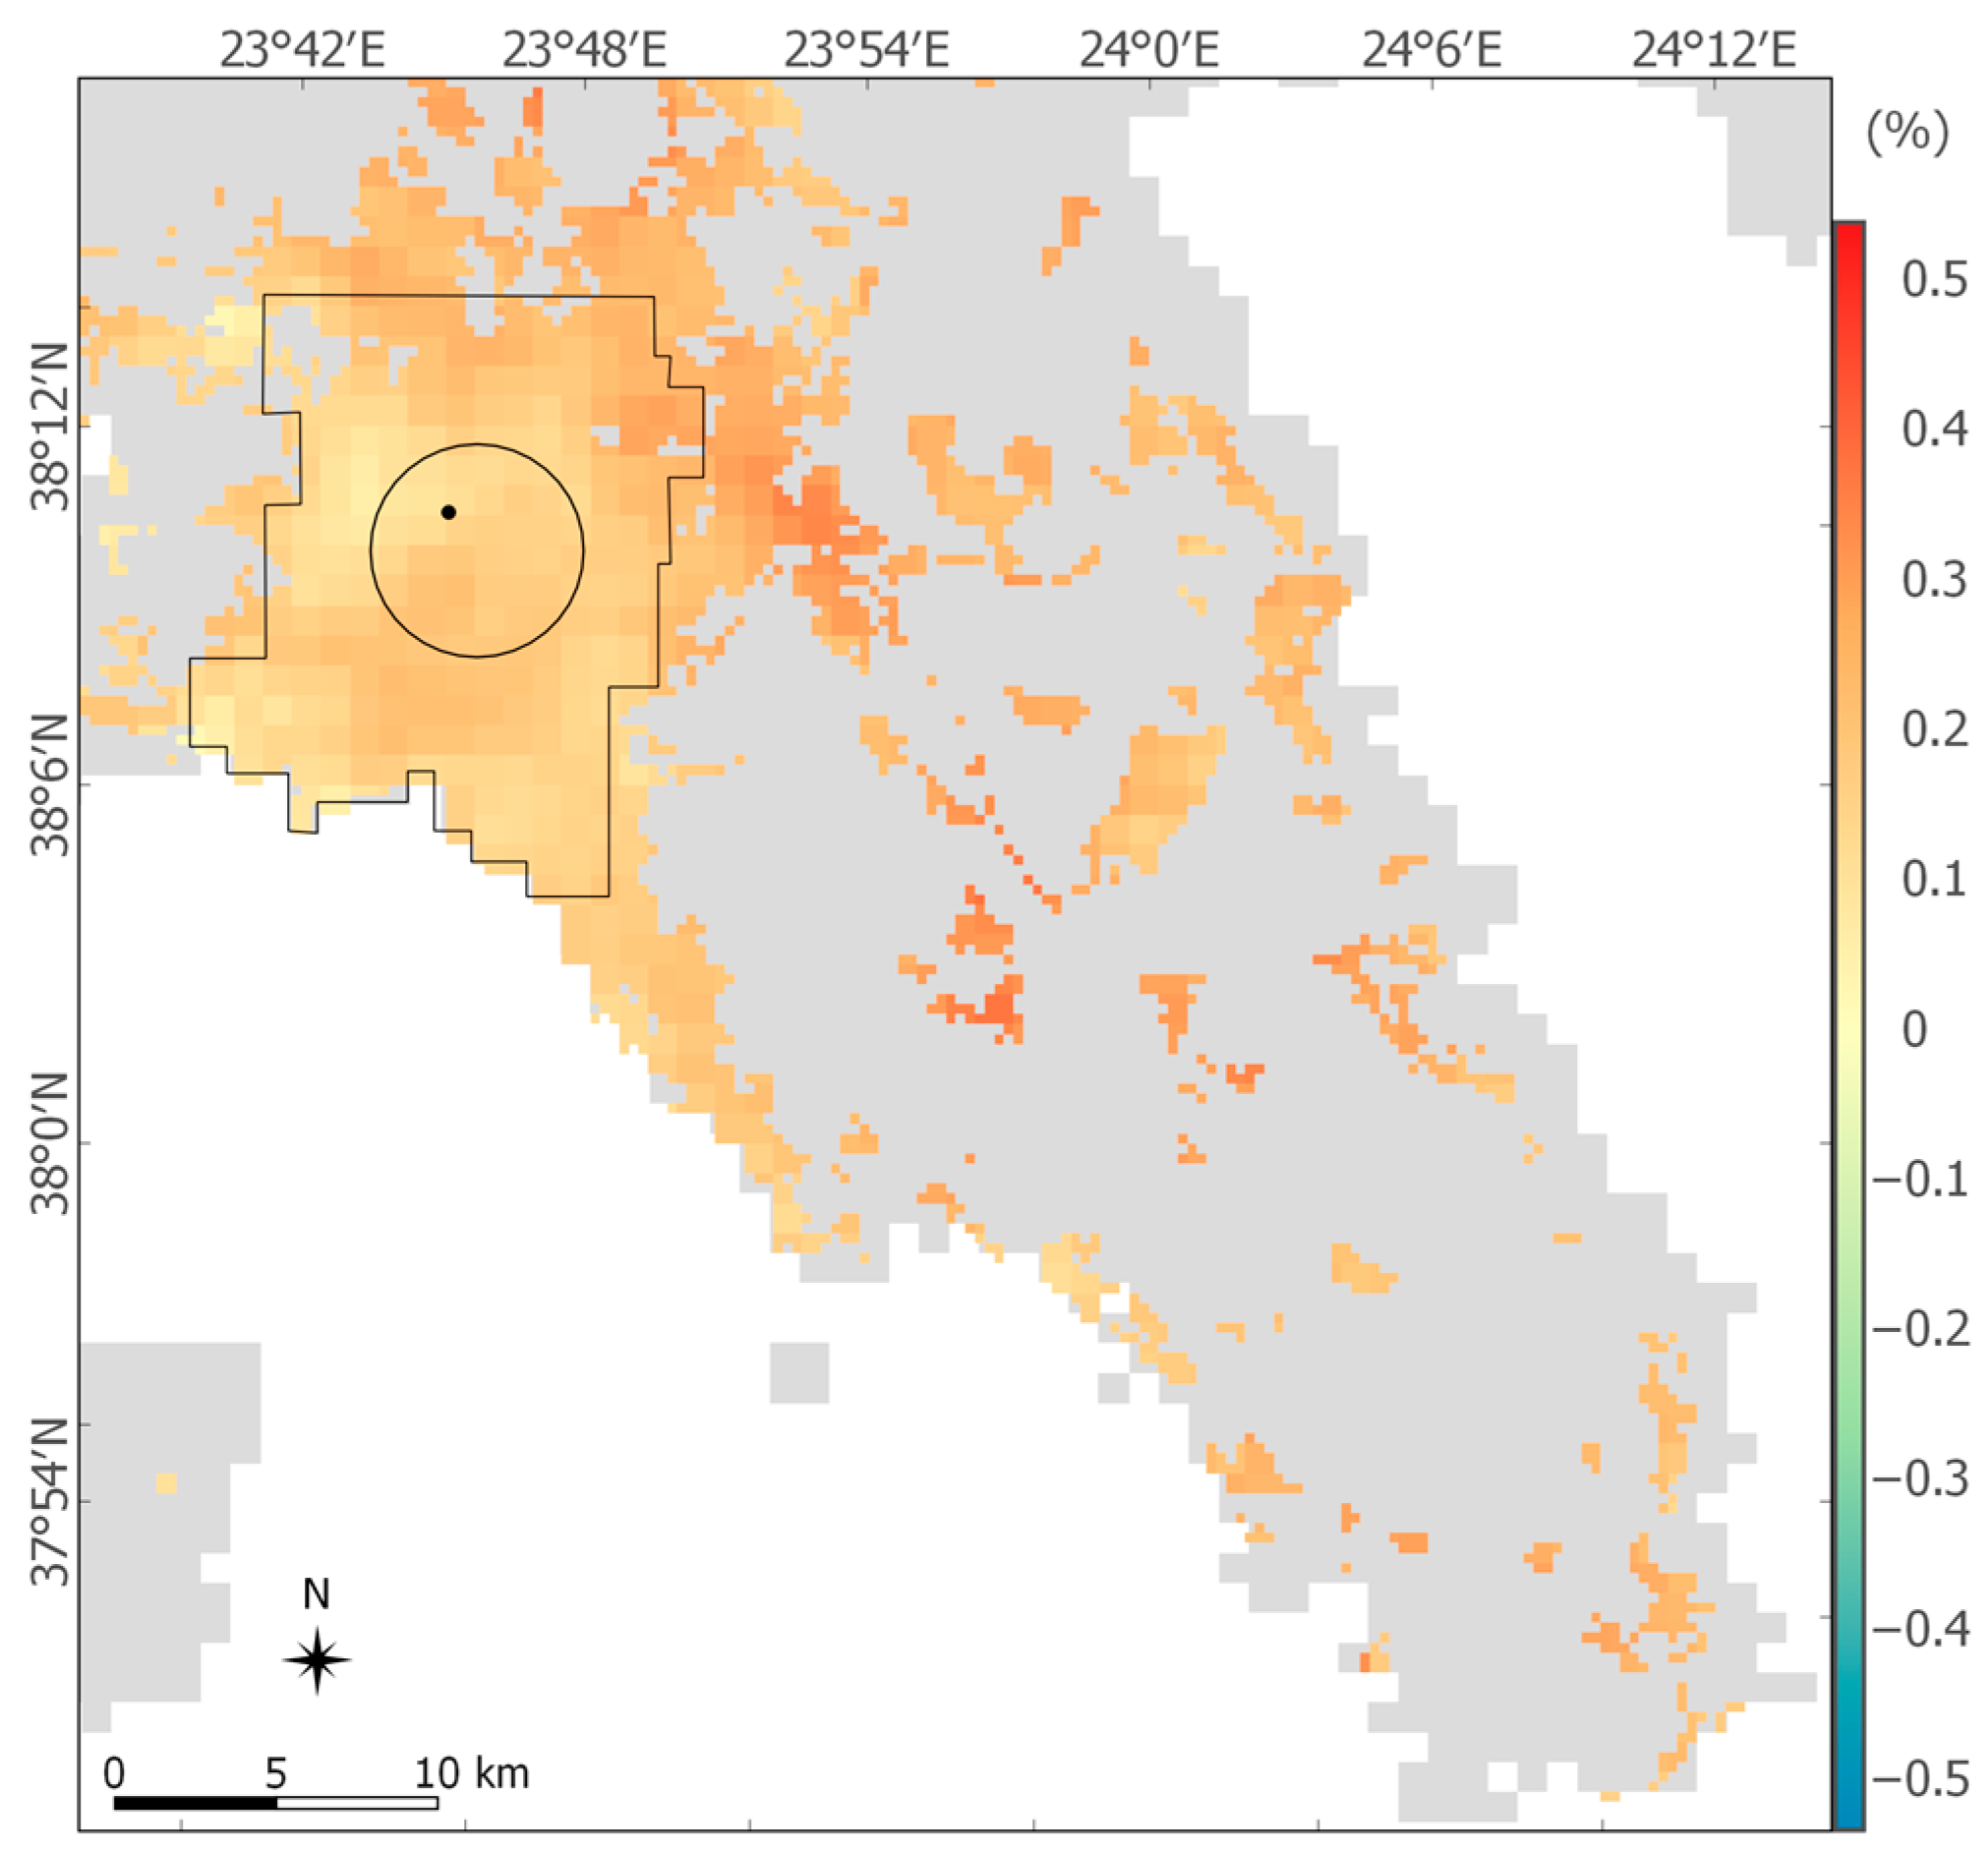
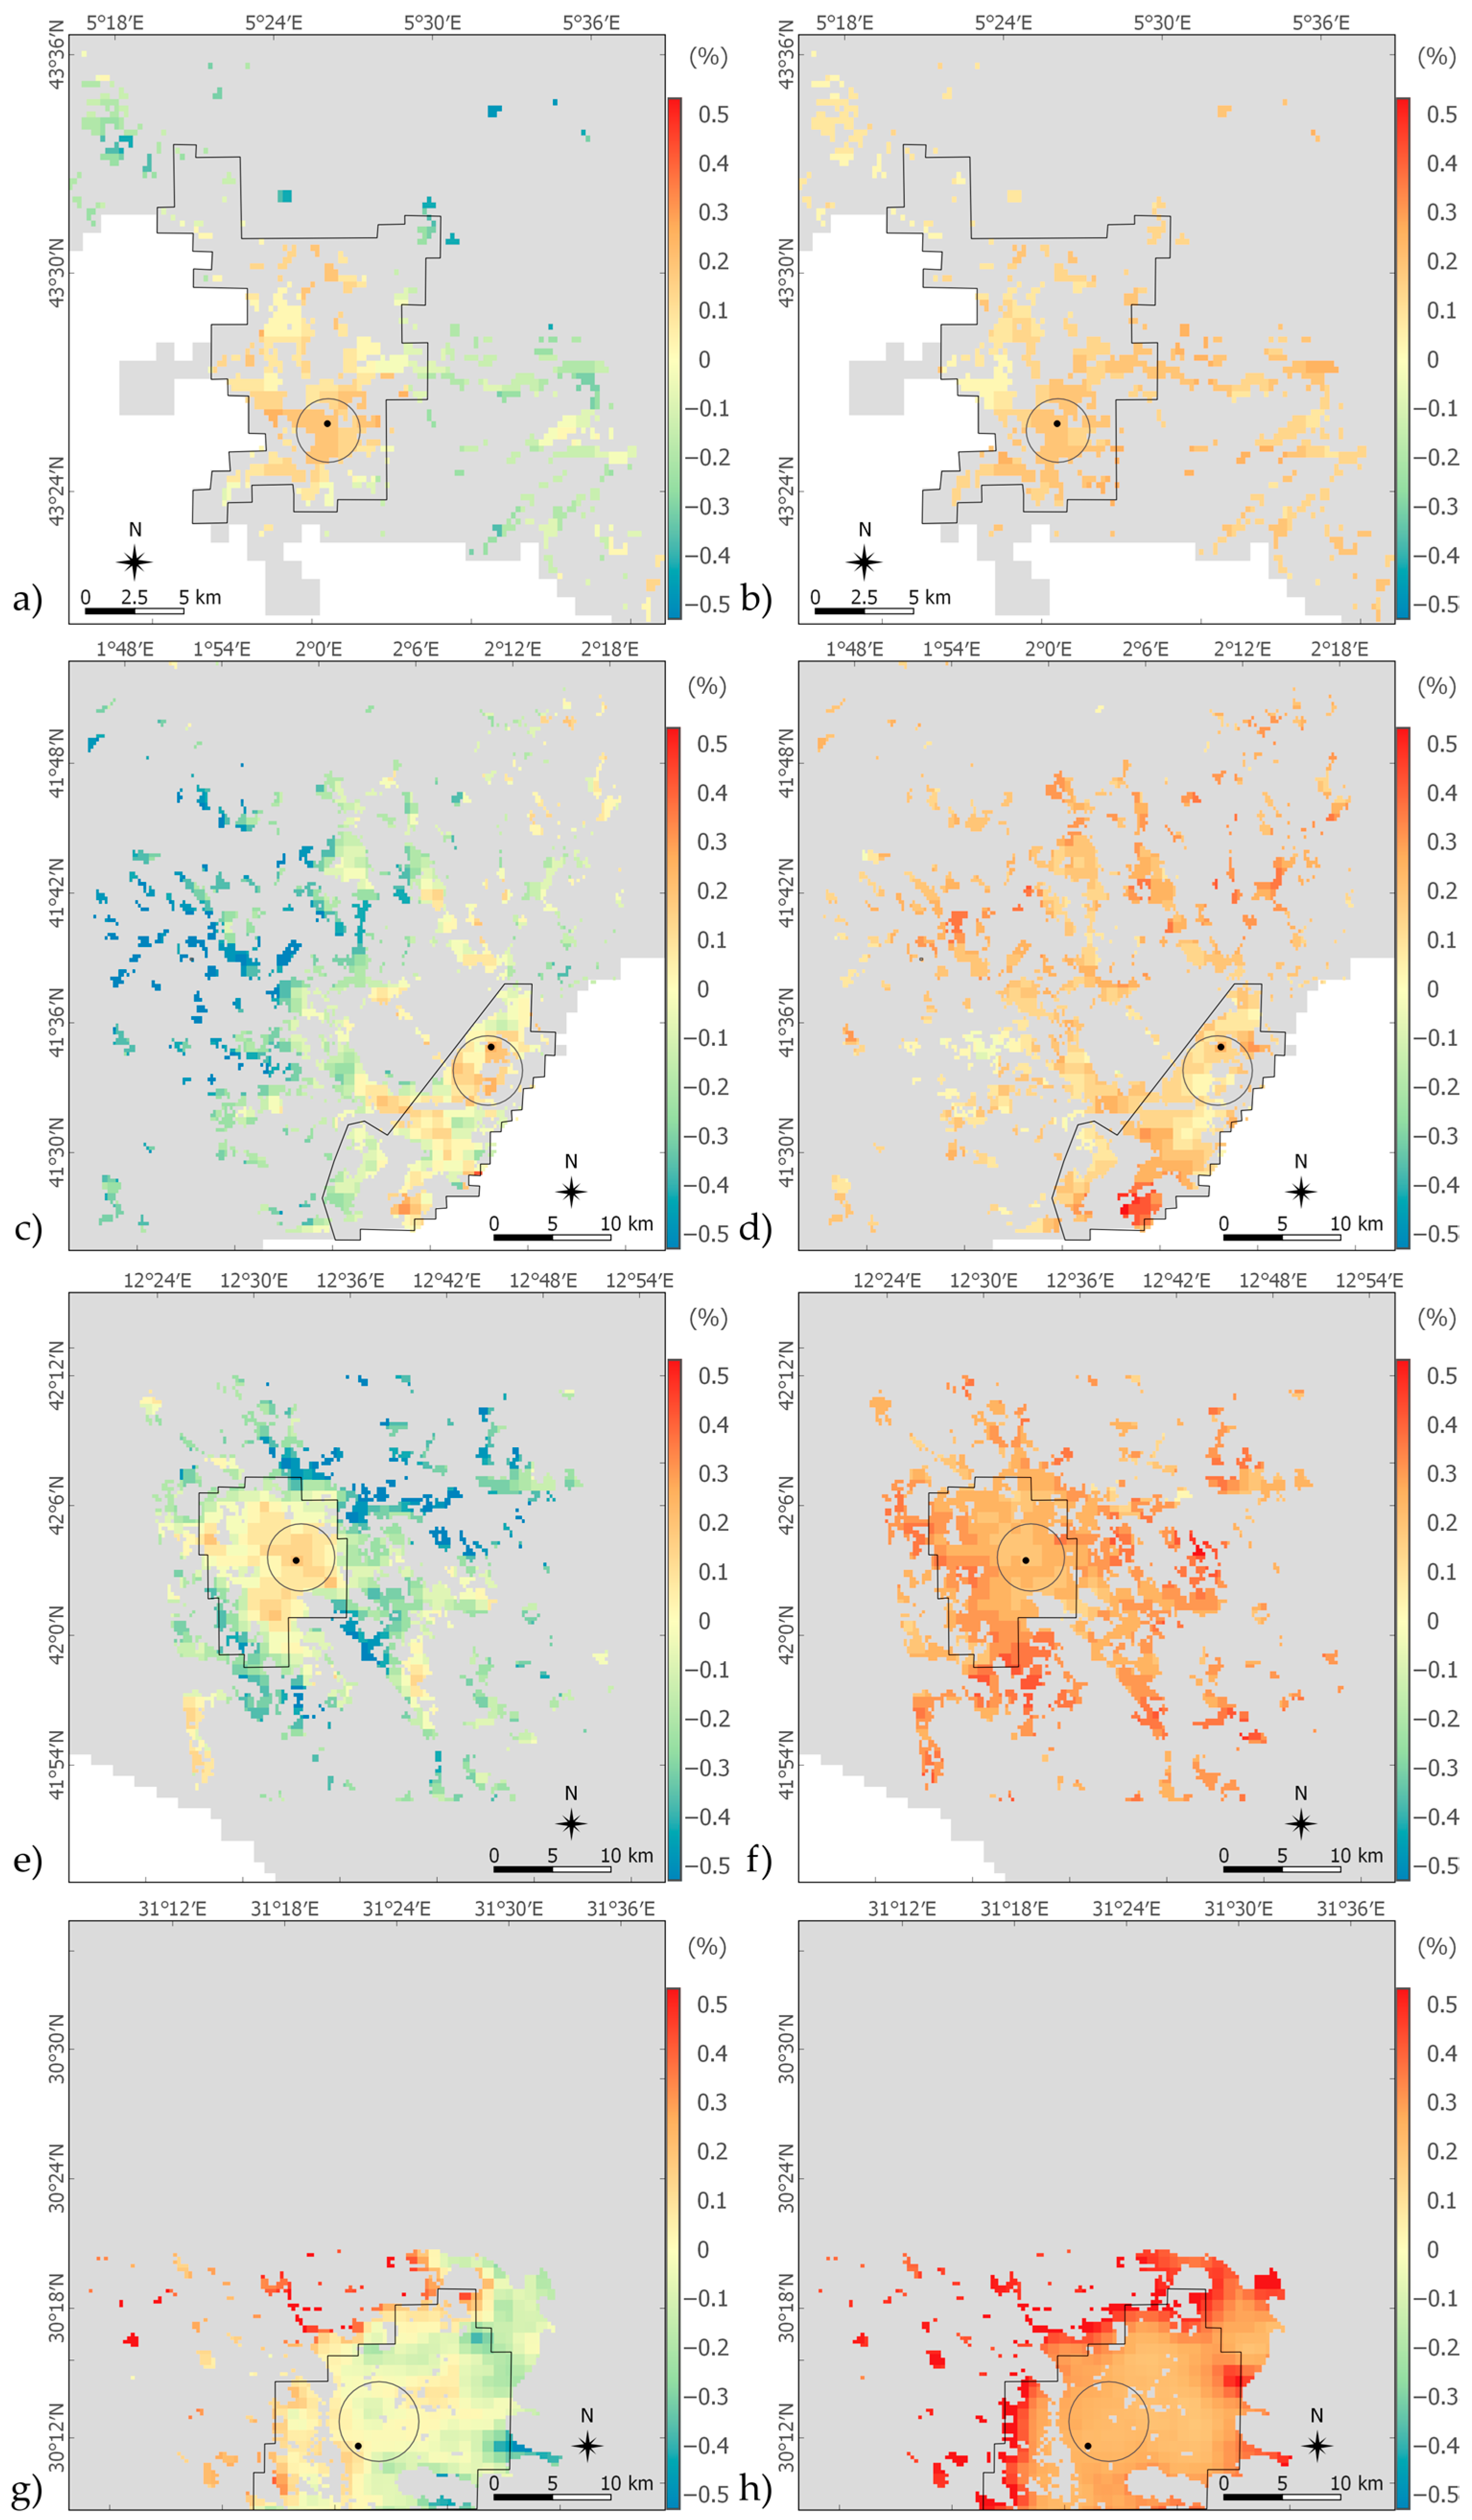
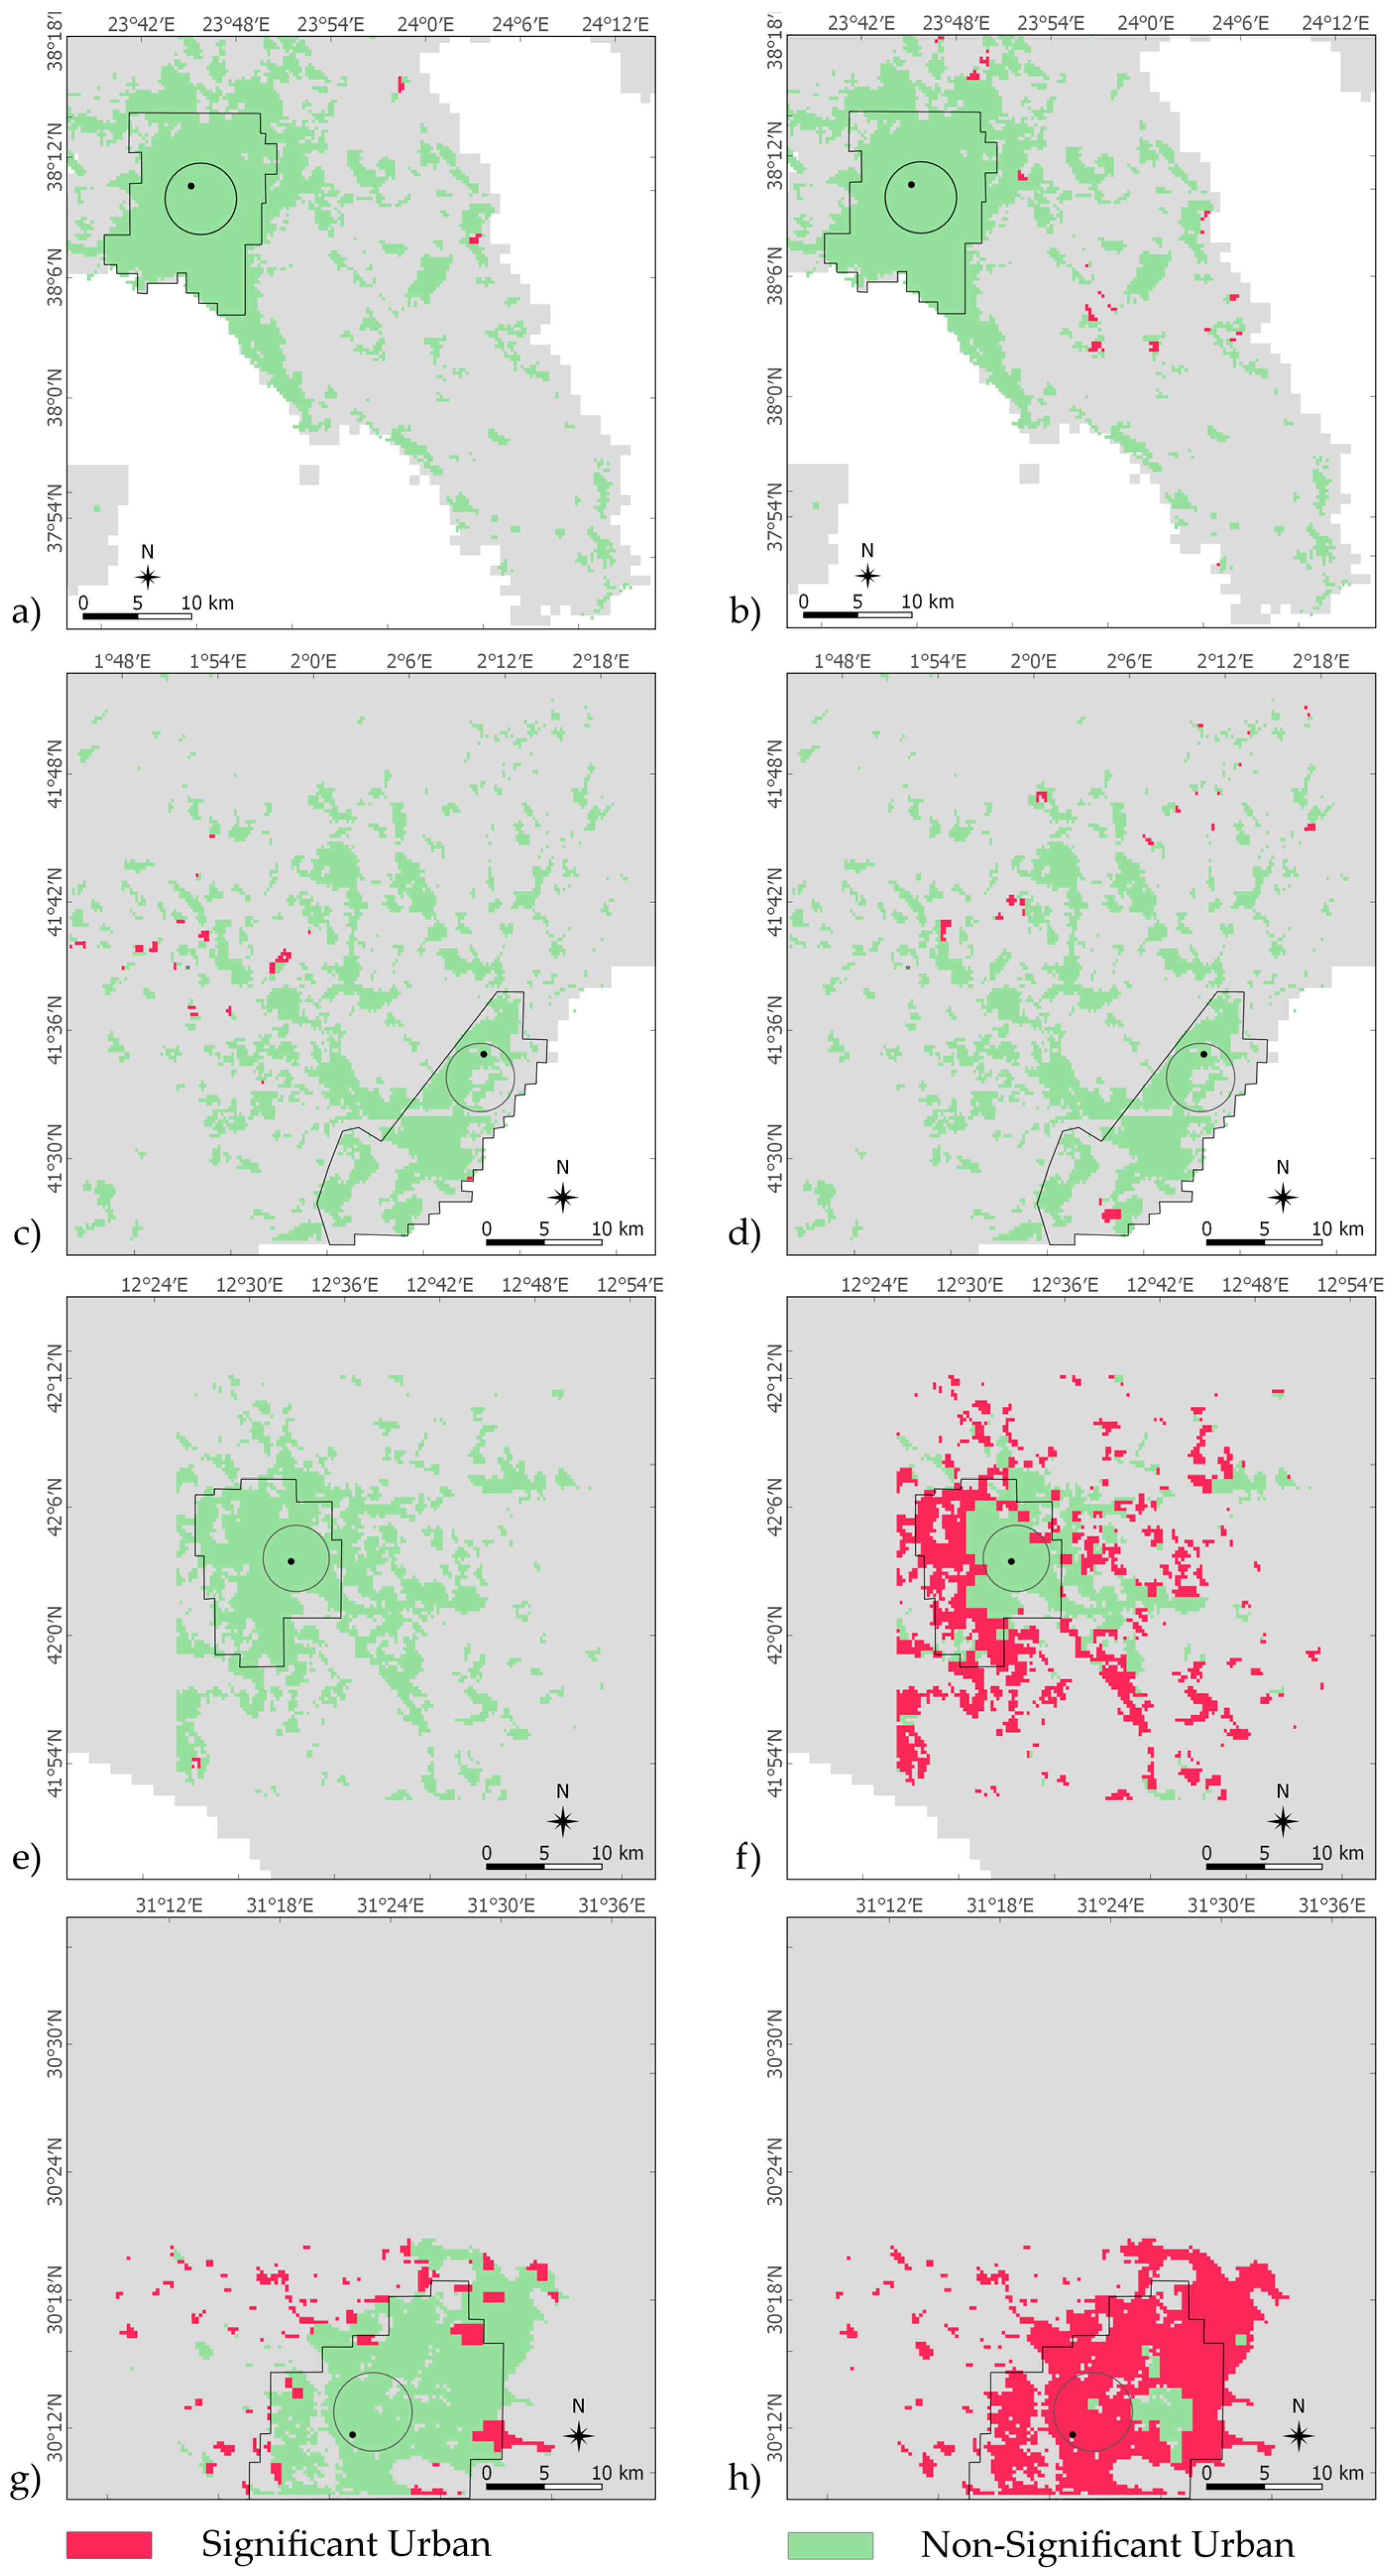
3.2. Surface Urban Heat Island Analysis

In order to assess the surface heat island phenomenon, LST trends in percentages (% per eighteen years) were converted to LST trends in Kelvin for a period of eighteen years using 2000 data as reference. The LST values were estimated on a pixel by pixel basis and the results for the city of Athens are presented in Figure 8, Figure 9, Figure 10 and Figure 11.
Daytime LST trend values of Athens reach +0.8 °K in the urban core (Figure 8) and then decrease gradually towards the outskirts of the city, resulting in an average urban LST trend of +0.167 °K. The non-urban areas exhibit a wide range of LST trend values, as expected, due to the various land covers that characterize the non-urban class and the accompanied changes that can be numerous (Figure 9). The average LST trend in the non-urban areas is slightly negative (−0.046 °K).
At nighttime, urban areas of Athens (Figure 10) exhibit an average positive LST trend of +0.52 °K, per eighteen years. Contrary to daytime, non-urban areas during nighttime have only positive LST trend values. The average non-urban LST trend (Figure 11) is similar to the urban one (+0.53 °K).
For the examination of the SUHI trends the average LST trend of the non-urban areas was subtracted from the LST trend of the urban areas. The SUHI results for the five cities under study are presented in Table 2 along with the average urban and non-urban LST trend values in Kelvin. Results reveal positive SUHI trend values during daytime for the majority of the cities and minor changes of SUHI during nighttime. In particular, during the last eighteen years in Marseille, SUHI has intensified by +0.605 °K in daytime, which is the maximum SUHI trend value observed. SUHI has weakened only in one city, in Cairo, by −0.3 °K. SUHI in the other cities appears to have been strengthened at least by +0.2 °K. At nighttime the SUHI of Cairo has weakened by −0.109 °K unlike the other cities, where the SUHI change is considerable limited. It must be noted that the standard deviations are very large in every case as a consequence of the low statistical significance of the LST trends.

4. Discussion

Assessing the summer LST trends of the period 2000–2017 in five major cities of the Mediterranean provided a clear evidence of positive LST trends during nighttime in the urban areas of these cities. These results are consisted with [63] who found positive annual nighttime LST trends in big cities across the Mediterranean region for the period 2001–2012. The LST change in the past eighteen years varies from +0.412 °K in Marseille to +0.923 °K in Cairo. Again, these results are consistent with [63] who found that Cairo exhibited the highest annual nighttime LST trends in the Mediterranean region and Marseille the lowest. These positive LST trends highlight the need of increased awareness regarding urban climate adaptation and mitigation plans.
The summer daytime LST present both positive and negative trends, although their spatial distribution suggests that positive trends are found in the urban core of these cities. The large standard deviation values reflect the large spatial variability of the LST trends of the urban areas, probably due to the low accuracy of the Globcover product in mapping urban areas especially in Europe as [72] reported. In addition, the inherent characteristic of the Globcover product to define as urban the artificial surfaces including all non-vegetative and human-constructed facilities that cover greater than 50% of a given landscape unit leads to heterogeneous urban pixels which in turn leads to large spatial variability especially during daytime. In [73,74,75] it is demonstrated that land cover composition and configuration greatly affects the magnitude of LST and that LST differs according to different landscape types, and the proportion of landscape types is the most significant factor affecting LST.
The vast majority of the LST trends were not statistical significant at the 90% level in consistency with [63] who found very few significant nighttime LST trends in the Mediterranean cities and with [65] who found non-statistical significant maximum and minimum LST trends around the globe. Contrary in [68], statistical significant negative LST trends at the 95% confidence level were found in the wider Athens area. In the latter study however the MOD11A2 LST data were upscaled to a 10km x 10km spatial resolution.
Nighttime SUHI present both positive and negative trends with low absolute values and these results are in line with [63] who found negative nighttime SUHI trends for Cairo and Marseille and positive nighttime SUHI trends for Rome and Barcelona. For the case of Athens, [63] found a negligible positive trend (0.02 °K per decade) contrary to our results. The daytime SUHI has positive trends in the European cities under study but negative trends are exhibited in Cairo. Unfortunately, no similar study was found in the literature to compare the results of the daytime SUHI trends, especially considering that the large standard deviations of these trends weaken their significance.
Further study of LST trends and SUHI focusing to more homogeneous urban areas should be considered. It is well known that land cover changes in urban areas affect LST over time [76,77] so additional research should be carried out by utilizing land cover change maps [78]. Nevertheless, these results provides a baseline for further research whereas the study has indicated how a relatively fast and straightforward LST analysis, using readily available satellite imagery, can assist in the SUHI assessment and urban planning, providing focus for subsequent more intensive measurement and analysis to support policy development and investment, especially in view of smart urbanization.

5. Conclusions

Summer LST and SUHI trends were calculated for five major Mediterranean cities for the period 2000–2017, using the MODIS 8-day product MOD11A2. LST and land cover data were used in order to assess the LST trends in urban and non-urban areas of these cities and to examine the SUHI intensity trend for the last eighteen years. The 2000–2017 time-series analysis found positive daytime LST trends for the majority of the cities under study, with the highest values found at the urban core of the cities, and positive nighttime LST trends in all cities. SUHI trends exhibit large variations, for daytime an increasing but not statistical significant SUHI trend was found for all European cities but not for Cairo. At nighttime, the SUHI trends are considerably limited with both positive and negative trends found.
MODIS data are freely available and provide consistent LST estimates from 2000. Despite the fact that they are not yet long enough for climatic studies, the methodology used in this research can provide essential information on the urban dynamics and can be integrated in urban climate change adaptation and strategy and also support the drafting of policies and measures for smart urbanization. The study also highlights the benefits of using remote sensing data and especially of using MODIS data for monitoring the LST dynamics and trends, as MODIS obtains the longest time series of consistent LST data covering wide regions of the globe. Finally, further research should focus on the accurate depiction of homogeneous urban areas in order to decrease the variability of the LST trends.

Author Contributions

All authors designed the methodology. Anastasios Polydoros and Thaleia Mavrakou implemented the methodology and performed the necessary statistical analysis; all authors contributed to the analysis of the data and to the drafting of the paper.

Conflicts of Interest

The authors declare no conflict of interest.

References

  1. Xian, G.; Crane, M. An analysis of urban thermal characteristics and associated land cover in Tampa Bay and Las Vegas using Landsat satellite data. Remote Sens. Environ. 2006, 104, 147–156. [Google Scholar] [CrossRef]
  2. Chrysoulakis, N.; Mitraka, Z.; Stathopoulou, M.; Cartalis, C. A comparative analysis of the urban web of the greater Athens agglomeration for the last 20 years period on the basis of Landsat imagery. In Proceedings of the Third International Conference on Environmental Management, Engineering, Planning and Economics CEMEPE 2011 & SECOTOX, Skiathos Island, Greece, 19–24 June 2011. [Google Scholar]
  3. Alberti, M.; Marzluff, J. Ecological resilience in urban ecosystems: Linking urban patterns to ecological and human function. Urban Ecosyst. 2004, 7, 241–265. [Google Scholar] [CrossRef]
  4. Intergovernmental Panel on Climate Change (IPCC). Climate Change 2013: The Physical Science Basis, Contribution of Working Group I to the Fifth Assessment Report of the Intergovernmental Panel on Climate Change; Cambridge University Press: Cambridge, MA, USA, 2013; ISBN 978-1107661820. [Google Scholar]
  5. Yuan, F.; Bauer, M.E. Comparison of impervious surface area and normalized difference vegetation index as indicators of surface urban heat island effects in Landsat imagery. Remote Sens. Environ. 2007, 106, 375–386. [Google Scholar] [CrossRef]
  6. Schwarz, N.; Schlink, U.; Franck, U.; Großmann, K. Relationship of land surface and air temperatures and its implications for quantifying urban heat island indicators—An application for the city of Leipzig (Germany). Ecol. Indic. 2012, 18, 693–704. [Google Scholar] [CrossRef]
  7. United Nations. World Urbanization Prospects: The 2014 Revision; United Nations: New York, NY, USA, 2014. [Google Scholar]
  8. Seto, K.C.; Fragkias, M.; Güneralp, B.; Reilly, M.K. A meta-analysis of global urban land expansion. PLoS ONE 2011, 6. [Google Scholar] [CrossRef] [PubMed]
  9. Intergovernmental Panel on Climate Change (IPCC). Climate Change, 2007b. Mitigation. Contribution of Working Group III to the Fourth Assessment Report of the Intergovernmental Panel on Climate Change; Metz, B., Davidson, O.R., Bosch, P.R., Dave, R., Meyer, L.A., Eds.; Cambridge University Press: Cambridge, UK; New York, NY, USA, 2007; p. 852. ISBN 978-0-521-88011-4. [Google Scholar]
  10. Bolle, H.J. Climate, climate variability, and impacts in the Mediterranean area: An overview. In Mediterranean Climate; Bolle, H.J., Ed.; Springer: Berlin, Germany, 2003; pp. 5–86. ISBN 978-3-642-55657-9. [Google Scholar]
  11. Giorgi, F.; Lionello, P. Climate change projections for the Mediterranean region. Glob. Planet Chang. 2008, 63, 90–104. [Google Scholar] [CrossRef]
  12. Stathopoulou, M.; Cartalis, C. Use of satellite remote sensing in support of urban heat island studies. Adv. Build. Energy Res. 2007, 1, 203–212. [Google Scholar] [CrossRef]
  13. Stathopoulou, M.; Synnefa, A.; Cartalis, C.; Santamouris, M.; Karlessi, I.; Akbari, H. A surface heat island study of Athens using high resolution satellite imagery and measurements of the optical and thermal properties of commonly used building and paving materials. Int. J. Sustain. Energy 2009, 28, 59–76. [Google Scholar] [CrossRef]
  14. Tam, B.Y.; Gough, W.A.; Mohsin, T. The impact of urbanization and the urban heat island effect on day to day temperature variation. Urban Clim. 2015, 12, 1–10. [Google Scholar] [CrossRef]
  15. Lehoczky, A.; Sobrino, J.A.; Skoković, D.; Aguilar, E. The Urban Heat Island Effect in the City of Valencia: A Case Study for Hot Summer Days. Urban Sci. 2017, 1, 9. [Google Scholar] [CrossRef]
  16. De Ridder, K.; Maiheu, B.; Lauwaet, D.; Daglis, I.A.; Keramitsoglou, I.; Kourtidis, K.; Manunta, P.; Paganini, M. Urban Heat Island Intensification during Hot Spells—The Case of Paris during the Summer of 2003. Urban Sci. 2017, 1, 3. [Google Scholar] [CrossRef]
  17. MacLachlan, A.; Biggs, E.; Roberts, G.; Boruff, B. Urbanisation-Induced Land Cover Temperature Dynamics for Sustainable Future Urban Heat Island Mitigation. Urban Sci. 2017, 1, 38. [Google Scholar] [CrossRef]
  18. Zhou, B.; Rybski, D.; Kropp, J.P. The role of city size and urban form in the surface urban heat island. Sci. Rep. 2017, 7, 4791. [Google Scholar] [CrossRef] [PubMed]
  19. Voogt, J.A.; Oke, T.R. Thermal remote sensing of urban climates. Remote Sens. Environ. 2003, 86, 370–384. [Google Scholar] [CrossRef]
  20. Taha, H. Urban climates and heat islands: Albedo, evapotranspiration, and anthropogenic heat. Energy Build. 1997, 25, 99–103. [Google Scholar] [CrossRef]
  21. Rosenfeld, A.H.; Akbari, H.; Bretz, S.; Fishman, B.L.; Kurn, D.M.; Sailor, D.; Taha, H. Mitigation of urban heat islands: Materials, utility programs, updates. Energy Build. 1995, 22, 255–265. [Google Scholar] [CrossRef]
  22. Santamouris, M. Regulating the damaged thermostat of the Cities—Status, Impacts and Mitigation Strategies. Energy Build. 2015, 91, 43–56. [Google Scholar] [CrossRef]
  23. Santamouris, M.; Cartalis, C.; Synnefa, A.; Kolokotsa, D. On The Impact of Urban Heat Island and Global Warming on the Power Demand and Electricity Consumption of Buildings—A Review. Energy Build. 2015, 98, 119–124. [Google Scholar] [CrossRef]
  24. Paravantis, J.; Santamouris, M.; Cartalis, C.; Efthymiou, C.; Kontoulis, N. Mortality Associated with High Ambient Temperatures, Heatwaves, and the Urban Heat Island in Athens, Greece. Sustainability 2017, 9, 606. [Google Scholar] [CrossRef]
  25. Heaviside, C.; Macintyre, H.; Vardoulakis, S. The Urban Heat Island: Implications for health in a changing environment. Curr. Environ. Health Rep. 2017, 4, 296–305. [Google Scholar] [CrossRef] [PubMed]
  26. Sismanidis, P.; Keramitsoglou, I.; Kiranoudis, C.T. Diurnal analysis of surface Urban Heat Island using spatially enhanced satellite derived LST data. In Proceedings of the Urban Remote Sensing Event (JURSE), 2015 Joint, Lausanne, Switzerland, 30 March–1 April 2015. [Google Scholar]
  27. Sobrino, J.A.; Oltra-Carrió, R.; Sòria, G.; Jiménez-Muñoz, J.C.; Franch, B.; Hidalgo, V.; Mattar, C.; Julian, Y.; Cuence, J.; Romaguera, M.; et al. Evaluation of the surface urban heat island effect in the city of Madrid by thermal remote sensing. Int. J. Remote Sens. 2013, 34, 3177–3192. [Google Scholar] [CrossRef]
  28. Abutaleb, K.; Ngie, A.; Darwish, A.; Ahmed, M.; Arafat, S.; Ahmed, F. Assessment of urban heat island using remotely sensed imagery over Greater Cairo, Egypt. Adv. Remote Sens. 2015, 4, 35. [Google Scholar] [CrossRef]
  29. Fabrizi, R.; Bonafoni, S.; Biondi, R. Satellite and ground-based sensors for the urban heat island analysis in the city of Rome. Remote Sens. 2010, 2, 1400–1415. [Google Scholar] [CrossRef]
  30. Lemonsu, A.; Grimmond, C.S.B.; Masson, V. Modeling the surface energy balance of the core of an old Mediterranean city: Marseille. J. Appl. Meteorol. 2004, 43, 312–327. [Google Scholar] [CrossRef]
  31. Srivastava, P.K.; Majumdar, T.J.; Bhattacharya, A.K. Surface temperature estimation in Singhbhum Shear Zone of India using Landsat-7 ETM+ thermal infrared data. Adv. Space Res. 2009, 43, 1563–1574. [Google Scholar] [CrossRef]
  32. Hereher, M.E. Time series trends of land surface temperatures in Egypt: A signal for global warming. Environ. Earth Sci. 2016, 75, 1218. [Google Scholar] [CrossRef]
  33. Kalnay, E.; Cai, M. Impact of urbanization and land-use change on climate. Nature 2003, 423, 528–531. [Google Scholar] [CrossRef] [PubMed]
  34. Landsberg, H.E. The Urban Climate, 1st ed.; Academic Press: Cambridge, MA, USA, 1981; ISBN 9780080924199. [Google Scholar]
  35. Sellers, P.J.; Hall, F.G.; Asrar, G.D.; Strebel, D.; Murphy, D. The first ISLSCP filed experiment (FIFE). Bull. Am. Meteorol. Soc. 1988, 69, 22–27. [Google Scholar] [CrossRef]
  36. Wan, Z. New refinements and validation of the MODIS Land-Surface Temperature/Emissivity products. Remote Sens. Environ. 2008, 112, 59–74. [Google Scholar] [CrossRef]
  37. Oku, Y.; Ishikawa, H.; Haginoya, S.; Ma, Y. Recent trends in land surface temperature on the Tibetan Plateau. J. Clim. 2006, 19, 2995–3003. [Google Scholar] [CrossRef]
  38. Arnfield, A.J. Two decades of urban climate research: A review of turbulence, exchanges of energy and water, and the urban heat island. Int. J. Climatol. 2003, 23, 1–26. [Google Scholar] [CrossRef]
  39. Roth, M.; Oke, T.R.; Emery, W.J. Satellite-derived urban heat islands from three coastal cities and the utility of such data in urban climatology. Int. J. Remote Sens. 1989, 10, 1699–1720. [Google Scholar] [CrossRef]
  40. Mallick, J.; Kant, Y.; Bharath, B.D. Estimation of land surface temperature over Delhi using Landsat–7 ETM+. J. Indian Geophys. Union 2008, 12, 131–140. [Google Scholar]
  41. Prata, A.J.; Caselles, V.; Coll, C.; Sobrino, J.A.; Ottlé, C. Thermal remote sensing of land surface temperature from satellites: Current status and future prospects. Remote Sens. Rev. 1995, 12, 175–224. [Google Scholar] [CrossRef]
  42. Keramitsoglou, I.; Kiranoudis, C.T.; Ceriola, G.; Weng, Q.; Rajasekar, U. Identification and analysis of urban surface temperature patterns in Greater Athens, Greece, using MODIS imagery. Remote Sens. Environ. 2011, 115, 3080–3090. [Google Scholar] [CrossRef]
  43. Chen, Y.C.; Chiu, H.W.; Su, Y.F.; Wu, Y.C.; Cheng, K.S. Does urbanization increase diurnal land surface temperature variation? Evidence and implications. Landsc. Urban Plan. 2017, 157, 247–258. [Google Scholar] [CrossRef]
  44. Heinl, M.; Hammerle, A.; Tappeiner, U.; Leitinger, G. Determinants of urban–rural land surface temperature differences–A landscape scale perspective. Landsc. Urban Plan. 2015, 134, 33–42. [Google Scholar] [CrossRef]
  45. Guo, G.; Wu, Z.; Xiao, R.; Chen, Y.; Liu, X.; Zhang, X. Impacts of urban biophysical composition on land surface temperature in urban heat island clusters. Landsc. Urban Plan. 2015, 135, 1–10. [Google Scholar] [CrossRef]
  46. Chrysoulakis, N.; Marconcini, M.; Sazonova, A.; Tal, A.; Dusgun, S.; Parlow, E.; Charalampopoulou, V.; Mitraka, Z.; Esch, T.; Cavur, M.; et al. Copernicus Sentinels for Urban Planning in Russia: The SEN4RUS Project. In Proceedings of the Conference Mapping Urban Areas from Space, Frascati, Italy, 4–5 November 2015. [Google Scholar]
  47. Santana, M.V.; Zhang, Q.; Nachabe, M.H.; Xie, X.; Mihelcic, J.R. Could smart growth lower the operational energy of water supply? A scenario analysis in Tampa, Florida, USA. Landsc. Urban Plan. 2017, 164, 99–108. [Google Scholar] [CrossRef]
  48. Polydoros, A.; Cartalis, C. Assessing thermal risk in urban areas–an application for the urban agglomeration of Athens. Adv. Build. Energy Res. 2014, 8, 74–83. [Google Scholar] [CrossRef]
  49. Stathopoulou, M.; Cartalis, C. Downscaling AVHRR land surface temperatures for improved surface urban heat island intensity estimation. Remote Sens. Environ. 2009, 113, 2592–2605. [Google Scholar] [CrossRef]
  50. Streutker, D.R. A remote sensing study of the urban heat island of Houston, Texas. Int. J. Remote Sens. 2002, 23, 2595–2608. [Google Scholar] [CrossRef]
  51. Stathopoulou, M.; Cartalis, C.; Keramitsoglou, I. Mapping micro-urban heat islands using NOAA/AVHRR images and CORINE Land Cover: An application to coastal cities of Greece. Int. J. Remote Sens. 2004, 25, 2301–2316. [Google Scholar] [CrossRef]
  52. Tomlinson, C.J.; Chapman, L.; Thornes, J.E.; Baker, C.J. Derivation of Birmingham’s summer surface urban heat island from MODIS satellite images. Int. J. Climatol. 2012, 32, 214–224. [Google Scholar] [CrossRef]
  53. Tran, H.; Uchihama, D.; Ochi, S.; Yasuoka, Y. Assessment with satellite data of the urban heat island effects in Asian mega cities. Int. J. Appl. Earth Observ. 2006, 8, 34–48. [Google Scholar] [CrossRef]
  54. Cheval, S.; Dumitrescu, A. The July urban heat island of Bucharest as derived from MODIS images. Theor. Appl. Climatol. 2009, 96, 145–153. [Google Scholar] [CrossRef]
  55. Peng, S.; Piao, S.; Ciais, P.; Friedlingstein, P.; Ottle, C.; Bréon, F.M.; Nan, H.; Zhou, L.; Myneni, R.B. Surface urban heat island across 419 global big cities. Environ. Sci. Technol. 2011, 46, 696–703. [Google Scholar] [CrossRef] [PubMed]
  56. Stathopoulou, M.; Cartalis, C. Daytime urban heat islands from Landsat ETM+ and Corine land cover data: An application to major cities in Greece. Sol. Energy 2007, 81, 358–368. [Google Scholar] [CrossRef]
  57. Rajasekar, U.; Weng, Q. Spatio-temporal modelling and analysis of urban heat islands by using Landsat TM and ETM+ imagery. Int. J. Remote Sens. 2009, 30, 3531–3548. [Google Scholar] [CrossRef]
  58. Klok, L.; Zwart, S.; Verhagen, H.; Mauri, E. The surface heat island of Rotterdam and its relationship with urban surface characteristics. Resour. Conserv. Recycl. 2012, 64, 23–29. [Google Scholar] [CrossRef]
  59. Nichol, J. Remote sensing of urban heat islands by day and night. Photogramm. Eng. Remote Sens. 2005, 71, 613–621. [Google Scholar] [CrossRef]
  60. Tsou, J.; Zhuang, J.; Li, Y.; Zhang, Y. Urban Heat Island Assessment Using the Landsat 8 Data: A Case Study in Shenzhen and Hong Kong. Urban Sci. 2017, 1, 10. [Google Scholar] [CrossRef]
  61. Zhang, Y.; Murray, A.T.; Turner, B.L. Optimizing green space locations to reduce daytime and nighttime urban heat island effects in Phoenix, Arizona. Landsc. Urban Plan. 2017, 165, 162–171. [Google Scholar] [CrossRef]
  62. Liu, L.; Zhang, Y. Urban Heat Island Analysis Using the Landsat TM Data and ASTER Data: A Case Study in Hong Kong. Remote Sens. 2011, 3, 1535–1552. [Google Scholar] [CrossRef]
  63. Benas, N.; Chrysoulakis, N.; Cartalis, C. Trends of urban surface temperature and heat island characteristics in the Mediterranean. Theor. Appl. Climatol. 2017, 130, 807–816. [Google Scholar] [CrossRef]
  64. Frey, C.M.; Kuenzer, C. Analysing a 13 Years MODIS Land Surface Temperature Time Series in the Mekong Basin. In Remote Sensing Time Series. Remote Sensing and Digital Image Processing, vol 22; Kuenzer, C., Dech, S., Wagner, W., Eds.; Springer: Cham, Switzerland, 2015; pp. 119–140. ISBN 978-3-319-15967-6. [Google Scholar]
  65. Sobrino, J.A.; Julien, Y. Trend analysis of global MODIS-Terra vegetation indices and land surface temperature between 2000 and 2011. IEEE J. Sel. Top. Appl. 2013, 6, 2139–2145. [Google Scholar] [CrossRef]
  66. Jin, M.; Dickinson, R.E. Land surface skin temperature climatology: Benefitting from the strengths of satellite observations. Environ. Res. Lett. 2010, 5. [Google Scholar] [CrossRef]
  67. Tian, F.; Qiu, G.Y.; Yang, Y.H.; Xiong, Y.J.; Wang, P. Studies on the relationships between land surface temperature and environmental factors in an inland river catchment based on geographically weighted regression and MODIS data. IEEE J. Sel. Top. Appl. 2012, 5, 687–698. [Google Scholar] [CrossRef]
  68. Eleftheriou, D.; Kiachidis, K.; Kalmintzis, G.; Kalea, A.; Bantasis, C.; Koumadoraki, P.; Spathara, M.E.; Tsolaki, A.; Tzampazidou, M.I.; Gemitzi, A. Determination of annual and seasonal daytime and nighttime trends of MODIS LST over Greece-climate change implications. Sci. Total Environ. 2017. [Google Scholar] [CrossRef] [PubMed]
  69. Yao, R.; Wang, L.; Gui, X.; Zheng, Y.; Zhang, H.; Huang, X. Urbanization Effects on Vegetation and Surface Urban Heat Islands in China’s Yangtze River Basin. Remote Sens. 2017, 9, 540. [Google Scholar] [CrossRef]
  70. Wan, Z. MODIS Land Surface Temperature Products Users’ Guide. Available online: http://www.icess.ucsb.edu/modis/LstUsrGuide/MODIS_LST_products_Users_guide_C5.pdf (accessed on 18 December 2017).
  71. Frey, C.M.; Kuenzer, C.; Dech, S. Quantitative comparison of the operational NOAA-AVHRR LST product of DLR and the MODIS LST product V005. Int. J. Remote Sens. 2012, 33, 7165–7183. [Google Scholar] [CrossRef]
  72. Potere, D.; Schneider, A.; Angel, S.; Civco, D.L. Mapping urban areas on a global scale: Which of the eight maps now available is more accurate? Int. J. Remote Sens. 2009, 30, 6531–6558. [Google Scholar] [CrossRef]
  73. Zhou, W.; Huang, G.; Cadenasso, M.L. Does spatial configuration matter? Understanding the effects of land cover pattern on land surface temperature in urban landscapes. Landsc. Urban Plan. 2011, 102, 54–63. [Google Scholar] [CrossRef]
  74. Liu, Y.; Peng, J.; Wang, Y. Diversification of Land Surface Temperature Change under Urban Landscape Renewal: A Case Study in the Main City of Shenzhen, China. Remote Sens. 2017, 9, 919. [Google Scholar] [CrossRef]
  75. Peng, J.; Xie, P.; Liu, Y.; Ma, J. Urban thermal environment dynamics and associated landscape pattern factors: A case study in the Beijing metropolitan region. Remote Sens. Environ. 2016, 173, 145–155. [Google Scholar] [CrossRef]
  76. Fu, P.; Weng, Q. A time series analysis of urbanization induced land use and land cover change and its impact on land surface temperature with Landsat imagery. Remote Sens. Environ. 2016, 175, 205–214. [Google Scholar] [CrossRef]
  77. Chen, X.L.; Zhao, H.M.; Li, P.X.; Yin, Z.Y. Remote sensing image-based analysis of the relationship between urban heat island and land use/cover changes. Remote Sens. Environ. 2006, 104, 133–146. [Google Scholar] [CrossRef]
  78. Ibrahim, F.; Rasul, G. Urban Land Use Land Cover Changes and Their Effect on Land Surface Temperature: Case Study Using Dohuk City in the Kurdistan Region of Iraq. Climate 2017, 5, 13. [Google Scholar] [CrossRef]
Figure 1. The Mediterranean Sea and the location of the five selected cities.
Urbansci 02 00016 g001
Figure 2. Land cover maps depicting the urban and suburban areas of each study area: (a) Athens, (b) Marseille, (c) Barcelona, (d) Rome and (e) Cairo.
Urbansci 02 00016 g002aUrbansci 02 00016 g002b
Figure 3. Daytime Land Surface Temperature (LST) trends of the urban pixels of Athens. The solid line indicates the boundary of the urban district, the circle indicates the urban core of the city and the point indicates the pixel selected for time series analysis. (gray: outside study area and non-urban pixels, white: sea).
Urbansci 02 00016 g003
Figure 4. Nighttime LST trends of the urban pixels of Athens. The solid line indicates the boundary of the urban district, the circle indicates the urban core of the city and the point indicates the pixel selected for time series analysis. (gray: outside study area and non-urban pixels, white: sea).
Urbansci 02 00016 g004
Figure 5. LST trend values of the urban pixels of (a) Marseille daytime; (b) Marseille nighttime; (c) Barcelona daytime; (d) Barcelona nighttime; (e) Rome daytime; (f) Rome nighttime; (g) Cairo daytime and (h) Cairo nighttime The solid line indicates the boundary of the urban district, the circle indicates the urban core of the city and the point indicates the pixel selected for time series analysis. (gray: outside study area and non-urban pixels, white: sea).
Urbansci 02 00016 g005
Figure 6. Time series of daytime and nighttime LSTs. The LSTs correspond to one selected pixel per city that it is located at the urban core and exhibits high positive LST trend as it can be seen in Figure 3 and Figure 5.
Urbansci 02 00016 g006
Figure 7. Significant and non-significant urban pixels of (a) Athens daytime, (b) Athens nighttime, (c) Barcelona daytime, (d) Barcelona nighttime, (e) Rome daytime, (f) Rome nighttime, (g) Cairo daytime and (h) Cairo nighttime. The solid line indicates the boundary of the urban district, the circle indicates the urban core of the city and the point indicates the pixel selected for time series analysis. (gray: outside study area and non-urban pixels, white: sea).
Urbansci 02 00016 g007
Figure 8. LST trend values (in °K) of the urban pixels of Athens (Daytime).
Urbansci 02 00016 g008
Figure 9. LST trend values (in °K) of the non-urban pixels of Athens (Daytime).
Urbansci 02 00016 g009
Figure 10. LST trend values (in °K) of the urban pixels of Athens (Nighttime).
Urbansci 02 00016 g010
Figure 11. LST trend values (in °K) of the non-urban pixels of Athens (Nighttime).
Urbansci 02 00016 g011
Table 1. Selected cities and their characteristics.
Population (m.)Metropolitan Area (km2)
Athens31130
Rome4.35352
Marseille1.83173
Barcelona5.354206
Cairo20.51709
Table 2. Average urban, non-urban LST and Surface Urban Heat Island (SUHI) trend values in Kelvin and standard deviations in parenthesis.
DaytimeNighttime
UrbanNon-urbanSUHIUrbanNon-urbanSUHI
Athens0.167
(0.489)
−0.046
(0.550)
0.213
(0.736)
0.521
(0.193)
0.536
(0.204)
−0.015
(0.281)
Rome−0.421
(0.530)
−0.753
(0.493)
0.332
(0.724)
0.723
(0.170)
0.672
(0.232)
0.051
(0.287)
Marseille−0.149
(0.480)
−1.154
(0.613)
0.605
(0.778)
0.412
(0.169)
0.418
(0.168)
−0.006
(0.238)
Barcelona−0.404
(0.557)
−0.711
(0.590)
0.307
(0.811)
0.459
(0.233)
0.435
(0.237)
0.024
(0.332)
Cairo−0.034
(0.558)
0.262
(0.857)
−0.296
(1.02)
0.923
(0.360)
1.032
(0.395)
−0.109
(0.534)

