A Method for Mapping Future Urbanization in the United States
by
Lahouari Bounoua
1,*, 
Joseph Nigro
1,2,*,
Kurtis Thome
1,
Ping Zhang
1,2,
Najlaa Fathi
3 and
Asia Lachir
3,4 1
Biospheric Sciences Laboratory, NASA GSFC, Greenbelt, MD 20771, USA
2
Science Systems and Applications, Inc., Lanham, MD 20706, USA
3
Department of Environmental Sciences, Faculty of Sciences Semlalia, Cadi Ayyad University, Marrakesh 40000, Morocco
4
Engineering School, Mundiapolis University, Nouaceur 20180, Casablanca, Morocco
*
Authors to whom correspondence should be addressed.
Urban Sci. 2018, 2(2), 40; https://0-doi-org.brum.beds.ac.uk/10.3390/urbansci2020040
Submission received: 23 March 2018
/
Revised: 19 April 2018
/
Accepted: 19 April 2018
/
Published: 24 April 2018
(This article belongs to the Special Issue Urban Futures—Landscape)
Abstract
:Cities are poised to absorb additional people. Their sustainability, or ability to accommodate a population increase without depleting resources or compromising future growth, depends on whether they harness the efficiency gains from urban land management. Population is often projected as a bulk national number without details about spatial distribution. We use Landsat and population data in a methodology to project and map U.S. urbanization for the year 2020 and document its spatial pattern. This methodology is important to spatially disaggregate projected population and assist land managers to monitor land use, assess infrastructure and distribute resources. We found the U.S. west coast urban areas to have the fastest population growth with relatively small land consumption resulting in future decrease in per capita land use. Except for Miami (FL), most other U.S. large urban areas, especially in the Midwest, are growing spatially faster than their population and inadvertently consuming land needed for ecosystem services. In large cities, such as New York, Chicago, Houston and Miami, land development is expected more in suburban zones than urban cores. In contrast, in Los Angeles land development within the city core is greater than in its suburbs.
1. Introduction
The United States is one of the world’s most urbanized countries with just over 80% of its total population living in urban dwellings as of 2010 [1]. However, since 2010, the urban population has increased by about 500% while the rural population increased only 19% [2]. With urbanization expected to increase over the coming decades, this could translate into a significant change in land use including conversion of forest, farm, and other lands for housing, transportation, and commercial buildings.
The process of urbanization is often associated with socioeconomic development and poverty reduction [3,4]. However, it is also associated with important, irreversible biophysical change in land use that drives the loss of farmlands and other terrestrial carbon pools [5], threatens biodiversity [6,7], affects hydrological systems [8,9] and alters local and regional climate [10,11,12].
A recent study indicates that, ca. 2001, urbanization in the continental United States (CONUS), occupied only 1.1% of the total land area but had significant impacts on surface climate including water, energy and the carbon cycles [9]. It showed that the impact of impervious surface area (ISA) associated with urbanization has added an average annual warming of 1.1 °C with 1.9 °C of it occurring between June and August. The study also revealed that across much of the moderate-to-high density ISA, more than 35% of the incoming precipitation is expelled as surface runoff, compared to less than 15% over vegetated lands, leading to higher flash-flooding risk in urbanized areas. In addition to biophysical impacts, urbanization also tends to increase the quantity and types of products that humans produce, use, and discard, thereby affecting waste generation and management, water quality, and chemical production and use. As such, it is important to develop methodologies to project urban expansion in order to address the numerous complex urban-related environmental problems and to assist in sustainable development of urban areas [13].
Although census data have been a traditional source for creating urban maps, spatially explicit urban mapping is increasingly using remote sensing data, especially over large areas such as the CONUS [14,15,16,17]. Several urban growth projection models exist. These models vary widely regarding their methodologies, theoretical assumptions and complexity. For example, the agent-based models present a number of opportunities and challenges but are mainly directed to real estate development. Other models use cellular automata and Markov chains to project the location and quantity of urban and other land cover types in expanding areas [18]. These models, such as SLEUTH, require several inputs including Slope, Land Use/Cover, Excluded layers, Urban areas, Transportation and Hillshading, hence the name. Several reviews are available on the subject [19,20,21]. They show that the prevailing modeling techniques often include numerous biophysical, political and socioeconomic factors to capture the spatiotemporal complexity of urban growth. However, data availability is considered a strong restraining factor, limiting the large scale applicability of these methods.
In the U.S., population is projected by the Census Bureau as a bulk country-level number including urban and rural populations, but little information is available about its spatial distribution or its rates of urban versus rural expansion. Individual states sometimes produce and report their own projections, which often are inconsistent in format and time-horizons, and do not normally go beyond the state or county level.
In this paper, our objective is to develop a methodology to project and spatially map future urbanization expansion over the CONUS from a single projected national population value, using the year 2020 as an example, and assess its spatial pattern based on past urban growth information.
2. Materials and Methods
In this paper, the build-up is characterized by the National Land Cover Dataset (NLCD) impervious surface area (ISA). This is a 30 m Landsat-based product, developed by the Multi-Resolution Land Characteristics Consortium (MRLC) and represents the percent impervious area within each pixel [22,23]. The NLCD ISA data used in this study is from 2001 to 2011. We also use the Center for International Earth Science Information Network (CIESIN) 2.5 arc-minute (~5 km) Gridded Population consisting of population count estimates derived from national and sub-national administrative units [24]. The U.S. Census Bureau 2020 National Population Projection is a single numeric value that takes into account future births, deaths, and net international migration rates [25]. The data for U.S. Urban Areas [26], Places [27], and State Boundaries [28] are all in vector polygon format and are used for calculating zonal statistics for the gridded population and ISA data. The bulk of the datasets that served this study are listed in Table 1.
The gridded datasets were processed and co-registered to the same common 0.05 degrees (~5 km) Climate Modeling Grid (CMG) over the CONUS. The CMG spatial resolution was chosen to correspond to available North American Land Data Assimilation System (NLDAS-2) hourly climate drivers, and to facilitate future modeling studies [12].
2.1. Population
The U.S. Census data shows that the U.S. population is projected to grow to an aggregate 334,503,458 persons by 2020 [25]. While this indicator captures the overall trend of the U.S. population growth including urban and rural districts, it does not inform about its spatial distribution nor does it discriminate between urban and rural growth. Our analysis disaggregates this single-value indicator to extract useful information as far as the city-scale. A 2020 CMG-scale population dataset was created, along with state-wide population summaries, based on the Census Bureau 2020 National Population Projection of 334,503,458 persons (inclusive of Alaska and Hawaii) [25]. First, for the years 2010 and 2015, gridded CIESEN population were aggregated to the state level and fractions of the population of each state to the total population were obtained and compared between the two years. Except for California, Florida and Texas which showed a slight increase in the fractions in 2015, most of the states including the District of Columbia (D.C.) experienced no significant change in their fractions. After adjustment of projected populations for Alaska and Hawaii (0.63% of the total), the remaining 2020 CONUS population (332,396,086) was redistributed over the conterminous states (including D.C.) based on their 2015 fractions, representative of the most recent state population distribution. These states’ results were further disaggregated to CMGs based on the 2015 fraction of each CMG population to the state’s population to which it belongs. The disaggregation process introduced minor discrepancies, due mostly to rounding errors and to northern and southern country border issues, resulting in a loss of 0.1% of the population, an average of 1 person per CMG for the contiguous states including D.C. The resultant state-wide breakdown is shown in Section 3.
2.2. Land Use
We use a realistic algorithm that enables us to produce a plausible future Land Use (LU) map based on decadal population and ISA change implicitly taking regional specificities into account. Using the 2001 [29] and the 2011 gridded population and ISA maps, we compute a spatially explicit decadal rate of change of ISA per capita at the CMG level. Then, using the gridded 2020 population, described in Section 2.1, along with the decadal rate of change of ISA per capita, it is possible to estimate the size of ISA for each CMG for 2020. This algorithm assumes a linear relationship between population growth and ISA over the short 10-year period and takes into account an implicit regional specificity. The linearity of the algorithm is not granted, however a post algorithm analysis of the results showed only 1 CMG out of 500,000+ resulted in an ISA greater than unity. We considered a business as usual scenario in which impervious surface can, with an equal probability distribution, occupy any land cover type other than water. Thus a CMG increase or decrease in ISA was equally distributed over all other land cover types co-existing in the CMG. The relationship is spatially explicit and thus implicitly includes non-linearity aspects of the cultural and geographical heritage of each urban area of the CONUS, since different regions have different land use patterns. This approach does not pretend to predict the details of future land use but rather provides a first order spatially-explicit gridded increase in ISA at the horizon 2020. The determination of impervious surface growth using similar methodologies has been used in the past and has provided reasonable results [30].
2.3. Geographic Location Statistics
The datasets produced were investigated at local, state, and continental scales in order to gain better insights into the future of population growth and land urbanization and its regional variation within the CONUS. Local- and state-scale zonal statistics were computed in ArcGIS using the Urban Areas 1:500k shapefile [26] agglomerates along with the U.S. Census Bureau MAF/TIGER 1:500k Cartographic Boundary Shapefiles—Places (Incorporated Places and Census Designated Places) [27] and the standard ESRI U.S. State Boundaries shapefile [28] respectively. All data zonal boundaries were converted to a ‘gridded’ vector representation to conform to the CMG borders. The final projection system for all raster data is Geographic WGS84 conforming to land surface models input requirements. While performing the zonal statistical analyses, the data were projected to USA Contiguous Albers Equal Area Conic with all pixels representing an equal area. All areas in following sections, unless otherwise noted, are referred to as urban areas for the agglomerates and cities for the places and are reported in hectares (1 ha = 104 m2).
3. Results and Discussion
3.1. Urban Area Scale
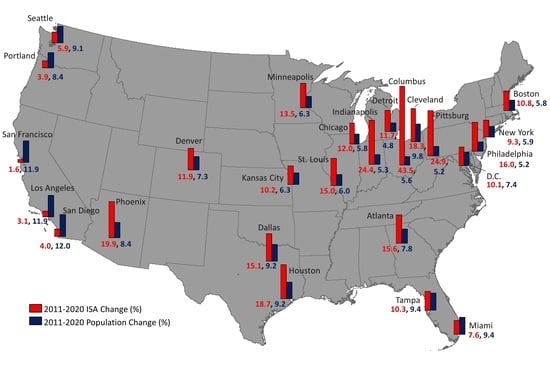
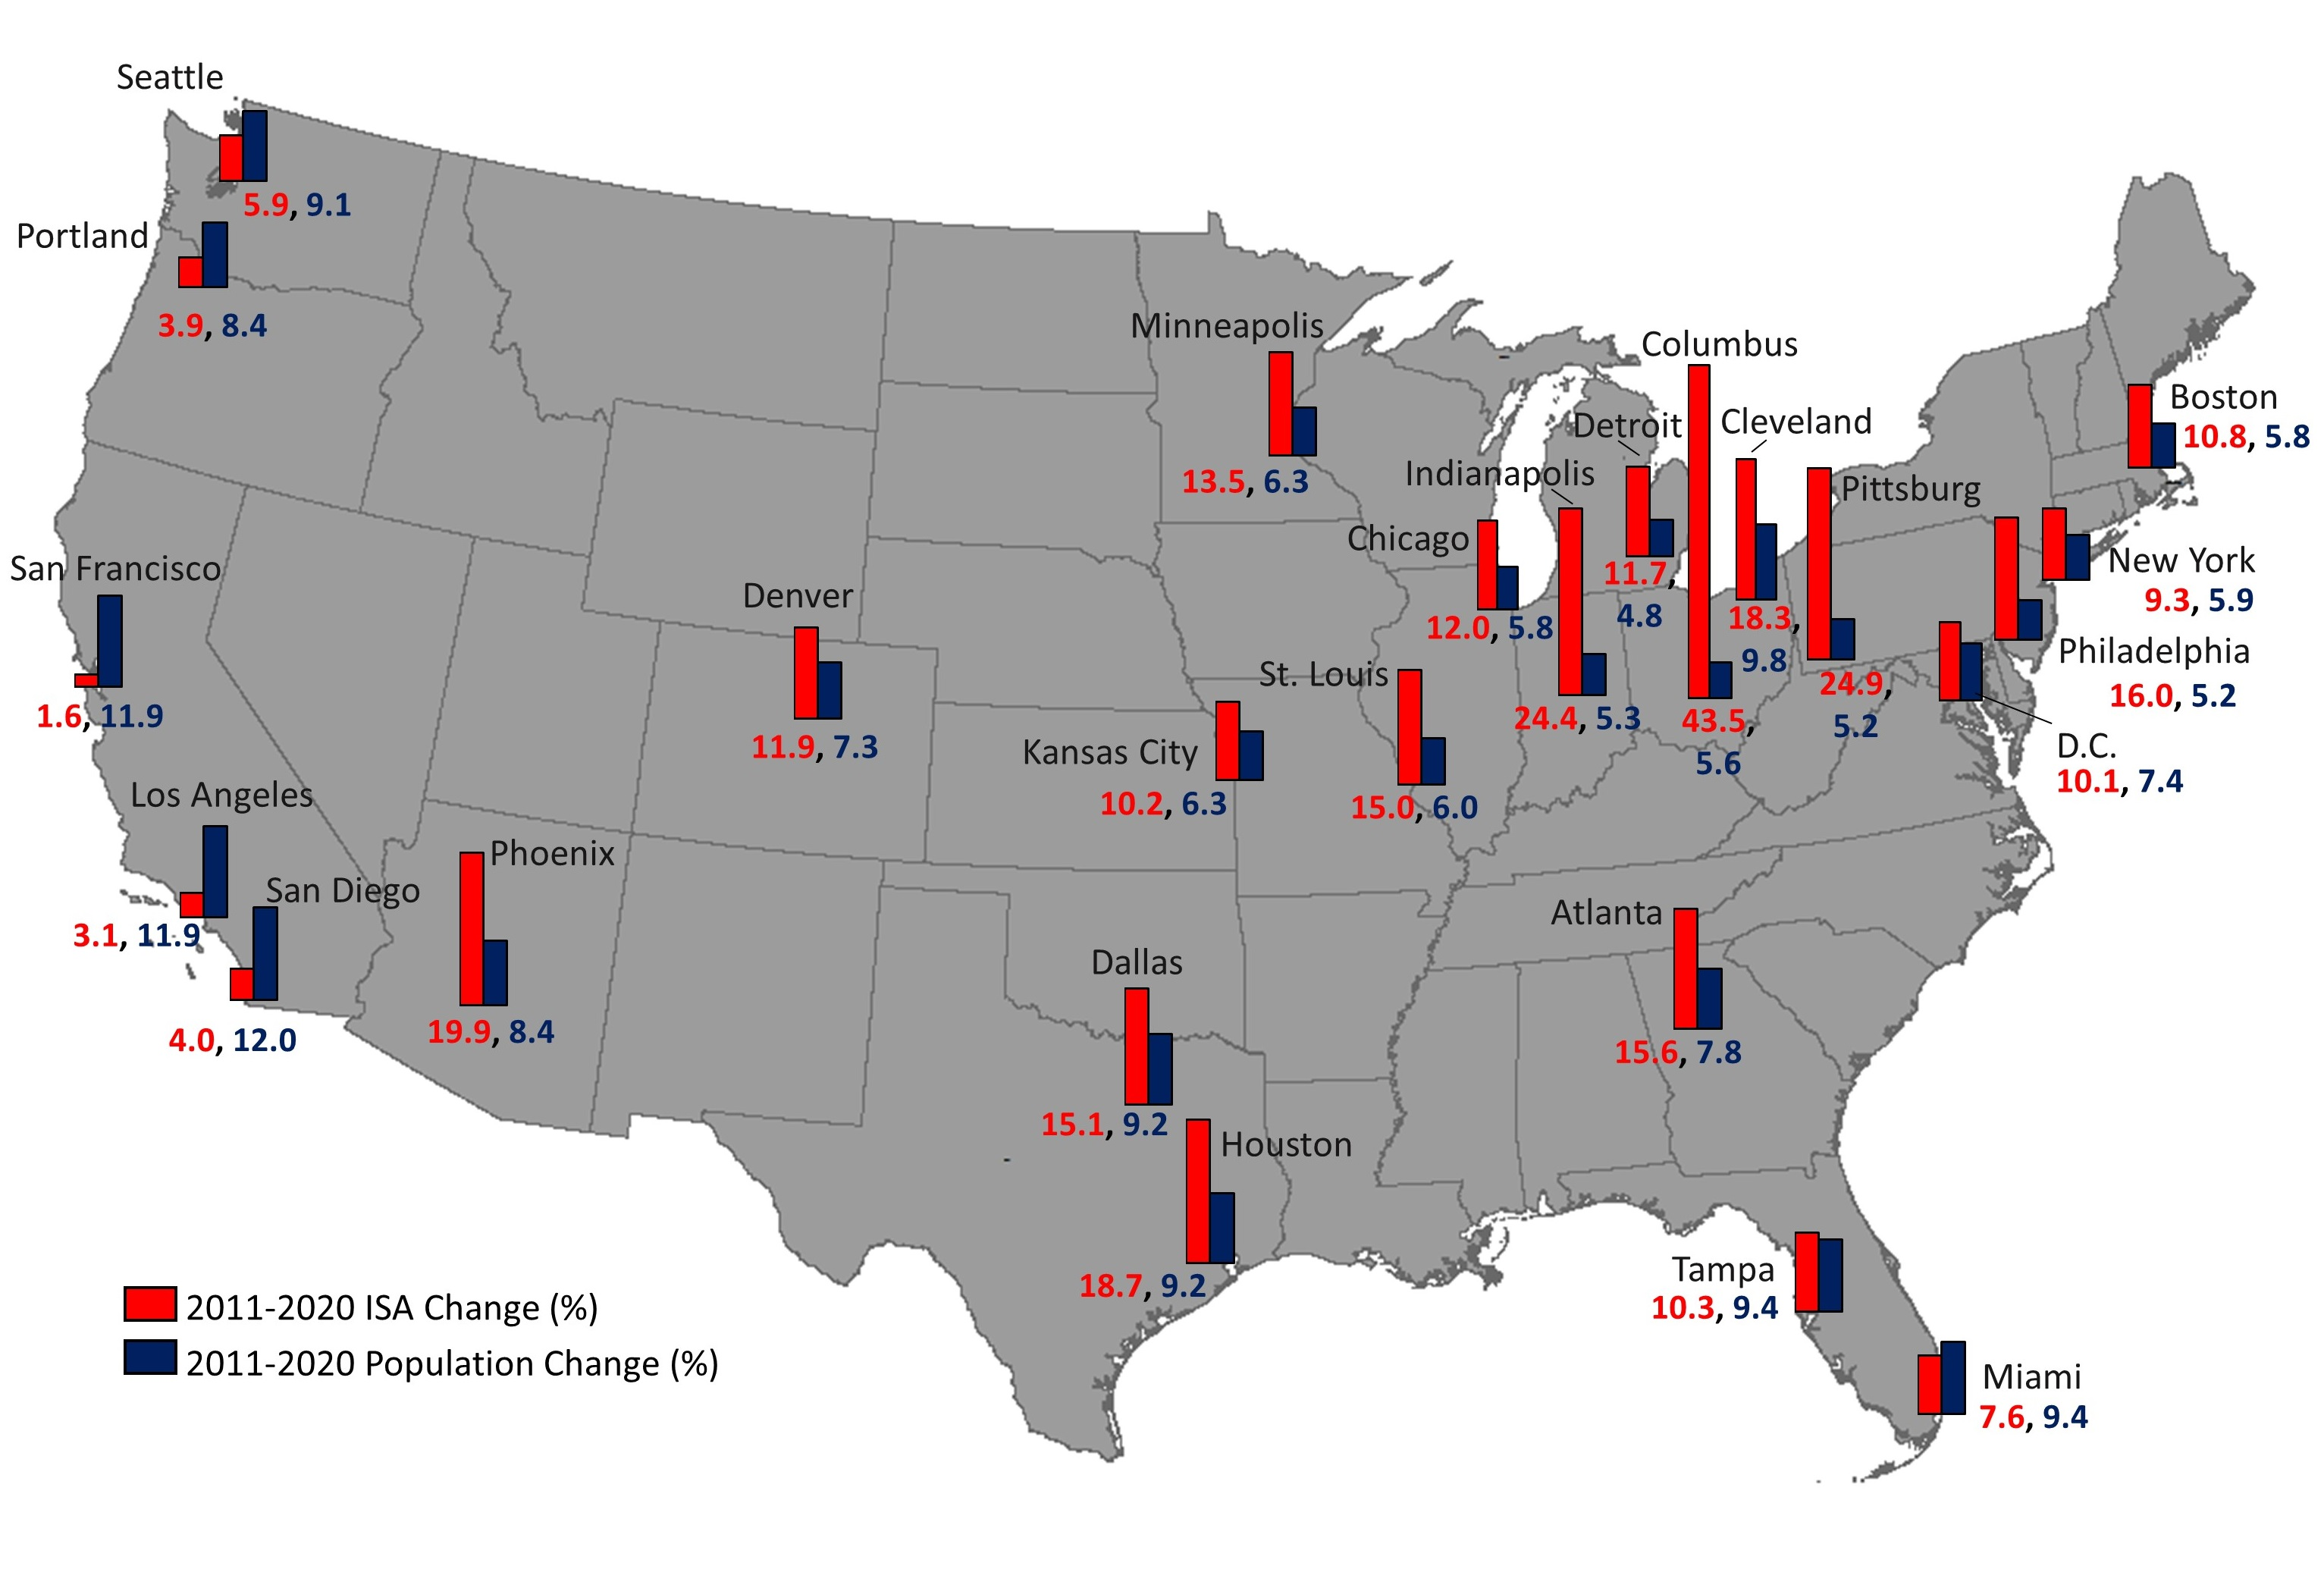
We explored 3257 urban areas that fall within the CONUS using the ESRI/U.S. Census Bureau 1:500k Urban Areas [26]. The 25 urban areas with the greatest amount of total ISA projected for 2020 along with associated population statistics were extracted and analyzed (Table 2). Results indicate that the New York, Los Angeles, and Chicago urban areas have been the three most populous urban areas since 2001 [31] and are projected to maintain these positions into 2020. There are substantial variations in population and land development trends in different parts of the U.S. The top three urban areas projected to have the fastest increase in 2020 population relative to 2011 are all located in California’s coastal area and are San Diego, Los Angeles and San Francisco. In these urban areas, population is expected to grow much faster than land development. For example in San Diego (CA) a projected population growth of 12% is associated with an increase of only four percent in land development. The same trend prevails in Portland (OR) and Seattle (WA). Everywhere else in the CONUS, except for Miami (FL), urban area impervious surface has increased significantly faster than population. This is notably visible in the upper Midwest where, for example, Columbus’ (OH) population is expected to increase by 4.6% while the ISA is projected to increase 43.5%. Similarly Pittsburgh’s (PA) population is expected to increase by 4.6% while its land development could see as much as 24.9% expansion, and in Cleveland (OH), the areal footprint expansion of 18.3% is quadruple the population growth rate. The central south part of the CONUS also reveals an uneven impact of population on land consumption; both in Houston (TX) and Dallas (TX), land expansion much surpasses the population growth. This analysis reveals that urbanization in the U.S. appears to implicitly include a ‘cultural character’ whereby, depending on the region, urban areas are either expanding horizontally using large area development per capita, or becoming denser and possibly using vertical structures to minimize their spatial footprints.
This ‘cultural character’ is likely modulated by land availability, topography, coastlines, inland water and land use policy regulation. Previous studies [31] have shown that urban areas seem to progressively ‘adapt’ to their population growth and may down-size their per capita land use with increase in population over time. Here we show that, among the 25 largest urban agglomerates, all west coast urban areas and Miami are expected to further reduce their ISA per capita use going into 2020 (Figure 1).
3.2. City Scale
Using a geographically distributed subset of urban areas with the largest projected ISA for 2020, we explored urbanization dynamics in more detail based on the U.S. Census Bureau 1:500k Cartographic Places Boundary data to see how changes in the city itself, as defined by the “Incorporated/Census Designated Places”, compare to those in urban areas, reported in Figure 1 with ISA and populations estimated using the CMG-level values. Five cities: New York, Los Angeles, Houston, Miami, and Chicago have been selected based on their ISA size and their regional representativeness to show cities’ dynamic in the different regions of the CONUS.
3.2.1. New York City
In the Northeast, the New York urban area is expected to continue to be the most populous in 2020 as it was in 2011 [31]. With recent higher life expectancy and a net influx of residents, the city’s population increase is expected to continue into 2020 [32]. This projected growth is seen not only at the urban area agglomerate level, but also at the city-level where the population growth between 2011 and 2020 (453,269 persons) is almost double that between 2001 and 2011 (246,154 persons), while ISA is projected to almost triple, 2394 ha from 2011 to 2020 versus only 857 ha during the previous decade [31]. Although New York is projected to remain the largest U.S. city in 2020, the faster growth of its population over land development implies a steady decline in ISA per capita leading to an increase in population density and a more pressing need for vertical growth to accommodate for this dynamic (Table 3).
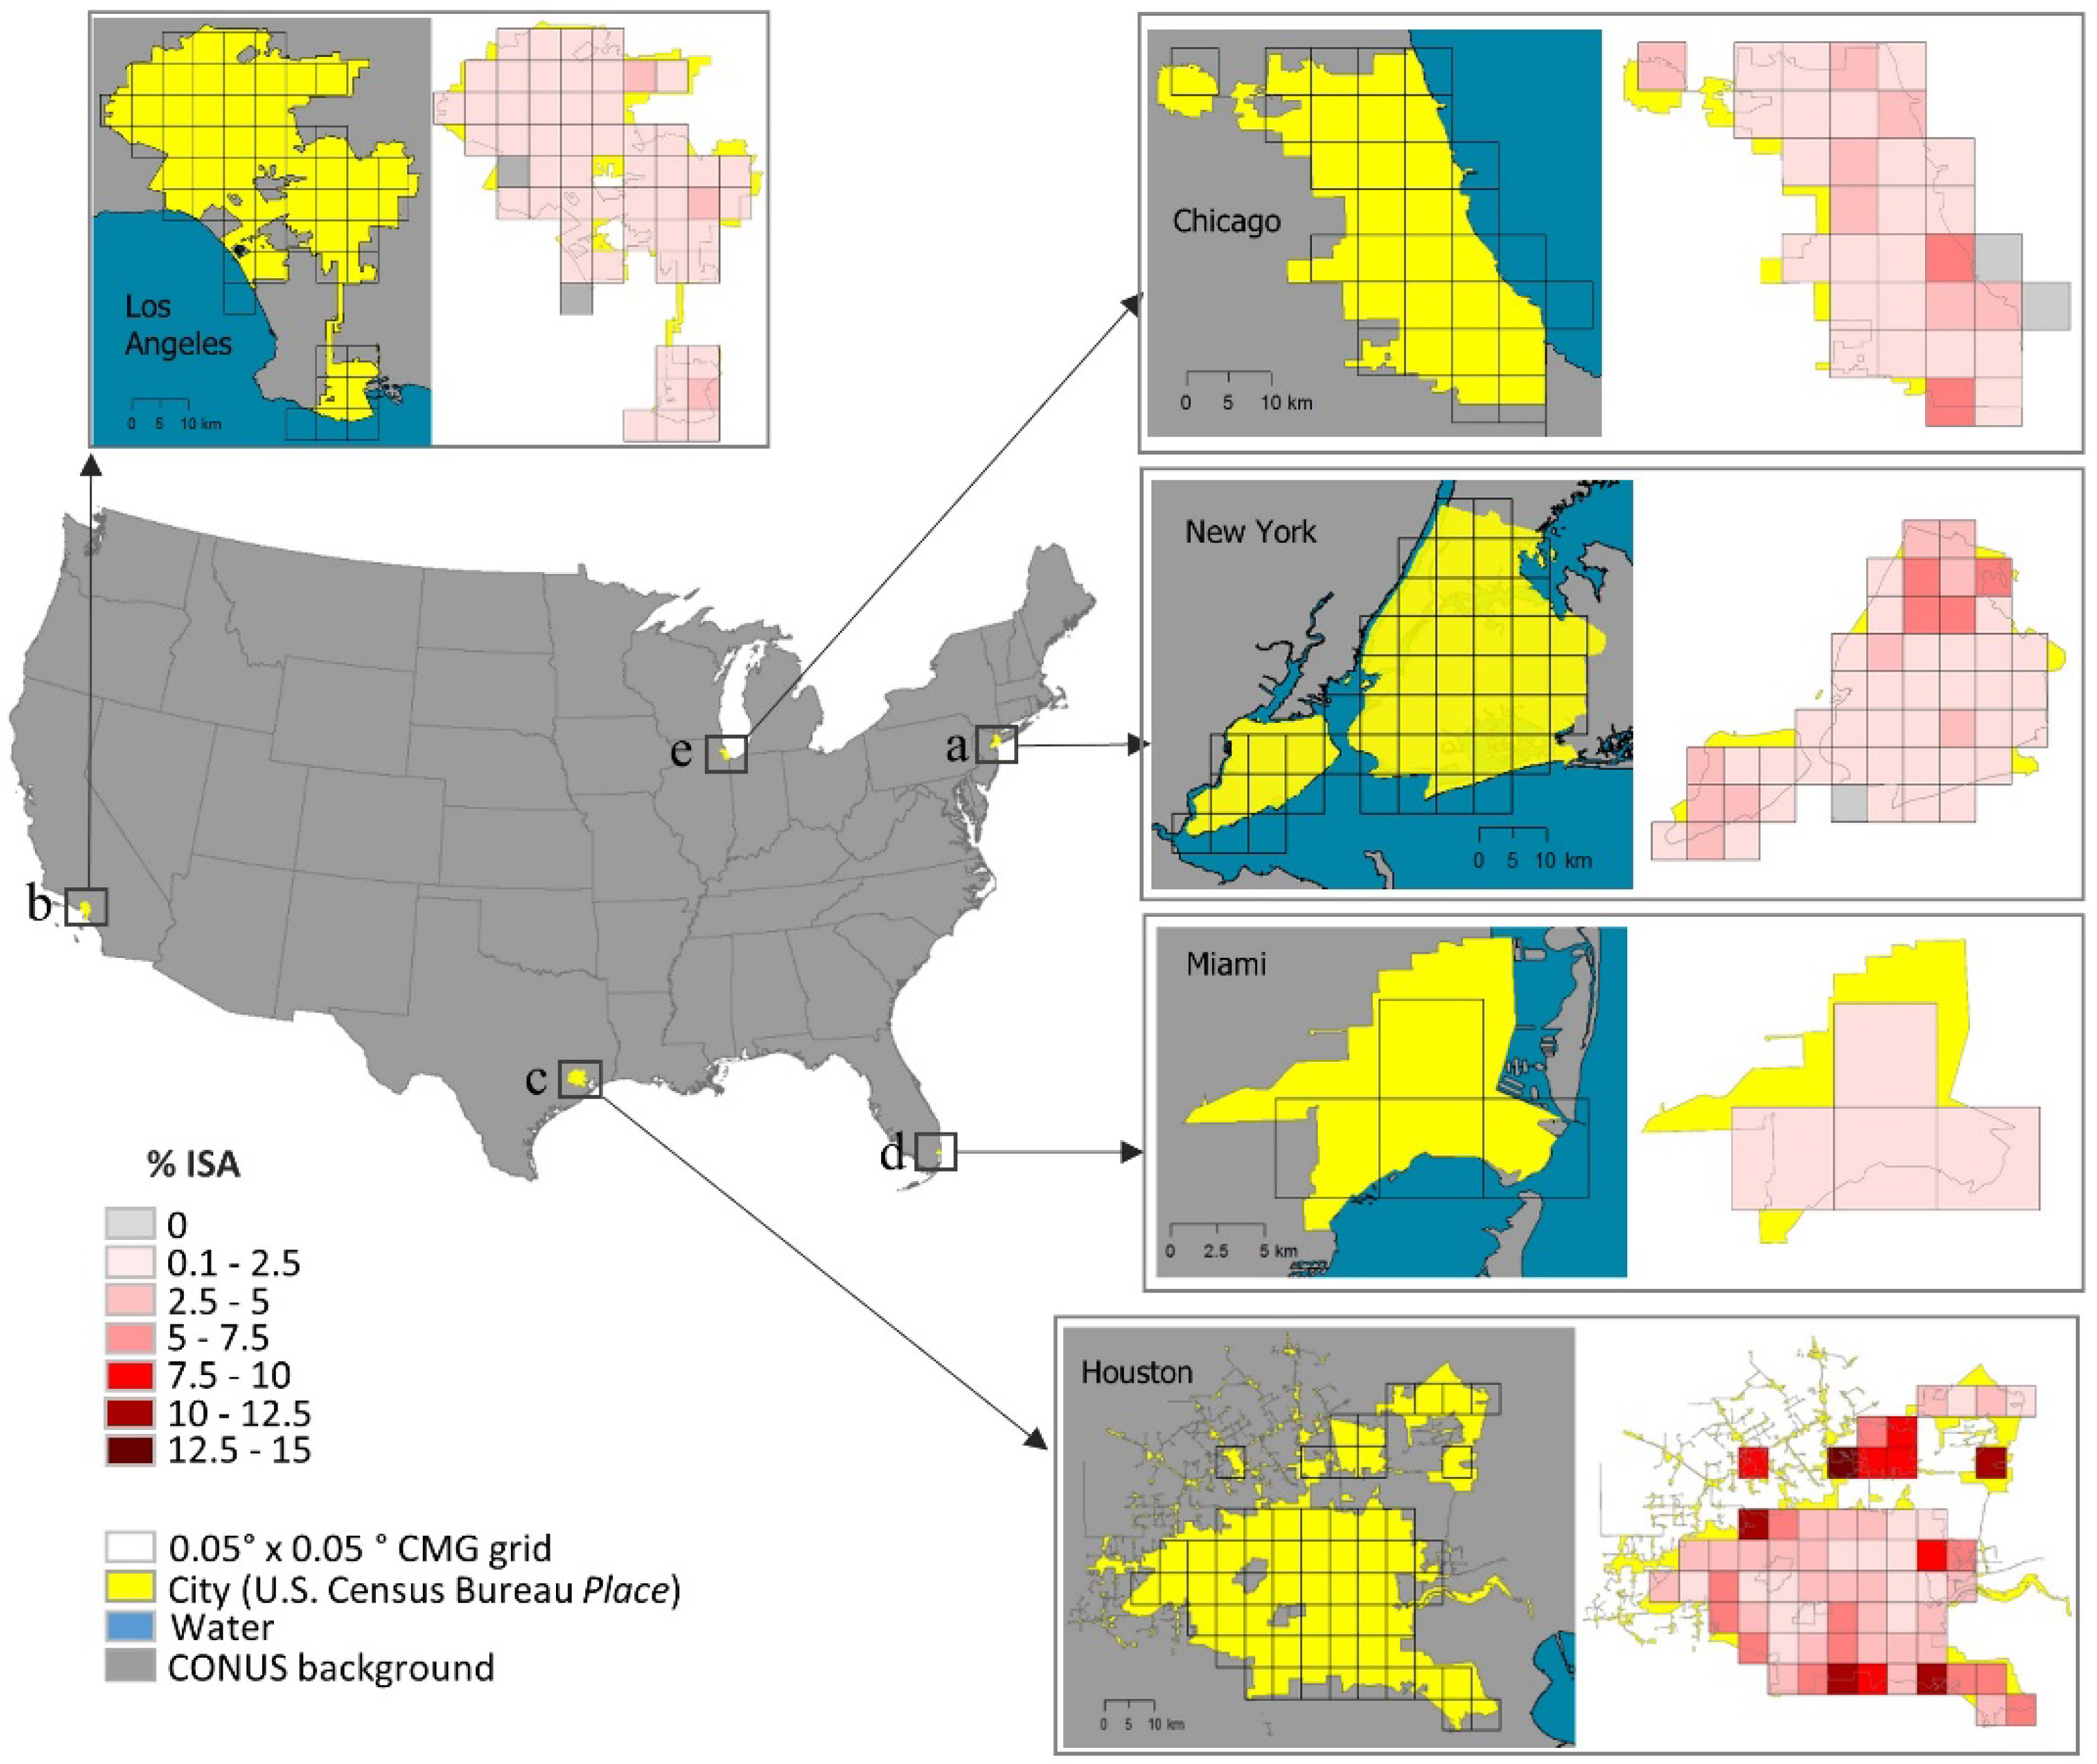
A notable difference between the New York urban area (Table 2) and the New York city (Table 3) can be seen in terms of population density. Further examination within the city limits reveals that the largest land development expected by 2020 will happen in the northern part of the city, the Bronx, and to a lesser extent in lower Staten Island. For the bulk of the city, increase in ISA will range between 0.1% and 2.5% (Figure 2a).
3.2.2. Los Angeles
In western regions of the CONUS, although the Los Angeles–Long Beach–Anaheim urban area is expected to be the second most populous urban area in 2020 after the New York urban area, it is expected to surpass it in terms of population density (Table 2). At city-scale (Figure 2b) in terms of ISA, Los Angeles ranked as #11 in 2001 [31] and is expected to move up to #9 in both 2011 and 2020. In Los Angeles, construction regulation [33] results in higher population density. This may be reflected in the reduction of population growth from 2011 to 2020 (546,490 persons) as opposed to 683,844 persons during the 2001–2011 decade [31], even though ISA growth seems to be of similar magnitude through time (Table 4).
3.2.3. Houston
In the southern regions, Houston (TX) was named the 2017 fastest-growing metro area by the U.S. Census Bureau, with a population increase of over 2000 people per week from 2010 to 2016, and is expected to replace Chicago as the third largest urban area in the country by 2025 [34]. Although the Houston urban area was the seventh most populous in 2011, up from the 10th position in 2001, it increased from the sixth to fourth position in terms of ISA size during the same period. The Houston urban area is projected to be the fourth largest in the CONUS by 2020 (Table 2). At local scale, the population of the city of Houston is expected to grow by 9.2% between 2011 and 2020, a relative decrease compared to the 13.8% growth during the 2001–2011 decade [31]. Correspondingly, the ISA change has also decreased from 11.6% to 11.0% between the two decades (Table 5). The ISA per capita use is projected to increase minimally by about 1.7%. Figure 2c shows change in ISA between 2001 and 2020 for the city of Houston. While there is no clear pattern as to how the city is expanding, there is a significant spatial variability ranging from 0.1% to as much as 15% in some districts.
3.2.4. Miami
In the southeast, the Miami urban area population is projected to grow 9.4% between 2011 and 2020 (Table 2), in line with the 9.4% for the city of Miami (Table 6). This is at odds with the fact that at the national level there is a slowing growth trend in core urban areas [35]. Unlike Houston, which is able to support urban sprawl in just about every direction, Miami is geographically constrained, leading to high population density and the possible continuation of vertical structures for residential properties in the downtown area [35]. This is reflected at the city level by a decrease in ISA per capita use of 5.9%. The overall increase in ISA in the city of Miami is expected to be about three percent and uniformly distributed over all districts (Figure 2d).
3.2.5. Chicago
In Chicago’s urban area, data reveals an expected population growth of 5.8% between 2011 and 2020 with an ISA increase of 12.0% (Table 2). There is a clear disconnect between changes in ISA and population; this is especially evident at city-scale where the ISA is expected to expand by 3.4% between 2011 and 2020 compared to only 1.3% during the 2001–2011 decade. However, the population growth is projected at 5.8% for 2020 while it has gone up by 4.6% during the 2001–2011 decade (Table 7). The spatial distribution of the ISA growth in the city of Chicago does not show any preferential district. Except for two districts where ISA is expected to increase up to 7.5%, in all others ISA expansion is projected to be less than 5.0% (Figure 2e).
3.2.6. Urban, Suburban and Rural Stratification
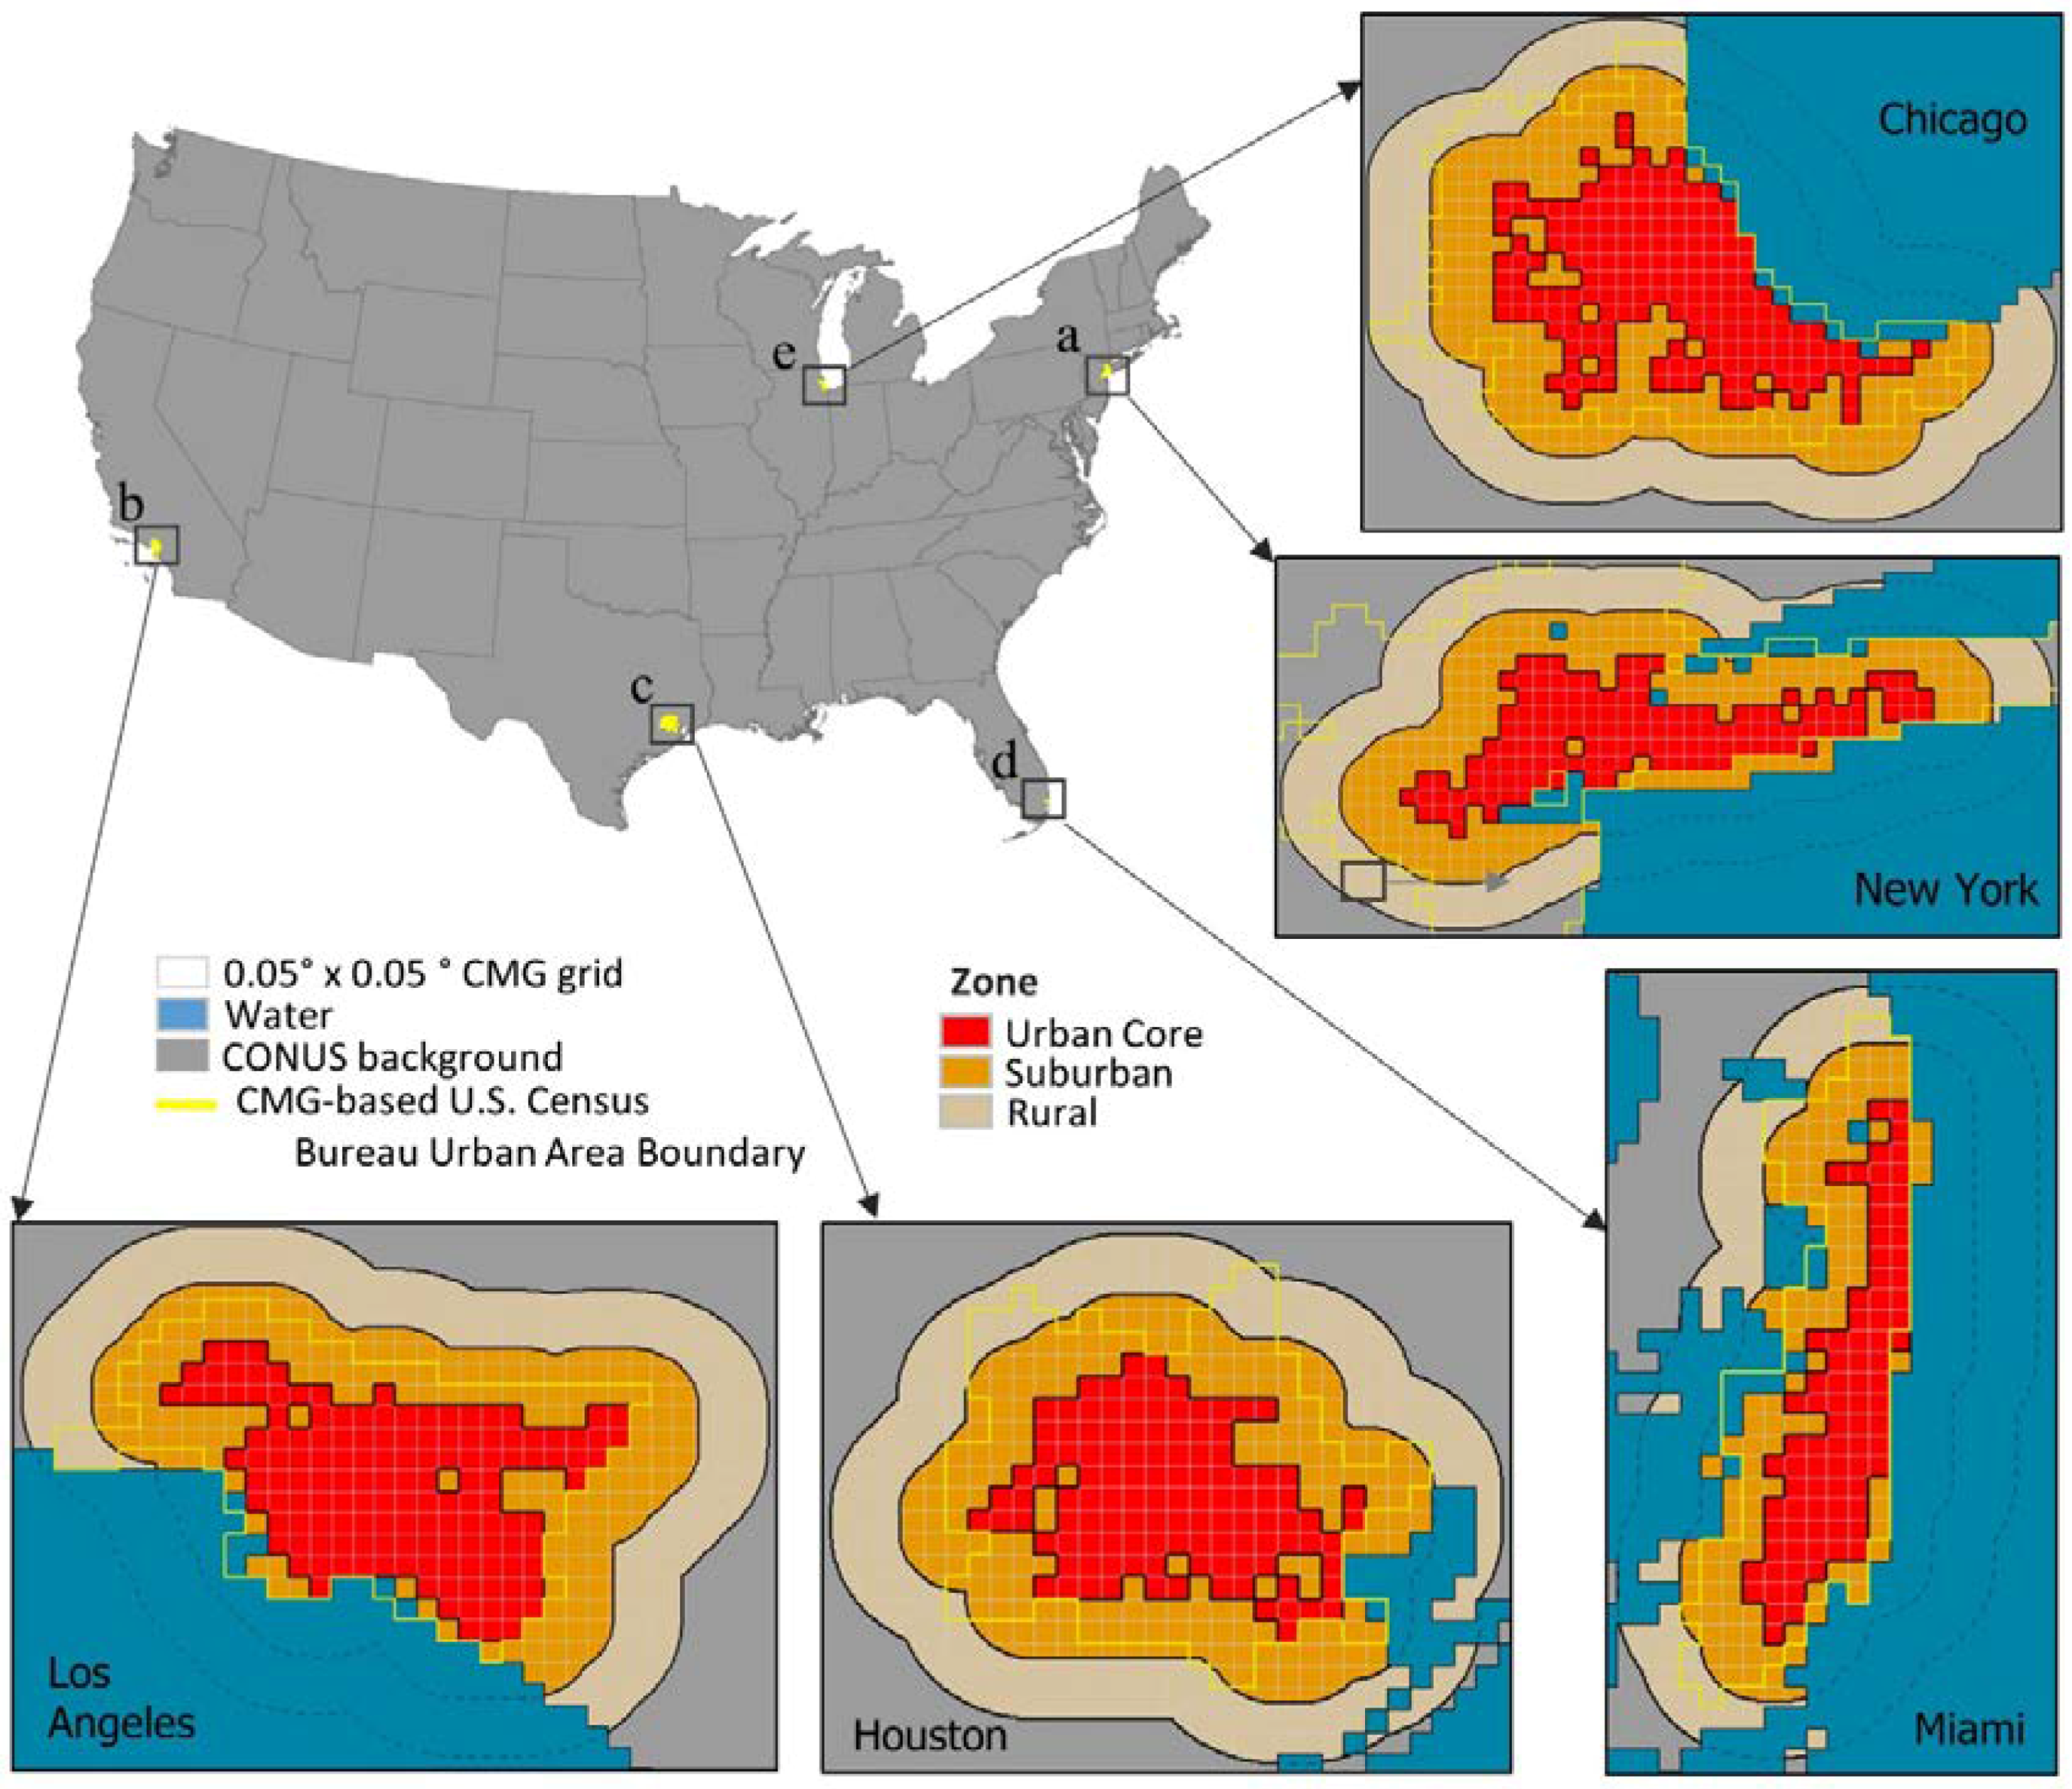
Once individual cities are defined, we further stratified the landscape within and around them using zones delimited based on ISA and distance. We define three zones based on percent ISA in concentric rings emanating at highest ISA in the city and decreasing outward from it: (1) the urban core is defined by the largest continuous cluster of 2011 CMG pixels with ISA values greater than or equal to 25.0% that fall within the Census urban area boundary for that city; (2) the suburban zone is defined as the area between 0 km and 15 km from the outer urban core contour; and (3) the rural zone is defined as the area between 15 km and 30 km from the outer urban contour (Figure 3). The rural zone is chosen to be far enough from the urban core to represent a remote rural area yet not too far to infringe into the 25.0% contour of an adjacent city. Pixels overlapping other cities are excluded from the analysis.
Among the major cities described above, Chicago and Houston are expected to experience the largest land development, respectively, both in the urban core and the suburban zone. In all five cities, land development is expected to occur more in suburban zones than in the urban core except for Los Angeles where land consumption within the city core is projected to be greater than in the suburbs (Table 8). As a general rule, the rural zone is the least developed. In all these cities, population is expected to increase much faster in the urban core than the suburbs, especially in Chicago and Los Angeles where it is expected to grow four times faster.
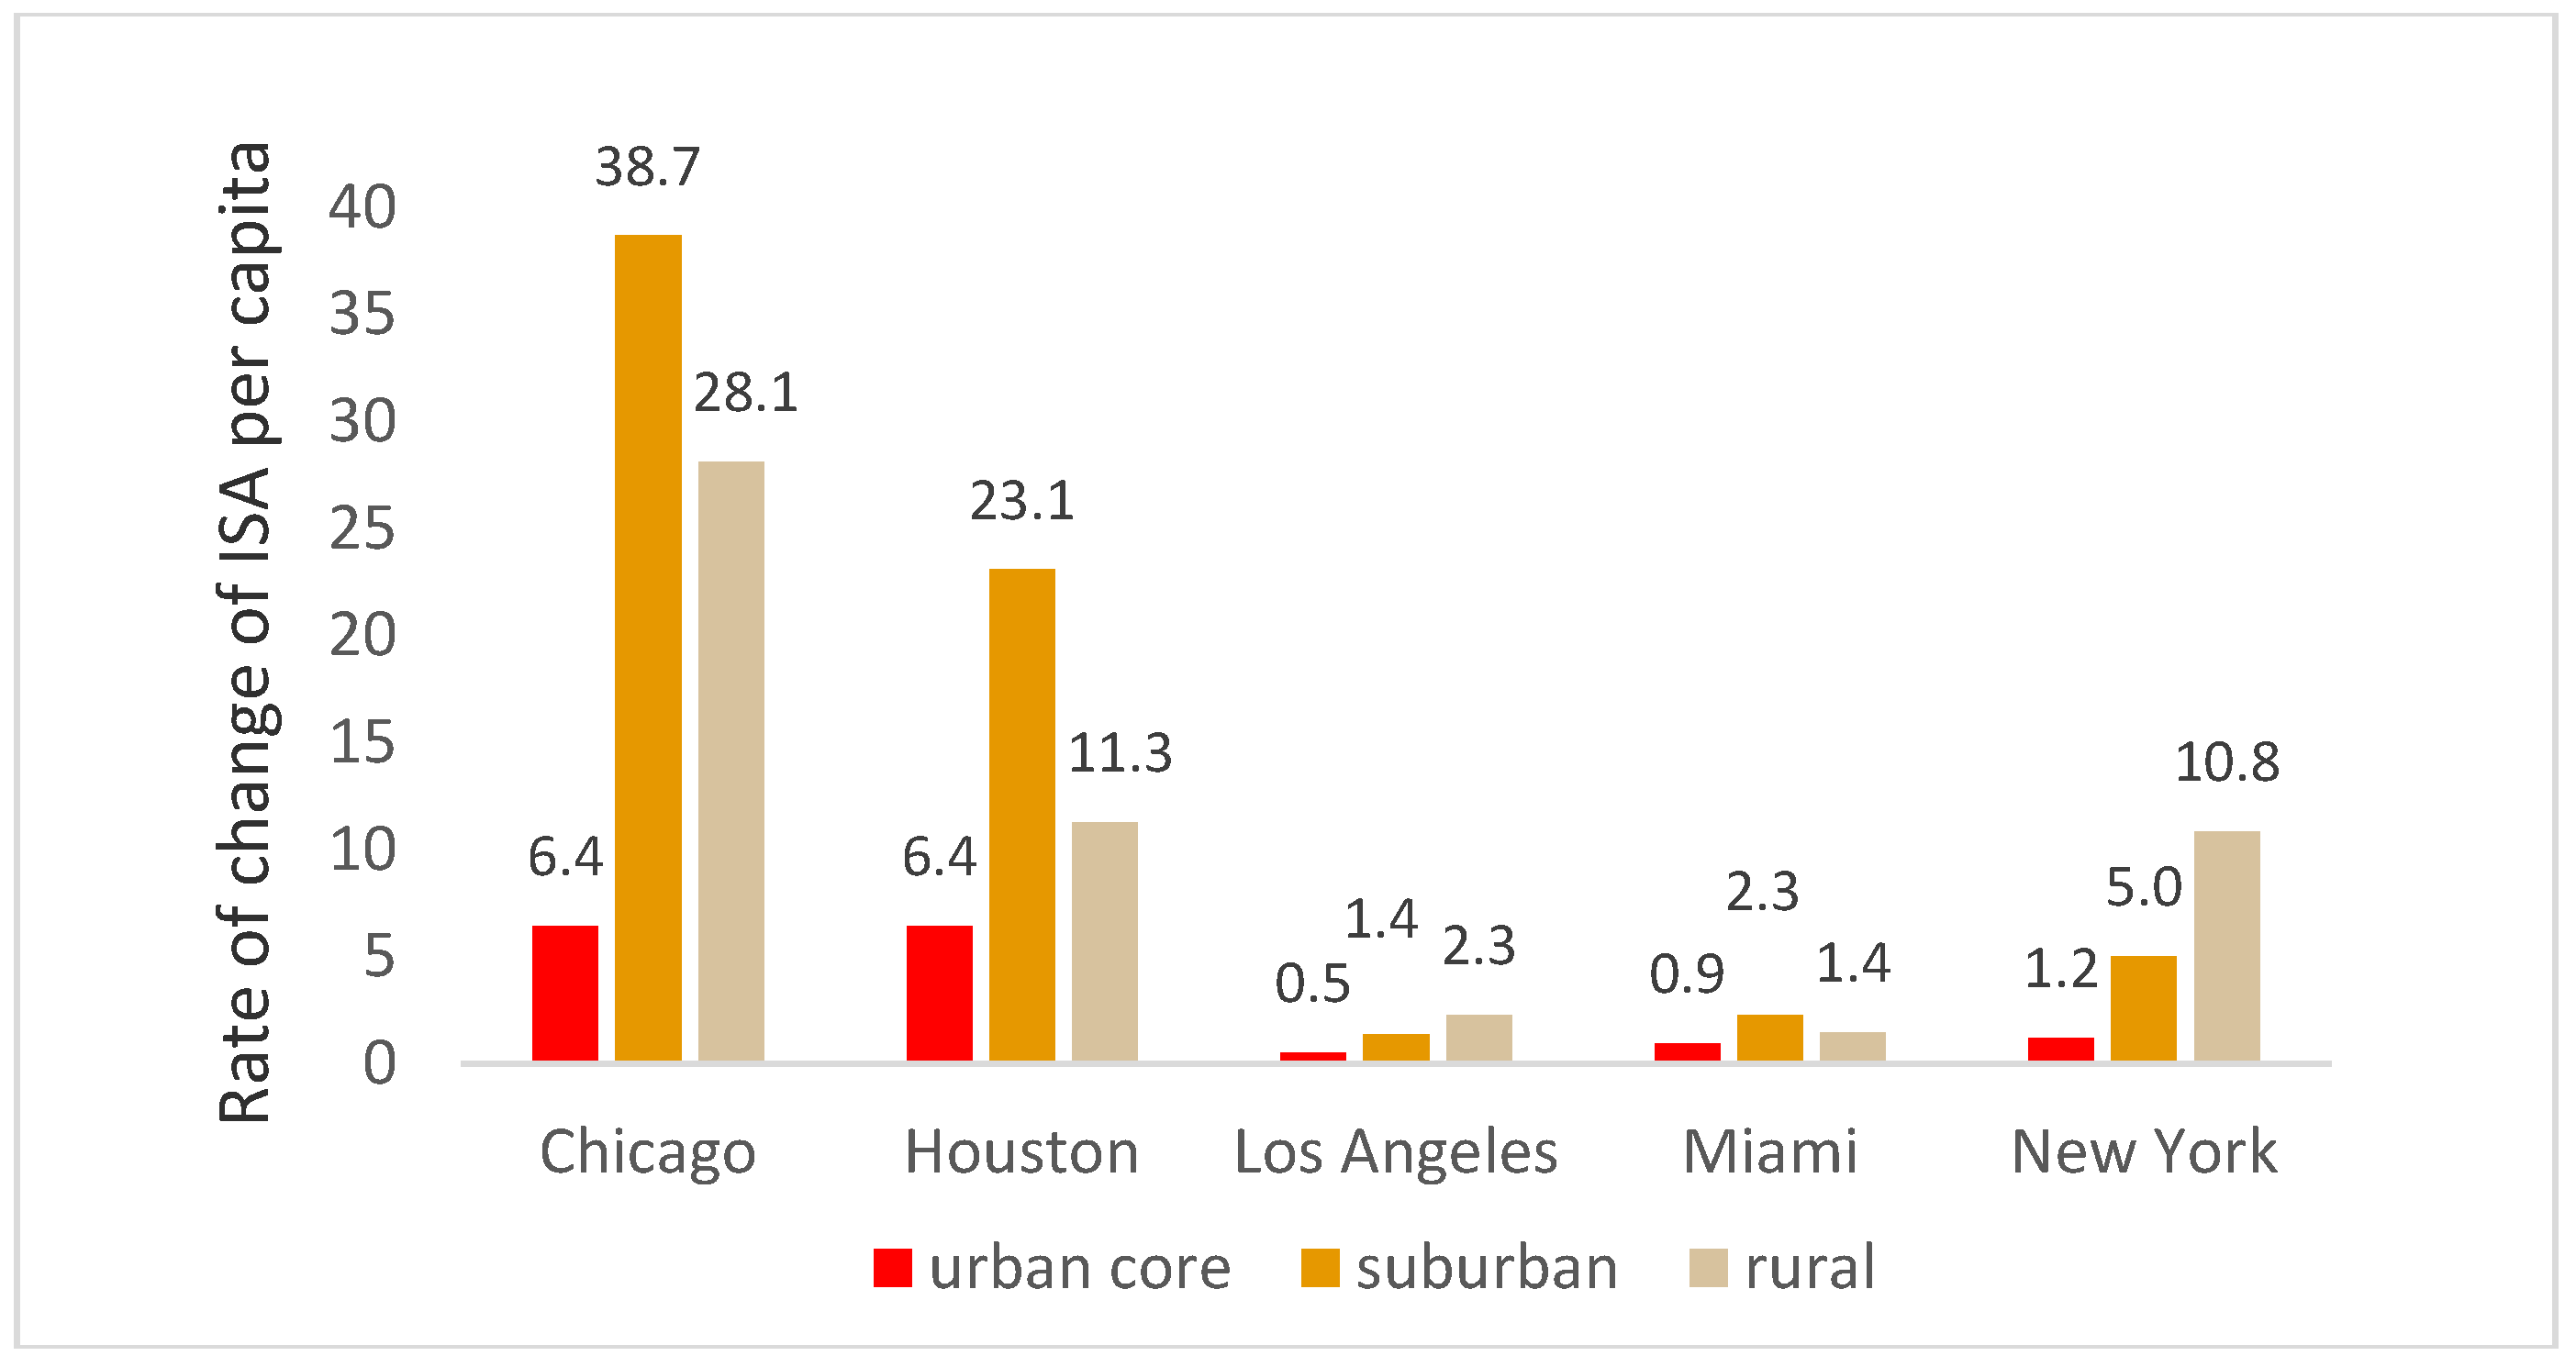
The ratio of land consumption rate to population growth rate is an important benchmark for monitoring land use efficiency [36]. We computed this indicator for the five cities to inform and track future urban growth at multiple scales: urban cores, suburban and rural zones (Figure 4). Again Chicago and Houston display the largest land use per capita in all three zones, respectively. Large population growth and limited land availability forces Los Angeles to have the smallest land use per capita in all zones, with a 0.5 ha per capita in the urban core. This agglomeration pattern, a sign of compactness and connectivity, is also seen in Miami and New York and is an indicator for urban prosperity and sustainability [36].
3.2.7. Lewes and Des Moines
In a previous study, Bounoua et al. [31] showed that Lewes, DE and Des Moines, IA exhibited some of the greatest ISA per-capita increases during the 2001–2011 decade. We included analysis of population and ISA information related to these two relatively small cities to get a better understanding of how population and ISA may change in smaller cities scattered across the CONUS and how this change compares to cities within large urban areas. Comparing results between the two decades, 2001–2011 and 2011–2020, we find that in Des Moines the increase in population is projected to almost double during the 2011–2020 decade compared to the 2001–2011, while the ISA change is projected to increase from 10.0% during 2001–2011 to 16.4% during the 2011–2020 decade (Table 9a). Because land development is increasing faster than population, the per capita land use in Des Moines is projected at 0.0462 ha per capita (462 m2 per capita) and has increased by 0.0046 ha per capita during the 2011–2020 decade. To put this number in perspective, in the U.S. the average area per capita in 2015 was 0.0098 ha [37]. On the contrary, for Lewes, the population change has decreased slightly during the 2011–2020 decade as compared to 2001–2011, while its ISA increase has more than doubled, leading to the highest ISA per capita use (Table 9b). With 0.0714 ha per capita, Lewes is projected to maintain the lowest population density of the CONUS by 2020.
3.3. State and Continental Scales
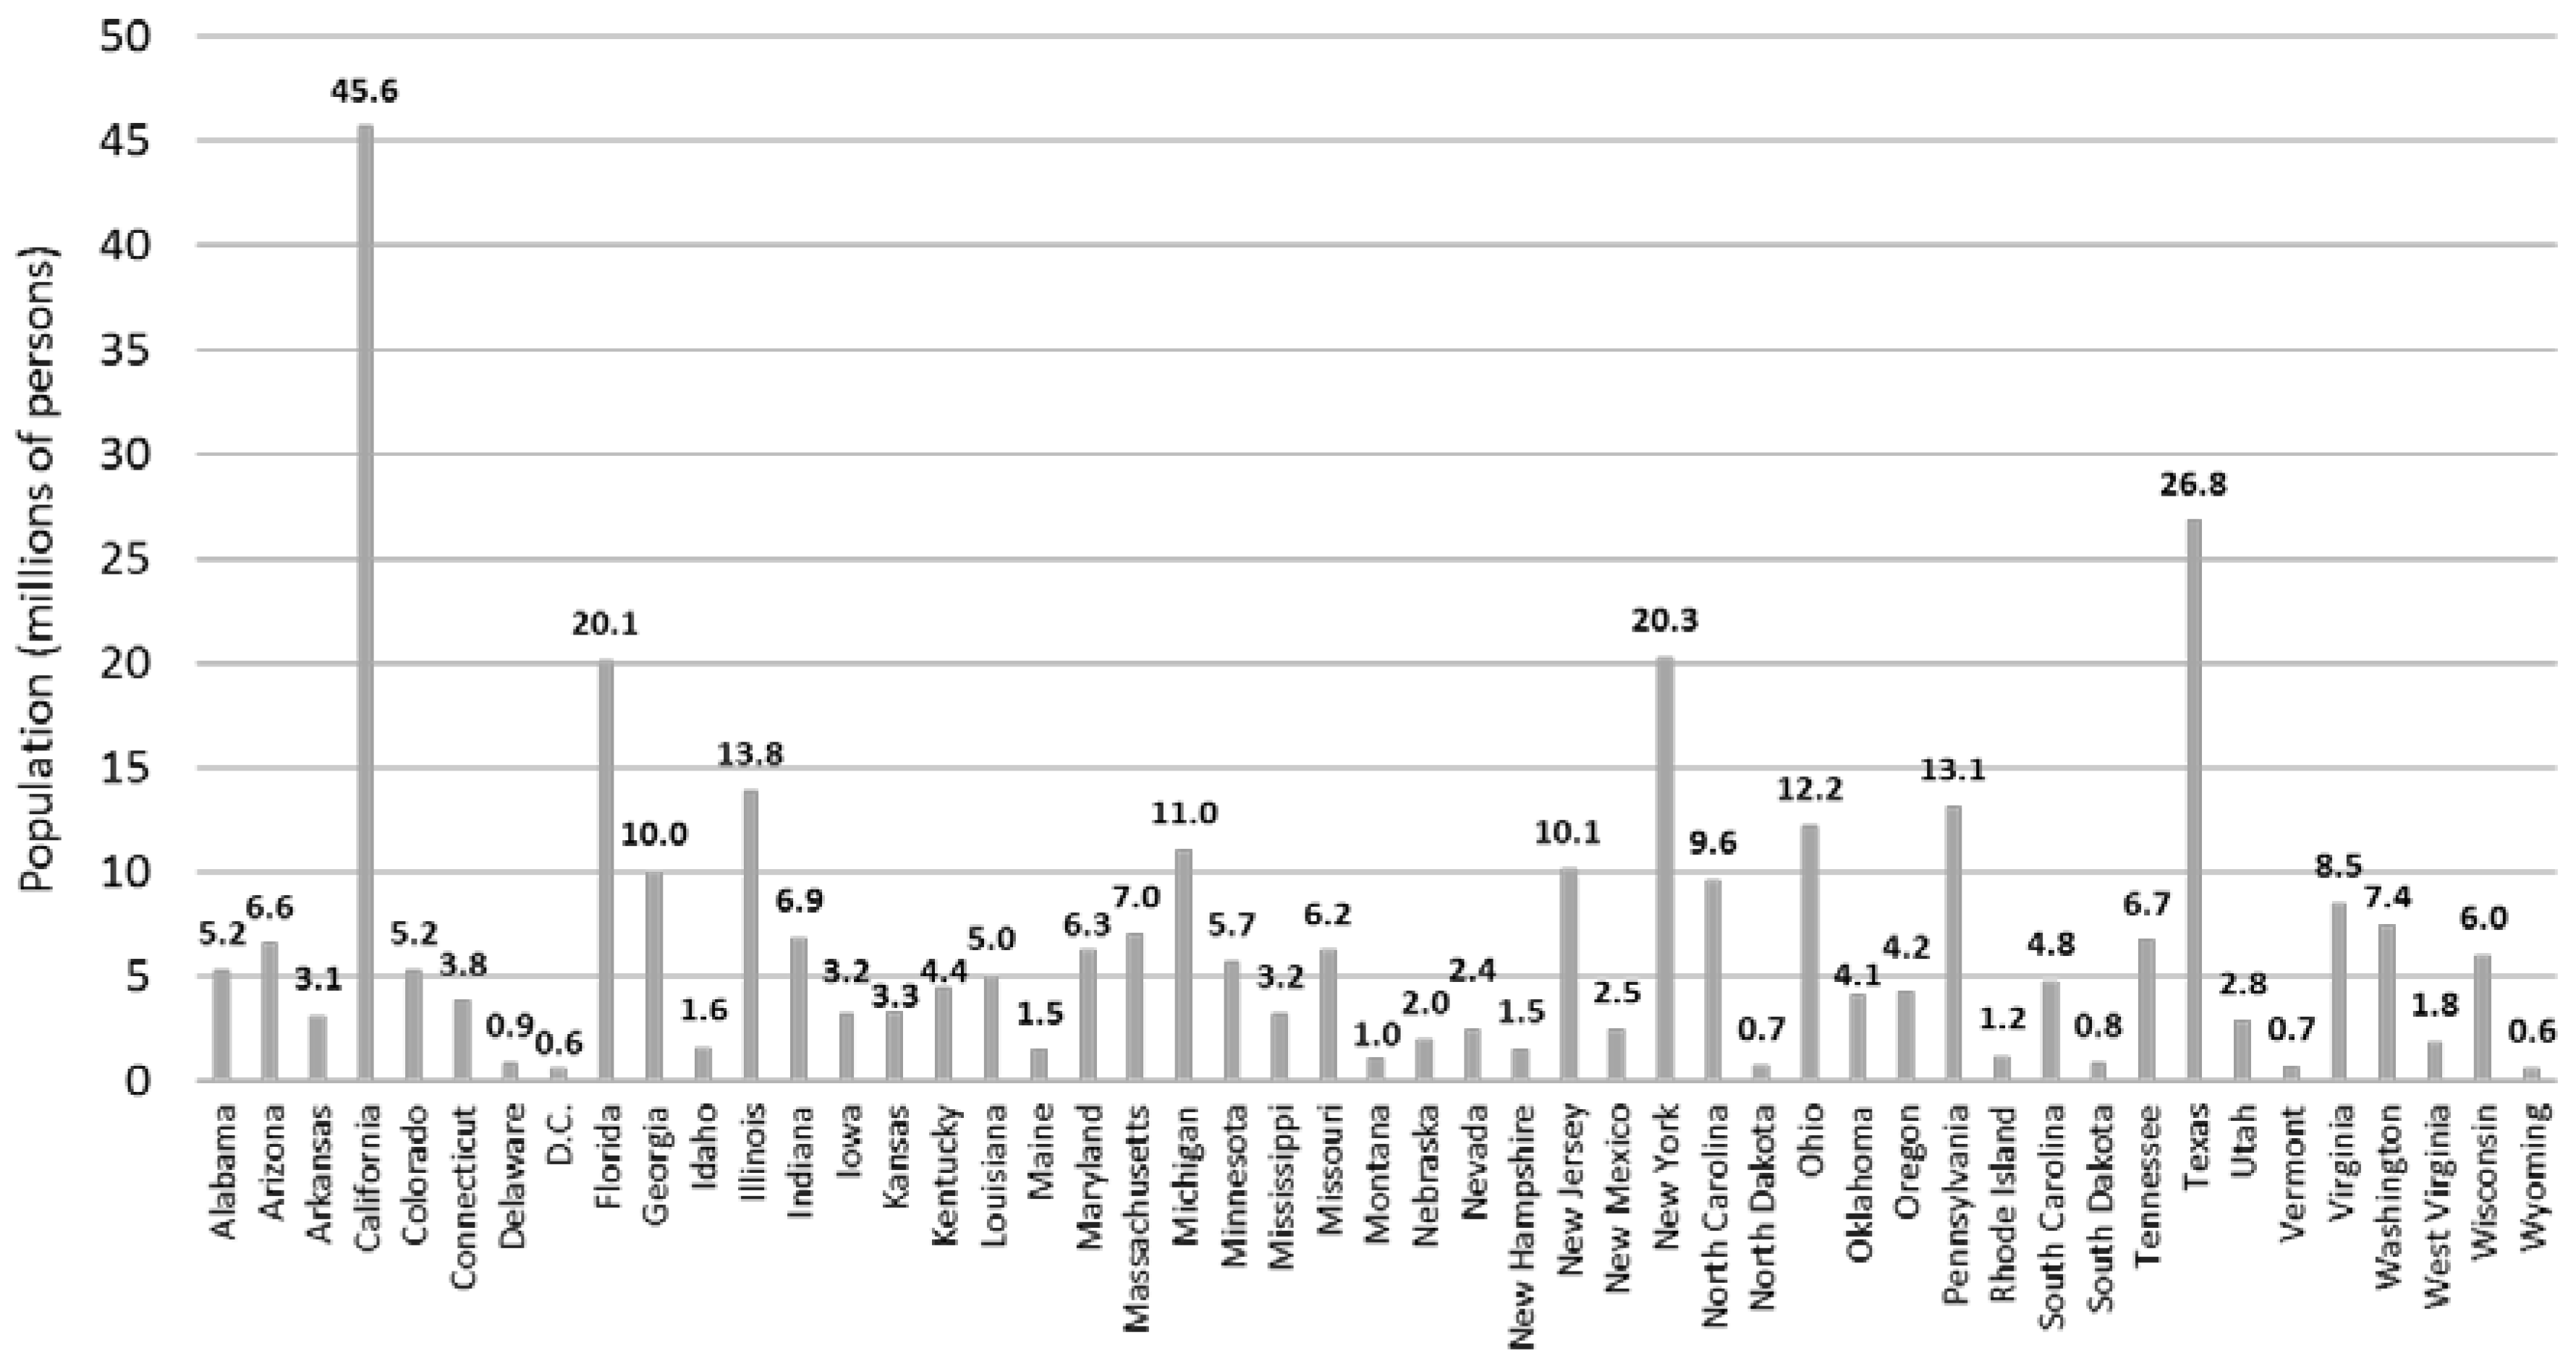
State-wide population summaries for 2020, disaggregated from the single Census Bureau 2020 National Population Projection (population count) value, were created as described in Section 2.1. The resultant state-wide breakdown is shown in Figure 5.
When population counts from the CMGs are aggregated to the states’ level, we find California, Texas, New York, Florida, and Illinois to be the top five states in both 2011 and 2020. These same states also present the highest amount of ISA in both years, with Texas surpassing California for the first spot in 2020 (Table 10). In terms of change between 2011 and 2020, the top five states with the largest projected increase in population are California, Texas, Florida, New York and Illinois, and those with the largest projected increase in ISA are Texas, Ohio, Pennsylvania, Michigan, and West Virginia.
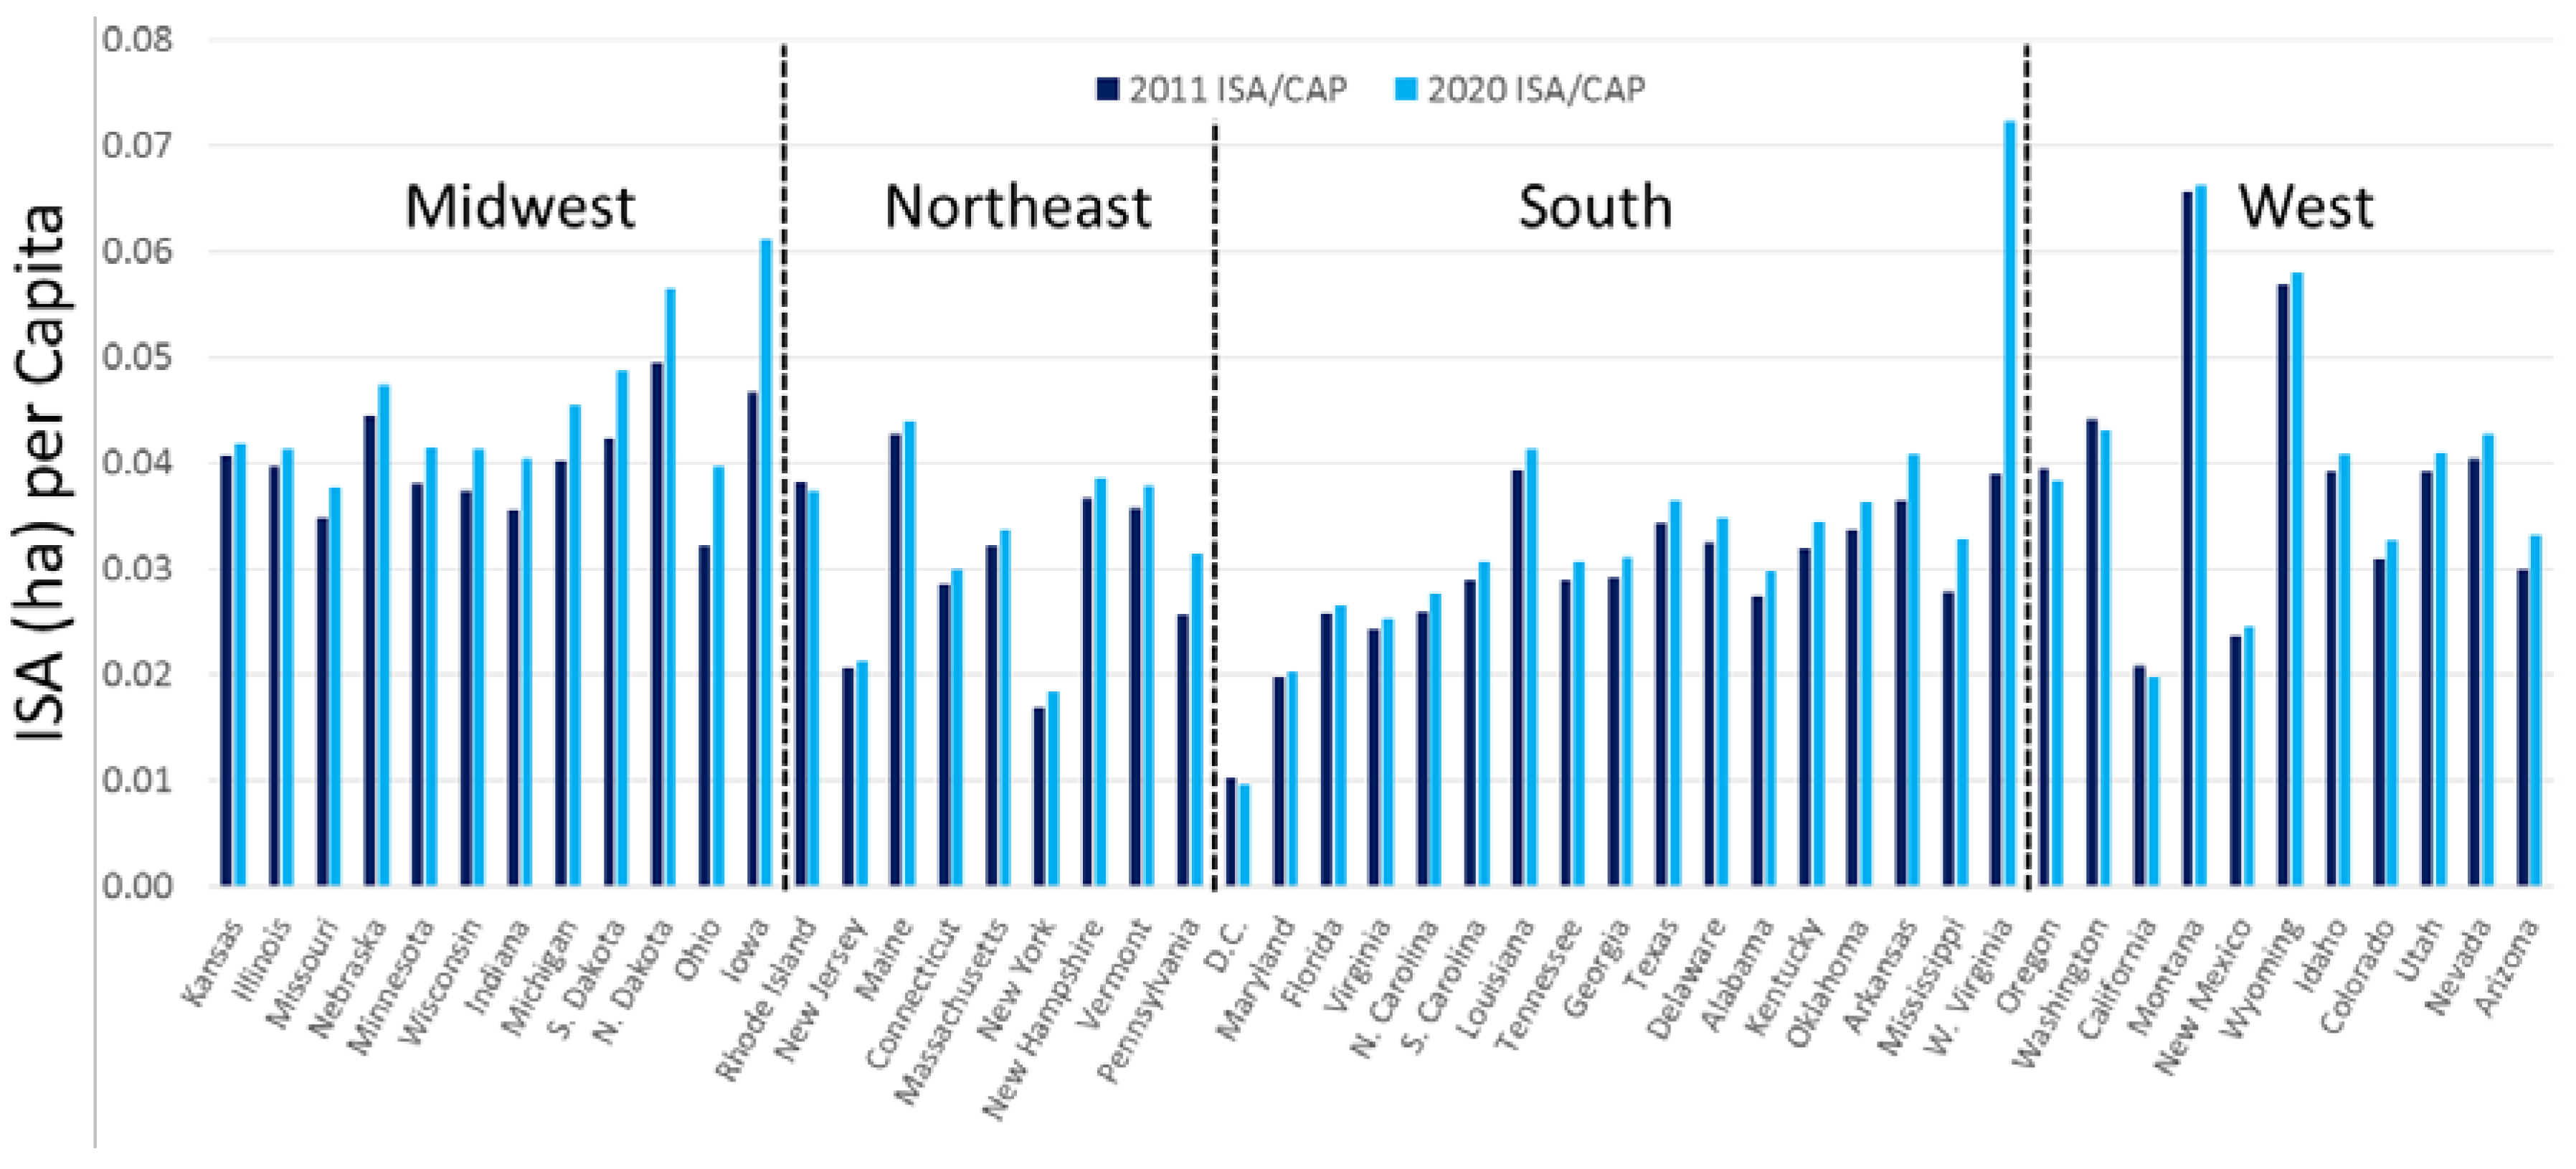
In terms of land use, western coastal states like Oregon, Washington, California and Montana are projected to reduce their ISA per capita use from 2011, with Oregon showing the greatest decline in ISA per capita (0.0012 ha/capita) and California showing the largest decrease (4.9%) relative to 2011. The remainder of the western states are all expected to increase their per capita land use by 2020 (Figure 6). All other states are projected to have an increased per capita land use, except Rhode Island (RI) and the District of Columbia (D.C). Midwestern states are projected to have the largest increase in ISA per capita use. For example, Iowa, Ohio, North Dakota, South Dakota, and Michigan have the highest ISA per capita gain, with Iowa showing the greatest increase in ISA per capita (0.0150 ha/capita) and the greatest ISA per capita increase (31.0%) relative to 2011.
At continental scale, projected change in population, ISA, ISA per capita and the fraction of ISA within the CONUS from 2011 to 2020 are presented in Table 11.
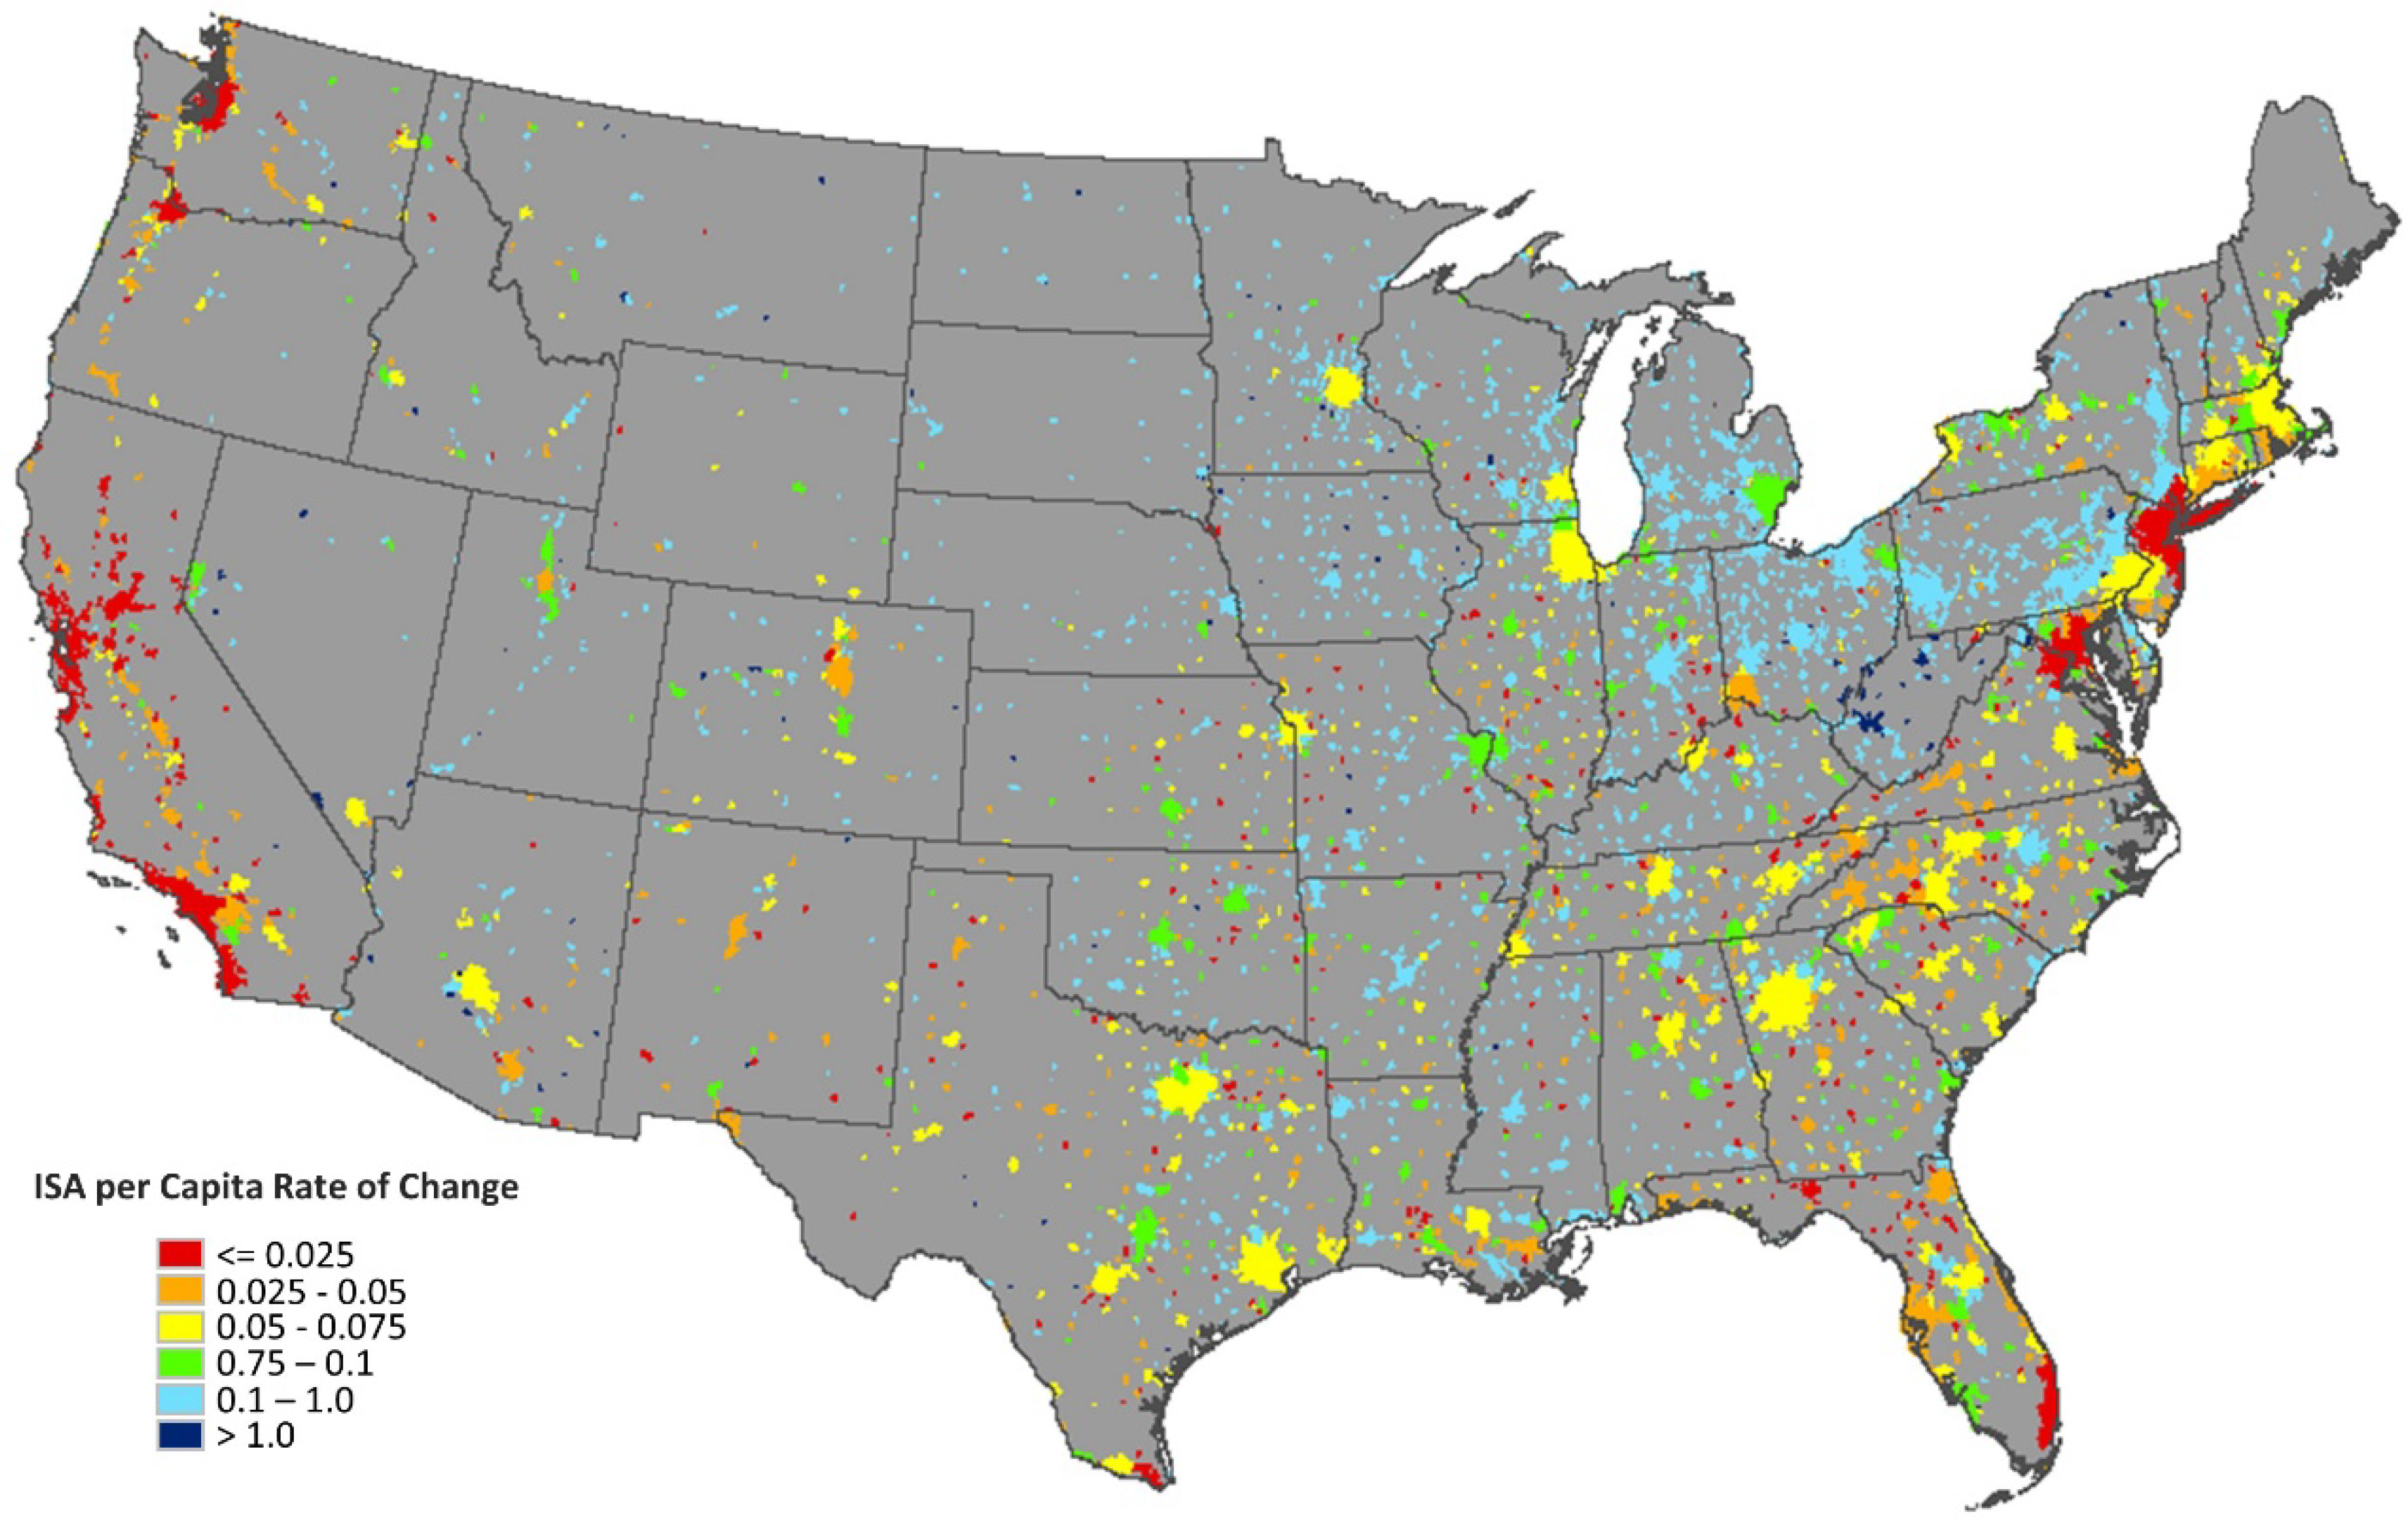
Population and ISA totals for the CONUS indicate that from 2011 to 2020, an increase in population of 23,248,745 persons will trigger an ISA increase of 1,415,280.24 ha leading to an overall average increase in land development for urbanization purposes of 0.17%. The rate of change of ISA per capita between 2011 and 2020 for all 3527 urban areas of the CONUS provides a synoptic view of the projected urbanization dynamics across the country (Figure 7). A significant increase in the rate of change in ISA per capita is projected across the Midwest into the Northeast and scattered within the South and in some areas in the interior of the West. In large urban areas throughout Pennsylvania, Ohio, Illinois, and Iowa the rate of change of ISA per capita change between 2011 and 2020 is projected to be significant (0.1–1.0 ha/capita), but the greatest change may be seen in West Virginia with rates greater than 1.0 ha per person. Many of the major urban areas in the Southern states are projected to experience a rate of change between 0.05 and 0.075 ha per capita, including a large portion of Georgia, Tennessee, South Carolina, and Alabama. On the contrary, most western urban areas in Washington, Oregon, and California are expected to experience a relatively low rate of change in land development (less than 0.025 ha/capita). The average 2020 ISA per capita use in California (0.02 ha/capita) is relatively lower than the CONUS average (0.03 ha/capita) as well as the average of Pennsylvania (0.03 ha/capita), Ohio (0.04 ha/capita), Nevada (0.04 ha/capita) and Iowa (0.06 ha/capita). For reference, the medium house size in the U.S. in 2016 is about 0.0250 ha [37].
Urbanization dynamics appear clearly contrasted between the eastern and western parts of the CONUS (Figure 7). For example New York remains the largest eastern urban area in terms of ISA extent and population count in 2020, while Los Angeles is by far the largest and most populous urban area in the West. However, the 2011–2020 ISA per capita for Los Angeles is projected to decrease by 0.001 ha per capita, while in New York, the ISA per capita is projected to remain unchanged.
4. Concluding Remarks
Sustainable urban growth requires the monitoring of the relationship between land use and population. In the United States population grew by 0.7% between 2015 and 2016, its slowest annual growth in about 80 years, bringing the total population to just over 323 million [38]. Considering this relatively slow annual growth rate, the nation’s population is projected to reach 334,503,458 people by 2020 [25]. Where and how this population growth is going to affect land use is not conveyed by this number. We developed a methodology based on historic growth pattern to spatially disaggregate this number to city-scale and further differentiate its distribution within urban and non-urban districts.
We find substantial variations in population and land development trends in different parts of the U.S. Most of the west coast large urban areas are projected to undergo a decrease in per capita land use between 2011 and 2020, with San Francisco (CA) leading the way with a 9.2% reduction. In most other areas of the CONUS, especially in the Upper Midwest, urban impervious surface areas are projected to increase significantly faster than population growth.
At city-level, on the east coast (e.g., New York, Miami) a population growth faster than land use is expected to reduce the per capita land use in 2020 leading to an increase in population density. Similar growth patterns are observed in large cities on the west coast (e.g., Los Angeles).
The land use and population dynamic observed at the city and urban area scales do not scale up to the state level and the top 5 CONUS states with highest ISA and population are set to remain the same between 2011 and 2020. At the continental scale, urbanization as reflected by ISA use is projected to expand by 0.17% between 2011 and 2020, an increase over the 0.11% reported between 2001 and 2011.
Author Contributions
Conceptualization, L. Bounoua. and K. Thome and P. Zhang; Methodology, L. Bounoua; J. Nigro, K. Thome and P. Zhang; Software, J. Nigro; Validation, J. Nigro, A, Lachir and N. Fathi; Formal Analysis, L. Bounoua, J. Nigro; Investigation, L. Bounoua, J. Nigro; Resources, L. Bounoua; Data Curation, J. Nigro, P. Zhang, A. Lachir, N. Fathi; Writing—Original Draft Preparation, L. Bounoua, J. Nigro; Writing—Review & Editing, L. Bounoua, K. Thome; Visualization, J. Nigro; Supervision, L. Bounoua; Project Administration, L. Bounoua.
Acknowledgments
This work was supported by the National Aeronautics and Space Administration Interdisciplinary Research in Earth Science (IDS) [grant: NNH11ZDA001N-IDS]. Garik Gutman program manager.
Conflicts of Interest
The authors declare no conflict of interest.
References
- U.S. Census Bureau. 2010 Census of Population and Housing. United States Summary: Population and Housing Unit Counts, CPH-2-1 2012, Table 4, 6–7. Available online: https://www.census.gov/prod/cen2010/cph-2-1.pdf (accessed on 16 April 2018).
- U.S. Environmental Protection Agency. Urbanization and Population Change. U.S. EPA’s Report on the Environment 2017. Available online: https://cfpub.epa.gov/roe/indicator.cfm?i=52 (accessed on 16 April 2018).
- Henderson, V. The Urbanization Process and Economic Growth: The So-What Question. J. Econ. Growth 2003, 8, 47–71. [Google Scholar] [CrossRef]
- Hope, K.R. Urbanization and Urban Growth in Africa. J. Asian Afr. Stud. 1998, 33, 345–358. [Google Scholar] [CrossRef]
- Imhoff, M.L.; Bounoua, L.; DeFries, R.; Lawrence, W.T.; Stutzer, D.; Tucker, C.J.; Ricketts, T. The Consequences of Urban Land Transformation on Net Primary Productivity in the United States. Remote Sens. Environ. 2004, 89, 434–443. [Google Scholar] [CrossRef]
- McKinney, M.L. Effects of Urbanization on Species Richness: A Review of Plants and Animals. Urban Ecosyst. 2008, 11, 161–176. [Google Scholar] [CrossRef]
- Grimm, N.B.; Faeth, S.H.; Golubiewski, N.E.; Redman, C.L.; Wu, J.G.; Bai, X.; Briggs, J.M. Global Change and the Ecology of Cities. Science 2008, 319, 756–760. [Google Scholar] [CrossRef] [PubMed]
- Carlson, T.N.; Arthur, S.T. The Impact of Land Use-Land Cover Changes Due to Urbanization on Surface Microclimate and Hydrology: A Satellite Perspective. Glob. Planet. Chang. 2000, 25, 49–65. [Google Scholar] [CrossRef]
- Bounoua, L.; Zhang, P.; Thome, K.; Masek, J.; Safia, A.; Imhoff, M.; Wolfe, R.E. Mapping Biophysical Parameters for Land Surface Modeling over the Continental US Using MODIS and Landsat. Dataset Pap. Sci. 2015, 1–11. [Google Scholar] [CrossRef]
- Oke, T.R. Urban Climates and Environmental Global Change. In Applied Climatology Principles and Practice; Thompson, R.D., Perry, A.H., Eds.; Routledge: New York, NY, USA, 1997; pp. 273–287. [Google Scholar]
- Masson, V. Urban Surface Modelling and the Meso-scale Impact of Cities. Theor. Appl. Climatol. 2006, 84, 35–45. [Google Scholar] [CrossRef]
- Zhang, P.; Bounoua, L.; Thome, K.; Robert, R.; Imhoff, M. Modeling Surface Climate in U.S. Cities Using Simple Biosphere Model SiB2. Can. J. Remote Sens. 2015, 41, 525–535. [Google Scholar] [CrossRef]
- Yeh, A.G.O.; Li, X. Sustainable Land Development Model for Rapid Growth Areas Using GIS. Int. J. Geogr. Inf. Sci. 1998, 12, 169–189. [Google Scholar] [CrossRef]
- Zhou, Y.; Wang, Y. An Assessment of Impervious Surface Areas. Rhode Isl. Northeast. Nat. 2007, 14, 643–650. [Google Scholar] [CrossRef]
- Zhou, Y.; Wang, Y. Extraction of Impervious Surface Areas from High Spatial resolution Imagery by Multiple Agent Segmentation and Classification. Photogramm. Eng. Remote Sens. 2008, 74, 857–868. [Google Scholar] [CrossRef]
- Schneider, A.; Friedl, M.A.; Potere, D. A New Map of Global Urban Extent from MODIS Satellite Data. Environ. Res. Lett. 2009, 4, 044003. [Google Scholar] [CrossRef]
- Zhang, Q.; Seto, K.C. Mapping Urbanization Dynamics at Regional and Global Scales using Multi-temporal DMSP/OLS Nighttime Light Data. Remote Sens. Environ. 2011, 115, 2320–2329. [Google Scholar] [CrossRef]
- Clarke, K.C.; Hoppen, S.; Gaydos, L. Methods and Techniques for Rigorous Calibration of a Cellular Automaton Model of Urban Growth. In Proceedings of the Third International Conference/Workshop on Integrating GIS and Environmental Modeling, Santa Fe, NM, USA, 21–25 January 1996; Available online: http://citeseerx.ist.psu.edu/viewdoc/download?doi=10.1.1.461.6535&rep=rep1&type=pdf (accessed on 16 April 2018).
- Karnieli, A.; Issar, A.; Wolf, M. The Effect of Urbanization in an Arid Region. Formation of Perched Water Table that Causes Environmental Damages. Environ. Geol. Water Sci. 1984, 6, 51–63. [Google Scholar] [CrossRef]
- Triantakonstantis, D.; Mountrakis, G. Urban Growth Prediction: A Review of Computational Models and Human Perceptions. J. Geogr. Inf. Syst. 2012, 4, 555–587. [Google Scholar] [CrossRef]
- Li, X.; Gong, P. Urban Growth Models: Progress and Perspective. Sci. Bull. 2016, 61, 1637–1650. [Google Scholar] [CrossRef]
- Homer, C.; Dewitz, J.; Fry, J.; Coan, M.; Hossain, N.; Larson, C.; Herold, N.; McKerrow, A.; VanDriel, J.N.; Wickham, J. Completion of the 2001 National Land Cover Database for the Conterminous United States. Photogramm. Eng. Remote Sens. 2007, 73, 337–341. [Google Scholar]
- Homer, C.; Huang, C.; Yang, L.; Wylie, B.; Coan, M. Development of a 2001 National Land cover Database for the United States. Photogramm. Eng. Remote Sens. 2004, 70, 829–840. [Google Scholar] [CrossRef]
- CIESIN-Columbia University; U.N. FAO & CIAT. Gridded Population of the World, Version 3 (GPWv3): Population Count Grid, Future Estimates; NASA SEDAC: Palisades, NY, USA, 2005. Available online: http://sedac.ciesin.columbia.edu/data/set/gpw-v3-population-count-future-estimates (accessed on 16 April 2018).
- U.S. Census Bureau. 2014 National Population Projections. Table 1. Projected Population by Single Year of Age, Sex, Race, and Hispanic Origin for the United States: 2014 to 2060. 2014. Available online: https://census.gov/data/datasets/2014/demo/popproj/2014-popproj.html (accessed on 16 April 2018).
- Esri, National Atlas of the United States, United States Geological Survey, Department of Commerce, Census Bureau-Geography Division. USA Urban Areas (1:500k–1.5m). 2010. Available online: https://www.arcgis.com/home/item.html?id=432bb9246fdd467c88136e6ffeac2762 (accessed on 16 April 2018).
- U.S. Census Bureau. Cartographic Boundary Shapefiles-Places (Incorporated Places and Census Designated Places). 2016. Available online: https://www.census.gov/geo/maps-data/data/cbf/cbf_place.html (accessed on 16 April 2018).
- Esri Data & Maps & Tomtom. USA State Boundaries. 2012. Available online: https://www.arcgis.com/home/item.html?id=540003aa59b047d7a1f465f7b1df1950 (accessed on 16 April 2018).
- Bounoua, L.; Zhang, P.; Mostovoy, G.; Thome, K.; Masek, J.; Imhoff, M.; Shepherd, M.; Quattrochi, D.; Santanello, J.; Silva, J. Impact of Urbanization on US Surface Climate. Environ. Res. Lett. 2015, 10. [Google Scholar] [CrossRef]
- Zhou, Y.; Smith, S.J.; Zhao, K.; Imhoff, M.; Thomson, A.; Lamberty, B.B.; Asrar, G.R.; Zhang, X.; He, C.; Elvdige, C.D. A Global Map of Urban Extent from Nightlights. Environ. Res. Lett. 2015, 10. [Google Scholar] [CrossRef]
- Bounoua, L.; Nigro, J.; Zhang, P.; Lachir, A.; Thome, K. Mapping Urbanization in the United States from 2001-2011. Appl. Geogr. 2018, 90, 123–133. [Google Scholar] [CrossRef]
- NYC Department of City Planning. Current Estimates for New York City’s Population for July 2016. Available online: http://www1.nyc.gov/site/planning/data-maps/nyc-population/current-future-populations.page (accessed on 16 April 2018).
- Beyer, S. Los Angeles Is the Latest City with a Housing Crisis. 10 April 2015. Available online: https://www.forbes.com/sites/scottbeyer/2015/04/10/los-angeles-is-the-latest-city-with-a-housing-crisis/#19179b105641 (accessed on 16 April 2018).
- Gray, N. How Spontaneous Order Keeps Houston Affordable. 20 March 2017. Available online: https://fee.org/articles/how-spontaneous-order-keeps-houston-affordable/?utm_source=zapier&utm_medium=facebook (accessed on 16 April 2018).
- Cepero, C. Miami Sees Continued Population Growth Downtown, Countering Trend. 11 October 2016. Available online: http://www.miamitodaynews.com/2016/10/11/miami-sees-continued-population-growth-downtown-countering-trend/ (accessed on 16 April 2018).
- SDSN (Sustainable Development Solutions Network). Indicators and a Monitoring Framework. Launching a Data Revolution for the Sustainable Development Goals. 2012. Available online: http://indicators.report/indicators/i-68/ (accessed on 16 April 2018).
- Perry, M. New US Homes Today Are 1000 Square Feet Larger Than in 1973 and Living Space per Person Has Nearly Doubled. AEIdeas, 5 June 2016. Available online: http://www.aei.org/publication/new-us-homes-today-are-1000-square-feet-larger-than-in-1973-and-living-space-per-person-has-nearly-doubled/ (accessed on 16 April 2018).
- U.S. Census Bureau. Utah Is Nation’s Fastest-Growing State. Census Bureau Reports. 20 December 2016. Available online: https://www.census.gov/newsroom/press-releases/2016/cb16-214.html (accessed on 16 April 2018).
Figure 1.
2011–2020 population and ISA change for the top 25 cities projected to have the greatest amount of total ISA in 2020.
Figure 1.
2011–2020 population and ISA change for the top 25 cities projected to have the greatest amount of total ISA in 2020.

Figure 2.
2011–2020 gridded ISA growth (%) at city scale for (a) New York City (NY), (b) Los Angeles (CA), (c) Houston (TX), (d) Miami (FL), and (e) Chicago (IL).
Figure 2.
2011–2020 gridded ISA growth (%) at city scale for (a) New York City (NY), (b) Los Angeles (CA), (c) Houston (TX), (d) Miami (FL), and (e) Chicago (IL).

Figure 3.
Layout of the three zones defined around cities (see text for details).

Figure 4.
Rate of change of ISA per capita (ha/person) between 2011 and 2020.

Figure 5.
Breakdown of the U.S. Population Projected for 2020 by state within the CONUS, including the District of Columbia. The CONUS population total is 332,079,363 persons (99.9% of the total projected population after the redistribution process is undertaken; see text for details).
Figure 5.
Breakdown of the U.S. Population Projected for 2020 by state within the CONUS, including the District of Columbia. The CONUS population total is 332,079,363 persons (99.9% of the total projected population after the redistribution process is undertaken; see text for details).

Figure 6.
2011 and 2020 ISA per capita (ha/person) for states grouped by region. Note: The results are arranged by smallest to largest ISA per capita difference for each region between 2011 and 2020.
Figure 6.
2011 and 2020 ISA per capita (ha/person) for states grouped by region. Note: The results are arranged by smallest to largest ISA per capita difference for each region between 2011 and 2020.

Figure 7.
Rate of change in ISA (ha) per capita (person) from 2011 to 2020 in the CONUS as defined by urban area boundaries. ISA per capita rate of change was computed by dividing the change in ISA between 2011 and 2020 by the change in population between 2011 and 2020.
Figure 7.
Rate of change in ISA (ha) per capita (person) from 2011 to 2020 in the CONUS as defined by urban area boundaries. ISA per capita rate of change was computed by dividing the change in ISA between 2011 and 2020 by the change in population between 2011 and 2020.


Table 1.
Datasets used in this study.
| Dataset | Spatial Resolution | Time Period |
|---|---|---|
| NLCD Impervious Surface Area | 30-m | 2001, 2011 |
| CIESIN Gridded Population of the World (GPWv3) | 2.5 arc-minute * | 2010, 2015 |
| U.S. Census Bureau National Population Projections | single value | 2020 |
| ESRI/U.S. Census Bureau 1:500k Urban Areas | n/a—vector (polygon) | 2010 |
| U.S. Census Bureau MAF/TIGER 1:500k Places | n/a—vector (polygon) | 2016 |
| ESRI U.S. State Boundaries | n/a—vector (polygon) | 2012 |
* About 5 km. NLCD: National Land Cover Dataset; CIESIN: Center for International Earth Science Information Network; ESRI: Environmental Systems Research Institute; MAF/TIGER; Master Address File/Topologically Integrated Geographic Encoding and Referencing.
Table 2.
Twenty-five urban areas with the largest impervious surface area (ISA, ha) in 2020 along with ISA and population (POP, persons) changes between 2011 and 2020.
Table 2.
Twenty-five urban areas with the largest impervious surface area (ISA, ha) in 2020 along with ISA and population (POP, persons) changes between 2011 and 2020.
| Urban Area | ISA | ISA Change | ISA/Cap a | ISA/Cap Change | ISA/Cap Change Rate d | POP | POP Change | POP Density e | 2020 Rank f | ||||
|---|---|---|---|---|---|---|---|---|---|---|---|---|---|
| 2020 | 2011–2020 | % | 2020 | 2011–2020 b | % c | 2011–2020 | 2020 | 2011–2020 | % | 2020 | ISA | POP | |
| New York | 287,443 | 24,450 | 9.3 | 0.0144 | 0.0004 | 3.2 | 0.0221 | 19,942,603 | 1,108,773 | 5.9 | 13 | 1 | 1 |
| Chicago | 286,798 | 30,718 | 12 | 0.0306 | 0.0017 | 5.9 | 0.0599 | 9,364,483 | 512,482 | 5.8 | 10 | 2 | 3 |
| Los Angeles | 214,383 | 6540 | 3.1 | 0.0136 | −0.0011 | −7.8 | 0.0039 | 15,821,139 | 1,677,225 | 11.9 | 27 | 3 | 2 |
| Houston | 187,808 | 29,633 | 18.7 | 0.0372 | 0.003 | 8.7 | 0.0696 | 5,049,910 | 425,460 | 9.2 | 8 | 4 | 7 |
| Dallas | 180,665 | 23,699 | 15.1 | 0.0328 | 0.0017 | 5.4 | 0.051 | 5,510,413 | 464,241 | 9.2 | 8 | 5 | 6 |
| Detroit | 160,366 | 16,759 | 11.7 | 0.0365 | 0.0023 | 6.6 | 0.084 | 4,394,534 | 199,568 | 4.8 | 8 | 6 | 11 |
| Boston | 149,728 | 14,550 | 10.8 | 0.032 | 0.0014 | 4.7 | 0.057 | 4,679,945 | 255,372 | 5.8 | 5 | 7 | 9 |
| Atlanta | 142,000 | 19,197 | 15.6 | 0.0304 | 0.0021 | 7.3 | 0.0569 | 4,670,525 | 337,553 | 7.8 | 5 | 8 | 10 |
| Philadelphia | 135,829 | 18,745 | 16 | 0.023 | 0.0022 | 10.3 | 0.0649 | 5,893,596 | 288,779 | 5.2 | 7 | 9 | 5 |
| Phoenix | 119,920 | 19,907 | 19.9 | 0.0319 | 0.0031 | 10.6 | 0.0681 | 3,754,243 | 292,374 | 8.4 | 8 | 10 | 13 |
| Seattle | 107,658 | 6025 | 5.9 | 0.0313 | −0.0009 | −2.9 | 0.021 | 3,441,781 | 287,549 | 9.1 | 6 | 11 | 15 |
| Miami | 107,280 | 7606 | 7.6 | 0.0172 | −0.0003 | −1.6 | 0.0141 | 6,252,799 | 539,126 | 9.4 | 13 | 12 | 4 |
| Minneapolis | 105,640 | 12,550 | 13.5 | 0.0367 | 0.0023 | 6.8 | 0.0738 | 2,877,611 | 170,162 | 6.3 | 6 | 13 | 16 |
| St. Louis | 89,731 | 11,694 | 15 | 0.0376 | 0.0029 | 8.4 | 0.0862 | 2,383,889 | 135,629 | 6 | 5 | 14 | 19 |
| DC | 84,255 | 7741 | 10.1 | 0.0177 | 0.0004 | 2.5 | 0.0236 | 4,756,814 | 327,714 | 7.4 | 8 | 15 | 8 |
| Pittsburgh | 76,850 | 15,331 | 24.9 | 0.0377 | 0.0061 | 19.4 | 0.1713 | 2,040,523 | 89,478 | 4.6 | 4 | 16 | 20 |
| San Diego | 73,536 | 2844 | 4 | 0.0202 | −0.0016 | −7.2 | 0.0073 | 3,648,960 | 391,950 | 12 | 11 | 17 | 14 |
| Denver | 71,003 | 7531 | 11.9 | 0.0288 | 0.0012 | 4.2 | 0.0447 | 2,467,825 | 168,529 | 7.3 | 8 | 18 | 18 |
| Tampa | 69,539 | 6513 | 10.3 | 0.0257 | 0.0002 | 0.8 | 0.028 | 2,701,944 | 232,993 | 9.4 | 6 | 19 | 17 |
| Portland | 67,721 | 2537 | 3.9 | 0.0335 | −0.0015 | −4.2 | 0.0162 | 2,020,575 | 156,629 | 8.4 | 7 | 20 | 21 |
| Columbus | 65,528 | 19,852 | 43.5 | 0.0505 | 0.0137 | 37.2 | 0.3479 | 1,297,635 | 57,054 | 4.6 | 5 | 21 | 25 |
| Cleveland | 65,290 | 10,119 | 18.3 | 0.0329 | 0.0038 | 13.1 | 0.116 | 1,984,747 | 87,255 | 4.6 | 5 | 22 | 22 |
| Indianapolis | 65,233 | 12,778 | 24.4 | 0.0452 | 0.0069 | 18.1 | 0.177 | 1,442,028 | 72,206 | 5.3 | 4 | 23 | 24 |
| Kansas City | 63,045 | 5820 | 10.2 | 0.0398 | 0.0014 | 3.6 | 0.0619 | 1,582,855 | 94,024 | 6.3 | 5 | 24 | 23 |
| San Francisco | 57,248 | 885 | 1.6 | 0.0137 | −0.0014 | −9.2 | 0.002 | 4,187,144 | 443,901 | 11.9 | 14 | 25 | 12 |
a ISA/Population (ha/person). b (ISA2020/Pop2020)-(ISA2011/Pop2011). (ha/capita). c ((ISA2020/Pop2020)-(ISA2011/Pop2011))/(ISA2011/Pop2011). (% of 2011 ISA/capita). d (ISA2020-ISA2011)/(Pop2020-Pop2011). (ha/capita). e population/area (person/ha). f the rankings reflect the total amount of 2020 ISA and the total amount of 2020 population, not change.
Table 3.
2011 and 2020 population (persons) and ISA (ha) for New York City, NY as designated by the Incorporated/Census Designated Place (yellow area in Figure 2a).
Table 3.
2011 and 2020 population (persons) and ISA (ha) for New York City, NY as designated by the Incorporated/Census Designated Place (yellow area in Figure 2a).
| 2011 | 2020 | Absolute Change 2011–2020 | Relative Change (%) | |
|---|---|---|---|---|
| Population | 8,184,804 | 8,638,073 | 453,269 | 5.5 |
| ISA | 58,178 | 60,572 | 2394 | 4.1 |
| ISA/Cap a | 0.0071 | 0.0070 | −0.0001 | −1.3 |
| Population Density b | 70 | 74 | 4 | 5.7 |
a ISA/Population (ha/person). b Population/area (person/ha).
Table 4.
2011 and 2020 population (persons) and ISA (ha) for the city of Los Angeles as designated by the Incorporated/Census Designated Place (yellow area in Figure 2b).
Table 4.
2011 and 2020 population (persons) and ISA (ha) for the city of Los Angeles as designated by the Incorporated/Census Designated Place (yellow area in Figure 2b).
| 2011 | 2020 | Absolute Change 2011–2020 | Relative Change (%) | |
|---|---|---|---|---|
| Population | 4,608,615 | 5,155,105 | 546,490 | 11.9 |
| ISA | 49,611 | 50,985 | 1374 | 2.8 |
| ISA/Cap a | 0.0108 | 0.0099 | −0.0009 | −8.1 |
| Population Density b | 34 | 36 | 2 | 5.9 |
a ISA/Population (ha/person). b Population/area (person/ha).
Table 5.
2011 and 2020 population (persons) and ISA (ha) for the city of Houston, TX as designated by the Incorporated/Census Designated Place (yellow area in Figure 2c).
Table 5.
2011 and 2020 population (persons) and ISA (ha) for the city of Houston, TX as designated by the Incorporated/Census Designated Place (yellow area in Figure 2c).
| 2011 | 2020 | Absolute Change 2011–2020 | Relative Change (%) | |
|---|---|---|---|---|
| Population | 2,445,187 | 2,670,107 | 224,920 | 9.2 |
| ISA | 69,817 | 77,515 | 7698 | 11.0 |
| ISA/Cap a | 0.0286 | 0.0290 | 0.0005 | 1.7 |
| Population Density b | 15 | 17 | 0.0342 | 13.3 |
a ISA/Population (ha/person). b Population/area (person/ha).
Table 6.
2011 and 2020 population (persons) and ISA (ha) for the city of Miami, FL as designated by the Incorporated/Census Designated Place (yellow area in Figure 2d).
Table 6.
2011 and 2020 population (persons) and ISA (ha) for the city of Miami, FL as designated by the Incorporated/Census Designated Place (yellow area in Figure 2d).
| 2011 | 2020 | Absolute Change 2011–2020 | Relative Change (%) | |
|---|---|---|---|---|
| Population | 277,336 | 303,507 | 26,171 | 9.4 |
| ISA | 5057 | 5209 | 151 | 3.0 |
| ISA/Cap a | 0.0182 | 0.0172 | −0.0011 | −5.9 |
| Population Density b | 28 | 30 | 2 | 7.1 |
a ISA/Population (ha/person). b Population/area (person/ha).
Table 7.
2011 and 2020 population (persons) and ISA (ha) results for Chicago, IL as designated by the Incorporated/Census Designated Place (yellow area in Figure 2e).
Table 7.
2011 and 2020 population (persons) and ISA (ha) results for Chicago, IL as designated by the Incorporated/Census Designated Place (yellow area in Figure 2e).
| 2011 | 2020 | Absolute Change 2011–2020 | Relative Change (%) | |
|---|---|---|---|---|
| Population | 3,008,748 | 3,184,005 | 175,257 | 5.8 |
| ISA | 43,858 | 45,353 | 1495 | 3.4 |
| ISA/Cap a | 0.0146 | 0.0142 | −0.0003 | −2.3 |
| Population Density b | 40 | 42 | 2 | 5 |
a ISA/Population (ha/person). b Population/area (person/ha).
Table 8.
2011 to 2020 change in ISA and population in urban core, suburban and rural areas.
| CITY | ISA Change (ha) 2011–2020 | Population Change (Persons) 2011–2020 | ||||
|---|---|---|---|---|---|---|
| Urban Core | Suburban | Rural | Urban Core | Suburban | Rural | |
| Chicago | 2,610,514 | 3,677,671 | 745,445 | 405,403 | 95,060 | 26,507 |
| Houston | 2,125,640 | 2,445,054 | 291,316 | 331,564 | 105,970 | 25,804 |
| Los Angeles | 702,157 | 524,742 | 185,890 | 1,381,802 | 381,060 | 81,820 |
| Miami | 353,989 | 357,465 | 6884 | 381,405 | 157,425 | 4764 |
| New York | 799,066 | 1,489,694 | 931,347 | 668,394 | 298,056 | 85,951 |
Table 9.
2001, 2011, and 2020 CMG-based population (persons) and ISA (ha) results for (a) Des Moines, IA and (b) Lewes, DE as designated by the Incorporated/Census Designated Places.
Table 9.
2001, 2011, and 2020 CMG-based population (persons) and ISA (ha) results for (a) Des Moines, IA and (b) Lewes, DE as designated by the Incorporated/Census Designated Places.
| (a) | 2001 | 2011 | 2020 | 2001–2011 | % | 2011–2020 | % | |
| Population | 214,442 | 220,014 | 230,502 | Population Change | 5572 | 2.6 | 10,488 | 4.8 |
| ISA | 8320 | 9154 | 10,655 | ISA Change | 834 | 10.0 | 1500 | 16.4 |
| ISA/Cap b | 10,655 | 0.0416 | 0.0462 | ISA/Cap Change c | 0.0028 | 7.2 | 0.0046 | 11.1 |
| Population Density a | 6 | 6 | 7 | ISA/Cap Rate of Change d | 0.1498 | 0.1431 | ||
| (b) | 2001 | 2011 | 2020 | 2001–2011 | % | 2011–2020 | % | |
| Population | 2817 | 3000 | 3170 | Population Change | 183 | 6.5 | 170 | 5.7 |
| ISA | 59 | 107 | 226 | ISA Change | 47 | 80.0 | 120 | 112.3 |
| ISA/Cap b | 0.0210 | 0.0355 | 0.0714 | ISA/Cap Change c | 0.0145 | 69.0 | 0.0359 | |
| Population Density a | 1 | 1 | 1 | ISA/Cap Rate of Change d | 0.2588 | 0.7042 | 101.0 |
a Population/total area (in hectares [ha]). b ISA/Population (ha per capita). c (ISA2011/POP2011)-(ISA2001/POP2001); (ISA2020/POP2020)-(ISA2011/POP2011); ha per capita. d (ISA2011-ISA2001)/(POP2011-POP2001); (ISA2020-ISA2011)/(POP2020-POP2011); ha per capita.
Table 10.
2011 and 2020 CMG-based population (persons) and ISA (ha) results for top five states in terms of greatest population and largest ISA.
Table 10.
2011 and 2020 CMG-based population (persons) and ISA (ha) results for top five states in terms of greatest population and largest ISA.
| STATE | 2011 POP | 2020 POP | 2011 ISA (ha) | 2020 ISA (ha) | 2011 ISA/CAP a | 2020 ISA/CAP a |
|---|---|---|---|---|---|---|
| CA | 40,773,397 | 45,639,563 | 852,609 | 907,498 | 0.021 | 0.020 |
| TX | 24,513,263 | 26,798,105 | 840,430 | 980,132 | 0.034 | 0.037 |
| NY | 19,222,036 | 20,285,126 | 326,010 | 375,630 | 0.017 | 0.019 |
| FL | 18,390,578 | 20,128,012 | 473,385 | 535,980 | 0.026 | 0.027 |
| IL | 13,066,629 | 13,830,333 | 519,429 | 571,332 | 0.040 | 0.041 |
a ISA/Population (ha per person).
Table 11.
Continental United States (CONUS) total ISA (ha), ISA per capita (ha/person), and ISA fraction of the CONUS (%) for 2011 and 2020. The total CONUS area is estimated at 815,157,499 ha. The ISA, population, and area estimates were derived by summing all CMG-based values within the CONUS boundary using the zonal statistics function in ArcGIS.
| Year | ISA | ISA/Cap | ISA Fraction of CONUS |
|---|---|---|---|
| 2011 | 9,275,987.09 | 0.0303 | 1.14 |
| 2020 | 10,691,267.33 | 0.0322 | 1.31 |
© 2018 by the authors. Licensee MDPI, Basel, Switzerland. This article is an open access article distributed under the terms and conditions of the Creative Commons Attribution (CC BY) license (http://creativecommons.org/licenses/by/4.0/).
Share and Cite
MDPI and ACS Style
Bounoua, L.; Nigro, J.; Thome, K.; Zhang, P.; Fathi, N.; Lachir, A. A Method for Mapping Future Urbanization in the United States. Urban Sci. 2018, 2, 40. https://0-doi-org.brum.beds.ac.uk/10.3390/urbansci2020040
AMA Style
Bounoua L, Nigro J, Thome K, Zhang P, Fathi N, Lachir A. A Method for Mapping Future Urbanization in the United States. Urban Science. 2018; 2(2):40. https://0-doi-org.brum.beds.ac.uk/10.3390/urbansci2020040
Chicago/Turabian StyleBounoua, Lahouari, Joseph Nigro, Kurtis Thome, Ping Zhang, Najlaa Fathi, and Asia Lachir. 2018. "A Method for Mapping Future Urbanization in the United States" Urban Science 2, no. 2: 40. https://0-doi-org.brum.beds.ac.uk/10.3390/urbansci2020040