Trends in Taxi Use and the Advent of Ridehailing, 1995–2017: Evidence from the US National Household Travel Survey


School of Geographical Sciences and Urban Planning, Arizona State University, Coor Hall, 975 S. Myrtle Ave, 5th Floor, Tempe, AZ 85281 USA
*
Author to whom correspondence should be addressed.
Urban Sci. 2018, 2(3), 79; https://0-doi-org.brum.beds.ac.uk/10.3390/urbansci2030079
Submission received: 8 August 2018
/
Revised: 22 August 2018
/
Accepted: 24 August 2018
/
Published: 28 August 2018
Abstract
:The advent of ridehailing services such as Uber and Lyft has expanded for-hire vehicle travel. We use data from the 2017 National Household Travel Survey (NHTS) to investigate the extent of this expansion in the United States. We report changes in the for-hire vehicle market since ridehailing services became available and statistically estimate the determinants of ridehailing use. From 2009–2017, the for-hire vehicle market share doubled. While for-hire vehicles still only account for 0.5% of all trips, the percent of all Americans who use ridehailing in any given month is nearly 10%. Within the for-hire vehicle market, this trend of growth has not been uniformly distributed across demographic groups or geographies; it has been greater in mid-sized and large cities, and among younger individuals and wealthier households. This suggests that understanding the equity implications of ridehailing is an important avenue for research. Multivariate analysis provides evidence that both transit and nonmotorized transport use are correlated with ridehailing use, that ridehailing has a negative relationship with vehicle ownership, and that residents of denser areas have higher ridehailing use. Given the rapid growth of ridehailing, it has become important for cities to include for-hire vehicles in their planning going forward. These NHTS data provide a starting point, but more detailed and frequent data collection is needed to fully understand this many-faceted, rapidly-changing market.
1. Introduction
Since 2010, smartphone-enabled taxi-type services have proliferated. The advent of these “ridehailing” services, such as Uber and Lyft in the United States, has precipitated dramatic growth in travel via for-hire vehicles. Billions of dollars have gone into the development of these app-based ridehailing services, recruiting drivers, and attracting passengers, leading to an impressive market penetration in less than ten years.
Ridehailing services have been characterized as transformative, disruptive, and perhaps revolutionary to our transportation system (e.g., refs. [1,2,3,4,5,6]). Shaheen [5] sees ridehailing and other shared mobility services as disruptors to the US status quo of private vehicle ownership. Nicks [2] argues that ridehailing’s ubiquity in smaller metropolitan areas is particularly transformative, as taxi availability in those locations was minimal prior to the introduction of ridehailing. Tilleman [6] suggests that automakers may find vastly different business models, providing mobility services rather than selling personal vehicles. These characterizations are not without critique and some are speculative, as data to assess how the market is changing has been scarce.
This research contributes to the nascent academic literature on ridehailing by using a large national travel survey to explore how ridehailing has changed the for-hire vehicle market and to estimate statistically the determinants of ridehailing use. The 2017 US National Household Travel Survey (NHTS) asked several questions about ridehailing and for-hire vehicle use. To our knowledge, this is the first large, nationally representative survey to ask about ridehailing use in the United States. These data allow us to report nationally representative statistics on the use of ridehailing, and to statistically explore individual-level determinants of ridehailing adoption.
Because the NHTS and its predecessor, the Nationwide Personal Transportation Survey (NPTS), have been conducted periodically over the last several decades, we can also analyze trends in the use of for-hire vehicles. The popular ridehailing service Uber was launched in 2010 (as UberCab), and its low-cost UberX option using personal cars was launched in 2013 [5]. The ridehailing service Lyft launched in 2012 [5]. In the years since, many other firms have entered the market [7,8]. The most recent NHTS was conducted in 2017, well after the introduction of ridehailing services, while the previous survey was in 2009. This fortuitous timing aligns well with the introduction of ridehailing, allowing a clean comparison of US travel patterns with and without ridehailing.
The NHTS data show that use of for-hire vehicles has doubled since 2009, but their overall share of travel remains small at around 0.5%. The market penetration of ridehailing services, however, is much larger; approximately 10% of Americans have used one of these services in the last month. We also find a significant broadening of the geography of for-hire vehicle use from 2009 to 2017, with substantial growth outside of large cities.
The analysis presented herein indicates that there are significant demographic determinants of ridehailing, with higher income and younger adults more likely to use these services. The built environment is also significant; individuals residing in denser locations and larger metropolitan areas are more likely to use ridehailing.
The analysis also provides evidence of the extent to which ridehailing complements and substitutes for other transport modes. Households with more vehicles tend to use ridehailing less, suggesting a substitution effect. Conversely, respondents who use public transit more, walk more, or bike more all use ridehailing more, suggesting a complementary relationship.
The paper proceeds to review the literature on ridehailing and taxi use and then presents results based on the NHTS data. This is followed by a discussion of policy implications. We conclude with a call for improved ridehailing data collection and suggested directions for future research.
2. Background
We use the term “ridehailing” to refer to the class of services that allow users to request a vehicle and driver using a smartphone. Common examples in the US include Uber and Lyft, but others exist. These services are also referred to as “ridesharing”, “ridesourcing”, and “transportation network companies” (TNCs). We use the term “taxi” to refer to a traditional taxicab, requested either by hailing a vehicle on the street or by a phone call to a company dispatcher. Additionally, we use the term “for-hire vehicle” to refer to taxis, ridehailing, and other vehicles (e.g., limousine/“black cab” service) that can be hired for passenger service on a per-trip or per-hour basis, are provided with a driver, and do not follow a fixed route or schedule.
Ridehailing is similar to the traditional taxicab with the following key differences: (1) the service is contracted and paid for using a smartphone app, rather than a street-hail or phone call to a company dispatcher [5] (p. 58); (2) ridehailing vehicles are usually privately-owned “regular” cars and vans without specialized markings [5] (pp. 58–59); and (3) ridehailing services are more loosely regulated than taxis. The first difference means that ridehailing may present equity challenges; some populations do not have smartphone access and/or the ability to make electronic payments. The third difference is also important; taxicab services are often heavily regulated with caps on the number of cabs permitted in a particular city and externally-set fares [9]. In contrast, these types of regulations are generally nonexistent for ridehailing firms [10]. In August 2018, New York City temporarily capped the number of ridehail vehicles permitted by issuing a one-year freeze on new licenses to allow time to study the effects of ridehailing growth, making it the first city in the US to do so [11]. It remains to be seen whether this cap will be extended or if other cities will follow New York’s lead.
Importantly, ridehailing services are usually less expensive than traditional taxis. Sperling [4] (p. 15) estimates ridehailing prices to be between $1.25 and $2.25 per passenger mile, and substantially less for shared ridehailing services. In comparison, taxicab rates in Phoenix, AZ are $2.20 per mile [12]; in Washington, DC, USA, $2.16 per mile [13]; in New York City, $2.50 per mile [14]; and in Kansas City, $2.10 per mile [15], with a variety of additional fees added to each trip.
Prior research has presented evidence on how ridehailing has affected the overall growth of the for-hire vehicle industry, and how that growth has been distributed across geographies and sociodemographic groups. Schaller [16] reported that for-hire vehicle ridership increased by 140% between 2012 and 2017. Using detailed trip-level data, Schneider [17] documented the swift rise of ridehailing in New York City; as of February 2017, ridehailing companies serve more trips in New York than taxis do, and the difference is especially pronounced in the outer boroughs [17,18]. Built environment characteristics are also important, with more ridehailing use in denser areas [19].
Smaller-scale surveys of ridehailing users have found that ridehailing users tend to be younger than the general population [20,21]. Race has been inconsistently associated with ridehailing; Clewlow and Mishra [21] found that African-Americans use ridehailing more than other racial or ethnic groups. Brown [22] found that majority-White areas had higher use than their populations would predict, while Lavieri et al. [19] found the opposite. There are mixed results regarding the relationship between income and ridehailing as well. Several authors have found that low-income individuals are underrepresented among ridehailing users overall [20,21], but Brown [22] found that ridehailing users living in low-income areas make more trips than those in high-income areas.
Scholars have also investigated how ridehailing interacts with other modes. There is mixed evidence on whether ridehailing competes with or complements public transportation. Surveys have shown that many ridehailing trips would otherwise be taken by transit [20], and new users of ridehailing decrease their transit use [21]. Babar and Burtch [23] found when Uber entered a market, ridership on rail increased, while ridership on buses declined. This decline was less in cities with higher quality transit. One study found that a higher density of transit stops was associated with increased ridehailing use [22], while another found that higher transit frequency was associated with decreased ridehailing use [19].
Sustainable transportation advocates have suggested that ridehailing can provide accessibility without vehicle ownership, potentially changing America’s longstanding model of car ownership [5,6]. Hampshire et al. [24] found that 9% of ridehailing users responding to a survey in Austin, Texas purchased a vehicle in response to a suspension of ridehailing service, suggesting that ridehailing was substituting for vehicle ownership. Clewlow and Mishra [21] found that 9% of ridehailing users had shed a car since beginning to use ridehailing. These numbers seem quite large, but research has shown that transitions in levels of household car ownership are far more common than might be expected, with 21% of households decreasing their car ownership during a two-year span (Table 2, [25]).
This research contributes to the ridehailing literature in three primary ways. First, we are able to track for-hire vehicle use over time using multiple waves of the NHTS. Second, we use a large, nationally-representative sample to statistically estimate relationships between sociodemographics, other transport modes, the built environment, and ridehailing. Third, the NHTS allows us to produce confidence intervals for our estimates, demonstrating that our estimated relationships are statistically robust.
3. Data and Methods
The NHTS is a large, nationally-representative travel survey. The 2017 NHTS surveyed 264,234 individuals aged 5 and up in 129,696 households, recording a large number of sociodemographic characteristics and habitual travel patterns, together with a 24-h travel diary. It is a two-part survey with an initial recruitment survey sent out and returned by mail with the follow up “retrieval” survey—which contains the bulk of the questions—conducted either online or by phone. The retrieval survey includes a travel diary portion, asking respondents to report all their trips on a previously-assigned day. The data were collected between March of 2016 and May of 2017 [26].
The 2017 NHTS included two questions that related to ridehailing. The first was part of the travel diary, where ridehailing was included with taxis as an option that respondents could select to indicate their transport mode on a reported trip in 2017. It is this question that we used to compare the 2017 data to previous iterations of the NHTS, since the survey has included “taxicab” (or similar) as a transport mode option since 1995 (prior to 1995, “taxicab” was reported as a separate mode only for business trips). Notably, the 2017 NHTS did not ask respondents to specify whether a for-hire vehicle trip was made by taxi or ridehailing service. Thus, we used responses to this question to understand trends over time in for-hire vehicle use, without examining ridehailing and taxis separately. The NHTS retrieval instrument refers specifically to Uber and Lyft [27], so trips using other ridehailing companies may be underreported.
The second relevant question for this study asked respondents how many ridehailing trips they had taken in the last 30 days, not including taxi trips. Responses to this question were used here to quantify the prevalence and geography of ridehailing use in 2017, the demographics of users, and as the dependent variable in a multivariate analysis of the correlates of ridehailing. Since this question is new to the 2017 NHTS and is not at the trip level, it cannot be used for the analysis of trends or multimodality; it is used to understand the demographics and built-environment determinants of ridehailing use. This question was only asked of respondents aged 16 or older.
A caveat to the trends presented in this article is that the NHTS sampling frame changed from a landline telephone-based sample to an address-based sample in 2017 [26,28], meaning that cell phone-only households were excluded from the 2009 survey. To the extent that exclusive cell phone use was correlated with for-hire vehicle use in 2009, some of the changes observed here may be due to this change rather than due to actual changes in travel behavior.
Two forms of statistical analysis were used: simple descriptive statistics based on distributions of demographic characteristics among users of various services and logistic regression for multivariate analysis. The NHTS provides weights to attempt to correct for sampling bias and nonresponse. These weights were used in all descriptive statistics. When data needed for the calculation of a descriptive statistic was missing, the statistic was estimated on the nonmissing data; no imputation or editing was done, except for that done by the NHTS prior to data release. Raw age rather than imputed age was used in the calculations, because imputed age was not available in the 2017 NHTS Version 1 used for this analysis. Less than 0.2% of respondents had missing ages. Data were processed and descriptive statistics were estimated in Python 3.6. The logistic regression was estimated using Stata 15.1.
For the trend analysis, for-hire vehicle use was assessed using the following trip modes from the NHTS, as stored in the travel mode (TRPTRANS) variable. For 1995, the “Taxicab” mode (code 15) was used; for 2001, the “Taxicab” and “Limousine” modes (codes 22 and 23) were used; for 2009, the “Taxicab” mode (code 19) was used; and in 2017, the “Taxi/Limo (including Uber/Lyft)” mode (code 17) was used. There was not a separate limousine mode in any year except for 2001. Given the flatness of the trends in for-hire vehicle use from 1995 to 2009 (Figure 1), limousines were likely de facto included in the taxicab mode in other years.
Standard errors for descriptive statistics were estimated using replicate weights, which are available for the 2001, 2009, and 2017 NHTS waves. The 1995 NPTS had no replicate weights, and thus, standard errors for that survey year were not computed. Replicate weights work by having many different weights for each individual, each computed using a different subset of the data. By computing the same estimate using different weights, a sampling distribution and thus, a standard error, can be derived [26,28,29]. To convert these standard errors to 95% confidence intervals, they were simply multiplied by 1.96, and the resulting value was added and subtracted from the point estimate to create a confidence interval under the assumption that the sampling distribution of each estimate was approximately normal. All confidence intervals presented in this article are 95%.
Our logistic regression model was fit using Stata’s logit command. Since there were multiple respondents to the NHTS in each household, a clustered variance-covariance estimator was used [30] (pp. 323–326), with clusters based on household. The public transit count variable (PTUSED) was altered before inclusion in the model. It indicates the number of days that public transit was used in the last 30 days; however, there were a number of data points for this variable that were above 30. These cases were top-coded and assumed to be 30.
The model was fit without using the survey weights provided by the NHTS. While weights are clearly needed for descriptive statistics, they are not needed if the sampling (both the sampling plan and the nonresponse) is endogenous—i.e., not correlated with the model’s error term [31]. We have a broad array of covariates in our model, including many of those used to develop the NHTS weights [32], and thus, we believe this to be approximately true. In addition to the variables presented in the table in Section 5, we also controlled for season and a proxy measure for the geographic strata used in the NHTS weighting [32] (p. 3). The NHTS oversampled some “add-on” areas. Some of these, such as Arizona, constituted entire states. In these cases, the proxy measure included a dummy variable for that state. Other add-on areas, such as Des Moines, are sub-state areas that the NHTS does not report separately in the public-use files. These are not controlled directly, but a dummy variable for the state containing them is controlled for. For states with no add-on areas, the Census division is controlled for.
As a check on this assumption, a weighted version of the model was fit as well. While the coefficients differ slightly, none of the conclusions of this paper are affected. The most notable difference is that the estimated effect of density is larger in the weighted version.
The model was checked for multicollinearity. The NHTS life cycle variable was excluded due to extreme collinearity with household size. A handful of the remaining variables had variance inflation factors (VIFs) exceeding 10, a common threshold for concern. However, O’Brien [33] points out that high VIFs are not, in and of themselves, problematic. Many factors can influence the variance of coefficient estimates, including multicollinearity of coefficients but also variance of independent variables and sample size. Given the large sample size in our model (over 200,000) and the relatively small coefficient confidence intervals, we do not see these VIFs as problematic.
4. Trends in For-Hire Vehicle Use
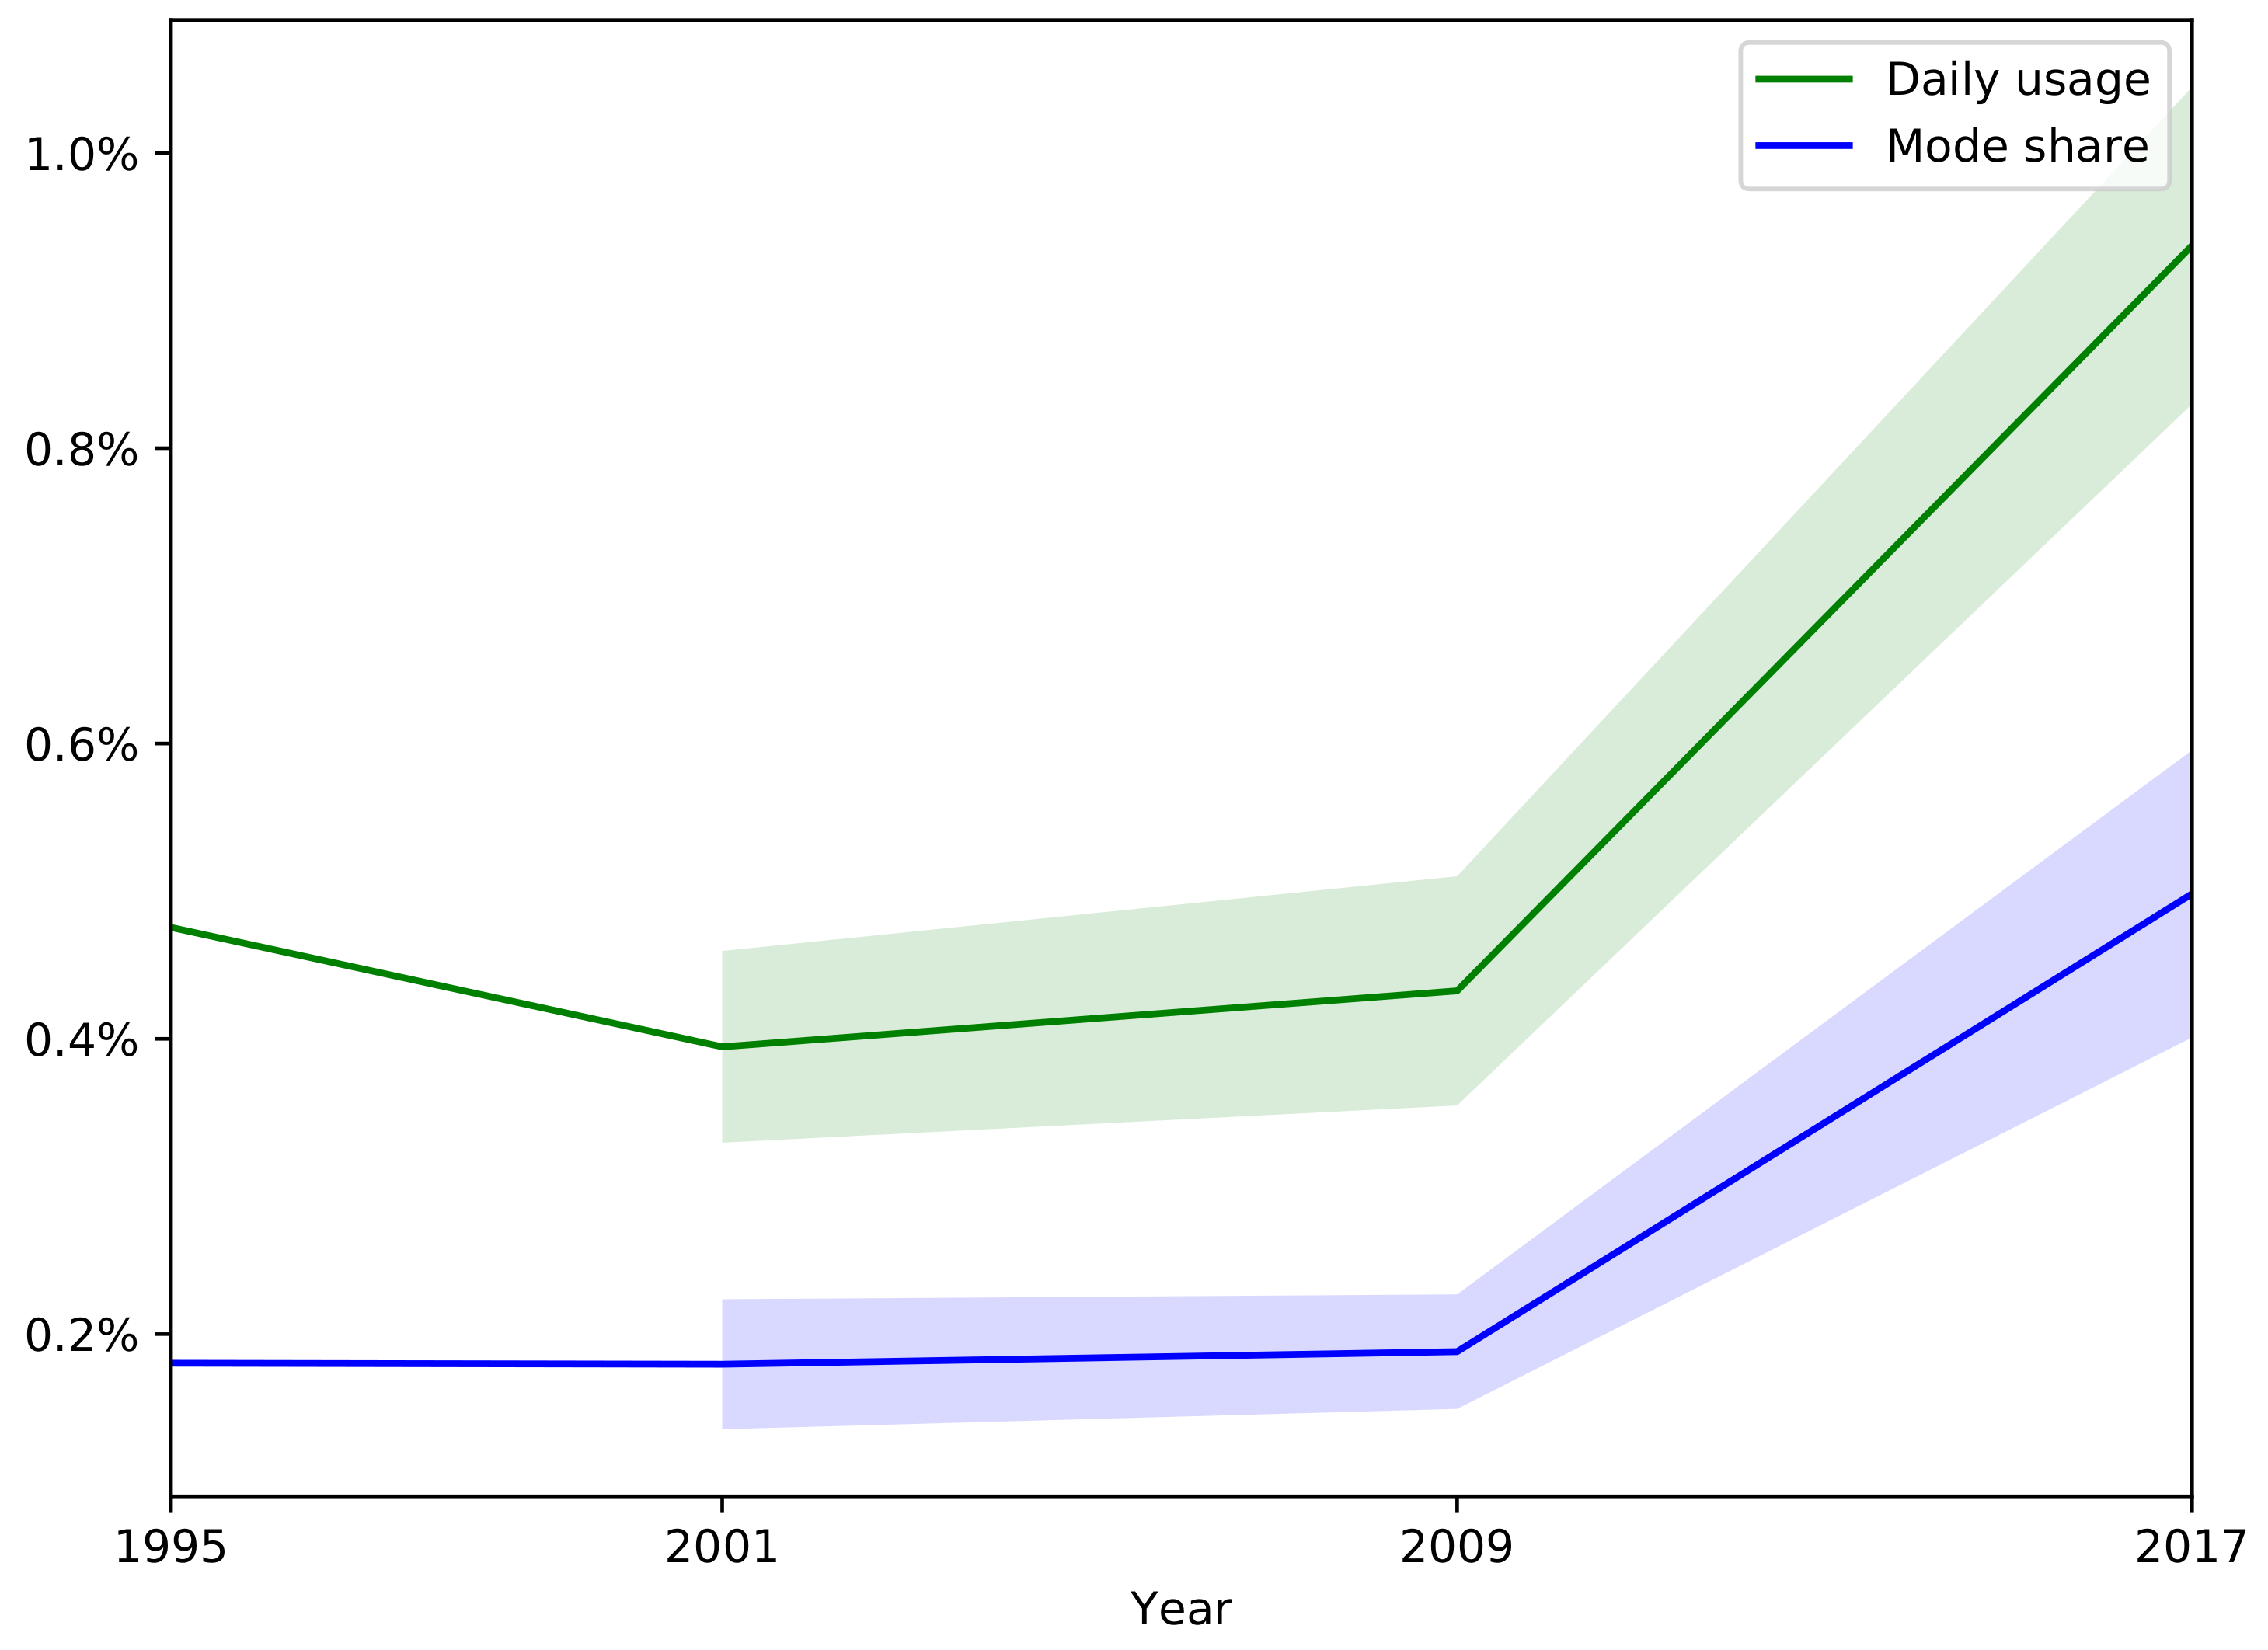
For-hire vehicle use has doubled since the 2009 NHTS. In the 2009 NHTS, of person-trips utilized for-hire vehicles; by 2017, that number had increased to . This is almost certainly due to the advent of ridehailing.
Trip mode share, however, does not tell the whole story. Even though the mode share for trips is only 0.5%, almost 1% () of Americans used for-hire vehicles for at least one trip on any given day in 2017, up from in 2009. Both of these trends are shown in Figure 1. Both trends were relatively stable prior to 2009. Since these trends were analyzed using the travel diary data, it was not possible to differentiate ridehailing and taxi use.
Even daily per-capita use does not fully represent the market penetration that ridehailing has achieved. The 2017 NHTS also asked respondents 16 years and older how many times they had used a ridehailing service specifically (i.e., not a traditional taxicab) in the last 30 days. A total of of respondents answered that they had used ridehailing at least once. This is a remarkably high market penetration given the age of these services. To put the market penetration of ridehailing in perspective, of respondents had used public transit in the last month. While this is nearly double the percentage of respondents who have used ridehailing, it is in the same order of magnitude.
These results show that there has been significant growth in for-hire vehicle use over the last decade. This growth, however, has been uneven across demographics and geographies. From a policy perspective, it is important to understand what the geographic and demographic determinants of ridehailing are, in order to better understand how these services are likely to affect urban transportation planning. These topics are explored in the sections below.
4.1. Geographic Distribution of For-Hire Vehicle Use
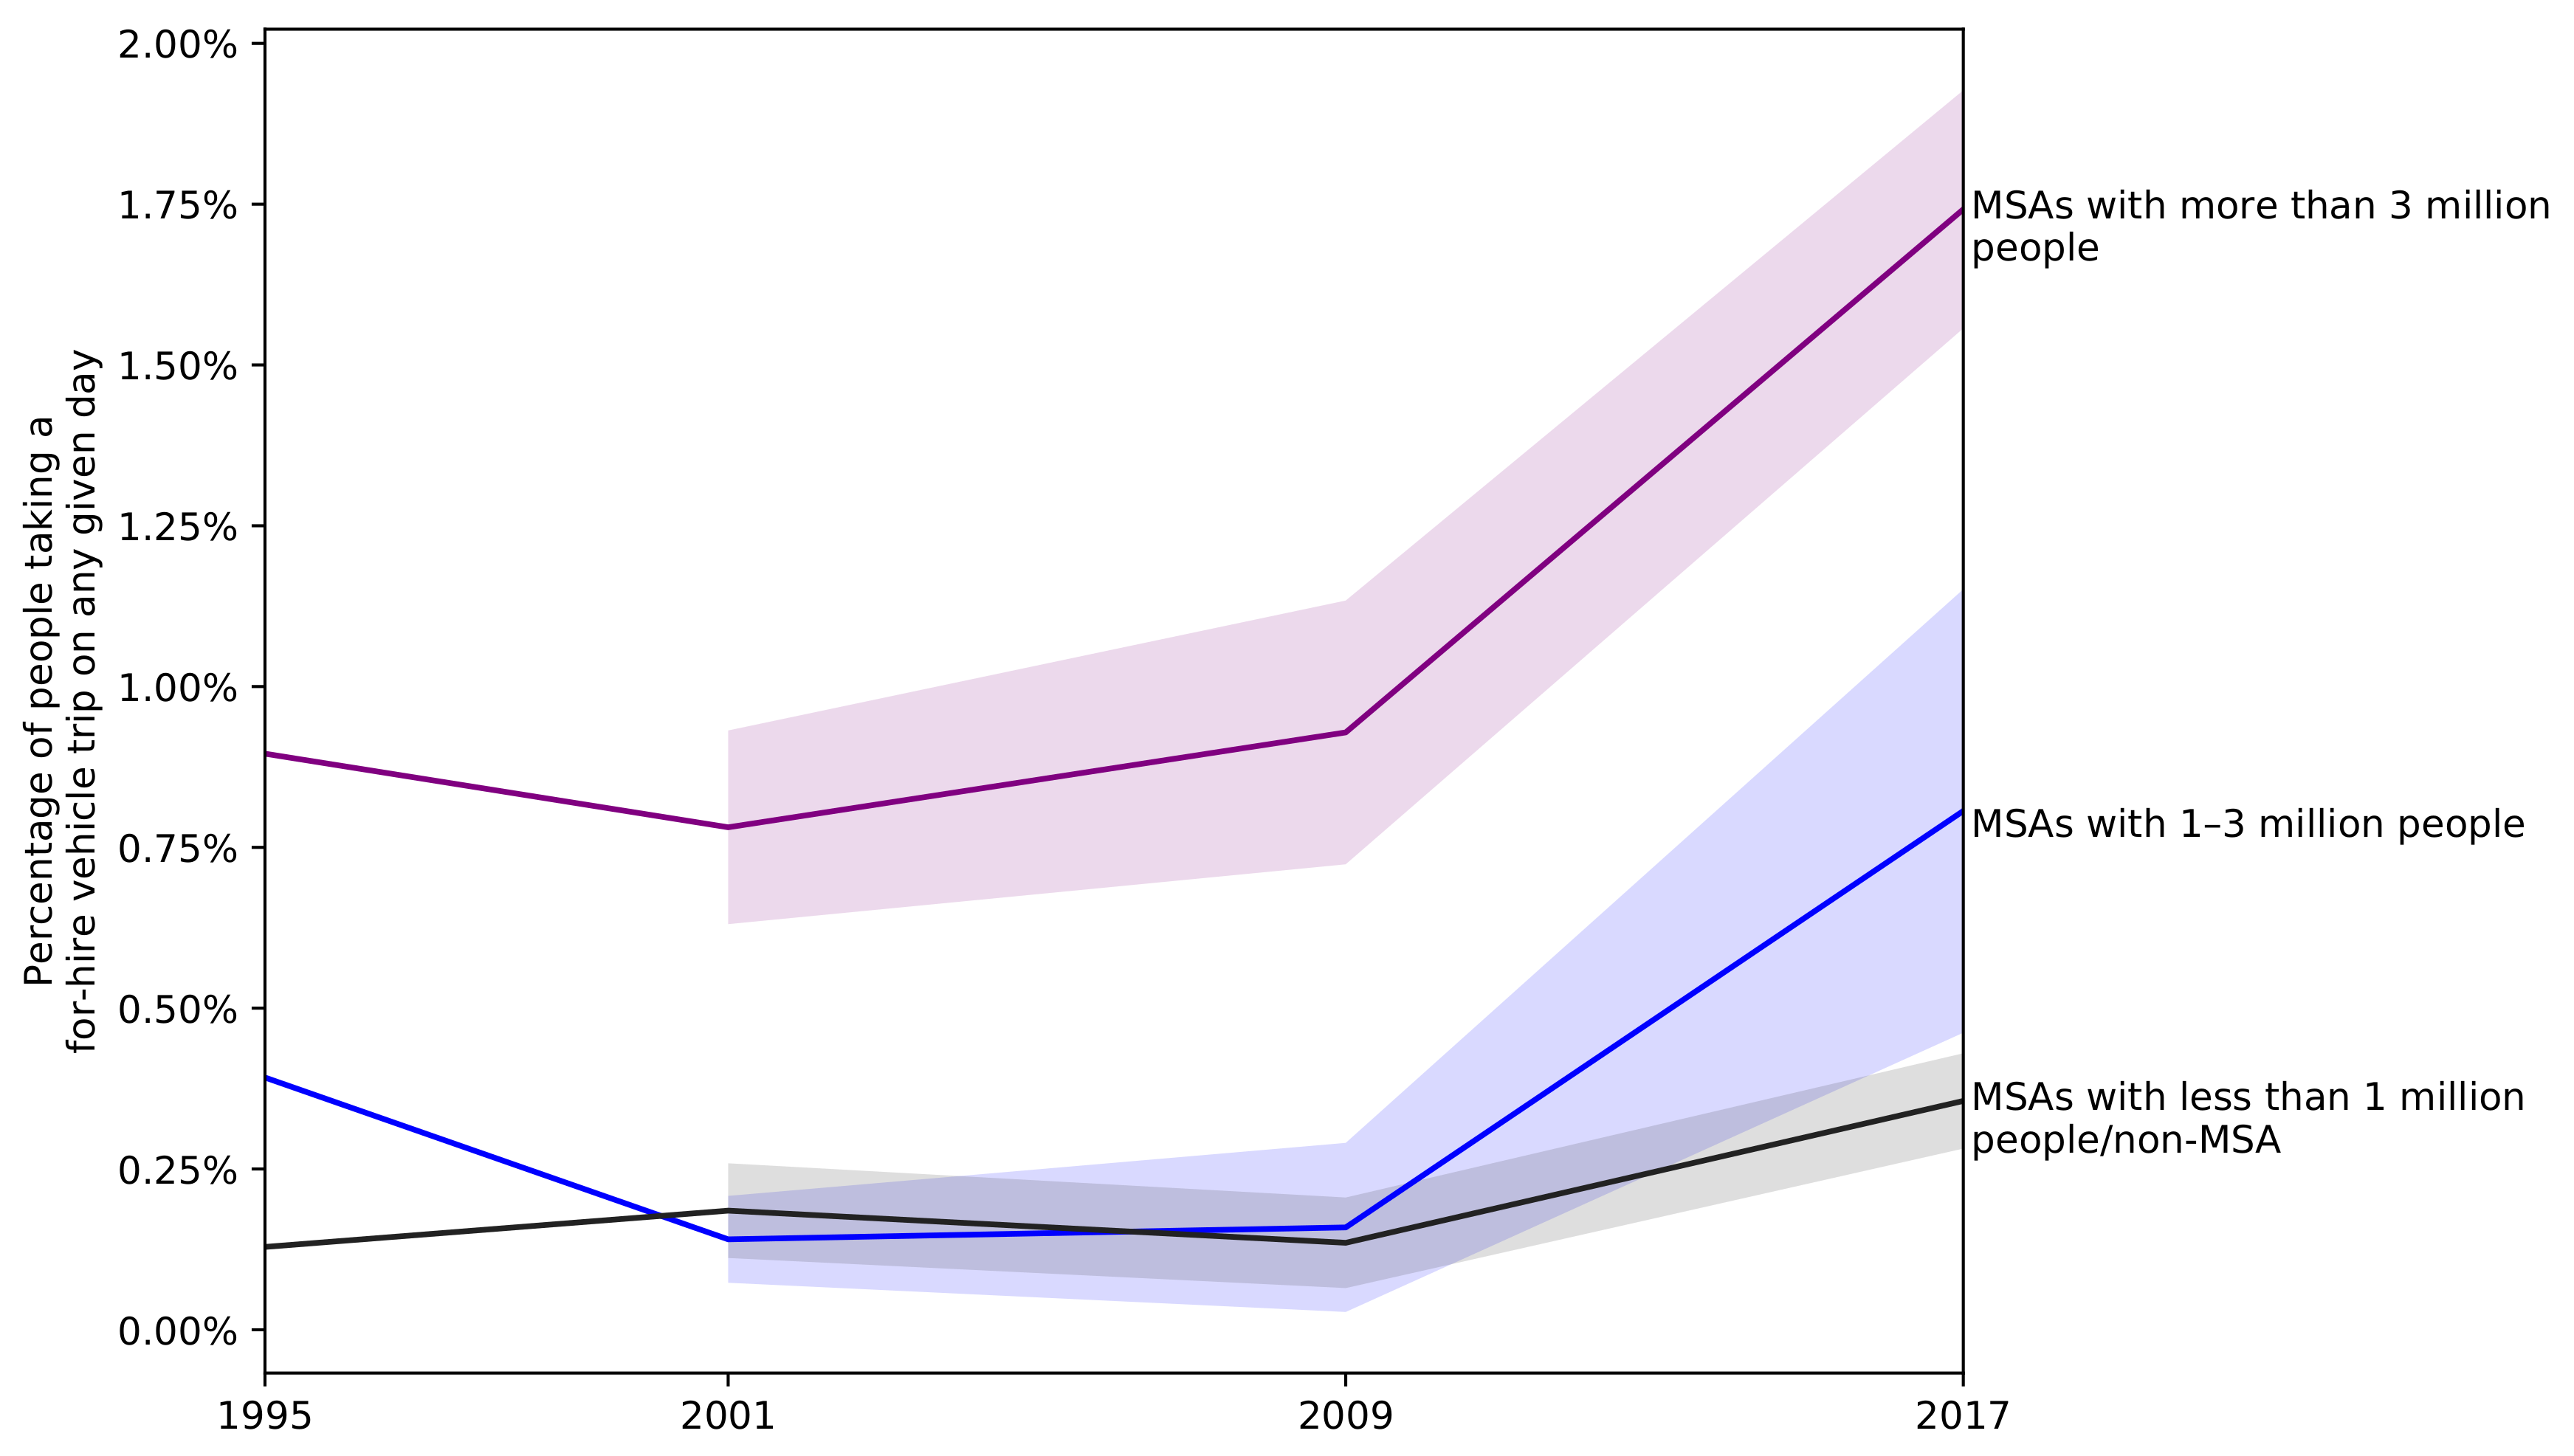
Perhaps the largest impact of the advent of ridehailing has been to make for-hire vehicles both more available and easier to hire across a much wider geographic area than was traditionally served by taxis. As described in the previous section, the use of for-hire vehicles has increased rapidly since 2009. These effects, however, have not been constant in all geographies. Figure 2 shows the change in the percentage of residents taking a for-hire vehicle trip on a given day by metropolitan area size, again using travel diary data that does not separate ridehailing from taxis. While some of these trips may not have been taken in the repondent’s home metropolitan area, a plot excluding residents who were out of town all day is nearly identical. Clearly, there has been significant growth in Census Metropolitan Statistical Areas (MSAs) of over 3 million people, but there has also been substantial growth in smaller MSAs (1–3 million), with these mid-sized MSAs approaching the level of per capita for-hire vehicle use experienced in much larger metropolitan areas in 2009.
These data provide evidence that ridehailing is bringing this useful service to a large new population that did not previously have ready access to for-hire vehicles. This change is even more evident in the fraction of for-hire vehicle users in different geographies; in 2009, of for-hire vehicle users lived in the New York City metropolitan area; by 2017, that number was only . However, these numbers should be interpreted with some caution, as there is significant heterogeneity within city size groups. For example, San Francisco and Washington, DC saw significant increases in for-hire vehicle use from 2009 to 2017, but use was relatively flat in New York, Boston, and Philadelphia.
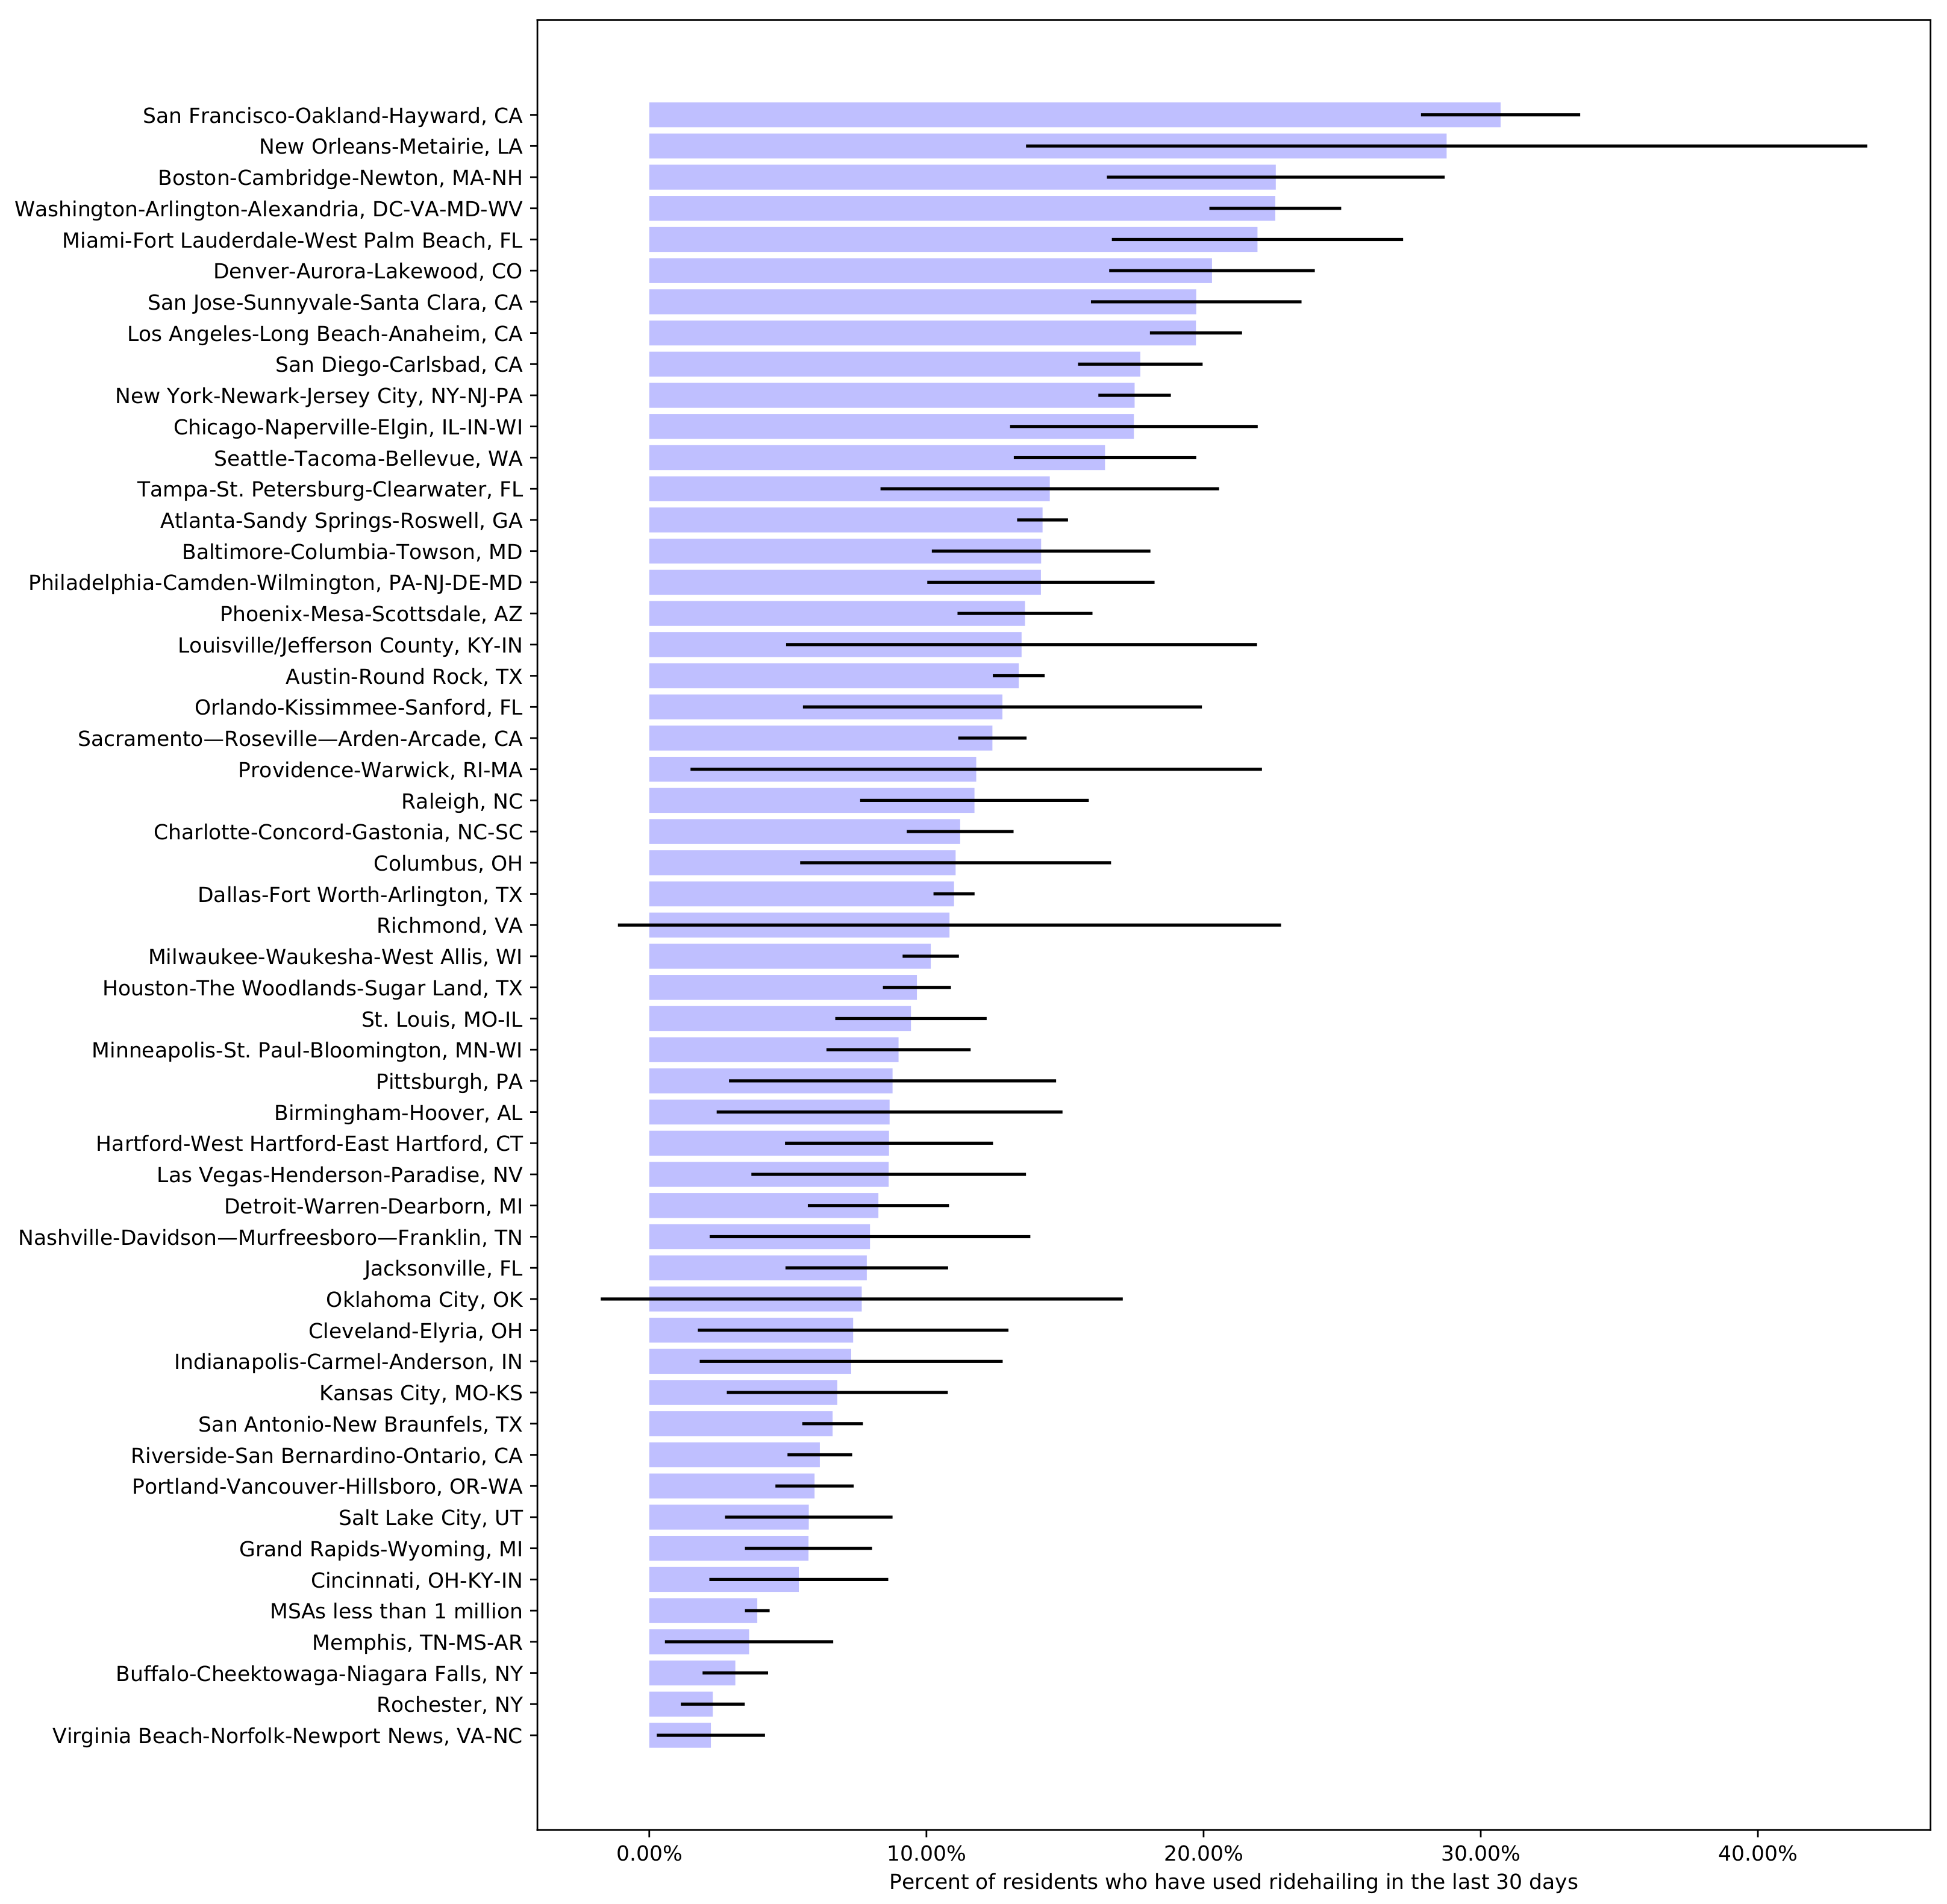
Ridehailing services have spread to many metropolitan areas across the country. Figure 3 shows the per capita use of ridehailing by Core-Based Statistical Area (CBSA, either a Metropolitan Statistical Area or Micropolitan Statistical Area [34]). This is based on the monthly usage question in the NHTS which is specific to ridehailing. The San Francisco-Oakland-Hayward, California metro area, where Uber and Lyft both launched, tops the list with of residents having used ridehailing in the last 30 days. Many of the cities at the top of this list (e.g., San Francisco, Boston, Washington, DC, New York) are older, denser, transit-oriented cities. Even in much smaller metropolitan areas, though—where taxi service was poor or non-existent prior to the advent of ridehailing—there is non-negligible market penetration.
4.2. Characteristics of For-Hire Vehicle Users
Table 1 provides a summary of ridehailing use by demographic characteristics. This table is based on the monthly usage question and thus is specific to ridehailing and does not include taxi use.
Ridehailing is disproportionately used by higher income households. Among members of households earning over $100,000 per year, had used ridehailing in the last 30 days, compared to less than 10% for all other income groups. This is not particularly surprising, as ridehailing is relatively expensive [4]; expensive goods tend to be consumed more by wealthier people.
This distribution over income does not match the income distribution in the for-hire vehicle market overall. Taxis have historically been used disproportionately by high-income households as well as low-income households, with less use by middle-income households [35,36]. This makes sense: low-income individuals are less likely to own cars, and thus taxis (or other for-hire vehicles) provide a valuable substitute when they occasionally need access to a vehicle (for instance, a large shopping trip or medical appointment). High income individuals are likely to own cars, but are less price sensitive and therefore are likely to be willing to pay the high marginal cost of a for-hire vehicle if it is more convenient than their own vehicle (for instance, when parking is difficult) [9] (p. 111f).
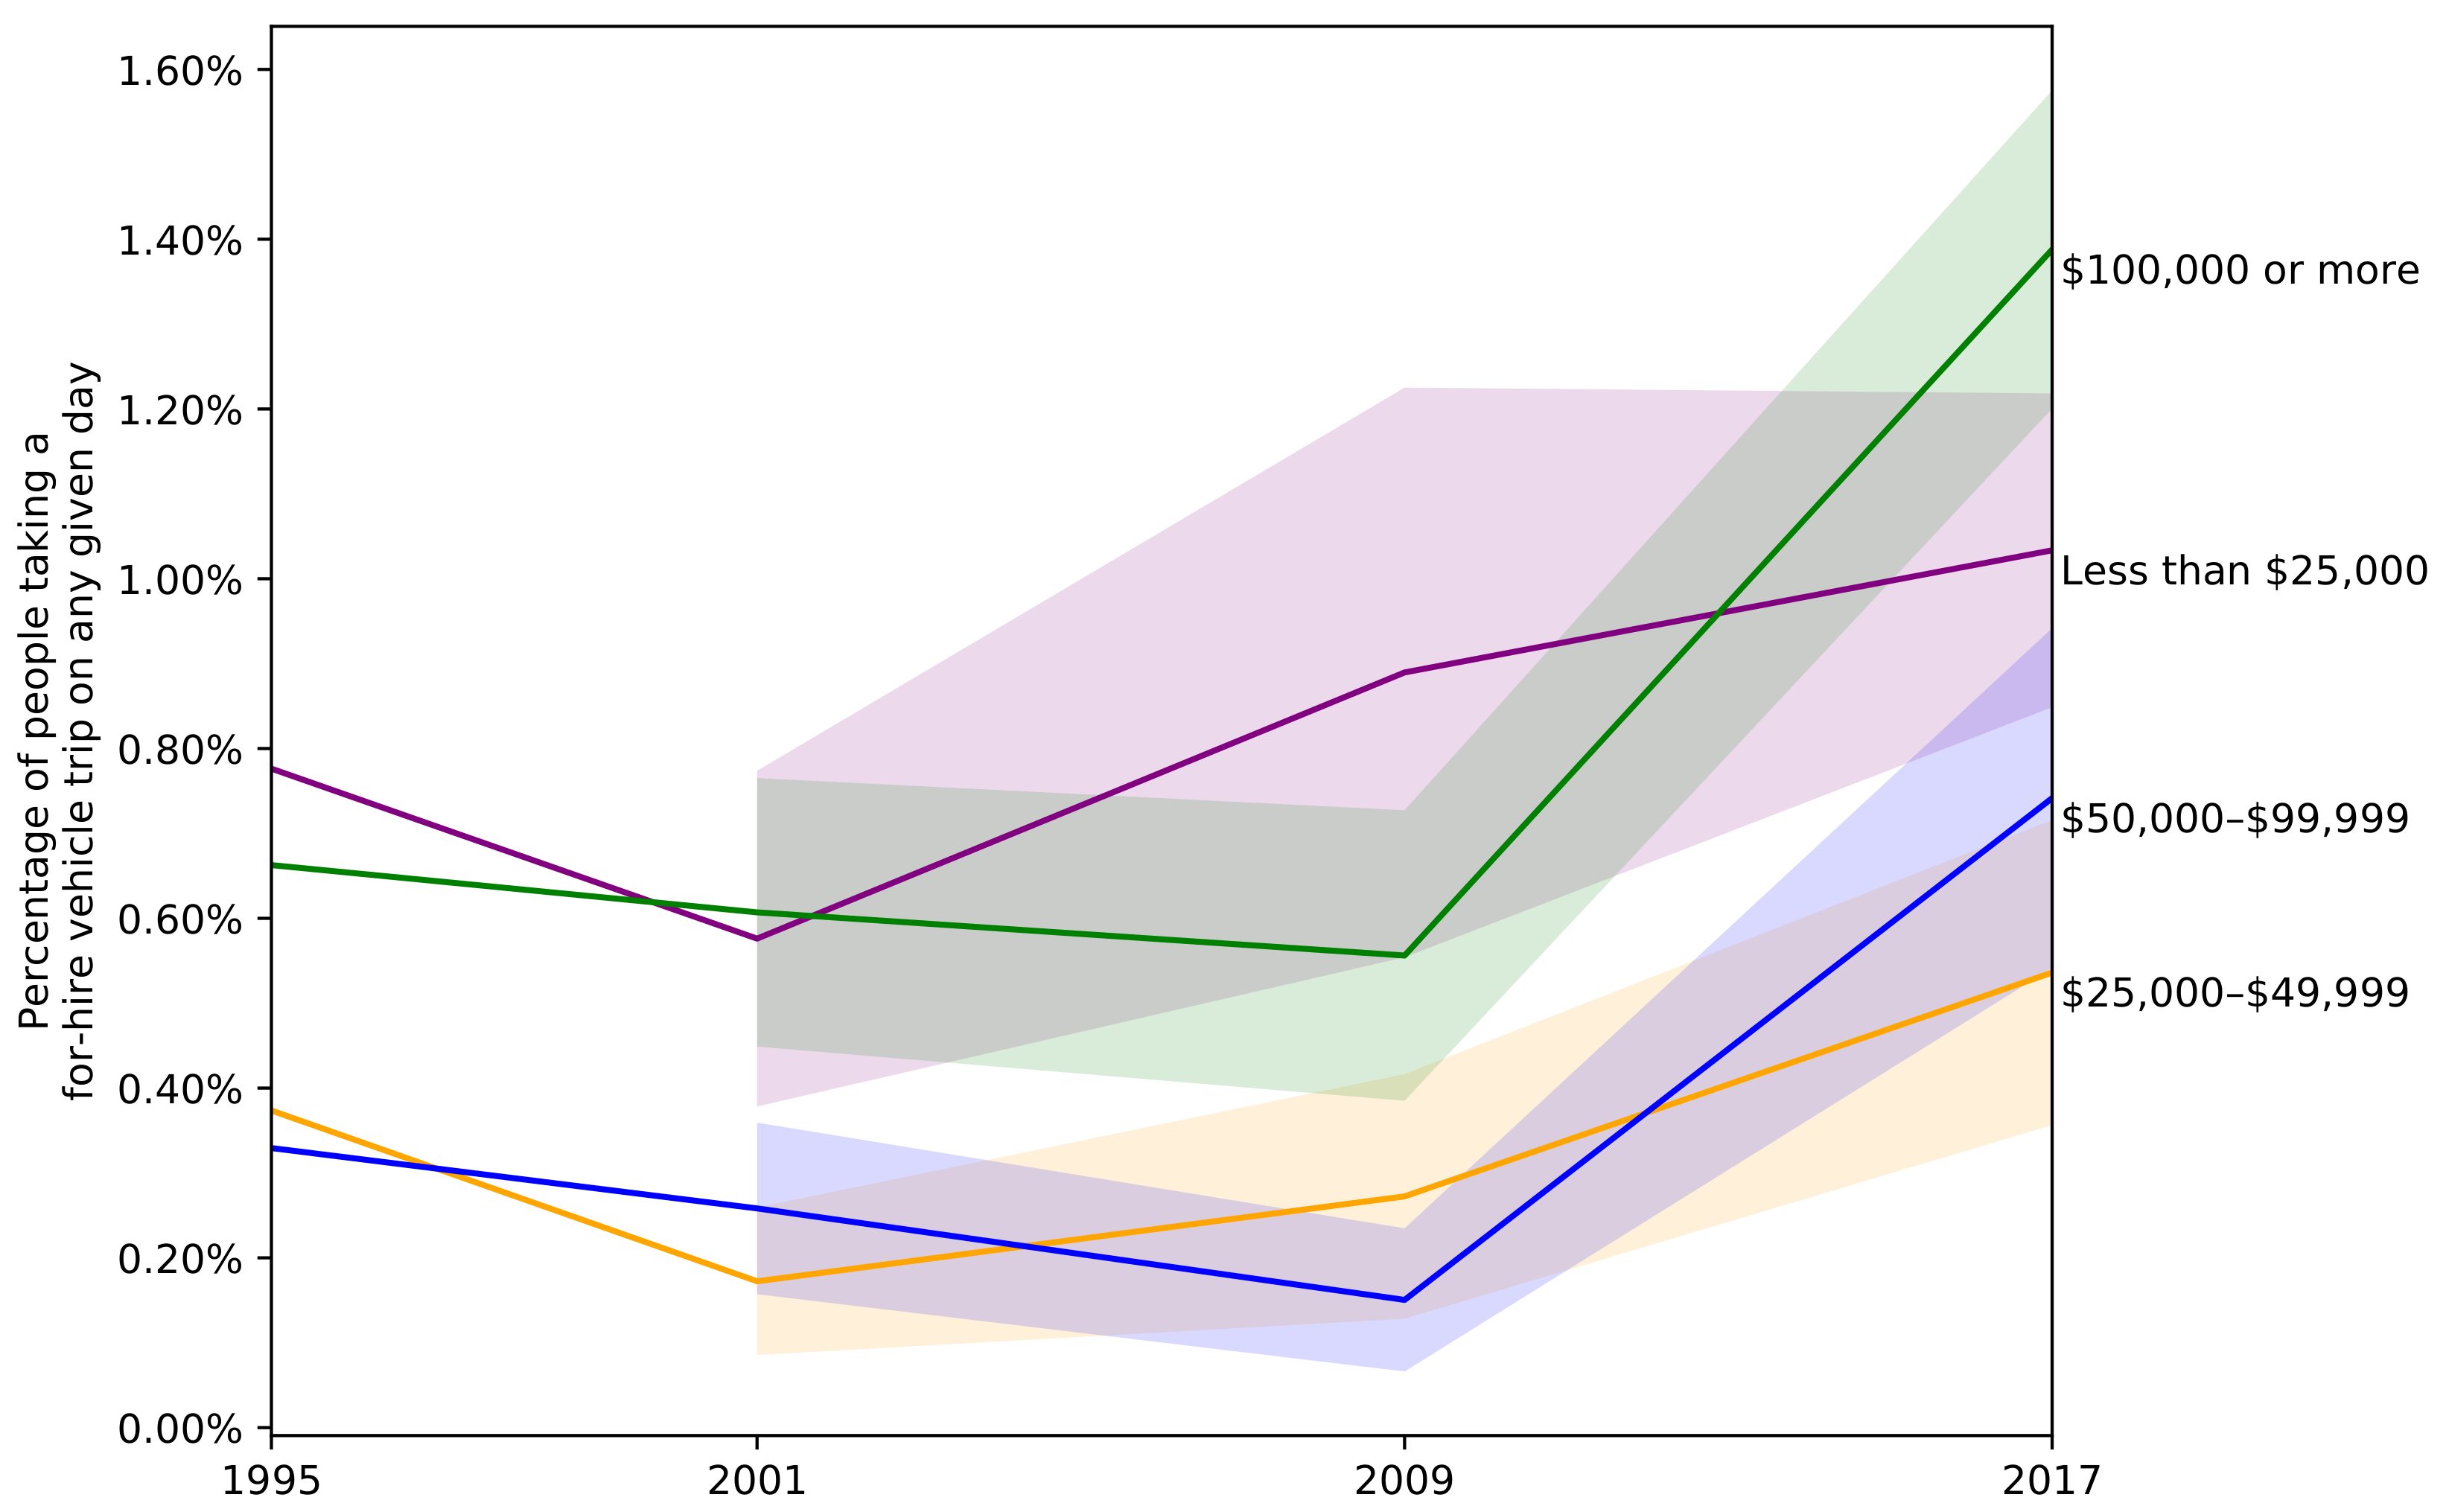
The NHTS shows this as well. Figure 4 shows the percentage of Americans using a for-hire vehicle in each of the last four NHTS/NPTS surveys by income (expressed in constant 2016 dollars). The highest income (green) and lowest income (purple) categories showed consistently higher per capita use of for-hire vehicles, even in 2017. Figure 4 looks at the for-hire vehicle market as a whole, while Table 1 looks specifically at the ridehailing market, suggesting that ridehailing users tend to be skewed towards more high income individuals than the for-hire vehicle market as a whole.
The 2017 NHTS has income categories expressed in 2016 dollars, since the question asks about income in the previous year. Incomes from other survey years were inflated using the Consumer Price Index All Urban Consumers annual estimates of inflation [37]. Since the NHTS income data are quantized, the inflated categories do not map exactly to categories used for the 2017 NHTS. In 1995, the exact CPI-adjusted breakpoints between the four categories would be $15,437, $30,874, and $61,748; these were quantized to $15,000 $30,000, and $60,000. In 2001, the exact breakpoints would be $17,937, $35,874, and $71,748, which were quantized to $20,000, $35,000, and $70,000. In 2009, the exact breakpoints would be $22,427, $44,853, and $89,707, which were quantized to $20,000, $45,000, and $80,000.
Figure 4 also shows that the growth of for-hire vehicle services since 2009 has been strongest among the highest income households (green and blue), suggesting that new ridehailing services have primarily catered to higher-income individuals. This may, in part, be due to the geographic coverage of ridehailing—as for-hire vehicle services extend into the wealthier suburbs from taxis’ center-city strongholds, they become available to generally wealthier suburban residents. It may also be due to the need for smartphones and credit cards to use ridehailing.
For those who use ridehailing, low-income and high-income people tend to use it with about the same frequency. Ridehailers across the income spectrum tend to make an average of 4–5 ridehailing trips per month. This suggests that comparing the travel day data used in Figure 4 with the monthlong data used in Table 1 should not introduce significant bias—low income and high income people are similarly likely to use ridehailing on any day if they have used ridehailing at all in a 30 day period. If instead, wealthy people used for-hire vehicles far less often than less wealthy people, wealthy people would be overrepresented in the month-long data relative to the day-long data.
Interestingly, this result differs from that of Brown [22], who found that ridehailers from of low-income neighborhoods in Los Angeles (not necessarily low-income themselves) use ridehailing more frequently than those from higher-income neighborhoods. The difference is likely due to differences in ridehailing use in Los Angeles compared to the overall US pattern; the NHTS data point estimates for L.A. are consistent with Brown’s finding.
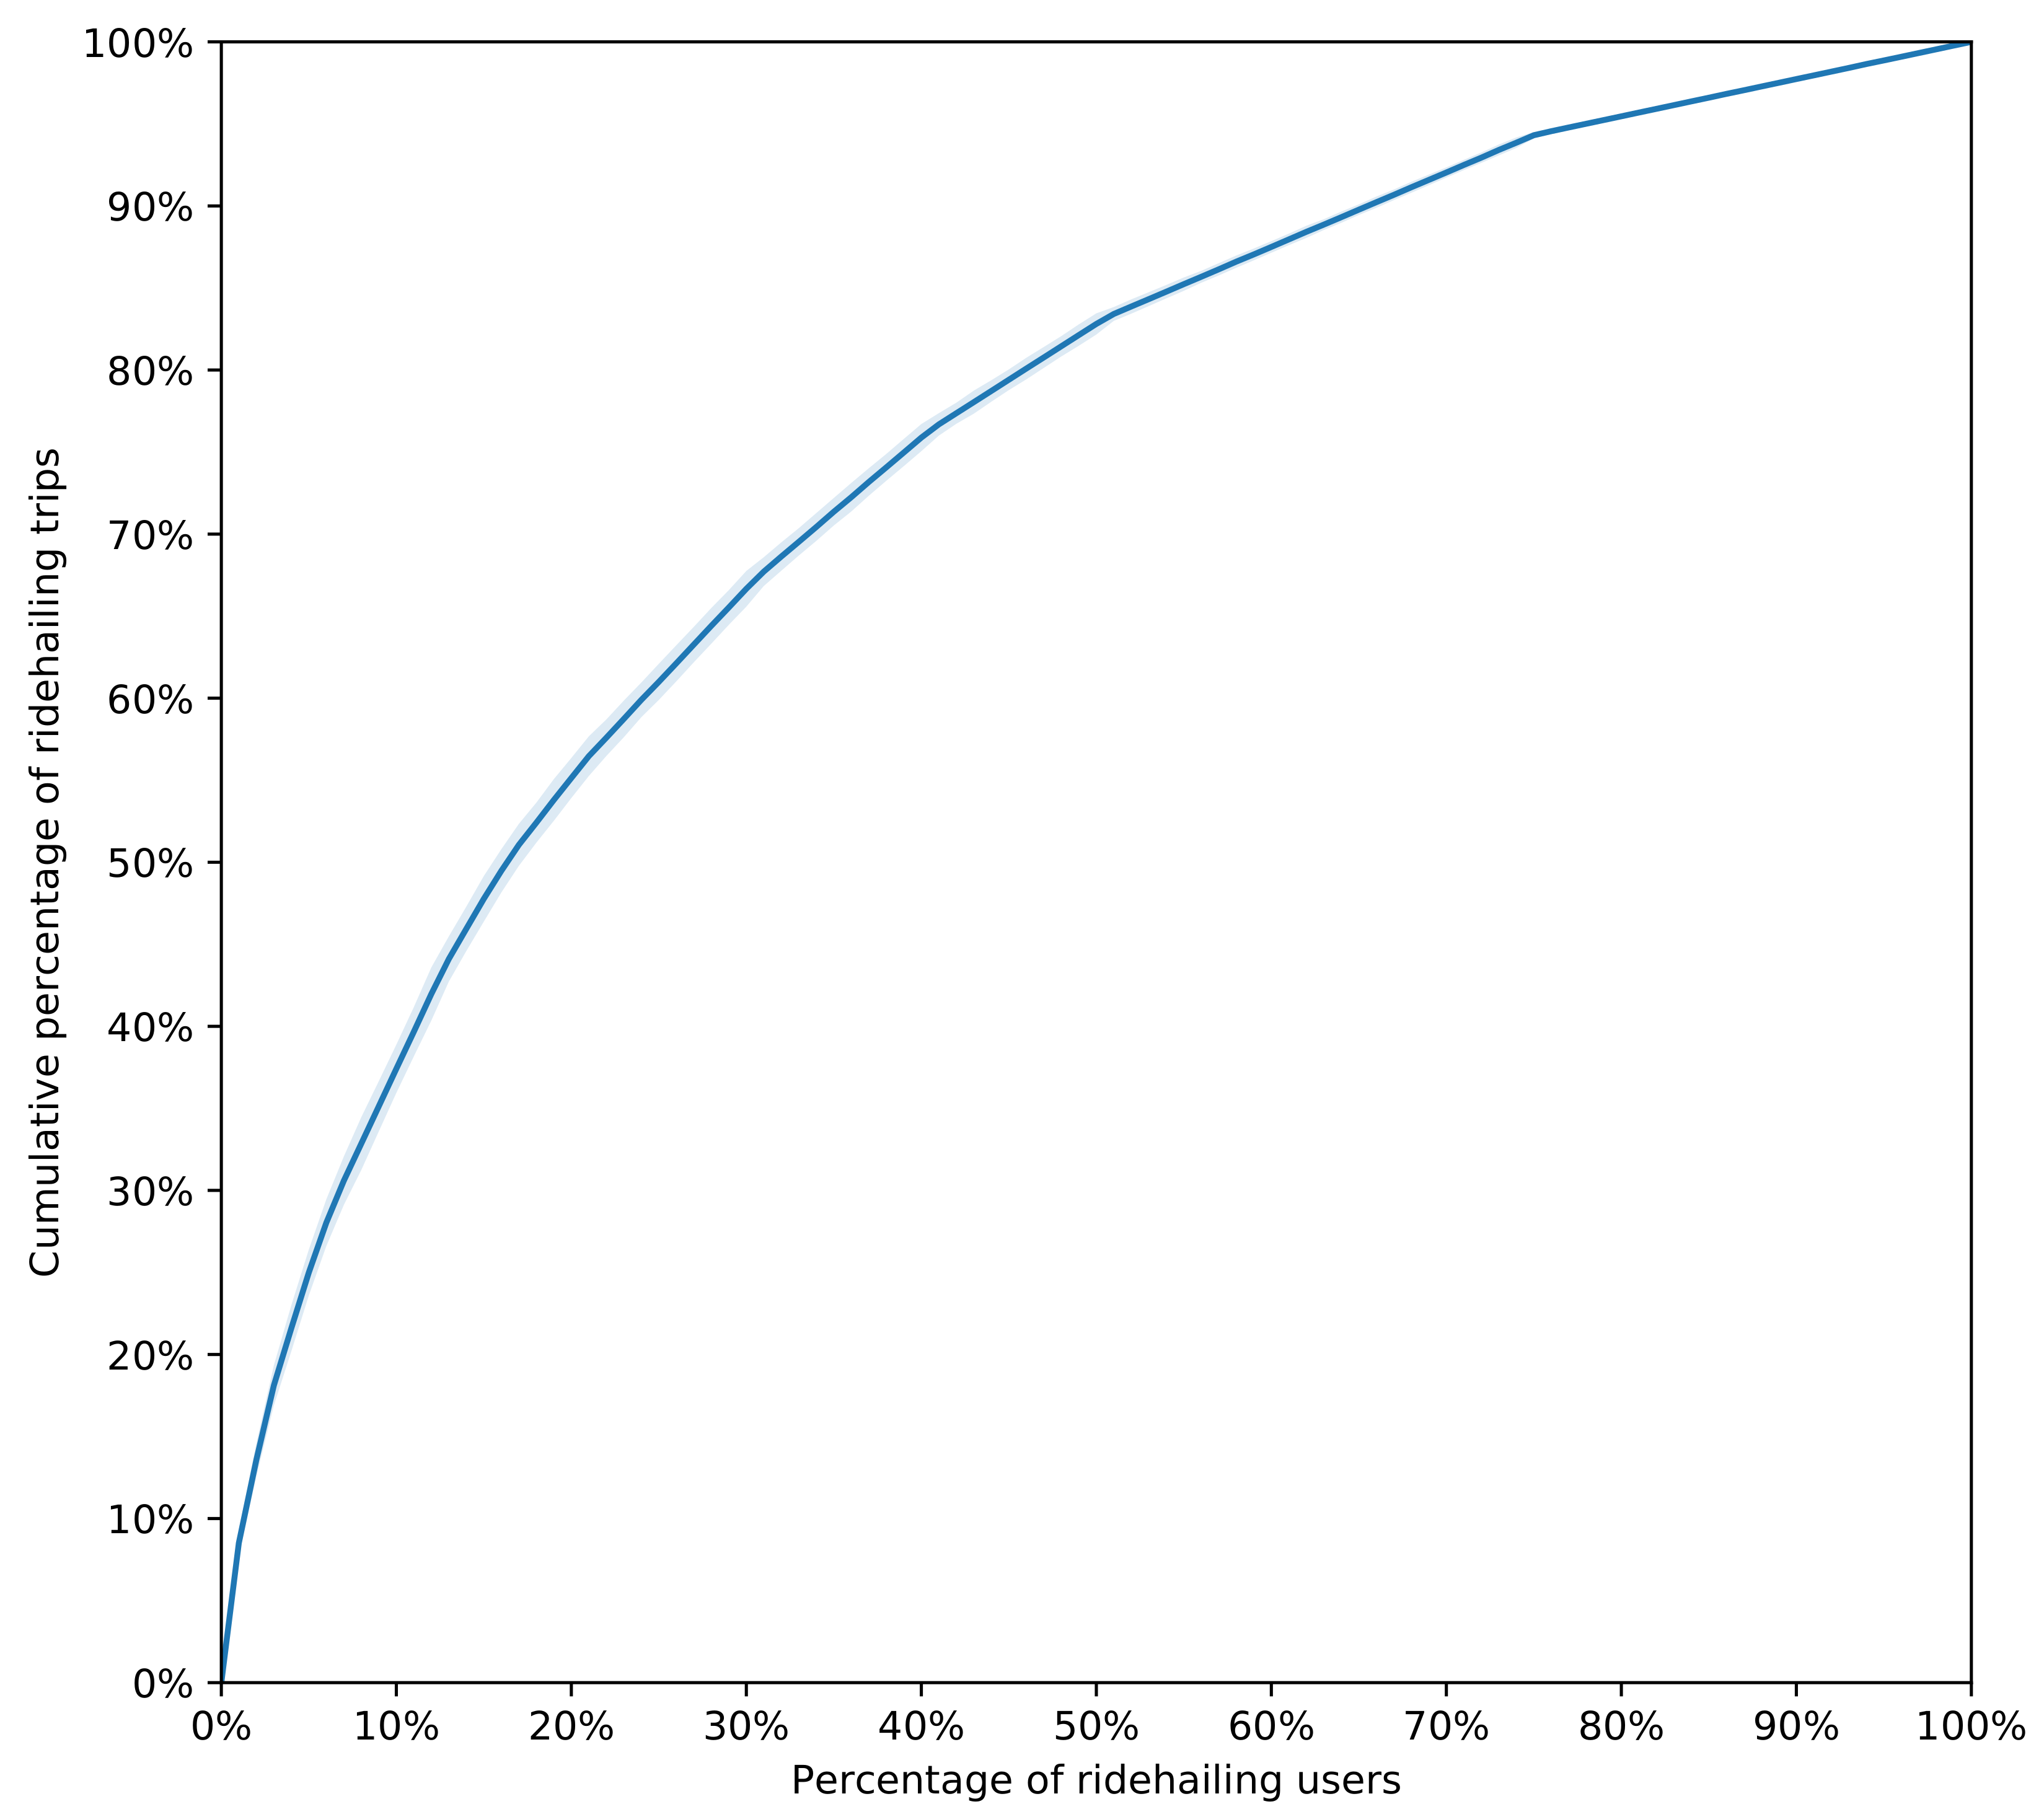
Average use per month conceals the concentration of use overall. Figure 5 shows the distribution of trip making by ridehailing across users using the 2017 data on ridehailing use over the last month. Like many consumer goods, a small share of users constitute most of the consumption. In this case, 50 percent of ridehail users made of total ridehailing trips, which means that about five percent of the US adult population is responsible for four out of five ridehailing trips. Of respondents who used ridehailing in the previous month, only made a single trip. As the NHTS only asked whether respondents used ridehailing in the past month, we can expect that there are additional occasional users who do not show up in these data. These data paint a picture of “superusers” who have incorporated ridehailing into their daily travel and most of the population who use ridehailing occasionally, at most.
This is consistent with previous research. Clewlow and Mishra [21] found that the majority of ridehailing users take less than three rides per month. Brown [22] found that over 40% of Lyft users use it less than once per month, and over half of trips were made by 10% of users. She notes that transit use is similarly concentrated among few users.
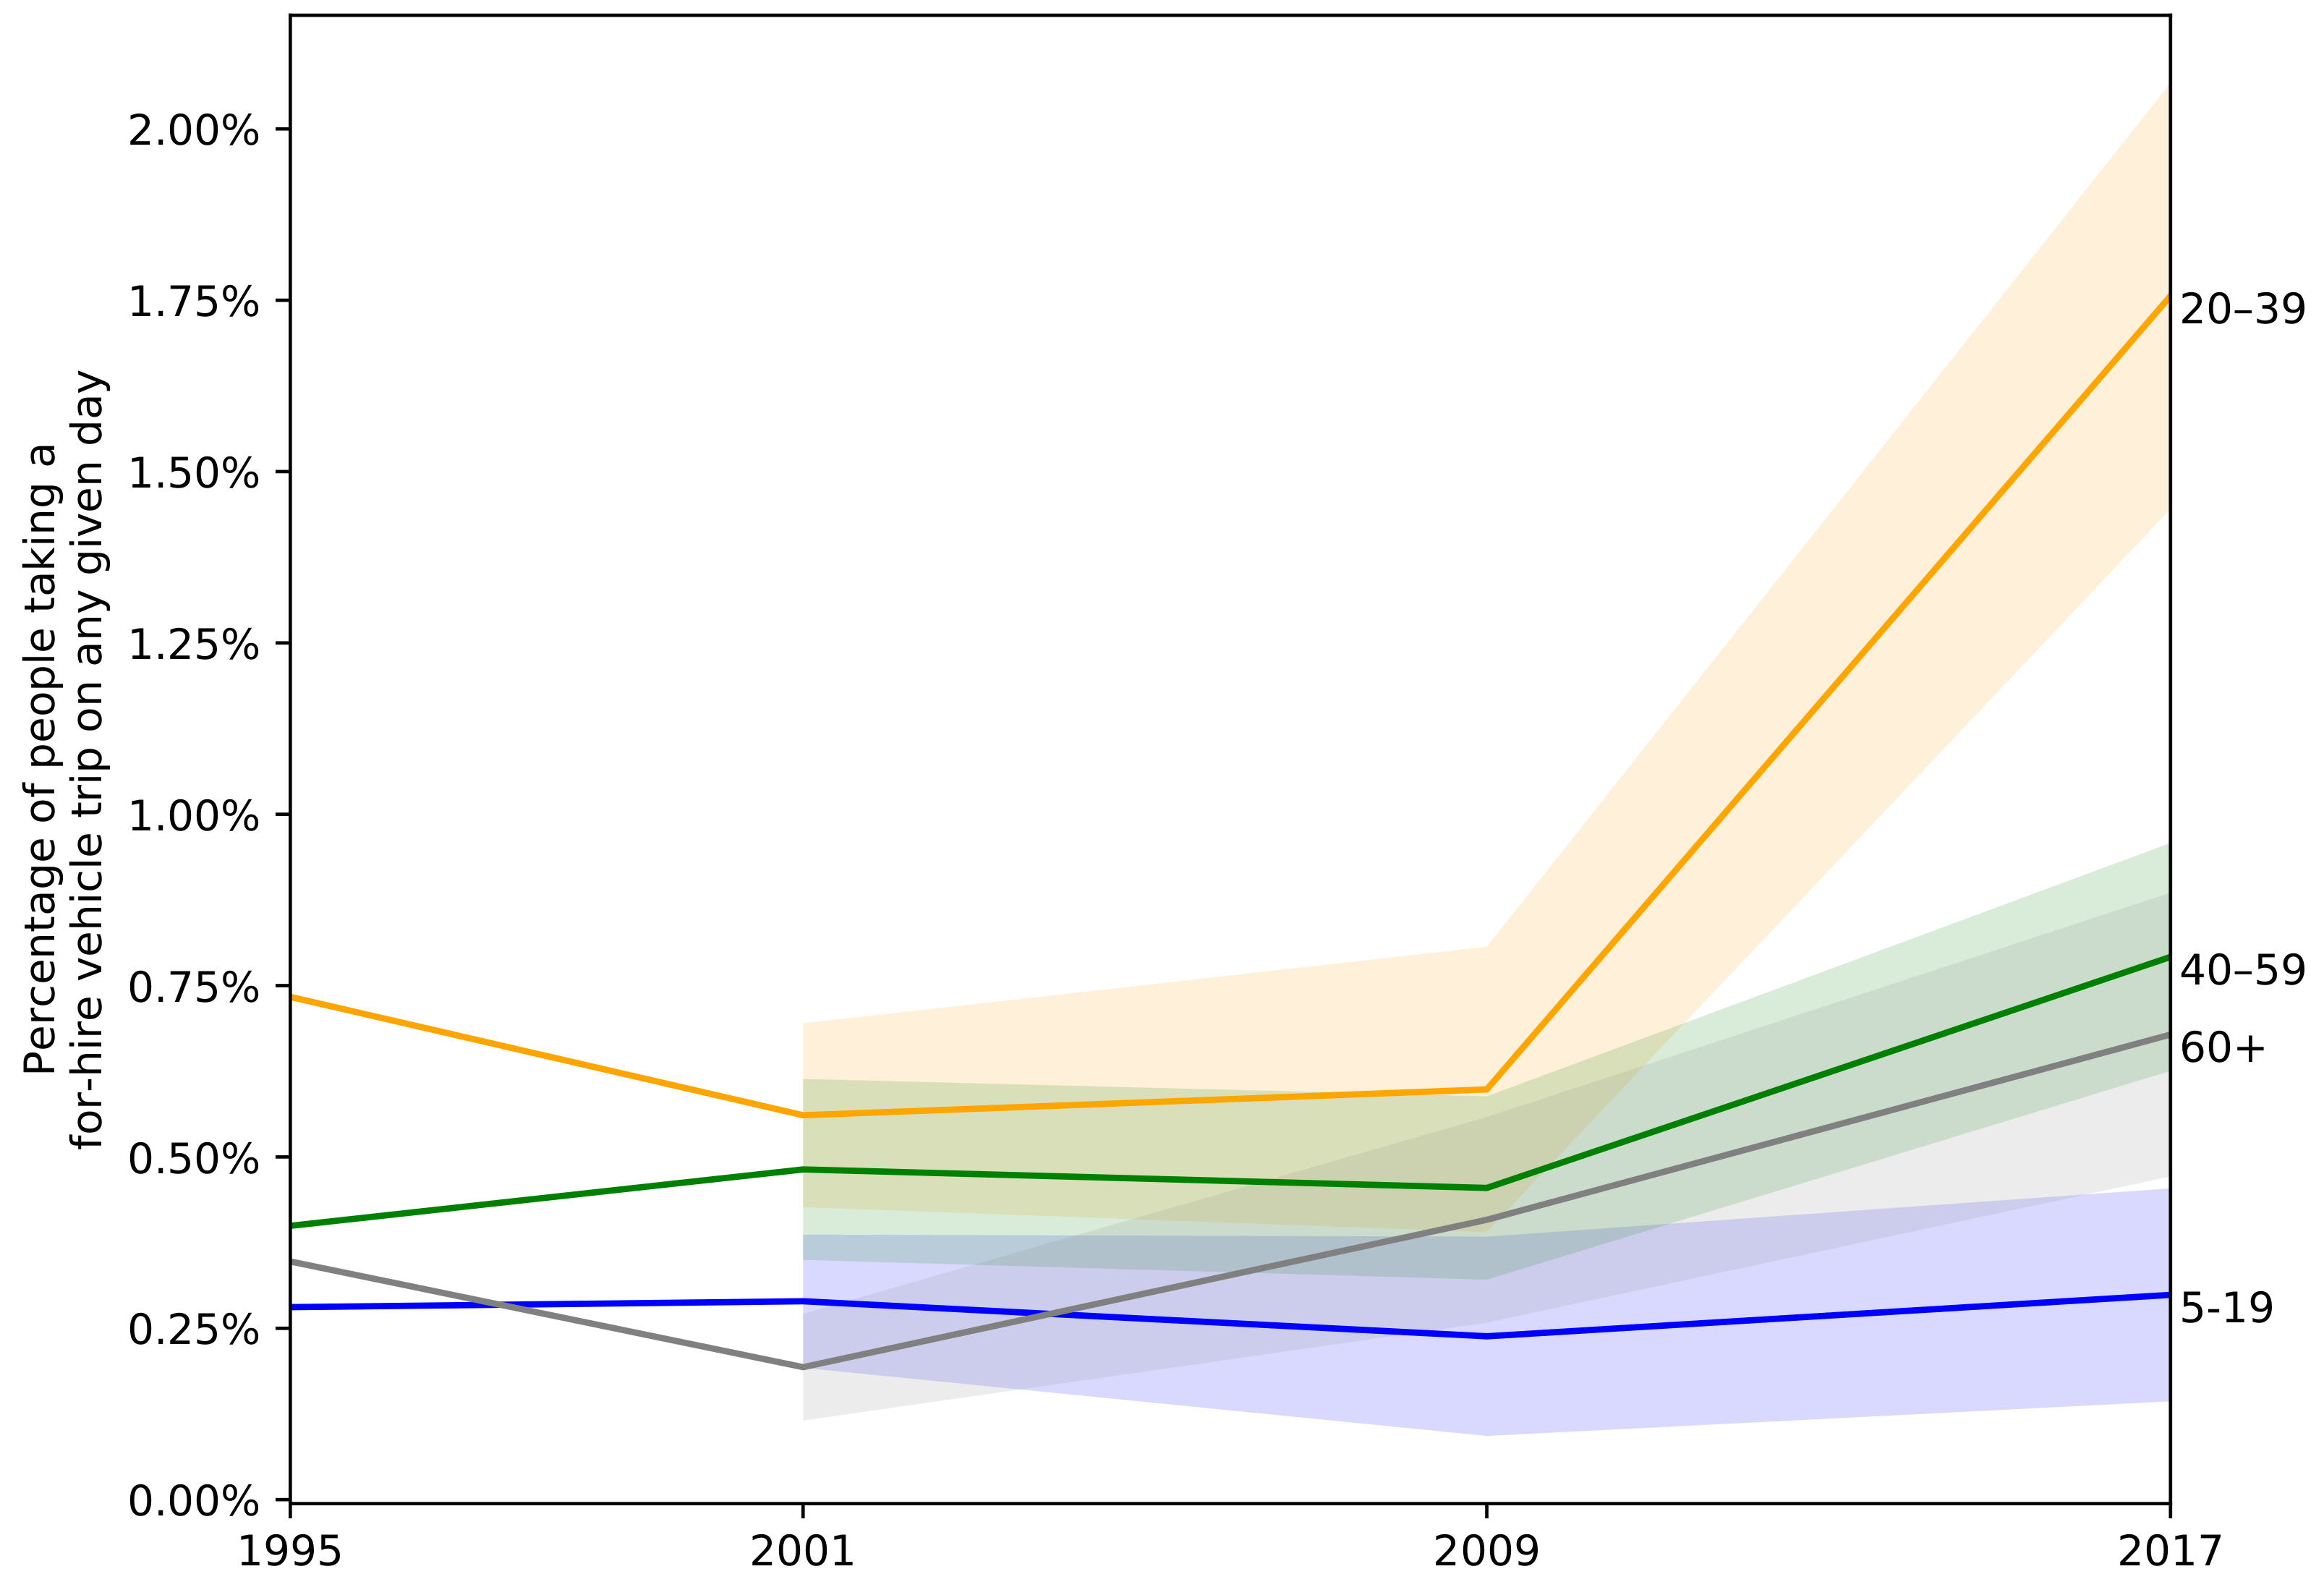
Table 1 confirms that ridehailing use is skewed towards young individuals, as previous research has found [20]. While this was somewhat true of for-hire vehicle users prior to the advent of ridehailing, it has become much more evident in the 2017 NHTS. Figure 6 shows the trends in for-hire vehicle use by age over the last four waves of the NHTS using the travel-diary data; clearly, much of the growth in for-hire vehicle use has come from 20–39 year olds. Table 1 also shows that usage is somewhat higher among men than among women.
While not strictly a demographic characteristic, for-hire vehicles (both taxis and ridehailing) are used at higher rates by individuals who are out of town. In 2017, of for-hire vehicle trips were taken by individuals who were out of town; only of all trips were taken by people who were out of town. Individuals who are out of town do not have their normal travel options (e.g., cars, bikes, or public transit) available to them and may use for-hire vehicles as a substitute. Business travelers may be less cost-sensitive than the general population, and thus may not be deterred by the high marginal cost of for-hire vehicles.
It is not possible to assess the extent to which this holds true for ridehailing separate from taxis, as we do not know whether NHTS respondents were out of town when they took the ridehailing trips they report taking in the last 30 days. There is reason to believe, though, that the effect might be even higher for ridehailing; ridehailing is uniform across cities, making it attractive for travelers. The steps to hail an Uber are the same in Anchorage as they are in Atlanta. Brown [22] (p. 41) found that 16% of Lyft trips in Los Angeles County, California were taken by users with billing ZIP codes outside California (although some of these may be students or other part-year residents who have their bills sent to another permanent address). Henao [38] found that 18% of ridehailing users in Denver, CO were from outside the area.
4.3. Multimodality
For-hire vehicle users are highly multimodal. In the 2017 NHTS, respondents who reported a for-hire vehicle trip on the travel day used for-hire vehicles for an average of of their trips on the travel day; for auto users, the comparable number was . At the tour level, the difference was similar; of tours that include a for-hire vehicle trip also included another mode. For autos, only of tours were multimodal. This makes sense; if a respondent uses an auto to go to work, they are unlikely to want to leave their auto at work when returning home, whereas for-hire vehicles leave the user free to choose another mode for other trips in the tour. Only tours containing more than two trips were considered; a tour was defined to end after each home-bound trip. This confirms the findings of King et al. [39] who found that taxi users made multimodal tours based on the asymmetry of taxi pickups and dropoffs.
5. Multivariate Analysis of Ridehailing Use
In order to identify more nuanced correlations, we estimated a logistic regression model, with a binary outcome variable for whether a respondent had used ridehailing in the last 30 days or not. This model is presented in Table 2, estimated using the subsample of the NHTS for which complete data was available for all of the covariates. In particular, the ridehailing question (our dependent variable) was only asked of respondents over 16 [27] (p. 41).
Several broad groups of variables were included in the model. Sociodemographics are important determinants of travel behavior, and we included variables such as household size and composition, sex, race, Hispanic status, age, income, and homeownership. We hypothesized that ridehailing is used as a substitute for some modes of transportation, and a complement to others, so we included variables reflecting the use of other modes of transportation. We interacted these variables with income, to see if any of these relationships differed for households of different incomes. Finally, the built environment is relevant for many travel-related decisions (e.g., Ewing and Cervero [40]), and thus, we included population density and metropolitan area size in the covariates.
The model fit fairly well, with a pseudo- of 0.26, satisfactory for a model of individual travel behavior. The sample size was 224,720 individuals from 123,633 households; thus, 85.05% of the (unweighted) sampled individuals and 95.33% of sampled households were included in the model. A total of 10.53% of the NHTS respondents were less than 16 years old, and thus were not asked about ridehailing; the others were excluded due to missing data. Standard errors were corrected for clustering within households. In addition to the covariates presented, the model also controlled for season and a proxy measure for the NHTS’s geographic sampling cells (described in Section 3), to avoid biased coefficient estimates due to oversampling in some parts of the country.
5.1. Demographics and Ridehailing
The coefficients of the model largely confirm the demographic results presented in Section 4.2. Higher income households use ridehailing more; separate coefficients are estimated for income for each household size to control for the fact that a one-person household earning $50,000 per year has far more disposable income than a four-person household with the same income. The highest income category (over $100,000 per year) is significant across household sizes, while the next highest category ($50,000–$100,000) is only significant for one and two person households and has a larger effect for one person households. Males use ridehailing more than females. Young people use ridehailing more than older people; 20–29 and 30–39 year olds use ridehailing far more than 16–19 year olds; 50–59 year olds and all older groups use it less. Table 1 shows that 50–59 year olds use ridehailing at about the same rate as 16–19 year olds; the model results likely differ because 50–59 year olds do not use ridehailing as much as their higher incomes might predict.
One interesting departure has to do with race. The model confirms that Black or African American individuals are slightly less likely than Whites to use ridehailing, which was suggested by Table 1. However, the bivariate relationships in Table 1 show that Asian individuals use ridehailing much more than Whites, while the model shows that they use it less than Whites given their other characteristics. This is likely due to income; income is a strong predictor of ridehailing use, and Asians tend to have higher incomes than Whites [41,42].
5.2. Ridehailing and Other Modes
The multivariate analysis presented in Table 2 includes four variables that represent the relationship between ridehailing and other modes. They are vehicles per household member: public transit use in the last 30 days, walk trips in the last 7 days, and bike trips in the last 7 days. We interact income with each of these to estimate the effects of other mode access and use on ridehailing separately for each income category.
Vehicle ownership has a negative relationship with ridehailing use, as expected. Those who own more cars are less likely to need the services of a for-hire vehicle. Interestingly, our results suggest that vehicle ownership is not strongly related to ridehailing use for the highest income category: above $100,000 annually. High income individuals are more likely to have disposable income and may use relatively expensive ridehailing when it is convenient, independent of whether they own a car, while lower income households are more price sensitive and may prefer low-marginal-cost private car trips when they are available. This difference is consistent with the the two previously-identified groups of for-hire vehicle users—low income users who use for-hire vehicles as a substitute for cars, and high income users who use them for their convenience in particular circumstances (see [9] (p. 111f)).
The other three included variables in this category are measures of alternative transport mode use. We hypothesized that the relationship between the use of other nonpersonal vehicle modes and ridehailing would be positive. Those who use other alternatives to using their own vehicle (if they even have a vehicle) are more likely to use ridehailing. The model results support this hypothesis with statistically significant and positive relationships between ridehailing and alternative mode use for all alternative modes and nearly all income categories.
5.3. Built Environment Correlates of Ridehailing
As residential density increases, the propensity to use ridehailing increases dramatically. At the very highest densities, residents are up to eight times more likely to use ridehailing than people living at very low densities. These are some of the largest effects in the model. This relationship makes sense; at high densities, destinations are nearby (and thus ridehailing is relatively inexpensive), wait times are shorter [43], and parking may be difficult and/or expensive. In the NHTS, density is measured at the home location which is not necessarily where all ridehailing trips begin or end; however, most for-hire vehicle trips in the 2017 NHTS (this research) and previous research (Table V-I, [38]) began or ended at home.
6. Discussion and Conclusions
This research has quantified the growth in for-hire vehicle use in the United States. Over the past decade, ridehailing has led to a doubling of the for-hire vehicle market by share of travel. While for-hire vehicles only account for about half of a percent of all trips, the percent of all Americans who use ridehailing in any given month is just under 10 percent. The geographic distribution of for-hire vehicle use has changed as well; while there has been growth in large metropolitan areas, there has also been growth in smaller metropolitan areas. These users are more likely to be multimodal, own fewer cars, and use alternative transportation more. Within the for-hire vehicle market, the growth in ridehailing is not uniformly distributed across demographic groups within the population. The built environment is significantly associated with ridehailing; residents of high-density areas are more likely to use ridehailing than residents of lower density areas.
6.1. Implications of the Rise of Ridehailing for City Planning
Given the rapid growth of ridehailing, it is important for cities to include for-hire vehicles in their planning going forward. There are a number of examples of this already. Some cities are providing designated ridehailing pickup zones [44,45]. Others are trying to control the negative traffic externalities of ridehailing through per-ride surcharges [46]. Cities are also using ridehailing to supplement or replace low-demand public transit lines [47,48], although this has not been particularly successful from a ridership perspective [49,50]. Using ridehailing to provide paratransit service has been much more successful, providing cost savings while improving service [51,52,53,54].
The growth of ridehailing also threatens revenue streams for the many cities that rely on parking fees or enforcement to fund municipal operations (personal communication with a representative of a Business Improvement District). As ridehailing becomes more prevalent, this revenue stream may drop off. This has already been observed in private parking facilities [55] and at airports [56]. As ridehailing continues to expand, cities will need to replace these existing sources of revenue, or make do without.
6.2. Impact on Other Transport Modes
At an individual level, our results show that higher use of alternatives to driving is associated with an increased likelihood of also using ridehailing, and that vehicle ownership is negatively associated with ridehailing use. We also found that for-hire vehicle users are multimodal travelers; the majority of them used another mode in addition to for-hire vehicles on the travel day, and most tours involving for-hire vehicles involved at least one other mode. This is promising news for those who view ridehailing as a “missing link” of sorts in the suite of mobility options for travelers not relying on their own private vehicles.
Previous research has also shown that other options that provide car access without car ownership reduce private vehicle ownership and increase transit use. Car sharing services (i.e., where the user is also the operator of the vehicle, as opposed to a ridehailing service where the vehicle comes with a driver) have been shown to reduce vehicle ownership (e.g., [57]). Guaranteed ride home programs, which provide taxi service to habitual transit commuters with extenuating circumstances such as a family emergency or unscheduled overtime, have also been correlated with enticing users to use transit rather than vehicles for commuting [58].
The impact of ridehailing on transit ridership is an especially important question for cities, and the evidence remains mixed. Our analysis indicates that ridehailing and transit are complementary for individuals, but this does not necessarily mean that transit ridership will increase as ridehailing use increases; it indicates simply that 2017 transit users are also more likely to be ridehailing users, all else equal. Other researchers have found that some ridehailing trips would be taken via public transportation were ridehailing not available (e.g., [20]), but this does not necessarily mean that transit ridership will drop as ridehailing use increases. Ridehailing can compete with transit for individual trips while still complementing transit as a part of a low-car lifestyle.
Critical to resolving this point is gaining a better understanding of the dynamics of ridehailing availability and vehicle ownership. If the availability of ridehailing allows users to give up or not purchase a car (and there is some evidence that it does [21,24]), on any individual trip they may decide between ridehailing and transit. However, their lack of car ownership would likely cause them to increase both their transit use and their ridehailing use over what it would be otherwise. In other words, removing personal autos from the mode choice set may increase both their transit use and their ridehailing use.
A closely-related issue is the impact of ridehailing on traffic congestion; vehicle ownership is a strong determinant of congestion levels. Evidence on this point is inconsistent. Ridehailing has been found to increase [59], decrease [60], and have no effect on traffic congestion [61].
Evidence of the city-scale relationship between ridehailing and transit indicates that it can be positive or negative, depending on the transit service type and quality [23]. Further research is needed to understand how these competitive and complementary effects interact. A good initial study would be to undertake qualitative interviews of ridehailing users to understand how their transportation choices have changed.
6.3. Geography and the Viability of Ridehailing
The NHTS data indicate that the recent growth in for-hire vehicle use has been substantially greater in larger MSAs than in small MSAs. Our regression analysis shows that people use ridehailing more in higher density neighborhoods, regardless of MSA size. Together, these two findings call into question the idea that ridehailing may be a large-scale replacement for car ownership. In low density areas, it may never be possible for shared vehicles (even autonomous ones with low per-mile operating costs) to affordably approximate the convenience of private car ownership. In small MSAs, demand simply may not be large enough to support a robust ridehailing industry. Mode share of for-hire vehicles is still low; if it increases, ridehailing will become viable over a broader range of population densities and MSA sizes. This eases but does not erase this concern.
Concerns over the relationship between density and the viability of ridehailing are exacerbated when “pooling”—or sharing a single ridehailing vehicle between multiple individuals—is considered. Pooling has been presented as the answer to many of the negative effects of ridehailing and single-occupant vehicle use in general [62]. It is clear, however, that if ridehailing is most prevalent at a relatively high density, pooling will require even higher density (so that multiple people happen to be going in roughly the same direction at the same time).
Currently, UberPool (Uber’s pooling service) is not available in metropolitan Phoenix, for example, at least in part, because of low density [63]. In Los Angeles County, about a quarter of Lyft trips use the Lyft Line pooled service [22] (p. 3). However, just because a rider uses a pooled service offering does not mean that that trip will necessarily be matched with another rider; ridehailing firms do not release statistics on what percentage of pooled trips are successfully matched with another rider. This is something that future waves of the NHTS should collect data on.
Fagnant and Kockelman (Table 2, [64]) performed simulation studies of a potential shared autonomous vehicle system in Austin, Texas. Even with an assumed mode share of 11% and trips restricted to a relatively small central area, only 6% of vehicle miles traveled had more than one tripmaker pooled in the vehicle. This mode share is much higher than the current observed for-hire vehicle mode share in the US. Clearly, a high density threshold may be needed for pooling to be workable. Determining this threshold is a valuable avenue for future research.
6.4. Equity
Our analysis shows that ridehailing users are disproportionately high income individuals which differs from the overall income distribution of for-hire vehicle users, including taxis. The question arises, then, whether transportation planners and policymakers should be concerned about equity of ridehailing service access. One view is that ridehail trips are simply high-priced luxury goods in a private market which one would expect to be consumed primarily by higher income individuals. If ridehailing is becoming an integral part of the transportation system, however, equity concerns are important [65] (p. 131).
A significant constraint to widespread adoption of ridehailing by low-income individuals is the need to have both a smartphone and a credit card to access these services [66]. We posit that if ridehailing reduces the availability of transit service and taxis that accept cash payments by out-competing these services, then there is a substantial equity problem. There is evidence that this is beginning to happen in the taxi market [5]. In the transit arena, the evidence of the effect of ridehailing is decidedly mixed, although our analysis of NHTS data suggests an overall complementarity between ridehailing and transit use. This is an important relationship to continue to watch; if transit agencies begin to cut service in response to ridehailing competition, low-income travelers will be severely impacted [66].
7. For Hire Vehicles: Data Needs and a Research Agenda
The NHTS is the first large, national survey in the United States to ask about ridehailing use. The analysis presented here illustrates the strengths and limits of these data, and suggests a number of avenues for further research. We divide our suggested directions for future research into two categories: short-term practical planning questions for today, and questions whose answers will inform longer-term planning.
Some questions can be answered using the origin-destination trip records retained by ridehailing companies themselves. In some markets, these data are public [17,19], and in others, researchers or governments may be able to obtain access (e.g., [22]). However, many interesting questions require information about users’ demographics, trip purposes, or the other trips they make, which cannot be obtained from trip records.
Three short-term planning questions concern the effect of ridehailing use on parking demand at popular destinations, knowing the locations of high-density pick-up and drop-off ridehailing activity to better manage curb access and using ridehailing origin-destination patterns to help coordinate ridehailing with transit service. Answers to all of these questions could be identified through targeted data sharing partnerships between ridehailing firms and city planning agencies; trip records are sufficient to answer these questions.
The answers to most longer-term planning questions depend on more complicated dynamics of travel choices, including car ownership and even residential neighborhood. The objective is to understand how these dynamics are likely to play out under various scenarios of ridehailing service characteristics—including prices—and regulatory policies. Specifically, ridehailing has the potential to have substantial effects on traffic congestion, vehicle ownership, transit ridership, non-motorized transport use, the environmental impact of the urban transport sector, and transport equity. Answering these questions requires more detailed, survey-style information about ridehailing use. In this article, we have touched upon many of these issues, but the NHTS data do not include enough instances of ridehailing trips to allow us to confidently report clear relationships.
One of the biggest concerns in this category is the price elasticity of ridehailing demand. Ridehailing firms have been accused of predatory pricing and operating at a loss [67]; prices may soon need to be adjusted upwards [68]. Alternatively, autonomous vehicles may soon be commercially available [4] (p. 15), which could lead to substantial reductions in the cost of providing ridehailing services. From the data available publicly today, we cannot estimate how ridehailing users would respond if the price were increased or decreased significantly. The potential for such price swings to cause large changes in both traffic congestion and transit ridership means that it is critical for transport planners and policymakers to gain an understanding of these effects.
Additional important questions include gaining a better understanding of the geography of ridehailing. Ultimately, what we want to know is where ridehailing services generate a societal welfare benefit (and where they do not). Where do pooled ridehailing services generate a welfare improvement?
This research focused on the United States due to the data source used. Ridehailing, however, is an international phenomenon, and future research could explore its use in cities around the world. To date, most ridehailing research has focused on the US context, probably because of the longer history of these services in the US. Research outside the US could provide an understanding of how these services operate in very different land use and demographic contexts.
To generate data that will help answer these questions, future rounds of the NHTS and other travel surveys worldwide should consider a sampling strategy that oversamples areas and populations of interest, including dense places, larger metropolitan areas, and respondents of high and low income. For for-hire trips, the type of service (taxi, ridehailing, etc.), the hailing method (street hail, smart phone app, dispatch, etc.), company used, wait time from request, whether the ride was pooled, and the cost of the ride should be asked as part of the travel survey. The NHTS should additionally gather information on the cost of travel for other modes. These additions would greatly improve the data collected publicly for planning purposes.
Author Contributions
Conceptualization, M.W.C., D.S., D.K.; Methodology, M.W.C., D.S., D.K.; Software, M.W.C.; Validation, M.W.C., D.S., D.K.; Formal Analysis, M.W.C., D.S.; Investigation, N/A; Resources, N/A; Data Curation, M.W.C.; Writing—Original Draft Preparation, M.W.C., D.S., D.K.; Writing—Review & Editing, M.W.C., D.S., D.K.; Visualization, M.W.C.; Supervision, M.W.C., D.S., D.K.; Project Administration, M.W.C., D.S., D.K.; Funding Acquisition, N/A.
Funding
This research received no external funding.
Acknowledgments
The authors wish to acknowledge Apara Banerjee and Stacey Bricka for answering question about the NHTS dataset.
Conflicts of Interest
The authors declare no conflict of interest.
Abbreviations
The following abbreviations are used in this manuscript:
| CBSA | Core-Based Statistical Area |
| NHTS | National Household Travel Survey |
| NPTS | Nationwide Personal Transportation Survey |
| MSA | Metropolitan Statistical Area |
References
- Goldwyn, E. Why UberX Will Win in the End. CityLab. 17 April 2014. Available online: https://www.citylab.com/transportation/2014/04/why-uberx-will-win-end/8895/ (accessed on 3 July 2018).
- Nicks, D. Like It or Not, Uber Is Transforming Life in Middle America. Time. 9 December 2014. Available online: http://time.com/3606017/uber-lyft-ridesharing-america/ (accessed on 20 June 2018).
- Posen, H. Ridesharing in the Sharing Economy: Should Regulators Impose Uber Regulations on Uber? Iowa Law Rev. 2015, 101, 405–433. [Google Scholar]
- Sperling, D.; Pike, S.; Chase, R. Will the Transportation Revolutions Improve Our Lives—Or Make Them Worse? In Three Revolutions: Steering Automated, Shared and Electric Vehicles to a Better Future; Sperling, D., Ed.; Island Press: Washington, DC, USA, 2018; pp. 1–20. [Google Scholar]
- Shaheen, S. Shared Mobility: The Potential of Ridehailing and Pooling. In Three Revolutions: Steering Automated, Shared and Electric Vehicles to a Better Future; Sperling, D., Ed.; Island Press: Washington, DC, USA, 2018; pp. 55–76. [Google Scholar]
- Tilleman, L. Remaking the Auto Industry. In Three Revolutions: Steering Automated, Shared and Electric Vehicles to a Better Future; Sperling, D., Ed.; Island Press: Washington, DC, USA, 2018; pp. 151–166. [Google Scholar]
- Siddiqui, F. D.C.-Based Split Will Discontinue Rideshare Service, Citing Market ‘Saturation’. The Washington Post. 27 September 2016. Available online: https://www.washingtonpost.com/news/dr-gridlock/wp/2016/09/27/d-c-based-split-will-discontinue-rideshare-service-citing-market-saturation/ (accessed on 25 June 2018).
- Vora, S. Here Are Some Alternatives to Uber. The New York Times. 4 October 2017. Available online: https://www.nytimes.com/2017/10/04/travel/uber-alternatives-new-york-london.html (accessed on 25 June 2018).
- Gilbert, G.; Samuels, R.E. The Taxicab: An Urban Transportation Survivor; University of North Carolina Press: Chapel Hill, NC, USA, 1982. [Google Scholar]
- Beer, R.; Brakewood, C.; Rahman, S.; Viscardi, J. Qualitative Analysis of Ride-Hailing Regulations in Major American Cities. Transp. Res. Rec. 2017, 2650, 84–91. [Google Scholar] [CrossRef]
- Associated Press. NYC Mayor Signs Bill Capping New Ride-Hail Licenses. The New York Times. 14 August 2018. Available online: https://www.nytimes.com/aponline/2018/08/14/us/ap-us-taxi-turmoil.html (accessed on 18 August 2018).
- Yellow Cab Arizona. Taxi Rates and Reservations. Available online: http://web.archive.org/web/20180712172319 / https://yellowcabaz.com/taxi-rates/ (accessed on 12 July 2018).
- District of Columbia Department of For-Hire Vehicles. Taxicab Fares|DC Taxi. Available online: http://web.archive.org/web/20180712172506 / https://dfhv.dc.gov/page/taxicab-fares; (accessed on 12 July 2018).
- New York City Taxi and Limousine Commission. Taxicab Rate of Fare. Available online: http://web.archive.org/web/20180712172701 / http://www.nyc.gov/html/tlc/html/passenger/taxicab_rate.shtml; (accessed on 12 July 2018).
- Checker Cab Kansas City. Checker KC—Rates. Available online: http://web.archive.org/web/20180712173021 / http://www.checkertaxicabkc.com/rates.html (accessed on 12 July 2018).
- Schaller, B. The New Automobility: Lyft, Uber and the Future of American Cities; Technical Report; Schaller Consulting: New York, NY, USA, 2018; Available online: http://www.schallerconsult.com/rideservices/automobility.pdf (accessed on 28 July 2018).
- Schneider, T. Analyzing 1.1 Billion NYC Taxi and Uber Trips, with a Vengeance. 2018. Available online: http://web.archive.org/web/20180707221551 / http://toddwschneider.com/posts/analyzing-1-1-billion-nyc-taxi-and-uber-trips-with-a-vengeance (accessed on 7 July 2018).
- Bialik, C.; Flowers, A.; Fischer-Baum, R.; Mehta, D. Uber Is Serving New York’s Outer Boroughs more than Taxis Are. FiveThirtyEight. 10 August 2015. Available online: https://fivethirtyeight.com/features/uber-is-serving-new-yorks-outer-boroughs-more-than-taxis-are/ (accessed on 7 July 2018).
- Lavieri, P.S.; Dias, F.F.; Juri, N.R.; Kuhr, J.; Bhat, C.R. A Model of Ridesourcing Demand Generation and Distribution. Transp. Res. Rec. 2018, 2665. [Google Scholar] [CrossRef]
- Rayle, L.; Dai, D.; Chan, N.; Cervero, R.; Shaheen, S. Just a Better Taxi? A Survey-Based Comparison of Taxis, Transit, and Ridesourcing Services in San Francisco. Transp. Policy 2016, 45, 168–178. [Google Scholar] [CrossRef]
- Clewlow, R.R.; Mishra, G.S. Disruptive Transportation: The Adoption, Utilization, and Impacts of Ride-Hailing in the United States; Technical Report UCD-ITS-RR-17-07; Institute of Transportation Studies, University of California: Davis, CA, USA, 2017. [Google Scholar]
- Brown, A. Ridehail Revolution: Ridehail Travel and Equity in Los Angeles. Ph.D. Thesis, University of California, Los Angeles, CA, USA, 2018. [Google Scholar]
- Babar, Y.; Burtch, G. Examining the Impact of Ridehailing Services on Public Transit Use. SSRN Electron. J. 2017, 1–54. [Google Scholar] [CrossRef]
- Hampshire, R.; Simek, C.; Fabusuyi, T.; Di, X.; Chen, X. Measuring the Impact of an Unanticipated Disruption of Uber/Lyft in Austin, TX. SSRN Electron. J. 2017. [Google Scholar] [CrossRef]
- Klein, N.J.; Smart, M.J. Car Today, Gone Tomorrow: The Ephemeral Car in Low-Income, Immigrant and Minority Families. Transportation 2017, 44, 495–510. [Google Scholar] [CrossRef]
- 2017 NHTS Data User Guide; Publication, Federal Highway Administration and Westat: Washington, DC, USA, 2018.
- Main Study Retrieval Questionnaire; Technical Report; Federal Highway Administration and Westat: Washington, DC, USA, 2018. Available online: https://nhts.ornl.gov/assets/2016/NHTS_Retrieval_Instrument_20180228.pdf (accessed on 7 June 2018).
- 2009 National Household Travel Survey User’s Guide, Version 2; Publication, Federal Highway Administration: Washington, DC, USA, 2011.
- 2001 National Household Travel Survey User’s Guide, Version 3, National Sample with Add-Ons; Publication, Federal Highway Administration: Washington, DC, USA, 2004.
- StataCorp. Stata User’s Guide: Release 15; Stata Press: College Station, TX, USA, 2017. [Google Scholar]
- Solon, G.; Haider, S.J.; Wooldridge, J.M. What Are We Weighting for? J. Hum. Resour. 2015, 50, 301–316. [Google Scholar] [CrossRef]
- Roth, S.B.; DeMatteis, J.; Dai, Y. 2017 NHTS Weighting Report: Task P; Technical Report; Federal Highway Administration: Washington, DC, USA, 2017.
- O’Brien, R.M. A Caution Regarding Rules of Thumb for Variance Inflation Factors. Qual. Quant. 2007, 41, 673–690. [Google Scholar] [CrossRef]
- US Census Bureau. Geographic Terms and Concepts—Core Based Statistical Areas and Related Statistical Areas. Available online: https://www.census.gov/geo/reference/gtc/gtc_cbsa.html (accessed on 27 August 2018).
- Renne, J.L.; Bennett, P. Socioeconomics of Urban Travel: Evidence from the 2009 National Household Travel Survey with Implications for Sustainability. World Transp. Policy Pract. 2014, 20, 7–27. [Google Scholar]
- Pisarski, A. Commuting in America III: The Third National Report on Commuting Patterns and Trends; Number 550; Transportation Research Board: Washington, DC, USA, 2006. [Google Scholar]
- Bureau of Labor Statistics. CPI-U All Urban Consumers (CUUR0000SA0). Available online: https://data.bls.gov/pdq/SurveyOutputServlet (accessed on 31 March 2018).
- Henao, A. Impacts of Ridesourcing—Lyft and Uber—On Transportation, Including VMT, Mode Replacement, Parking, and Travel Behavior. Ph.D. Thesis, University of Colorado, Denver, CO, USA, 2017. [Google Scholar]
- King, D.A.; Peters, J.R.; Daus, M.W. Taxicabs for Improved Urban Mobility: Are We Missing an Opportunity? In Proceedings of the Transportation Research Board Annual Meeting, Washington, DC, USA, 22–26 January 2012. [Google Scholar]
- Ewing, R.; Cervero, R. Travel and the Built Environment: A Meta-Analysis. J. Am. Plan. Assoc. 2010, 76, 265–294. [Google Scholar] [CrossRef]
- US Census Bureau. Median Household Income in the Past 12 Months (In 2016 Inflation-adjusted Dollars) (White Alone Householder) American Community Survey 1-Year Estimates. 2016. Available online: https://censusreporter.org/data/table/?table=B19013Ageo_ids=01000USprimary_geo_id=01000US (accessed on 3 July 2018).
- US Census Bureau. Median Household Income in the Past 12 Months (In 2016 Inflation-adjusted Dollars) (Asian Alone Householder) American Community Survey 1-Year Estimates, 2016. Available online: https://censusreporter.org/data/table/?table=B19013Dgeo_ids=01000USprimary_geo_id=01000US (accessed on 03 July 2018).
- Hughes, R.; MacKenzie, D. Transportation Network Company Wait Times in Greater Seattle, and Relationship to Socioeconomic Indicators. J. Transp. Geogr. 2016, 56, 36–44. [Google Scholar] [CrossRef]
- McFarland, M. Cities Warm Up to Designated Uber, Lyft Pick-Up Spots. 2017. Available online: http://money.cnn.com/2017/11/16/technology/uber-lyft-designated-pickup-spots/index.html (accessed on 20 June 2018).
- Kansas City Power & Light District Partners With Uber to Make Getting Rides Easier. KSHB Kansas City. 6 December 2017. Available online: https://www.kshb.com/news/local-news/kansas-city-power-light-district-partners-with-uber-to-make-getting-rides-easier (accessed on 20 June 2018).
- Hu, W. Congestion Pricing Falters in New York, Again. The New York Times. 31 March 2018. Available online: https://www.nytimes.com/2018/03/31/nyregion/congestion-pricing-new-york.html (accessed on 15 June 2018).
- Boehm, J. Lyft to Give Discounts to Riders Traveling to, from Phoenix Bus Stops. azcentral. 18 October 2017. Available online: https://www.azcentral.com/story/news/local/phoenix/2017/10/18/lyft-give-discounts-riders-traveling-to-phoenix-bus-stops/774239001/ (accessed on 20 June 2018).
- Van Cleave, K. Texas City Ditches Buses for Via Ride-Share. Available online: https://www.cbsnews.com/video/texas-city-ditches-buses-for-via-ride-share/ (accessed on 20 June 2018).
- Urgo, J. Flex V. Fixed: An Experiment in On-Demand Transit. TransitCenter. 15 May 2018. Available online: http://transitcenter.org/2018/05/15/adding-flexible-routes-improve-fixed-route-network/ (accessed on 10 July 2018).
- Westervelt, M.; Huang, E.; Schank, J.; Borgman, N.; Fuhrer, T.; Peppard, C.; Narula-Woods, R. UpRouted: Exploring Microtransit in the United States; Eno Center for Transportation: Washington, DC, USA, 2018. [Google Scholar]
- Massachusetts Bay Transportation Authority. On-Demand Paratransit Pilot Program. Available online: http://web.archive.org/web/20180621004522 / https://www.mbta.com/accessibility/the-ride/on-demand-pilot (accessed on 21 June 2018).
- Kansas City Area Transportation Authority. Transit Initiatives. Available online: http://web.archive.org/web/20180621005617 / http://www.kcata.org/transit-initiatives/prospect_ave_study (accessed on 21 June 2018).
- Bankson, A.M. Uber and Lyft Partner With Boston Transit Agency to Provide On-Demand Rides to Disabled Residents. 2017. Available online: http://web.archive.org/web/20180621140525 / http://mitsloan.mit.edu/newsroom/articles/uber-and-lyft-partner-with-boston-transit-agency-to-provide-on-demand-rides-to-disabled-residents/ (accessed on 21 June 2018).
- RideKC Freedom On-Demand Winning Over Riders. 2017. Available online: http://ridekc.org/blog/ridekc-freedom-on-demand-winning-over-riders (accessed on 21 June 2018).
- Steele, J. Ace Parking Says Uber, Lyft Have Cut Parking Business Up to 50% in Some Venues. San Diego Union Tribune. 22 February 2018. Available online: http://www.sandiegouniontribune.com/business/growth-development/sd-fi-ace-parking-uber-lyft-competition-20180222-story.html (accessed on 20 June 2018).
- Bergal, J. Airport Parking Takes Hit from Uber, Lyft. Pew Stateline. 18 July 2017. Available online: http://www.pewtrusts.org/en/research-and-analysis/blogs/stateline/2017/07/18/airport-parking-takes-hit-from-uber-lyft (accessed on 20 June 2018).
- Martin, E.; Shaheen, S.; Lidicker, J. Impact of Carsharing on Household Vehicle Holdings. Transp. Res. Rec. 2010, 2143, 150–158. [Google Scholar] [CrossRef]
- Menczer, W. Guaranteed Ride Home Programs: A Study of Program Characteristics, Utilization, and Cost. J. Public Transp. 2007, 10, 131–149. [Google Scholar] [CrossRef] [Green Version]
- Schaller, B. Empty Seats, Full Streets: Fixing Manhattan’s Traffic Problem; Technical Report; Schaller Consulting: Brooklyn, NY, USA, 2017; Available online: http://schallerconsult.com/rideservices/emptyseats.pdf (accessed on 15 June 2018).
- Li, Z.; Hong, Y.; Zhang, Z. Do On-demand Ride-sharing Services Affect Traffic Congestion? Evidence from Uber Entry. SSRN 2016. [Google Scholar] [CrossRef]
- City of New York Office of the Mayor. For-Hire Vehicle Transportation Study. Technical Report. 2016. Available online: https://www1.nyc.gov/assets/operations/downloads/pdf/For-Hire-Vehicle-Transportation-Study.pdf (accessed on 25 June 2018).
- Sperling, D. Epilogue: Pooling is the Answer. In Three Revolutions: Steering Automated, Shared and Electric Vehicles to a Better Future; Sperling, D., Ed.; Island Press: Washington, DC, USA, 2018; pp. 189–196. [Google Scholar]
- Brooks, R. Uber and the Future of Urban Mobility; Weekly Transportation Seminar Series; Arizona State University: Tempe, AZ, USA, 2018. [Google Scholar]
- Fagnant, D.J.; Kockelman, K.M. Dynamic Ride-Sharing and Fleet Sizing for a System of Shared Autonomous Vehicles in Austin, Texas. Transportation 2016, 45, 143–158. [Google Scholar] [CrossRef]
- Committee for Review of Innovative Urban Mobility Services. Between Public and Private Mobility: Examining the Rise of Technology-Enabled Transportation Services; Technical Report 319; Transportation Research Board: Washington, DC, USA, 2016. [Google Scholar] [CrossRef]
- Brown, A.; Taylor, B.D. Bridging the Gap between Mobility Haves and Have-nots. In Three Revolutions: Steering Automated, Shared and Electric Vehicles to a Better Future; Sperling, D., Ed.; Island Press: Washington, DC, USA, 2018; pp. 131–150. [Google Scholar]
- Horan, H. Will The Growth of Uber Increase Economic Welfare? Transp. Law J. 2017, 44, 33–105. [Google Scholar] [CrossRef]
- Somerville, H. True Price of an Uber Ride in Question as Investors Assess Firm’s Value. Reuters. 23 August 2017. Available online: https://www.reuters.com/article/us-uber-profitability/true-price-of-an-uber-ride-in-question-as-investors-assess-firms-value-idUSKCN1B3103 (accessed on 20 June 2018).
Figure 1.
Growth in mode share and daily use of for-hire vehicles (shaded areas represent 95% confidence intervals).
Figure 1.
Growth in mode share and daily use of for-hire vehicles (shaded areas represent 95% confidence intervals).

Figure 2.
Per capita use of for-hire vehicles, by metropolitan area size (shaded areas represent 95% confidence intervals).
Figure 2.
Per capita use of for-hire vehicles, by metropolitan area size (shaded areas represent 95% confidence intervals).

Figure 3.
Per capita use of ridehailing services, by geography (black lines indicate 95% confidence intervals).
Figure 3.
Per capita use of ridehailing services, by geography (black lines indicate 95% confidence intervals).

Figure 4.
Trends in percentage of Americans using a for-hire vehicle on a given day, by annual household income (shaded areas represent 95% confidence intervals).
Figure 4.
Trends in percentage of Americans using a for-hire vehicle on a given day, by annual household income (shaded areas represent 95% confidence intervals).

Figure 5.
Proportion of ridehailing trips made by ridehailing users (shaded area represents 95% confidence interval).
Figure 5.
Proportion of ridehailing trips made by ridehailing users (shaded area represents 95% confidence interval).

Figure 6.
For hire vehicle use, by age (shaded areas represent 95% confidence intervals).


Table 1.
Ridehailing use by demographic subgroups (margins of error indicate 95% confidence intervals).
Table 1.
Ridehailing use by demographic subgroups (margins of error indicate 95% confidence intervals).
| Percentage Who Have Used Ridehailing in the Last 30 Days | Average Number of Ridehailing Trips in the Last 30 Days for Ridehailing Users | |
|---|---|---|
| Race | ||
| White | ||
| Black or African American | ||
| Asian | ||
| Household Income | ||
| Less than $25,000 | ||
| $25,000–$49,999 | ||
| $50,000–$99,999 | ||
| $100,000 or more | ||
| Age | ||
| 16–19 | ||
| 20–29 | ||
| 30–39 | ||
| 40–49 | ||
| 50–59 | ||
| 60–69 | ||
| 70–79 | ||
| 80+ | ||
| Sex | ||
| Male | ||
| Female |
Table 2.
Logistic regression results.
| Variable | Odds Ratio | p-Value | 95% Conf Int. | |
|---|---|---|---|---|
| Low | High | |||
| Household size (base: household size 1) | ||||
| Household size 2 | 1.380 *** | 0.001 | 1.146 | 1.661 |
| Household size 3 | 0.913 | 0.492 | 0.704 | 1.184 |
| Household size 4+ | 0.687 ** | 0.008 | 0.521 | 0.905 |
| Worker | 1.412 *** | 0.000 | 1.344 | 1.483 |
| Homeowner | 0.752 *** | 0.000 | 0.713 | 0.793 |
| Male | 1.135 *** | 0.000 | 1.100 | 1.171 |
| Presence of children | ||||
| Children 0–12 | 1.000 | 0.998 | 0.928 | 1.078 |
| Children 13–17 | 0.980 | 0.642 | 0.901 | 1.066 |
| Income, household size 1 (base: $24,999 or less) | ||||
| $25,000–$50,000 | 1.270 | 0.110 | 0.947 | 1.702 |
| $50,000–$100,000 | 2.083 *** | 0.000 | 1.630 | 2.662 |
| More than $100,000 | 3.500 *** | 0.000 | 2.745 | 4.463 |
| Income, household size 2 (base: $24,999 or less) | ||||
| $25,000–$50,000 | 0.920 | 0.550 | 0.701 | 1.208 |
| $50,000–$100,000 | 1.456 ** | 0.001 | 1.156 | 1.835 |
| More than $100,000 | 2.867 *** | 0.000 | 2.301 | 3.573 |
| Income, household size 3 (base: $24,999 or less) | ||||
| $25,000–$50,000 | 0.956 | 0.778 | 0.700 | 1.306 |
| $50,000–$100,000 | 1.190 | 0.204 | 0.909 | 1.558 |
| More than $100,000 | 2.602 *** | 0.000 | 2.021 | 3.349 |
| Income, household size 4+ (base: $24,999 or less) | ||||
| $25,000–$50,000 | 0.832 | 0.255 | 0.607 | 1.141 |
| $50,000–$100,000 | 1.135 | 0.350 | 0.870 | 1.481 |
| More than $100,000 | 2.647 *** | 0.000 | 2.060 | 3.401 |
| Race (base: White) | ||||
| American Indian or Alaska Native | 0.812 | 0.152 | 0.611 | 1.080 |
| Asian | 0.779 *** | 0.000 | 0.717 | 0.847 |
| Black or African American | 0.762 *** | 0.000 | 0.700 | 0.828 |
| Multiple races | 0.897 * | 0.046 | 0.807 | 0.998 |
| Native Hawaiian or other Pacific Islander | 0.955 | 0.787 | 0.686 | 1.331 |
| Other | 0.846 * | 0.014 | 0.741 | 0.966 |
| Hispanic | 0.899 ** | 0.006 | 0.834 | 0.969 |
| Age (base: 16–19) | ||||
| 20–29 | 2.663 *** | 0.000 | 2.356 | 3.010 |
| 30–39 | 1.949 *** | 0.000 | 1.725 | 2.203 |
| 40–49 | 1.131 * | 0.045 | 1.003 | 1.274 |
| 50–59 | 0.647 *** | 0.000 | 0.572 | 0.732 |
| 60–69 | 0.446 *** | 0.000 | 0.392 | 0.507 |
| 70–79 | 0.312 *** | 0.000 | 0.268 | 0.363 |
| 80+ | 0.289 *** | 0.000 | 0.234 | 0.358 |
| No related adults in household | 2.045 *** | 0.000 | 1.801 | 2.322 |
| Out of town on travel day | 2.110 *** | 0.000 | 1.941 | 2.293 |
| Daily smartphone use by household member responding to recruitment survey | 3.141 *** | 0.000 | 2.864 | 3.444 |
| Vehicles per household member | ||||
| $24,999 or less | 0.794 ** | 0.008 | 0.669 | 0.941 |
| $25,000–$50,000 | 0.770 *** | 0.001 | 0.661 | 0.897 |
| $50,000–$100,000 | 0.753 *** | 0.000 | 0.689 | 0.824 |
| More than $100,000 | 0.918 ** | 0.010 | 0.860 | 0.980 |
| Days used public transit in last 30 days | ||||
| $24,999 or less | 1.040 *** | 0.000 | 1.031 | 1.049 |
| $25,000–$50,000 | 1.048 *** | 0.000 | 1.038 | 1.058 |
| $50,000–$100,000 | 1.060 *** | 0.000 | 1.052 | 1.067 |
| More than $100,000 | 1.065 *** | 0.000 | 1.059 | 1.071 |
| Walk trips in last 7 days | ||||
| $24,999 or less | 1.007 * | 0.012 | 1.001 | 1.012 |
| $25,000–$50,000 | 1.012 *** | 0.000 | 1.007 | 1.016 |
| $50,000–$100,000 | 1.013 *** | 0.000 | 1.009 | 1.016 |
| More than $100,000 | 1.016 *** | 0.000 | 1.013 | 1.020 |
| Bike trips in last 7 days | ||||
| $24,999 or less | 1.012 | 0.125 | 0.997 | 1.027 |
| $25,000–$50,000 | 1.048 *** | 0.000 | 1.024 | 1.072 |
| $50,000–$100,000 | 1.035 ** | 0.001 | 1.013 | 1.057 |
| More than $100,000 | 1.050 *** | 0.000 | 1.032 | 1.068 |
| Count of trips on travel day | ||||
| $24,999 or less | 1.024 * | 0.037 | 1.001 | 1.047 |
| $25,000–$50,000 | 1.030 ** | 0.002 | 1.011 | 1.050 |
| $50,000–$100,000 | 1.042 *** | 0.000 | 1.028 | 1.056 |
| More than $100,000 | 1.043 *** | 0.000 | 1.033 | 1.053 |
| Heavy rail in MSA | 0.979 | 0.574 | 0.908 | 1.055 |
| MSA size (base: not in MSA) | ||||
| Less than 250,000 | 1.453 * | 0.011 | 1.090 | 1.936 |
| 250,000–499,999 | 1.197 | 0.357 | 0.817 | 1.753 |
| 500,000–999,999 | 1.193 | 0.345 | 0.827 | 1.722 |
| 1,000,000–2,999,999 | 1.945 *** | 0.001 | 1.337 | 2.830 |
| More than 3,000,000 | 1.855 ** | 0.002 | 1.264 | 2.722 |
| Home block group density, not in MSA (base: 0–99 persons/sq. mi.) | ||||
| 100–499 persons/sq. mi. | 1.077 | 0.604 | 0.813 | 1.428 |
| 500–999 persons/sq. mi. | 1.314 | 0.108 | 0.942 | 1.834 |
| 1000–1999 persons/sq. mi. | 1.290 | 0.139 | 0.921 | 1.808 |
| 2000–3999 persons/sq. mi. | 1.082 | 0.688 | 0.737 | 1.588 |
| 4000–9999 persons/sq. mi. | 1.103 | 0.688 | 0.684 | 1.777 |
| 10,000–24,999 persons/sq. mi. | 0.832 | 0.793 | 0.211 | 3.285 |
| Home block group density, MSA with less than 250,000 people (base: 0–99 persons/sq. mi.) | ||||
| 100–499 persons/sq. mi. | 0.940 | 0.666 | 0.711 | 1.244 |
| 500–999 persons/sq. mi. | 1.084 | 0.601 | 0.801 | 1.468 |
| 1000–1999 persons/sq. mi. | 1.451 ** | 0.008 | 1.101 | 1.911 |
| 2000–3999 persons/sq. mi. | 1.273 | 0.085 | 0.968 | 1.675 |
| 4000–9999 persons/sq. mi. | 1.569 ** | 0.002 | 1.184 | 2.079 |
| 10,000–24,999 persons/sq. mi. | 1.381 | 0.280 | 0.769 | 2.480 |
| > 25,000 persons/sq. mi. | 4.676 * | 0.023 | 1.232 | 17.750 |
| Home block group density, MSA with 250,000 to 499,999 people (base: 0–99 persons/sq. mi.) | ||||
| 100–499 persons/sq. mi. | 1.562 * | 0.027 | 1.052 | 2.319 |
| 500–999 persons/sq. mi. | 2.053 *** | 0.000 | 1.379 | 3.057 |
| 1000–1999 persons/sq. mi. | 2.500 *** | 0.000 | 1.714 | 3.647 |
| 2000–3999 persons/sq. mi. | 2.572 *** | 0.000 | 1.777 | 3.722 |
| 4000–9999 persons/sq. mi. | 2.777 *** | 0.000 | 1.923 | 4.009 |
| 10,000–24,999 persons/sq. mi. | 3.735 *** | 0.000 | 2.433 | 5.734 |
| > 25,000 persons/sq. mi. | 3.170 * | 0.044 | 1.031 | 9.743 |
| Home block group density, MSA with 500,000 to 999,999 people (base: 0–99 persons/sq. mi.) | ||||
| 100–499 persons/sq. mi. | 1.462 * | 0.040 | 1.017 | 2.101 |
| 500–999 persons/sq. mi. | 2.077 *** | 0.000 | 1.446 | 2.982 |
| 1000–1999 persons/sq. mi. | 2.317 *** | 0.000 | 1.639 | 3.278 |
| 2000–3999 persons/sq. mi. | 3.097 *** | 0.000 | 2.211 | 4.340 |
| 4000–9999 persons/sq. mi. | 3.076 *** | 0.000 | 2.181 | 4.338 |
| 10,000–24,999 persons/sq. mi. | 3.632 *** | 0.000 | 2.405 | 5.487 |
| > 25,000 persons/sq. mi. | 5.110 *** | 0.000 | 2.501 | 10.440 |
| Home block group density, MSA with 1,000,000 to 2,999,999 people (base: 0–99 persons/sq. mi.) | ||||
| 100–499 persons/sq. mi. | 1.242 | 0.259 | 0.853 | 1.810 |
| 500–999 persons/sq. mi. | 2.044 *** | 0.000 | 1.398 | 2.987 |
| 1000–1999 persons/sq. mi. | 2.118 *** | 0.000 | 1.485 | 3.021 |
| 2000–3999 persons/sq. mi. | 2.356 *** | 0.000 | 1.671 | 3.323 |
| 4000–9999 persons/sq. mi. | 2.876 *** | 0.000 | 2.052 | 4.032 |
| 10,000–24,999 persons/sq. mi. | 2.755 *** | 0.000 | 1.917 | 3.959 |
| > 25,000 persons/sq. mi. | 7.944 *** | 0.000 | 4.483 | 14.080 |
| Home block group density, MSA with 3 million people or more (base: 0–99 persons/sq. mi.) | ||||
| 100–499 persons/sq. mi. | 1.686 ** | 0.005 | 1.172 | 2.426 |
| 500–999 persons/sq. mi. | 2.087 *** | 0.000 | 1.453 | 2.998 |
| 1000–1999 persons/sq. mi. | 2.756 *** | 0.000 | 1.948 | 3.899 |
| 2000–3999 persons/sq. mi. | 3.168 *** | 0.000 | 2.254 | 4.452 |
| 4000–9999 persons/sq. mi. | 3.561 *** | 0.000 | 2.539 | 4.994 |
| 10,000–24,999 persons/sq. mi. | 4.605*** | 0.000 | 3.265 | 6.496 |
| > 25,000 persons/sq. mi. | 6.967 *** | 0.000 | 4.870 | 9.967 |
* = p < 0.05, ** = p < 0.01, *** = p < 0.001. Not shown: season and proxy for geographic sampling stratum.
© 2018 by the authors. Licensee MDPI, Basel, Switzerland. This article is an open access article distributed under the terms and conditions of the Creative Commons Attribution (CC BY) license (http://creativecommons.org/licenses/by/4.0/).
Share and Cite
MDPI and ACS Style
Conway, M.W.; Salon, D.; King, D.A. Trends in Taxi Use and the Advent of Ridehailing, 1995–2017: Evidence from the US National Household Travel Survey. Urban Sci. 2018, 2, 79. https://0-doi-org.brum.beds.ac.uk/10.3390/urbansci2030079
AMA Style
Conway MW, Salon D, King DA. Trends in Taxi Use and the Advent of Ridehailing, 1995–2017: Evidence from the US National Household Travel Survey. Urban Science. 2018; 2(3):79. https://0-doi-org.brum.beds.ac.uk/10.3390/urbansci2030079
Chicago/Turabian StyleConway, Matthew Wigginton, Deborah Salon, and David A. King. 2018. "Trends in Taxi Use and the Advent of Ridehailing, 1995–2017: Evidence from the US National Household Travel Survey" Urban Science 2, no. 3: 79. https://0-doi-org.brum.beds.ac.uk/10.3390/urbansci2030079