Land-Use/Land-Cover Change Analysis and Urban Growth Modelling in the Greater Accra Metropolitan Area (GAMA), Ghana


1
Institute of Geodesy and Geoinformation, Technical University Berlin, Faculty VI, Straße des 17. Juni 135, 10623 Berlin, Germany
2
Department of Geography, Christian-Albrechts-Universität zu Kiel, Ludewig-Meyn-Straße 14, 24098 Kiel, Germany
*
Author to whom correspondence should be addressed.
Urban Sci. 2019, 3(1), 26; https://0-doi-org.brum.beds.ac.uk/10.3390/urbansci3010026
Submission received: 21 January 2019
/
Revised: 18 February 2019
/
Accepted: 21 February 2019
/
Published: 27 February 2019
Abstract
:A rapid increase in the world’s population over the last century has triggered the transformation of the earth surface, especially in urban areas, where more than half of the global population live. Ghana is no exception and a high population growth rate, coupled with economic development over the last three decades, has transformed the Greater Accra region into a hotspot for massive urban growth. The urban extent of the region has expanded extensively, mainly at the expense of the vegetative cover in the region. Although urbanization presents several opportunities, the environmental and social problems cannot be underestimated. Therefore, the need to estimate the rate and extent of land use/land cover changes in the region and the main drivers of these changes is imperative. Geographic Information Systems (GIS) and remote sensing techniques provide effective tools in studying and monitoring land-use/land-cover change over space and time. A post classification change detection of multiple Landsat images was conducted to map and analyse the extent and rate of land use/land cover change in the region between 1991 and 2015. Subsequently, the urban extent of the region was forecasted for the year 2025 using the Markov Chain and the Multi-Layer Perceptron neural network, together with drivers representing proximity, biophysical, and socio-economic variables. The results from the research revealed that built-up areas increased by 277% over the 24-year study period. However, forest areas experienced massive reduction, diminishing from 34% in 1991 to 6.5% in 2015. The 2025 projected land use map revealed that the urban extent will massively increase to cover 70% of the study area, as compared to 44% in 2015. The urban extent is also anticipated to spill into the adjoining districts mainly on the western and eastern sides of the region. The success of this research in generating a future land-use map for 2025, together with the other significant findings, demonstrates the usefulness of spatial models as tools for sustainable city planning and environmental management, especially for urban planners in developing countries.
1. Introduction
The global population has rapidly increased over the last century and it will continue to augment in the years to come, although at a lower rate. As of mid-2017, the world population stood at 7.6 billion, indicating that the global population had increased by roughly one billion in the last twelve years [1]. By 2050, the world population will reach 9.7 billion, with more than half of the growth occurring between now and 2050 being projected to happen in Africa. A significant percent of this growth is expected to take place in urban centres. As of 2014, about 40% of the African population were living in urban centres. The percentage of urban dwellers in Africa has been forecasted to reach 56% by 2050 [2]. These demographic changes, coupled with economic transformations and technological advancements, have shaped the face of the earth in both negative and positive ways.
Land-use change, including forest degradation and urbanization, are the results of the interaction between anthropogenic and biophysical factors. Land use changes are influenced by a combination of several factors and no single factor can solely account for these changes. These interactions are different in every region, meaning that land-use types are impacted and modified in different ways. McNeil et al. [3] grouped the drivers of land-use/land-cover change into economic, political, demographic, and environmental forces. Demographic factors, such as rapid population growth, have the tendency to contribute to the over exploitation of natural resources and the concentration of people in a few places. For instance, urban areas cover less than 2% of the earth surface but more than half of the world’s population reside in urban areas. Therefore, many scholars consider population growth as the main driver of land use change, especially in developing countries [4,5,6]. McNeil et al. [3] however argued that political and economic drivers; which includes technological advancements are the most significant drivers of land use change. Seto and Kaufman [7] in their studies found a positive correlation between urban expansion and foreign direct investment. Recently, more attention has also been allocated to the role of climate change in land use change [8].
Comparatively, Ghana has a higher proportion of urban dwellers, with about half of the Ghanaian population living in urban centres as of 2010 [9]. This number is expected to reach 70% by 2050. However, the urban population of Ghana is highly concentrated in cities, such as Accra, Kumasi, and Tamale. In 2010, for example, the Greater Accra region, which is the regional capital of Ghana had an urban population of 90.5% [9]. The urbanization process is mainly linked to economic growth, commercialization, and industrialization, as well as rural-urban migration and globalization [10]. At the heart of this urbanization process in Accra is the Greater Accra Metropolitan Area (GAMA), which has evolved from a group of coastal fishing communities to become the economic hub of Ghana, attracting people from all over the country and other parts of the world [11]. GAMA is the most economically vibrant district in the region, encompassing Accra and Tema. which are the economic nuclei of the Greater Accra region. As the regional capital of Ghana, the region attracts a lot of people from different parts of the country and all over the world, which is mainly due to the availability of economic opportunities. The implementation of modernization strategies that are based on import substitution in the post-independence era provided the impetus for the rapid urbanization of the region. Part of these strategies included the creation of the port city of Tema and the establishment of industrial estates in Accra. The concentration of the head offices of major banking and commercial companies, manufacturing and industrial firms, as well as other political activities further strengthened the economic status of the region. Between 1994 and 1999, GAMA alone attracted about 80% of all foreign direct investment in Ghana. Presently, GAMA has expanded to include the areas of Accra, Tema, and its surroundings, it and has the highest urban population growth rate in Ghana. Between 1985 and 2000, the urban extent of GAMA increased by 160%, with the urban population also increasing by more than 50% within the same period [12]. The population of GAMA is projected to more than double to 10.5 million people by 2040 [9]. Indeed, the urbanization process in Accra has reached a saturation phase and virtually the entire population is expected to become urban in the next few years.
Despite the considerable economic growth and development that the GAMA has experienced, the region faces several environmental and social problems. The area grew at such a rapid rate that the national and local authorities were unable to provide the necessary infrastructures to match the region’s rate of expansion. Konadu Agyemang [13] asserts that the rapid expansion of Accra’s urban population has created a situation whereby a huge gap exists between the demand and the need for housing facilities and other related infrastructure and their provisioning. The region has experienced an increase in the number and size of informal settlements as a result of inadequate housing facilities. Waste management remains a vivid problem and it has overwhelmed the region for several years now. For instance, only 15% of the metropolitan area is covered by sewage systems, while the existing sewage system is in a very deplorable state [14]. Furthermore, only 67.7% of solid waste that is generated in the region is collected, with the rest being thrown into open spaces and drainages [15]. Due to improper city planning and monitoring, some residents have built houses in waterways that have resulted in annual floods in the city. Studies conducted also indicate that the green spaces within the city have been drastically reduced to only a few patches that are still under threat from urban expansion. City authorities have been unable to monitor the urbanization process in the region and have failed to provide concrete planning directives as well as sustainable city development policies. Indeed, the city has been allowed to grow “naturally”, with little control over the urbanization process. This has been further made difficult by limited and outdated spatial monitoring techniques.
Over the last three decades, advancements in remote sensing technologies have made it possible to study physical changes and patterns [16]. Remote sensing and Geographic Information Systems (GIS) techniques provide information and the necessary tools to study and understand land use/land cover (LULC) changes over time. GIS and remote sensing have become important tools for conducting change analysis in different parts of the world [17]. For developing countries, where geospatial technologies are not well developed, remote sensing data, especially Landsat images, provide a suitable option for monitoring urban change and expansion. Several scholars have been able to use remote sensing data to successfully quantify urban change, as well as its rate of change [17,18,19]. Prior urban studies in Accra have analysed and exploited remotely sensed data for analyses of urban growth in the context of population growth, urban ecology, socio-economic indicators, etc. In Ghana, Møller and Yankson conducted early efforts to map urban expansion using remote sensing data [20]. They assessed the suitability of using Landsat Thematic Mapper images for urban change studies, as well as producing a land cover map of Accra. For a similar study area, Stow et al. [21] examined the relationship between urban vegetation change and the housing quality index while using remote sensing and statistical techniques. Stow et al. [22] also analysed and examined the relationship between population growth and land cover change in southern Ghana using remote sensing techniques. The research revealed that population growth was higher than built-up expansion in the Accra Metropolitan Assembly. Generally, these studies lack in-depth class-by-class analysis and no future LULC simulation and projection has yet been conducted in the region. This is the first paper to model and predict the urban extent of the Greater Accra Metropolitan Area and it also seeks to demonstrate how spatial models can be used in developing countries to monitor and track environmental and social changes, including forest loss and urban expansion.
Different scholars have applied many land use modeling techniques with varying theoretical basis, assumptions, and inputs to model and predict land use change. Several scholars have reviewed and applied these techniques in different study areas and research fields. Musa et al. [23] provide an overview of several urban growth models and initiatives. Pijanowski et al. [24] used the neural network to project urban expansion in the Tehran Metropolitan area. Attua and Fisher [6] also used the Markov chain model to predict land use change in the New Juaben municipality of Ghana. Koranteng and Niedzwiecki [25] projected forest loss in the Ashanti region of Ghana using the Land Change Modeler tool, which was embedded in the software IDRISI. Samardžić et al. present the incorporation of Support Vector Machines (SVL) into land use modelling [26]. Ahmed and Ahmed [27] conducted a comparative study on different models for predicting land use change and concluded that a combination of Multi-Layer Perceptron (MLP) neural network and Markov Chain produced the most accurate land use change prediction
Objectives
The objective of this study is to analyse the urban land use change in the Greater Accra Metropolitan Area between 1991 and 2015 to provide a better understanding regarding the extent, rate, and pattern of urban land use change in the region. It also aims to provide an overview of the main forces driving urban expansion in the region and predict the urban extent of the region by 2025 while using a hybrid Neural Network Markov Chain model.
2. Materials and Methods
2.1. Study Area
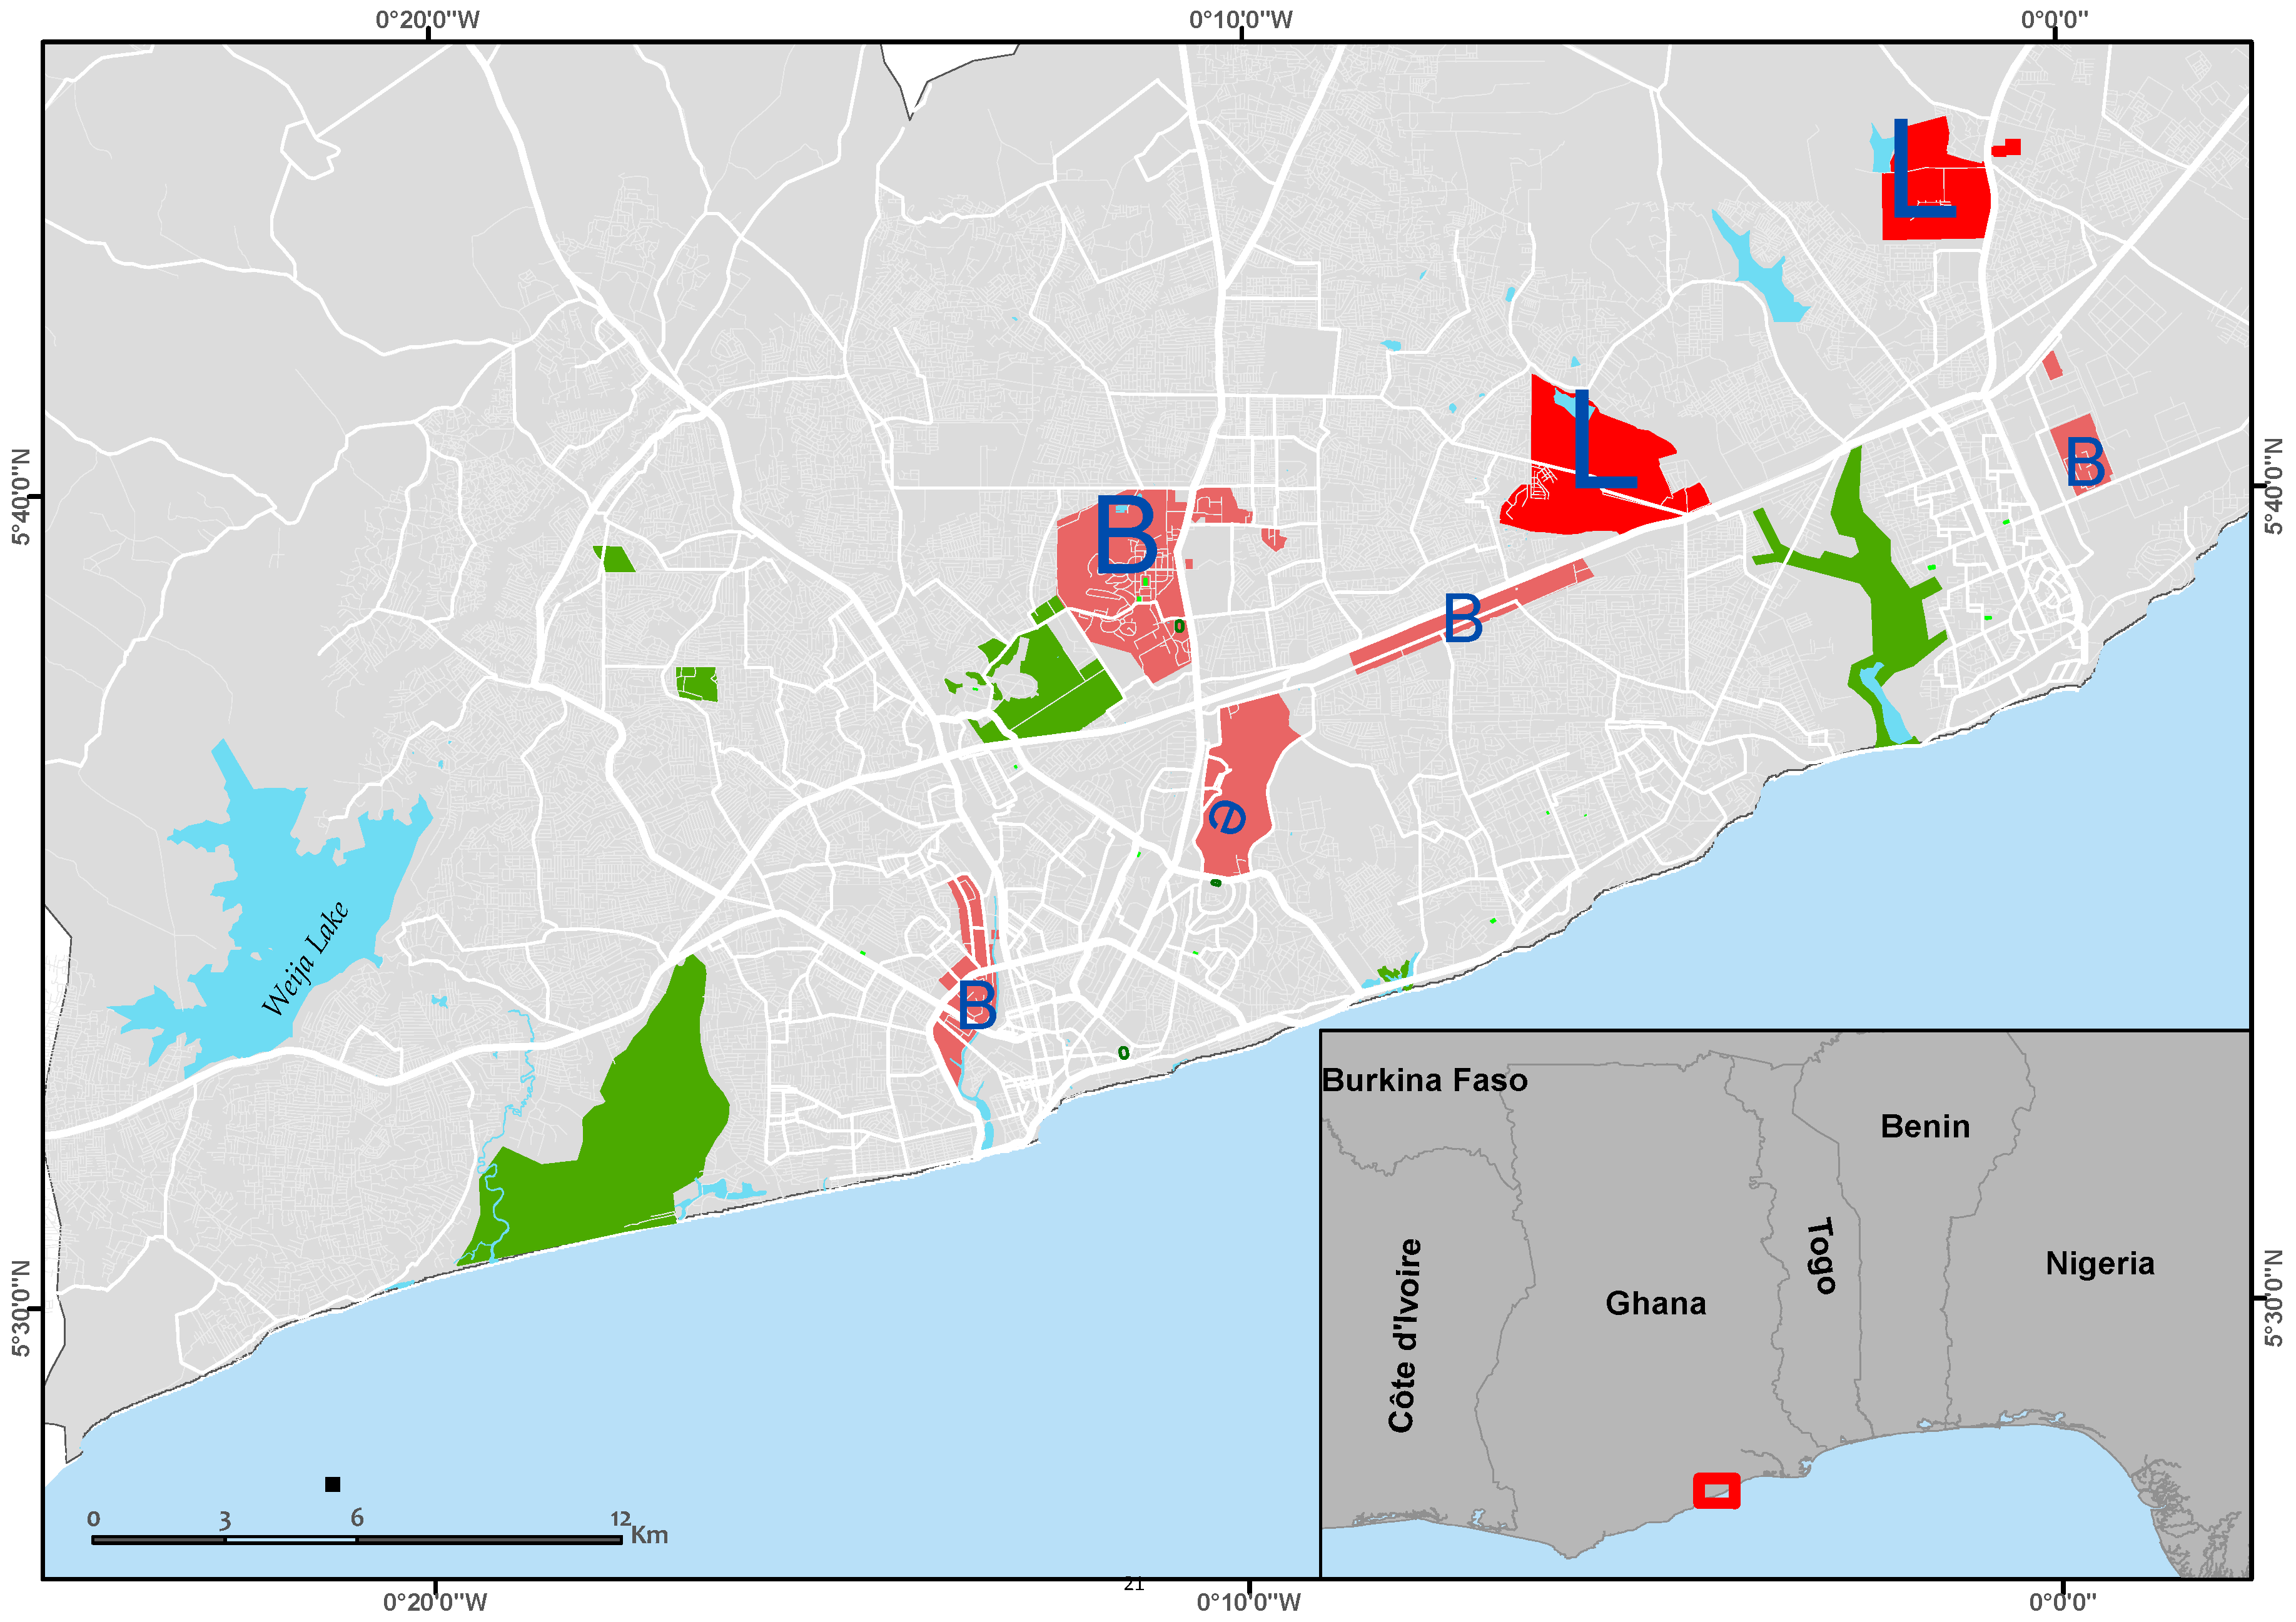
The Greater Accra Metropolitan area is located between 5°5′27″ to 5°28′2″ north latitude and 0°4′58″ east longitude to 0°37′2″ west longitude along the Atlantic coast of Ghana (Figure 1). The size of the study area is approximately 1585 km2. The topography of the region varies from flat to gently undulating slopes that rise to 75 m at the foothills with a few isolated hills and rock outcrops. The region lies in the dry coastal equatorial climatic zone and it has two raining seasons. The first season starts in March and ends in July, while the second season starts in September and ends in November [28]. The rains are mostly intensive short storms that normally cause floods in most parts of the region. Mean monthly temperature ranges from 24.7 °C in August to 33 °C in March, with an annual average of 26.8 °C [29]. Coastal savannah shrubs interspersed with thickets mainly cover the region. The grasses are short and barely grow beyond one meter with the trees growing to an average height of five meters. However, it is believed that much of the area was once covered with dense forest, but has been lost due to climate change and human activities [30].
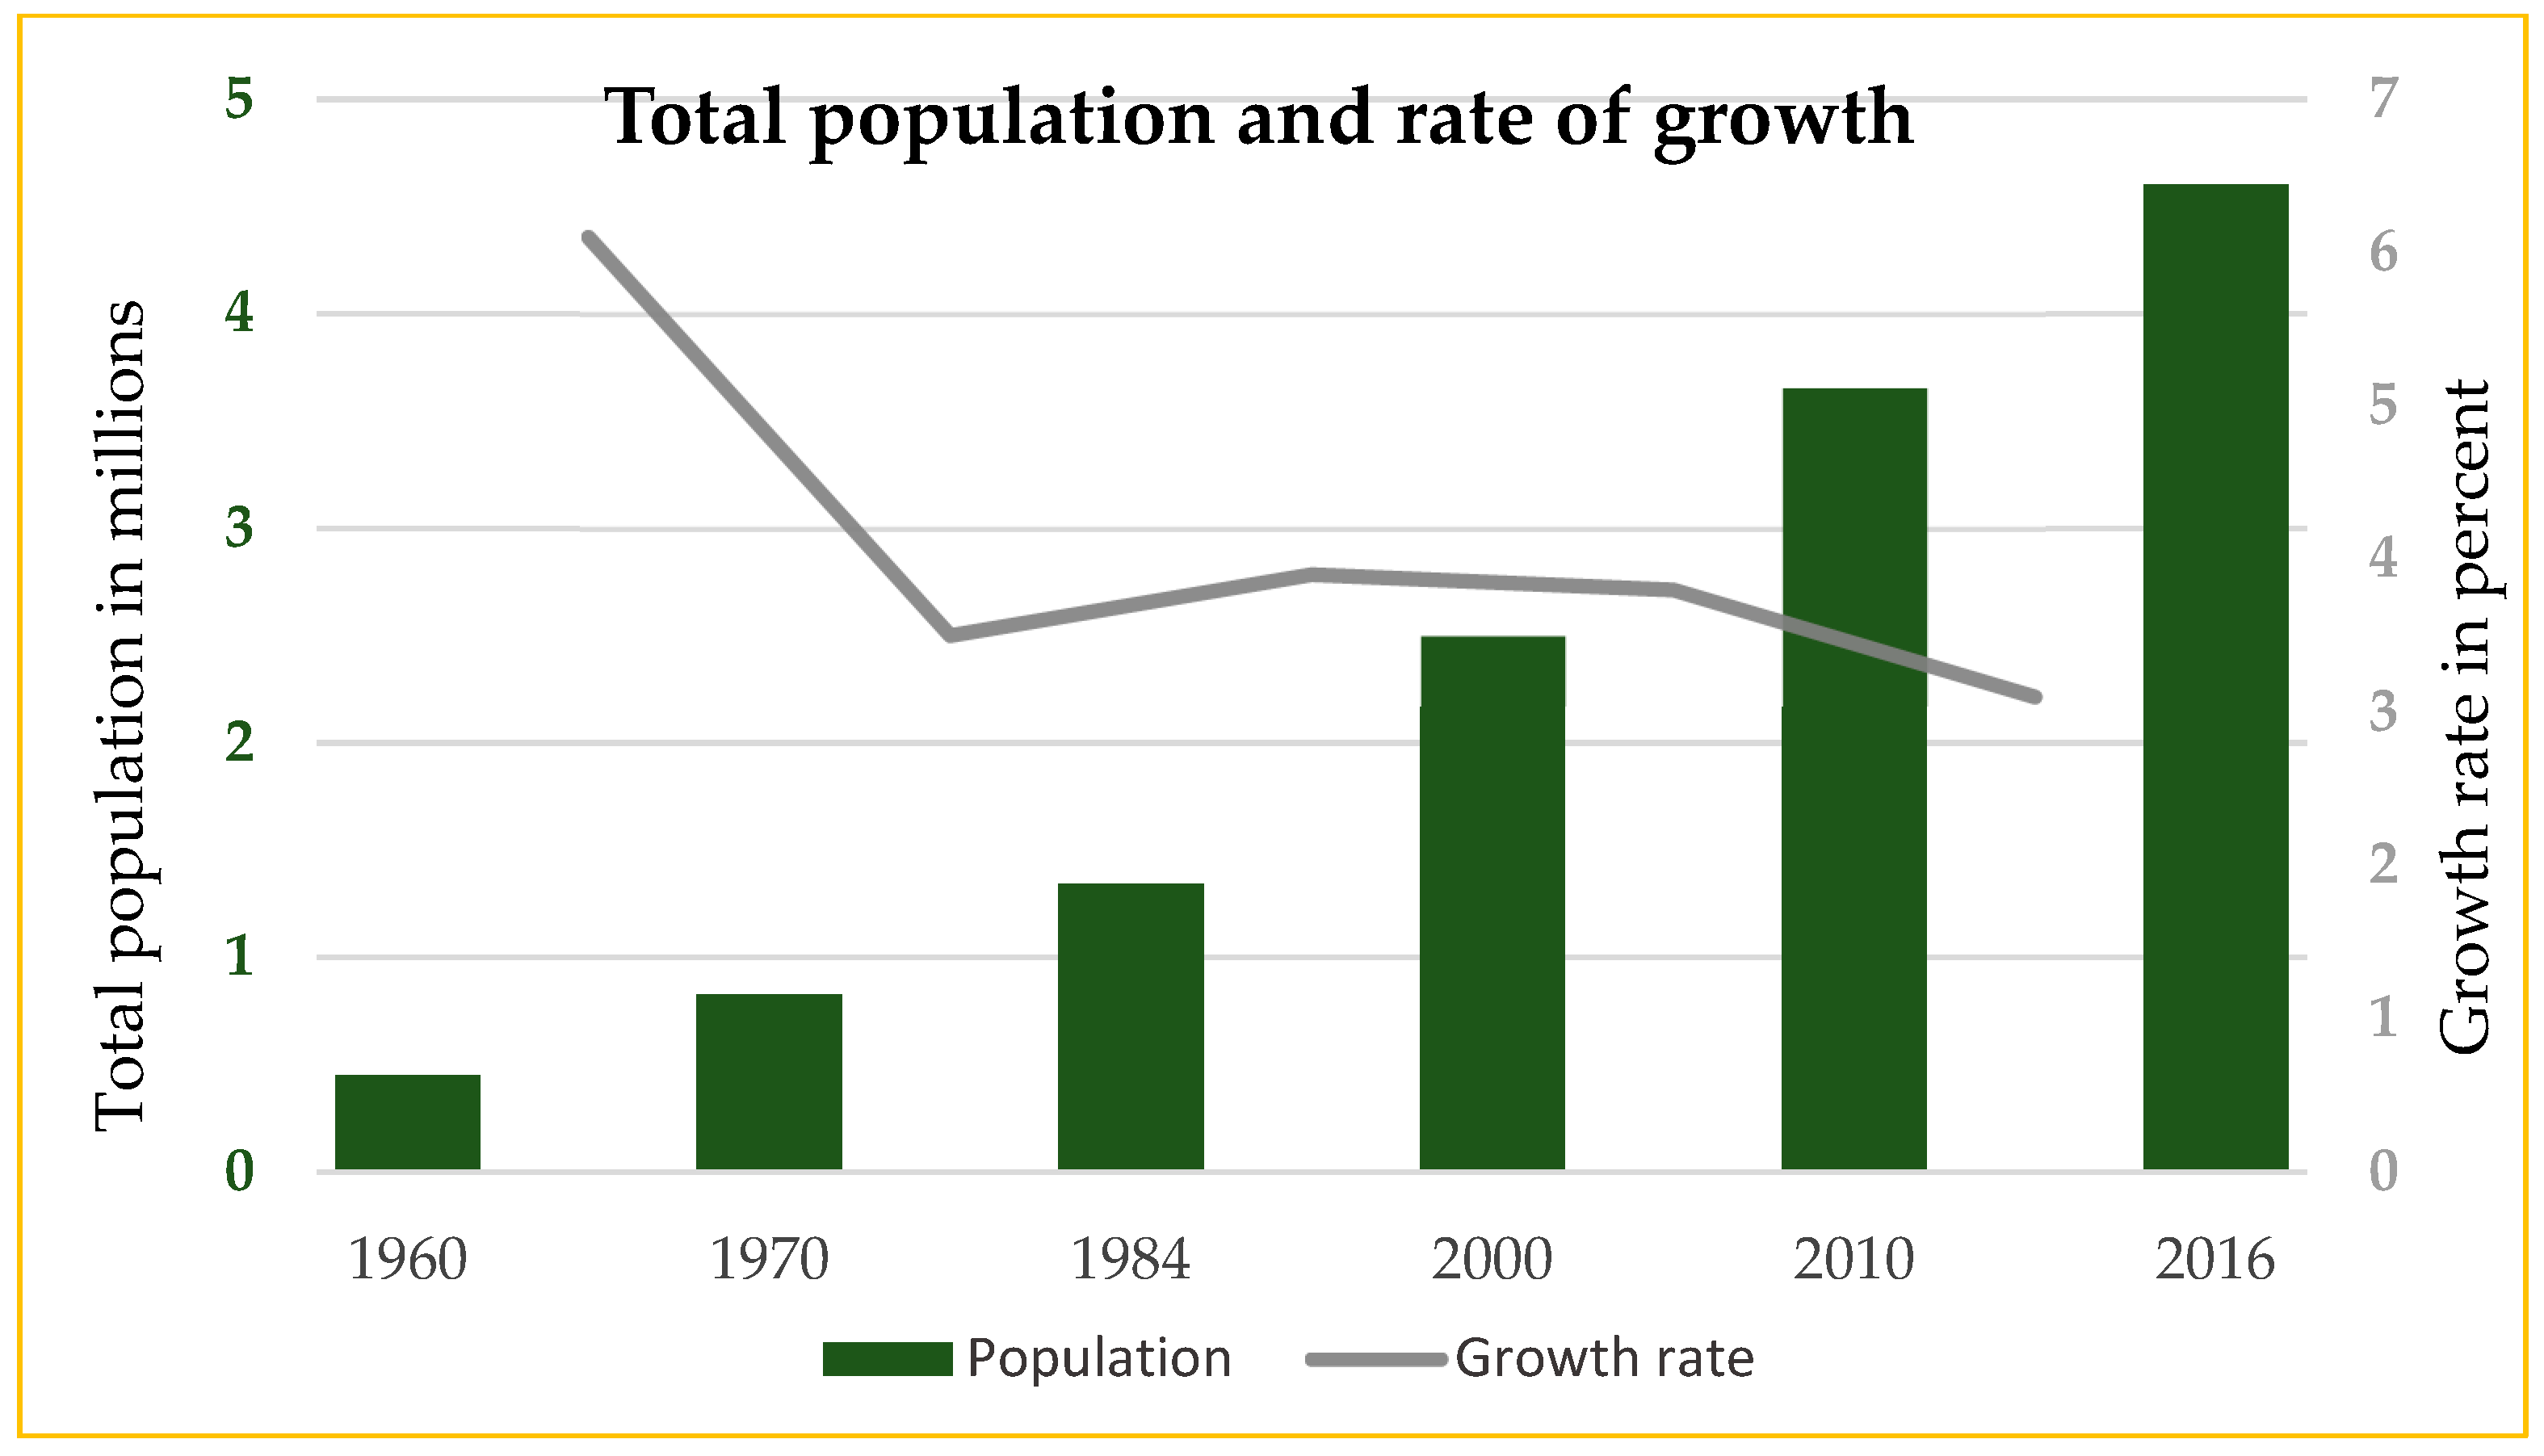
The region has one of the highest population densities in Ghana with a population of 4.6 million people as of 2016, with an average annual population growth rate of 3.5% between 2000 and 2010 [31] (Figure 2). The population is projected to more than double to 10.5 million by 2040 [9]. The region accounts for 25% of Ghana’s Gross Domestic Product (GDP). GAMA also accounts for 32% of formal urban employment and 28% of informal urban employment in the country [15]. It also has the lowest incidence of poverty across the country, with a rate of 5.6%, which is much lower than the national rate of 24.2% in 2011/2012. Income inequality has also improved over the last few years, with the rates falling from 41.9% in 2005/2006 to 37% in 2012/2013 [31].
2.2. Data
The research was conducted using Landsat images as the prime remote sensing data due to the availability of images for an extensive period of time as compared to other satellite types. Four satellite images, specifically Landsat 4 TM, Landsat 7 ETM, Landsat 7 ETM+, and Landsat 8 OLI, for the years 1991, 2000, 2009, and 2015, respectively, were obtained from the United States Geological Survey (USGS) online data portal (Table 1). In order to obtain images with less clouds and avoid extreme difference in land cover reflectance, the images were acquired between December and early February, which corresponds to the dry season in Ghana. The unavailability of images for some years and the presence of clouds and scan lines on some of the images made it impossible to maintain a constant year difference between the four satellite images that were used in the study. All of the images were radiometrically calibrated using the Fast Line-of-Sight Atmospheric Analysis of Hypercubes (FLAASH) tool in the software package ENVI version 5.1. The tropical atmospheric and urban aerosol parameters were selected from the Moderate Resolution Atmospheric Transmission (MODTRAN) model for calibrating the images. The images were also projected into the Universal Traversal Mercator (UTM) zone 30 North projection.
Several ancillary data were also collected for this research. The ASTER Global Digital Elevation Model (ASTGTM) v2 was retrieved from the NASA online data portal. Vector data of roads, water bodies, administrative boundaries, and towns were also obtained from the RS/GIS lab of the University of Ghana. The topographic maps of the region were also acquired from the Center for Remote Sensing and Geographic Information Services (CERSGIS); University of Ghana. All of the datasets used in the study were geometrically calibrated using UTM zone 30 North projection.
2.3. Classification and Accuracy Assessment
The images were classified using the maximum likelihood classification algorithm, which is a supervised classification and one of the most widely used classification techniques. The maximum likelihood classification algorithm is popular among remote sensing researchers because of its strong theoretical foundation and the ability to accommodate varying data, LULC types, and satellite systems [32]. Supervised classification groups pixels into classes by comparing the spectral properties of each pixel to a set of representative pixels, which are known as training data or sample specified by the user. The USGS Land use/land cover classification system developed by Anderson et al. [33] was adopted to identify and group the LULC feature in this research (Table 2). However, the classification system was slightly modified to suit the study area.
Prior to classification, principal component analysis was performed to visually enhance the images and reduce redundancy in the images. Training samples were collected for each land cover type by creating polygons around the features and areas that are representative of each LULC type. The polygons were randomly created across the image in order to capture the spectral variability within each land cover type. The training samples were collected using the researcher’s personal knowledge and experience of the study area, as well as Google Earth and topographic maps. After all of the training samples were collected, the polygons for each LULC type were subsequently converted into Region of Interests (ROI) for classification using the Maximum Likelihood algorithm in ENVI.
The accuracies of the resulting land use maps were assessed while using the confusion matrix. The confusion matrix is able to generate several measurements of quality, which includes overall accuracy, producer accuracy, user accuracy, and Kappa coefficient. The accuracy is calculated by comparing the corresponding ROI that is generated from a reference data with the classified land use maps. A minimum of 70 ROIs were collected for each LULC class using topographic maps, satellite images, and Google Earth. The post-classification change detection technique was used to quantify, identify, and describe the differences in the land use maps produced. This technique is capable of producing a complex matrix of change and also minimizing the effects of sensor and atmospheric differences between two dates by using classified images [34].
2.4. Urban Land Use Change Modelling
The Land Change Modeller (LCM), embedded in the software Terrset, was used to model and predict the urban extent of the region for the year 2025. Before the model could be parameterized, all of the datasets had to be harmonized to the have the same characteristics. All of the different datasets used were pre-processed to have the same projection, spatial resolution, and dimension. Additionally, the land cover maps used also had the same values and corresponding legends and a background value of zero.
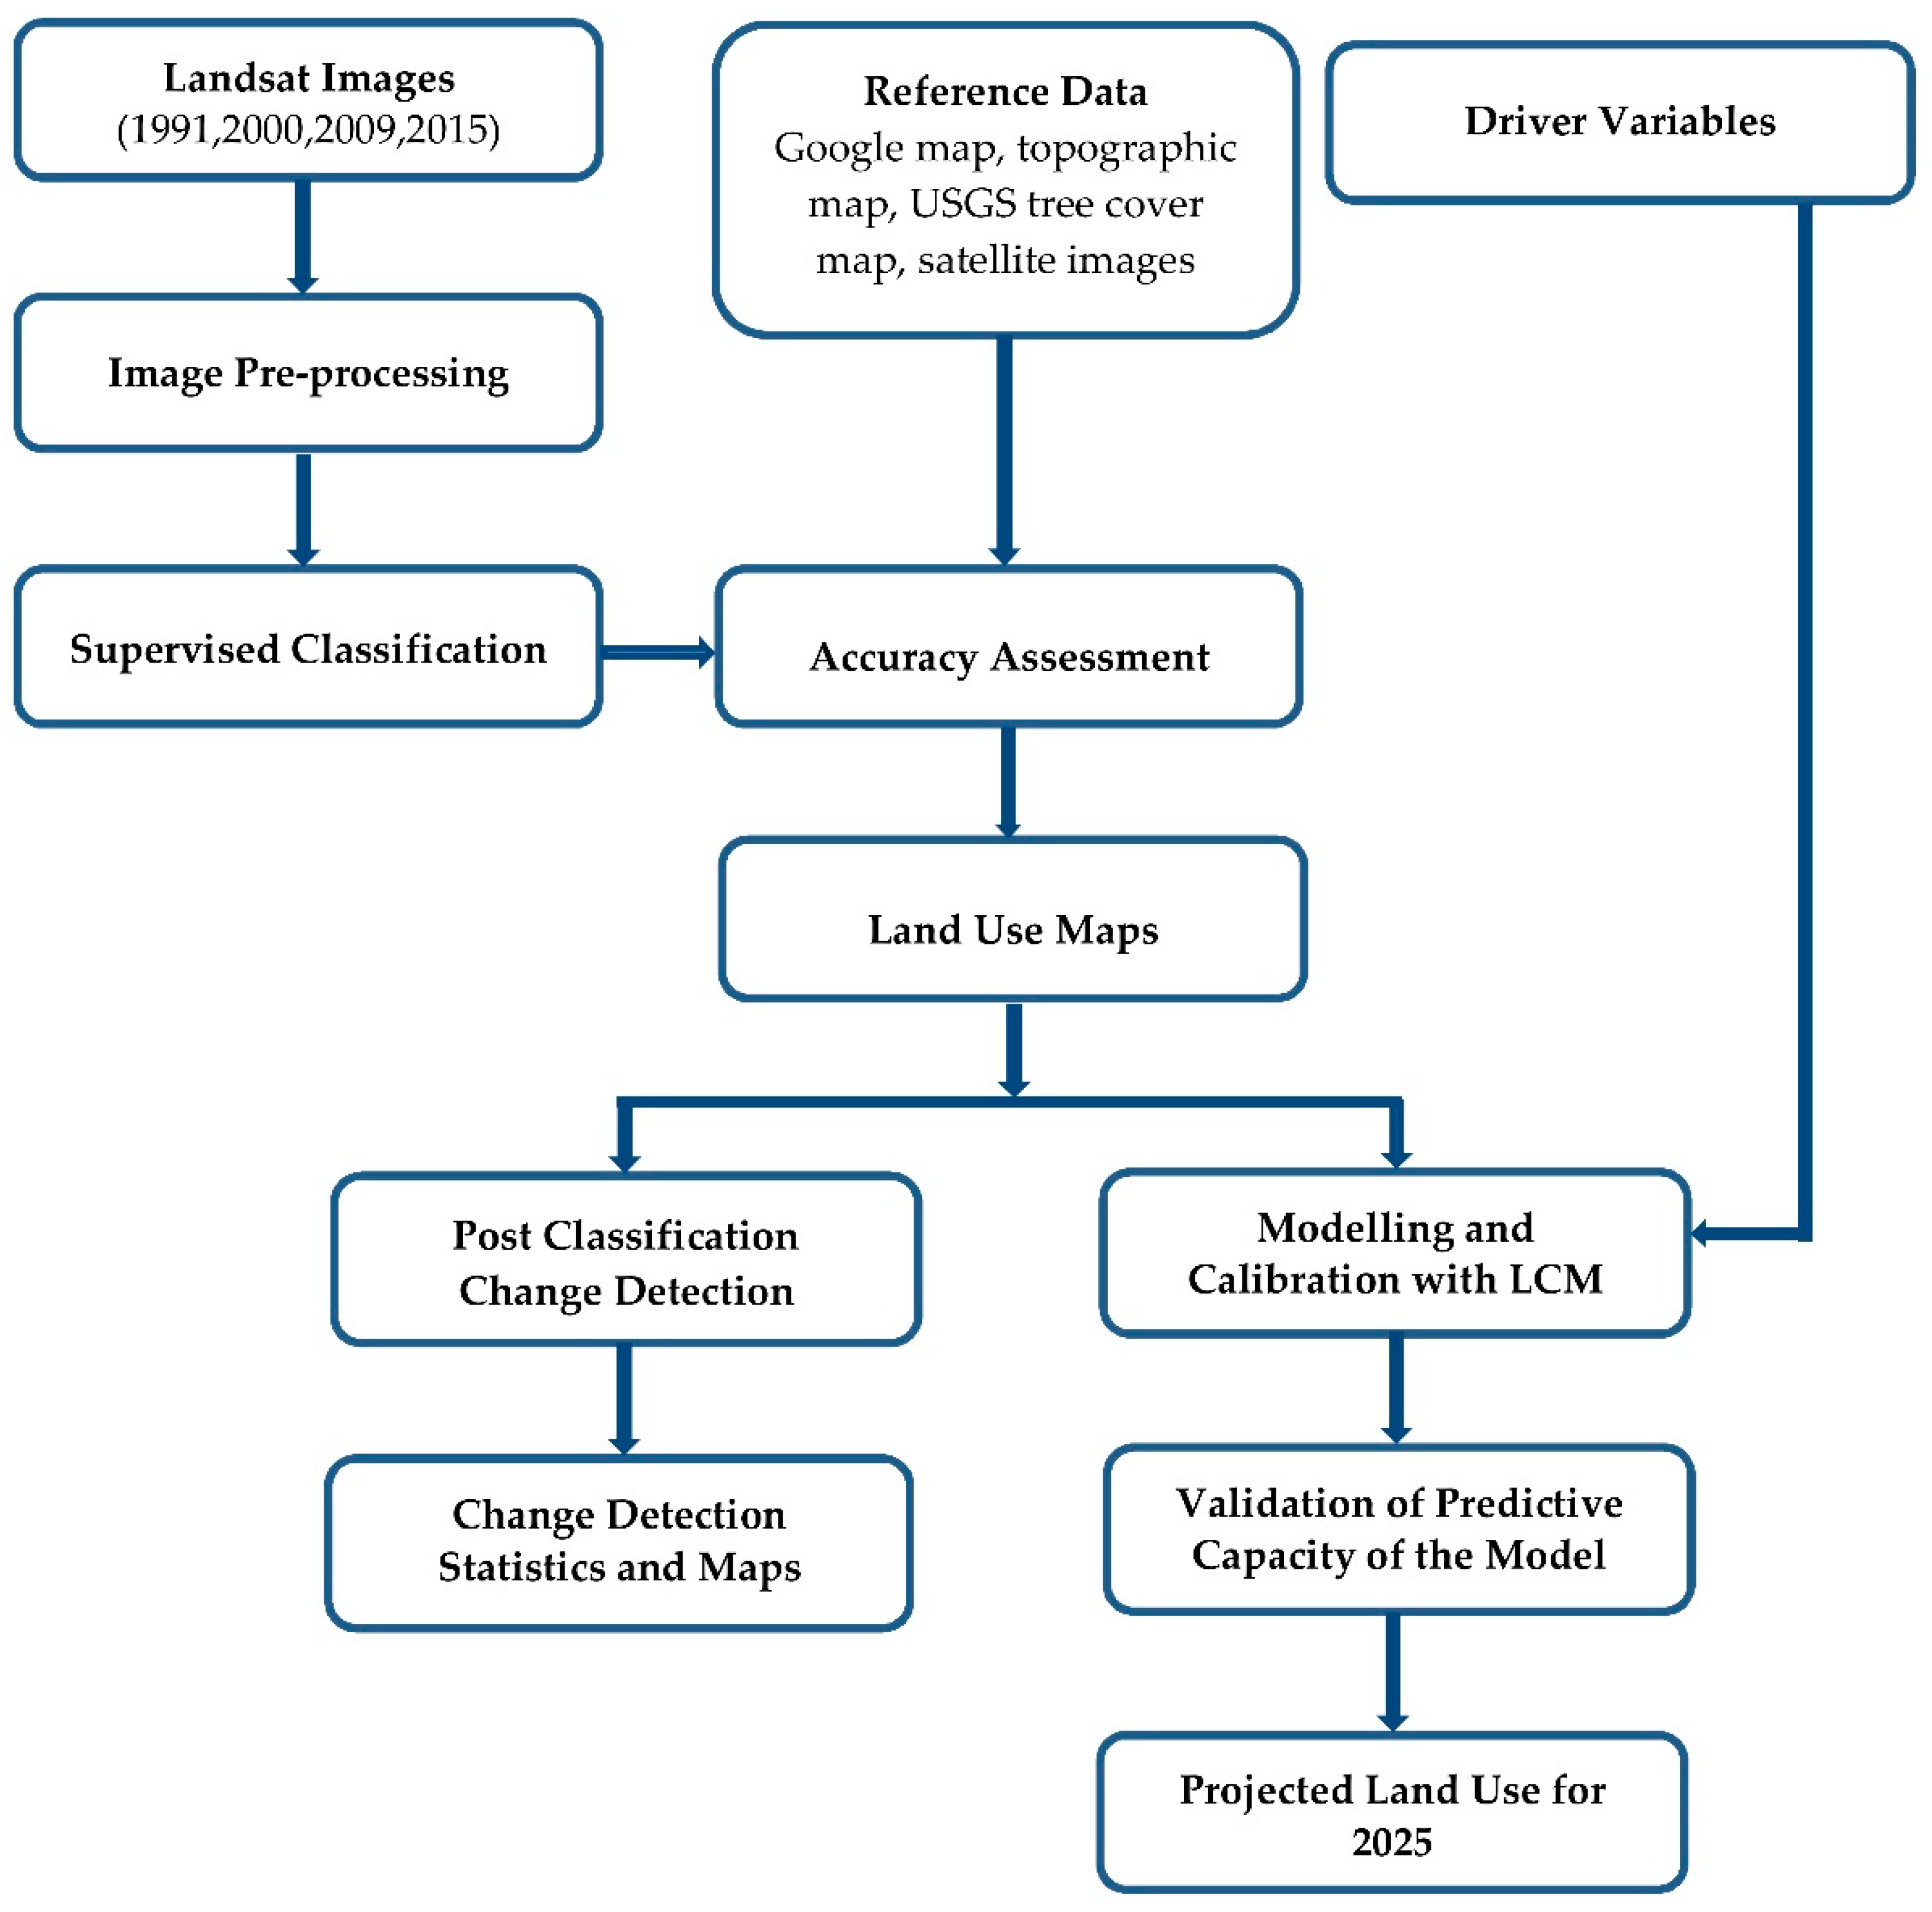
In setting up the LCM model, the 2000 and 2009 land use maps that were generated from the image classification were used as the base maps. The two land use maps were reclassified into three land cover class categories in order to improve the accuracy of the model. The main focus of the study was urban growth rather than the other land use transitions. Furthermore, the other LULC types have exhibited little transformation over time in the change analysis. Grassland and forest were merged together, forming one class called Vegetation. Bare soil, which covered less than 1% of the study area and mostly located in urban areas was merged with built-up. The water bodies were left unchanged. Figure 3 summarizes the entire process chain.
2.4.1.Transition Potential and Driver Variable
Transition potential expresses the likelihood that a particular land use type will change in the future. In LCM, change analysis and predictions are performed using a set of empirically evaluated transition sub-models. A transition sub-model may be made up of a single land cover transition or a group of transitions that are assumed to have the same explanatory or driver variables. The transition potential tool in LCM allows for the user to group transitions that occurred between two land use maps into a set of sub-models, which produces a transition potential map for each transition. In this research, the urbanization sub-model was created to model all built-up transitions. Thus, only the transitions vegetation to built-up and water bodies to built-up were included in the urbanization sub-model.
To develop the transition potential for the urbanization sub-model, a set of driver variables were developed to represent the main forces that influence urban growth in the region. The choice of driver variables was based on a spatial analysis and literature review of similar studies. The driver variables that were used in this research included Elevation, Slope, Land cost, Distance to existing urban areas, Distance to Central Business Districts (CBD), and Distance to roads and Distance to the coast (Table 3). The distance drivers represent the proximity of pixels to forces that act as constraints or incentives to urban growth. The distance to urban driver expresses the proximity of a pixel to established urban areas in 2009. The distance to urban driver was modelled as a dynamic variable to express the varying distance of urban pixels as they change over time. The distance to roads driver represents the accessibility of pixels to major roads in the region. The CDB driver was also created to model the magnetic influence of the two economic hubs—Accra and Tema—on the region. Elevation and slope were also included to account for the geophysical limitations and constraints in the region. An exclusionary layer was also introduced to prevent some areas in the region from becoming urban. Exclusionary zones are expressed in the form of a Boolean map with areas being excluded from becoming urban coded as 0 with the other areas having a value of 1 [35]. Exclusionary zones that were considered in this research include military zones, forest reserves, wetlands, cemeteries, university lands, golf courses, and community parks.
LCM provides statistical tools to test the explanatory potentials of the drivers before they are used in the model. The Cramer’s V is a correlation coefficient that tests the relationship between driver variables and the distribution of land use types in the later land use map. The Cramer’s V ranges from 0.0 to 1.0, with a higher value indicating a good driver variable and a smaller value indicating little or no correlation between the driver variable and changes in the land use map. However, this does not guarantee a strong model performance, since it cannot account for the mathematical specification of the modelling approach used as well as the intricacy of the relationship [37].
Based on the Cramer’s V, the best driver variables were selected to parameterize the model using the MLP algorithm. MLP is a type of neural network that uses the feed forward algorithm, i.e., information in this type of network flows in one direction only—forward. MLP consists of interconnected nodes that respond to weighted input it receives from other nodes. The architecture of the MLP consists of three layers, namely input, output, and hidden layers. In this context, the input layers would be the driver variables and the land use transitions, whereas the transition potential map is the output layer. Hidden layers consist of a number of processing elements that enable the transformation of input data into output layer [38]. The aim of neural network training is to construct a model by using information from a data, so that the network can hypothesize and predict outputs from inputs that it has not seen before. The MLP neural network uses the back propagation algorithm to reduce error in the network by adjusting the weights between nodes [38]. After each run or a series of iterations, an error term will be calculated and the aggregate error will be distributed across the network.
In the LCM, the MLP trains the model by using a sample of pixels that underwent transition from one land use type to another and a different set of pixels that did not undergo change in the two land use maps. The sample size is set, by default, to be equal to the smallest number of pixels that transitioned from one category to another. MLP assigns the selected pixels to two classes; one group for training the model and the other set for testing or validating the accuracy of the MLP model. The MLP uses the pixels in the training sample as an example to develop a multivariate function that can predict the potential for transition that is based on the values at any location for the driver variables [37].
Upon completion of the entire process, MLP outputs a number of statistics that provide information regarding the power of the explanatory driver variables as well as the models accuracy in predicting class transitions and persistence. One important aspect of the statistics generated is termed “Forcing Independent Variables to be Constant”. This statistic is generated by withdrawing driver variables from the model one at a time. After training the model using all of the driver variables, the system tests for the relative power of the explanatory variable by holding the inputs from the selected variable constant. This effectively removes the driver variable from the modelling. The modified model is run again and the accuracy and skill test are calculated using the validation pixels. This process is repeated for all driver variables to determine their influence on the skill measure and accuracy of the model.
2.4.2. Change Prediction
The Markov chain calculated the amount of land that will transition for each land-use type for the specified future date. A Markov chain is a stochastic process where the next state of a system (t + 1) is only dependent on the current state (t) [39]. The Markov chain estimates the amount of change that is needed based on the two land use maps used in the model. The process estimates exactly how much land would be anticipated to change from the later date to the specified prediction date based on the projection of the transition potentials that are derived from the MLP and creates a transition probabilities matrix [37]. The transition probability matrix(n*n) of the Markov process is defined as
where P is the probability matrix of n states
pij is the transition probability of state i to j
The probability of the future state of a cell is given as
where p(t + 1) is the future land cover distribution
p(t + 1) = p(t) ∗P
p(t) is the current land cover distribution
P is the transition potential
Based on the transition probabilities matrix, a hard prediction map is generated, which has the same land use categories as the input maps. The hard prediction model is based on a competitive land allocation model that is similar to a multi-objective decision process [37]. The soft prediction map is similar to the transition potential map and it shows the probability for every pixel to change for a particular transition in a continuous map format.
2.4.3. Validation
The resulting hard prediction map was validated to evaluate the accuracy of the model in predicting future land use maps. In LCM, the validation process involves a three-way comparison between the later land use map (2009), the predicted land cover map, and a map of reality. The 2015 classification map was used as the map of reality in the validation phase. This process generates a map that portrays the accuracy of the model. The map shows areas where the model correctly predicted called “hits”, areas where the model predicted to change but actually did not change, called “false alarms”, and areas that changed in reality, but the model was unable to predict, referred to as “misses”. Calculating the Kappa coefficient between the predicted map and actual land use map statistically validated the predicted map.
Once the predictive capacity of the model was verified for the period between 2000 and 2009, the simulation process was repeated to predict the 2025 land use map while using the 2009 and 2015 classified maps as the base maps. A new distance to urban driver was generated using the 2015 urban pixels. The other drivers remained unchanged.
3. Results
3.1. Nature, Extent and Rate of Land-Use Change
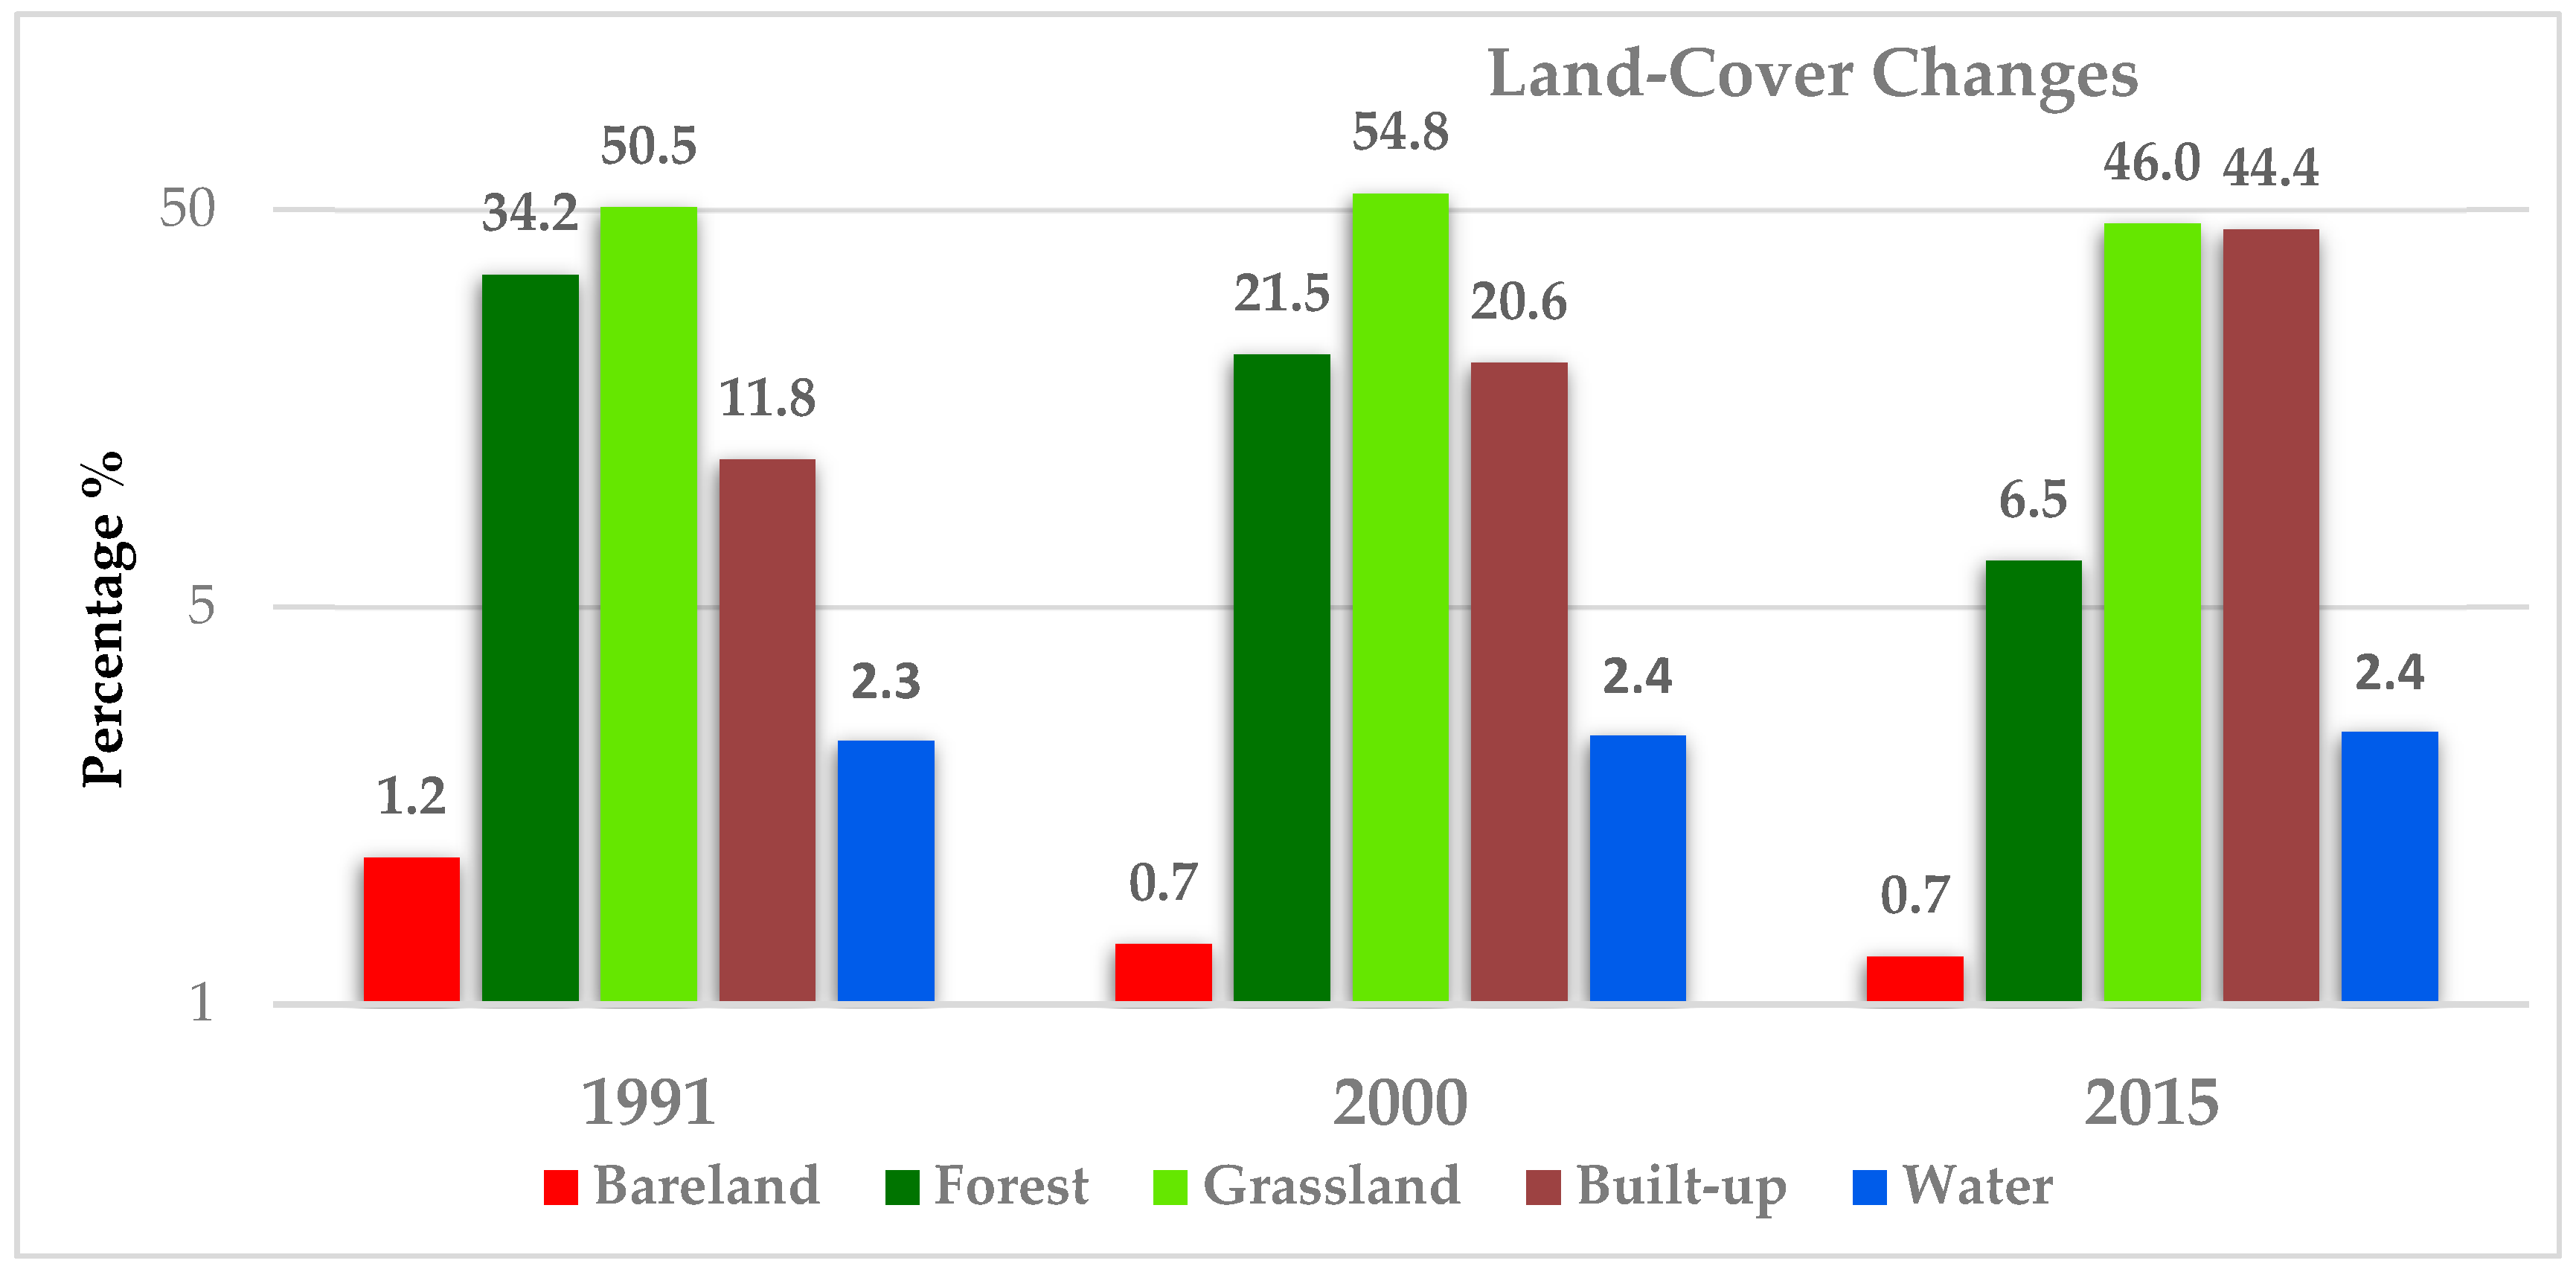
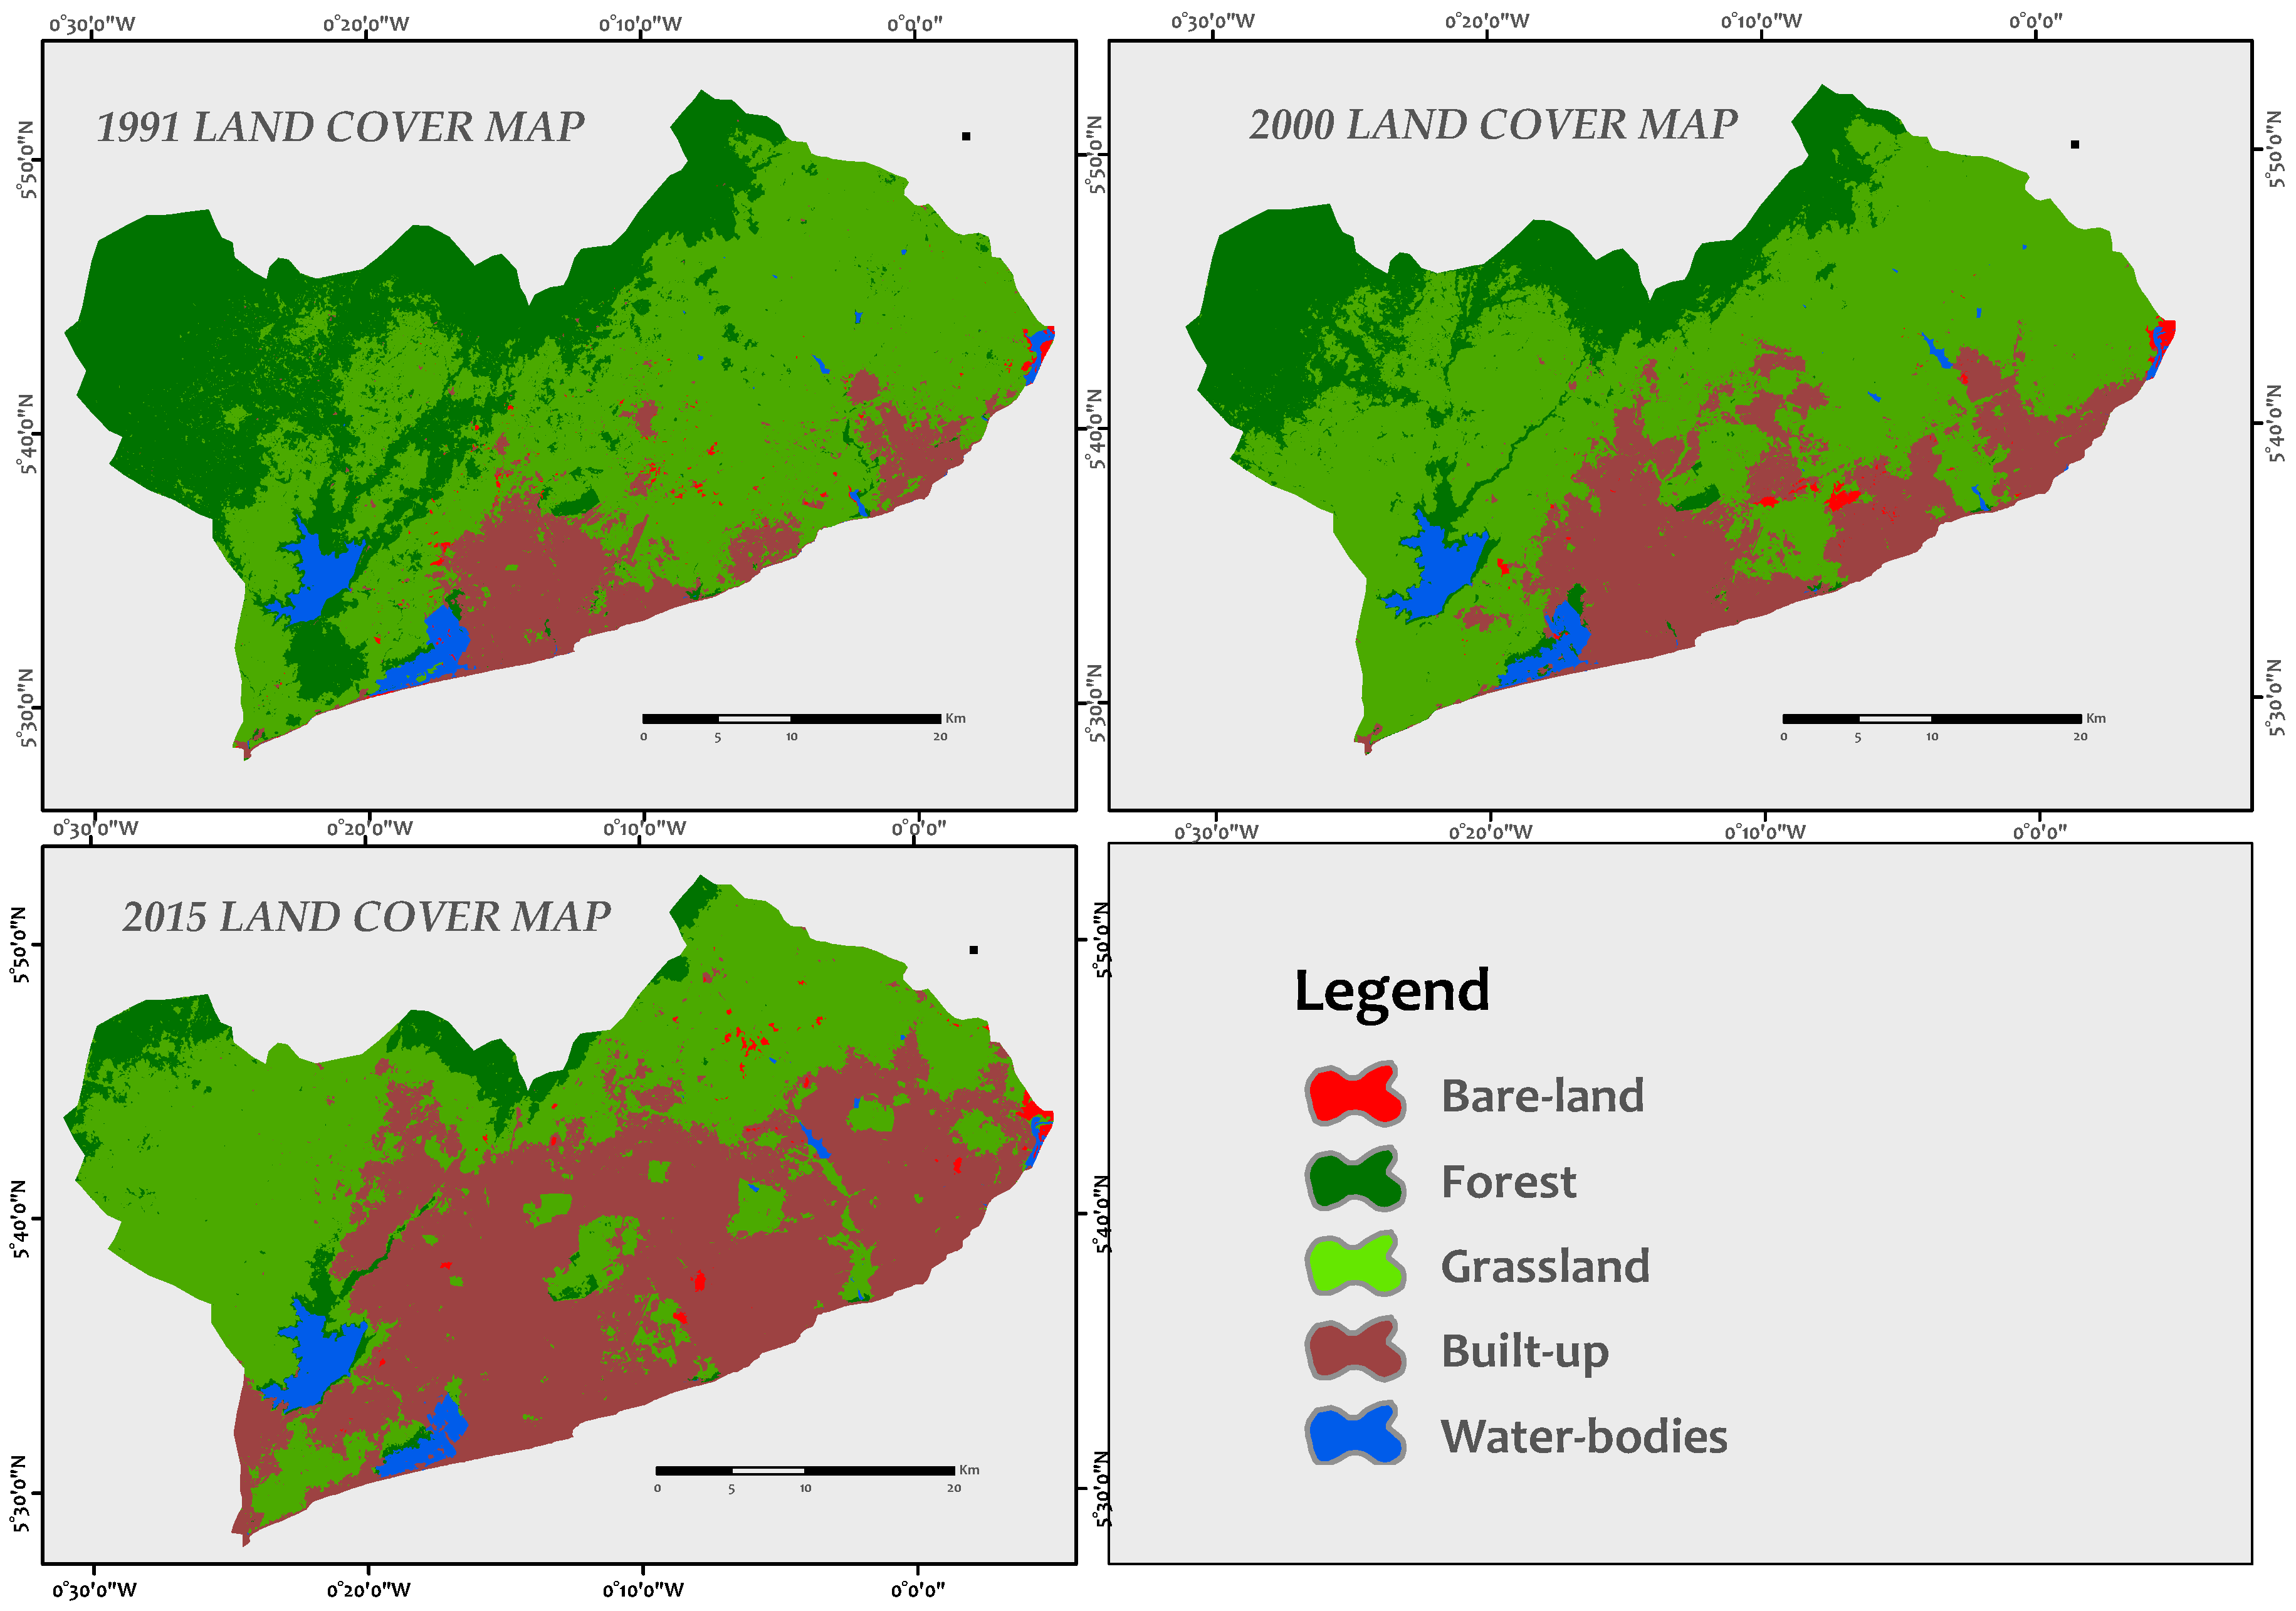
In exception of bare-land and grassland, the other land cover types were consistent in their direction of change from year to year (i.e., increasing or decreasing). The statistics revealed that built-up areas in the region have been drastically expanding, mainly at the expense of grassland. Forest areas in the region had the greatest loss, while grassland and water bodies exhibited very little change between 1991 and 2015. The analysis further revealed that, in 1991, grassland was the most dominant land cover type, covering 50.5% (80,079 ha.) of the study area. This was closely followed by forest, which covered 34.2% (54,258 ha.) of the area. Built up areas represented 11.8% (18,625 ha.) of the area, with water bodies also covering 2.3%. The remaining 1.2% of the study area were classified as bare-land. Table 4 shows the land-use percentage and area changes for the two study periods.
In 2000, grassland continued to cover more than half of the study area, precisely 54.8% (86,863 ha.), marginally increasing by 8.4% between 1991 and 2000. Between the same time period, forest cover diminished to 21.5% (34,137 ha). The analysis also indicated that built-up areas had significantly increased, expanding from 11.8% in 1991 to 20.6% in 2000. This percentage increase means that built-up covered approximately 32,587 ha. of the study area in 2000. As of 2015, grassland was still the most widespread land-use type, although it diminished roughly by 16%, covering 46% (72,892 ha.) in 2015. Built up areas continued to massively expand, becoming the second most dominant land use type in the region, covering 44.4% (70,355 ha.) of the study area in 2015. Forest cover diminished enormously within the same time period, occupying only 6.5% (10,346 ha.) of the region in 2015. Figure 4, Figure 5 and Figure 6 show the percentage coverage and spatial distribution of the land-use types for the years 1991, 2000, and 2015.
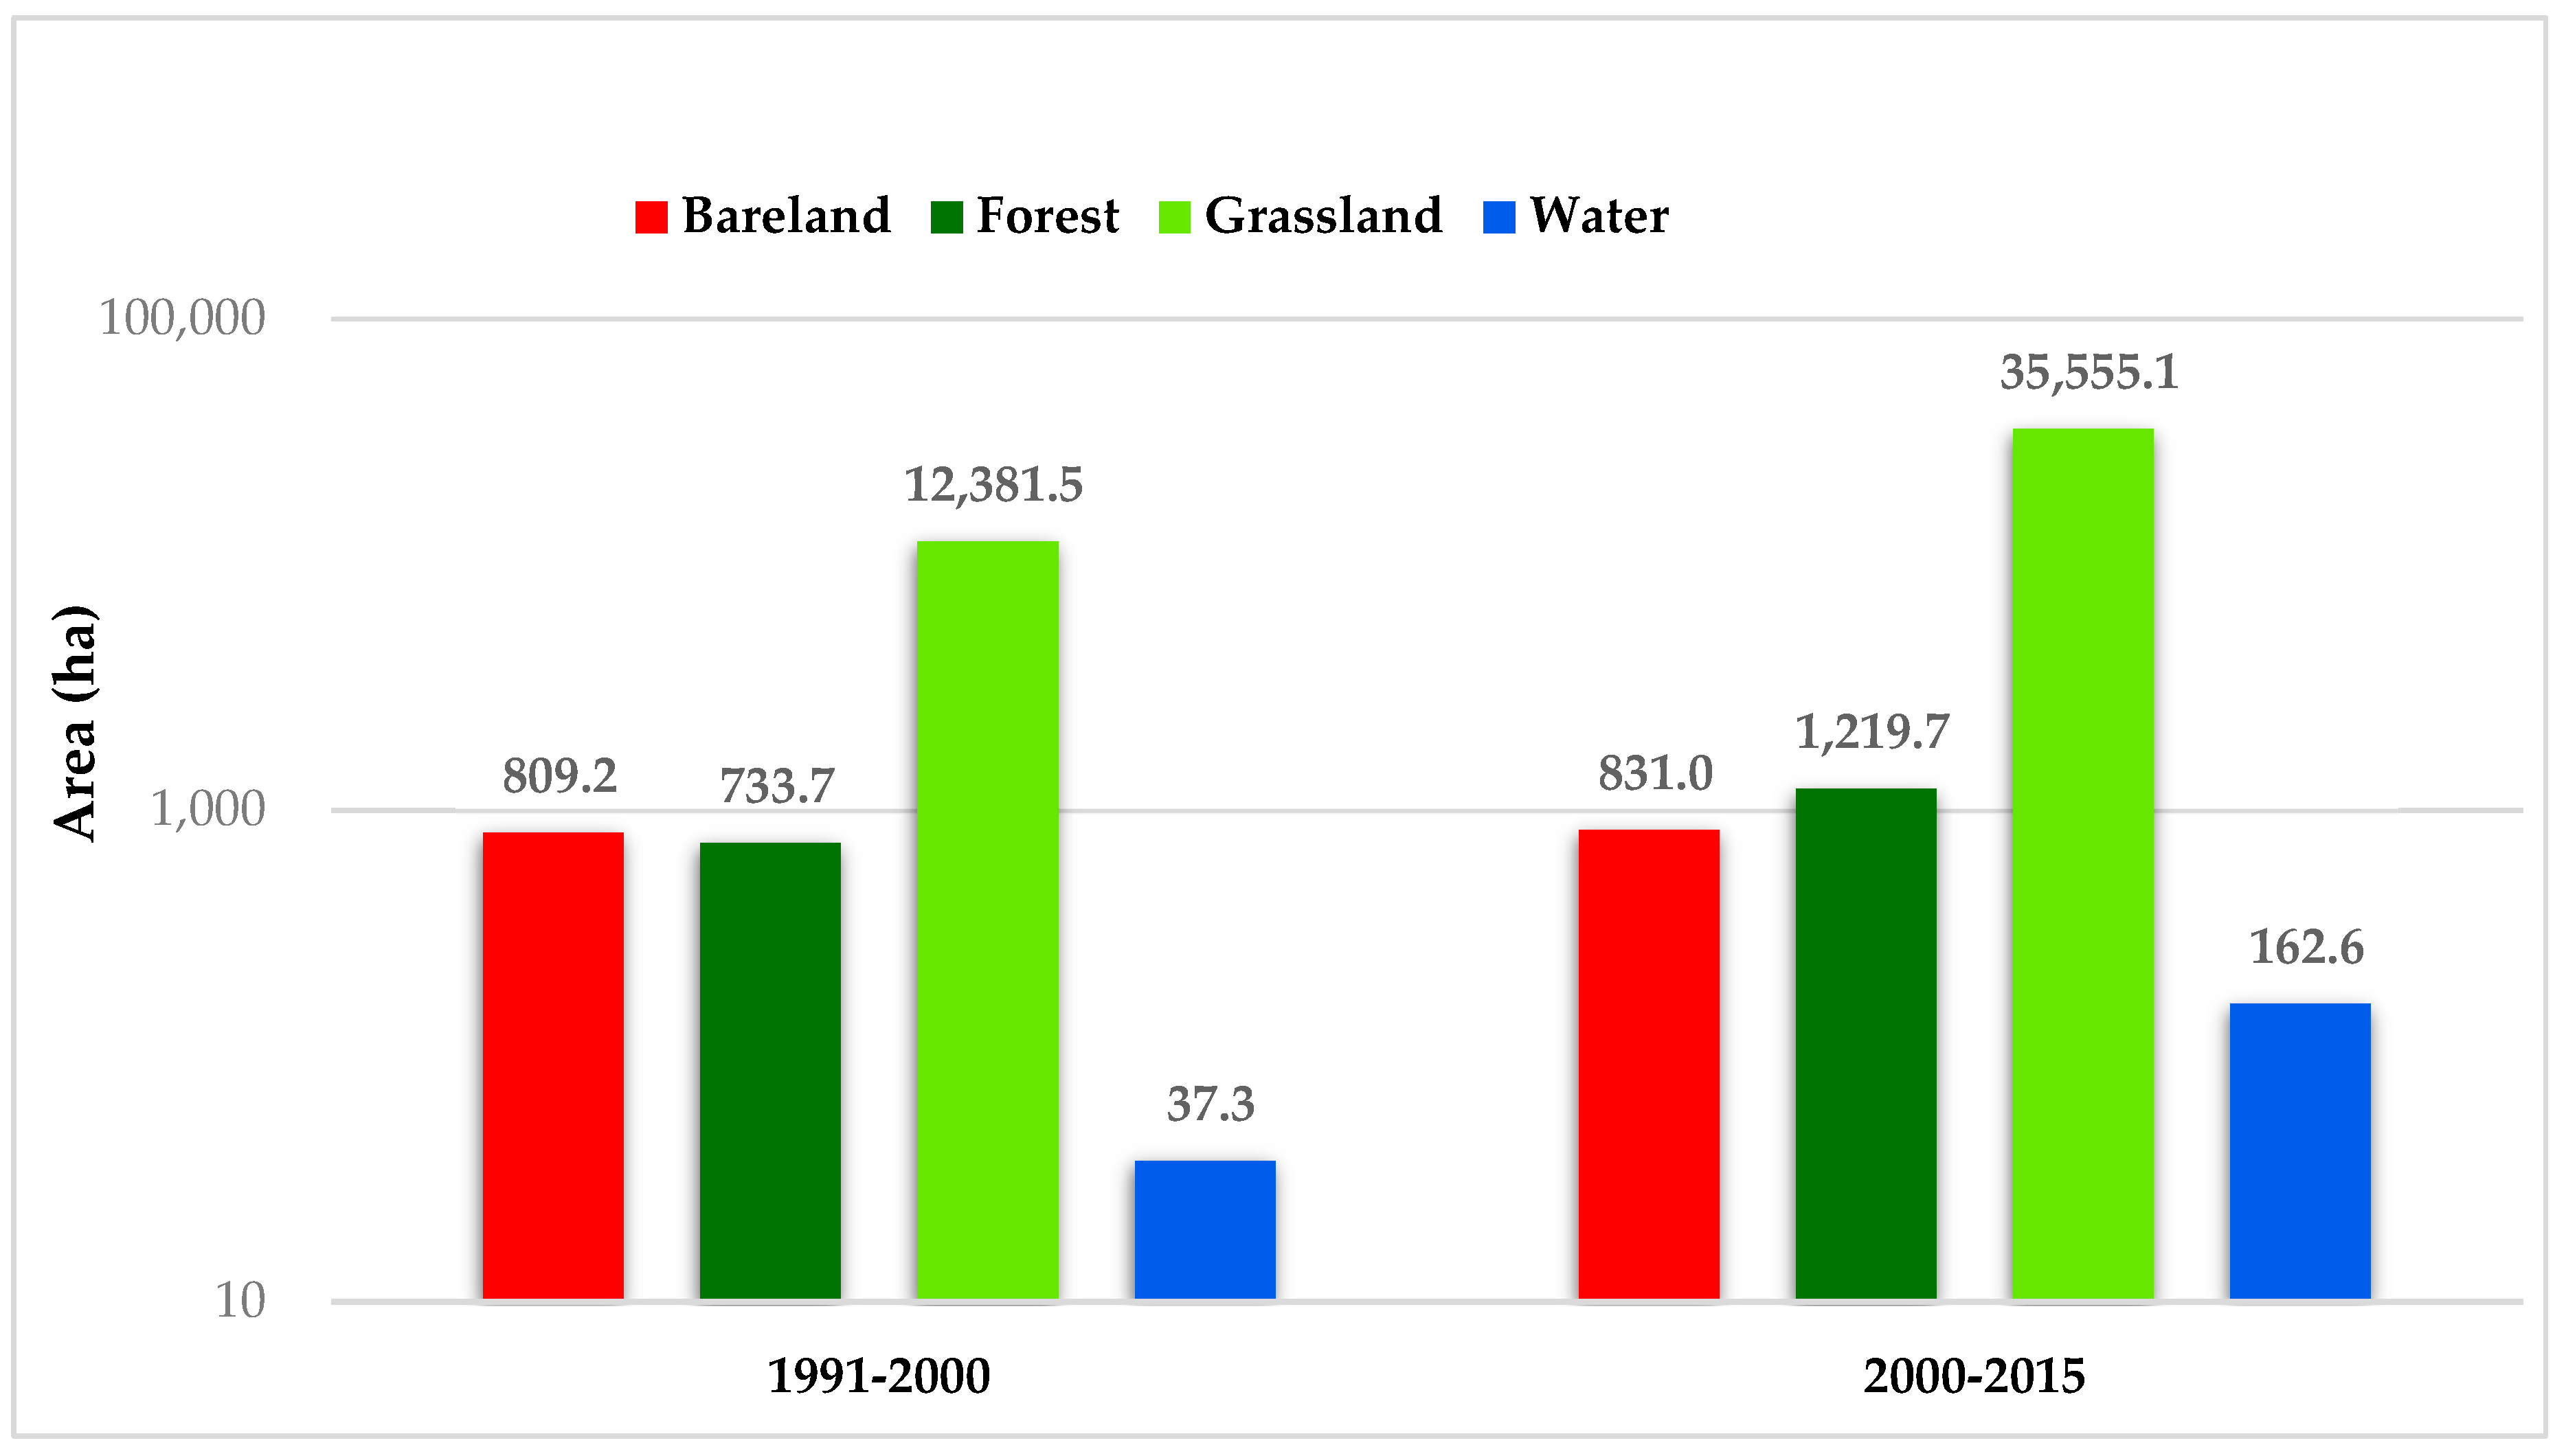
Among the five land cover classes assessed, built-up had the highest expansion rate in the region. Altogether, the built-up areas in the region expanded by about 277.7% between 1991 and 2015. The analysis indicated that built-up areas increased by 75% between 1991 and 2000, gaining approximately 13,961 ha. during this period. Accounting for this expansion, about 12,382 ha. of grassland were converted into built-up. Thus, grassland contributed 88% of the total urban expansion that occurred between 1991 and 2000. A further 809 ha. and 733 ha. of bare-land and forest, respectively, were transformed into built-up within the same time period. Built-up continued to expand significantly within the second study period (2000 to 2015), gaining about 37,768 ha. within this period, which translates into a net increase of 116% in the space of 15 years. Grassland remained the main contributor to urban expansion within this study period as well, with 35,555 ha. of grassland being converted into built-up. This figure represents approximately 94% of the total urban expansion that occurred during the second study period. Figure 5 presents the net gains and losses that are associated with built-up.
The statistics also revealed a massive decrease in forest areas in the region. Between 1991 and 2000, about 20,121 ha, which translates into 37.1% of the forest cover in 1991, was lost. Out of the total forest lost during this period, about 19,300 ha. was transformed into grassland. The statistics further indicated that the forest cover in the region continued to immensely diminish between 2000 and 2015, with the majority of the forested areas being converted into grassland during this period as well. From 2000 to 2015, about 23,790 ha. of the forest cover in GAMA was lost, representing a net loss of 69.7%. Accounting for this loss, about 22,296 ha. of forested areas were converted into grassland, which represents 93.7% of the total forest lost between 2000 and 2015. Approximately 1220 ha. of the forest lost were also transformed into built up areas, contributing to the massive urban expansion going on in the region.
Of the five land cover types assessed, water bodies experienced the least change, although water resources in the region expanded marginally over the entire 25-year period. Water bodies covered 2.30% (3637 ha.) of the study area in 1991, expanding to 2.37% (3761 ha.) in 2000 and subsequently covering 2.42% (3832 ha.) in 2015. Between 1991 and 2000, water bodies in the region expanded by 124 ha. Water bodies also expanded by a net gain of nearly 70 ha. between 2000 and 2015. Grassland and forest were the biggest contributors to these minimal net increases.
Throughout the analyses, grassland remained the most dominant land use type in the region, showing very little change in the proportion of area covered over the years. The change detection analysis revealed an interesting pattern between grassland, forest, and built-up areas in the study. Although built-up areas mostly expanded into grassland, the forest cover was also simultaneously depleted into grassland. Thus, the grassland areas are shifting from the coast into the hinterlands of the region, especially the northern and north western parts, which were formerly covered with forest. Between 1991 and 2000, about 19,367 ha. of forest were transformed into grassland. However, approximately 12,381 ha. of grassland were converted into built-up areas between the same time period. During the second study period, about 22,296 ha. of forest were transformed into grassland, while approximately 35,555 ha. of grassland were also converted into built-up areas.
3.2. LCM Performance and Validation
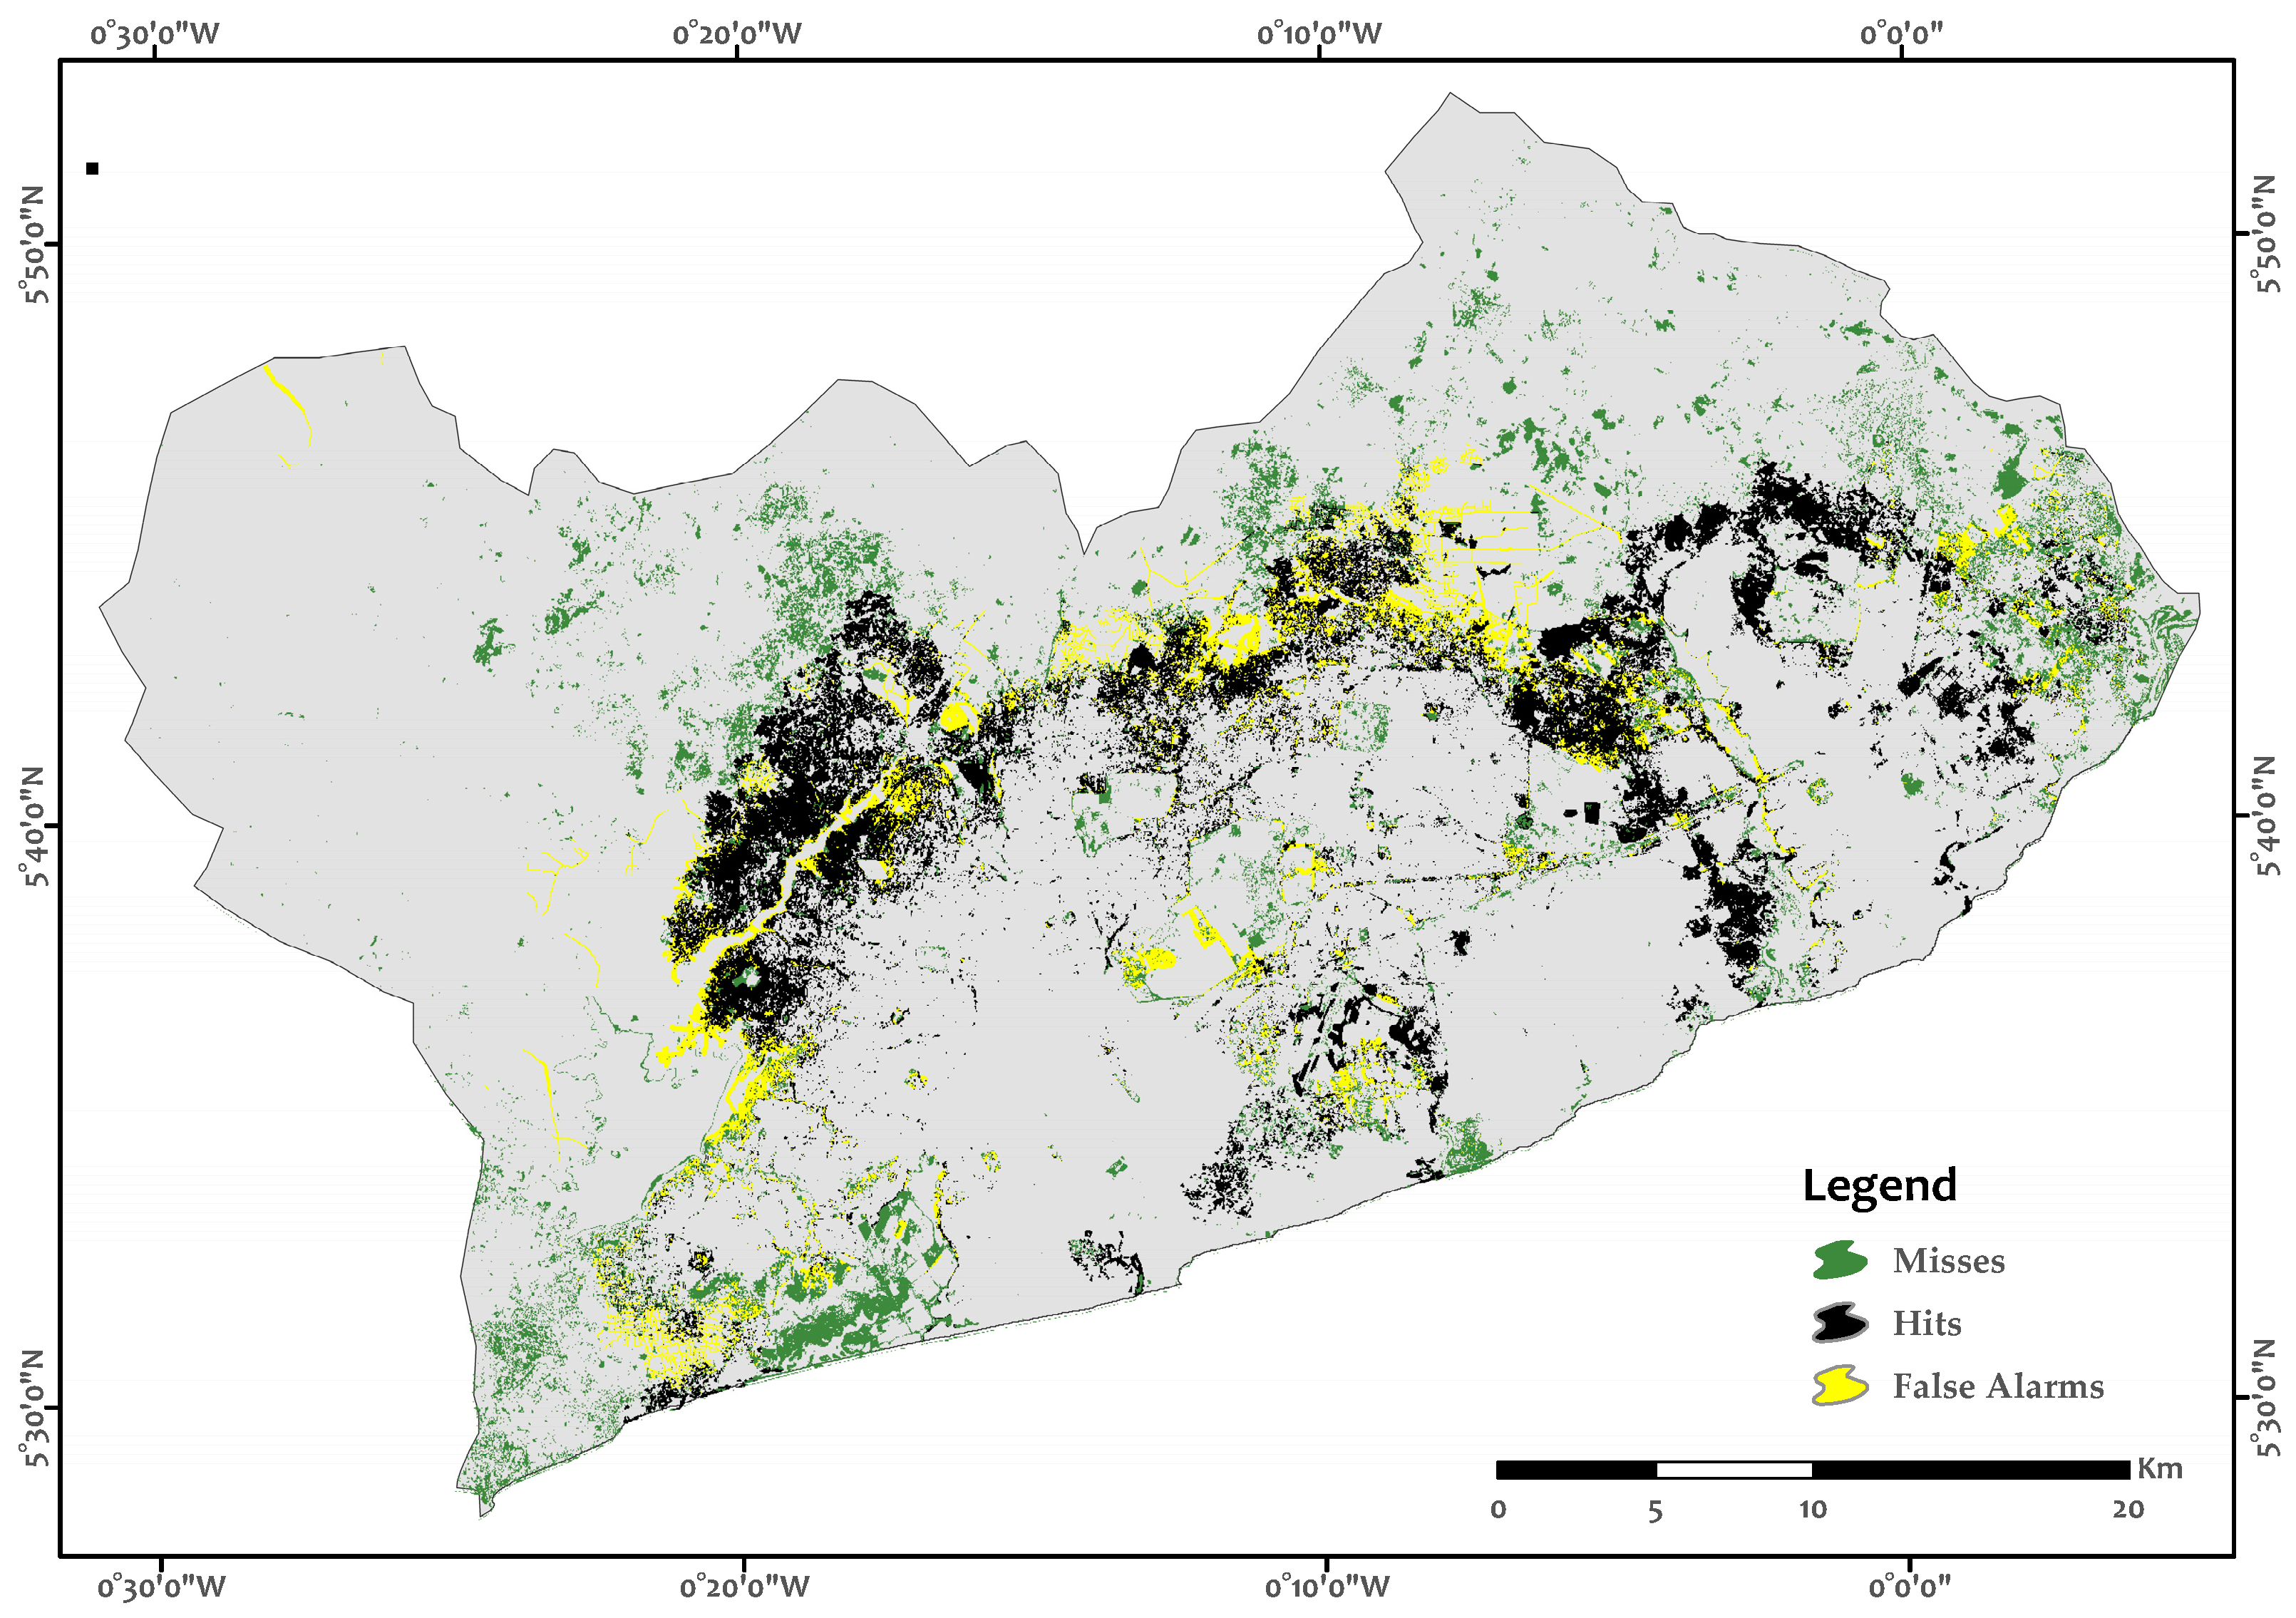
Validation of the predicted 2015 land-use map produced both statistics and a map of correctness and error. According to the statistics that were derived from the model, the projected urban extent of the region for the year 2015 was 47.25%. This figure is commensurable with the actual 2015 urban extent, which was 44.4%. With regards to the accuracy of the model, it was able to correctly predict 59.81% of the total urban expansion that occurred between 2009 and 2015, which corresponds to the hits in the validation map. However, it was unable to predict 40.19% of the total urban expansion that occurred between 2009 and 2015. Out of the total area, the model predicted undergoing change or urban expansion between 2009 and 2015, and about 25.16% was wrongly predicted. Thus, these areas, referred to as false alarms, did not experience any change, albeit the model predicted these areas would undergo change between 2009 and 2015. Figure 7 shows the validation map with areas of hits, misses, and false alarms. Based on statistical analysis, an overall accuracy of 87.69% was achieved with a Kappa coefficient of 0.76.
3.3. Influence of Driver Variable on Urban Growth
The sensitivity analysis revealed that, “Distance to Urbanized” areas was the most influential driver variable (Table 5). Without this variable, the accuracy of the model dropped from 90.43% to 43.98%. This means that the “Distance to Urban” driver variable alone accounts for more than half of the overall accuracy of the model. The second most influential driver variable was “Distance to Roads”. The exclusion of this variable from the model reduces the overall accuracy from 90.43% to 81.91%. According to the analysis, slope was the driver variable with the least influence on the model. The elimination of the slope variable from the model increases the accuracy of the model from 90.43% to 90.51%. Consequently, the inclusion of this variable in the model marginally reduces the accuracy of the model by 0.08%.
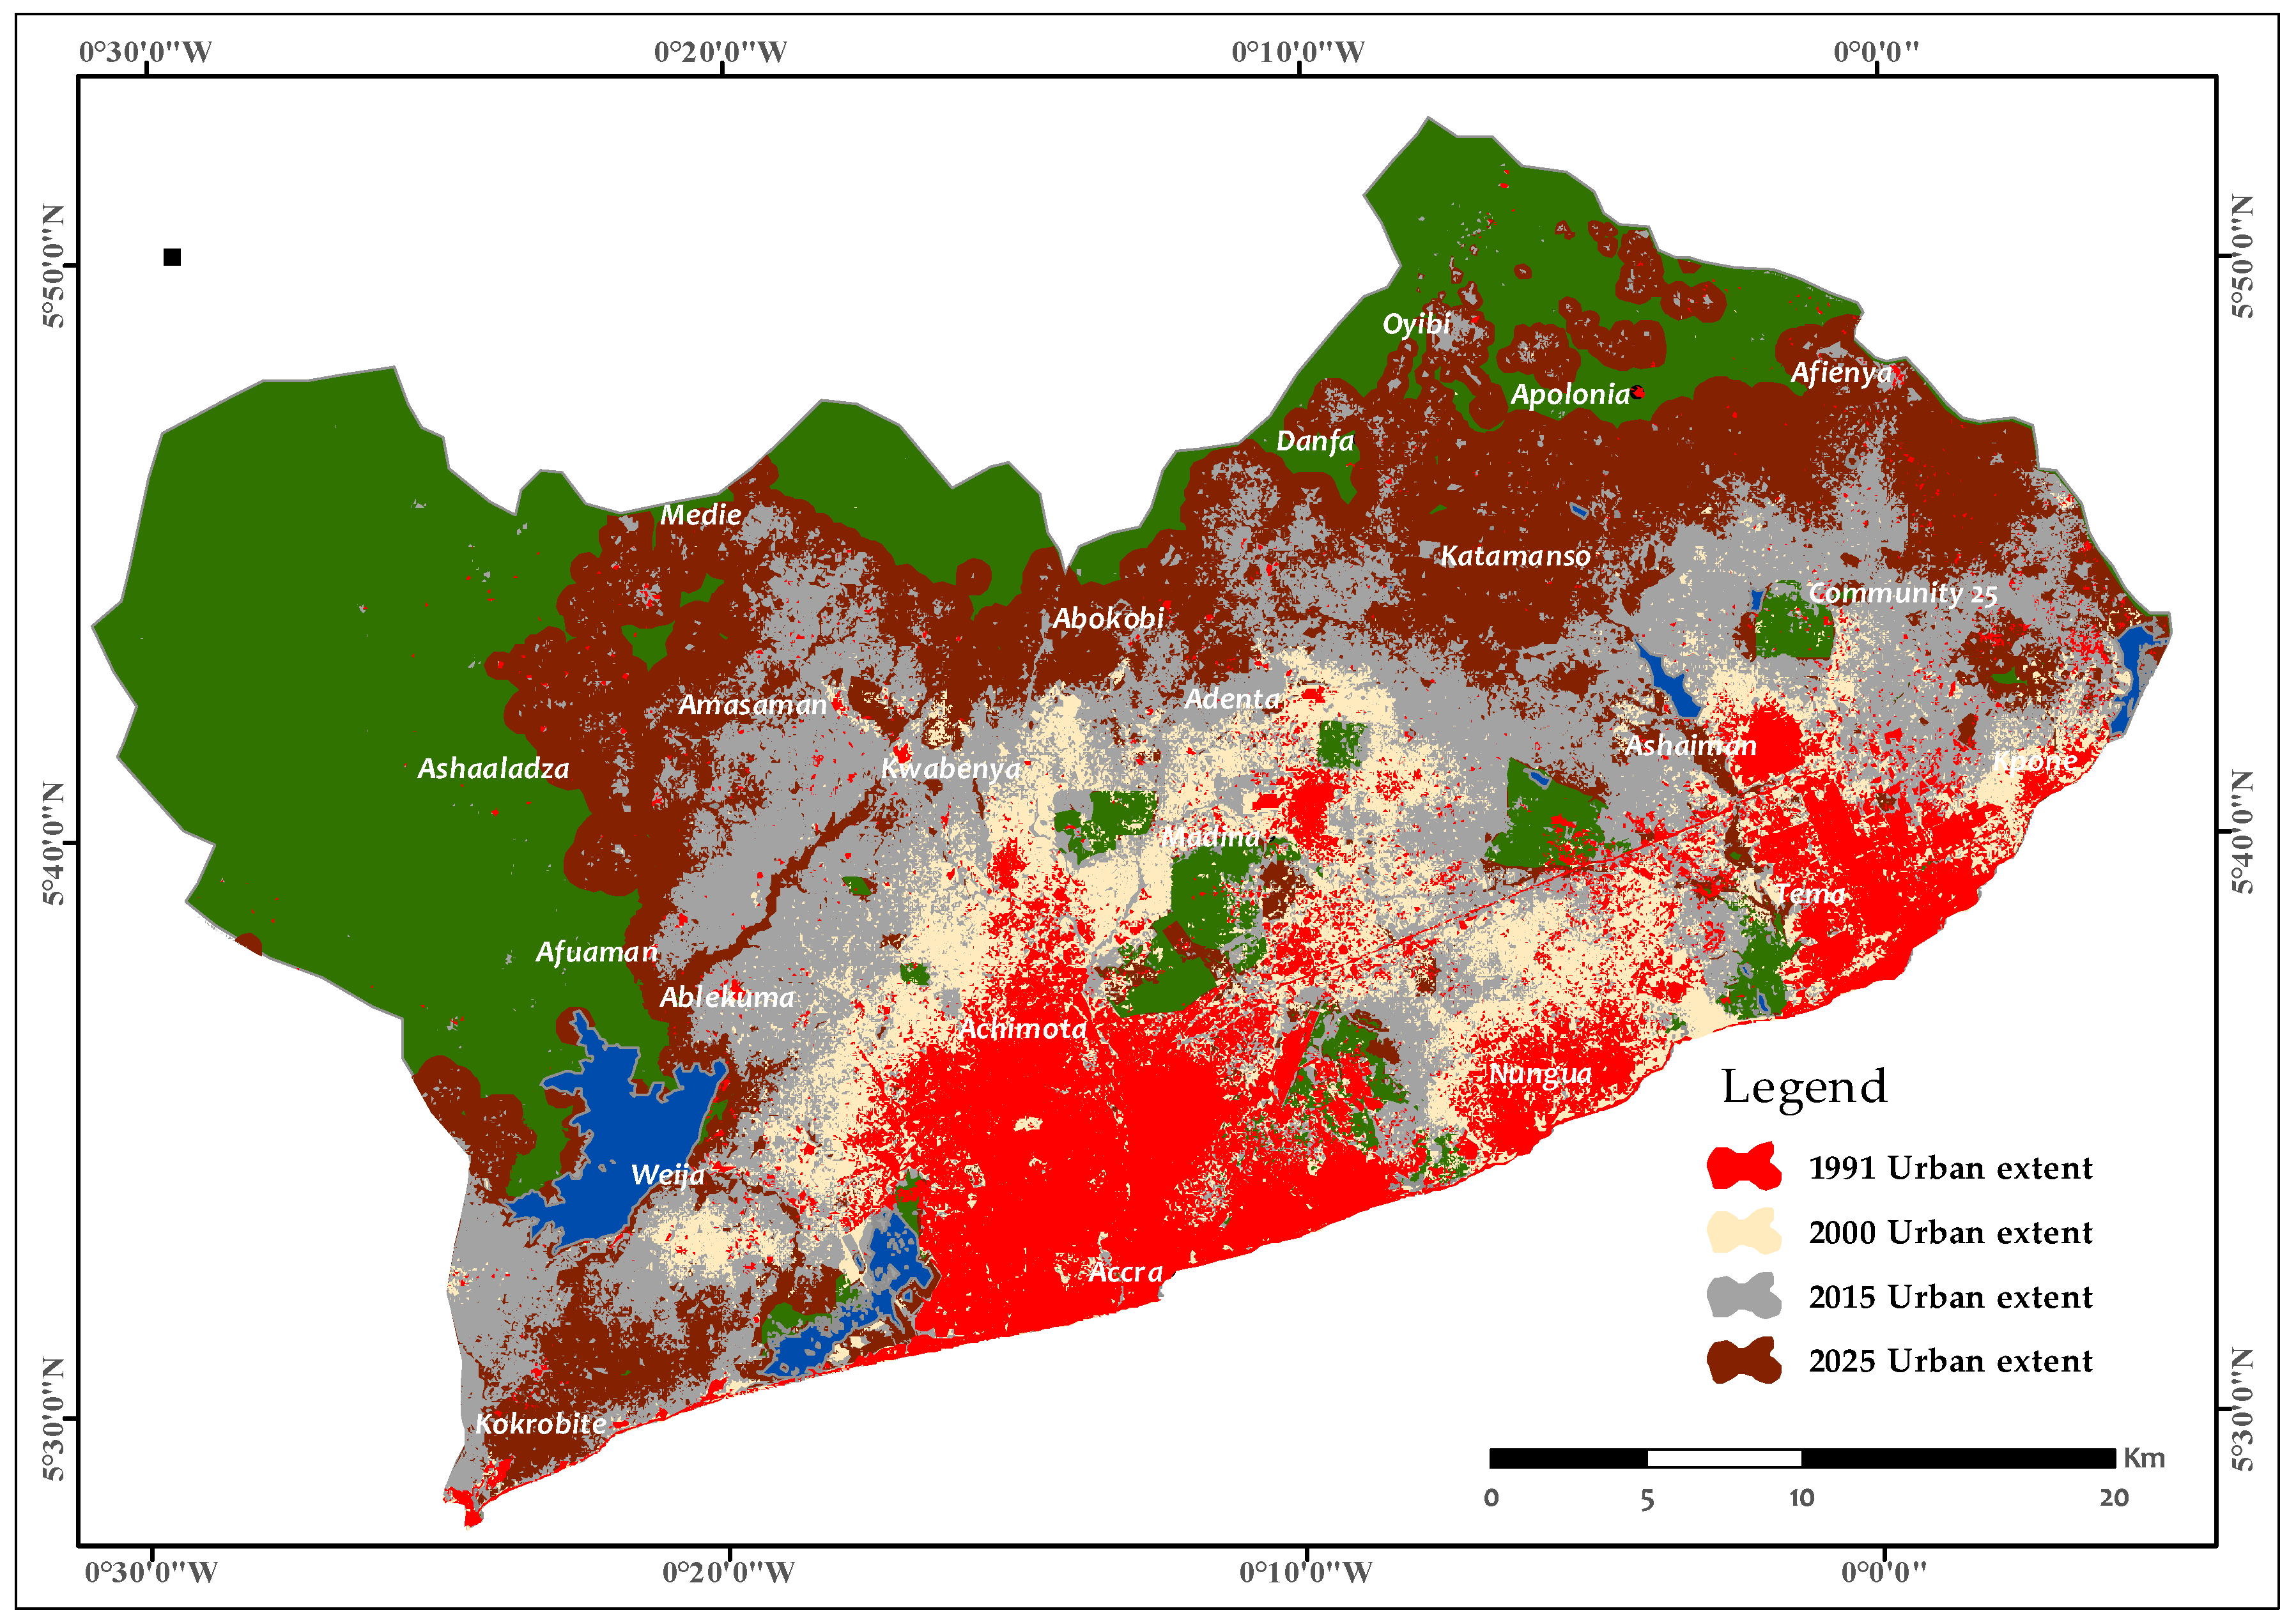
The resulting 2025 projected land-use map revealed that the urban areas would continue to massively expand, encapsulating several parts of the study area. According to the projection, it is expected that by 2025, about 108,607 ha. of land surface in the region will be covered by built-up, which represents roughly 68.5% of the region. This means that, between 2015 and 2025, the total areas that are covered by built-up will increase by 54.34% (38,252 ha). It is expected that, between this period, about 37,816 ha. of vegetation (grassland and forest) will be transformed into built-up, which represents 98.8% of the total urban expansion projected to occur between 2015 and 2025. A further 435 ha. of water bodies is also expected to transition into built-up between this time period. By 2025, the conurbation of GAMA will extend to include areas, such as Afuaman, Ashaladza, and Medie in the western part of the region, as well as towns, like Abokobi, Danfa, and Oyibi in the north (Figure 8). The eastern frontier of this new conurbation is expected to grow beyond Community 25 and Afienya and probably into the adjoining districts.
4. Discussion
Post classification statistical analysis of the 1991, 2000, and 2015 land-use maps revealed a continuous increase in built-up, while the forest areas in the region continue to diminish. For example, during the 24-year study period, built-up had increased from covering 11.8% of the study area to 44.4%, with the main contributor being grassland. The extensive growth in built-up can be associated with the rapid population growth in the region and Ghana in general [40,41]. Between 1984 and 2000, the population of GAMA increased by 50% with the population growing at a rate of 3.5% per year [12,42]. The population growth rate marginally reduced to 3.1% per annum between 2000 and 2010 [11]. The rate is calculated to be around 2.5% for the period between 2010 and 2016. However, the rate of urban expansion was so fast that it outpaced the rate of population growth. Between 1985 and 2000, for example, the population of GAMA increased by 50%, while the urban extent increased by 160% [12]. This can be partly attributed to the architectural change that is currently going on in the region, with more people favoring bungalow type (single tenant) houses over compound (multiple tenants) houses [43].
Additionally, economic growth has led to a massive boost in the housing sector. Market forces, rather than urban planning, shapes spatial expansion in the region [11]. The housing sector has received massive investment in recent years from both local and foreign investors. Much of the investment is in the form of speculative development that is aimed at expatriates and Ghanaians living aboard. In many cases, most of these houses are yet occupied by tenants or house owners. Several estates and gated communities have emerged, mostly around the fringes of Accra and Tema. Wellington [44] also attributed the massive urban expansion in the region to the uncontrolled private land use development, as more people prefer to settle at the fringes of the city where the cost of land is relatively cheap. Furthermore, with more and more people moving into Accra, the acquisition and ownership of land in the region has become more competitive. In Accra, customary lands are owned by traditional leaders; represented by chiefs and family heads that hold these lands in trust for the community. Members have the right to use the land, which was mostly for agricultural purposes in the past. However, the chiefs and elders are now taking advantage of the current economic boom, massive in-migration, and burgeoning demand for land by selling land to non-native people, primarily for building purposes [45]. Furthermore, the government’s predilection for taking customary lands without paying compensation has given the chiefs extra motivation to sell these lands to private developers [46]. These, coupled with mismanagement, lack of proper policies, and corruption have led to uncontrolled land acquisition and further contributed to the massive urban expansion occurring in the region, especially on the urban fringes [47].
One apparent ecological impact of the massive urban expansion currently going on in the region is the loss of forest vegetation. The decrease in the size of forest areas in the region coincides with urban expansion. The conversion of forest into shrub and herbaceous vegetation is mainly due to urban expansion, agricultural activities, and firewood harvesting [21,45]. Spatial analysis of the initial 1991 image revealed that the majority of the forest cover in the region was in the western part. Extensive patches of forest could also be seen below the Weija lake as well as fringe forest around the Densu River. However, the majority of these patches of forest had disappeared in 2000, with the main forest cover being limited to the northern and north-western parts of the study area. As of 2015, only the Achimota forest reserve could be classified as a forest within the urban core of Accra, although it is under threat from urban expansion and commercialization. The forestry Commission of Ghana, which manages the Achimota forest has put in place plans to turn the reserve into an Eco park. Although this development could generate income and create job opportunities, it would also likely reduce the forest extent of the reserve. Attua and Fisher [6] suggest that increased demand for firewood and charcoal partially caused forest degradation in Ghana is partly, which is subsequently linked to increasing population. Yorke and Margai further support this assertion [48]. As urban centres expand and population increases, the demand for energy also increases. The majority of households in Ghana still depend on firewood and charcoal for domestic use due to the relatively high cost and unreliable supply of other energy sources, such as Liquefied petroleum gas and electricity. In Ghana, about 25% and 50% of urban households depend on firewood and charcoal, respectively, for cooking [49]. Consequently, woodlands and forest areas are exploited to meet the increasing demand for cheap energy.
Based on the predicted future LULC map of the region, urban expansion is likely to continue unabated. The majority of the urban expansion projected to occur between 2015 and 2025 is extensions from the 2015 urban extent with many infills also being projected to occur within the urban core of the region. The majority of the urban expansion is expected to occur in the western and eastern sides of GAMA. Owusu [50] noted that settlements in the western and eastern part of GAMA have a higher growth rate than other parts of GAMA. In the south eastern part of the region, the townships of Kasoa and Weija are expected to grow towards each other and subsequently merge. Many of the non-urban zones within the urban core are exclusionary zones that were restricted from becoming urban during the modelling phase. Without these exclusionary zones, areas such as the Achimota forest reserve, University of Ghana, Weija, and Sakumo Ramsar sites would have been encroached by urban expansion.
This research provides empirical evidence of rapid urbanization in GAMA and a glimpse of how the region will develop in the future. The findings of the research provide urban planners and city authorities with valuable information about where to expect urban expansion in the coming years. Based on this projection, these urban development stakeholders can make decisions regarding the areas to prioritize in terms of neighborhood design and planning, amenities provisioning, and urban policy formulation and implementation. More initiatives must be directed towards the urban fringes where the majority of the urban expansion is forecasted to occur. With the right measures and policies, the occurrence of slums and informal settlements in these prioritized areas could be curbed.
The study also has significant implications for environmental hazards in the region. Many of the wetlands that absorb much of the water during heavy rains are projected to be encroached upon as people scramble for the remaining untenanted lands in the region. Additionally, the vegetative cover in the region, including the Achimota Forest reserve, is expected to deplete as they come under pressure from urban expansion. The destruction of these ecologically important areas does not only mean loss of habitat for many birds, turtles, and other creatures, but also would increase the incidence of flooding, water, and air pollution in the region. It is therefore critical for these areas to be protected from urban expansion by enforcing strict encroachment regulations.
Several policies and measures can be put in place by policy makers and urban planners to control and slow down the rate of urban expansion in the region. The green belt strategy is one policy that can be adopted to limit urban expansion in the region. Such a policy will promote redevelopments and infills rather than uncontrolled leapfrog developments, which mostly result in the creation of informal settlements. This strategy has been successfully used in Germany to control urban development in many cities. In 2011, 59 of the 96 German planning regions had greenbelt as part of their regional plans [51]. To ensure efficient use of land, local planning authorities must also regularly review and update the regional land supply and demand based on population and economic projections. The land market must also be reformed to put more power in the hands of urban planners. Currently, traditional rulers with little or no coordination with urban planners control the sale of land in the region. Close collaboration between traditional leaders and local planning authorities with regards to the sale of lands in the region will help to control urban sprawling while promoting sustainable urban expansion. The sale of land in the urban fringes could be prohibited while promoting housing in the urban core through pricing mechanisms and policies. This could be used as a mechanism to control the proliferation of urban development in the region by concentrating on urban intensification through redevelopment and infills.
The power of urban modelling and simulation should be fully utilized in urban planning and policy formulation. The integration of population and economic projections and future demands for space with land use models provides an effective tool to analyse alternative scenarios. Different land use systems can be simulated while using multiple policy scenarios. Scenarios provide multiple views of the future and help to reduce uncertainty in policy making by providing a robust decision-making framework [52]. This helps policy makers and urban planners to make appropriate policies and more effectively manage future urban expansions.
5. Conclusions
This study shows that the integration of GIS, remote sensing, and statistical models provides a powerful tool for monitoring spatial and temporal land use change, as well as modelling complex human-nature interactions. The results of the LULC change analysis revealed the main change trajectories in the region, particularly the expansion of built-up at the expense of vegetation (forest and grassland). During the entire study period, the built-up increased by almost threefold. Water bodies in the region also experience little change during the study period, while the bare-land land cover was spatially and directionally inconsistent for year-to-year. Based on the LULC simulation, the urban extent of GAMA is projected to cover roughly 70% of the region by 2025. However, the modelling was limited by the unavailability of geospatial data, such as population density, income, employment distribution, and so on. Incorporating socio-economic data, land use policy, human factors, etc. could help to improve the performance of the land use model in making future predictions. Thus, it is recommended to incorporate these socio-economic variables for future studies.
As seen in the works of Angel et al. [53] and Agyemang [54], Kasoa, which is the administrative capital of the adjoining Awutu Senya East municipality is physically and functionally linked to GAMA. Kasoa is currently seen as a satellite town with many people that commute daily to Accra to work and trade. The township of Kasoa is growing rapidly towards GAMA and the two conurbations are expected to fully merge in the coming years. Moreover, the urban extent of GAMA is virtually spilling into the adjoining districts. Thus, the influence of these districts on GAMA’s future urban expansion cannot be overlooked. Future research works should therefore include the adjacent districts on the western and eastern sides of the region to better understand the connectedness and interdependence of Accra and its surrounding satellite towns.
Author Contributions
B.A. and N.O. conceived and designed the study and its methodology. B.A. conducted data processing, the formal data analysis, validation and visualization. B.A. prepared the original draft of the manuscript. Both authors contributed to the review and editing. N.O. was responsible for supervising.
Funding
This research received no external funding.
Acknowledgments
The authors would like to thank the Remote Sensing/GIS lab of the University of Ghana for their assistance. We gratefully acknowledge Dr. Wilhelm Windhorst for his advice.
Conflicts of Interest
The authors declare no conflict of interest.
References
- United Nations, Department of Economic and Social Affairs/Population Division. World Population Prospects: The 2017 Revision, Key Findings and Advance Tables. ESA/P/WP/248; United Nations: New York, NY, USA, 2017. [Google Scholar]
- United Nations Department of Economic and Social Affairs/Population Division. World Urbanization Prospects: The 2014 Revision; United Nations: New York, NY, USA, 2014. [Google Scholar]
- McNeill, J.; Alves, D.; Arizpe, L.; Bykova, O.; Galvin, K.; Kelmelis, J.; Migot-Adholla, S.; Morrisette, P.; Moss, R.; Richards, J. Toward a typology and regionalization of land-cover and land-use change: Report of working group B. In Changes in Land Use and Land Cover: A Global Perspective; Cambridge University Press: Cambridge, UK, 1994; pp. 55–71. [Google Scholar]
- Laurance, W.F.; Albernaz, A.K.M.; Schroth, G.; Fearnside, P.M.; Bergen, S.; Venticinque, E.M.; Da Costa, C. Predictors of deforestation in the Brazilian Amazon. J. Biogeogr. 2002, 29, 737–748. [Google Scholar] [CrossRef] [Green Version]
- Allen, J.C.; Barnes, D.F. The causes of deforestation in developing countries. Ann. Am. Assoc. Geogr. 1985, 75, 163–184. [Google Scholar] [CrossRef]
- Attua, E.M.; Fisher, J.B. Historical and future land-cover change in a municipality of Ghana. Earth Interact. 2011, 15, 1–26. [Google Scholar] [CrossRef]
- Seto, K.C.; Kaufmann, R. Modeling the Drivers of Urban Land Use Change in the Pearl River Delta, China: Integrating Remote Sensing with Socioeconomic Data. Land Econ. 2003, 79, 106–121. [Google Scholar] [CrossRef]
- Zak, M.R.; Cabido, M.; Caceres, D.; Diaz, S. What drives accelerated land cover change in central Argentina? Synergistic consequences of climatic, socioeconomic, and technological factors. Environ. Manag. 2008, 42, 181–189. [Google Scholar] [CrossRef] [PubMed]
- Ghana Statistical Service. 2010 Population and Housing Census Summary Report of Final Results; Ghana Statistical Service: Accra, Ghana, 2012.
- Kilcullen, D.; Mills, G.; Trott, W. Poles of Prosperity or Slums of Despair? The Future of African Cities; Discussion paper; The Brenthurst Foundation: Johannesburg, South Africa, 2015. [Google Scholar]
- Cities Alliance. Future Proofing Cities: Ghana—Metropolitan Cities. 2016. Available online: https://www.arup.com/perspectives/publications/research/section/future-cities-africa (accessed on 27 September 2018).
- World Bank. Rising through Cities in Ghana:Ghana Urbanization Review—Overview Report (English). Available online: http://wwwwds.worldbank.org/external/default/WDSContentServer/WDSP/IB/2015/05/13/090224b082e76e98/1_0/Rendered/PDF/Ghana000Rising0view0overview0report.pdf (accessed on 24 September 2018).
- Konadu-Agyemang, K. The Political Economy of Housing and Urban Development in Africa: Ghana’s Experience from Colonial Times to 1998; Praeger: Westport, CN, USA, 2001. [Google Scholar]
- Norström, A. Water and Sanitation in Ghana. Focus on Adenta Municipal District in the Greater Accra Region; CIT Urban Water Management AB: Stolkhom, Sweden, 2009. [Google Scholar]
- Ghana Statistical Service. Ghana Living Standards Survey 6 (GLSS 6), Main Report; Ghana Statistical Service: Accra, Ghana, 2014.
- Cohen, W.B.; Goward, S.N. Landsat’s role in ecological applications of remote sensing. AIBS Bull. 2004, 54, 535–545. [Google Scholar] [CrossRef]
- Yuan, F.; Sawaya, K.E.; Loeffelholz, B.C.; Bauer, M.E. Land cover classification and change analysis of the Twin Cities (Minnesota) Metropolitan Area by multitemporal Landsat remote sensing. Remote Sens. Environ. 2005, 98, 317–328. [Google Scholar] [CrossRef]
- Adepoju, M.O.; Millington, A.C.; Tansey, K.T. Land use/land cover change detection in metropolitan Lagos (Nigeria): 1984–2002. In Proceedings of the ASPRS 2006 Annual Conference, Reno, NV, USA, 1–5 May 2006; pp. 1–5. [Google Scholar]
- Kolehmainen, K.; Ban, Y. Multitemporal spot images for urban land-cover change detection over Stockholm between 1986 and 2004. Int. Arch. Photogramm. Remote Sens. Spat. Inf. Sci. 2008, 37, 63–66. [Google Scholar]
- Yankson, P.; Møller-Jensen, L. Assessing the Land Cover Change of Accra Using Landsat-TM Data. Geogr. Tidsskr.-Dan. J. Geogr. 1994, 94, 21–25. [Google Scholar]
- Stow, D.A.; Weeks, J.R.; Toure, S.; Coulter, L.L.; Lippitt, C.D.; Ashcroft, E. Urban vegetation cover and vegetation change in Accra, Ghana: Connection to housing quality. Prof. Geogr. 2013, 65, 451–465. [Google Scholar] [CrossRef] [PubMed]
- Stow, D.A.; Weeks, J.R.; Shih, H.-C.; Coulter, L.L.; Johnson, H.; Tsai, Y.-H.; Kerr, A.; Benza, M.; Mensah, F. Inter-regional pattern of urbanization in southern Ghana in the first decade of the new millennium. Appl. Geogr. 2016, 71, 32–43. [Google Scholar] [CrossRef] [Green Version]
- Musa, S.I.; Hashim, M.; Reba, M.N.M. A review of geospatial-based urban growth models and modelling initiatives. Geocarto Int. 2017, 32, 813–833. [Google Scholar] [CrossRef]
- Pijanowski, B.; Tayyebi, A.; Delavar, M.; Yazdanpanah, M.J. Urban expansion simulation using geospatial information system and artificial neural networks. Int. J. Environ. Res. 2009, 3, 493–502. [Google Scholar] [CrossRef]
- Koranteng, A.; Zawila-Niedzwiecki, T. Modelling forest loss and other land use change dynamics in Ashanti Region of Ghana. Folia For. Pol. 2015, 57, 96–111. [Google Scholar] [CrossRef] [Green Version]
- Samardžić-Petrović, M.; Dragićević, S.; Kovačević, M.; Bajat, B. Modeling Urban Land Use Changes Using Support Vector Machines. Trans. GIS 2016, 20, 718–734. [Google Scholar] [CrossRef]
- Ahmed, B.; Ahmed, R. Modeling urban land cover growth dynamics using multi-temporal satellite images: A case study of Dhaka, Bangladesh. ISPRS Int. J. Geo-Inf. 2012, 1, 3–31. [Google Scholar] [CrossRef]
- Amoako, C.; Frimpong Boamah, E. The three-dimensional causes of flooding in Accra, Ghana. Int. J. Urban Sustain. Dev. 2015, 7, 109–129. [Google Scholar] [CrossRef]
- Dickson, K.B.; Benneh, G. A New Geography of Ghana; Longman Publishing Group: Harlow, UK, 2001. [Google Scholar]
- Ministry of Local Government. Strategic plan for the Greater Accra Metropolitan Area; Millennium Cities Initiative: Accra, Ghana, 1992.
- World Bank. Enhancing urban resilience in the Greater Accra Metropolitan Area (English); World Bank Group: Washington, DC, USA, 2017; Available online: http://documents.worldbank.org/curated/en/949241495793834492/Enhancing-urban-resilience-in-the-Greater-Accra-Metropolitan-Area (accessed on 24 September 2018).
- Bolstad, P.; Lillesand, T.M. Rapid maximum likelihood classification. Photogramm. Eng. Remote Sens. 1991, 57, 67–74. [Google Scholar]
- Anderson, J.R.; Hardy, E.E.; Roach, J.T.; Witmer, R.E.A. A Land Use and Land Cover Classification System for Use with Remote Sensor Data; US Geological Survey Professional Paper (USGS): Reston, WV, USA, 1976.
- Singh, A. Review article digital change detection techniques using remotely-sensed data. Int. J. Remote Sens. 1989, 10, 989–1003. [Google Scholar] [CrossRef]
- Eastman, J.R.; Jin, W.; Kyem, P.A.K.; Toledano, J. Raster procedures for multi-criteria/multi-objective decisions. Photogramm. Eng. Remote Sens. 1995, 61, 539–547. [Google Scholar]
- Buckley, R.; Mathema, A. Real Estate and Remittances in Accra, Ghana: A Case of the Winner’s Curse? MIGA: Washington, DC, USA, 2007. [Google Scholar]
- Eastman, J.R. TerrSet Tutorial; Clark Labs, Clark University: Worcester, MA, USA, 2015. [Google Scholar]
- Civco, D.L. Artificial neural networks for land-cover classification and mapping. Int. J. Geogr. Inf. Sci. 1993, 7, 173–186. [Google Scholar] [CrossRef]
- Weng, Q. Land use change analysis in the Zhujiang Delta of China using satellite remote sensing, GIS and stochastic modelling. J. Environ. Manag. 2002, 64, 273–284. [Google Scholar] [CrossRef] [Green Version]
- Braimoh, A.K. Modeling Land-Use Change in the Volta Basin of Ghana; Cuvillier Verlag: Göttingen, Germany, 2004. [Google Scholar]
- Comité Permanent Inter-états de Lutte contre la Sécheresse dans le Sahel [CILSS]. A Window on a Changing World; CILSS: Ouagadougou, Burkina Faso, 2016. [Google Scholar]
- Doan, P.; Oduro, C.Y. Patterns of population growth in peri-urban Accra, Ghana. Int. J. Urban Reg. Res. 2012, 36, 1306–1325. [Google Scholar] [CrossRef]
- Grant, R. Globalizing city: The urban and economic transformation of Accra, Ghana; Syracuse University Press: New York, NY, USA, 2009. [Google Scholar]
- Wellington, H.N.A. In Gated cages, glazed boxes and dashed housing hopes–In remembrance of the dicey future of Ghanaian housing. In Proceedings of the 2009 National Housing Conference, Accra, Ghana, 7–8 October 2009; Council for Scientific and Industrial Research (CSIR)/Ghana Institute of Architects (GIA): Kumasi, Ghana, 2006; pp. 69–73. [Google Scholar]
- Yankson, P.W.K.; Gough, K.V. The environmental impact of rapid urbanization in the peri-urban area of Accra, Ghana. Geogr. Tidsskr.-Dan. J. Geogr. 1999, 99, 89–100. [Google Scholar] [CrossRef]
- Fiadzigbey, M.E. Customary Land Administration in Ghana. Challenges and Prospects; XXIII FIG Congress: Munich, Germany, 2006. [Google Scholar]
- Larbi, W.O.; Antwi, A.; Olomolaiye, P. Compulsory land acquisition in Ghana—policy and praxis. Land Use Policy 2004, 21, 115–127. [Google Scholar] [CrossRef]
- Yorke, C.; Margai, F.M. Monitoring land use change in the Densu River basin, Ghana using GIS and remote sensing methods. Afr. Geogr. Rev. 2007, 26, 87–110. [Google Scholar] [CrossRef]
- Ghana Energy Commission. Charcoal Price Tracking in Major Urban Centres of Ghana; Ghana Energy Commission: Accra, Ghana, 2014.
- Owusu, G. Coping with urban sprawl: A critical discussion of the urban containment strategy in a developing country city, Accra. Planum, J. Urban. 2013, 1, 1–17. [Google Scholar]
- Siedentop, S.; Fina, S.; Krehl, A. Greenbelts in Germany’s regional plans—An effective growth management policy? Landsc. Urban Plan. 2016, 145, 71–82. [Google Scholar] [CrossRef]
- Pan, H.; Deal, B.; Destouni, G.; Zhang, Y.; Kalantari, Z. Sociohydrology modeling for complex urban environments in support of integrated land and water resource management practices. Land Degrad. Dev. 2018, 29, 3639–3652. [Google Scholar] [CrossRef]
- Angel, S.; Blei, A.; Civco, D.; Lamson-Hall, P.; Parent, J.; Sanchez, N.G.; Civco, D.L.; Lei, R.Q.; Thom, K. Atlas of Urban Expansion—2016 Edition, Volume 1: Areas and Densities. Available online: https://www.lincolninst.edu/publications/other/atlas-urban-expansion-2016-edition (accessed on 12 October 2018).
- Agyemang, E. Transportation System as a Climate Mitigation Strategy for the Greater Accra Metropolitan Area (GAMA). Ph.D. Dissertation, University of Ghana, Accra, Ghana, 2015. [Google Scholar]
Figure 1.
Detailed map of the study area and its relative location on the West African coast.

Figure 2.
Population growth trends in Greater Accra Metropolitan Area (GAMA).

Figure 3.
Flow chart of the research methodology.

Figure 4.
Land-use type percentage coverage for 1991, 2000, and 2015.

Figure 5.
Net gains and losses that are associated with built-up during the two study periods.

Figure 6.
1991, 2000, and 2015 land use/land cover maps of GAMA.

Figure 7.
Validation map showing areas of hits, misses, false alarms, and null success.

Figure 8.
Changes in the urban extent of GAMA between 1991 and 2015 and the projected urban extent of the region for the year 2025.
Figure 8.
Changes in the urban extent of GAMA between 1991 and 2015 and the projected urban extent of the region for the year 2025.


Table 1.
Characteristics and properties of the Landsat images used.
| Acquisition Date. | Path/Row | Landsat | Sensor | Spatial Resolution | Number of Bands |
|---|---|---|---|---|---|
| 10/01/1991 | 193/056 | Landsat 4 | TM | 30 m | 6 |
| 04/02/2000 | 193/056 | Landsat 7 | ETM | 30 m | 7 |
| 27/01/2009 | 193/056 | Landsat 7 | ETM+ | 30 m | 7 |
| 06/12/2015 | 193/056 | Landsat 8 | OLI–TIRS | 30 m | 9 |
Table 2.
Description of Land use/land cover types.
| Land-Use/Land-Cover Type | Description |
|---|---|
| Built-up | Residential areas, Mixed urban areas Industrial and Commercial units, Transportation facilities |
| Forest | Evergreen forest land, Mixed forest land, Deciduous forest land, Forest reserves |
| Grassland | Herbaceous vegetation, Shrub and bush areas, Mixed grassland with few scattered trees |
| Bare-land | Beaches, Sandy areas, Exposed rocks, River banks, Quarries and gravel pits, transitional areas Lakes, Rivers, Streams, Canals, Reservoirs, Estuaries, Bays, Forested wetlands, Aquaculture facilities |
| Water |
Table 3.
Driver variables used and their descriptions.
| Dataset | Description | Source |
|---|---|---|
| Distance to Urban | Euclidean distance of pixels to the urban pixels | Retrieved from classified images |
| Distance to Road | Euclidean distance of pixels to the primary and secondary roads in the region | RS/GIS lab; University of Ghana. |
| Distance to Coast | Euclidean distance of pixels to the coast; Vector converted to raster | RS/GIS lab; University of Ghana. |
| Distance to CBD | Euclidean distance of pixels to the two economic hubs in the region | RS/GIS lab; University of Ghana. |
| Distance to Town | Euclidean distance to the main towns in the region | RS/GIS lab; University of Ghana. |
| Elevation | Digital Elevation Model (DEM) | NASA online data portal |
| Slope | Slope calculated from Digital Elevation Model | Calculated from Elevation dataset |
| Cost of Land | Land prices in Accra | [36] |
| Exclusionary Zone | A Boolean map with protected areas codes as 0 and other areas having a value of 1 | RS/GIS lab; University of Ghana., Google Earth |
Table 4.
Land-use percentage change and rate of change during the two study periods.
| Percentage Change (%) | Annual Rate of Change (%) | Area Change (ha) | ||||
|---|---|---|---|---|---|---|
| Land-Use Type | 1991–2000 | 2000–2015 | 1991–2000 | 2000–2015 | 1991–2000 | 2000–2015 |
| Bare-land | −39.51 | −6.90 | −4.39 | −0.46 | −732.1 | −77.3 |
| Forest | −37.08 | −69.69 | −4.12 | −4.65 | −20,121.4 | −23,790.5 |
| Grassland | 8.47 | −16.08 | 0.94 | −1.07 | 6784.2 | −13,971.0 |
| Urban | 74.96 | 115.90 | 8.33 | 7.73 | 13,961.6 | 37,768.4 |
| Water | 3.42 | 1.87 | 0.38 | 0.12 | 124.5 | 70.4 |
Table 5.
Relative significance of driver variables generated by forcing independent variables to be constant.
Table 5.
Relative significance of driver variables generated by forcing independent variables to be constant.
| Model (Constant Variable) | Accuracy (%) | Skill Measure | Influence Order |
|---|---|---|---|
| With all variables | 90.43 | 0.8724 | N/A |
| Slope | 90.51 | 0.8735 | 7 (least influential) |
| Distance to Town | 89.98 | 0.8665 | 6 |
| Distance to CBD | 88.97 | 0.853 | 5 |
| Cost of Land | 87.92 | 0.839 | 4 |
| Distance to Coast | 82.67 | 0.769 | 3 |
| Distance to Road | 81.91 | 0.7588 | 2 |
| Distance to Urban | 43.98 | 0.2531 | 1 (most influential) |
© 2019 by the authors. Licensee MDPI, Basel, Switzerland. This article is an open access article distributed under the terms and conditions of the Creative Commons Attribution (CC BY) license (http://creativecommons.org/licenses/by/4.0/).
Share and Cite
MDPI and ACS Style
Addae, B.; Oppelt, N. Land-Use/Land-Cover Change Analysis and Urban Growth Modelling in the Greater Accra Metropolitan Area (GAMA), Ghana. Urban Sci. 2019, 3, 26. https://0-doi-org.brum.beds.ac.uk/10.3390/urbansci3010026
AMA Style
Addae B, Oppelt N. Land-Use/Land-Cover Change Analysis and Urban Growth Modelling in the Greater Accra Metropolitan Area (GAMA), Ghana. Urban Science. 2019; 3(1):26. https://0-doi-org.brum.beds.ac.uk/10.3390/urbansci3010026
Chicago/Turabian StyleAddae, Bright, and Natascha Oppelt. 2019. "Land-Use/Land-Cover Change Analysis and Urban Growth Modelling in the Greater Accra Metropolitan Area (GAMA), Ghana" Urban Science 3, no. 1: 26. https://0-doi-org.brum.beds.ac.uk/10.3390/urbansci3010026