Article

A Statistically Rigorous Approach to Experimental Design of Vertical Living Walls for Green Buildings

1
School of Natural and Built Environments, University of South Australia, Mawson Lakes Boulevard, Mawson Lakes, SA 5095, Australia
2
Faculty of Engineering, Universiti Malaysia Sarawak, Kota Samarahan, Sarawak 94300, Malaysia
3
Phenomics and Bioinformatics Research Centre, School of Information Technology and Mathematical Sciences, University of South Australia, Mawson Lakes Boulevard, Mawson Lakes, SA 5095, Australia
*
Author to whom correspondence should be addressed.
Submission received: 27 June 2019 / Revised: 9 July 2019 / Accepted: 11 July 2019 / Published: 15 July 2019

Abstract

:
Living walls (LW) have been widely proposed as a form of green infrastructure to improve aesthetics, energy consumption, and microclimate in urban environments by adding densely-planted vegetation to the outside walls of buildings. Scientific studies using multiple treatments in a single LW face challenges due to the close physical proximity of different treatments, particularly the potential for plants above to influence those below. A study on a west-facing LW was undertaken to investigate 36 unique treatments in Adelaide, South Australia, for nine months. The LW comprised combinations of six native plant species, three soil substrates and two irrigation volumes. The LW consisted of 144 modular trays mounted on a wall in a 12 × 12 grid with four replicates of each treatment. The location of each treatment was designed to account for a cascading carry-over effect that may be present when one plant is placed above another. Carry-over effect of the model designed showed mixed results among the plant groups identified. It was also found that long-form plants can significantly shade smaller plants below them. Experimental research into the performance of plants in mixed species LW should consider the carry-over effect to account for this.

1. Introduction

From 2009–2013, 411 research articles on urban heat island (UHI) mitigation were published, reflecting a growing number of UHI phenomena research and found that vegetation-related measures were most researched compared to other measures [1]. A UHI study for Adelaide suggested that microclimates within the city may change within 1 km [2]. In another study, one of the factors that control the difference in UHI intensity is evaporation capability. Hence, green infrastructure has been recommended for implementation in cities [3].
Living wall is one of two popular vertical greenery systems (VGS), the other being the green façade [4,5,6,7,8]. The two are structurally different, in that with living walls the plants are contained in modular trays or felt pocket systems, while green façades provide structures for climbing plants. There are multiple VGS applications [9] but they are widely reported for their thermal benefits on building façades [10,11]. They provide shading that reduces the temperature of the façades, while evapotranspiration from the plants also reduces the temperature of their surrounding environment [12,13]. Subsequently, as the temperature of the building decreases [14,15,16,17,18,19], energy demands will also be reduced as less energy is required to heat or cool the building [20,21,22,23].
Reducing the thermal load on buildings is not the only benefit of VGS, which in urban areas have the potential to also act as habitat to enhance urban biodiversity. In a study involving 33 VGS in France, beetles and spiders were most common in living walls compared to bare walls and green façades. This was due to the frequent irrigation of the living walls, which created micro habitats for invertebrates [24].
Plant selection is important to maximize the capacity and performance of a living wall [25,26]. To minimize the maintenance and irrigation needs, especially for living walls, utilizing perennial and native plants is advisable [27]. Previous studies on living walls have explored the use of perennials [25,28], shrubs [29,30,31], edible plants for food production [17,32,33,34], and local or native plants [11,23,35].
VGS also provide enhanced aesthetics [36,37] that can improve human health [38] and increase property values [39]. VGS are high in initial costs and on-going maintenance requirements, and life-cycle studies and cost-benefit analyses suggest there will be a long-term return-on-investment period for VGS [27,40,41].
Irrigation of VGS is key to both the survival of the plants and the transpirative cooling effect that they provide. To optimize irrigation, suggestions have been to use drip irrigation, drought tolerant plants, rainwater harvesting, and irrigation without a pumping system [42], and to employ higher frequency irrigation events with lower flows but shorter irrigation time [43]. The myriad combinations of contributing factors to VGS performance (e.g., plant species, irrigation regime, and substrate/soil type) complicate the experimental study of VGS.
In conventional horticultural or botanical research, individual plant replicates would be spread out and appropriately randomized to minimize interference between one another. However, in a compact living wall where the intent is to study the performance of plants growing in a realistic, closely-planted structure, interference between individual plants (especially those located above and below one another) may be expected. This study presents a statistically rigorous experimental design for investigating the potential of native plants growing in such a compact living. We focus on the growth habit of six native plant species, grown in three different substrates with two irrigation regimes for a living wall in South Australia. This study investigates individual plant growth as well as how plant growth is affected by the cascading effect of the plants above them.

2. Materials and Methods

A living wall was installed on a west-facing atrium wall of a building in Adelaide, South Australia. The experiment was conducted for nine months, from December 2015 to August 2016. According to the Köppen-Geiger climate classification, Adelaide experiences temperate Mediterranean climate (Csa, warm temperate–summer dry–hot summer) [44]. Adelaide is further categorized as being in the warm dry (3B) climate zone with cooling degree days (CDD) of 2316 h and heating degree days (HDD) of 1202 h [45]. Adelaide is the driest state capital city in Australia, with a long term annual average precipitation of about 550 mm [46]. During the study period, the average daily temperature recorded at the atrium, measured at 1.0 m away from the living wall (LW) was 18.7 °C, with 2.6 °C minimum daily temperature and 45.6 °C maximum daily temperature. On average, humidity of the atrium was 64%. Measurement was conducted using digital iButton hygochron temperature/humidity logger (DS1923) (resolution 0.5 °C, accuracy of ±0.5 °C from −10 °C to 65 °C) [47]. Wind velocity was not measured during this experiment as the atrium was fully sheltered with negligible exposure to outside winds.

2.1. Experimental Setup

An experimental living wall of 2.4 m (w) × 3.0 m (h) was mounted on an atrium wall that was 7.0 m (w) × 4.0 m high (Figure 1). This wall faces west in an atrium surrounded by glass walls and clay bricks. The living wall consisted of 144 Elmich Versiwall modular living wall pots, 12 on each row and with 12 columns. Each pot was 195 mm (w) × 207 mm (h) × 192 mm (d) [48] with a total volume of 1.8 L, and each contained 1.5 L of soil substrate. The setup was equipped with a drip irrigation system with pressure compensating drippers. A total of 36 different treatments were investigated in this study, comprising of the combinations of six plant species, three soil substrates, two irrigation frequencies, and each combination had four replicates.

2.1.1. Plant Selection

The plant species were initially identified according to their height and canopy traits to suit the small-sized pots and to withstand the local climate, particularly the intense dry heat in summer. The species choice was further refined according to their life-cycle (perennial plants were chosen), growth rate, perceived resilience, and availability from local suppliers in tube stock. The six native South Australian plants selected were: (i) Einadia nutans (nodding saltbush) or EN, (ii) Festuca glauca (blue fescue) (FG), (iii) Goodenia varia (sticky goodenia) (GV), (iv) Lomandra filiformis (wattle mat rush) (LF), (v) Scaevola albida ‘mauve cluster’ (fairy fan flower) (SA), and (vi) Pelargonium australe (Austral storksbill) (PA). The plant species were also classified into groups based on their growth habit: Spreading (GV), compact (EN, PA, and SA), and grass (FG and LF).

2.1.2. Soil Substrates

Soil substrate type is a crucial factor affecting plant root growth and, subsequently, the growth rate of individual plants [49,50]. In the living wall pot, a geotextile layer was placed beneath the substrate layer. The soil substrate used was organic sandy loam (L) that contained approximately 30% organic compost. Two other substrate combinations were introduced by mixing the loam with 10% v/v kaolin clay and bentonite clay (C) at a 1:3 ratio, and 10% v/v commercial grade zeolite (Z), respectively. Kaolin and bentonite clays were selected because clay can increase water retention in sandy soils [51]. In contrast, zeolite is a mineral component and a commercial soil conditioner often applied as an additive to growth media to alter the chemical and physical properties of the soil [52,53]. Zeolite has a high range of cation exchange capacity (CEC), around twice that of bentonite [53]. The water holding capacity of each substrate determined using percolation test was 39.4%, 43.9%, and 36.7% for loam, clay, and zeolite, respectively. Scoria was added as mulch to all pots. No fertilizers were used during the experiment.

2.1.3. Irrigation

Plants in small pots need to be watered regularly [54]. The small container pots limit the plant root growth area due to the small physical volume and limited moisture. In this study, the irrigation amount was set at slightly higher than the average Adelaide annual rainfall to account for expected high evaporation rates. Drip irrigation was employed to maintain consistency in the irrigation water delivered to each pot. Two irrigation frequencies were used, with calculations based on the 1.5 L living wall pot: (i) Infrequent irrigation of 4 L/h for 5 min weekly, or about 333 mL weekly (I1); and (ii) frequent irrigation of 2 L/h for 3 min every 48 h, or about 350 mL weekly (I2).
Excess irrigation drained from the bottom of the pots via an outlet added to the bottom of each pot, with drainage tubes running across the back of the living wall structure to the floor. The individual outlets were labeled and used to capture excess irrigation water for subsequent analysis.

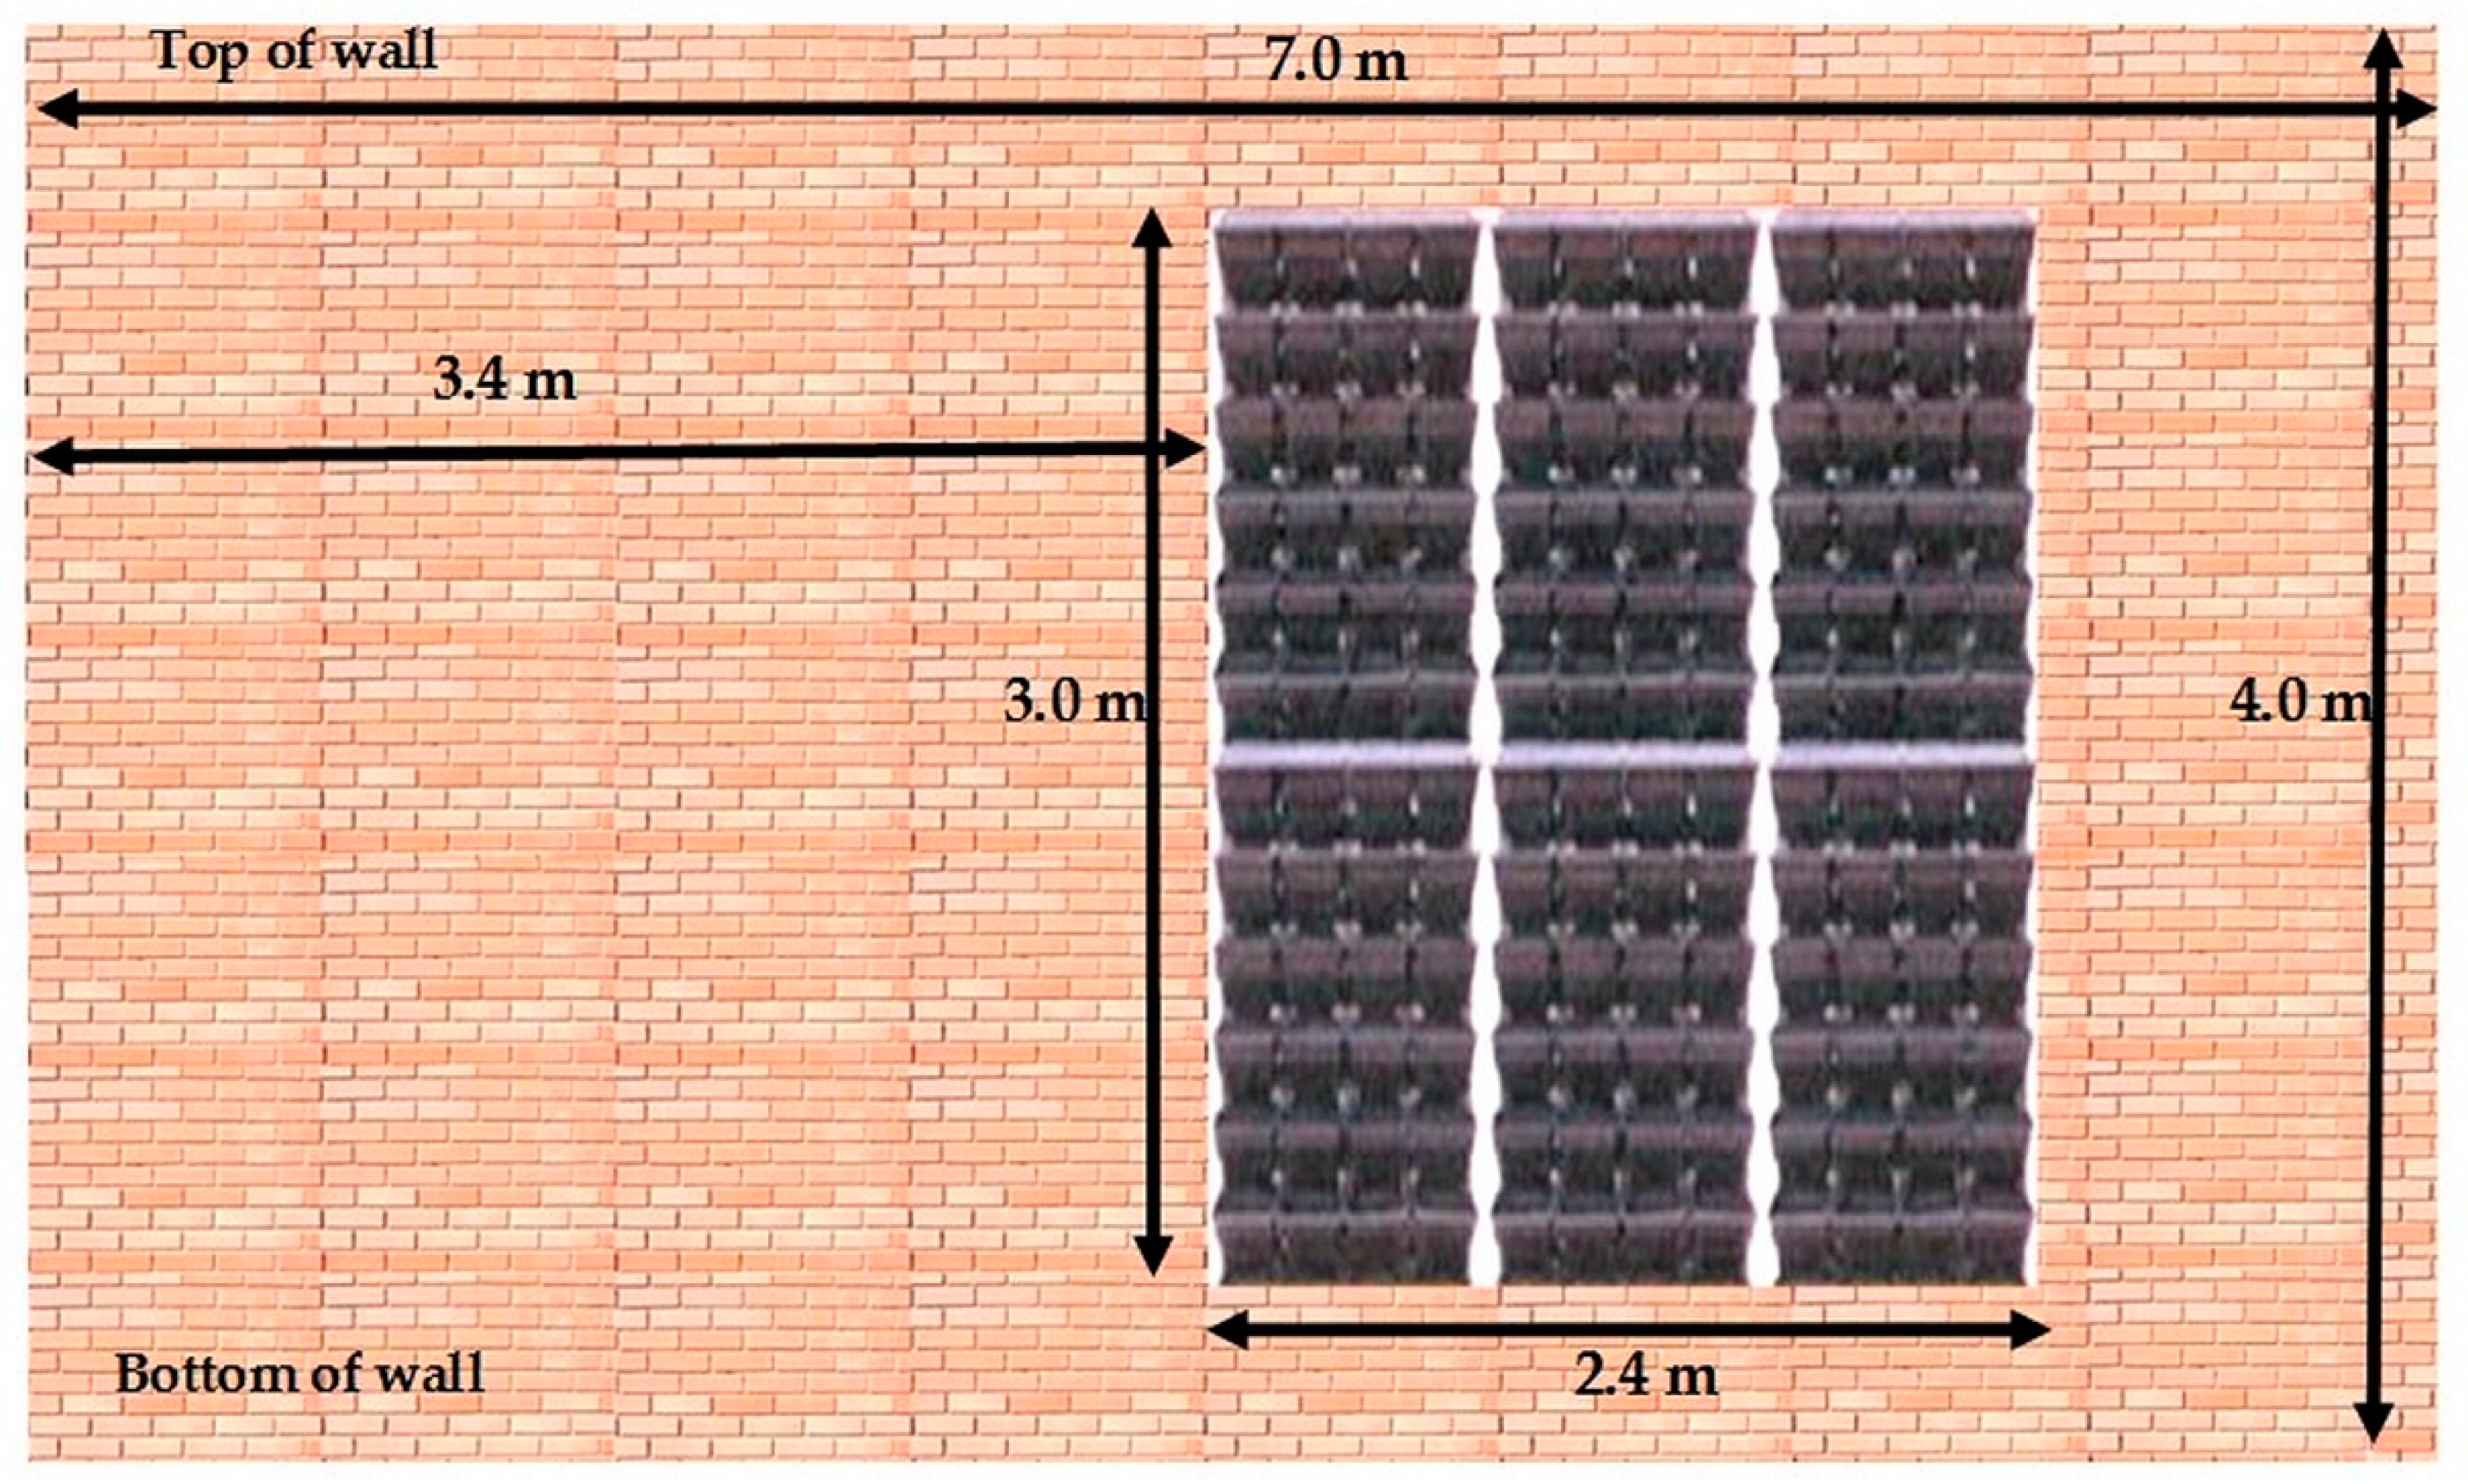
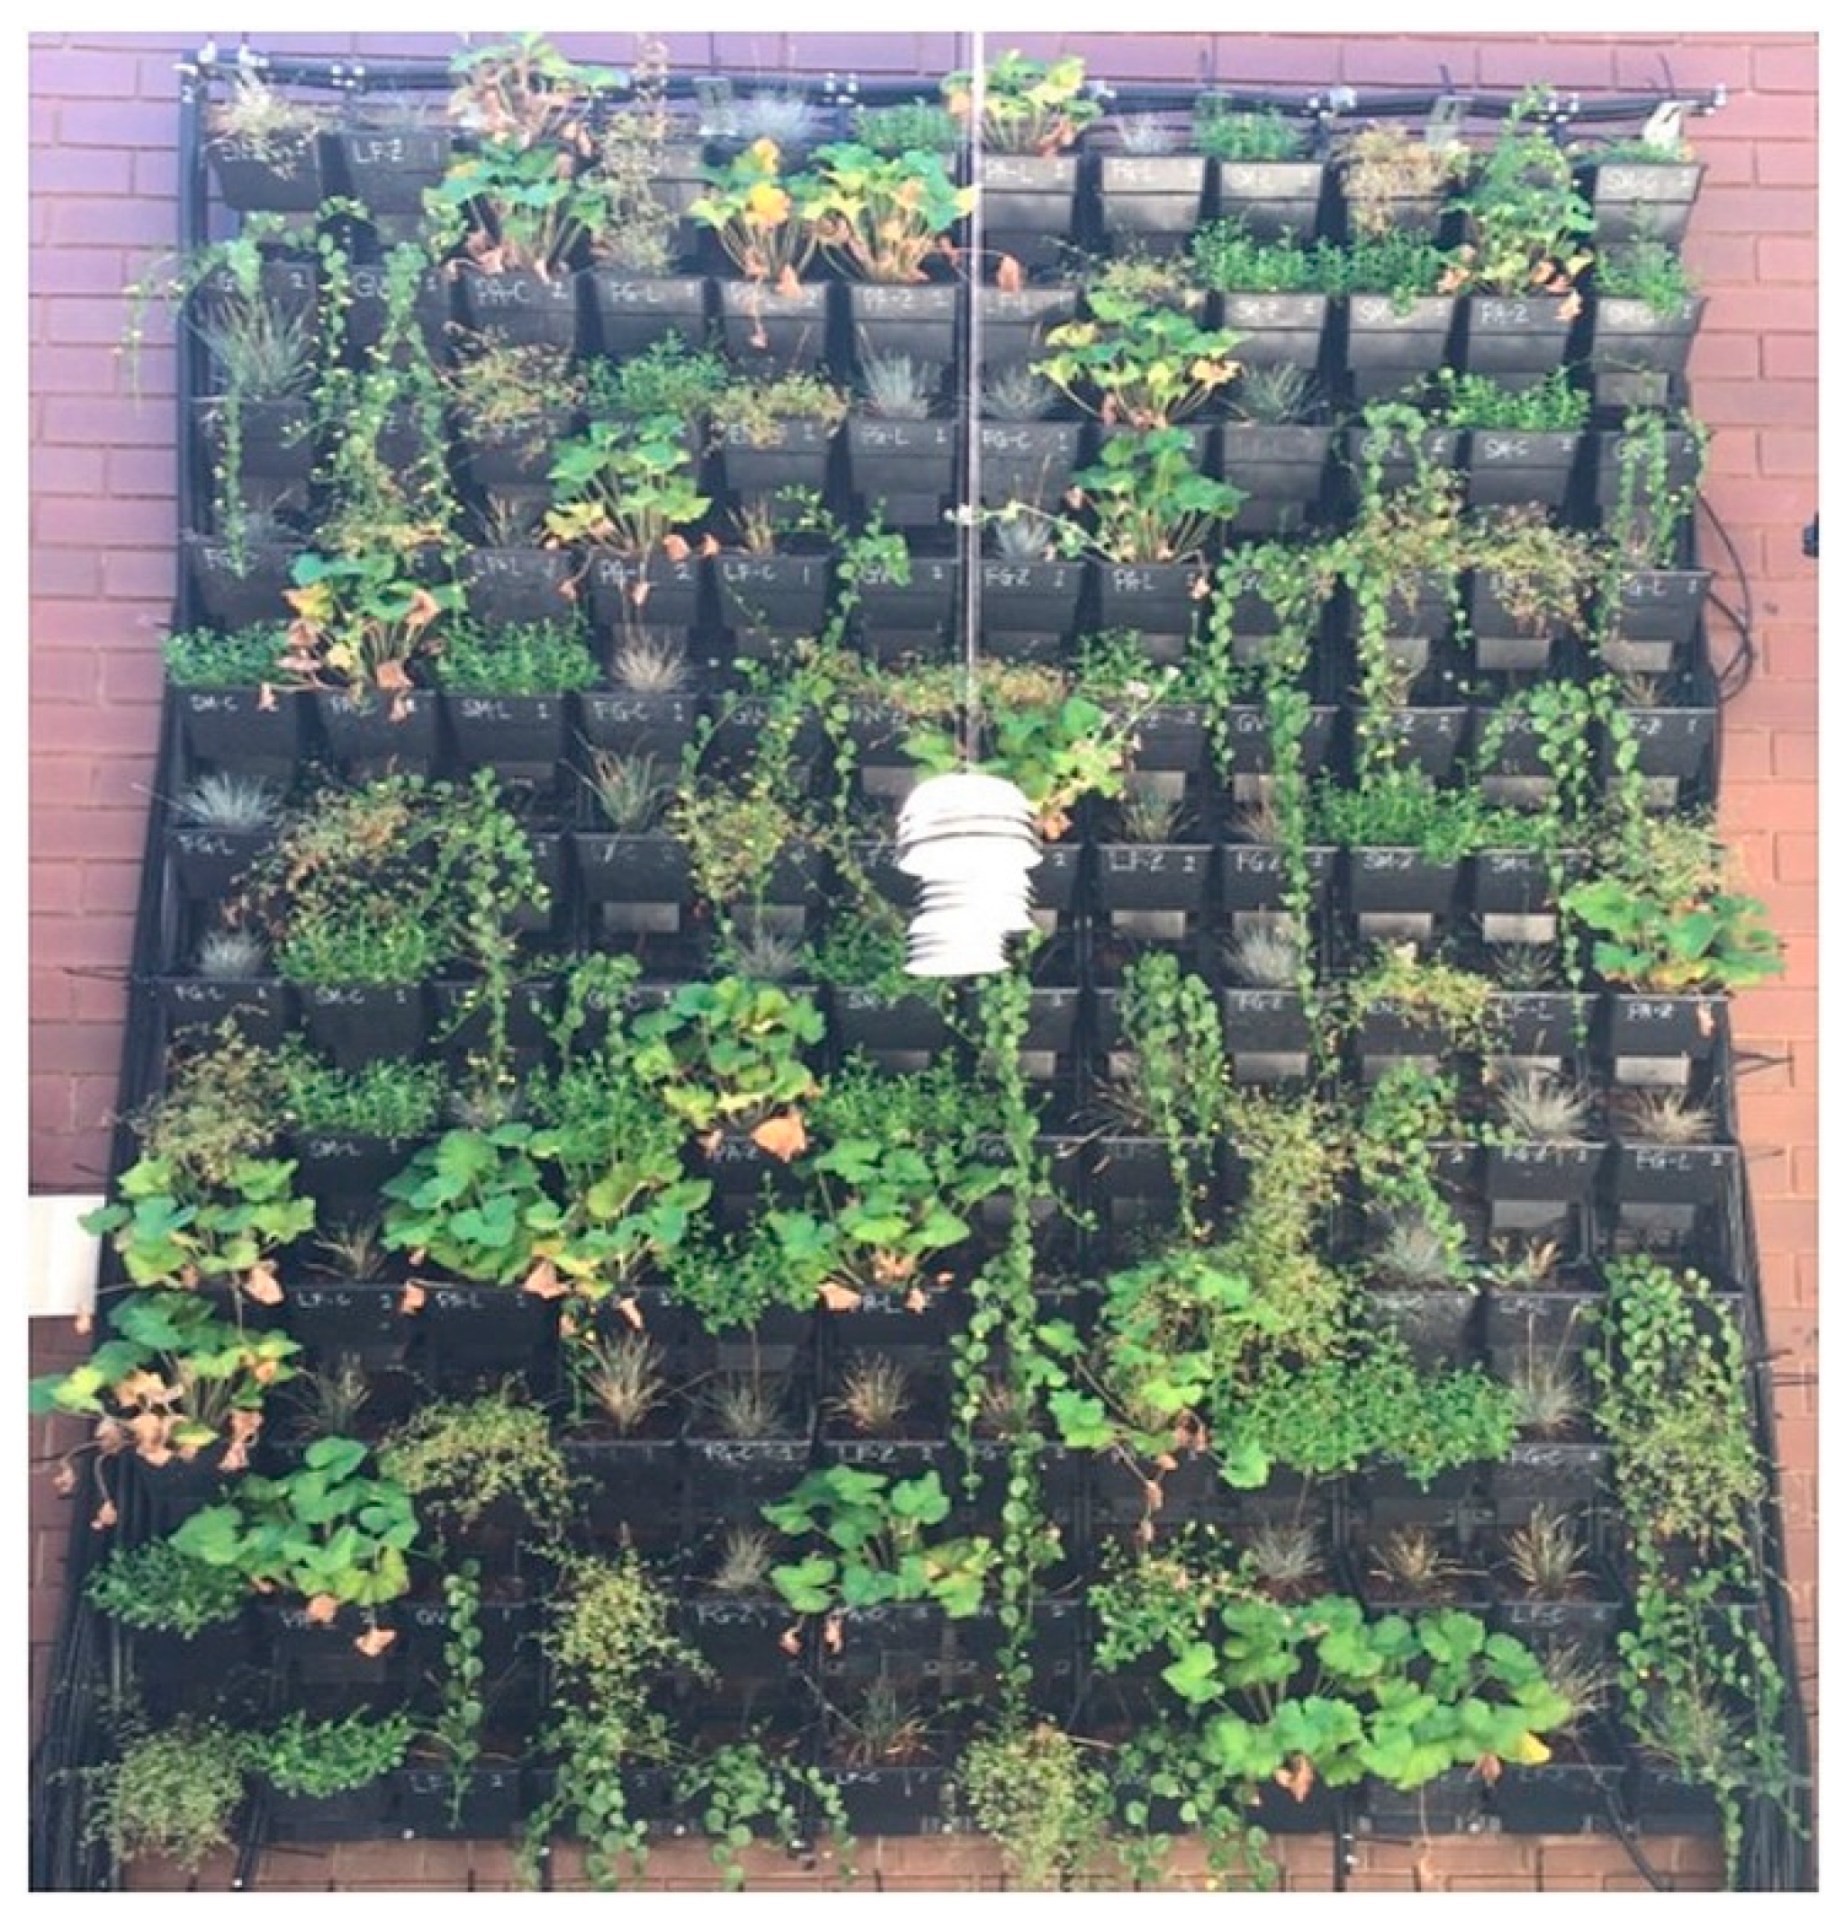
2.1.4. Arrangement of Living Wall Pots

It was anticipated that incident light would vary across the rows and columns of the trays. Furthermore, a large plant may shade the plant in the tray below. To design the arrangement of the pots, light variability was considered. To account for these sources of variability, a row-column carry-over design for assigning the 36 treatments (six plant species, three soil substrates and two irrigation levels) was used, and this was generated using the computer package CycDesigN [55]. This design spreads the replicates of the treatments across the rows and columns, while, as far as possible, all the treatments occur above those pots that receive the same treatment. The carry-over design is capable of comparing treatments, after adjusting for the influence (carry-over effect) on the plot below of the plant group (Section 2.1.1), soil substrate, and irrigation level in the pot above; it provides estimates of both the adjusted direct treatment and the carry-over treatment effects. The arrangement of the pots on the living wall is shown in Table 1.
Planting commenced in November 2015. For each species, three sample plants were taken at the beginning of the experiment. Each plant was measured for height, then dried in the oven at 70 °C for at least 48 h until the mass has stabilized [56]. The final dry weight of the plant was taken as the sample biomass rate. In the first four weeks, all pots were given the more frequent irrigation treatment (I2) to establish their growth and to ensure they would be ready to face the harsh warm and dry summer conditions. In August 2016, all plants were harvested, and they were individually processed.
Measurements were taken for average and maximum plant height and dry weight at harvest for growth analysis. Plant height is a measure of growth and vigor [56]. Both maximum height (Hmax) and average height (Havg) were recorded. Hmax is taken as the maximum length of foliage to the crown of the stem and was not always measured vertically. For spreading plants, for example, the concept of height was a measure of these plants’ length as they droop outwards and/or downwards. The average height was a more qualitative and approximate measure of the height (or length) of most of the stems or foliage, as in many cases it was not practical to measure each piece of a many-stemmed plant or every leaf of grass. All height measurements were taken before drying. Height measurements after harvest were taken by laying the plants straight on the working table and measured using a metric measuring tape. The plants were then stored in a paper bag and dried in the oven set at 70 °C until the weight had stabilized. Dry weight was taken with an electronic balance (A&D, Electronic Balance FA-2000).
The measurements at the end of the experiment were then compared to the average height, and dry weight of the sample plant measured and weighted at the start of the experiment.
Plant health and survival was visually assessed [57] and was assigned a living percentage from 0% to 100%. Plants assessed as being moderately healthy (31–60%), healthy (61–90%), and very healthy (91–100%) were considered for further analysis, while unhealthy plants (0–30%) were removed from the analysis. Observations were also made for pests and biodiversity, new plant growth, and soil conditions.

2.2. Statistical Analysis

A mixed-model analysis of each response, after omitting plants for which the living percentage was less than or equal to 30% (very unhealthy), was performed using the ASReml-R [58] and ASRemlPlus [59] packages for the R statistical computing environment [60]. The maximal mixed model for this analysis when all plant species are observed was in the following form:
E[Y] = xRow + (Group + Plant)*Substrate*Irrigation + First + (GrCarry/Group)*SubCarry*IrrCarry
var[Y] = Rows + Columns + idh(Group):WithinGroup
where E[Y] and var[Y] are the expected value and variance of the response Y that model the fixed and random effects, respectively, as follows: (i) xRow adjusts for linear trend across the rows, Rows separates random deviations from the trend, and Columns separates column variation; (ii) Group, Plant, Substrate, and Irrigation are the treatment factors and give rise to direct effects of the treatments; (iii) SubCarry, IrrCarry, and GrCarry are factors indexing the Substrate, Irrigation, and Plant Group, respectively, that occurred in the row above each plant and give rise to carry-over effects of the treatment factors; (iv) first indexes whether it is the first row or not (there being no plants above the first row); and (v) the combination of GrCarry and Group allows for the carry-over effect of the Plant Groups to depend on the Group below; and (vi) idh(Group):WithinGroup signifies that the variability of plants within each of the three groups of plant species was allowed to differ between these three groups.
In the case of the variables for which only the plant species EN, GV, and PA were observed, the variance was allowed to differ between plant species and the carry-over effects were omitted from the analysis.
For all responses, REML ratio tests with α = 0.20 were used to test whether the residual variances differed significantly between the plant groups. The model was modified to reflect the results of these tests and residual versus fitted value plots and normal probability plots of the residuals were inspected to check that the assumptions underlying the analysis were met.
Then two sets of Wald F-tests were conducted with α = 0.05 and employing degrees of freedom calculated using the Kenward–Rogers method: (i) Carry-over effects were tested and any non-significant terms omitted; and (ii) the model describing the effects of the factors Plant, Substrate, and Irrigation was determined, with non-significant terms retained. For each set, testing began with the term containing all of the factors for that set and proceeded by testing terms whose factors were not a subset of those of a significant term. Predictions for the 36 treatment combinations, adjusted for carry-over effects, were made, as were predictions for the carry-over effects themselves. Approximate least significant difference values for a significance level of 5% [LSD (5%)] were calculated for determining the significance of differences between pairs of predictions.

3. Results and Discussions

The results are grouped according to the 36 different treatment types. The following sections discuss plant growth, namely health and survival, plant height and dry weight, and additional observations. Carry-over effect analysis is shown in the analysis of maximum plant height. Figure 2 shows the experimental living wall and arrangement of the 144 living wall pots.

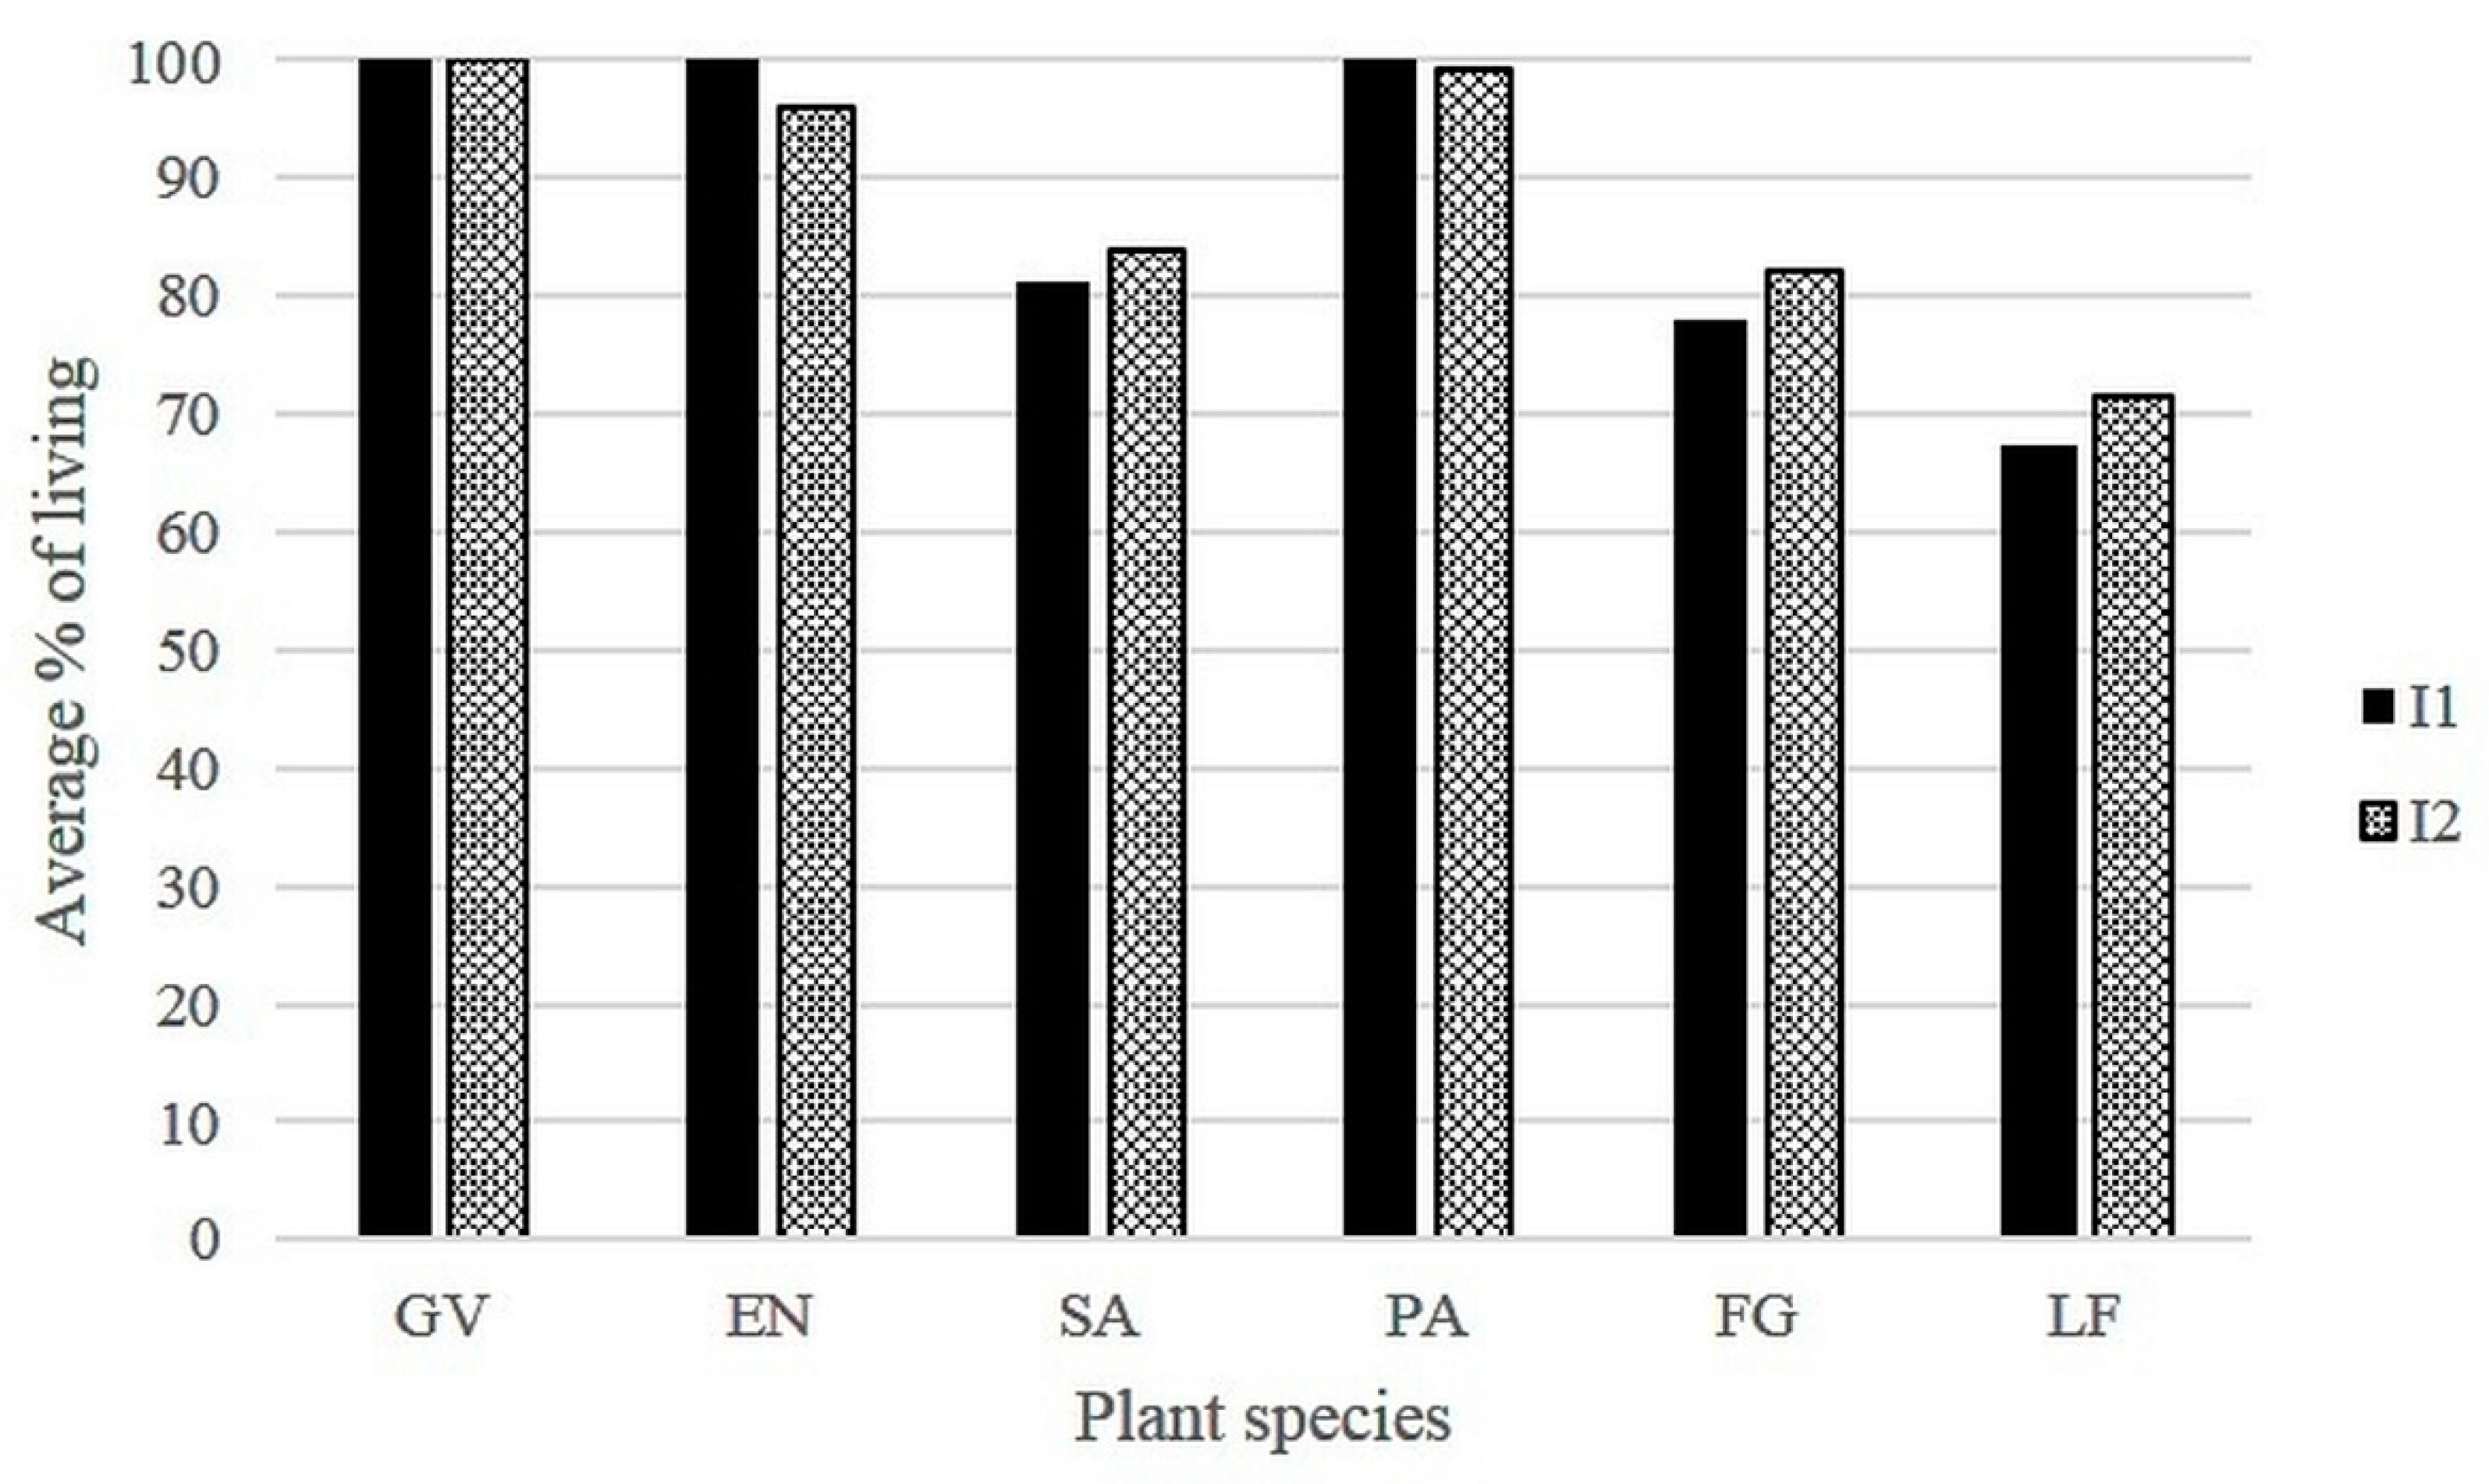
3.1. Plant Health and Survival

Of the 144 living wall pots, 110 (or 76%) were assessed as being moderately healthy to very healthy. The results for each treatment are presented in Table 2. All GV in each soil substrate and irrigation treatment survived the entire study period. The next most healthy plant was PA with 22 out of 24 pots assessed, followed by EN (20 out of 24). LF grass was the least resilient with only 11 out of 24 plants assessed as moderate to very healthy. This suggests that GV, PA, and EN are the most resilient plant species across a range of conditions. In terms of the soil substrate used, 39 out of a maximum of 48 plants in clay were moderate to very healthy, followed by zeolite (36/48) and loam (35/48). For irrigation treatment, I2 recorded more healthy plants with 59/72, compared to I1 with only 51/72 plants. However, the differences are small, thus, plant vigor was not affected by the different irrigation treatments.
The average living percentage recorded for all 110 plants included in the analysis are presented in Figure 3, which is consistent with the analysis in Table 2. All GV planted for this experiment (1) survived the experiment, and (2) had a 100% score on the percentage of living (very healthy). From the 22 PA, all PA in I1 were very healthy (100%), while the 11 PA in I2 were on average score of 99%. Similarly, all EN in I1 were very healthy (100%) while EN in I2 were on average score of 96%.
The plant species selection was significant to this study, as the use of climate-appropriate plants is expected to further minimize maintenance requirements for living walls [25,59]. The grasses, LF and FG, had the lowest survival rate in the living wall with only 11 (45.8%) and 15 (62.5%) plants of each respective species classified as moderately healthy and above. Of these remaining plants, LF on average were only 70% healthy (67.5% for I1, 71% for I2), while FG were on average 81% healthy (78% for I1, 82% for I2). SA were similar on average for both irrigation treatments, with 81% (I1) and 83% (I2) of plants being assessed as healthy.

3.2. Plant Height

The results of the analyses for both maximum height (Hmax) and the more qualitative average height (Havg) are reported here.

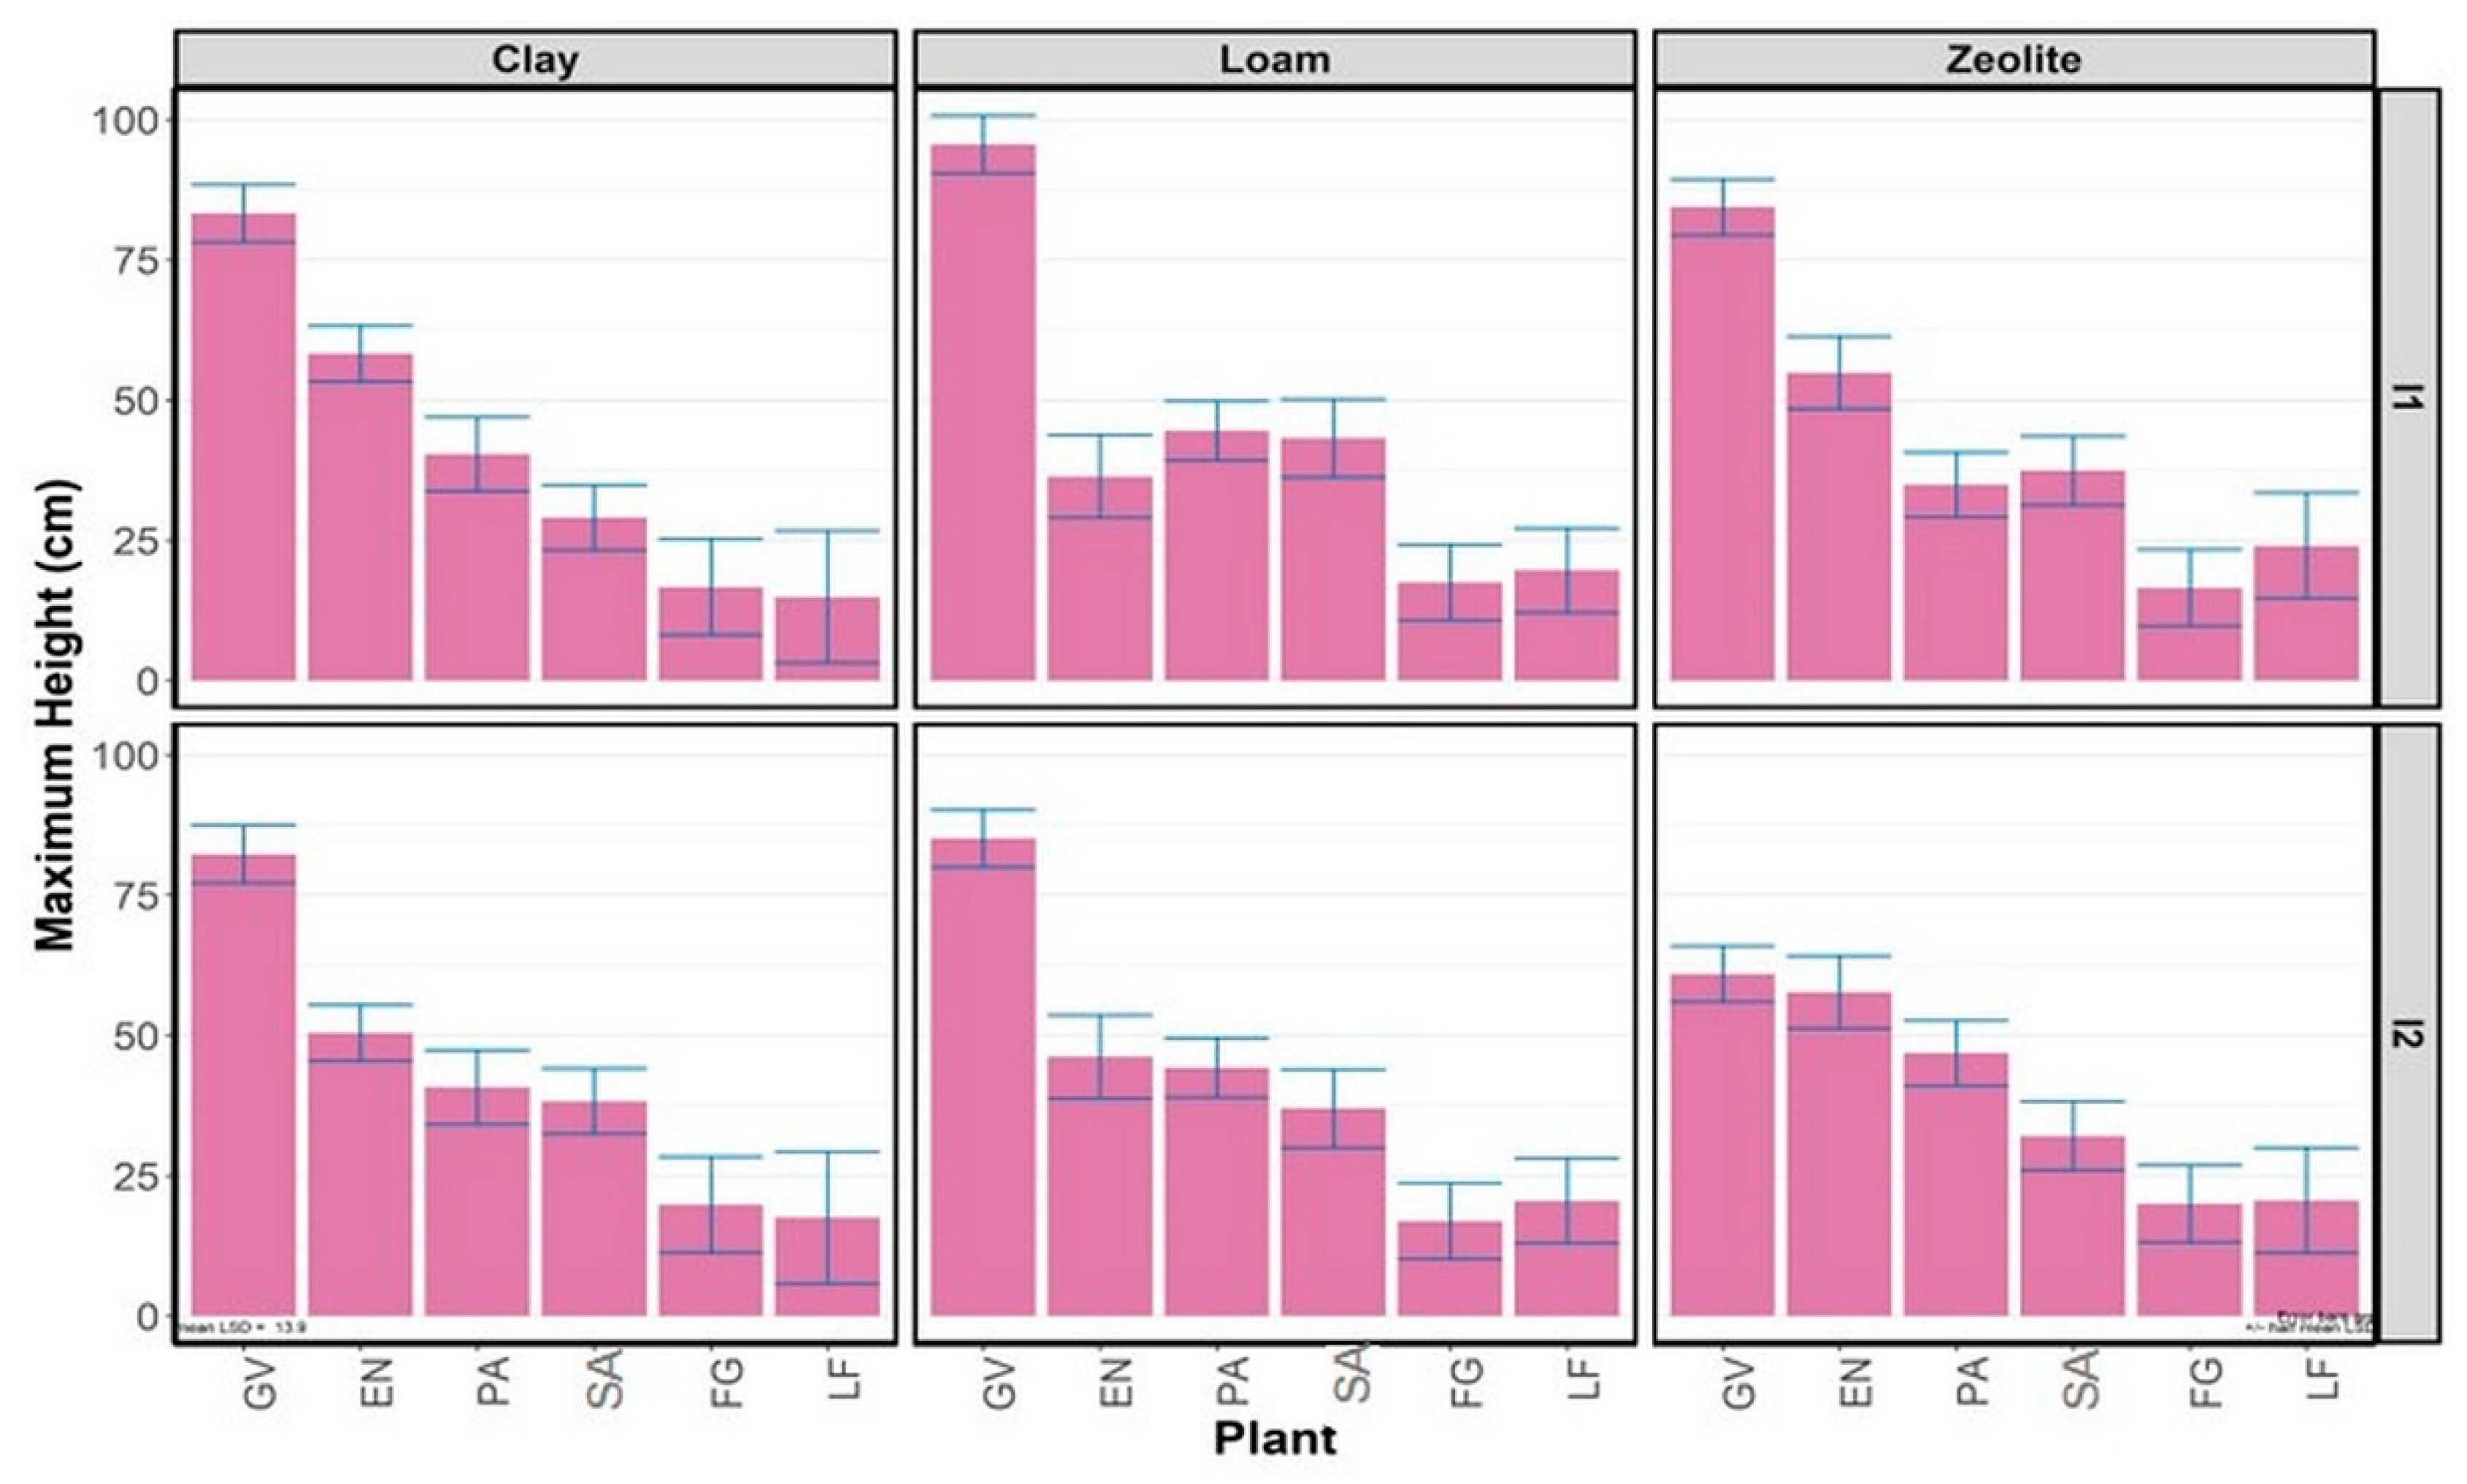
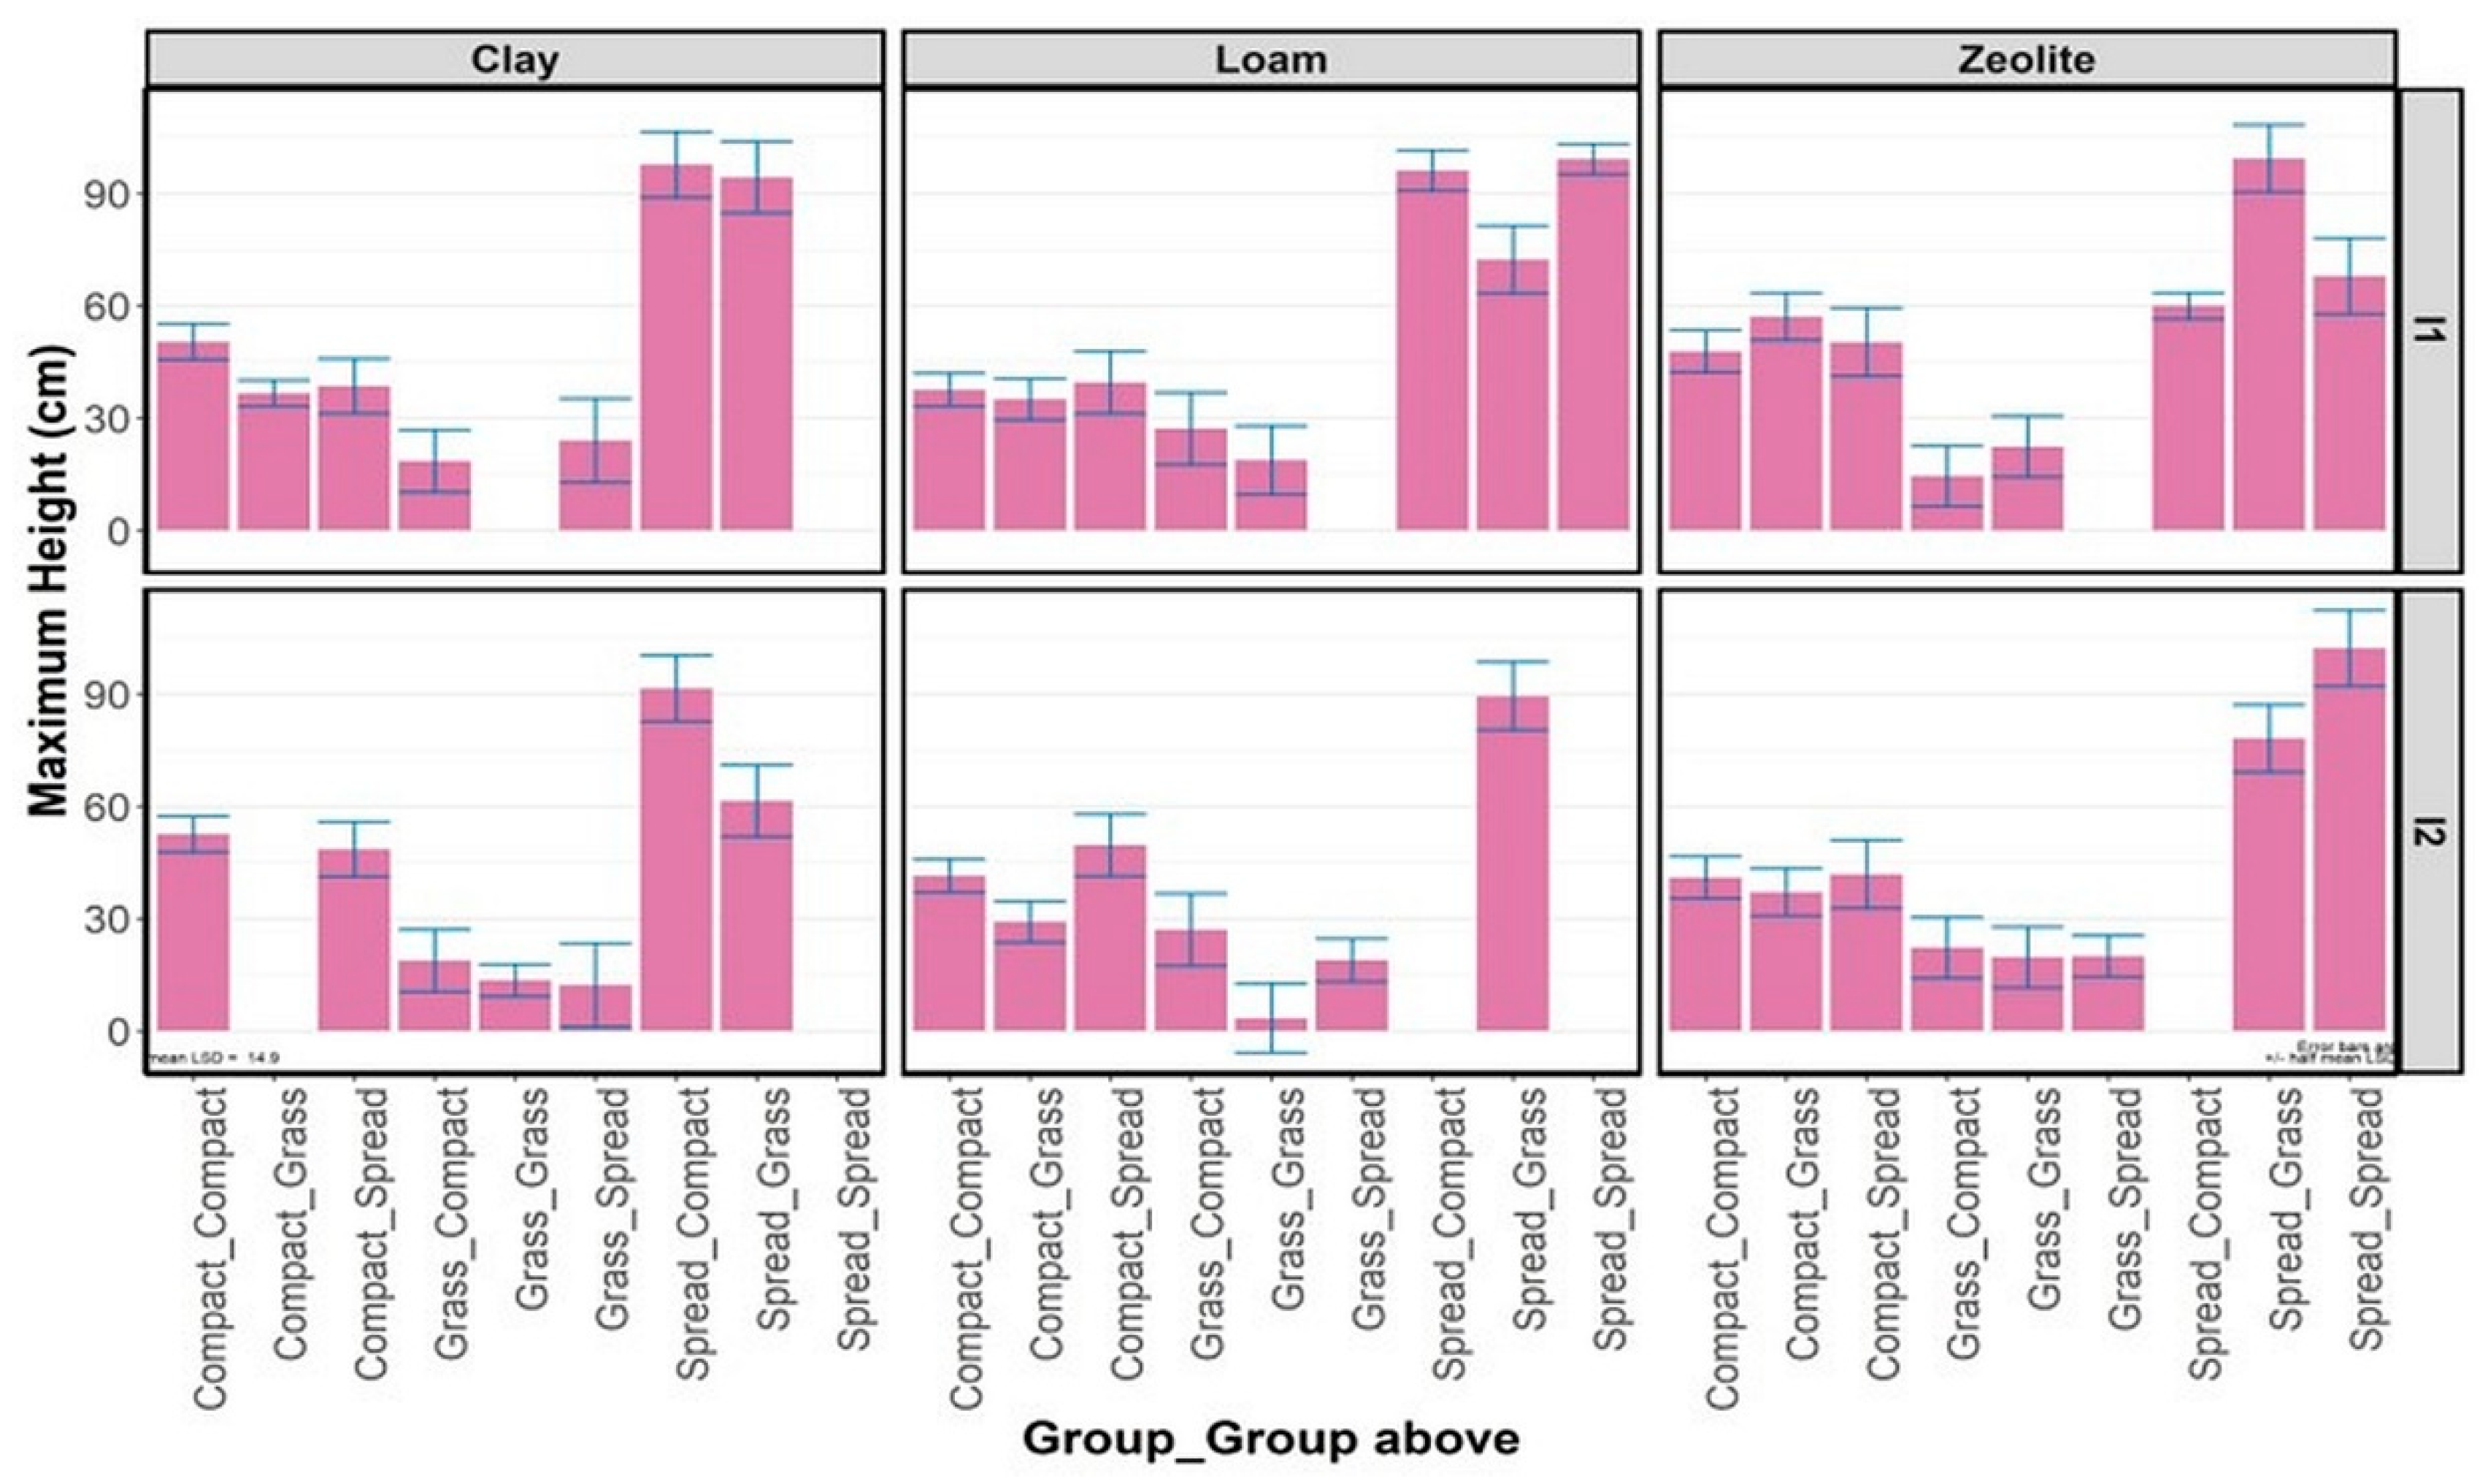
3.2.1. Maximum Plant Height

The mixed model analysis revealed that Hmax depended on the combination of plant, substrate, and irrigation (p = 0.009) and that there was a carry-over effect that varied with the plant group, substrate, and irrigation of the plant above (p = 0.032).
The predicted means of Hmax (adjusted for the carry-over effects) are shown in Figure 4. For all combinations of substrate and irrigation, except for zeolite with I2, GV is significantly taller (p ≤ 0.05) than all the other plants. In all cases, there is not a significant difference (p > 0.05) between LF and FG, but in almost all cases, LF and FG are significantly smaller (p ≤ 0.05) than the other plants. For the compact plants, EN, PA, and SA: (i) There are no significant differences (p > 0.05) for I2 with clay and loam and I1 with loam; (ii) EN is taller (p ≤ 0.05) than PA and SA for clay and zeolite with I1; and (iii) SA is smaller (p ≤ 0.05) than EN and PA for zeolite with I2.
Considering each plant species, there are few significant differences. GV does not significantly differ (p > 0.05) between the substrates and irrigation treatments, except that it is significantly smaller (p ≤ 0.05) for zeolite with I2. For EN, there are no significant differences, except for loam with I1, which is significantly smaller (p ≤ 0.05) than all the other substrate–irrigation combinations. For PA, the only significant difference (p ≤ 0.05) is between I1 and I2 in zeolite, and for SA, the only significant difference (p ≤ 0.05) is between loam and clay with I1. For each of FG and LF, there are no significant differences (p > 0.05) between substrate–irrigation combinations.
The predicted carry-over effects for Hmax are shown in Figure 5; some combinations of group and group above do not have values because they were not present in the subset of the data analyzed. The interpretation of a carry-over effect for a group is that it represents the average for plants when the combination of factors for that carry-over effect is above that group. For example, the values for the first three positions from the left in each panel, when they are present, measure the effect of the above plant groups (compact, grass, and spread) on the compact plants.
In compact plants, in clay substrate, Hmax values were not statistically significant (p > 0.05) in most combinations, except Compact_Grass under I1 which was significantly smaller than Compact_Compact under both I1 and I2. In loam, Hmax for compact plants was only significantly different (p ≤ 0.05) under I2 whereby Compact_Grass carry-over was smaller than Compact_Compact and Compact_Spread carry-over. In zeolite, Compact_Grass under I1 was significantly taller than all compact carry-over groups in I2.
For grass plants, the Hmax were similar between groups in all substrates and irrigation types, except in loam where Grass_Grass under I2 was significantly shorter than Grass_Grass under I1 and Grass_Compact under I2.
For spreading plants, Hmax was not significantly different (p > 0.05) between (1) in clay: Spread_Compact under I1 and I2; Spread_Compact and Spread_Grass, both under I1, (2) in loam: Spread_Compact and Spread_Spread, both under I1; Spread_Grass under I2 with all group carry-over groups in I1; (3) in zeolite: Spread_Compact and Spread_Spread in I1; Spread_Spread in I2 and Spread_Grass in I1; and Spread_Grass in I2 and Spread_Spread in I1.
Generally, the effect of other plants on compact plants is intermediate between their effect on spreading plants and the grasses. In most cases, grasses were not significantly affected by the plants above them. Spreading plants, however, remained the tallest of all groups due to their physiological nature but were affected by plants above. In retrospect, it would be preferable to construct a design that balances the three groups of plant species by three soil substrates and by two irrigation levels that occur above the pots with the same treatment.

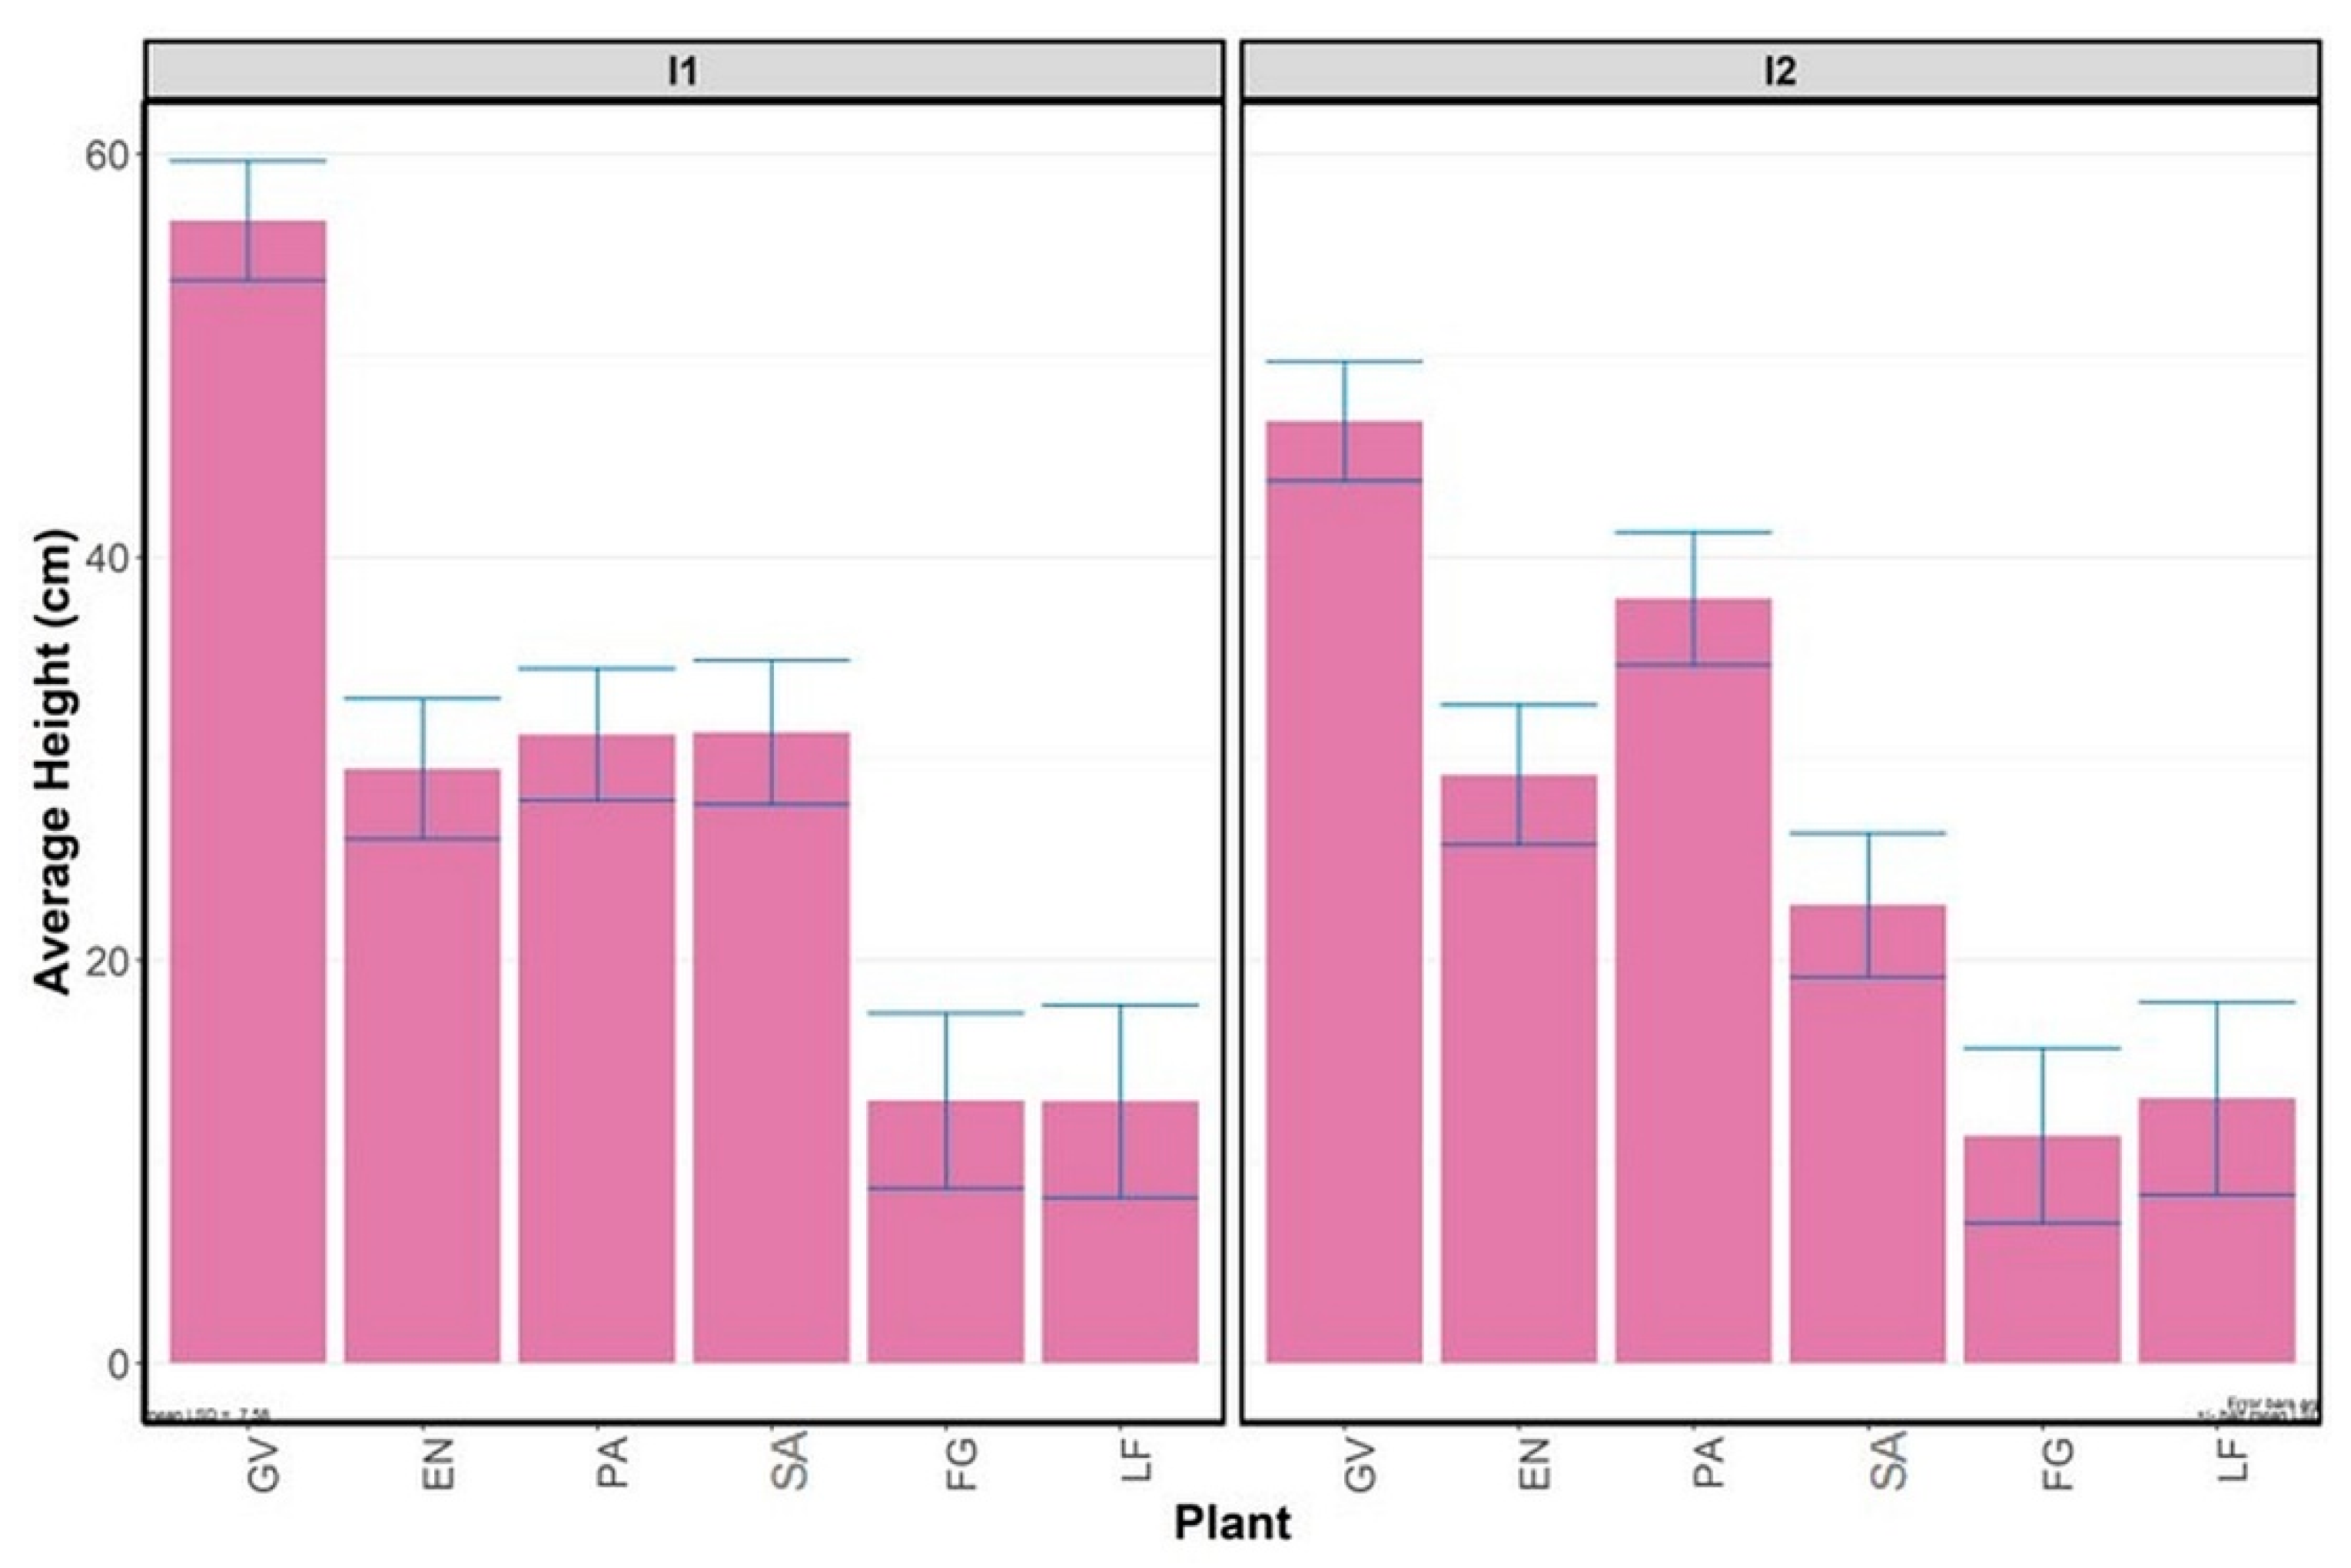
3.2.2. Average Plant Height
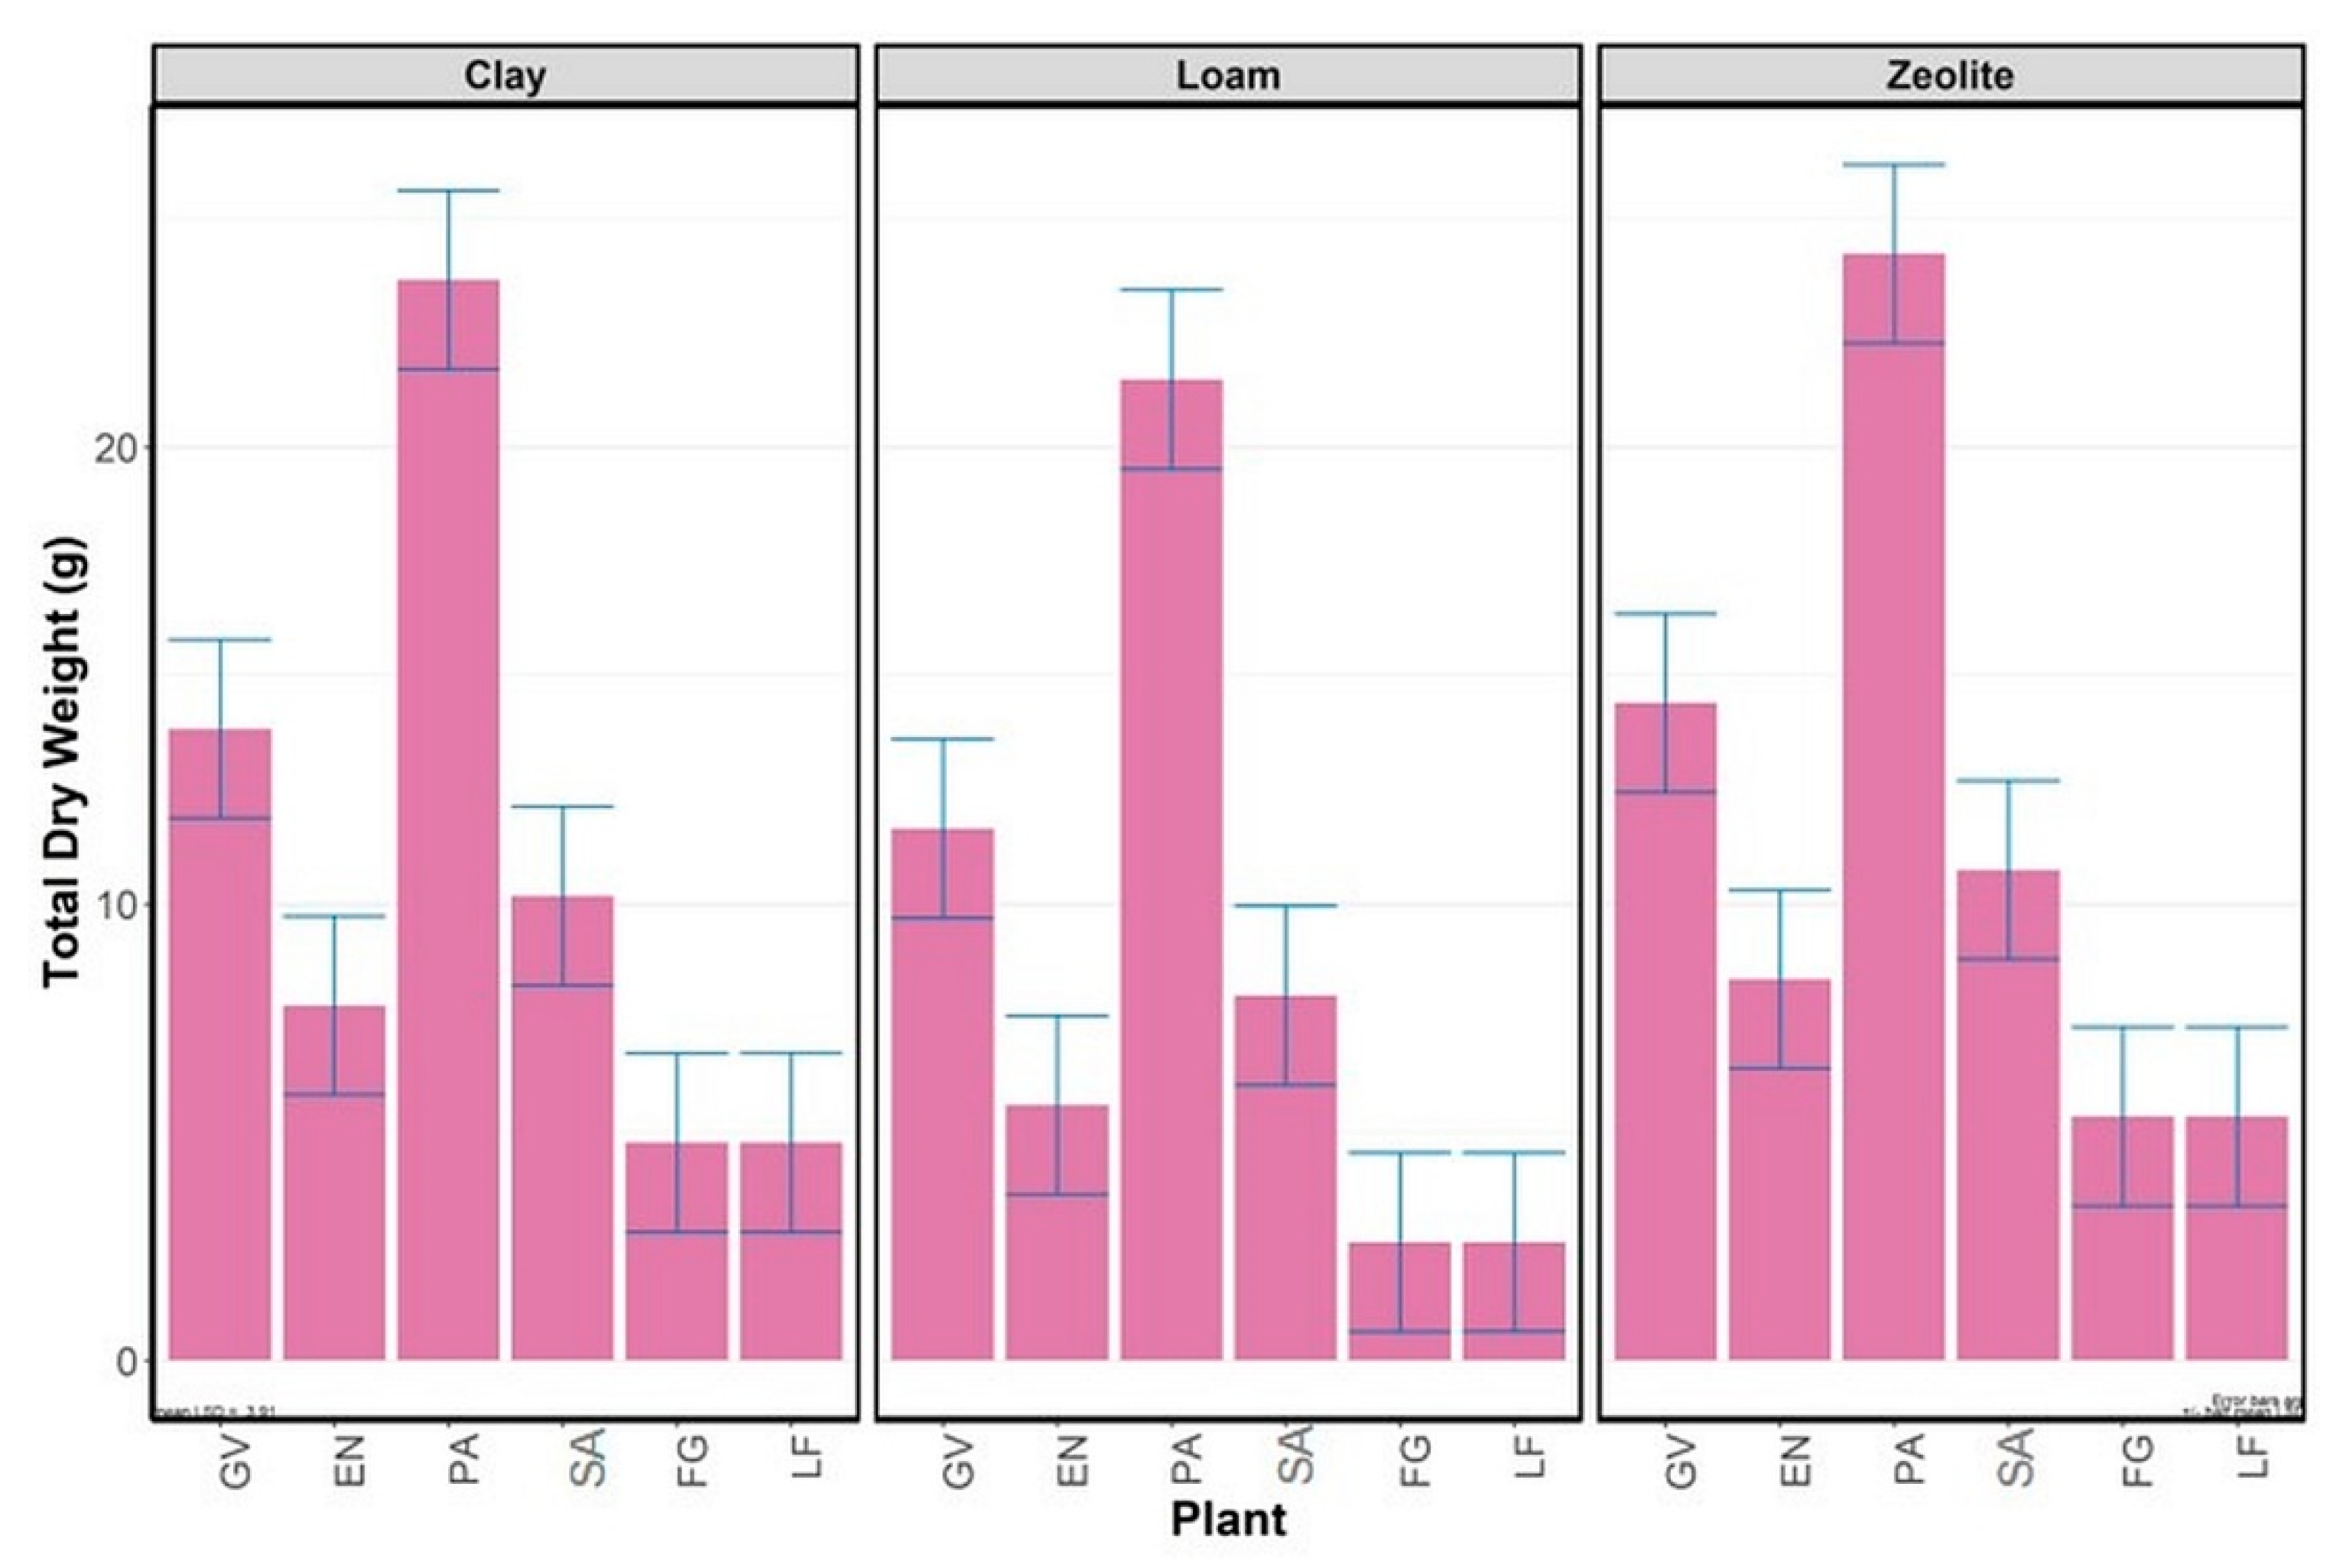
The mixed model analysis showed that the substrate had no significant impact (p > 0.05) on average plant height (Havg), but that Havg differs significantly (p = 0.026) between the different plants in combination with the two irrigation treatments. There was a carry-over effect that varied with the substrate and irrigation of the plant above (p = 0.032), but there was no significant carry-over effect associated with the plant group (p > 0.05). As average plant height was only taken as qualitative, the interpretation of the statistical analysis should be tempered by the lack of precision in the estimation technique.
The predictions, adjusted for carry-over effects, are shown in Figure 6. For both irrigations, the average plant height for GV was significantly higher (p ≤ 0.05) than those for EN, PA, and SA, all of which were significantly greater (p ≤ 0.05) than FG and LF. The two kinds of grass were not significantly different (p > 0.05) and, for the compact plants, the only significant differences were that PA was significantly taller (p ≤ 0.05) than EM and SA with I2.

3.3. Dry Weight

The mixed model analysis showed that total dry weight differed significantly (p = 0.026) between the different plants and between the three soil substrates (p = 0.045), but that their effects were independent. Irrigation had no significant impact (p > 0.05) on total dry weight, and there were no significant (p > 0.05) carry-over effects.
The pattern in the plant differences was the same for each substrate (Figure 7): (i) PA had significantly higher (p ≤ 0.05) total dry weight compared to the other plants; (ii) GV had significantly higher (p ≤ 0.05) total dry weight than the remaining four plants; (iii) EN was not significantly different (p > 0.05) from SA, FG, and LF, but SA was significantly heavier (p ≤ 0.05) than FG and LF. The differences between the plants were the same for all substrates: Zeolite produced significantly higher weights (p ≤ 0.05) than loam, while clay was intermediate and not significantly different (p > 0.05) from either.

3.4. Additional Observations

3.4.1. Issues

Among the issues in living walls and VGS applications are irrigation and maintenance [9] as observed throughout this experiment. For instance, each pot was connected to an outlet and drainage tube to capture excess outflow, and it was observed that there was sometimes pressure build-up (most likely due to an air-lock) in the narrow outlet tubes that hindered the outflow of excess water. Hence, water logging occurred in some of the pots, especially those in the middle of the living wall (columns 4, 5, and 6 in Table 1) because these had the most extended outflow tubes. Waterlogging was noted in 26 of the 144 pots, 16 of which were considered as unhealthy to dead. Once identified, measures were taken to release the pressure build-up inside the outflow pipe. Although this simple solution worked, it required regular checking of the pots to prevent long-term damage to the plants.
A further observation was that LF, a species of native South Australian grass, naturally leaves brown thatches as it continues to grow. While the plant can be healthy, it appears partly dead and may be considered to have reduced aesthetic value to a green wall. LF was also one of the most underperforming plants as indicated by its low percentage of living, and only 11 out of 24 pots remained as moderately healthy to very healthy on the living wall (Table 2).
When the living wall was harvested in August, which was towards the end of winter, new growth was observed during harvesting in seven FG pots, fourteen PA pots, and three SA pots. These were planted in loam (10 pots), zeolite (9), and clay (5). It was observed that clay was the lowest performing substrate in terms of promoting new growth.
EN is a plant with small red or yellow berries. The species used in this experiment bore huge numbers (thousands) of small red berries in the first few months since planting. As the berries shed, they could sprout in other pots that could provide enough space for them to grow. As a result, small EN were observed in 45 other pots but were mostly in pots with GV (15), LF (13), FG (9), PA (7), and SA (1). It is conceivable that over a longer timeframe, an ecological succession process might be observed with the more vigorous plants colonizing more and more of the living wall.
The open nature of the atrium with the presence of wind also exposed the living wall to foreign plant species. Weeds were sighted around the living wall and in four of the pots at harvest time. Although its presence was not widespread, the removal of individual weeds was required periodically.

3.4.2. Wall Ecology

Spider webs were a common observation on the living wall. Although the presence of spiders is a good sign as part of a thriving food-web, the presence of the webs may be considered to diminish the wall’s aesthetic value. Hence, it is suggested that maintenance schedules could include removing overtly visible spider webs from the plants while maintaining those in the pots. A magpie-lark (Grallina cyanoleuca) preying for caterpillars was observed almost daily at the living wall.
There were also several episodes of whiteflies targeting EN and SA in March 2016. As maintenance, the pesticide pyrethrum was sprayed every week for three weeks until the whiteflies were under control. Spraying of pyrethrum, however, risked killing other invertebrates that were contributing to the food-chain within the living wall. At harvest, each pot was assessed visually for biodiversity. The presence of spiders, caterpillars, and cocoons could still be found on at least 34 of the pots, although the numbers could have been affected by the pesticide.
At harvest, no microfauna was found on FG or GV. There was only one spider found in a pot that contained SA. However, 26 caterpillars (mostly white cabbage moth) were identified at harvest. Most of these were on PA (19 of 22), followed by SA (4 of 18), LF (2 of 11), and EN (1 of 20). In two further PA pots and one SA pot, previous caterpillar infestation was identified, but with no caterpillars sighted in the pot. Moreover, a caterpillar cocoon was found on the leaves of the only remaining PA plant, indicating that all PA plants were infested with caterpillars. Three other cocoons were found (one on LF and two on SA). Although most of the PA survived this experiment and with good vigor, they were susceptible to caterpillar infestation, and signs of the infestation were visible on their broad leaves. Hence, it is not recommended that this plant is used on living walls.
Caterpillars were more prevalent in pots with I1 irrigation than in I2 pots. However, plants in I2 (more frequent irrigation) recorded a larger count of microfauna than I1 (albeit by a small margin). This is consistent with the findings of Madre et al. [24], who found that the damp and cool atmosphere of living walls promoted the number of spiders and beetles present in their study. In the current study, comparatively similar counts of microfauna were observed across all soil types. However, caterpillars were mostly observed in clay (10) and zeolite (9), compared to loam (7).

4. Conclusions

This study has analyzed 36 different treatment combinations for a west-facing living wall containing native Australian plant species in a hot and dry climate of South Australia.
From the 144 living wall pots, only 110 (76.4%) were assessed as more than moderately healthy and included in the analysis. In future, it can be suggested that the unhealthy plants be replaced to maintain the aesthetic value of the living wall. GV was the most successful plant with a 100% survival rate, followed by PA (92%) and EN (83%). Except for two particular plant species, LF that was inhibited in growth by suspected dryness and PA for pest infestation, four other living wall plants selected were resilient to the weather and environment. Hence, some native plants can be potentially grown in a living wall.
The plants were healthier in clay compared to zeolite and loam and were healthier in I2 with frequent irrigation compared to I1. In the cases where a significant difference was observed, loam substrates produced the tallest plants, followed by clay and zeolite.
The two irrigation treatments selected were of similar total weekly volumes but did not affect the plant survival significantly. However, there may be more practical reasons to use shorter but more frequent irrigation [43], especially for small pots and with limited growth media.
From this experiment, the assessment of carry-over effect allows us to see that plants above impact the growth of plants below to an intermediate extent and the type of plant (above and below) influences this impact. The carry-over effect showed that grasses were not affected by plant groups above, based on their Hmax at harvest, while the spreading group of plants were the most variable in Hmax when exposed to a different group of plants. However, the spreading plants remained the tallest among all plant groups. More analysis of the carry-over design is recommended for future analysis.
Waterlogging, infestation of pests, spiders, and weeds were some common issues in this living wall. Regular maintenance should be included in a master plan to minimize the extent of damage that can be caused by structural problems, pests, or weeds.

Author Contributions

Conceptualization, R.A.B., C.B., and J.W.; formal analysis, R.A.B., C.B., and J.W.; investigation, R.A.B.; supervision, J.W. and S.B.; writing—original draft, R.A.B. and C.B.; writing—review & editing, J.W., S.B., and R.R.

Funding

This research received no external funding.

Acknowledgments

The authors would like to acknowledge University of South Australia for support towards this research. Rosmina A. Bustami acknowledges Universiti Malaysia Sarawak for the PhD scholarship award.

Conflicts of Interest

The authors declare no conflict of interest.

References

  1. Aleksandrowicz, O.; Vuckovic, M.; Kiesel, K.; Mahdavi, A. Current trends in urban heat island mitigation research: Observations based on a comprehensive research repository. Urban Clim. 2017, 21, 1–26. [Google Scholar] [CrossRef]
  2. Soltani, A.; Sharifi, E. Daily variation of urban heat island effect and its correlations to urban greenery: A case study of Adelaide. Front. Archit. Res. 2017, 6, 529–538. [Google Scholar] [CrossRef]
  3. Li, D.; Liao, W.; Rigden, A.J.; Liu, X.; Wang, D.; Malyshev, S.; Shevliakova, E. Urban heat island: Aerodynamics or imperviousness? Sci. Adv. 2019, 5, eaau4299. [Google Scholar] [CrossRef] [PubMed] [Green Version]
  4. Köhler, M. Green facades—A view back and some visions. Urban Ecosyst. 2008, 11, 423–436. [Google Scholar] [CrossRef]
  5. Safikhani, T.; Abdullah, A.M.; Ossen, D.R.; Baharvand, M. A review of energy characteristic of vertical greenery systems. Renew. Sustain. Energy Rev. 2014, 40, 450–462. [Google Scholar] [CrossRef]
  6. Medl, A.; Stangl, R.; Florineth, F. Vertical greening systems—A review on recent technologies and research advancement. Build. Environ. 2017, 125, 227–239. [Google Scholar] [CrossRef]
  7. Manso, M.; Castro-Gomes, J. Green wall systems: A review of their characteristics. Renew. Sustain. Energy Rev. 2015, 41, 863–871. [Google Scholar] [CrossRef]
  8. Othman, A.R.; Sahidin, N. Vertical Greening Façade as Passive Approach in Sustainable Design. Procedia Soc. Behav. Sci. 2016, 222, 845–854. [Google Scholar] [CrossRef]
  9. Bustami, R.A.; Belusko, M.; Ward, J.; Beecham, S. Vertical greenery systems: A systematic review of research trends. Build. Environ. 2018, 146, 226–237. [Google Scholar] [CrossRef]
  10. Pérez, G.; Rincón, L.; Vila, A.; González, J.M.; Cabeza, L.F. Green vertical systems for buildings as passive systems for energy savings. Appl. Energy 2011, 88, 4854–4859. [Google Scholar] [CrossRef]
  11. Razzaghmanesh, M.; Razzaghmanesh, M. Thermal performance investigation of a living wall in a dry climate of Australia. Build. Environ. 2017, 112, 45–62. [Google Scholar] [CrossRef]
  12. Scarpa, M.; Mazzali, U.; Peron, F. Modeling the energy performance of living walls: Validation against field measurements in temperate climate. Energy Build. 2014, 79, 155–163. [Google Scholar] [CrossRef]
  13. Koyama, T.; Yoshinaga, M.; Maeda, K.I.; Yamauchi, A. Transpiration cooling effect of climber greenwall with an air gap on indoor thermal environment. Ecol. Eng. 2015, 83, 343–353. [Google Scholar] [CrossRef]
  14. Wong, N.H.; Kwang Tan, A.Y.; Chen, Y.; Sekar, K.; Tan, P.Y.; Chan, D.; Chiang, K.; Wong, N.C. Thermal evaluation of vertical greenery systems for building walls. Build. Environ. 2010, 45, 663–672. [Google Scholar] [CrossRef]
  15. Chen, Q.; Li, B.; Liu, X. An experimental evaluation of the living wall system in hot and humid climate. Energy Build. 2013, 61, 298–307. [Google Scholar] [CrossRef]
  16. Susorova, I.; Angulo, M.; Bahrami, P.; Stephens, B. A model of vegetated exterior facades for evaluation of wall thermal performance. Build. Environ. 2013, 67, 1–13. [Google Scholar] [CrossRef]
  17. Basher, H.S.; Ahmad, S.S.; Rahman, A.M.A.; Zaman, N.Q. The use of edible vertical greenery system to improve thermal performance in tropical climate. J. Mech. Eng. 2016, 13, 57–66. [Google Scholar]
  18. de Jesus, M.P.; Lourenço, J.M.; Arce, R.M.; Macias, M. Green façades and in situ measurements of outdoor building thermal behaviour. Build. Environ. 2017, 119, 11–19. [Google Scholar] [CrossRef]
  19. Cuce, E. Thermal regulation impact of green walls: An experimental and numerical investigation. Appl. Energy 2017, 194, 247–254. [Google Scholar] [CrossRef]
  20. Coma, J.; Pérez, G.; de Gracia, A.; Burés, S.; Urrestarazu, M.; Cabeza, L.F. Vertical greenery systems for energy savings in buildings: A comparative study between green walls and green facades. Build. Environ. 2017, 111, 228–237. [Google Scholar] [CrossRef] [Green Version]
  21. Cheng, C.Y.; Cheung, K.K.S.; Chu, L.M. Thermal performance of a vegetated cladding system on facade walls. Build. Environ. 2010, 45, 1779–1787. [Google Scholar] [CrossRef]
  22. Tudiwer, D.; Korjenic, A. The effect of living wall systems on the thermal resistance of the façade. Energy Build. 2017, 135, 10–19. [Google Scholar] [CrossRef]
  23. He, Y.; Yu, H.; Ozaki, A.; Dong, N.; Zheng, S. An investigation on the thermal and energy performance of living wall system in Shanghai area. Energy Build. 2017, 140, 324–335. [Google Scholar] [CrossRef]
  24. Madre, F.; Clergeau, P.; Machon, N.; Vergnes, A. Building biodiversity: Vegetated façades as habitats for spider and beetle assemblages. Glob. Ecol. Conserv. 2015, 3, 222–233. [Google Scholar] [CrossRef]
  25. Cameron, R.W.F.; Taylor, J.E.; Emmett, M.R. What’s ‘cool’ in the world of green façades? How plant choice influences the cooling properties of green walls. Build. Environ. 2014, 73, 198–207. [Google Scholar] [CrossRef]
  26. Dunnett, N.; Kingsbury, N. Planting Green Roofs and Living Walls; Timber Press Inc.: Portland, OR, USA, 2008; ISBN 13:978-0-88192-911-9. [Google Scholar]
  27. Perini, K.; Rosasco, P. Cost–benefit analysis for green façades and living wall systems. Build. Environ. 2013, 70, 110–121. [Google Scholar] [CrossRef]
  28. Mårtensson, L.-M.; Wuolo, A.; Fransson, A.-M.; Emilsson, T. Plant performance in living wall systems in the Scandinavian climate. Ecol. Eng. 2014, 71, 610–614. [Google Scholar] [CrossRef] [Green Version]
  29. Devecchi, M.; Merlo, F.; Vigetti, A.; Larcher, F. The cultivation of mediterranean aromatic plants on green walls. Acta Hortic. 2013, 999, 243–247. [Google Scholar] [CrossRef]
  30. Taylor, J.E.; Cameron, R.W.F.; Emmett, M.R. The role of shrubs and climbers on improving thermal performance of brick walls during winter. Acta Hortic. 2014, 1108, 353–359. [Google Scholar] [CrossRef]
  31. Larcher, F.; Merlo, F.; Devecchi, M. The use of Mediterranean shrubs in green living walls. Agronomic evaluation of Myrtus communis L. Acta Hortic. 2013, 990, 495–500. [Google Scholar] [CrossRef]
  32. Mårtensson, L.-M.; Fransson, A.-M.; Emilsson, T. Exploring the use of edible and evergreen perennials in living wall systems in the Scandinavian climate. Urban For. Urban Green. 2016, 15, 84–88. [Google Scholar] [CrossRef]
  33. Nagle, L.; Echols, S.; Tamminga, K. Food production on a living wall: Pilot study. J. Green Build. 2017, 12, 23–38. [Google Scholar] [CrossRef]
  34. Cakir, A.; Yalcinalp, E.; Dogan, E.; Meral, A. Determination of the Suitability of Some American grapevine rootstocks as a new edible landscape component of vertical gardens. Sustainability 2017, 9, 1275. [Google Scholar] [CrossRef]
  35. Hasan, M.M.; Karim, A.; Brown, R.J.; Perkins, M.; Joyce, D. Estimation of Energy saving of Commercial building by living wall and green facade in Subtropical climate of Australia. In Proceedings of the 7th International Green Energy Conference & the 1st DNL Conference on Clean Energy, Dalian, China, 28–30 May 2012. [Google Scholar]
  36. Wong, N.H.; Tan, A.Y.K.; Tan, P.Y.; Sia, A.; Wong, N.C. Perception Studies of Vertical Greenery Systems in Singapore. J. Urban Plan. Dev. 2010, 136, 330–338. [Google Scholar] [CrossRef]
  37. Blanc, P.; Lalot, V. The Vertical Garden: From Nature to the City; W.W. Norton: New York, NY, USA, 2008; ISBN 9780393732597. [Google Scholar]
  38. Pérez-Urrestarazu, L.; Blasco-Romero, A.; Fernández-Cañero, R. Media and social impact valuation of a living wall: The case study of the Sagrado Corazon hospital in Seville (Spain). Urban For. Urban Green. 2017, 24, 141–148. [Google Scholar] [CrossRef]
  39. Veisten, K.; Smyrnova, Y.; Klæboe, R.; Hornikx, M.; Mosslemi, M.; Kang, J. Valuation of green walls and green roofs as soundscape measures: Including monetised amenity values together with noise-attenuation values in a cost-benefit analysis of a green wall affecting courtyards. Int. J. Environ. Res. Public Health 2012, 9, 3770–3778. [Google Scholar] [CrossRef] [PubMed]
  40. Ottelé, M.; Perini, K.; Fraaij, A.L.A.; Haas, E.M.; Raiteri, R. Comparative life cycle analysis for green façades and living wall systems. Energy Build. 2011, 43, 3419–3429. [Google Scholar] [CrossRef]
  41. Pan, L.; Chu, L.M. Energy saving potential and life cycle environmental impacts of a vertical greenery system in Hong Kong: A case study. Build. Environ. 2015, 96, 293–300. [Google Scholar] [CrossRef]
  42. Natarajan, M.; Rahimi, M.; Sen, S.; Mackenzie, N.; Imanbayev, Y. Living wall systems: Evaluating life-cycle energy, water and carbon impacts. Urban Ecosyst. 2014, 18, 1–11. [Google Scholar] [CrossRef]
  43. Pérez-Urrestarazu, L.; Egea, G.; Franco-Salas, A.; Fernández-Cañero, R. Irrigation Systems Evaluation for Living Walls. J. Irrig. Drain. Eng. 2014, 140, 04013024. [Google Scholar] [CrossRef]
  44. Kottek, M.; Grieser, J.; Beck, C.; Rudolf, B.; Rubel, F. World Map of the Köppen-Geiger climate classification updated. Meteorol. Z. 2006, 15, 259–263. [Google Scholar] [CrossRef]
  45. ASHRAE. ASHRAE Standard 169-2013 Climatic Data for Building Design Standards; American Society of Heating, Refrigerating and Air-Conditioning Engineers: Atlanta, GA, USA, 2013; ISBN 1041-2336. [Google Scholar]
  46. Bureau of Meteorology (BOM). Adelaide (Kent Town) Monthly Climate Statistics. Available online: http://www.bom.gov.au/jsp/ncc/cdio/cvg/av?p_stn_num=023090&p_prim_element_index=0&p_comp_element_index=0&redraw=null&p_display_type=full_statistics_table&normals_years=1981-2010&tablesizebutt=normal (accessed on 3 February 2016).
  47. Maxim Integrated DS1923 iButton Hygrochron Temperature/Humidity Logger with 8KB Data-Log Memory—Maxim. Available online: https://www.maximintegrated.com/en/products/ibutton/data-loggers/DS1923.html (accessed on 8 July 2019).
  48. Elmich Pte Ltd. VersiWallTM GP Tray Planter. Available online: https://elmich.com.au/wp-content/uploads/2014/11/Elmich-VersiWall-AU-28-01-16.pdf (accessed on 5 July 2016).
  49. Jørgensen, L.; Dresbøll, D.B.; Thorup-Kristensen, K. Root growth of perennials in vertical growing media for use in green walls. Sci. Hortic. 2014, 166, 31–41. [Google Scholar] [CrossRef]
  50. Weinmaster, M. Are Green Walls a “Green” as They Look? An Introduction to the Various Technologies and Ecological Benefits of Green Walls. J. Green Build. 2009, 4, 3–18. [Google Scholar] [CrossRef]
  51. Reuter, G. Improvement of sandy soils by clay-substrate application. Appl. Clay Sci. 1994, 9, 107–120. [Google Scholar] [CrossRef]
  52. Meisl, T.; Dubský, M.; Šrámek, F.; Nečas, T. The effect of clay amendment on substrate properties and growth of woody plants. Acta Univ. Agric. Silvic. Mendel. Brun. 2012, 60, 163–170. [Google Scholar] [CrossRef]
  53. Kolar, M.; Dubský, M.; Šrámek, F.; Pintar, M. The Effect of Natural Zeolite in Peat Based Growing Media on Pelargonium zonale Plants. Eur. J. Hortic. Sci. 2010, 75, 226–230. [Google Scholar]
  54. Bunt, A.C. Media and Mixes for Container-Grown Plants: A Manual on the Preparation and Use of Growing Media for Pot Plants; Springer: Dordrecht, The Netherlands, 1988; ISBN 978-94-011-7904-1. [Google Scholar]
  55. A Package for the Computer Generation of Experimental Designs 2013, CycDesigN 5.1; VSN International: Hemel Hempstead, UK, 2013.
  56. Pérez-Harguindeguy, N.; Diaz, S.; Garnier, E.; Lavorel, S.; Poorter, H.; Jaureguiberry, P.; Bret-Harte, M.S.S.; Cornwell, W.K.K.; Craine, J.M.M.; Gurvich, D.E.E.; et al. New Handbook for standardized measurment of plant functional traits worldwide. Aust. J. Bot. 2013, 61, 167–234. [Google Scholar] [CrossRef]
  57. Farrell, C.; Mitchell, R.E.; Szota, C.; Rayner, J.P.; Williams, N.S.G. Green roofs for hot and dry climates: Interacting effects of plant water use, succulence and substrate. Ecol. Eng. 2012, 49, 270–276. [Google Scholar] [CrossRef]
  58. Butler, D.G.; Cullis, B.R.; Gilmour, A.R.; Gogel, B.J. Analysis of Mixed Models for S Language Environments: ASReml-R Reference Manual; DPI Publications: Brisbane, Australia, 2009. [Google Scholar]
  59. Brien, C.J. asremlPlus: Augments the Use of ASReml-R in Fitting Mixed Models 2017. Available online: http://cran.at.r-project.org/package=asremlPlus (accessed on 28 September 2018).
  60. R Development Core Team. R: A Language and Environment for Statistical Computing 2017; R Development Core Team: St. Louis, MO, USA, 2017. [Google Scholar]
Figure 1. Size and position of the living wall.
Urbansci 03 00071 g001
Figure 2. Experimental living wall showing the arrangement of the 144 living wall pots.
Urbansci 03 00071 g002
Figure 3. Average percentage of living recorded for plants at the end of the experiment (descriptive analysis).
Urbansci 03 00071 g003
Figure 4. Predictions of H max for plants in different substrates and irrigation treatments. Error bars are approximately ±0.5 LSD (5%); if they do not overlap, the predicted means are significantly different (p ≤ 0.05), while those whose error bars overlap are not significantly different (p > 0.05).
Urbansci 03 00071 g004
Figure 5. Carry-over predictions of H max for plant groups in different substrates and irrigation treatments. Error bars are approximately ±0.5 LSD (5%); if they do not overlap, the predicted means are significantly different (p ≤ 0.05), while those whose error bars overlap are not significantly different (p > 0.05).
Urbansci 03 00071 g005
Figure 6. Predictions of H avg for plants in different irrigation treatments. Error bars are approximately ±0.5 LSD (5%); if they do not overlap, the predicted means are significantly different (p ≤ 0.05), while those whose error bars overlap are not significantly different (p > 0.05).
Urbansci 03 00071 g006
Figure 7. Predictions of dry weight for plants in different substrates. Error bars are approximately ±0.5 LSD (5%); if they do not overlap, the predicted means are significantly different (p ≤ 0.05), while those whose error bars overlap are not significantly different (p > 0.05).
Urbansci 03 00071 g007
Table 1. Living wall experiment arrangement.
Column Row123456789101112
1EN-Z-I1LF-Z-I1PA-Z-I2EN-L-I1FG-C-I2SA-C-I1PA-L-I1FG-L-I2SA-L-I2EN-L-I2GV-Z-I1SA-C-I2
2GV-C-I2GV-C-I1PA-C-I2FG-L-I1PA-L-I2PA-Z-I2LF-L-I1EN-C-I1SA-Z-I2SA-L-I2PA-Z-I1SA-C-I1
3LF-Z-I2GV-Z-I2EN-Z-I2SA-Z-I1EN-L-I1FG-L-I1FG-C-I1PA-C-I2LF-L-I2GV-L-I1SA-C-I2GV-C-I1
4FG-C-I2EN-Z-I1LF-L-I1PA-L-I2LF-C-I1GV-L-I2FG-Z-I1PA-L-I1GV-Z-I2EN-C-I1EN-L-I2FG-L-I1
5SA-C-I1PA-C-I2SA-L-I1FG-C-I1GV-L-I2EN-Z-I1EN-C-I2SA-Z-I2GV-L-I1LF-Z-I2GV-C-I2LF-Z-I1
6FG-L-I2EN-L-I1GV-Z-I1LF-C-I2EN-C-I2LF-Z-I1PA-C-I2LF-Z-I2FG-Z-I1SA-Z-I2SA-L-I1EN-L-I2
7FG-L-I1SA-C-I1LF-C-I2GV-C-I1FG-Z-I1SA-Z-I2GV-C-I2GV-L-I2FG-Z-I2EN-L-I1LF-L-I2PA-Z-I1
8EN-C-I1SA-L-I1FG-Z-I2SA-C-I2PA-Z-I1SA-L-I2GV-Z-I1LF-C-I1EN-C-I2GV-Z-I2FG-Z-I1FG-L-I2
9PA-C-I1LF-C-I2PA-L-I1PA-Z-I1SA-Z-I1PA-L-I2GV-L-I1EN-Z-I2EN-Z-I1FG-C-I2LF-L-I1GV-C-I2
10PA-Z-I2LF-L-I2EN-C-I1LF-L-I1FG-C-I1LF-Z-I2FG-L-I2PA-C-I1SA-L-I1SA-Z-I1FG-C-I2EN-C-I2
11SA-Z-I1PA-L-I2GV-L-I1EN-Z-I2FG-Z-I2PA-C-I1PA-Z-I2SA-L-I2FG-C-I1LF-C-I1LF-C-I2GV-L-I2
12EN-L-I2SA-C-I2LF-L-I2GV-Z-I2GV-Z-I1LF-C-I1EN-Z-I2GV-C-I1PA-L-I1PA-C-I1LF-Z-I1FG-Z-I2
Plant species: EN: Einadia nutans; FG: Festuca glauca; GV: Goodenia varia; LF: Lomandra filiformis; PA: Pelargonium australe; SA: Scaevola albida ‘mauve cluster’; Soil substrate: C: Clay; L: Loam; Z: Zeolite; Irrigation: I1: Irrigation 1 (4 L/h for 5 min weekly); I2: Irrigation 2 (2 L/h for 3 min every two days).
Table 2. Number of plants assessed as moderately healthy to very healthy for each treatment combination (descriptive analysis).
Plant SpeciesClayLoamZeoliteTotal
I1I2TotalI1I2TotalI1I2Total
GV44844844824
EN44823543720
PA34744843722
SA43723533618
FG14523523515
LF13422412311
Total172239161935181836110
Plant species: GV: Goodenia varia; EN: Einadia nutans; SA: Scaevola albida ‘mauve cluster’; PA: Pelargonium australe; FG: Festuca glauca; LF: Lomandra filiformis; Irrigation: I1: Irrigation 1 (4 L/h for 5 min weekly); I2: Irrigation 2 (2 L/h for 3 min every two days).

