An Analysis of the Efficiency of Local Government Expenditure and the Minimum Efficient Scale in Vietnam


School of Business Administration, Ishinomaki Senshu University, Miyagi 986-8580, Japan
Urban Sci. 2019, 3(3), 77; https://0-doi-org.brum.beds.ac.uk/10.3390/urbansci3030077
Submission received: 1 May 2019
/
Revised: 18 July 2019
/
Accepted: 19 July 2019
/
Published: 24 July 2019
(This article belongs to the Special Issue Regional Economic Development)
Abstract
:The purposes of this study were to; (i) estimate the efficiency of local government expenditure by province and city in Vietnam, (ii) test if there was a change in the efficiency of local government expenditure with the rapid development of Vietnam, and (iii) estimate the size of the population that is improving local government expenditures. By using the stochastic frontier cost function method to estimate the cost inefficiency, we found that Vietnam has been improving the efficiency of local government expenditure while achieving rapid economic growth from FY2005 to FY2009. In addition, we simulated a minimum efficient scale (MES) to determine the size of the province population that is improving local government expenditures. We found that the MES in Vietnam is 1,394,859.
1. Introduction
Many countries, not just developing countries but also developed countries, have been suffering from the adverse condition of their public finances. To mitigate the issue, they have sought to re-organize their local government system to make it more efficient.
In Vietnam, the government has introduced a market-oriented economy since the launch of the political and economic reform, Doi Moi policy, in 1986. Furthermore, Vietnam became a full member of Association of Southeast Asian Nations (ASEAN) in 1995 and has attained rapid economic growth. According to International Monetary Fund (IMF) [1], during the period from FY2005 to FY2009, the GDP growth rate in Vietnam has increased from 5.4% to 7.6%. The high growth rate is expected for years to keep. At the same time, demands for publicly provided goods and services have also increased between 15.6% and 30.7%. Local government expenditures account for about one third of total government expenditure in Vietnam. It is possible that such rapid GDP growth and increasing demands for local government may affect the efficiency of local government expenditure. It is, thus, necessary to estimate the efficiency of local government expenditure in each fiscal year and test whether there was a change in the efficiency of local government expenditure with the rapid development of Vietnam.
Since Aigner, Lovell and Schmidt (1977) [2], Meeusen and Broeck (1977) [3], and Battese and Corra (1977) [4], empirical analyses for estimating local government efficiency have received a great deal of scholarly attention. Using data envelopment analysis (DEA), Häkkinen and Joumard (2007) [5] estimated the effectiveness in the health care sector of the OECD over the period 1999 to 2002. Rayp and Sijpe (2007) [6] estimated the efficiency of the government in 52 developing countries from 1990 to 1994. Prasetyo and Zuhdi (2013) [7] investigated the efficiency of government expenditure per capita in health and education sectors and transfers and subsidies in 81 countries from 2006 to 2010. Lavado and Domingo (2015) [8] estimated the efficiency of government in developing countries in Asia from 1995 to 2010. Kaya Samut and Cafri (2016) [9] estimated the efficiency of health system in 29 OECD countries between 2000 and 2010. Using free disposal hull (FDH), Gupta and Verhoeven (2001) [10] estimated the efficiency of government expenditure on education and health in 37 countries in Africa from 1984 to 1995. Herrera and Pang (2005) [11] estimated the efficiency of education and health in 140 countries between 1996 and 2003. Using the stochastic frontier method (SFM), Wranik (2012) [12] estimated the efficiency of health care system in 21 developed OECD countries between 1970 and 2008. Grigoli and Kapsolli (2013) [13] quantified the inefficiency of public health expenditure in 80 emerging and developing economies over the period 2001 to 2010. However, these papers are cross-national comparative studies.
Regarding cross-regional study, using DEA, Worthington and Dollery (2001) [14] estimated the efficiency of the domestic waste management function in 103 New South Wales local governments in 1993. Cordero, Pedraja-Chaparro, Pisaflores and Polo (2016) [15] assessed the performance of the 278 Portuguese mainland municipalities for the 2009–2014 period. Hayashi (2017) [16] estimated the efficiency of social welfare offices in the Japanese system of local public administration. Wang and Tao (2019) [17] measured the efficiency of local government health expenditure in each region of China from 2007 to 2016. Using DEA and SFM, Broersma, Edzes and van Dijk (2013) [18] assessed the effect of the introduction of the “new work and social assistance act” in 2004 on cost efficiency and assessed the impact of municipal policy strategies on cost inefficiency during the period of 2005 to 2007. Beidas-Strom (2017) [19] estimated the efficiency of public sector service in England at the sub-regional level between 2010 and 2014. Using DEA and FDH, Borger and Kerstens (1995) [20] estimated the cost efficiency of Belgian local government. Using FDH, Balaguer-Coll, Prior and Tortosa-Ausina (2010) [21] analyzed the links between efficiency and the decentralization of power in Spanish local governments for the years 1995 and 2000. Worthington (2000) [22] applied DEA and SFM to measure the cost efficiency of Australian local governments. Using SFM, Geys (2006) [23] focused on local government efficiency ratings in Flemish municipalities. These studies focus on the efficiency of local government; however, these studies do not test whether there was a change in the efficiency of local government expenditure with the rapid development. Since the high growth rate would be expected for years to keep, it is necessary to test if there was a change in the efficiency of local government expenditure with the rapid development.
Furthermore, it is also necessary not just to estimate the efficiency but also to consider how the local government improved the efficiency of their expenditure. Regarding this issue, there are several studies on optimal population size that is improving the local government efficiency. Furukawa (2004) [24] estimated the optimal population of the city among regions in Japan from the viewpoint of minimizing per capita government expenditure. Otsuka, Goto and Sueyoshi (2014) [25] calculates the population size at Japanese prefectural level that would minimize per capita government expenditure. Zheng (2007) [26] measures optimal city sizes for Japanese metropolitan areas, using a surplus function approach. Zhang, Yang and Huo (2016) [27] analyzes the relationship between city size and urban benefits in China. These literature imply that it is significant to analyze the population size at local level from the viewpoint of the efficiency of local government expenditure. Therefore, in this study, we estimated the size of the population that is improving local government expenditures in Vietnam and compared it with the current population size to analyze whether the efficiency of local government expenditure can be improved much further.
This paper is organized as follows: Section 2 presents the model for local government expenditure by province and city. Section 3 shows the data we use, the empirical result, the simulation of efficiency for local government expenditure by province and city, and the size of the population that is improving local government expenditures. Section 4 presents the conclusions of the study.
2. Specification of Local Government Expenditure by Province and City
DEA, FDH, and SFM are known methods for estimating the efficiency or inefficiency of production or of costs. Although DEA and FDH measure inefficiency without requiring the specification of a production and/or cost function, the DEA and FDH methods are based on linear programing, and it is assumed that the economy of scale is constant. Since U-shaped cost functions showing the existence of scale economy have been observed in many countries, it is appropriate to use SFM to estimate the inefficiency of province-level government expenditure in Vietnam. We assume that each province and city uses resources as an input factor to produce publicly provided goods and/or services; then, we estimate the following function:
: Expenditure on publicly provided goods and/or services by each province and city;
: Yield of publicly provided goods and/or services by each province and city;
: A vector of economic and demographic characteristics;
: A vector of unknown parameters.
The are assumed to be independent and identically distributed .
The are assumed to be independent and identically distributed non-negative truncations of the a distribution.
However, it is difficult to observe the value of directly because only a less detailed dataset is available for Vietnam. Therefore, we also assume that is strongly related to population size. This is because the Socialist Republic of Vietnam is a planned economy. It is rational to assume that the quality of publicly provided goods and/or services per capita would be equal across provinces. However, strongly depends on scale economy and/or diseconomy. Therefore, the quantity of publicly provided goods and/or services would not be equal across provinces. Based on the above, we define as follows:
: Population size of each province or city i in year t.
When (3) is substituted in (1), we obtain
The stochastic frontier cost function (4) for the panel data on Vietnamese province expenditure is as follows:
is a dummy for each year. We also assume that the price of capital, one of the input factors, does differ between provinces because Vietnam is a socialist country.
The technical inefficiency is given by:
There are two types of estimations: Corrected ordinary least squares regression (COLS) and maximum likelihood method (ML). Coelli (1995) [28] states that ‘results indicate substantial bias in both ML and COLS when the percentage contribution of inefficiency in the composed error (denoted by γ*) is small, and also that ML should be used in preference to COLS because of large mean square error advantages when γ* is greater than 50%. This will be considered in more detail in the next section; the size γ is larger than 0.5, therefore, we employ the ML method.
3. Empirical Analysis
3.1. Data and Descriptive Statistics
The total expenditure (TE) of the province and city are from the website on Ministry of Finance in Vietnam. The province and city population sizes are from the website of the Vietnamese General Statistics Office.
We use the data on the volume of retail sales of goods and services at current prices per capita by province and city (retail) as an economic characteristic of a province and city. The variable of poverty (poverty) is the proportion of the population in poverty. ‘Urban’ is the proportion of residents living in urban areas. These data are from the website of the Vietnamese General Statistics Office. ‘City’ is a dummy variable for five major cities: Ha Noi, Da Nang, Ho Chi Minh, Can Tho, and Hai Phong. Each of these cities has almost the same rank as a province. There are six regions: Northern Central and Central Coast (NC), Mekong River Delta (MR), Northern Midlands and Mountain (NM), Red River Delta (RR), South East (SE), and Central Highlands (CH).
The data includes 57 provinces and five major cities in the period from FY2005 to FY2009. Since TE data are not sufficiently detailed, some provinces lack such data for some years or do not include such data at all. Therefore, the data we use are unbalanced panel data. The descriptive statistics of the data are shown in Table 1.
3.2. Stochastic Frontier Cost Functions
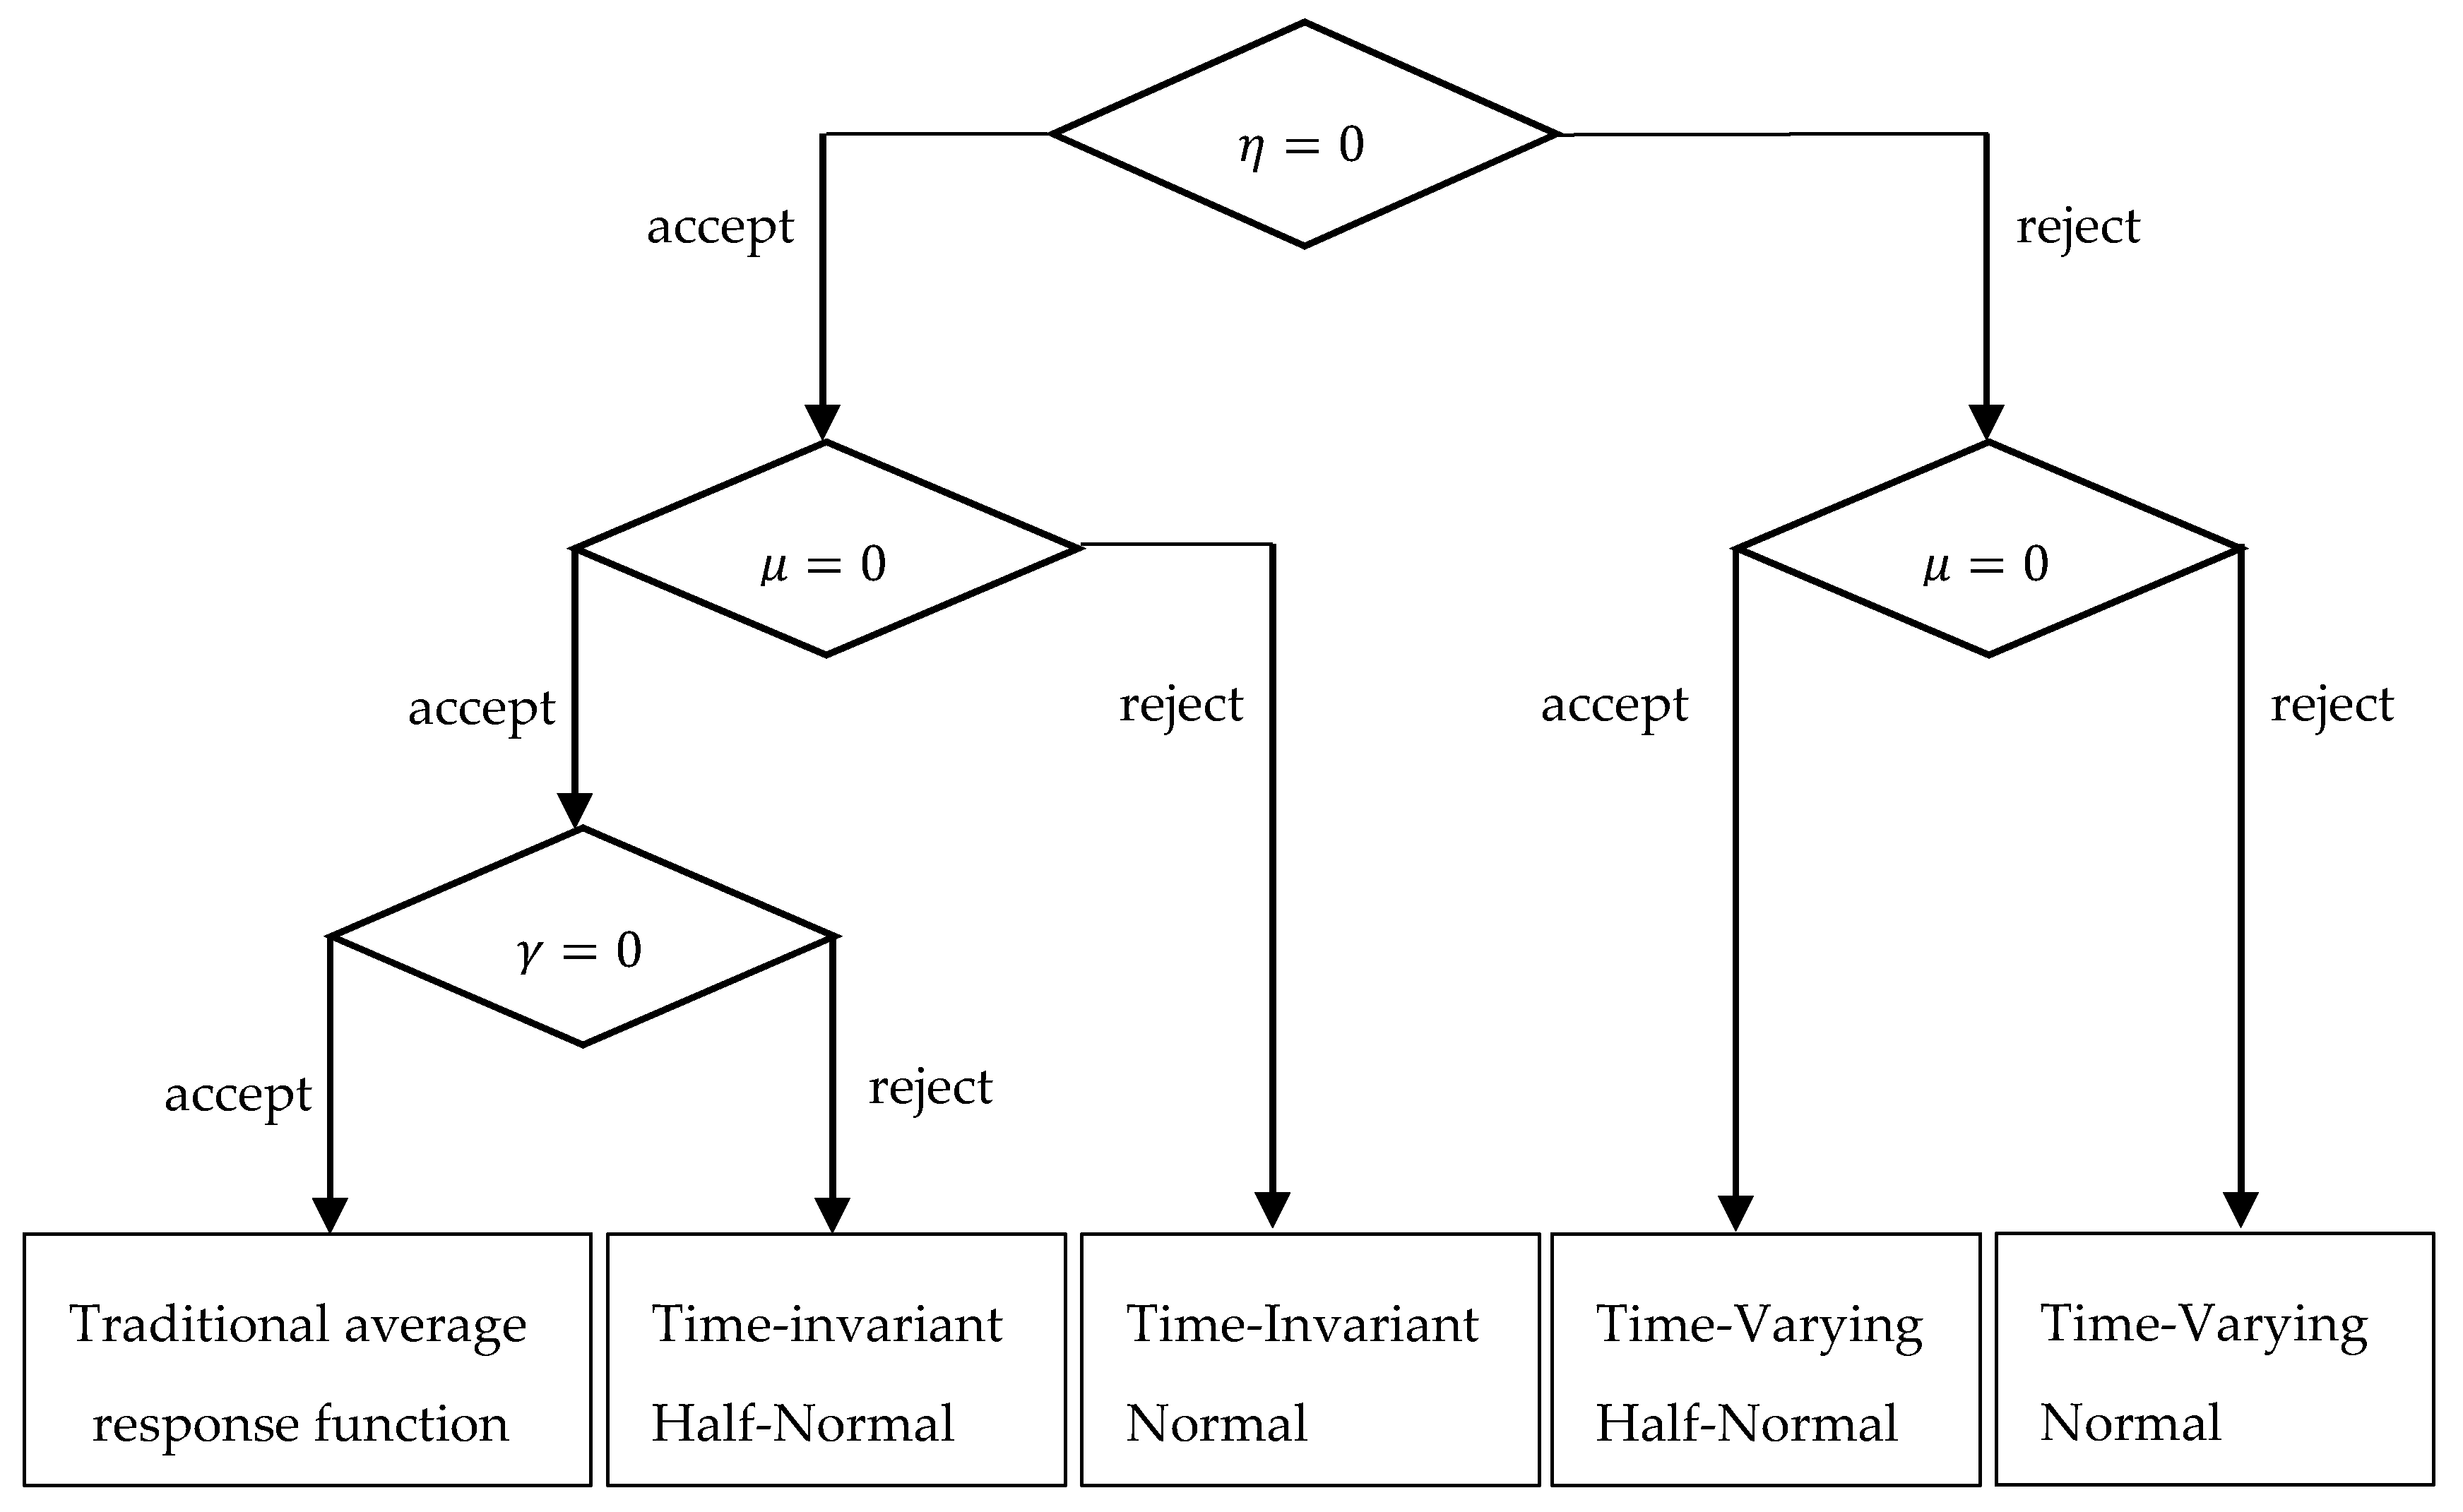
We employed a stochastic frontier cost function estimation. Following Battese and Coelli (1992) [31], we tested some hypotheses on the stochastic frontier cost function model. Figure 1 shows the flow of these tests. As shown in Table 2, the hypotheses that ‘η = 0’ ‘μ = 0’ are both rejected with statistical significance at the one percent level. Therefore, we apply a time-varying model with a normal distribution. The estimation results are presented in Table 2.
First, the variables ‘lnN’ and ‘(ln N)2’ are significant at the one percent level throughout the model. This shows that population size affects the total expenditure of a province and city. The other variables, except retail, are not significant. This implies that a local government should decide its total expenditure only based on the population size variable.
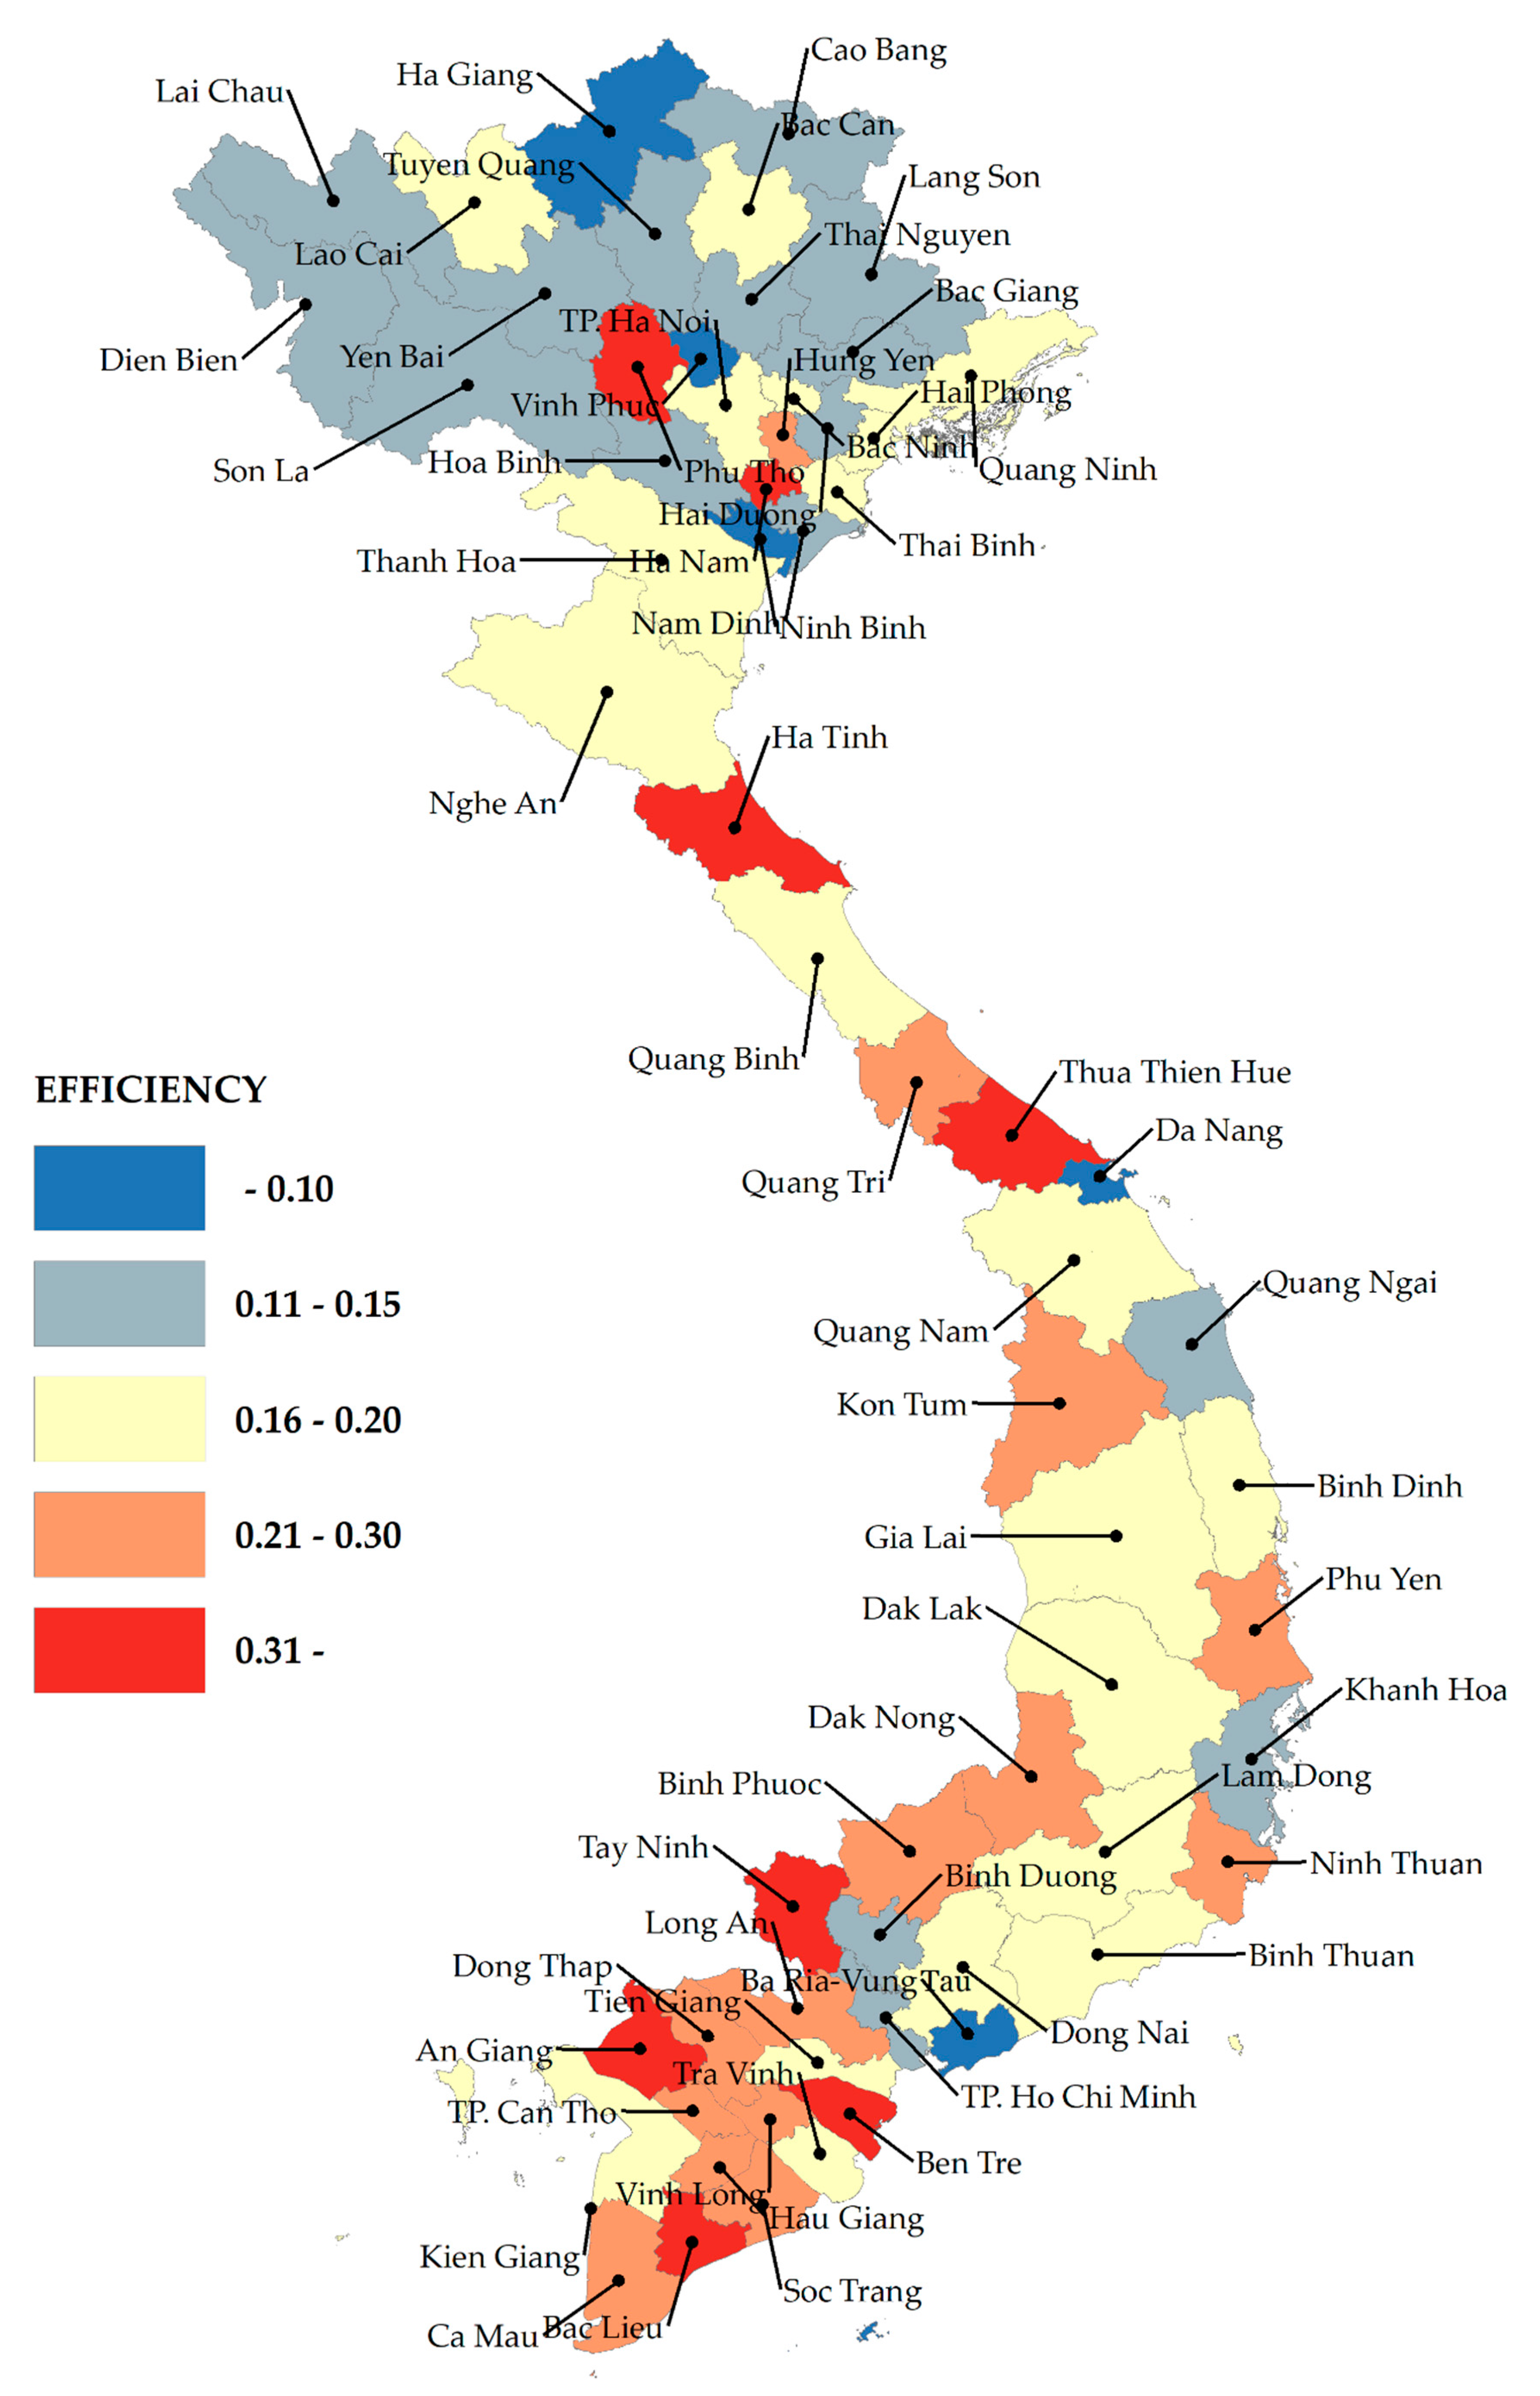
Based on this result, we simulate the inefficiency of a province and city during the period from FY2005 to FY2009. The simulation results are shown in Table 3 and Figure 2.
In the FY2005, the average inefficiency was 0.256. This shows that the total cost could have been improved by 25.6%. The most efficient province in that year was Da Nang city in the Northern Central and Central Coast region. In this province, only 14.3% of the spending by this province was wasteful. On the other hand, the least efficient province was Tay Ninh in South East. In this province, 43.0% of the spending was wasteful.
In the FY2009, the average inefficiency was 0.144. The efficiency improved by 0.112 from FY2005 to FY2009. The most efficient province in FY2009 was Da Nang city in the Northern Central and Central Coast region. In this province, 6.3% of the spending was wasteful. On the other hand, the lowest efficient province was Tay Ninh in South East. Here, 30.2% of the spending was wasteful.
To test whether there was a change in the inefficiency of local government expenditure from FY2005 to FY2009, we conducted an ANOVA test. Since the F value of the test is 16.82, the null hypothesis—that there was no change in the inefficiency of local government expenditure from FY2005 to FY2009—is rejected at the one percent statistical significance level. This indicates that the inefficiency was different in the two fiscal years.
From these facts, we come to the conclusion that, although Vietnam achieved a rapid economic growth from FY2005 to FY2009, it improved the efficiency of local government expenditure and that the efficiency of local government expenditure can be improved much further.
3.3. Minimum Efficient Scale
The total cost includes the total management cost (TMC), the cost for culture and education, and the investment cost for infrastructure, among others. The cost for culture and education and the investment cost for infrastructure refer to any area-specific costs. Therefore, we also estimated the stochastic frontier cost function of the total management cost as a non-area-specific cost. The estimation result is as follows:
Figures between brackets indicate z-values. All variables were significant at the 1% level. The TMC can also be explained by population size and retail sales. Based on this result, we simulated the inefficiency of the TMC and calculated the correlation coefficient of the inefficiency value calculated by the SFM of the TC and the TMC. We obtained a correlation coefficient of 0.6995. This indicates that increasing TMC efficiency improves TC efficiency.
This section focuses on the minimum efficient scale (MES) to make the TMC efficient. In this study, MES is defined as the population size that minimizes the average management cost (AMC), which is the TMC per capita.
To estimate the MES using panel data; we used the variables adopted in the stochastic frontier cost function model in the previous section. We conducted a Hausman test to choose between a fixed-effects model and a random-effects model. The hypothesis (H0) of the Hausman test is that random-effects is the preferred model. The result supports the use of a fixed-effects model at the statistical significance level of 1%. The estimation result is as follows:
Figures between brackets indicate t-values. All variables are significant at the 1% level. We replaced the estimated result in the following equation to obtain the MES.
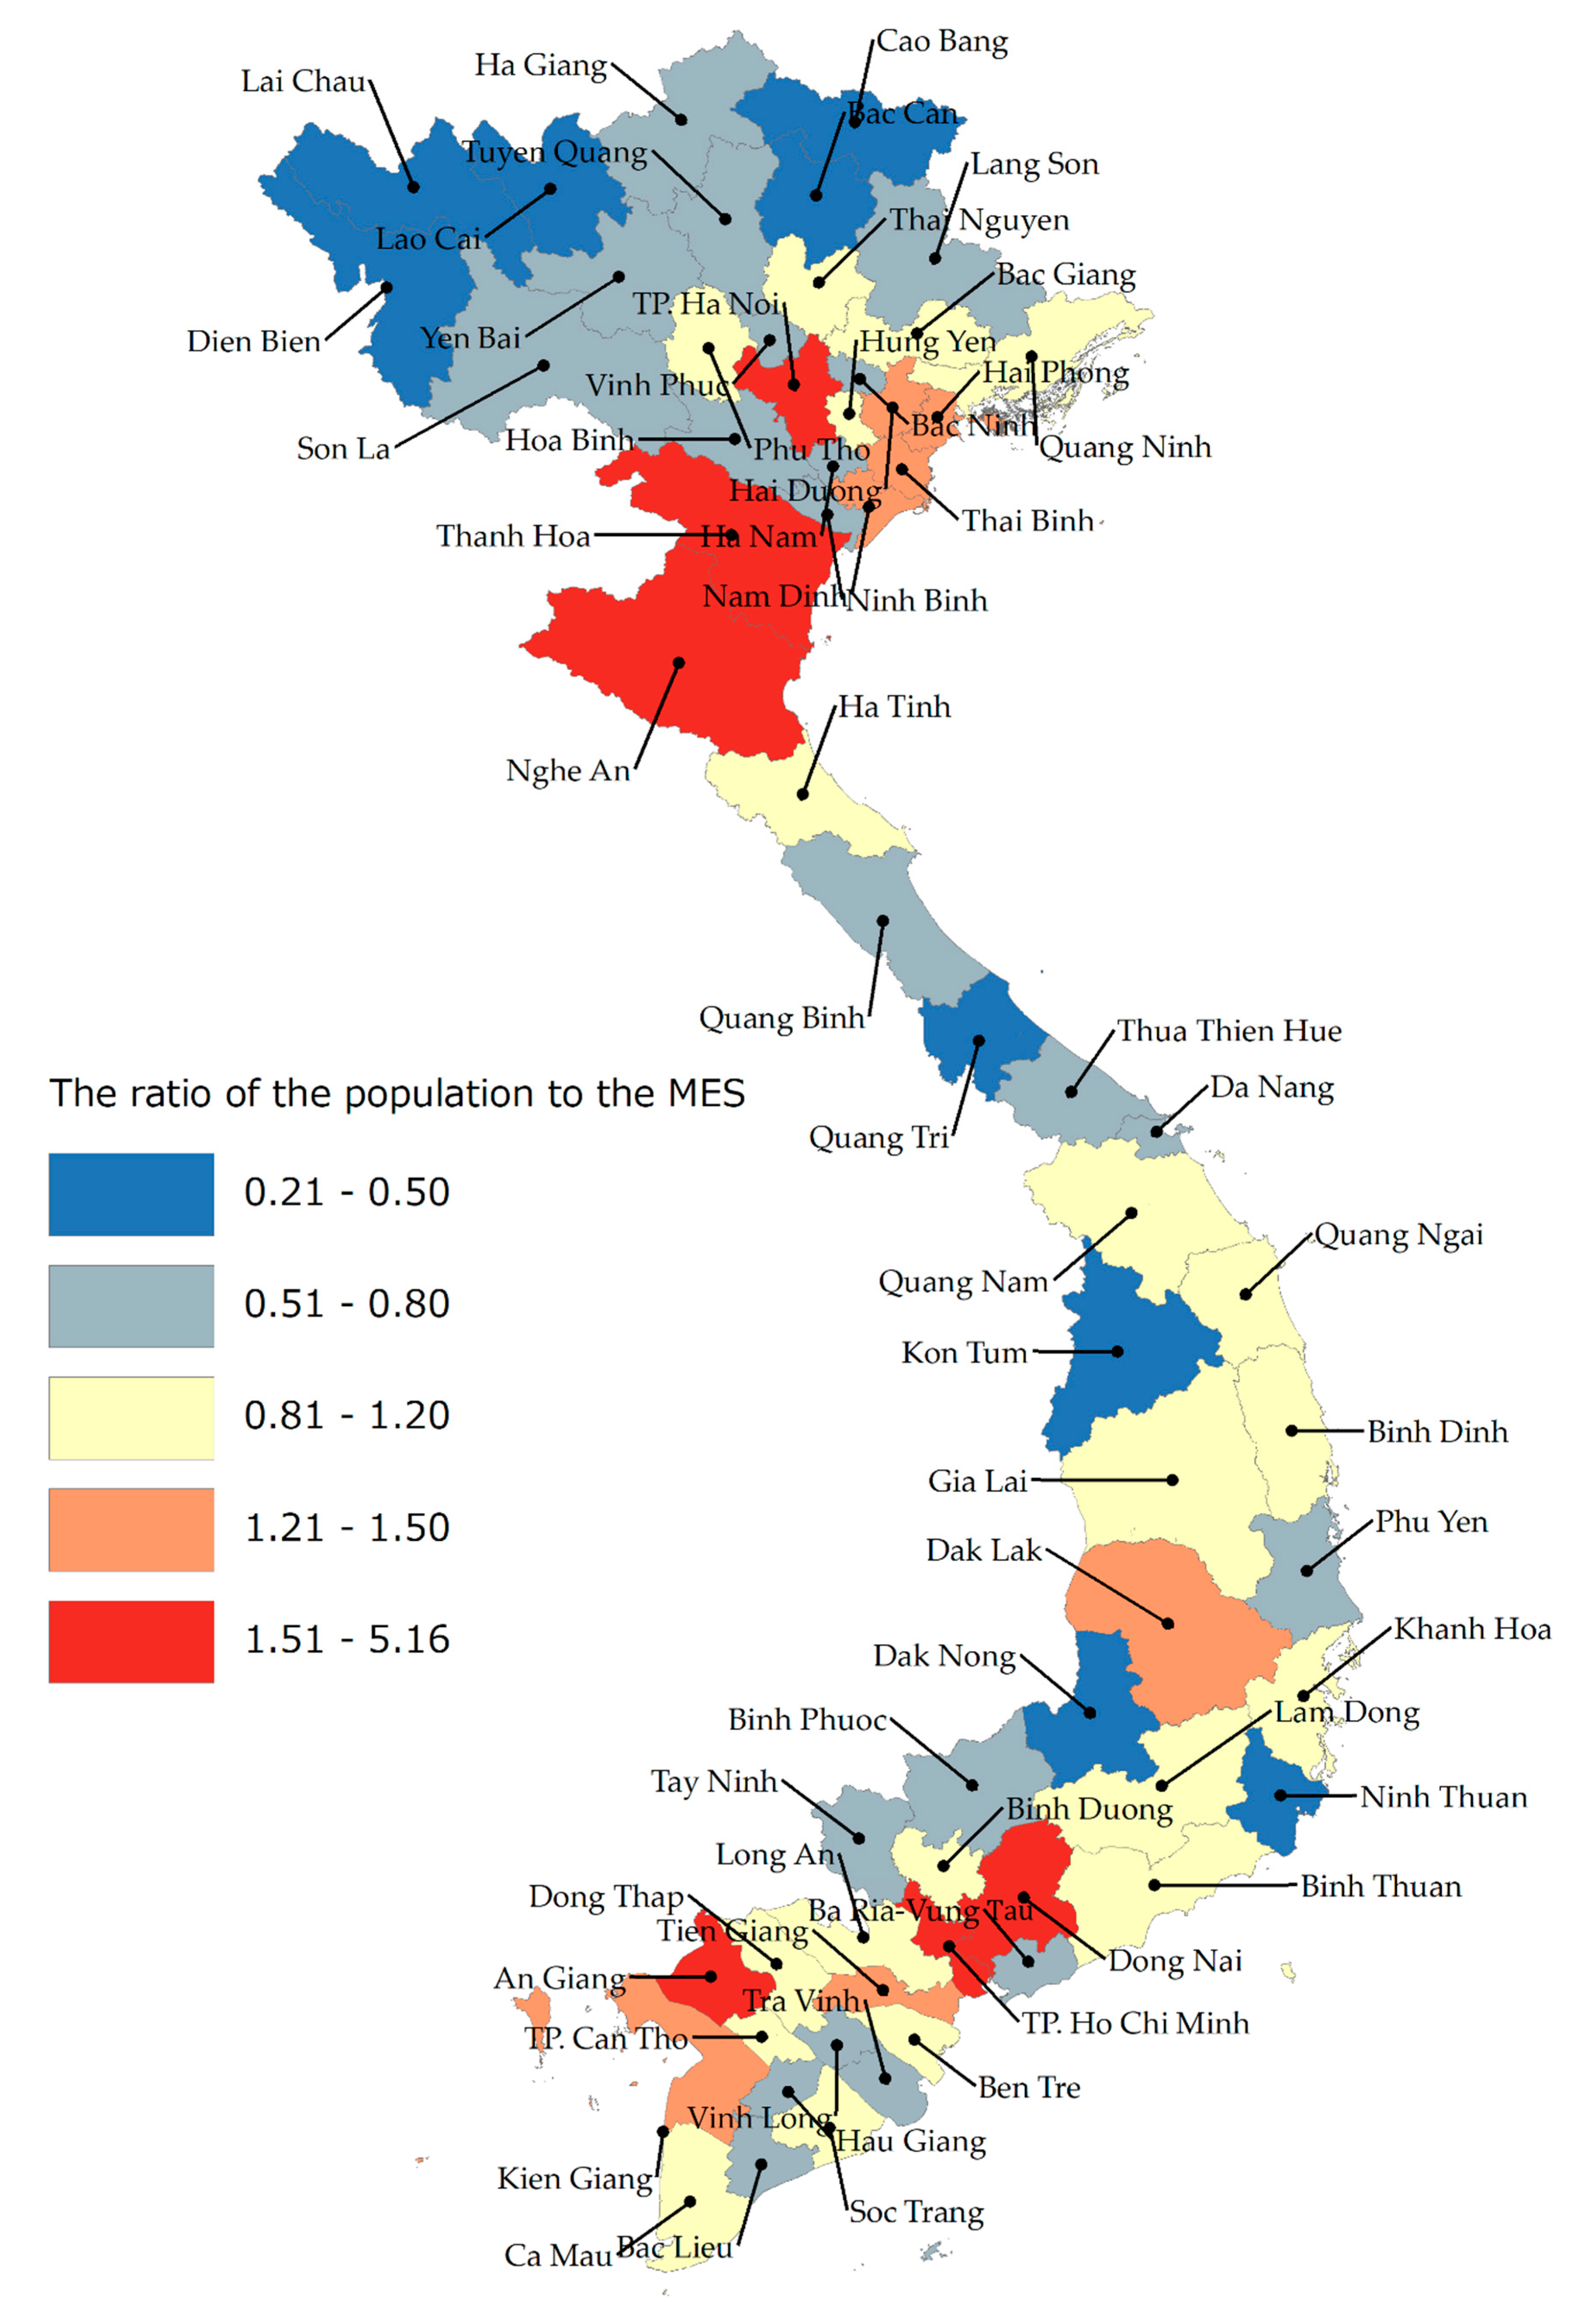
As a result, we obtained an MES of 1,394,854. The simulation results are shown in Figure 3.
In FY2009, we found that 19 provinces or cities were larger than the MES and 44 provinces or cities were smaller than the MES. Hanoi city and Ho Chi Minh city can minimize the management cost by separating into four to five regions. Furthermore, Bac Kan Province and Lai Chau Province can minimize the management cost by merging with the surrounding three to four provinces.
4. Conclusions
The purposes of this study were to; (i) estimate the efficiency of local government expenditure by province and city in Vietnam, (ii) test if there was a change in the efficiency of local government expenditure with the rapid development of Vietnam, and (iii) estimate the size of the population that would improve local government expenditures. By using SFM to estimate the cost inefficiency, we found that the average cost inefficiency in local government expenditure was 0.256 in FY2005 and 0.144 in FY2009, and the inefficiencies for each fiscal year are statistically different. These results show that Vietnam improved the efficiency of local government expenditure while achieving rapid economic growth from FY2005 to FY2009 and that the efficiency of local government expenditure can be improved much further.
The total cost includes any area-specific costs, such as costs for education and culture. Therefore, we estimated the stochastic frontier cost function of the total management cost as a non-area-specific cost. Based on this estimation, we simulated the inefficiency of the TMC and calculated the correlation coefficient of the inefficiency value calculated by the SFM of the TC and the TMC. We obtained a correlation coefficient of 0.6995, which indicates that increasing TMC efficiency improves TC efficiency. To improve the TMC efficiency, we estimated the MES using panel data. As a result, we obtained an MES of 1,394,854.
This study can be further improved by applying another stochastic frontier model, such as that by Battese and Coelli (1995) [32]. This is because the model we used cannot specify the factors affecting the inefficiency. As we mentioned above, since these issues stem from the fact that the data set is not a detailed one, we will wait for the dataset to be improved.
Funding
This research received no external funding.
Acknowledgments
I would like to thank Thanh Long Giang for useful comments on the manuscript. Naturally, any errors remain my full responsibility.
Conflicts of Interest
The author declares no conflicts of interest.
References
- International Monetary Fund. World Economic Outlook Database. Available online: https://www.imf.org/external/pubs/ft/weo/2019/01/weodata/weorept.aspx?sy=2004&ey=2011&scsm=1&ssd=1&sort=country&ds=.&br=1&pr1.x=60&pr1.y=10&c=582&s=NGDP_RPCH%2CGGX%2CGGXWDG&grp=0&a= (accessed on 17 July 2019).
- Aigner, D.J.; Lovell, C.A.K.; Schmidt, P. Formulation and Estimation of Stochastic Frontier Production Function Models. J. Econom. 1977, 6, 21–37. [Google Scholar] [CrossRef]
- Meeusen, W.; Broeck, J.V.D. Efficiency Estimation from Cobb-Douglas Production Functions with Composed Error. Int. Econ. Rev. 1977, 18, 435–444. [Google Scholar] [CrossRef]
- Battese, G.E.; Corra, G.S. Estimation of a production frontier model: With application to the pastoral zone of eastern Australia. Aust. J. Agric. Econ. 1977, 21, 169–179. [Google Scholar] [CrossRef]
- Häkkinen, U.; Joumard, I. Cross-Country Analysis of Efficiency in OECD Health Care Sectors: Options for Research. OECD Econ. Dep. Work. Pap. 2007. [Google Scholar] [CrossRef]
- Rayp, G.; Sijpe, N.V.D. Measuring and explaining government efficiency in developing countries. J. Dev. Stud. 2007, 43, 360–381. [Google Scholar] [CrossRef]
- Prasetyo, A.D.; Zuhdi, U. Government Expenditure Efficiency towards the Human Development. Procedia Econ. Financ. 2013, 5, 615–622. [Google Scholar] [CrossRef]
- Lavado, R.F.; Domingo, G.A. Public Service Spending: Efficiency and Distributional Impact- Lessons from Asia. ADB Econ. Work. Pap. Ser. 2015, 435, 1–52. [Google Scholar] [CrossRef]
- Kaya Samut, P.; Cafri, R. Analysis of the Efficiency Determinants of Health Systems in OECD Countries by DEA and Panel Tobit. Soc. Indic. Res. 2016, 129, 113–132. [Google Scholar] [CrossRef]
- Gupta, S.; Verhoeven, M. The Efficiency of Government Expenditure Experiences in Africa. J. Policy Modeling 2001, 23, 433–467. [Google Scholar] [CrossRef]
- Herrera, S.; Pang, G. Efficiency of public spending in developing countries: An efficiency frontier approach. Policy Res. Work. Pap. 2005. [Google Scholar] [CrossRef]
- Wranik, D. Healthcare policy tools as determinants of health-system efficiency: Evidence from the OECD. Health Econ. Policy Law 2012, 7, 197–226. [Google Scholar] [CrossRef] [PubMed]
- Grigoli, F.; Kapsoli, J. Waste Not, Want Not: The Efficiency of Health Expenditure in Emerging and Developing Economies. IMF Work. Pap. 2013, 13, 1–25. [Google Scholar] [CrossRef]
- Worthington, A.C.; Dollery, B.E. Measuring Efficiency in Local Government: An Analysis of New South Wales Municipalities’ Domestic Waste Management Function. Policy Stud. J. 2001, 29, 232–249. [Google Scholar] [CrossRef]
- Cordero, J.M.; Pedraja-Chaparro, F.; Pisaflores, E.C.; Polo, C. Efficiency assessment of Portuguese municipalities using a conditional nonparametric approach. J. Product. Anal. 2016, 48, 1–24. [Google Scholar] [CrossRef]
- Hayashi, M. Using DEA to analyze the efficiency of welfare offices and influencing factors: The case of Japan’s municipal public assistance programs. In Advances in DEA Theory and Applications; Tone, K., Ed.; Wiley: Hoboken, NJ, USA, 2017; pp. 300–314. [Google Scholar]
- Wang, M.; Tao, C. Research on the Efficiency of Local Government Health Expenditure in China and Its Spatial Spillover Effect. Sustainability 2019, 11, 2469. [Google Scholar] [CrossRef]
- Broersma, L.; Edzes, A.J.E.; van Dijk, J. Have Dutch municipalities become more efficient in managing the costs of social assistance dependency? J. Reg. Sci. 2013, 53, 274–291. [Google Scholar] [CrossRef]
- Beidas-Strom, S. What Has Happened to Sub-Regional Public Sector Efficiency in England since the Crisis? IMF Work. Pap. 2017, 17, 1–44. Available online: https://www.imf.org/en/Publications/WP/Issues/2017/02/14/What-has-happened-to-Sub-Regional-Public-Sector-Efficiency-in-England-since-the-Crisis-44664 (accessed on 5 July 2019). [CrossRef]
- Borger, B.; Kerstens, K. Cost efficiency of Belgian local governments: A comparative analysis of FDH, DEA, and econometric approaches. Reg. Sci. Urban Econ. 1996, 26, 145–170. [Google Scholar] [CrossRef]
- Balaguer-Coll, M.T.; Prior, D.; Tortosa-Ausina, E. Decentralization and efficiency of local government. Ann. Reg. Sci. 2010, 45, 571–601. [Google Scholar] [CrossRef]
- Worthington, A. Cost efficiency in Australian local government: A comparative analysis of mathematical programming and econometric approaches. Financ. Account. Manag. 2000, 16, 201–224. [Google Scholar] [CrossRef]
- Geys, B. Looking Across Borders: A Test of Spatial Policy Interdependence Using Local Government Efficiency Ratings. J. Urban Econ. 2006, 60, 443–462. [Google Scholar] [CrossRef]
- Furukawa, A. Optimal Population of the City among Regions. Oikonomika 2004, 40, 81–94. (In Japanese) [Google Scholar]
- Otsuka, A.; Goto, M.; Sueyoshi, S. Cost-efficiency of Japanese local governments: Effects of decentralization and regional integration. Reg. Stud. Reg. Sci. 2014, 1, 207–220. [Google Scholar] [CrossRef]
- Zheng, X.P. Measurement of Optimal City Sizes in Japan: A Surplus Function Approach. Urban Stud. 2007, 44, 939–951. [Google Scholar] [CrossRef]
- Zhang, W.; Yang, D.; Huo, J. Studies of the Relationship between City Size and Urban Benefits in China Based on a Panel Data Model. Sustainability 2016, 8, 554. [Google Scholar] [CrossRef]
- Coelli, T.J. Estimators and Hypothesis Tests for a Stochastic Frontier Function: A Monte Carlo analysis. J. Product. Anal. 1995, 6, 247–268. [Google Scholar] [CrossRef]
- General Statistics Office of Viet Nam. Available online: https://www.gso.gov.vn/ (accessed on 2 October 2018).
- Ministry of Finance of the Socialist Republic of Viet Nam. Available online: http://vst.mof.gov.vn/webcenter/portal/mof/r/m/trangchu?_afrLoop=65931115469173747#!%40%40%3F_afrLoop%3D65931115469173747%26centerWidth%3D100%26leftWidth%3D0%26rightWidth%3D0%26showFooter%3Dfalse%26showHeader%3Dfalse%26_adf.ctrl-state%3Dg93ngv90c_9 (accessed on 29 September 2018).
- Battese, G.E.; Coelli, T.J. Frontier Production Functions, Technical Efficiency and Panel Data: With Application to Paddy Farmers in India. J. Product. Anal. 1992, 3, 153–169. [Google Scholar] [CrossRef]
- Battese, G.E.; Coelli, T.J. A model for technical inefficiency effects in a stochastic frontier production function for panel data. Empir. Econ. 1995, 20, 325–332. [Google Scholar] [CrossRef] [Green Version]
Figure 1.
Test of hypotheses for stochastic frontier cost function model.

Figure 2.
Map of inefficiency in Vietnam.

Figure 3.
Map of minimum efficient scale (MES) in FY2009.


Table 1.
Descriptive statistics.
| Variable | Description | Mean | Std. Dev. | Min | Max | Source |
|---|---|---|---|---|---|---|
| ln TC | Ln of Total Cost | 14.611 | 0.603 | 13.643 | 17.746 | MOF |
| ln N | Ln of population size of province or city | 13.897 | 0.534 | 12.565 | 15.785 | GSO |
| (ln N)2 | (ln N)2 | 193.408 | 14.907 | 157.892 | 249.158 | GSO |
| ln retail | Ln of retail sales of goods and services at current prices per capita by province | 15.545 | 0.616 | 13.943 | 17.520 | GSO |
| ln km | Ln of area of each province or city in a given year (in square kilometers) | 8.216 | 0.788 | 6.713 | 9.711 | GSO |
| poverty | Proportion of population in poverty (%) | 17.496 | 11.295 | 0.300 | 58.200 | GSO |
| urban | Proportion of urban population (%) | 23.970 | 16.271 | 7.537 | 87.541 | GSO |
| city | Dummy variable for five major cities | 0.075 | 0.264 | 0 | 1 | GSO |
| NC | Dummy variable for Northern Central region | 0.213 | 0.410 | 0 | 1 | GSO |
| MR | Dummy variable for Mekong River Delta | 0.238 | 0.427 | 0 | 1 | GSO |
| RR | Dummy variable for Red River Delta | 0.206 | 0.406 | 0 | 1 | GSO |
| NM | Dummy variable for Northern Midlands and Mountain region | 0.181 | 0.386 | 0 | 1 | GSO |
| SE | Dummy variable for South East region | 0.088 | 0.283 | 0 | 1 | GSO |
Table 2.
Estimation results.
| Model 1 | Model 2 | |||||
|---|---|---|---|---|---|---|
| Variables | coef. | z | coef. | z | ||
| ln N | −5.157 | ** | −2.27 | −10.308 | *** | −4.80 |
| (ln N)2 | 0.204 | ** | 2.53 | 0.387 | *** | 5.03 |
| ln retail | 0.303 | ** | 2.56 | 0.269 | *** | 3.79 |
| ln km2 | 0.007 | 0.07 | ||||
| poverty rate | 0.006 | 0.98 | ||||
| urban rate | 0.008 | 1.60 | ||||
| city | 0.053 | 0.23 | ||||
| NC | 0.021 | 0.13 | ||||
| MR | −0.228 | −1.13 | ||||
| RR | 0.237 | 0.96 | ||||
| NM | 0.242 | 1.57 | ||||
| SE | 0.071 | 0.33 | ||||
| constant | 54.563 | *** | 3.42 | 91.100 | *** | 6.10 |
| η | −0.137 | *** | −3.11 | −0.088 | *** | −3.00 |
| μ | 0.972 | *** | 2.58 | 1.654 | *** | 2.65 |
| ln sigma2 | −2.423 | *** | −13.89 | −2.036 | *** | −12.25 |
| ilgtgamma | 1.034 | *** | 3.23 | 1.458 | *** | 5.64 |
| Log likelihood | 12.935 | −2.720 | ||||
| AIC | 8.131 | 21.439 | ||||
| Sample | 160 | 160 | ||||
Note: The asterisks *** and ** indicate statistical significance at the 1% and 5% level, respectively.
Table 3.
Degree of inefficiency in FY2005 and FY2009.
| FY2005 | |||
| Region | Province | Inefficiency | |
| Efficient | Northern Central and Central Coast | Da Nang | 0.143 |
| ↑ | Red River Delta | Vinh Phuc | 0.145 |
| ↑ | South East | Ba Ria-Vung Tau | 0.162 |
| ↑ | Red River Delta | Ha Noi | 0.163 |
| ↑ | Northern Midlands and Mountain | Son La | 0.172 |
| ↓ | Mekong River Delta | An Giang | 0.365 |
| ↓ | Red River Delta | Hung Yen | 0.366 |
| ↓ | Mekong River Delta | Ben Tre | 0.378 |
| ↓ | Mekong River Delta | Bac Lieu | 0.402 |
| Inefficient | South East | Tay Ninh | 0.430 |
| Average | 0.256 | ||
| Standard Deviation | 0.069 | ||
| FY2009 | |||
| Region | Province | Inefficiency | |
| Efficient | Northern Central and Central Coast | Da Nang | 0.063 |
| ↑ | Red River Delta | Vinh Phuc | 0.065 |
| ↑ | South East | Ba Ria-Vung Tau | 0.076 |
| ↑ | Northern Midlands and Mountain | Ha Giang | 0.084 |
| ↑ | Red River Delta | Ninh Binh | 0.096 |
| ↓ | Red River Delta | Bac Ninh | 0.194 |
| ↓ | South East | Binh Phuoc | 0.219 |
| ↓ | Mekong River Delta | Vinh Long | 0.224 |
| ↓ | Red River Delta | Hung Yen | 0.240 |
| Inefficient | South East | Tay Ninh | 0.302 |
| Average | 0.144 | ||
| Standard Deviation | 0.053 |
Note: The lower the degree of inefficiency is, the better the efficiency is.
© 2019 by the author. Licensee MDPI, Basel, Switzerland. This article is an open access article distributed under the terms and conditions of the Creative Commons Attribution (CC BY) license (http://creativecommons.org/licenses/by/4.0/).
Share and Cite
MDPI and ACS Style
Sekiguchi, S. An Analysis of the Efficiency of Local Government Expenditure and the Minimum Efficient Scale in Vietnam. Urban Sci. 2019, 3, 77. https://0-doi-org.brum.beds.ac.uk/10.3390/urbansci3030077
AMA Style
Sekiguchi S. An Analysis of the Efficiency of Local Government Expenditure and the Minimum Efficient Scale in Vietnam. Urban Science. 2019; 3(3):77. https://0-doi-org.brum.beds.ac.uk/10.3390/urbansci3030077
Chicago/Turabian StyleSekiguchi, Shunsuke. 2019. "An Analysis of the Efficiency of Local Government Expenditure and the Minimum Efficient Scale in Vietnam" Urban Science 3, no. 3: 77. https://0-doi-org.brum.beds.ac.uk/10.3390/urbansci3030077