Using Twitter to Analyze the Effect of Hurricanes on Human Mobility Patterns


Geomatics Program, Fort Lauderdale Research and Education Center, University of Florida, Fort Lauderdale, FL 33314, USA
*
Author to whom correspondence should be addressed.
Urban Sci. 2019, 3(3), 87; https://0-doi-org.brum.beds.ac.uk/10.3390/urbansci3030087
Submission received: 9 June 2019
/
Revised: 31 July 2019
/
Accepted: 1 August 2019
/
Published: 3 August 2019
Abstract
:Understanding human mobility patterns becomes essential in crisis management and response. This study analyzes the effect of two hurricanes in the United States on human mobility patterns, more specifically on trip distance (displacement), radius of gyration, and mean square displacement, using Twitter data. The study examines three geographical regions which include urbanized areas (Houston, Texas; Miami-Dade County, Florida) and both rural and urbanized areas (North and South Carolina) affected by hurricanes Matthew (2016) and Harvey (2017). Comparison of movement patterns before, during, and after each hurricane shows that displacement and activity space decreased during the events in the regions. Part of this decline can be potentially tied to observed lower tweet numbers around supply facilities during hurricanes, when many of them are closed, as well as to numerous flooded and blocked roads reported in the affected regions. Furthermore, it is shown that displacement patterns can be modeled through a truncated power-law before, during, and after the analyzed hurricanes, which demonstrates the resilience of human mobility behavior in this regard. Analysis of hashtag use in the three study areas indicates that Twitter contributors post about the events primarily during the hurricane landfall and to some extent also during hurricane preparation. This increase in hurricane-related Twitter topics and decrease in activity space provides a tie between changed travel behavior in affected areas and user perception of hurricanes in the Twitter community. Overall, this study adds to the body of knowledge that connects human mobility to natural crises at the local level. It suggests that governmental and rescue operations need to respond to and be prepared for reduced mobility of residents in affected regions during natural crisis events.
1. Introduction
Natural crises, such as earthquakes, hurricanes, and floods affect human mobility in the form of evacuation, migration, and return processes [1]. For example, in 2005, Hurricane Katrina affected around 1.7 million people who had to be evacuated in the state of Louisiana [2]. In 2016, Hurricane Matthew led to the evacuation of more than 1 million people across Cuba and 1.5 million people in Florida [3]. In 2017, the floods from Hurricane Harvey around Houston, Texas, displaced more than 30,000 people and inundated hundreds of thousands of homes [4]. Understanding human mobility in times of such events, especially in heavily populated urban areas, is important for support and rescue operations. Twitter is a prominent social networking platform with over 320 million monthly active users worldwide. It allows posting messages, so called tweets, that consist of up to 280 characters. The platform has been used to identify human mobility patterns during extreme events, such as natural disasters. A review study showed that emergency and disaster management account for 27% of the Twitter data applications [5], which comprise event detection and trajectory modeling of natural disasters including wildfires, earthquakes, floods, storms, tsunamis, and hurricanes [6,7]. As expected, the frequency of disaster related tweets is highest in the spatial proximity of a disaster [8,9].
Related work on movement analysis focuses primarily on the effects of crisis events on a larger scale and longer-term movements. One study, for example, explored evacuation patterns by leveraging user location information from tweets posted in the hours prior and concurrent to Hurricane Matthew in 2016 [10], and another study used Twitter data to estimate the percentage of evacuees during the same hurricane [11]. Tweets were also used to identify refugee migration patterns from the Middle East and Northern Africa to Europe during the initial surge of refugees aiming for Europe in 2015 [12].
Despite such analysis, the effect of natural disasters on local mobility patterns (e.g., for the population remaining in the affected regions during such an event), is less explored. Furthermore, the implications of changed mobility patterns on planning and rescue operations need to be addressed. As a step in this direction, the goal of this study is to investigate changes in human activity patterns during two major hurricanes in three study areas in the United States, based on comparing Twitter posts two weeks before and after the hurricanes. The three related objectives are to analyze the effects of the hurricanes on (a) the frequency distribution of displacement distances for Twitter users, (b) the size of the user activity area as measured by the radius of gyration and the mean squared displacement (MSD), and (c) the number of tweets posted in the vicinity of selected points of interest (POIs). A fourth objective is to examine event related changes in Twitter hashtag usage during hurricanes, which can help to tie user perception of the event to mobility patterns.
The remainder of this paper is structured as follows: Section 2 provides an overview of previous studies and reviews methods and data used for modeling travel behavior in natural disasters. Section 3 describes the study setup including study areas, data extraction, and methods. Section 4 presents the analysis results for each case study and compares them to each other. Section 5 discusses results and limitations of the chosen approach, implications for disaster management and research, and provides directions for future work.
2. Related Literature
The distance covered by an individual move within a certain time period is one of the main factors in modeling human mobility [13]. Different terms, such as jump length, flight length, displacement, or trip, are widely used to describe the distance covered between two stops. Mobility models, such as random way point (RWP) or walk models (e.g., Brownian motion (BM)) are commonly used to simulate human walk patterns [14]. Analyses of mobility patterns show that human mobility appears to be similar to what physicists have called Lévy walks. Oftentimes, power-law pause times are accompanied with Lévy walks (known as Lévy walk with trapping). Flight and pause time distributions of Lévy walks closely follow (truncated) power-law distributions [14]. However, distributions of power-law pause times are not required to identify Lévy walks. The measure of the type of diffusion of particles can also be described by the mean squared distance (MSD) from the origin after time .
Crowd-sourced spatial data, such as social media, cell phone data records, or photo-sharing services, can give insight into the perception of natural disasters and perturbations in human mobility during and after such events [15], supplementing traditional data collection methods, such as household surveys [16]. A study that used tweets to analyze the short-term perturbations on three weather events (Hurricane Sandy, Typhoon Wipha, and Typhoon Haiyan) showed that in most cases displacement data fit the power-law and hence the Lévy walk better than the lognormal distribution and exponential distribution both during and after the event [17]. Analysis of tweets posted before, during, and after fifteen destructive cases across five types of natural disasters (typhoon, winter storm, earthquake, wildfire, rainstorm) further confirmed that the power-law can describe human mobility [18]. Analysis of cell phone data in Europe showed that travel patterns of individual users may be approximated by a Lévy law model up to a distance characterized by the radius of gyration, but not for distances beyond that threshold [19].
Other studies focused on the operation of attention cycles in social media platforms under the occurrence of natural disasters. It was found that the highest volume of posted tweets around the Philippine Haiyan and Yolanda typhoons was produced days after the landfall [20,21]. Likewise, Twitter activity related to Hurricane Sandy peaked during the initial impact and subsequent hours [22]. That paper also examined the tweet volume with respect to four different disaster phases (preparedness, impact, recovery, and response) over time.
Twitter hashtags (keywords with the (#) symbol) draw attention to a particular topic or event and are actively used in data retrieval. Twitter users can create new hashtags or use existing ones. Hashtags have been widely used in tracking topical information during and after crisis situations. For example, Twitter hashtags related to the Paris attacks in November 2015 helped to model the propagation of information shared across the globe in the Twitter network [23]. Spatial and temporal characteristics of the Twitter feed were also used as a sensor network to assess the extent and impact of earthquakes, such as the 2011 earthquake in Christchurch (New Zealand) [24], or the Napa (California, USA) earthquake in 2014 [25]. The latter study used a combination of latent Dirichlet allocation (LDA) for semantic information extraction and local spatial autocorrelation for hotspot detection. Using machine-learning methods (support vector machine, supervised latent Dirichlet allocation) in combination with several public disaster-related datasets, it was shown that a classification model of Twitter content can be trained to automatically collect hashtags highly related to the event of interest [26].
Social media data, such as tweets, are noisy, often contain fabricated or inaccurate content, and vary in spatial accuracy [27,28]. They reveal user sampling bias [29] and geographical bias through its concentration on certain countries [30]. Bots, which are machine-generated tweets, such as advertisements or automated accounts impersonating humans, can affect the results of mobility and content analysis as well as event detection from tweets [31]. Bots can also alter the popularity of users, pollute content, and spread misinformation [32]. Various algorithms to detect bots in tweets were introduced in the literature [33,34,35].
Closely related to the topic of user sampling bias is the relationship between tweet density and socio-economic characteristics of local residents, which has been explored for the United States at the county level [36]. That study revealed that well-educated people in occupations of management, business, science, and arts are more likely to be involved in the generation of georeferenced tweets than others. Since only about 1–2% of tweets are geo-tagged [37], Twitter analysis results are not necessarily representative of all Twitter users, let alone of the general population. The small percentage of geo-coded tweets can also cause data scarcity, which led to the exploration of methods to geo-locate tweets from message content [38] or from the spatial relationships between Twitter users [39].
3. Data and Methods
3.1. Study Areas
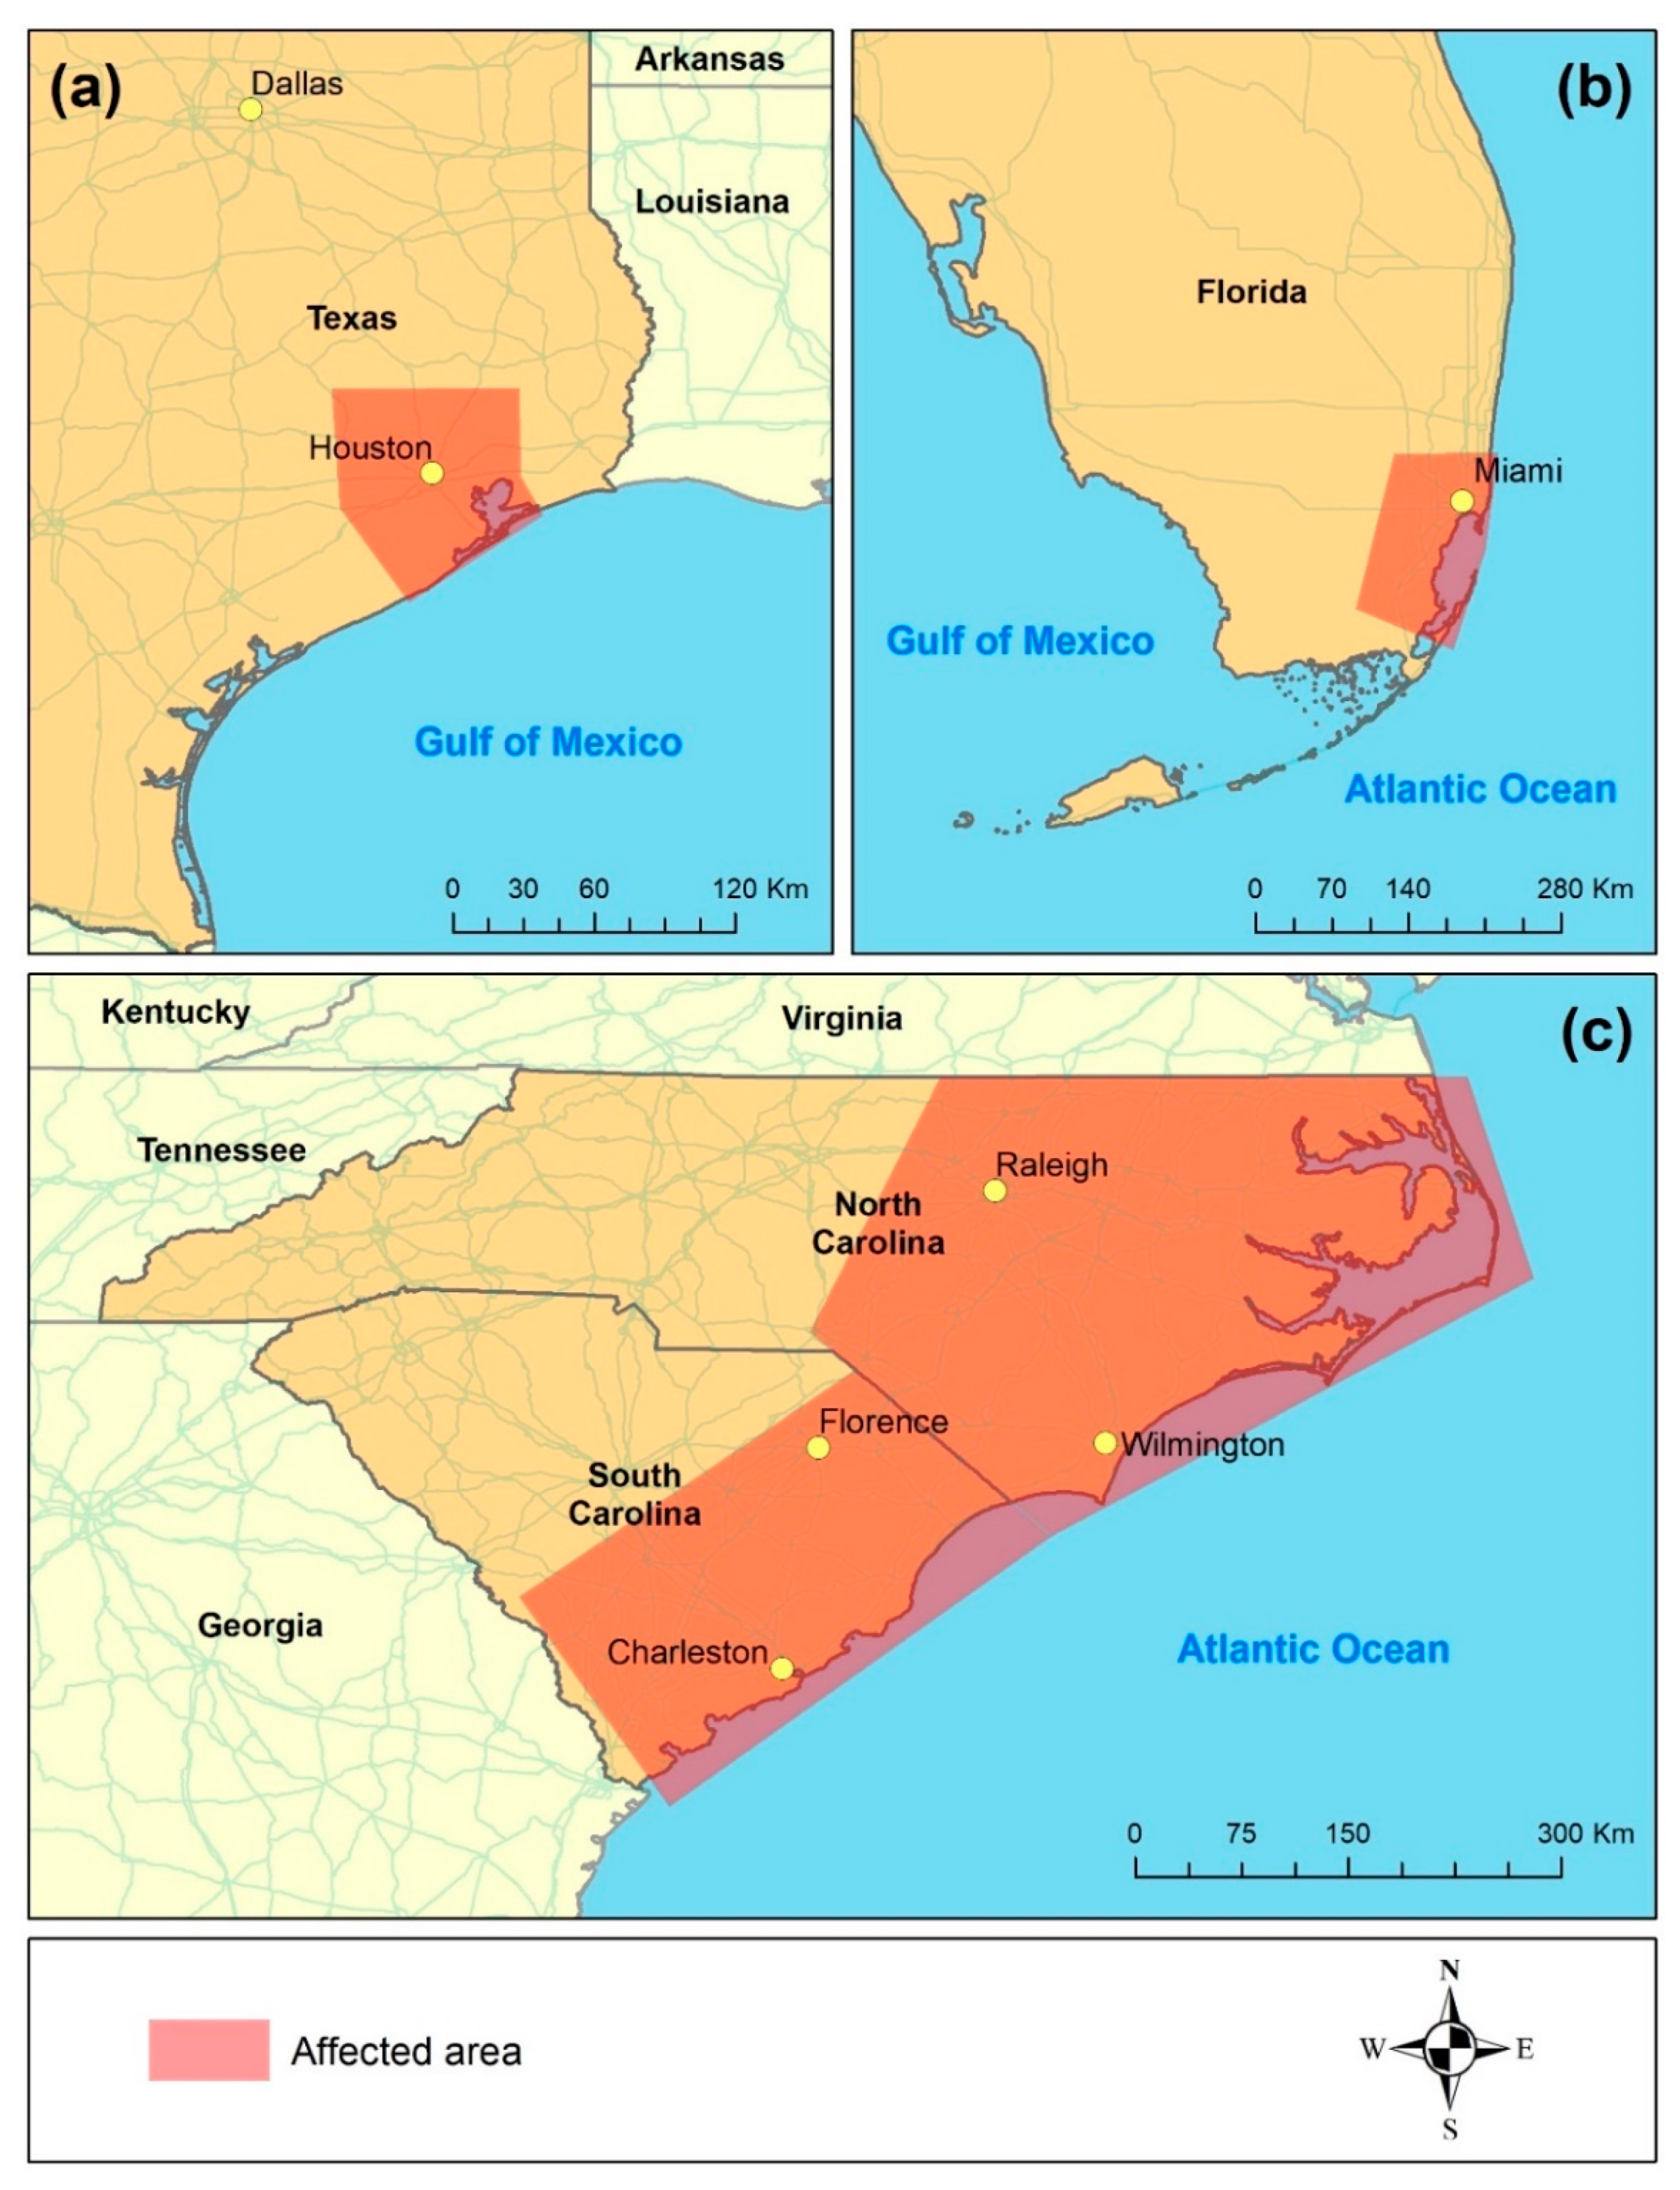
This research examines three populated areas in the United States that were affected by two major hurricane events. The areas include Houston, Texas (Figure 1a), which was hit by Hurricane Harvey in August 2017 [40], and Miami-Dade County, Florida (Figure 1b), and the eastern parts of North and South Carolina (Figure 1c), both of which were hit by Hurricane Matthew in October 2016 [41]. The extent of the three affected areas (red polygons in Figure 1) was obtained from the Flood Event Viewer (FEV) of the United States Geological Survey (USGS).
3.1.1. Hurricane Harvey
Hurricane Harvey was a category 4 hurricane that formed on 17 August 2017 and dissipated on 2 September 2017. It caused severe damage and destruction to hundreds of thousands of homes and the death of 103 people throughout Texas. The hurricane dumped a significant amount of rainfall of up to 30 in (760 mm), causing extensive flooding in many areas across Texas including the Houston metropolitan area. This hurricane is considered to be the wettest tropical cyclone in the history of the United States.
3.1.2. Hurricane Matthew
Hurricane Matthew was a category 5 hurricane that formed on 28 September 2016 and dissipated on 10 October 2016. The hurricane caused damage of 1.9 billion USD and far-reaching destruction in Haiti and the southeastern United States. Over 500 people were killed and more than 400 were injured. Many areas within Florida and North and South Carolina were exposed to major flooding for several days.
3.2. Data Collection and Preparation
The Twitter streaming Application Programming Interface (API) was used to collect geocoded tweets in the analyzed regions. More specifically, Tweepy, a Python-based client application was used [42]. Only tweets with exact coordinates were used for the analysis. Data were downloaded in JavaScript object notation (JSON) format for the Houston affected area between 1 August 2017 and 30 September 2017 and for the Miami-Dade County and North and South Carolina study areas between 1 September 2016 and 31 October 2016 and stored in a PostgreSQL database. Structured Query Language (SQL) queries were used to extract tweet metadata including user id, time created, and geometry location in addition to the profile information of users, such as username.
Tweets from automated Twitter accounts (bots) were excluded, using the Botometer (formerly known as BotOrNot) web service that evaluates Twitter accounts to distinguish between human and bot accounts [35]. This service uses a Twitter screen name to examine the activity of a Twitter account based on which a score is assigned. Higher scores indicate a higher probability of a bot account. Python was used to call the Botomoeter API for the Twitter users in the analyzed dataset.
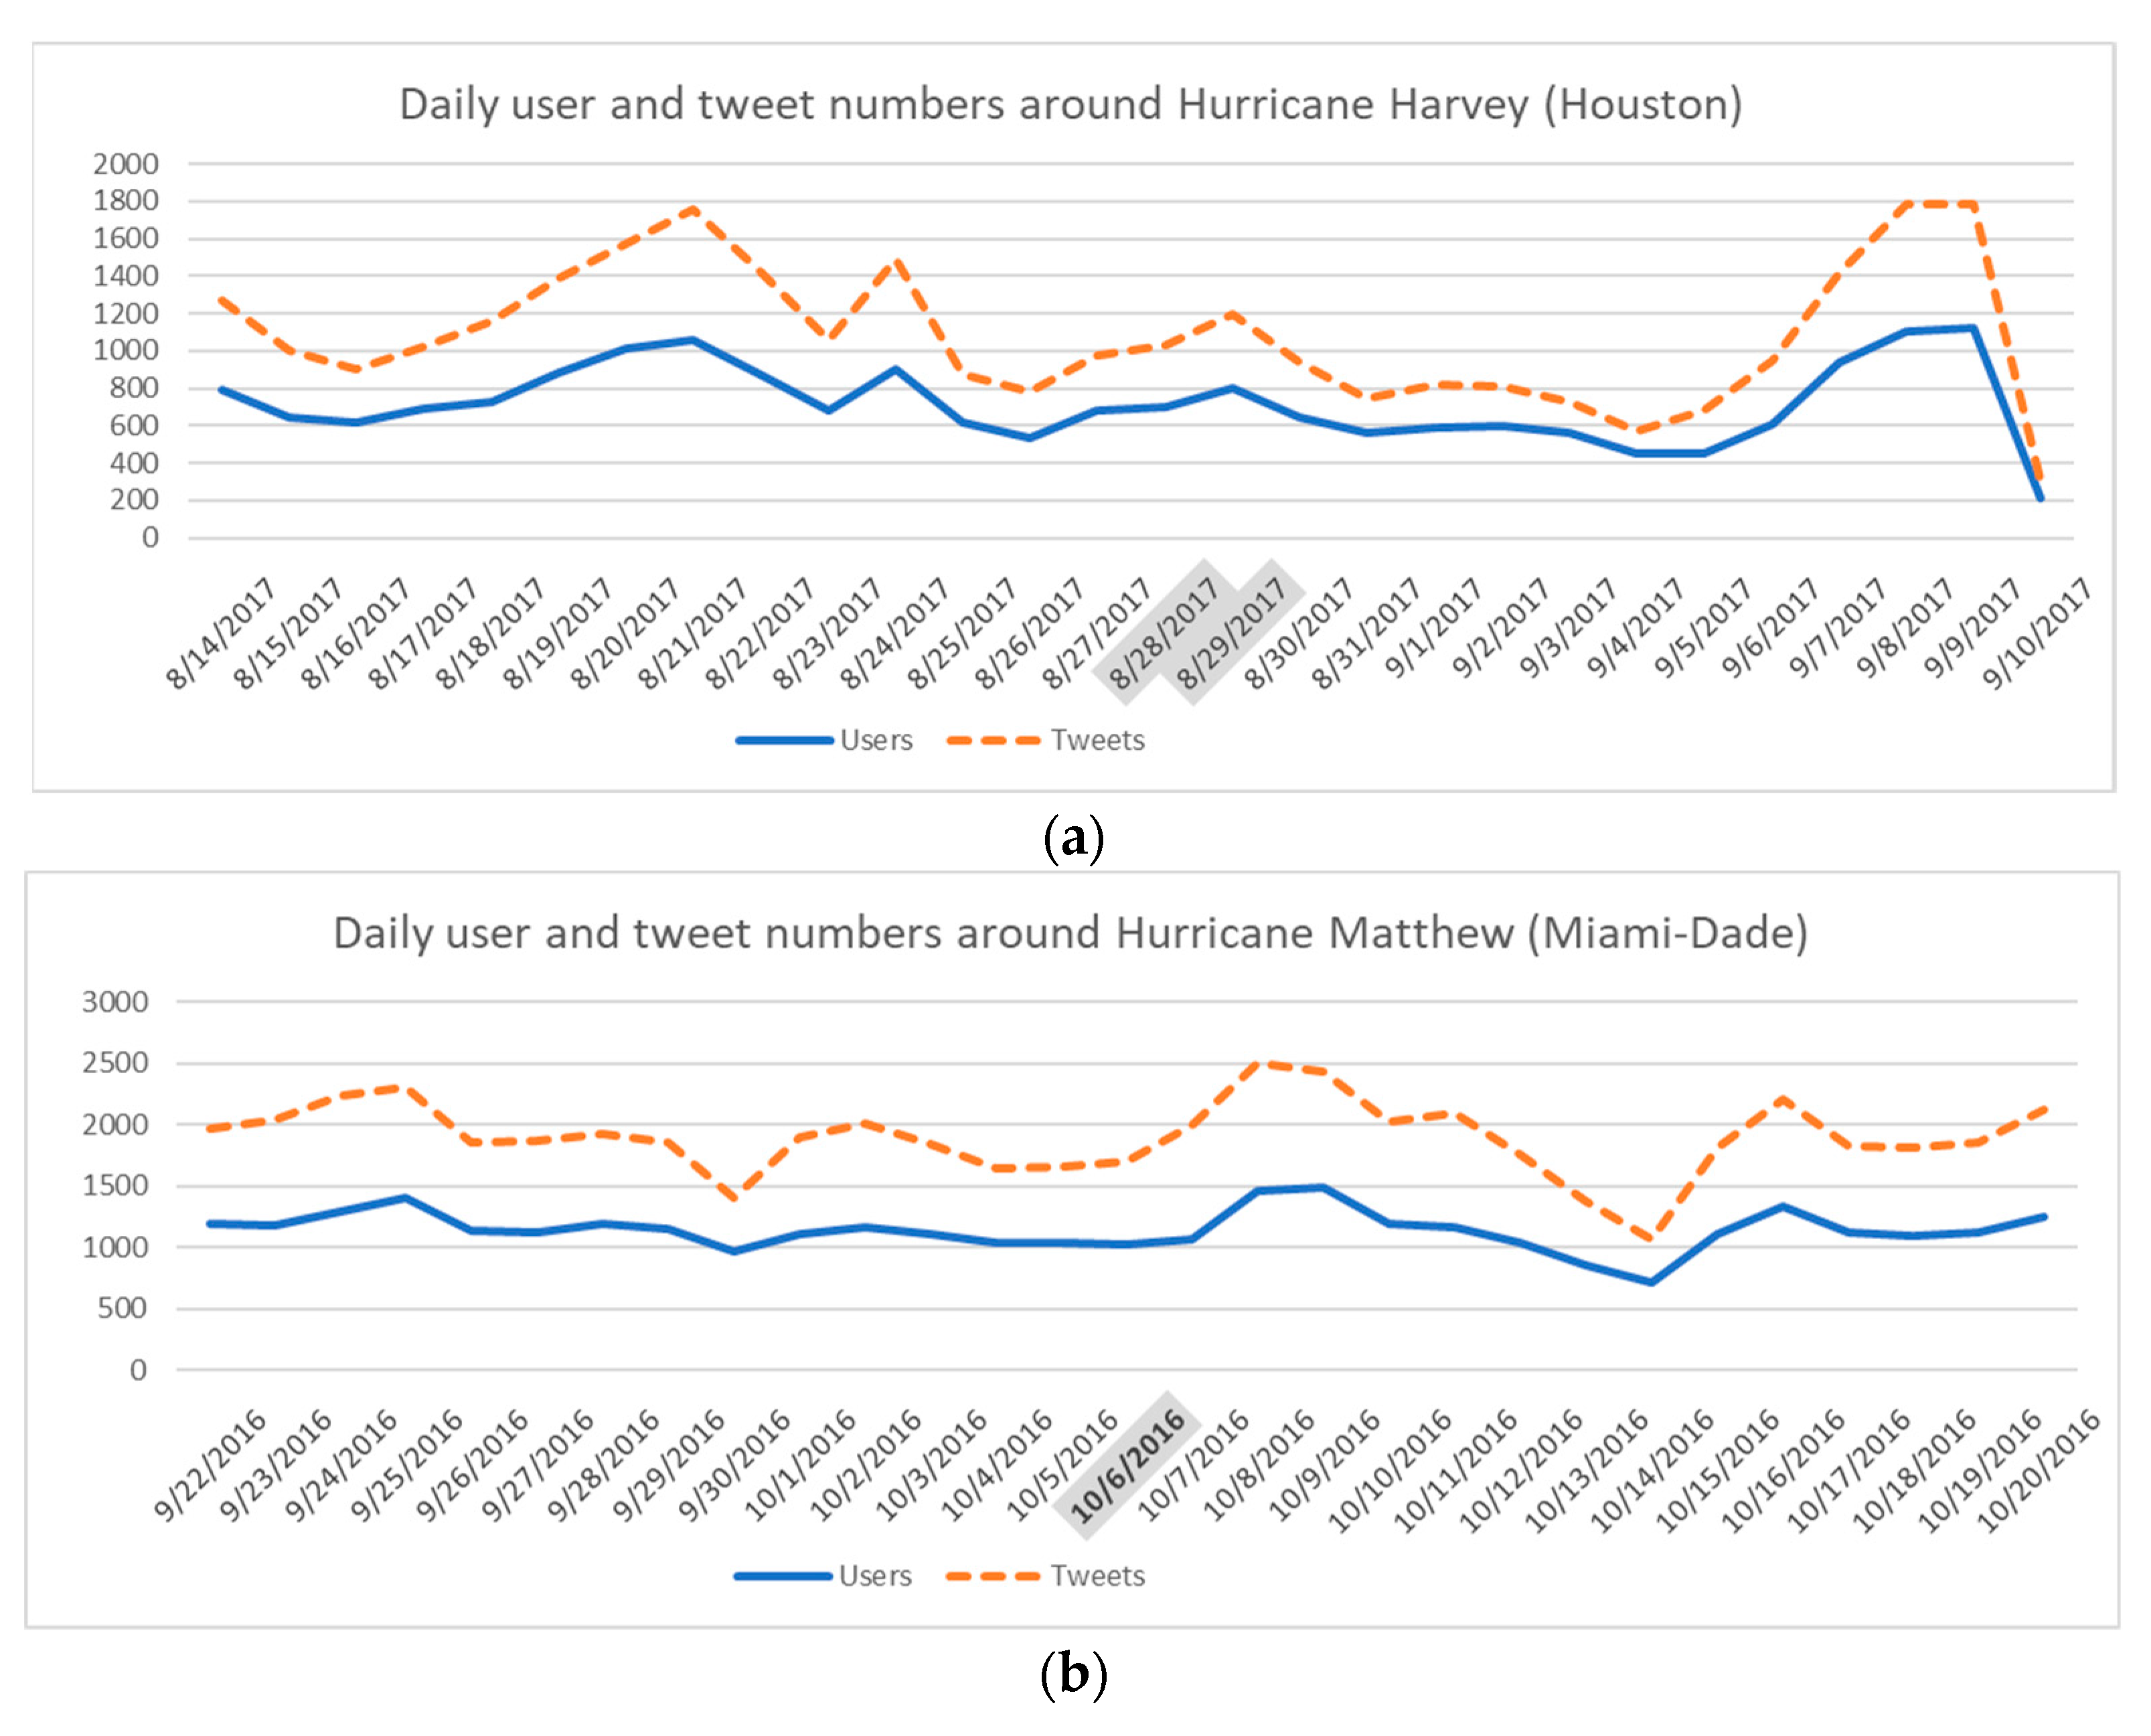
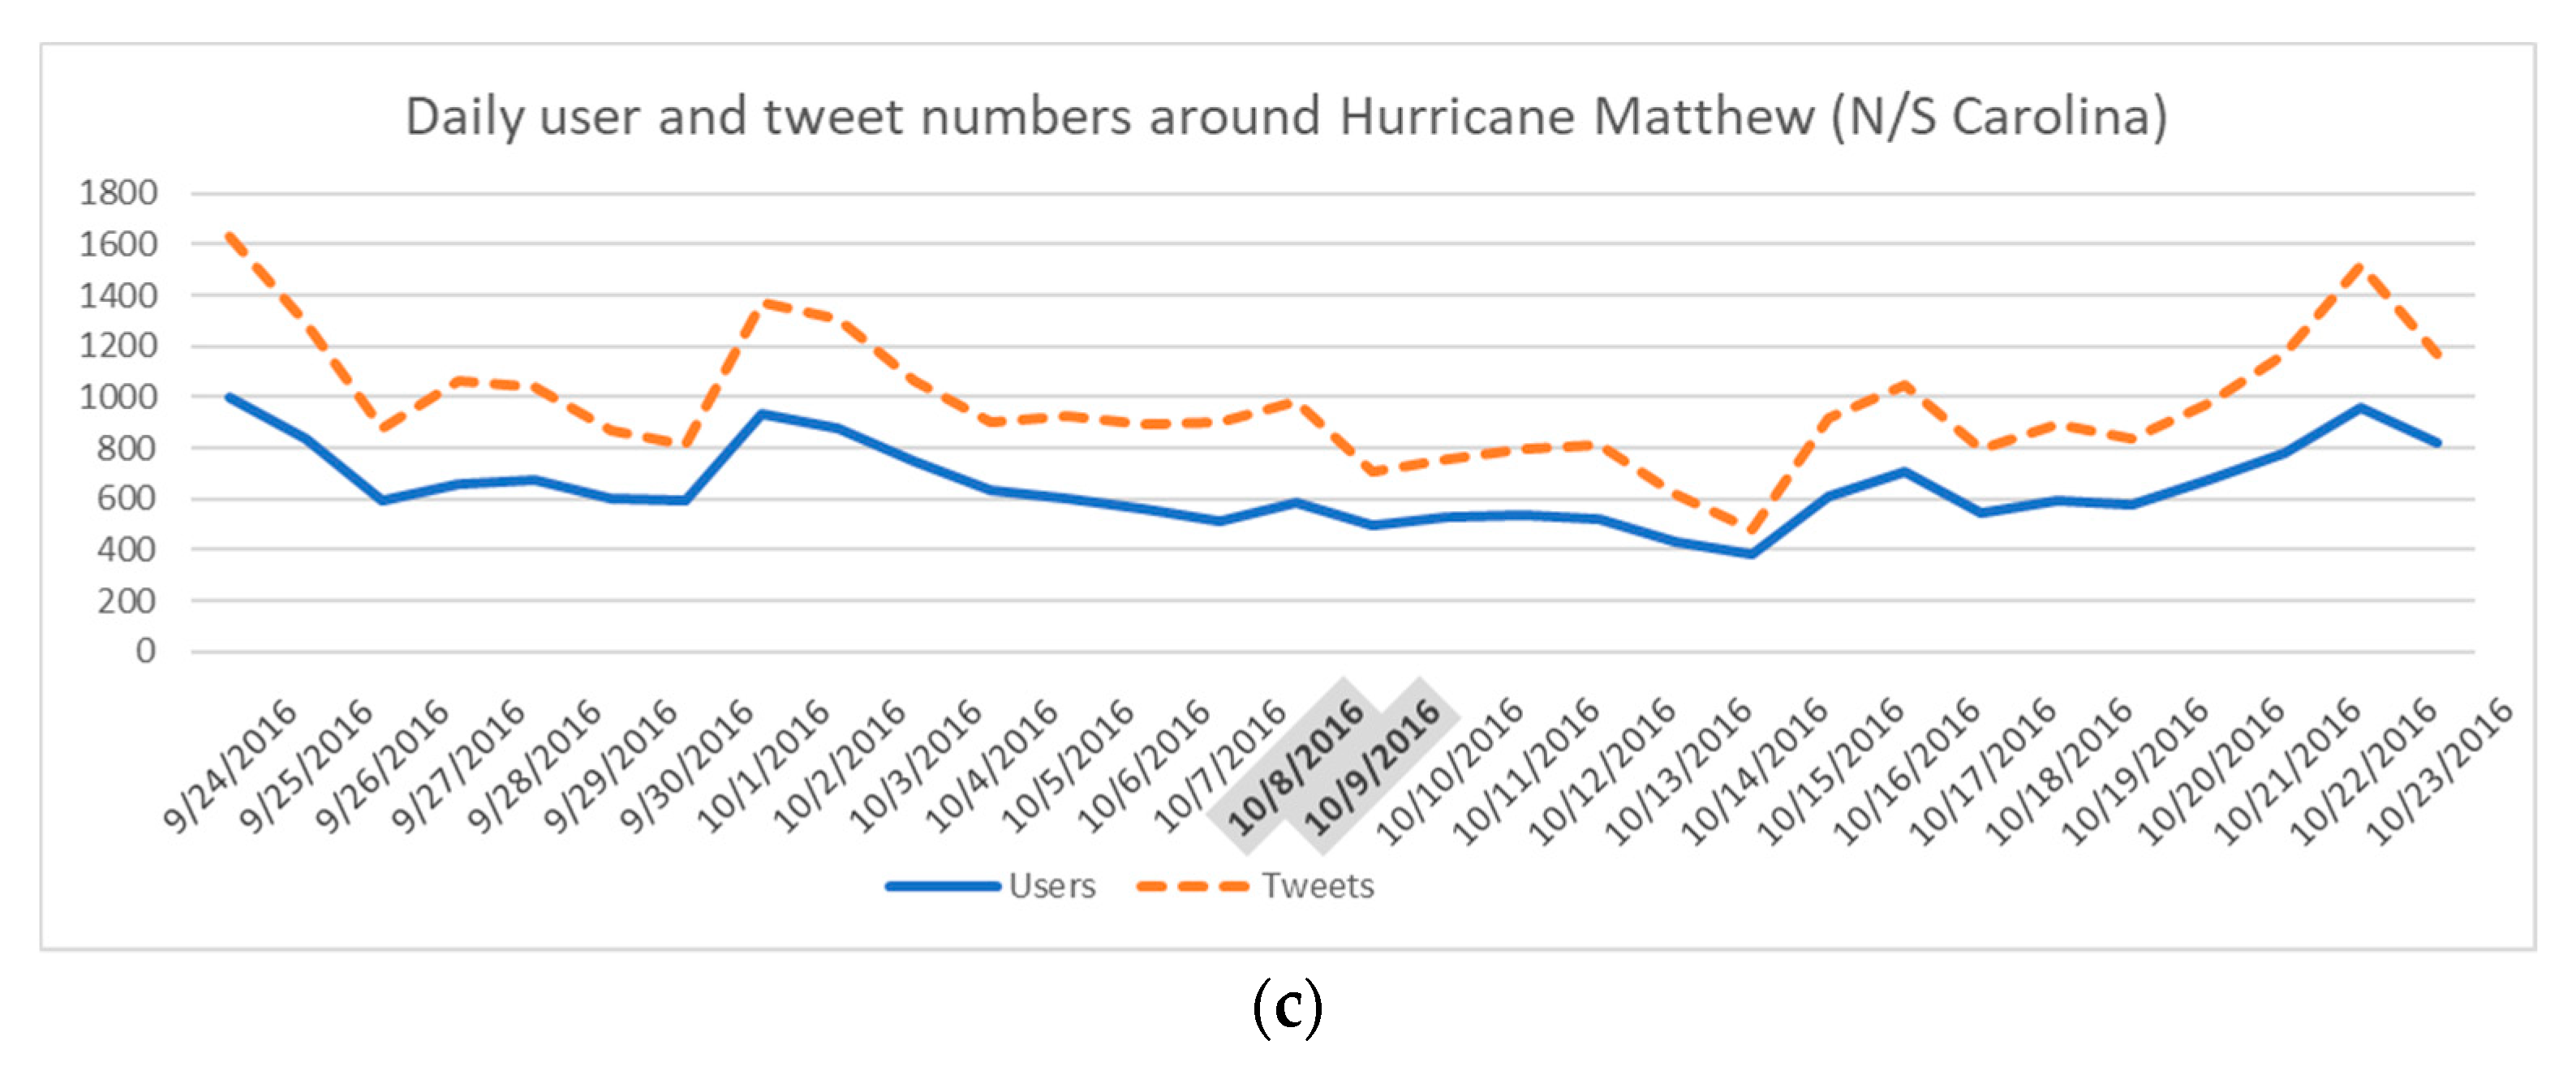
Figure 2 plots the number of remaining geo-tagged tweets with exact coordinates posted per day in the three analyzed regions for a four-week time window around the hurricane events as well as the number of Twitter users who tweeted these posts. Visual inspection shows that the hurricanes do not cause significant disturbances in the daily pattern of the user and tweet numbers in any of the three regions within the analyzed time periods.
3.3. Data Analysis
For the first part of the study data analysis included the examination of displacement distances during, two weeks before, and two weeks (for Hurricane Harvey: three weeks) after the hurricane landfalls from users who posted tweets from within the affected areas before, during, and after the events. This subset condition ensured that the same user group was considered for displacement distance comparison between the different time periods. For Hurricane Harvey (Houston area), the observation time during the event was set to two days, which included Monday, 28 August and Tuesday, 29 August 2017. The same weekdays two weeks before (14 and 15 August 2017) and three weeks after (18 and 19 September 2017) the event were chosen for comparison. The three-week gap (instead of the planned two weeks) was necessary due to a partial interruption in the Twitter download process on the scheduled two observation days two weeks after this event (11 and 12 September). For Hurricane Matthew (Miami-Dade County), Thursday, 6 October 2016, was set as the analyzed event date, and 22 September and 20 October 2016, were assigned for comparison dates before and after the hurricane, respectively. For North and South Carolina, Saturday, 8 October 2016 and Sunday, 9 October 2016, were the observed event dates, with 24 and 25 September 2016 and 22 and 23 October 2016 used for comparison before and after the hurricane, respectively.
The displacements for each user were calculated between two consecutive tweet locations in km using the Haversine formula [43]. Significance levels of differences in median distances between before, during, and after the event were then determined through the Mann–Whitney U test. Furthermore, observed displacements were grouped into six distance bands, which are [0, 5], [5, 10], [10, 25], [25, 50], [50, 100], and [100, ∞]. The number of displacements within each band was then determined before, during, and after the event. A chi-squared test of independence was subsequently performed to determine the statistical association between the distribution of distance bands and the observation period (before/during/after).
To determine the distribution of obtained displacements they were fit to a power-law model [44] and a truncated power-law model [19], where is the variable of interest (displacement), is the power-law exponent, and is the cutoff value. Also, a likelihood ratio test was performed to compare the goodness of fit between the two applied models. The R packages movr and lmtest were used for implementing the power-law distribution models and for conducting the likelihood ratio tests, respectively.
For the second part of the study, the MSD was used as a measure of the spatial extent of user displacement within the study areas. The MSD can be computed for each user as , where denotes the tweet location (origin) at the beginning of the observations, and is the subsequent tweet location of that individual at time [13]. The MSD was calculated for each user between the user’s first location and each subsequent location within the affected area t min later. The average MSD was then computed across all users in 2-h steps for the three regions before, during, and after the hurricane, resulting in a total of nine MSD curves. In addition to this, the radius of gyration was calculated for each user to determine how far the user moves around the center of the visited locations. It can be calculated as , where is the number of visited locations, i runs from 1 to n, is the location of tweet , and is the geometric center of visited locations of the user [45]. The Mann–Whitney U test was used to determine significance levels of differences in the median radius of gyration before, during, and after each event. For this part of the study tweets from the same range of observation dates as before were used. However, the requirement that a user had to post before, during, or after the hurricane in the region (through application of a user filter) was relaxed (i.e., the user filter was not applied) to increase the sample size of users and tweets for the computation of the radius of gyration and MSD (Table 1).
In addition to analyzing changes in displacement and activity space, the change in the number of tweets posted around supply stores (food stores, home improvement retails, gas stations) during the hurricanes was compared to the change in the number of all tweets posted in a region during a hurricane, followed by chi-squared tests of independence. This analysis was conducted to explore the effect of hurricanes on localities from which tweets are posted. Furthermore, Twitter hashtag use was counted in the affected areas to identify the change in the Twitter topic focus before, during, and after a hurricane event. This gives insight into the effect of the hurricanes on the perception of the Twitter community, and can, therefore, potentially tie changed mobility behavior to the events.
4. Results
4.1. Trip Distances
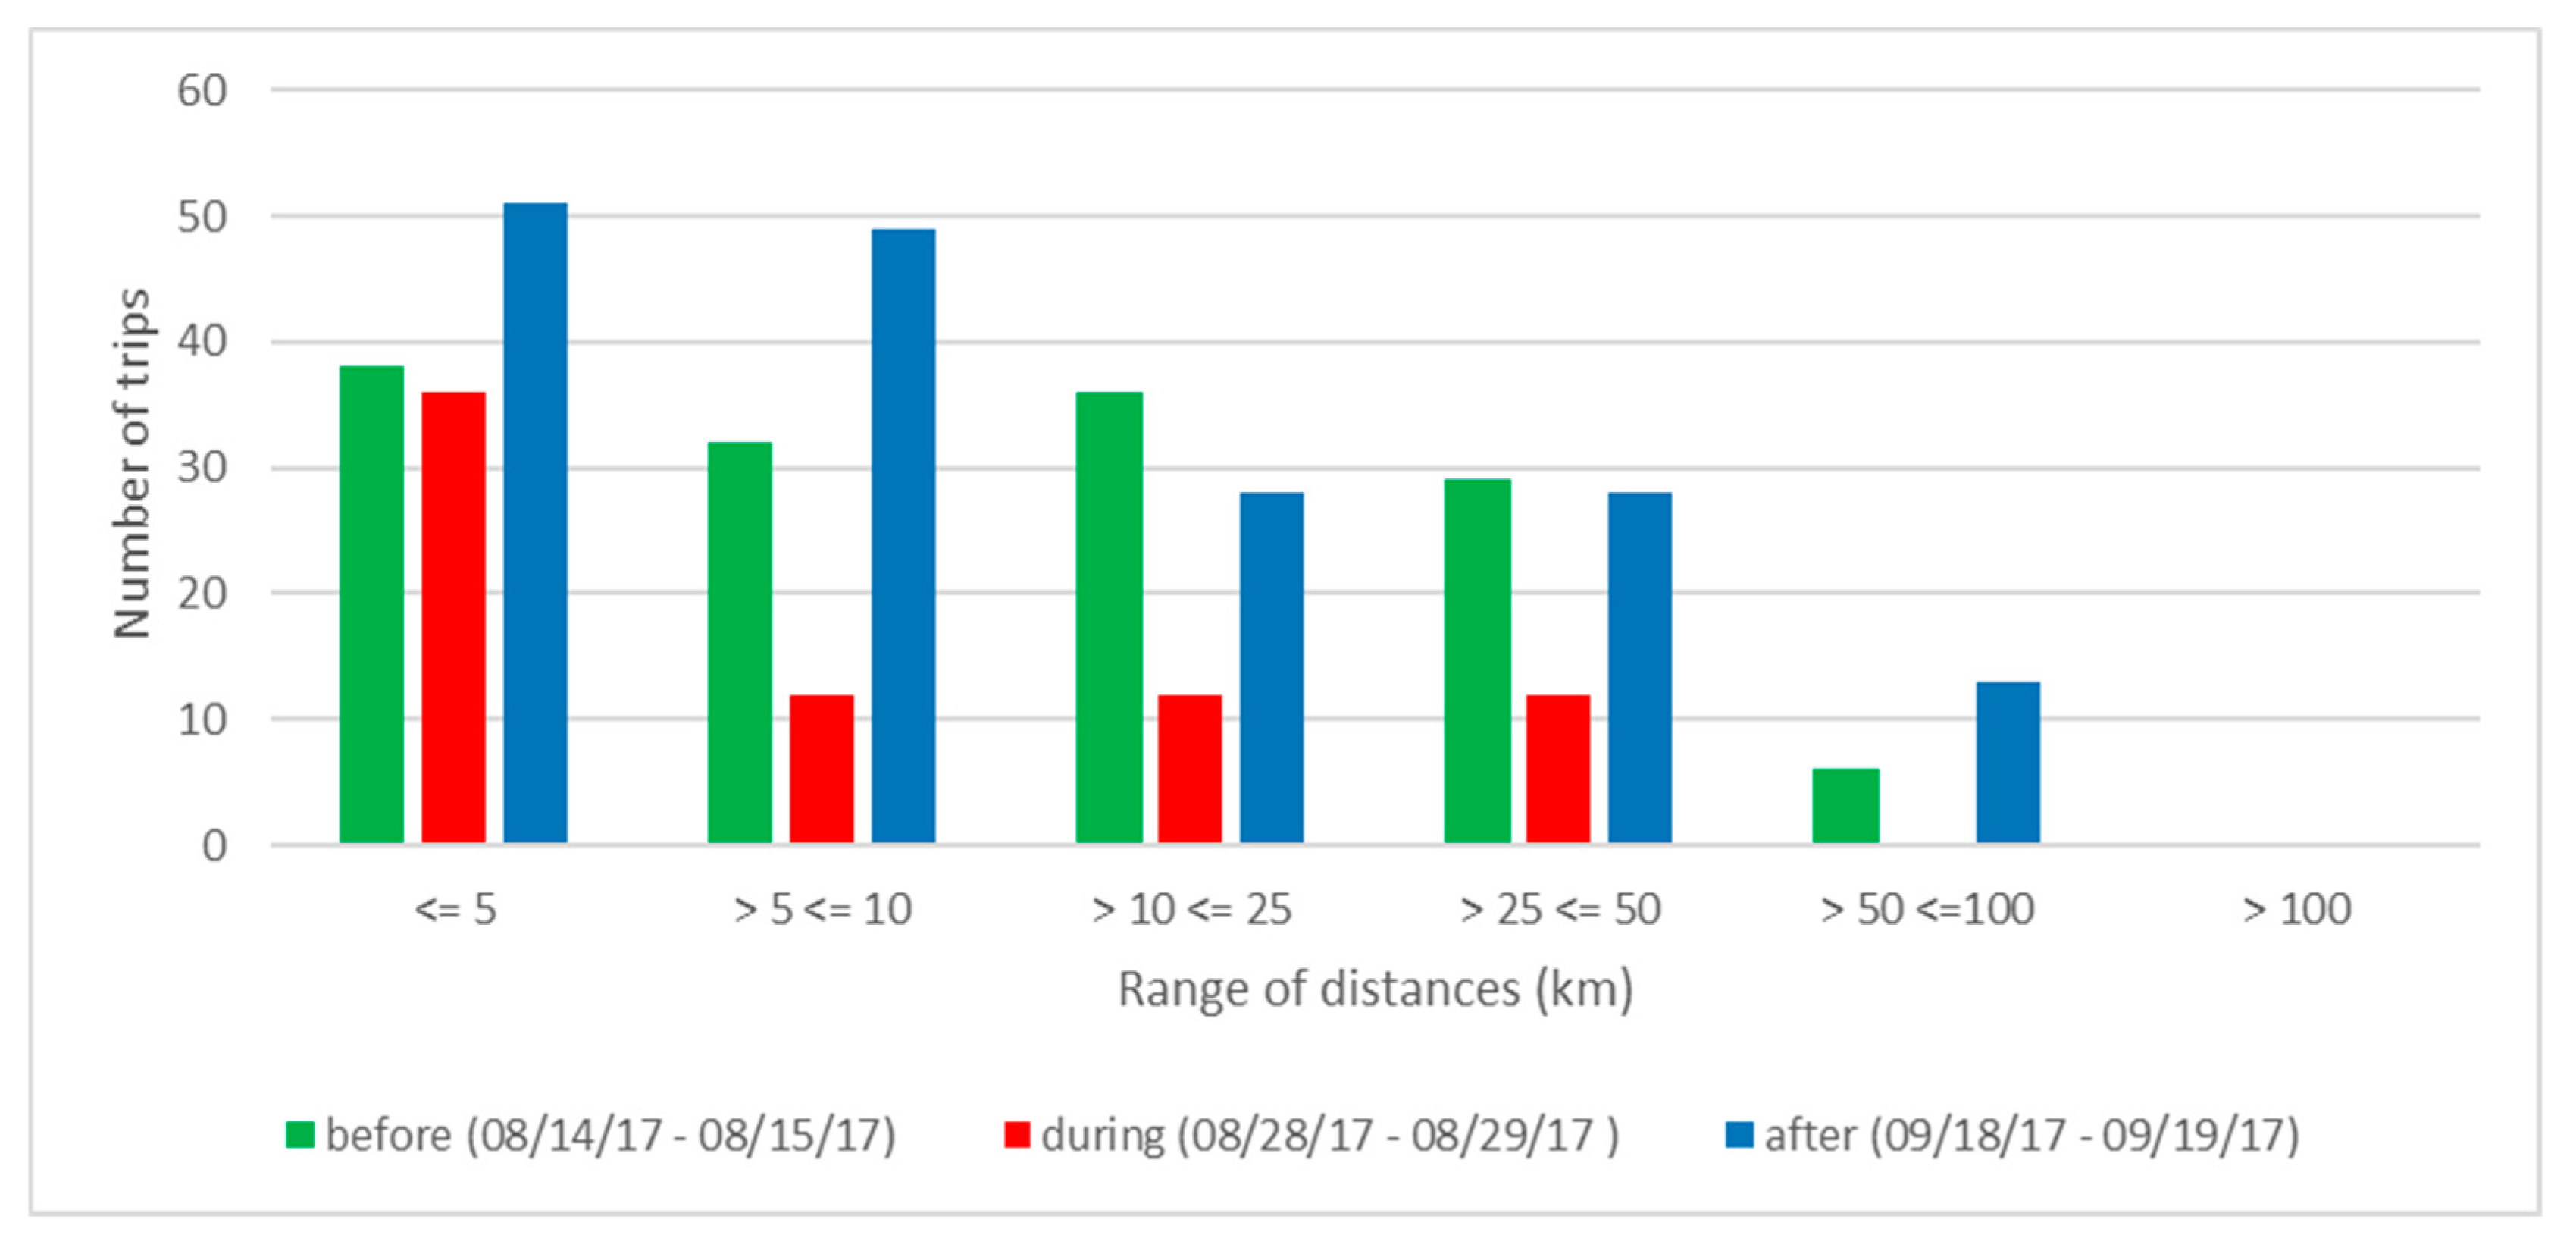
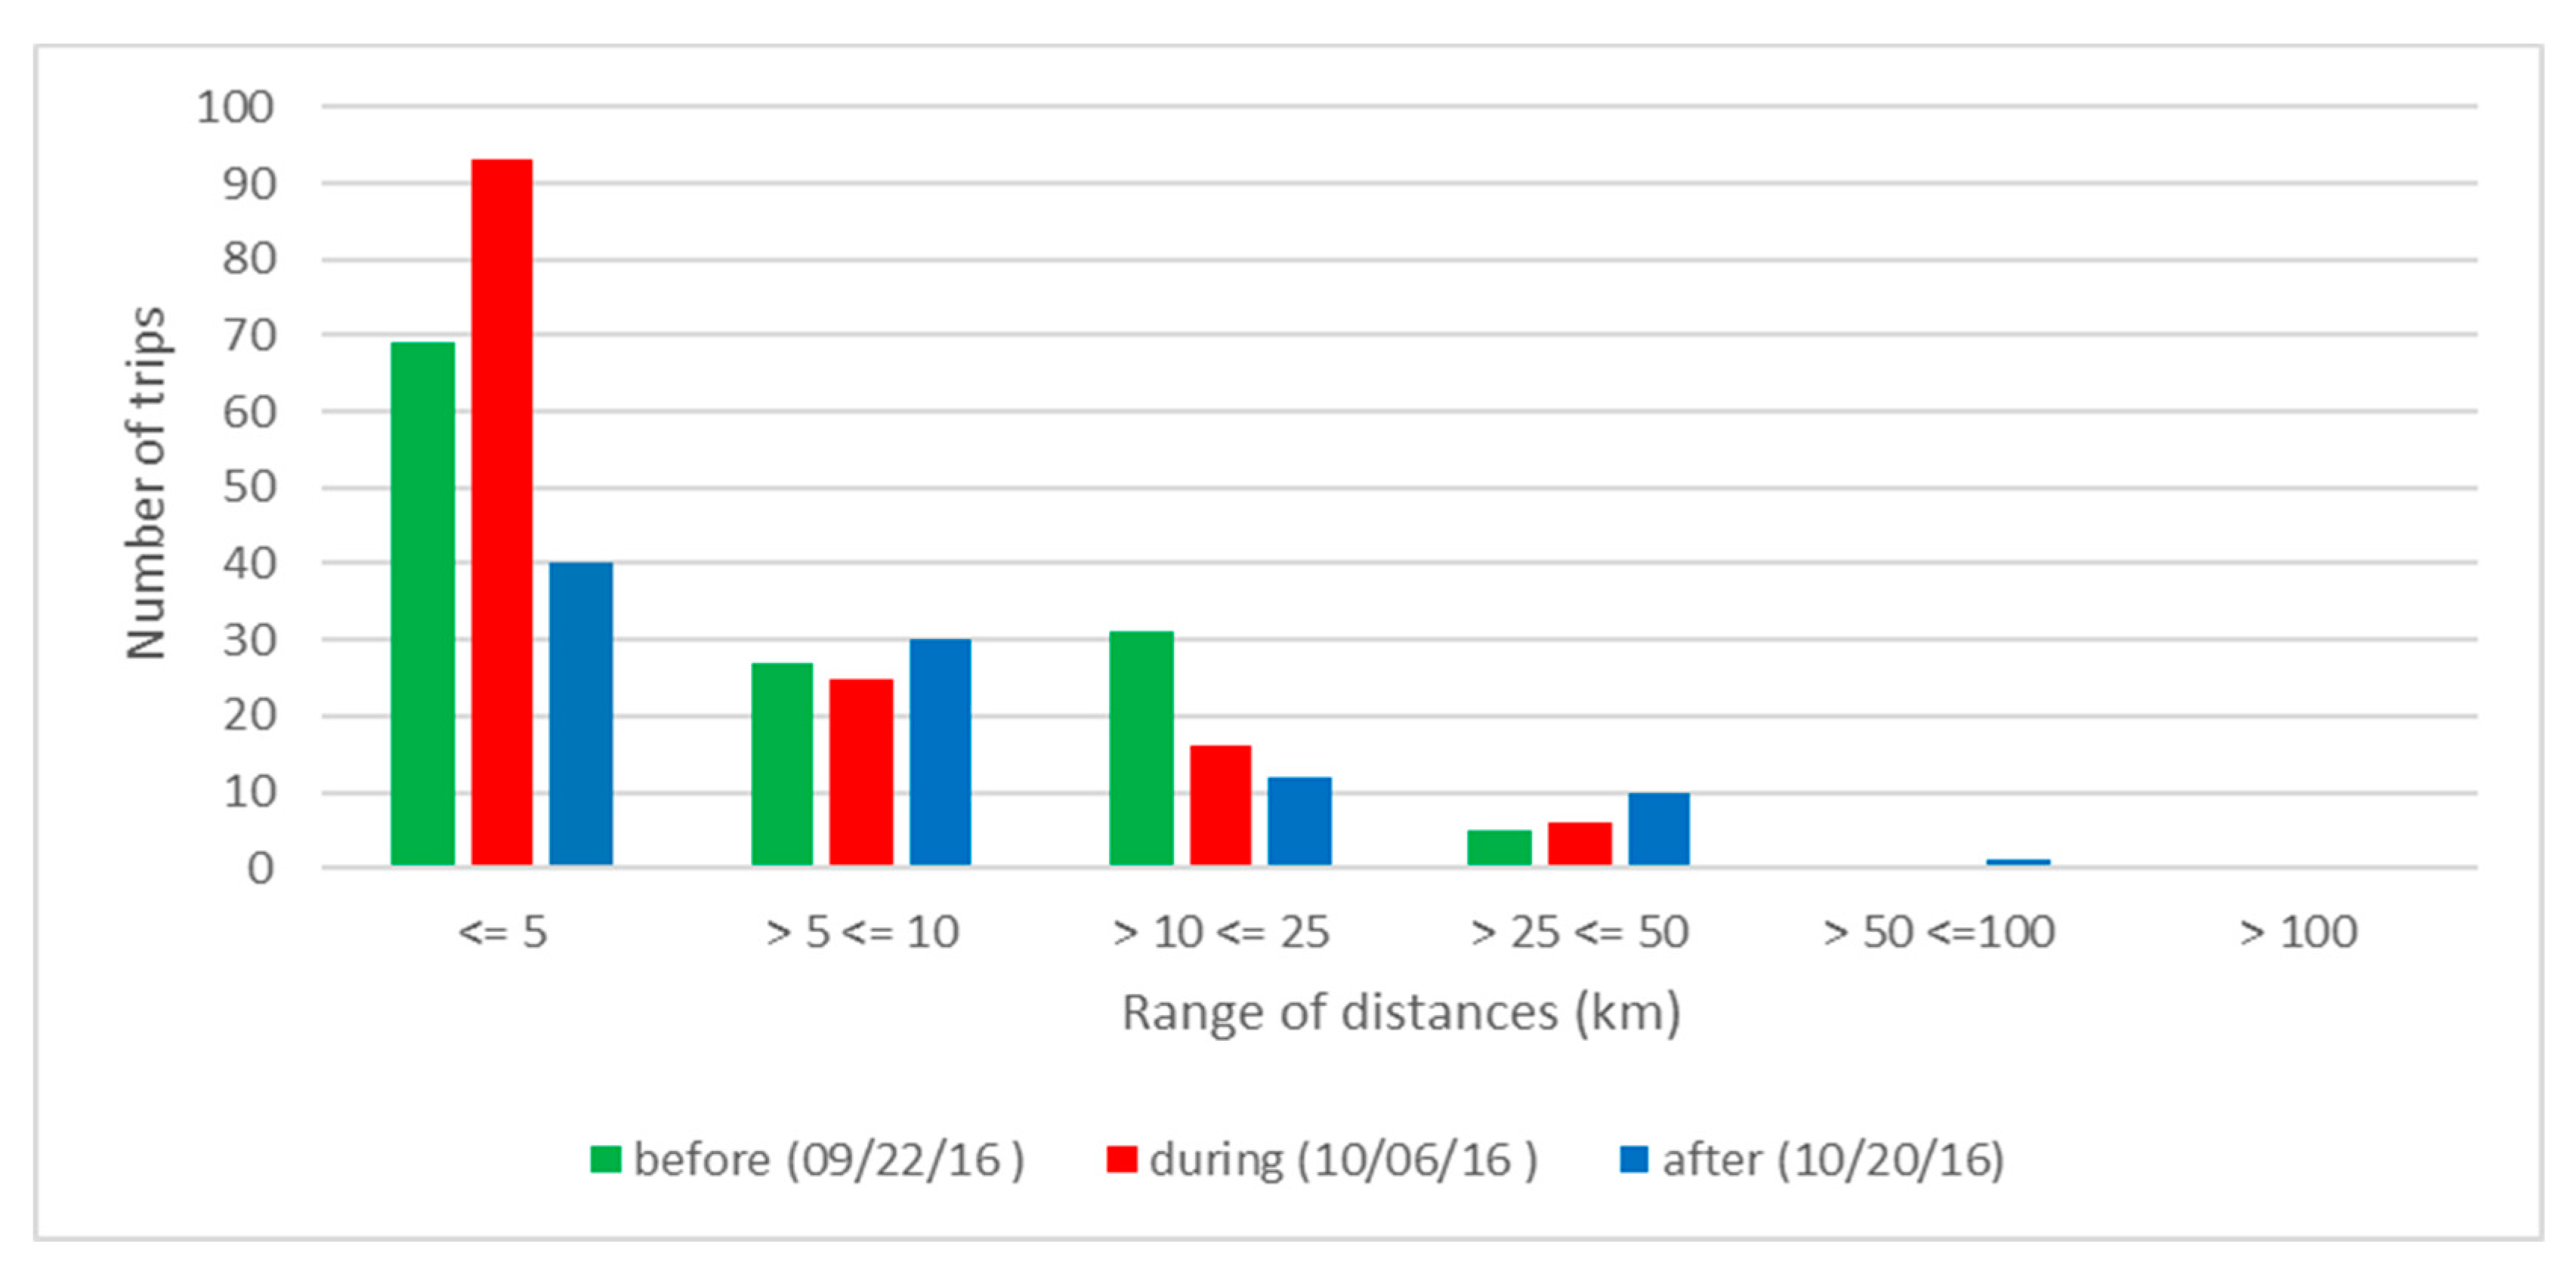
Figure 3 shows the number of observed trips in the different distance ranges for the Houston area before, during, and after Hurricane Harvey. The proportion of short trips (≤5 km) among all trips is highest during the hurricane period (red columns) with 50% compared to 27% before and 30% after the event. That is, longer trips above 5 km occurred less frequent during the hurricane than before and after, and no trips over 50 km were observed in the study area during the hurricane at all. Hence, making longer-distance trips was discouraged. A chi-squared test revealed a significant association between trip distribution and time period before/during the hurricane (χ2 = 11.169, df = 1, p < 0.001) and during/after the hurricane (χ2 = 8.600, df = 1, p = 0.003). This means that the hurricane caused significant perturbations on travel behavior within the localized affected area, with trips becoming shorter during the event.
Next, the mean and median offsets between any two subsequent tweet locations before, during, and after the events were calculated for each study area (Table 2). In line with the chi-squared test conducted above, results for the Houston area confirm that the mean and median displacement during Hurricane Harvey (M = 11 km, Mdn = 5 km) are smaller than the corresponding values before (M = 16 km, Mdn = 10 km) and after (M = 17 km, Mdn = 9 km) the hurricane, supporting the findings of limited mobility during the hurricane event. A Mann–Whitney U test shows that the differences in displacement medians between before and during the hurricane (U = 3892.5, p = 0.005) and during and after the hurricane (U = 4981, p = 0.025) are significant.
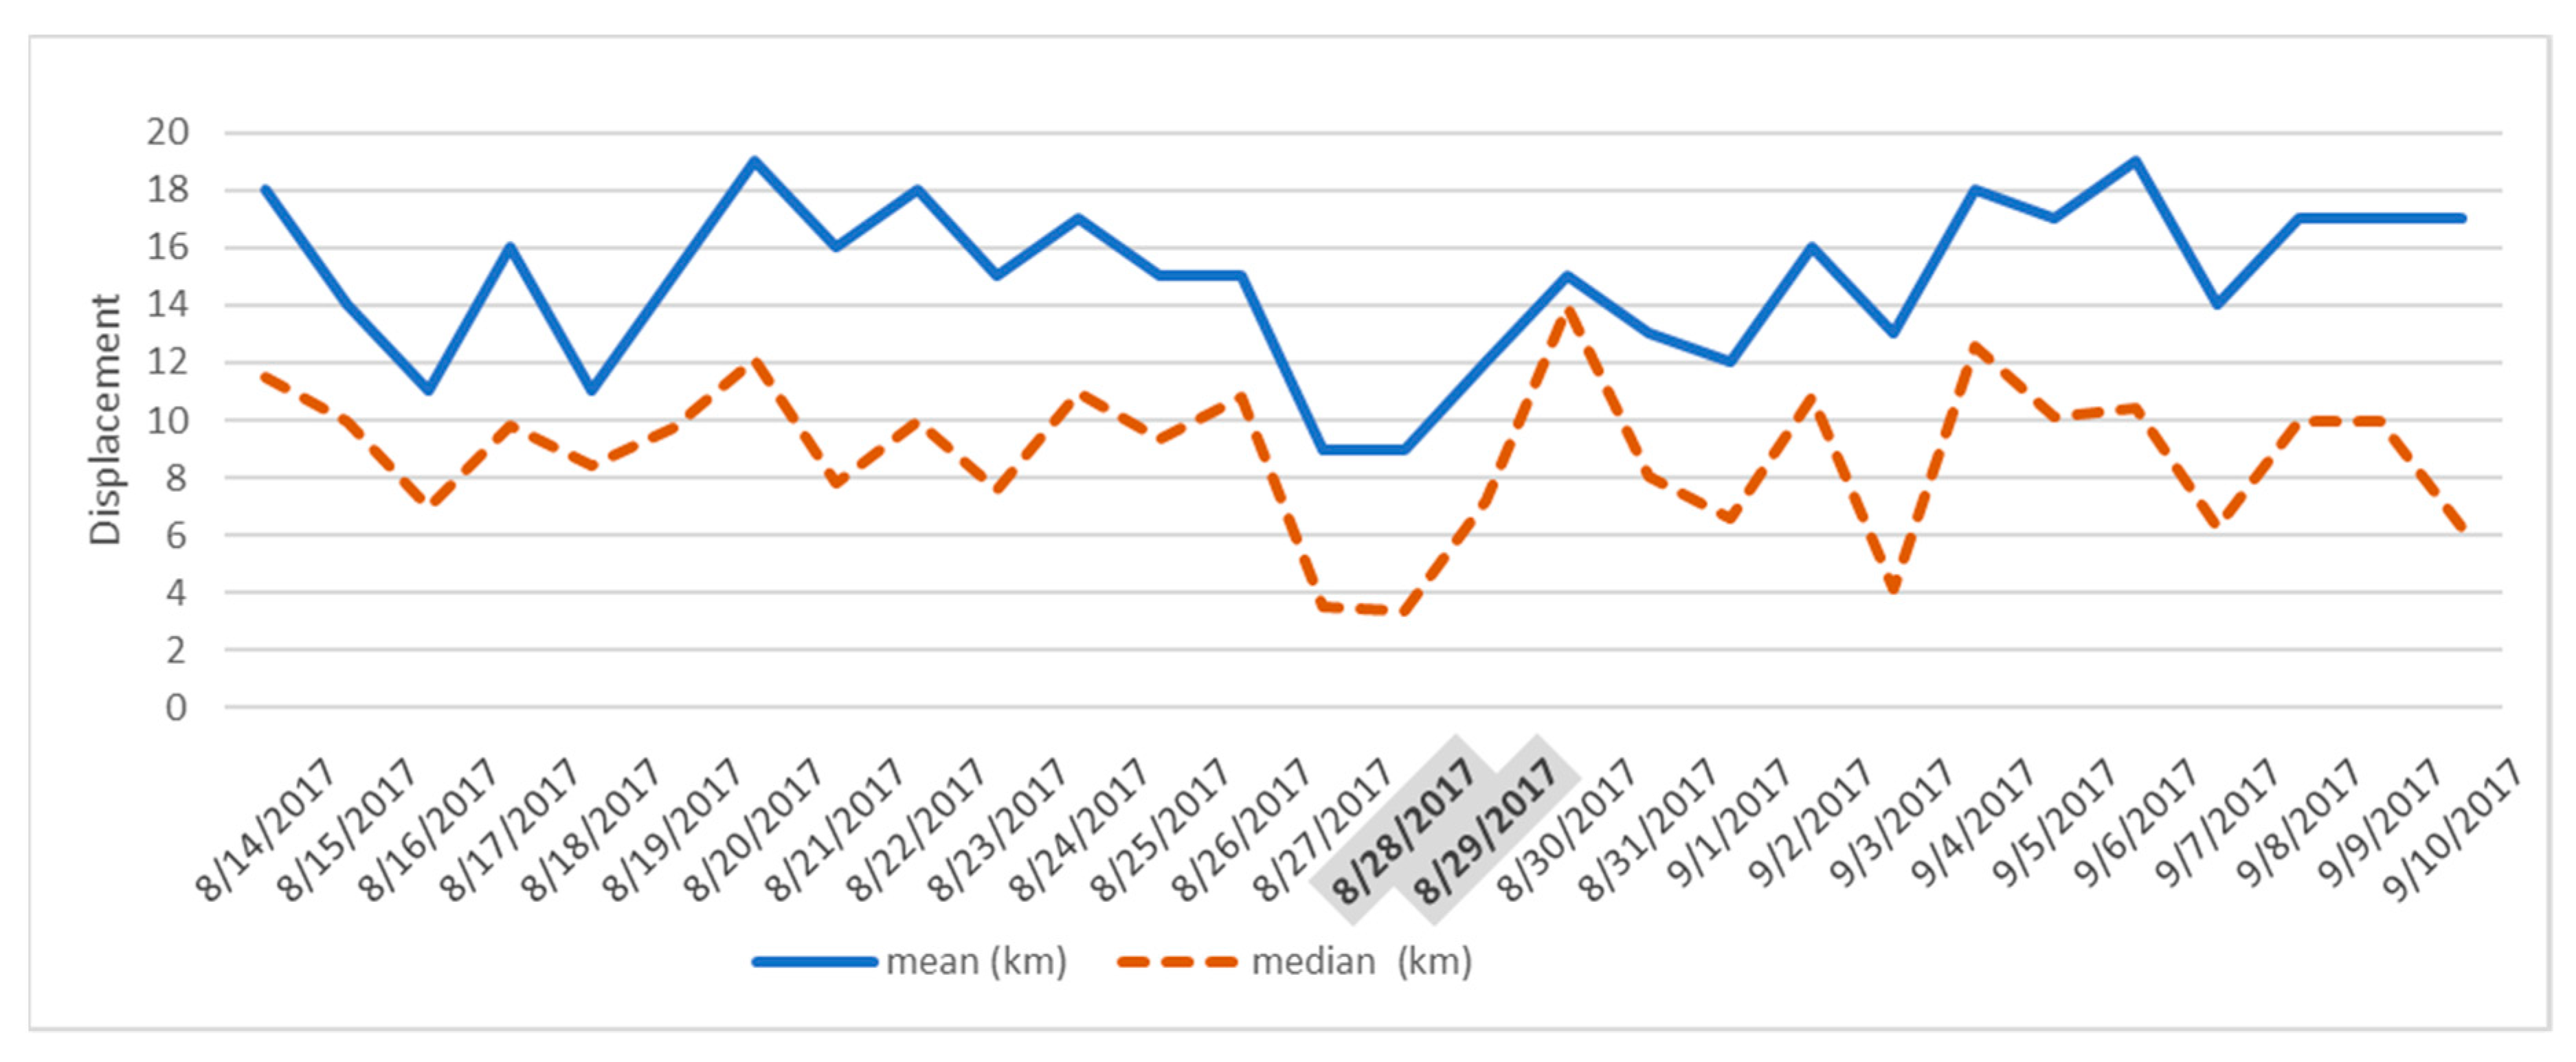
As an example for more detailed visualization of displacement quantities over the observation period, Figure 4 plots the daily mean and median offsets over the four-week period surrounding Hurricane Harvey, where a drop-in distance offsets is clearly discernible around the hurricane event.
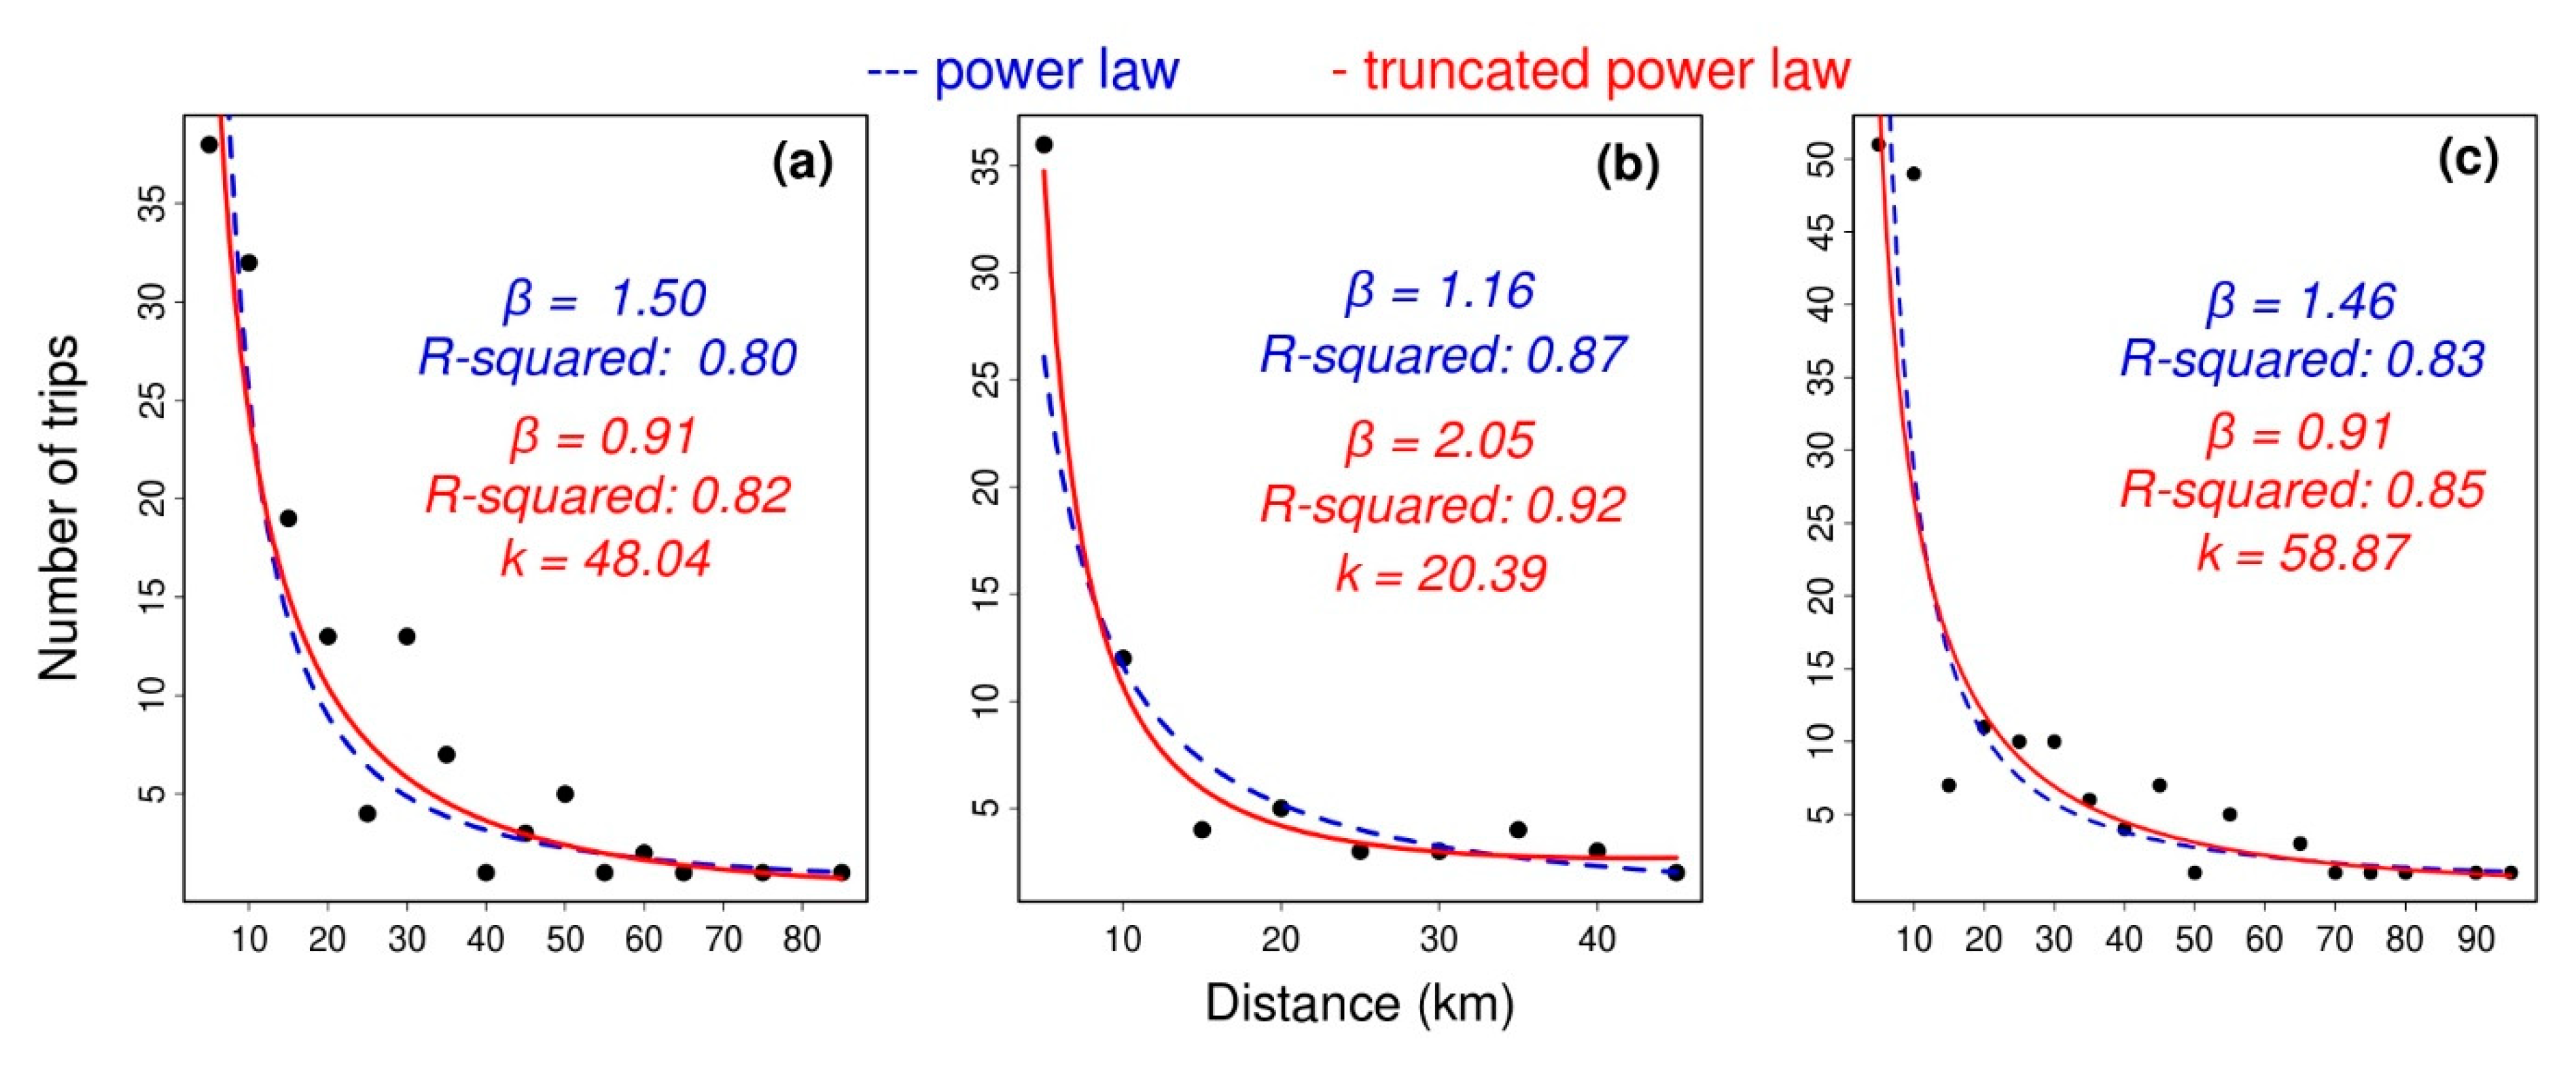
The distribution of displacements for the Houston area is fit to power-law and truncated power-law models for the time periods before (Figure 5a), during (Figure 5b), and after (Figure 5c) Hurricane Harvey. R-squared values are higher for the truncated power-law (0.82, 0.92, and 0.85) than for the power-law (0.80, 0.87, and 0.83). A likelihood ratio test revealed that the truncated power-law provides a significantly better model fit of observed displacements than the power-law (Δχ2(1) = 4.7922, p = 0.028) during the hurricane, but not before and after the hurricane.
The number of observed displacements in the different distance ranges for the Miami-Dade County affected area before, during, and after Hurricane Matthew are shown in Figure 6. Also, here, the proportion of short trips (≤5 km), with 66% among all trips, is highest during the hurricane, compared to 52% before and 43% after the event. As with Hurricane Harvey, no trips over 50 km were observed for the Miami-Dade study area during Hurricane Matthew. A chi-squared test revealed a significant association between trip distribution and time period before/during the hurricane (χ2 = 5.652, df = 1, p = 0.017) and during/after the hurricane (χ2 = 12.508, df = 1, p < 0.001).
As shown in Table 2, the mean and median values of displacements are smaller during Hurricane Matthew (M = 5 km, Mdn = 2 km) than before (M = 7 km, Mdn = 4 km) and after (M = 9 km, Mdn = 6 km) the hurricane in Miami-Dade County. A Mann–Whitney U test showed that the differences in distance medians between before and during the hurricane (U = 7729.5, p = 0.019) and during and after the hurricane (U = 4461.5, p < 0.001) are significant.
Before Hurricane Matthew, the truncated power-law (R-squared = 0.96) fit the distribution of trips better than the power-law (R-squared = 0.93) for the Miami-Dade County area, although this difference was not statistically significant. Both models reveal an equal fit to the observed offsets during the hurricane (R-squared = 0.92) and after the hurricane (R-squared = 0.77) in that area.
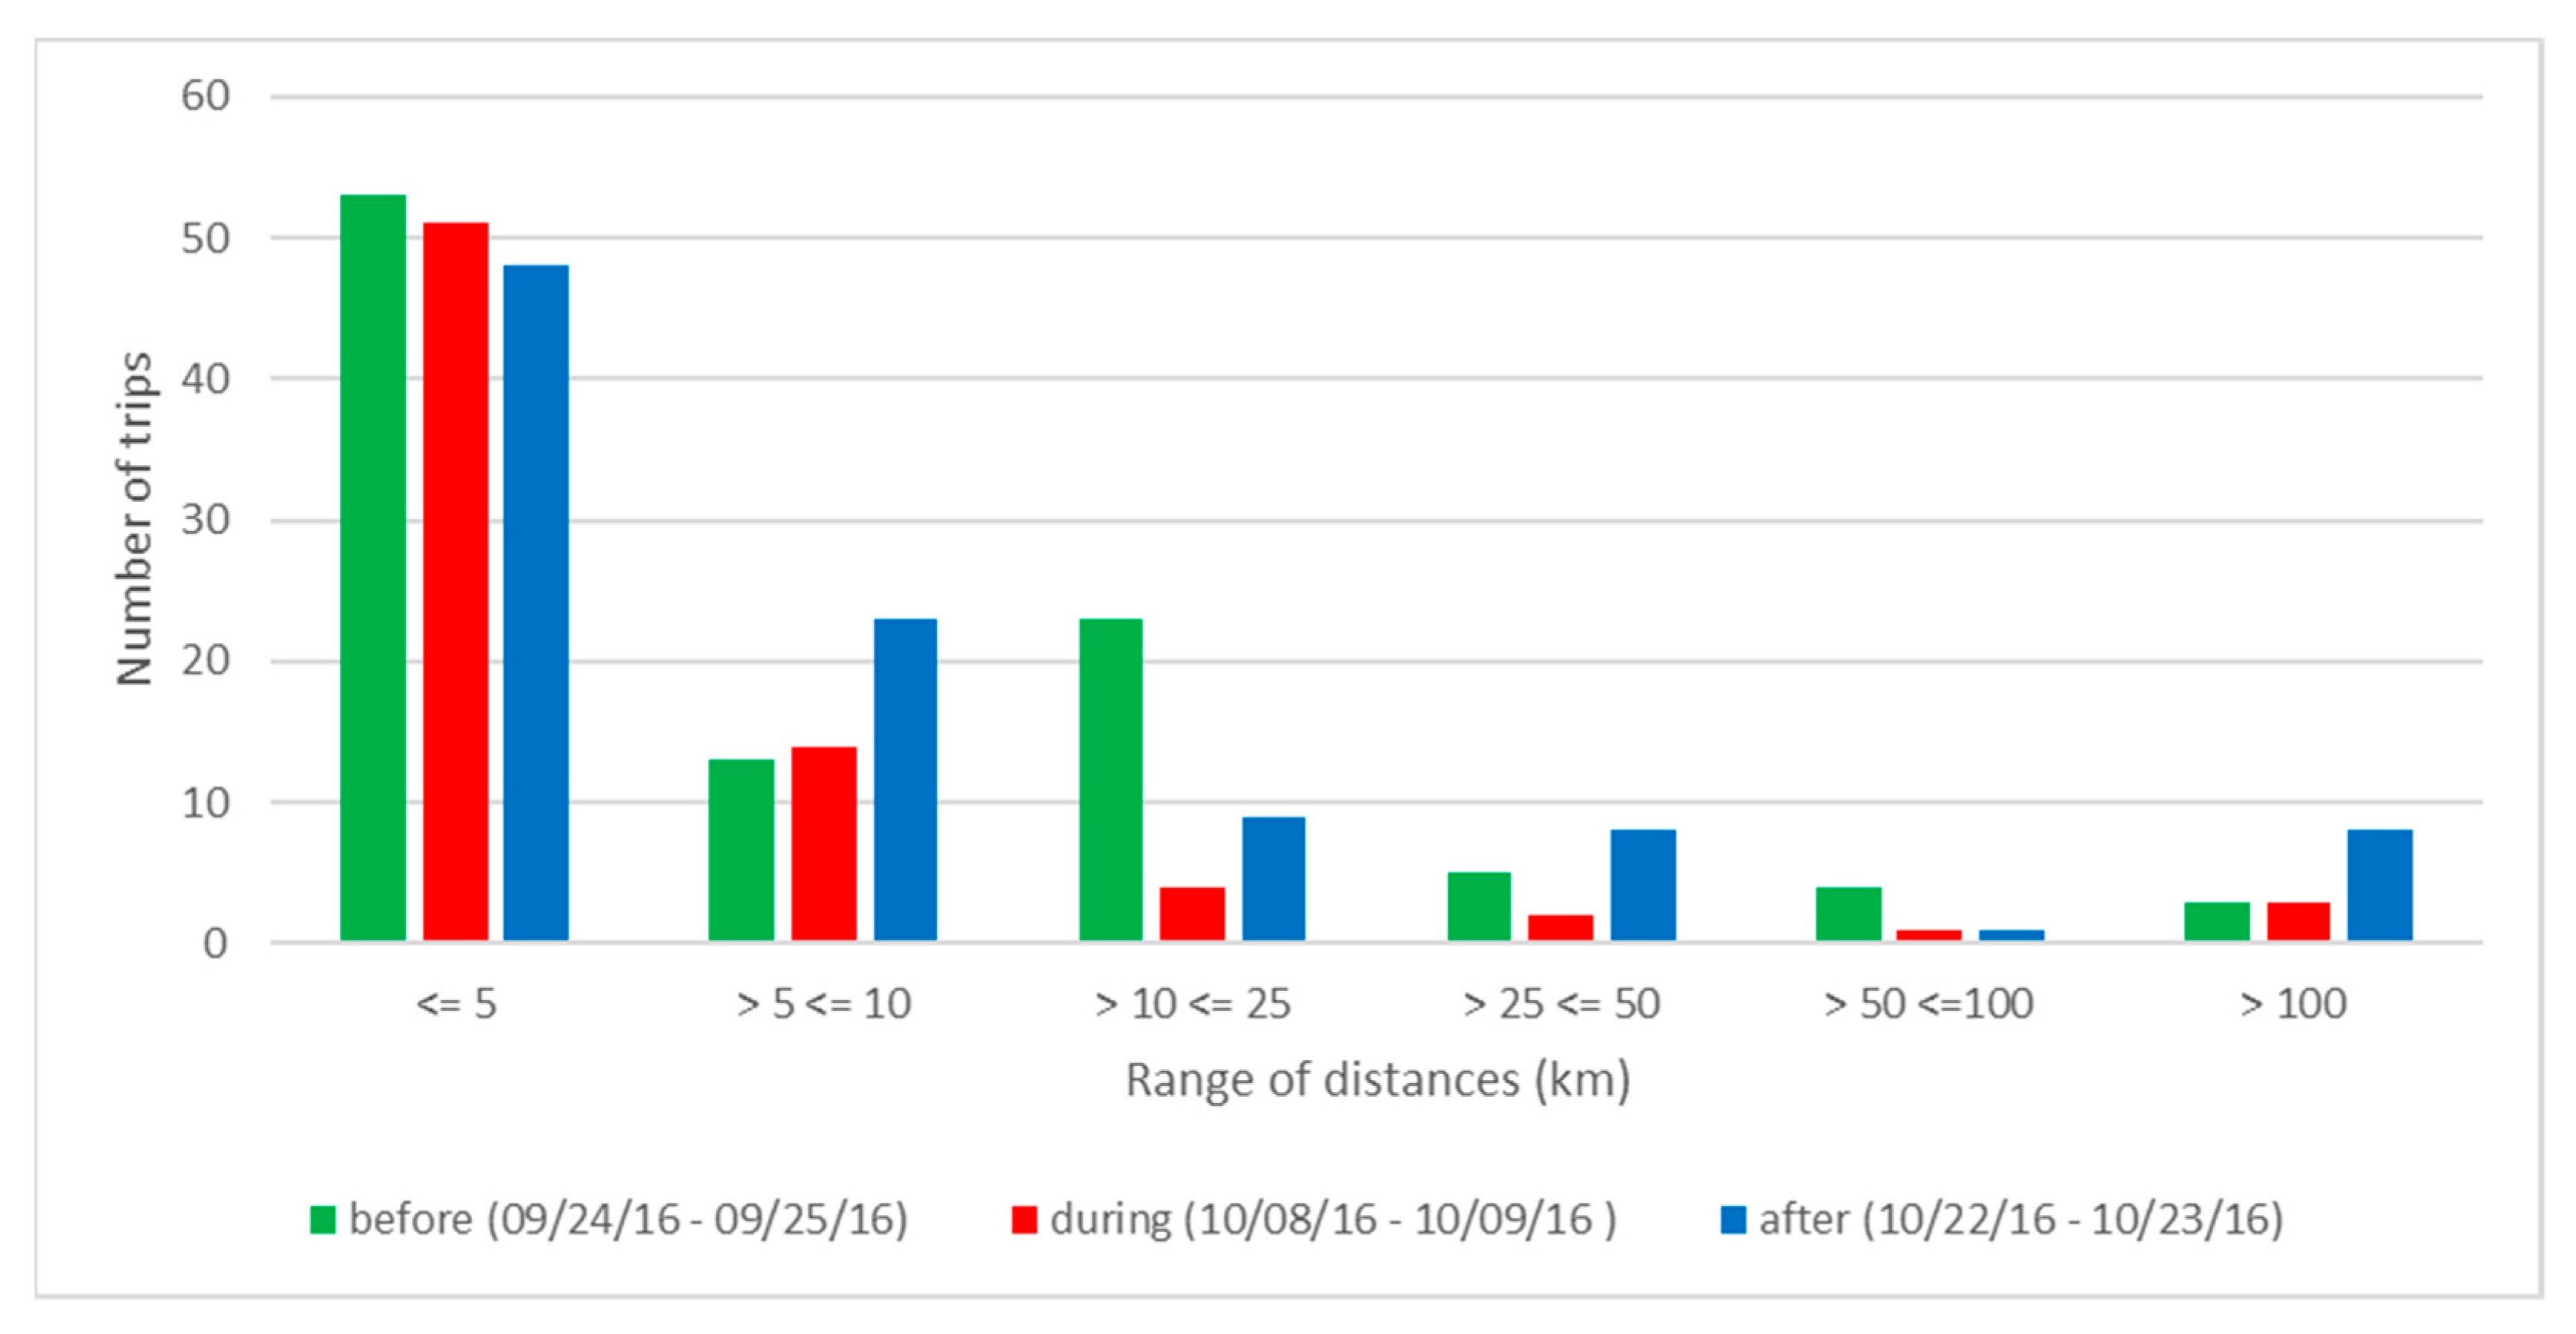
As with the other two study areas, for North and South Carolina, the proportion of short trips among all trips was highest during Hurricane Matthew (68%), compared to before (53%) and after (49%) (see Figure 7). A chi-squared test revealed a significant association between trip distribution and time period before/during the hurricane (χ2 = 4.291, df = 1, p = 0.038) and during/after the hurricane (χ2 = 5.935, df = 1, p = 0.014).
For the affected areas in North and South Carolina the mean and median values of displacements are smaller during Hurricane Matthew (M = 11 km, Mdn = 3 km) than before (M = 17 km, Mdn = 5 km) and after (M = 24 km, Mdn = 5 km) the hurricane (see Table 2). A Mann–Whitney U test showed that the difference in distance medians between during and after the hurricane is significant (U = 2891, p = 0.021).
The truncated power-law shows a better model fit to observed displacements (R-squared: 0.87, 0.89, and 0.78) than the power-law (R-squared: 0.67, 0.72, and 0.54) before, during, and after Hurricane Matthew for the North and South Carolina area, respectively. The likelihood ratio test revealed that these differences in model fit were significant before (Δχ2(1) = 10.854, p < 0.001), during (Δχ2(1) = 8.929, p = 0.002), and after the hurricane (Δχ2(1) = 11.479, p < 0.001).
4.2. Activity Spaces
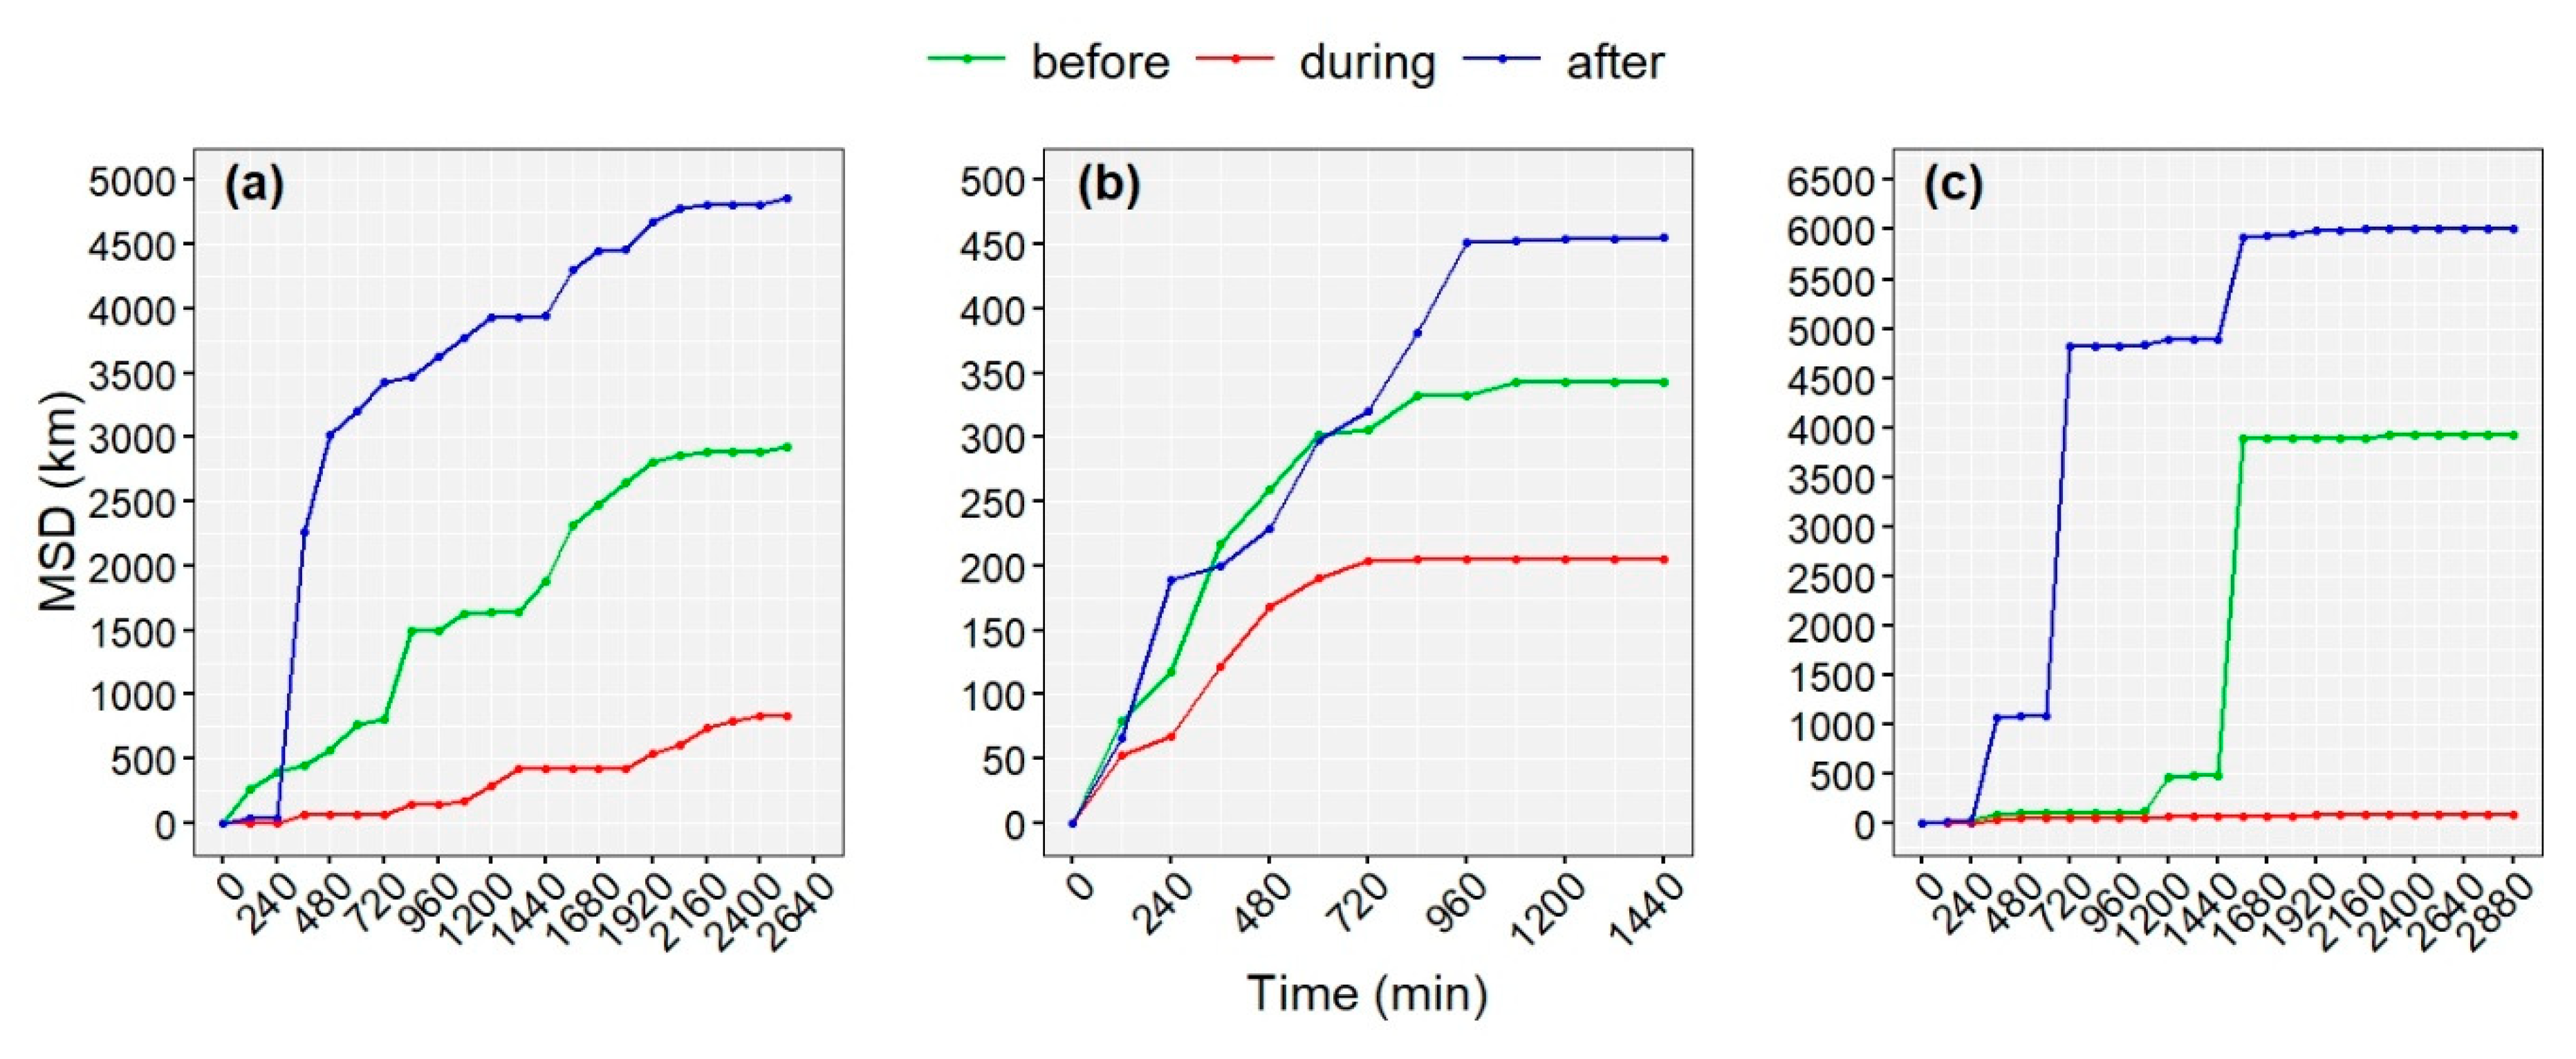
Figure 8 shows the average MSD of users in 2-h steps within the analyzed time period before, during, and after each event in the three study areas, based on 22, 19, and 25 users before, during, and after the hurricane for the Houston area; 19, 22, and 20 users before, during, and after the hurricane for the Miami-Dade area; and 17, 23, and 19 users before, during, and after the hurricane for the South and North Carolina area, respectively. The figure reveals that the average MSD values during the hurricanes in the three examined areas (i.e., Hurricane Harvey in Houston (Figure 8a) and Hurricane Matthew in Miami-Dade County (Figure 8b) and North and South Carolina (Figure 8c)), are smaller than the corresponding MSD values before and after each event. This means that overall mobility and the size of the activity space are diminished during the hurricane events, compared to before and after.
The slowing in MSD growth over time can be expected and has been observed in previous studies [13,46]. During the hurricane event, this typical behavior can especially be observed for the Miami-Dade County area (Hurricane Matthew) and to some extent for Houston (Hurricane Matthew). As opposed to this, for the North Carolina area, MSD values remained small throughout the entire hurricane event compared to before and after the event.
Using the same set of Twitter users, the mean and median of the radius of gyration across these users before, during, and after the events were calculated for each study area (Table 3). The values were found to be smaller during than before and after the events for each region with the exception of the during/after comparison for Miami-Dade. For the Houston area, a Mann–Whitney U test showed that the difference in medians of the radius of gyration between before and during the hurricane (U = 142.5, p = 0.015) and during and after the hurricane (U = 133, p = 0.005) is significant.
For Miami-Dade County, a Mann–Whitney U test showed that the p-value for the difference in medians of the radius of gyration between before and during the hurricane is slightly above the 5% level of significance (U = 150.5, p = 0.064).
For Hurricane Matthew and the North and South Carolina areas, the difference in medians of the radius of gyration between before and during the hurricane is significant (U = 169.5, p = 0.045) and during and after the hurricane slightly above the 5% level of significance (U = 158, p = 0.093).
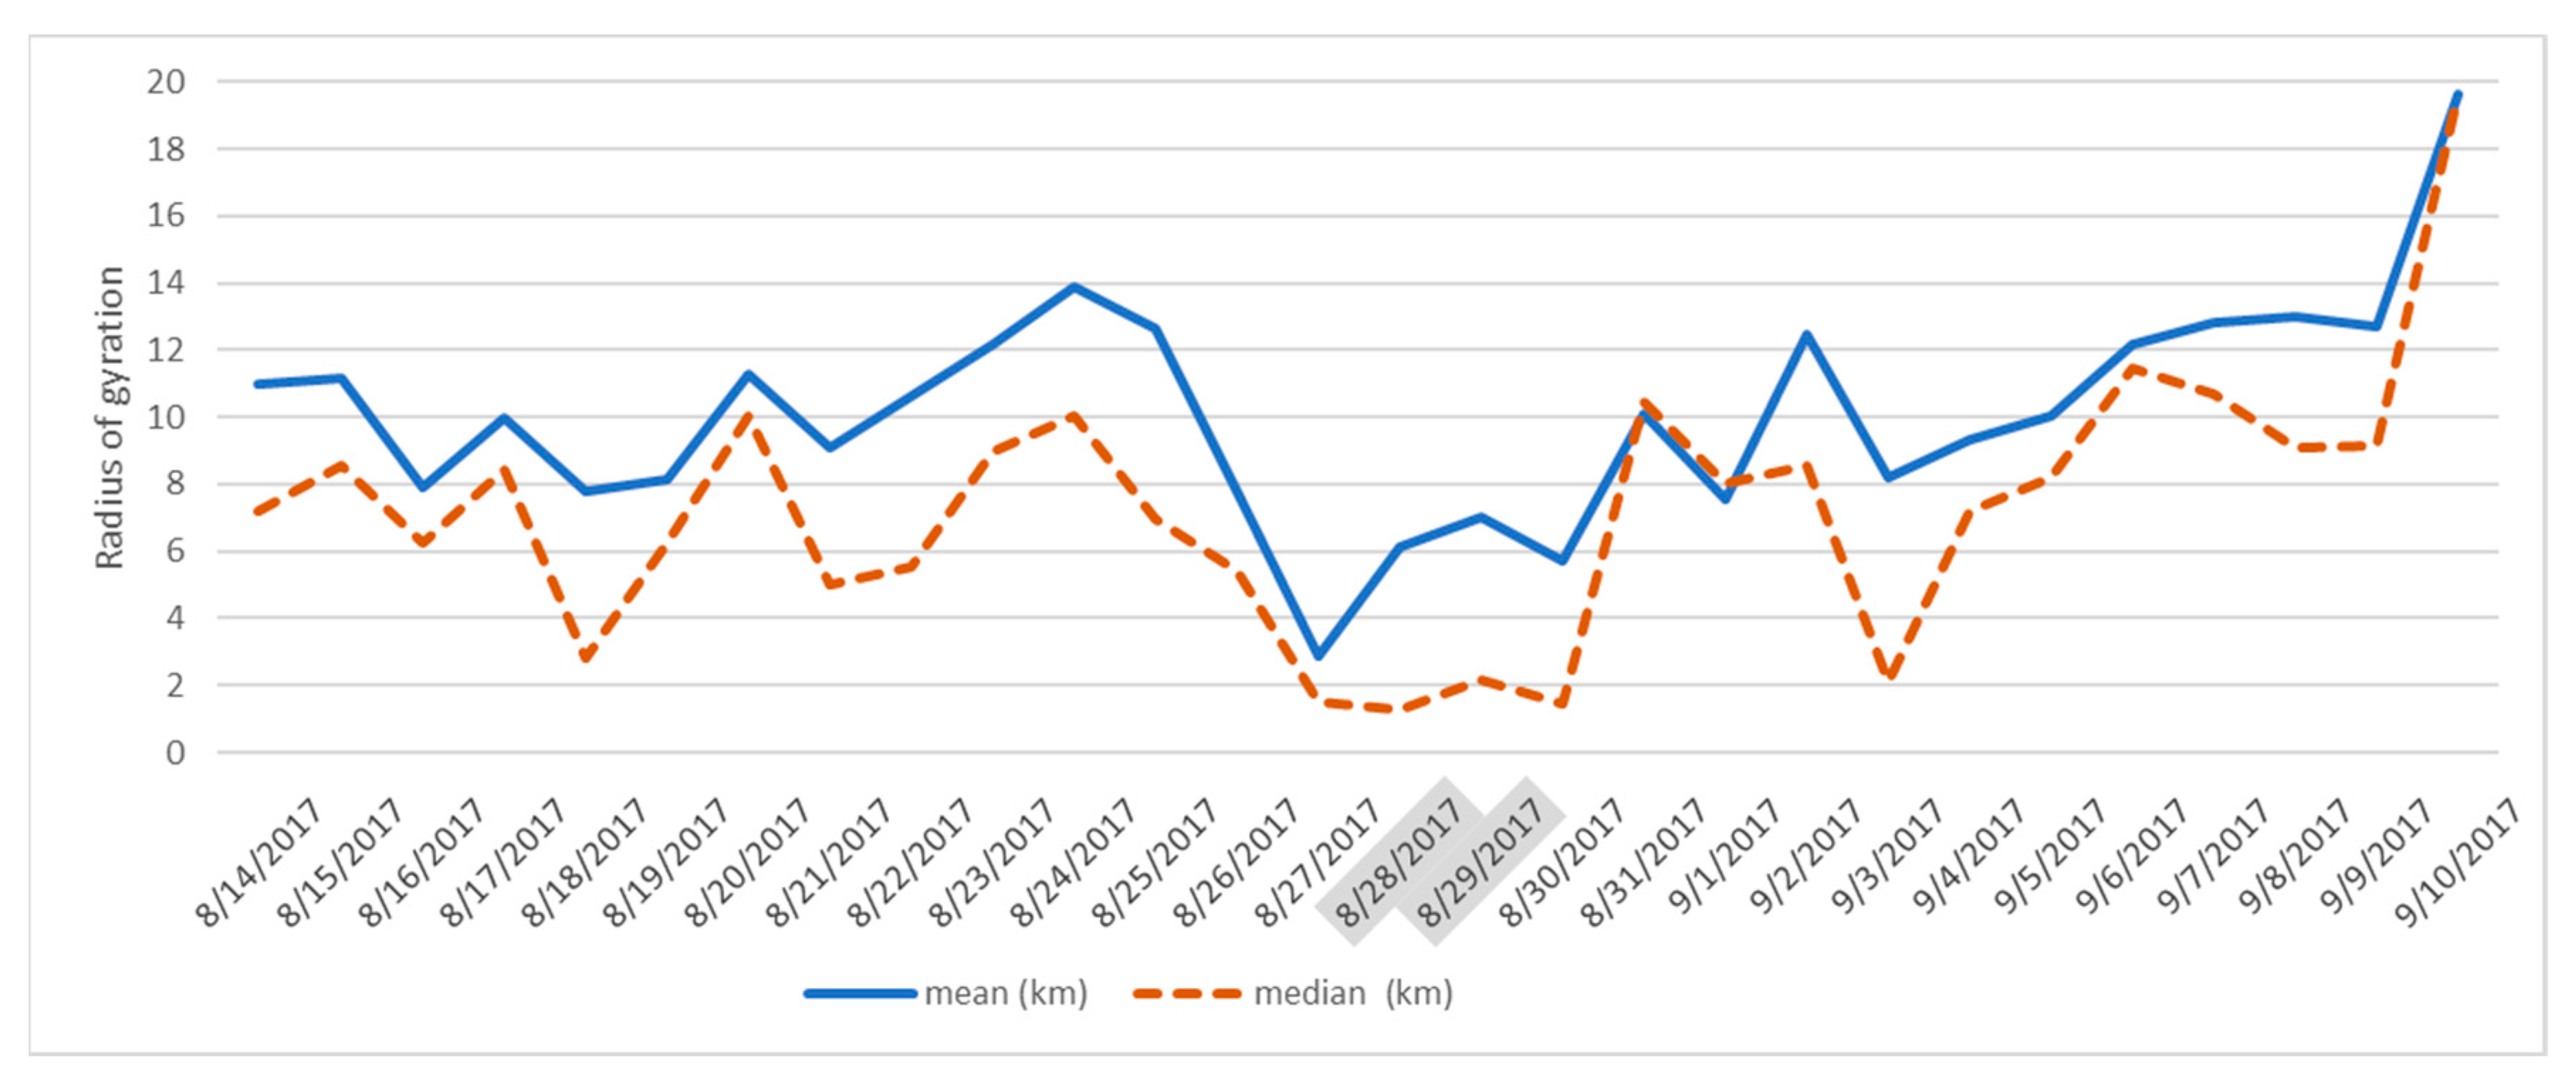
As an example for a more detailed visualization of the radius of gyration over the four-week observation period, Figure 9 plots the daily mean and median radius of gyration values over the four-week period surrounding Hurricane Harvey. The days around the hurricane event show a distinct drop.
Overall, MSD computations and measures of the radius of gyration for the three analyzed regions suggest reduced movement and smaller activity spaces during hurricane events compared to before and after.
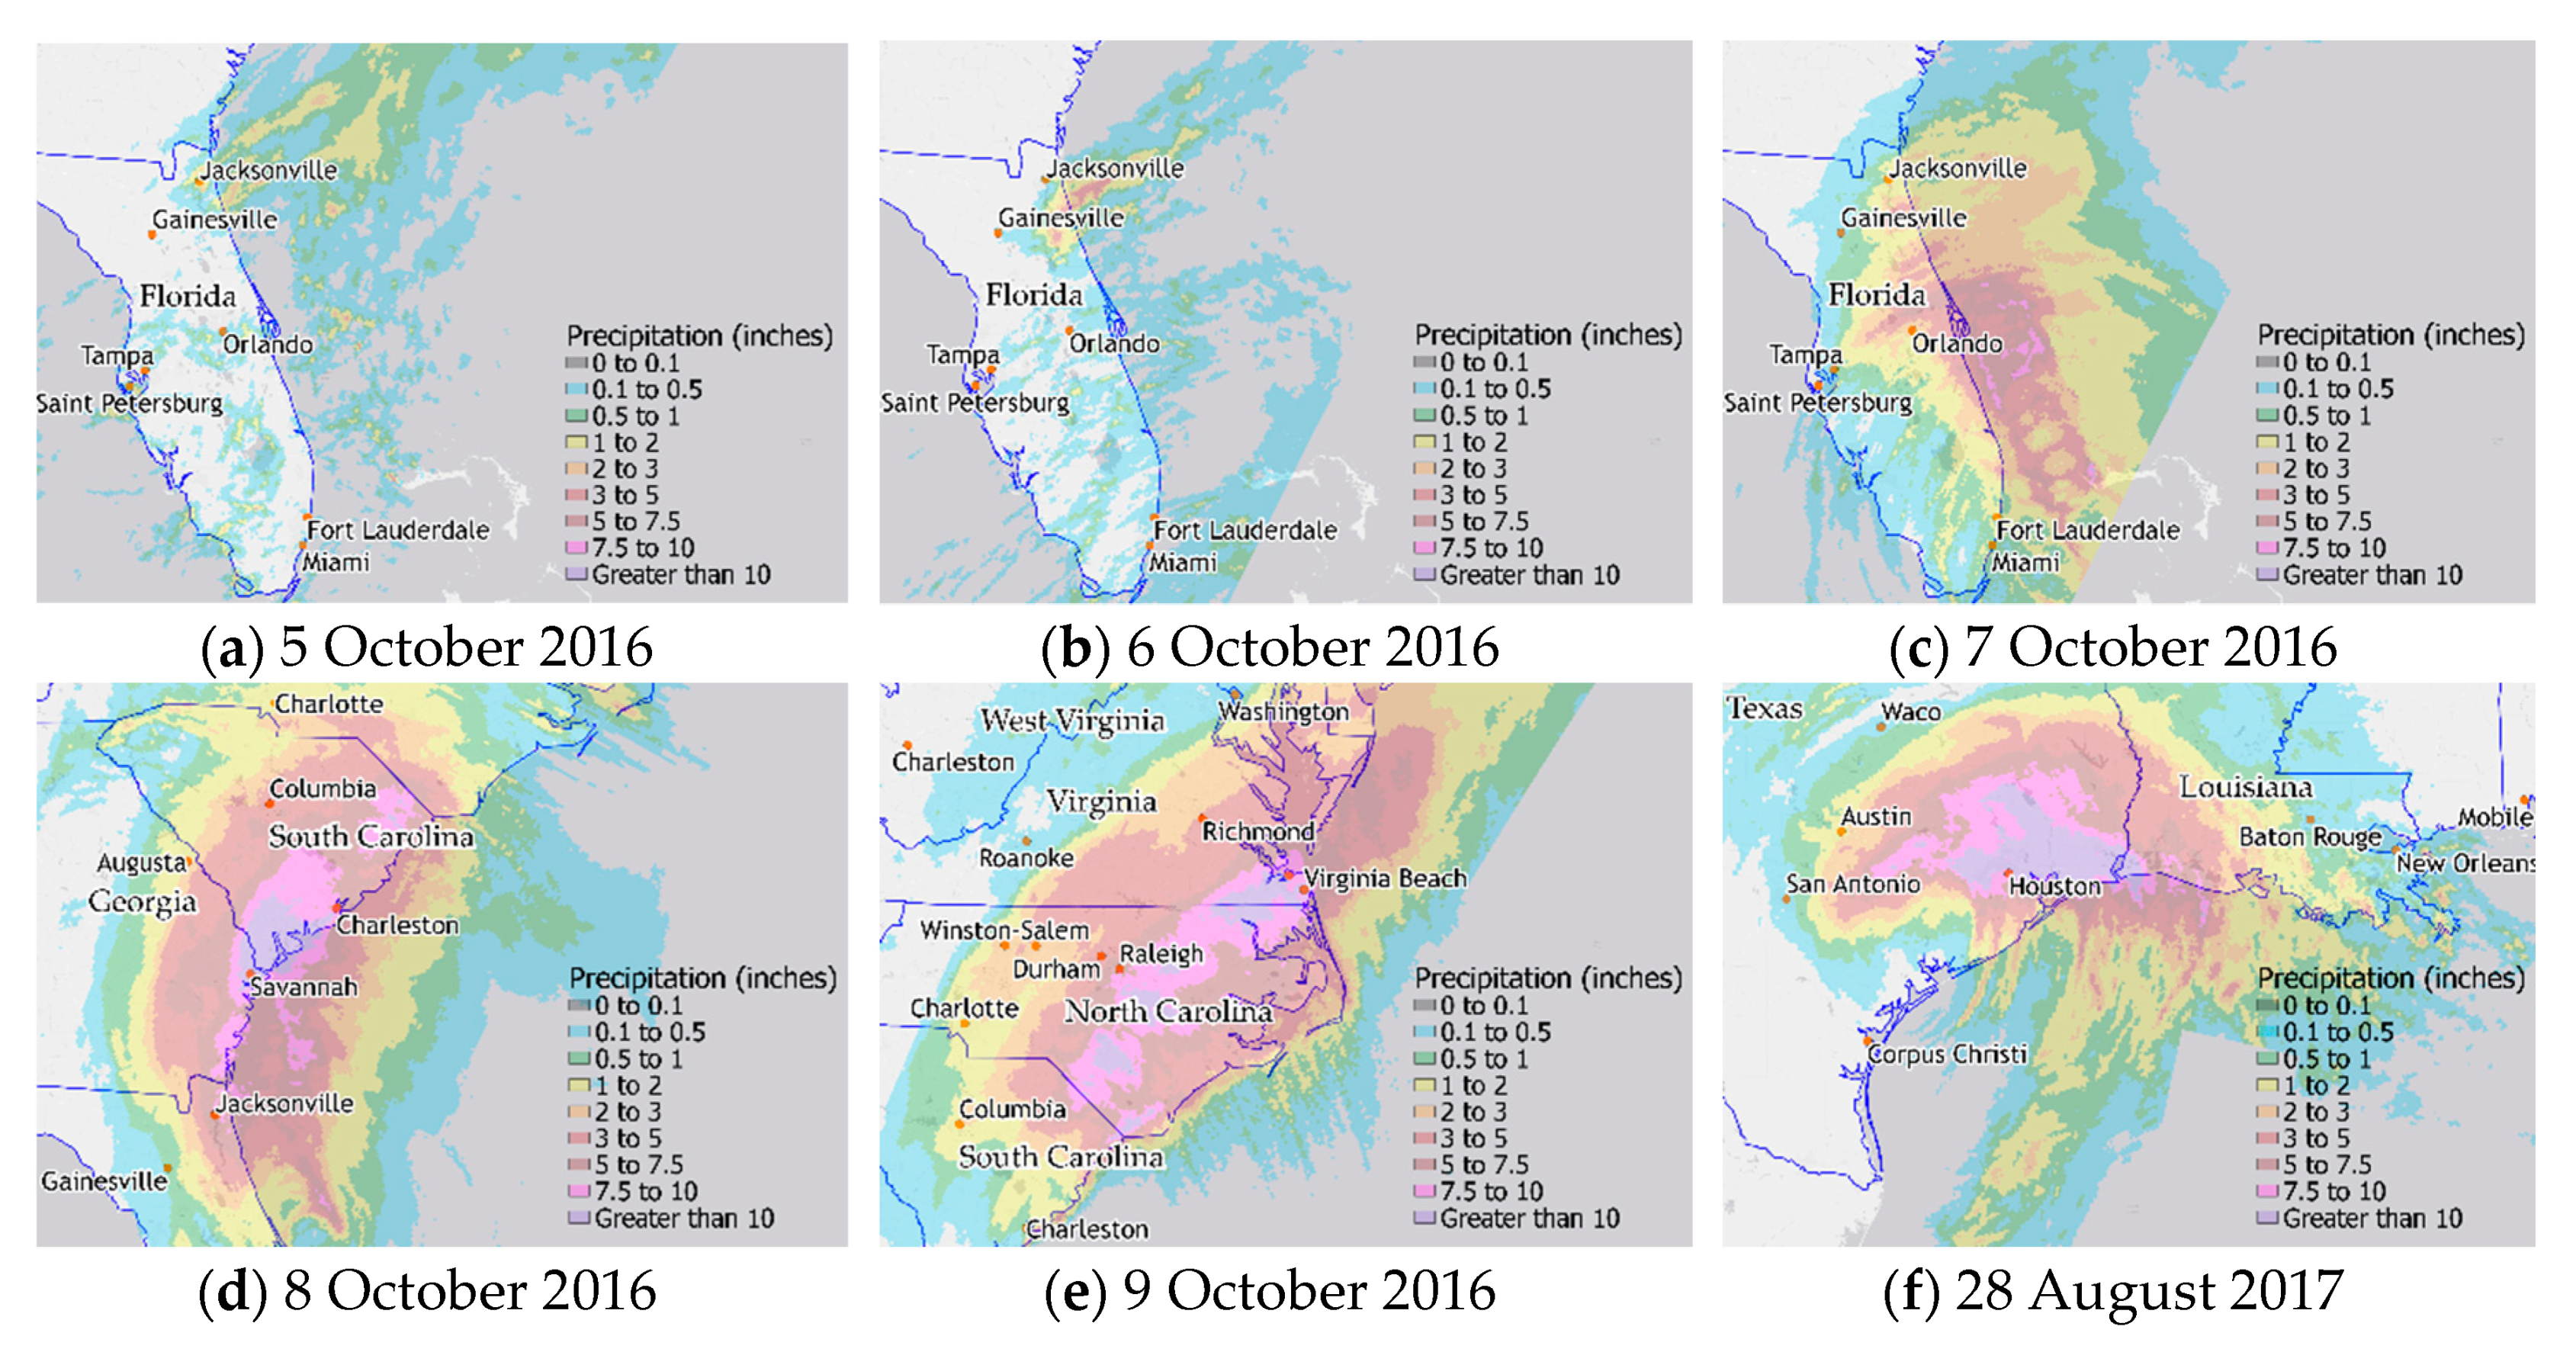
The somewhat less pronounced effect of Hurricane Matthew on travel behavior in Miami-Dade compared to North/South Carolina and Hurricane Harvey (compare Table 3) can likely be explained by the fact that the hurricane never landed in Miami-Dade County but further north in Daytona Beach. This is visually discernible on daily precipitation maps from the National Weather Service [47] for Florida and North/South Carolina (Figure 10a–e). Although there was a lot of communication about Hurricane Matthew in Miami-Dade and preparation since all forecasts were predicting landfall in Miami-Dade or Broward County, it did in fact not hit Miami-Dade County with substantial rainfall (Figure 10a–c), whereas purple areas for 8 October 2016 and 9 October 2016 do show heavy precipitation in the analyzed North/South Carolina region (Figure 10d,e). Heavy precipitation during Hurricane Harvey for the Houston area is also clearly discernible in Figure 10f for 28 August 2017.
4.3. Tweet Numbers around Supply Related Points of Interest
Potential reasons for shorter displacement and smaller MSDs during hurricanes are manifold and include the temporary closing of facilities, such as stores, schools, or office buildings. Such closings could lead to the cancellation of (longer) shopping and commute trips. Facilities reported closed during the analyzed hurricanes in Houston [48], Miami-Dade County [49], North Carolina [50], and South Carolina [51] included malls, universities, governmental buildings, childcare centers, parks, libraries, museums, supermarkets, restaurants, and banks. To analyze the change of tweeting locations during the events we counted for those Twitter users who tweeted at least once before, during, and after the hurricane in an analyzed region the number of tweets posted within 500 m from a supply business during the event. To increase the sample size around the hurricane event days, three-day ranges around hurricane events were used for the analysis. The same weekdays were also used for counting tweets around these points of interest (POIs) within the preceding two and subsequent two to three weeks, respectively. The obtained ratio of tweets from during over before/after the hurricane was then compared to the corresponding ratio obtained from all tweets posted by Twitter users observed in these time periods. The working hypothesis was that relatively fewer tweets are observed near the supply locations during the hurricane in comparison to tweets in other parts of the analyzed regions (for example, due to accessibility problems or closed businesses), which would imply a reduction in trips towards these businesses during hurricane events. A series of chi-squared tests of independence were performed to examine the relationship between proximity to supply business and tweeting frequency during the hurricane relative to all tweets posted. Related POIs were extracted for each region from OpenStreetMap (OSM) and included food stores (supermarkets, grocery stores), home improvement retailers, and gas stations. The total number of POIs identified for this purpose were 106 for Houston, 134 for Miami-Dade, and 138 for North/South Carolina analyzed regions, respectively.
At least one significant association was found for each analyzed region. More specifically, a chi-squared test of independence for Houston showed that areas around gas stations were less likely to be tweeted from during than before and after the hurricane (χ2 (1) = 23.26, p < 0.001). Results also showed for Miami-Dade (χ2 (1) = 12.1, p < 0.001) and North/South Carolina (χ2 (1) = 4.97, p = 0.026) that areas around home improvement retail stores were less likely to be tweeted from during than before and after the hurricane. Furthermore, a chi-squared test of independence for Miami-Dade County showed that areas around food stores were less likely to be tweeted from during than before and after the hurricane (χ2 (1) = 5.00, p = 0.025).
4.4. Hashtags Use
For each analyzed area, the ten most frequently used hashtags two weeks before, during, and two weeks after the event were extracted and reported in Table 4, where hurricane-related hashtags are underlined. For Hurricane Harvey, hashtags related to the event represent the majority of the top ten hashtags during the hurricane, including hashtags, such as #hurricaneharvey and #prayforhouston. No event-related hashtags occurred in the top ten list before and after the event.
During Hurricane Matthew, two event-related hashtags (#hurricanematthew, #matthew) were found among the top ten hashtags in Miami-Dade County, but none before and after. These two hashtags and another event-related hashtags (#HurricaneMatthew) also occurred in the top ten hashtags during the same hurricane in North and South Carolina, where, again, no hurricane-related hashtags were found among the top ten before and after the event. This hashtag frequency count suggests that the Twitter community was concerned about the hurricane in each of the analyzed regions, which most likely contributed also to the observed changes in travel behavior during the events.
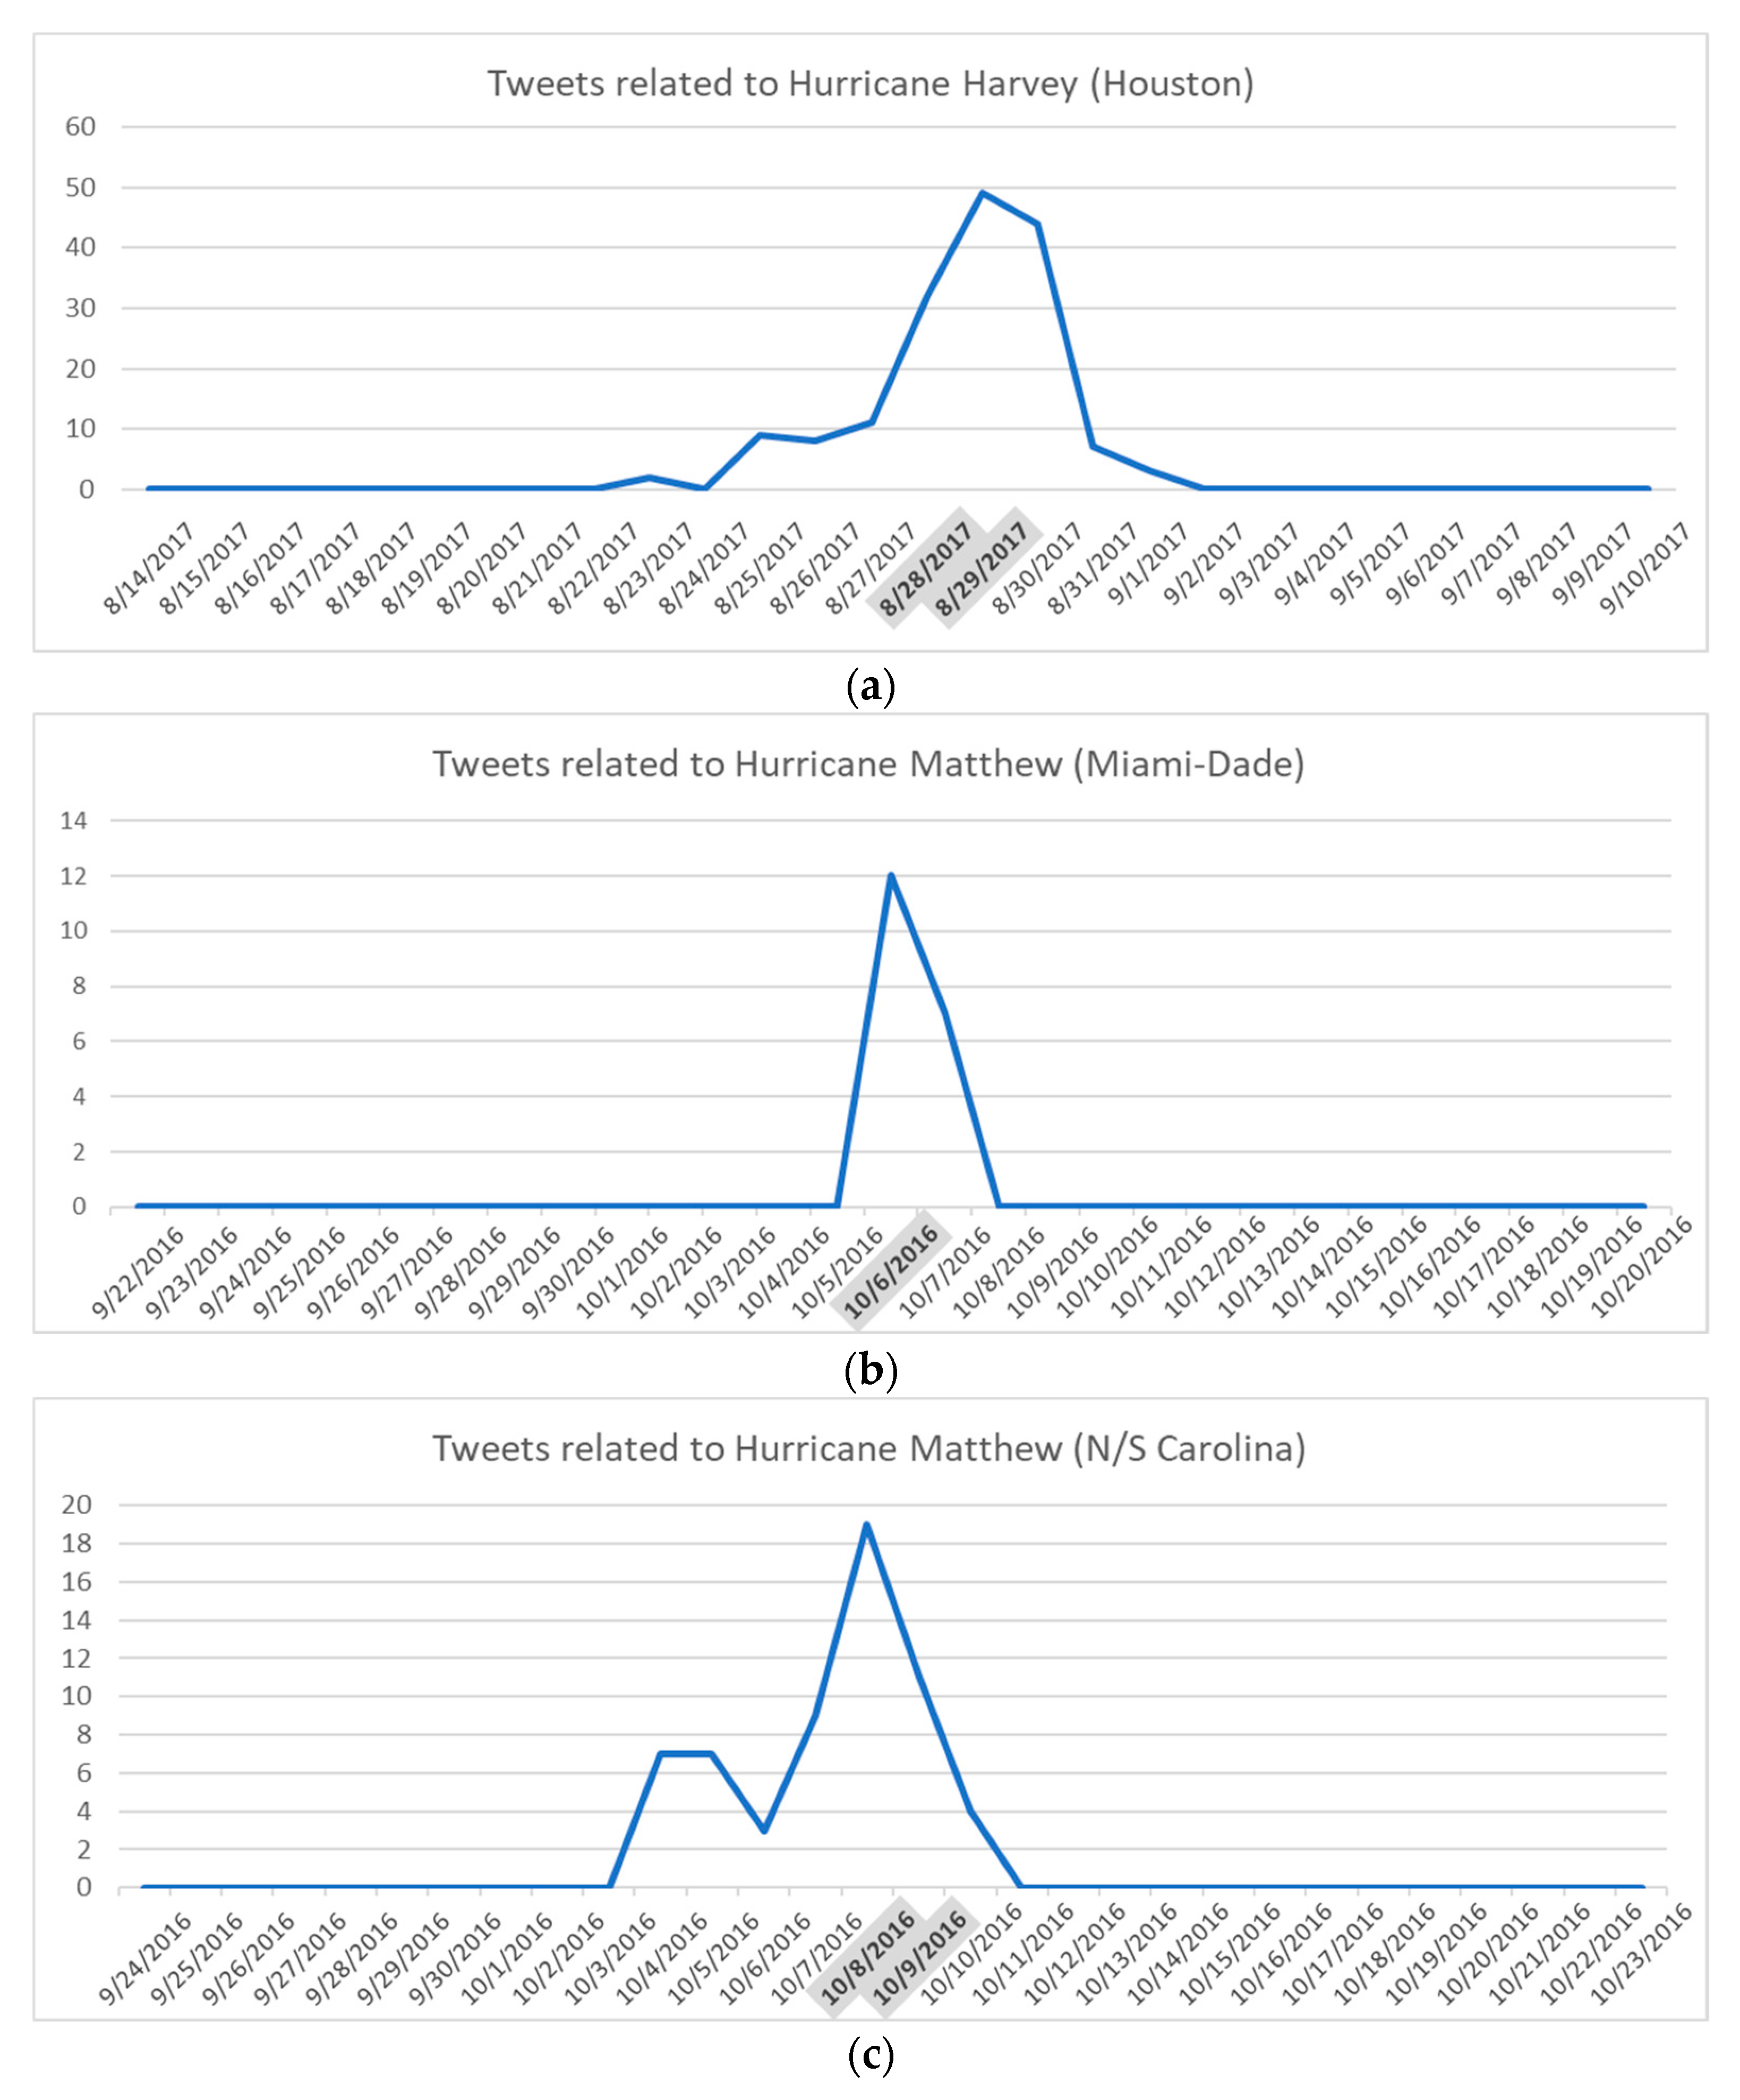
Figure 11 plots the daily number of tweets with hurricane related hashtags for the three study regions around two weeks of each hurricane landfall. As has been demonstrated for other hurricanes [20,22], hurricane related tweets peak at landfall also for the three analyzed areas. Despite this commonality, the frequency plots reveal some difference between the analyzed regions. As opposed to the Miami-Dade County study area (Hurricane Matthew) (Figure 11b), the Houston (Figure 11a) and North/South Carolina area (Figure 11c) show hurricane-related tweets up to five days before the landfall. These fall therefore into the preparedness phase [22]. In addition to this, tweets posted after landfall for Hurricane Harvey suggest that they relate to the impact and recovery stage. The two peaks found in North/South Carolina can potentially be attributed to the evacuation order on 4 October 2016 (local peak) and landfall on 8 October 2016 (global peak) [11], which gives a distinct pattern compared to the other two study areas in Houston and Miami-Dade with only one distinct peak. The latter could be explained by the fact that no evacuation orders were given for Houston [52], and that no mandatory but only selected voluntary evacuations were conducted for Miami-Dade County (e.g., for mobile homes or low-lying areas) [53]. Despite differences between the regions, all frequency plots suggest that the Twitter user community dropped this topic soon after the hurricane events.
The analysis reveals a potential association between the use of crisis-related hashtags and travel disruption in an affected area during such an event, which could support transport and rescue planning efforts and operations through hashtag analysis. At this point, this observed relationship is only of an exploratory nature and needs, therefore, to be assessed statistically with a larger sample, possibly from other events in the future. In this presented study hurricane-related hashtags for the Miami-Dade study area do occur only on the 9th and 10th rank (Table 4), whereas they appear on the 2nd and 1st rank for the Houston and North/South Carolina regions, respectively. At the same time, the Miami-Dade areas experienced relatively moderate disturbances on the radius of gyration and MSD compared to the other two study areas (compare Table 3 and Figure 8), and apparently also fewer disruptions in the road network (see next section). Hence, this could imply a relationship between the severity of travel disruptions and the use of hurricane related hashtag in the analyzed area.
5. Concluding Discussion and Future Work
This study used the steadily growing amount of spatio-temporal information that becomes available on social media portals to track and analyze people’s mobility [54].
In response to the first two posed objectives of this research, the results showed for three analyzed study regions that (1) displacements become shorter and areas of activity become smaller during hurricanes and that (2) the distribution of displacements can be well approximated by power-law models. The latter finding demonstrates that the Lévy walk model closely resembles human mobility patterns even during hurricane events.
Our results complement those from previous studies and they also have implications on decision making and logistics in disaster management. Previous studies already examined the change of human mobility in natural disaster events [17,18]. For example, analysis of fifteen destructive cases across five types of natural disasters showed that daily displacement data fits with the power-law distribution better than the exponential distribution [18]. Our model results complement these findings by showing that the truncated power-law in two of the three analyzed regions significantly outperforms the power-law during, before, and after hurricanes. It also demonstrates that the truncated power-law model applies both to metropolitan areas (Houston, Miami-Dade) and mixed population density areas including rural settings (North and South Carolina). Furthermore, our study confirms the persistence of the Lévy walk model for two additional hurricanes (Harvey, Matthew) not previously analyzed in this aspect. As an implication for future research, this suggests that the Lévy walk model (i.e., the truncated power-law) should be used as a baseline model for human mobility analyses when modeling or simulating more complex movement patterns in natural disaster scenarios (e.g., through the integration of obstacles or barriers in the street network) [55]. The similarity of movement patterns in urban and rural settings in response to hurricanes is also supported through similar changes (i.e., a reduction) in the mean squared displacement (MSD), suggesting a smaller activity space during such events. To the best of our knowledge, the MSD has not yet been analyzed in the context of natural disasters, specifically hurricanes, before. Instead it has been mainly used for the analysis of Global Positioning System (GPS) user traces in different non-disaster related settings. The analysis of movement patterns in a theme park in Orlando, FL, for example, showed that the MSD increased in the afternoon when visitors tended to move faster between the attractions to make the best use of the time before the park closed [56].
The observed reduced mobility during hurricanes could be due to different reasons, such as resident safety concerns, closed stores, or flooded streets. Our study revealed a relative reduction in Twitter activities around supply facilities (food stores, home improvement retailers, gas stations) compared to tweets posted from other locations. This means that, on average, residents do not access supply businesses during hurricanes at the rate they usually do. Since no increased social media activities were observed around these facilities before the hurricane event, this could suggest that the population is not necessarily well prepared for the event in terms of supplies (food, sand bags, other structural and building materials). For practical planning purposes of governmental and rescue organizations, this could imply that a dense network of (ad-hoc) emergency facilities and operations, such as supply distribution sites, positioning of rescue teams, or shelters in affected areas for the local population in need will help to reach the desired effect of support more effectively.
The possibility that flooded streets contribute to the observed reduction in travel distances is supported by a long list of flooded and/or closed roads and bridge closures reported in the affected regions during the hurricanes that were analyzed. Table 5 lists the number of road-related infrastructure closures around the hurricane events for the Houston (Hurricane Harvey), South Carolina, and North Carolina (Hurricane Matthew) regions. In addition, the partial impact of Hurricane Matthew on the transportation infrastructure in Miami-Dade County becomes evident through the reported lock down of all draw bridges in Miami-Dade County [57], although, as shown before, that area experienced less precipitation than the other analyzed regions.
The novel findings discovered aside, the analysis in this study is limited in several ways. For example, the Twitter user community evolves around people that use smart phones or other mobile devices for their networking activities. Furthermore, Twitter users represent a spectrum of the population that has a certain socio-demographic background [36]. Also, the low percentage (around 1–2%) of geo-tagged tweets among all tweets strongly limits the number of tweets that remains available for spatial analysis. This renders certain statistical tests on spatial movement patterns non-significant (possibly due to a low power of the test), or spatio-temporal modeling approaches inapplicable due to little data variation between users or across different days. For example, we fit re-visitation patterns before, during, and after hurricane events in the different analysis regions to known re-visitation patterns, such as Zipf’s law, which was earlier confirmed for cell phone tracking data [19]. However, the small number of re-locations per user on different days in our dataset rendered this approach unsuccessful. In addition to the low percentage of geo-tagged tweets, Twitter recently removed the feature to tag the precise location in regular text posts and instead limited precise location tagging to an updated camera function moving forward [61]. However, limiting precise geotagging to images and videos will further reduce the number of available tweets with a precise location since only a small percentage of tweets (around 1–2%) contain multi-media content [62]. A possible approach to somewhat mitigate this problem could be to apply creative methods for estimating the tweet location based on tags or visual clues, as has been performed for other multi-media sources [63].
Considering the current and potential future limitations in accessing tweets with precise location information, cell phone data, due to their abundance, may offer more effective means for tracking people’s movement for the purpose of disaster management and decision-making in the immediate aftermath of disasters [64,65]. However, although cell phone data typically provide a higher temporal resolution of visited locations than tweets, which allows, for example, a more detailed identification of the type of places visited (home, work, social activities) before, during, and after natural crises [66], such cell phone-based studies are difficult to replicate since cell phone data are notoriously difficult to obtain from cell phone providers. This becomes even more challenging when aiming for cross-border displacement analyses. The results of the Twitter analysis presented in this study, which are, admittedly, quite general (i.e., smaller activity space and fewer supply POIs visited during hurricane, displacement following truncated power-law) than various cell phone-based studies, could, however, be replicated for many other events and regions due to the availability of Twitter data across many parts of the globe [67].
For future work, we aim to extend the analysis to other geographic regions, to examine other types of natural crises (e.g., earthquakes, floods, and fires), and to explore other aspects of mobility that may be affected by such catastrophic events, such as the directionality of trips or the frequency of in- and out-flights to and from affected regions. Additional crowd-sourced data such as photo and video sharing platforms (Flickr, Instagram, Snapchat) will be considered for refined mobility and trajectory extraction and analyses. Also, other spatial data sets from industry or citizens capturing the extent of a natural disaster event, which includes hurricane-related insurance claims [68] or crowd-sourced flood reports [69], can be used to further explore the relationship between the severity of hurricanes and changes in mobility patterns in urban neighborhoods.
Author Contributions
Statistical analysis, original draft preparation, and editing, A.A.; writing—review and editing, H.H.H.; data collection and review, S.C.
Funding
This research received no external funding.
Conflicts of Interest
The authors declare no conflicts of interest.
References
- Li, W.; Airriess, C.A.; Chen, A.C.-C.; Leong, K.J.; Keith, V. Katrina and migration: Evacuation and return by African Americans and Vietnamese Americans in an eastern New Orleans suburb. Prof. Geogr. 2010, 62, 103–118. [Google Scholar] [CrossRef]
- Coussens, C.; Goldman, L. Environmental Public Health Impacts of Disasters: Hurricane Katrina: Workshop Summary; National Academies Press: Washington, DC, USA, 2007. [Google Scholar]
- Wikipedia. Hurricane Matthew. Available online: https://en.wikipedia.org/wiki/Hurricane_Matthew (accessed on 19 July 2019).
- Wikipedia. Hurricane Harvey. Available online: https://en.wikipedia.org/wiki/Hurricane_Harvey (accessed on 19 July 2019).
- Steiger, E.; de Albuquerque, J.P.; Zipf, A. An Advanced Systematic Literature Review on Spatiotemporal Analyses of Twitter Data. Trans. GIS 2015, 19, 809–834. [Google Scholar] [CrossRef]
- Shelton, T.; Poorthuis, A.; Graham, M.; Zook, M. Mapping the data shadows of Hurricane Sandy: Uncovering the sociospatial dimensions of ‘big data’. Geoforum 2014, 52, 167–179. [Google Scholar] [CrossRef]
- Wang, Z.; Ye, X.; Tsou, M.-H. Spatial, temporal, and content analysis of Twitter for wildfire hazards. Nat. Hazards 2016, 83, 523–540. [Google Scholar] [CrossRef]
- Herfort, B.; de Albuquerque, J.P.; Schelhorn, S.-J.; Zipf, A. Exploring the Geographical Relations Between Social Media and Flood Phenomena to Improve Situational Awareness. In Connecting a Digital Europe through Location and Place; Huerta, J., Schade, S., Granell, C., Eds.; Lecture Notes in Geoinformation and Cartography; Springer: Cham, Switzerland, 2014; pp. 55–71. [Google Scholar]
- De Albuquerque, J.P.; Herfort, B.; Brenning, A.; Zipf, A. A geographic approach for combining social media and authoritative data towards identifying useful information for disaster management. Int. J. Geogr. Inf. Sci. 2015, 29, 667–689. [Google Scholar] [CrossRef] [Green Version]
- Han, S.Y.; Tsou, M.-H.; Knaap, E.; Rey, S.; Cao, G. How Do Cities Flow in an Emergency? Tracing Human Mobility Patterns during a Natural Disaster with Big Data and Geospatial Data Science. Urban Sci. 2019, 3, 51. [Google Scholar] [CrossRef]
- Martín, Y.; Li, Z.; Cutter, S.L. Leveraging Twitter to gauge evacuation compliance: Spatiotemporal analysis of Hurricane Matthew. PLoS ONE 2017, 12, e0181701. [Google Scholar] [CrossRef] [PubMed]
- Hübl, F.; Cvetojevic, S.; Hochmair, H.H.; Paulus, G. Analyzing refugee migration patterns using geo-tagged tweets. ISPRS Int. J. Geo-Inf. 2017, 6, 302. [Google Scholar] [CrossRef]
- Barbosa, H.; Barthelemy, M.; Ghoshal, G.; James, C.R.; Lenormand, M.; Louail, T.; Menezes, R.; Ramasco, J.J.; Simini, F.; Tomasini, M. Human mobility: Models and applications. Phys. Rep. 2018, 734, 1–74. [Google Scholar] [CrossRef] [Green Version]
- Rhee, I.; Shin, M.; Hong, S.; Lee, K.; Kim, S.J.; Chong, S. On the levy-walk nature of human mobility. IEEE/ACM Trans. Netw. 2011, 19, 630–643. [Google Scholar] [CrossRef]
- Bagrow, J.P.; Wang, D.; Barabasi, A.-L. Collective response of human populations to large-scale emergencies. PLoS ONE 2011, 6, e17680. [Google Scholar] [CrossRef] [PubMed]
- Gray, C.L.; Mueller, V. Natural disasters and population mobility in Bangladesh. Proc. Natl. Acad. Sci. USA 2012, 109, 6000–6005. [Google Scholar] [CrossRef] [PubMed] [Green Version]
- Wang, Q.; Taylor, J.E. Quantifying and Comparing Human Mobility Perturbation during Hurricane Sandy, Typhoon Wipha and Typhoon Haiyan. Procedia Econ. Financ. 2014, 18, 33–38. [Google Scholar]
- Wang, Q.; Taylor, J.E. Patterns and limitations of urban human mobility resilience under the influence of multiple types of natural disaster. PLoS ONE 2016, 11, e0147299. [Google Scholar] [CrossRef] [PubMed]
- Gonzalez, M.C.; Hidalgo, C.A.; Barabasi, A.-L. Understanding individual human mobility patterns. Nature 2008, 453, 779–782. [Google Scholar] [CrossRef] [PubMed]
- David, C.C.; Ong, J.C.; Legara, E.F.T. Tweeting Supertyphoon Haiyan: Evolving Functions of Twitter during and after a Disaster Event. PLoS ONE 2016, 11, e0150190. [Google Scholar] [CrossRef] [PubMed]
- Meier, P. Digital Humanitarians: How Big Data Is Changing the Face of Humanitarian Response; CRC Press: Boca Raton, FL, USA, 2015. [Google Scholar]
- Huang, Q.; Xiao, Y. Geographic Situational Awareness: Mining Tweets for Disaster Preparedness, Emergency Response, Impact, and Recovery. ISPRS Int. J. Geo-Inf. 2015, 4, 1549–1568. [Google Scholar] [CrossRef] [Green Version]
- Cvetojevic, S.; Hochmair, H.H. Analyzing the spread of tweets in response to Paris attacks. Comput. Environ. Urban Syst. 2018, 71, 14–26. [Google Scholar] [CrossRef]
- Bruns, A.; Burgess, J.E. Local and Global Responses to Disaster: #Eqnz and the Christchurch Earthquake. In Proceedings of the Disaster and Emergency Management Conference, Brisbane, Australia, 16–18 April 2012. [Google Scholar]
- Resch, B.; Usländer, F.; Havas, C. Combining machine-learning topic models and spatiotemporal analysis of social media data for disaster footprint and damage assessment. Cartogr. Geogr. Inf. Sci. 2018, 45, 362–376. [Google Scholar] [CrossRef]
- Murzintcev, N.; Cheng, C. Disaster Hashtags in Social Media. ISPRS Int. J. Geo-Inf. 2017, 6, 204. [Google Scholar] [CrossRef]
- Lazer, D.M.J.; Baum, M.A.; Benkler, Y.; Berinsky, A.J.; Greenhill, K.M.; Menczer, F.; Metzger, M.J.; Nyhan, B.; Pennycook, G.; Rothschild, D.; et al. The science of fake news. Science 2018, 359, 1094–1096. [Google Scholar] [CrossRef]
- Cvetojevic, S.; Juhász, L.; Hochmair, H.H. Positional Accuracy of Twitter and Instagram Images in Urban Environments. GI_Forum 2016, 1, 191–203. [Google Scholar] [CrossRef]
- Duggan, M.; Ellison, N.B.; Lampe, C.; Lenhart, A.; Madden, M. Social Media Update 2014. Available online: https://www.pewinternet.org/2015/01/09/social-media-update-2014/ (accessed on 19 July 2019).
- Hawelka, B.; Sitkoa, I.; Beinat, E.; Sobolevsky, S.; Kazakopoulos, P.; Ratti, C. Geo-located Twitter as proxy for global mobility patterns. Cartogr. Geogr. Inf. Sci. 2014, 41, 260–271. [Google Scholar] [CrossRef] [Green Version]
- Azmandian, M.; Singh, K.; Gelsey, B.; Chang, Y.-H.; Maheswaran, R. Following Human Mobility Using Tweets. In Agents and Data Mining Interaction; Cao, L., Zeng, Y., Symeonidis, A.L., Gorodetsky, V.I., Yu, P.S., Singh, M.P., Eds.; Springer: Berlin/Heidelberg, Germany, 2013; Volume 7607, pp. 139–149. [Google Scholar]
- Vosoughi, S.; Roy, D.; Aral, S. The spread of true and false news online. Science 2018, 359, 1146–1151. [Google Scholar] [CrossRef]
- Zhang, C.M.; Paxson, V. Detecting and Analyzing Automated Activity on Twitter. In Passive and Active Measurement. PAM 2011; Spring, N., Riley, G., Eds.; Springer: Berlin, Germany, 2011; Volume 6579, pp. 102–111. [Google Scholar]
- Guo, D.; Chen, C. Detecting Non-personal and Spam Users on Geo-tagged Twitter Network. Trans. GIS 2014, 18, 370–384. [Google Scholar] [CrossRef]
- Davis, C.A.; Varol, O.; Ferrara, E.; Flammini, A.; Menczer, F. BotOrNot: A System to Evaluate Social Bots. In Proceedings of the 25th International Conference Companion on World Wide Web, Montréal, QC, Canada, 11–15 April 2016; ACM: New York, NY, USA; pp. 273–274. [Google Scholar]
- Li, L.; Goodchild, M.F.; Xu, B. Spatial, temporal, and socioeconomic patterns in the use of Twitter and Flickr. Cartogr. Geogr. Inf. Sci. 2013, 40, 61–77. [Google Scholar] [CrossRef]
- Graham, M.; Hale, S.A.; Gaffney, D. Where in the World Are You? Geolocation and Language Identification in Twitter. Prof. Geogr. 2014, 66, 568–578. [Google Scholar] [CrossRef] [Green Version]
- Cheng, Z.; Caverlee, J.; Lee, K. You Are Where You Tweet: A Content-Based Approach to Geo-Locating Twitter Users. In Proceedings of the 19th ACM International Conference on Information and Knowledge Management (CIKM), Toronto, ON, Canada, 26–30 October 2010; ACM: New York, NY, USA; pp. 759–768. [Google Scholar]
- Jurgens, D. That’s What Friends Are For: Inferring Location in Online Social Media Platforms Based on Social Relationships. In Proceedings of the Seventh International AAAI Conference on Weblogs and Social Media, Boston, MA, USA, 28 June 2013; pp. 273–282. [Google Scholar]
- United States Geological Survey (USGS). Hurricane Harvey. Available online: https://www.usgs.gov/special-topic/hurricane-harvey (accessed on 19 July 2019).
- United States Geological Survey (USGS). Hurricane Matthew: Flood Resources and Tools. Available online: https://water.usgs.gov/floods/events/2016/matthew (accessed on 19 July 2019).
- Tweepy. An Easy-to-Use Python Library for Accessing the Twitter API. Available online: http://www.tweepy.org/ (accessed on 19 July 2019).
- Chopde, N.R.; Nichat, M. Landmark based shortest path detection by using A* and Haversine formula. Int. J. Innov. Res. Comput. Commun. Eng. 2013, 1, 298–302. [Google Scholar]
- Clauset, A.; Shalizi, C.R.; Newman, M.E. Power-law distributions in empirical data. SIAM Rev. 2009, 51, 661–703. [Google Scholar] [CrossRef]
- Jurdak, R.; Zhao, K.; Liu, J.; AbouJaoude, M.; Cameron, M.; Newth, D. Understanding human mobility from Twitter. PLoS ONE 2015, 10, e0131469. [Google Scholar] [CrossRef]
- Song, C.; Koren, T.; Wang, P.; Barabási, A.-L. Modelling the scaling properties of human mobility. Nat. Phys. 2010, 6, 818–823. [Google Scholar] [CrossRef] [Green Version]
- National Weather Service. Advanced Hydrologic Prediction Service. Available online: https://water.weather.gov/precip/download.php (accessed on 19 July 2019).
- FOX26. Harvey-Related Business Closures. Available online: http://www.fox26houston.com/news/hurricane-harvey-business-closures (accessed on 19 July 2019).
- WSVN. What’s Open and Closed in South Florida Due to Hurricane Matthew. Available online: https://wsvn.com/news/local/closures-updates-ahead-of-hurricane-matthew-2/ (accessed on 19 July 2019).
- The State. Closings, Cancellations, Postponements Due to Hurricane Matthew. Available online: https://www.thestate.com/news/local/article105941492.html (accessed on 19 July 2019).
- Live 5 News. LOOK HERE: Closings and Cancellations Related to Hurricane Matthew. Available online: https://www.live5news.com/story/33314320/look-here-closings-and-cancellations-related-to-hurricane-matthew/ (accessed on 19 July 2019).
- CNN. Houston Knew It Was at Risk of Flooding, So Why didn’t the City Evacuate? Available online: https://www.cnn.com/2017/08/27/us/houston-evacuation-hurricane-harvey/index.html (accessed on 19 July 2019).
- CBSMiami. Evacuation Orders Throughout Florida. Available online: https://miami.cbslocal.com/2016/10/06/evacuation-orders-throughout-florida/ (accessed on 19 July 2019).
- Lenormand, M.; Gonçalves, B.; Tugores, A.; Ramasco, J.J. Human diffusion and city influence. J. R. Soc. Interface 2015, 12. [Google Scholar] [CrossRef]
- Akpoyibo, S.E.; Narayanan, R.G.L.; Ibe, O.C. Lévy walk models of survivor movement in disaster areas with barriers. Int. J. Comput. Netw. Commun. 2014, 6, 1. [Google Scholar] [CrossRef]
- Vukadinovic, V.; Mangold, S. Opportunistic wireless communication in theme parks: A study of visitors mobility. In Proceedings of the 6th ACM Workshop on Challenged Networks, Las Vegas, NV, USA, 23 September 2011; ACM: New York, NY, USA; pp. 3–8. [Google Scholar]
- NEWSTALK. Hurricane Matthew: Scott Suspends Tolls, Road Closures. Available online: https://www.newstalkflorida.com/featured/hurricane-matthew-suspends-tolls/ (accessed on 19 July 2019).
- Chron. These Are the Roads That Are Closed in Houston Due to Hurricane Harvey. Available online: https://www.chron.com/news/houston-weather/hurricaneharvey/article/These-are-the-roads-that-are-closed-in-Houston-12003482.php#photo-14029257 (accessed on 19 July 2019).
- HoustonPublicMedia. Latest Road Closures and Conditions for the Houston Area. Available online: https://www.houstonpublicmedia.org/articles/news/2017/09/01/234670/list-of-road-closures-and-driving-conditions-friday/ (accessed on 19 July 2019).
- Benfield, A. Hurricane Matthew Event Recap Report. Available online: http://thoughtleadership.aonbenfield.com/Documents/20170424-ab-if-hurricane-matthew-recap.pdf (accessed on 19 July 2019).
- Twitter. Removing Precise Location in Tweets. Available online: https://twitter.com/TwitterSupport/status/1141039841993355264 (accessed on 19 July 2019).
- Juhász, L.; Hochmair, H.H. Comparing the Spatial and Temporal Activity Patterns between Snapchat, Twitter, and Flickr in Florida. GI_Forum 2019, 1. [Google Scholar] [CrossRef]
- Friedland, G.; Choi, J.; Lei, H.; Janin, A. Multimodal location estimation on Flickr videos. In Proceedings of the 3rd ACM SIGMM International Workshop on Social Media, Scottsdale, AZ, USA, 30 November 2011; ACM: New York, NY, USA; pp. 23–28. [Google Scholar]
- Bengtsson, L.; Lu, X.; Thorson, A.; Garfield, R.; Von Schreeb, J. Improved response to disasters and outbreaks by tracking population movements with mobile phone network data: A post-earthquake geospatial study in Haiti. PLoS Med. 2011, 8, e1001083. [Google Scholar] [CrossRef]
- Gething, P.W.; Tatem, A.J. Can mobile phone data improve emergency response to natural disasters? PLoS Med. 2011, 8, e1001085. [Google Scholar] [CrossRef]
- Song, X.; Zhang, Q.; Sekimoto, Y.; Shibasaki, R. Prediction of Human Emergency Behavior and their Mobility Following Large-Scale Disaster. In Proceedings of the 20th ACM SIGKDD International Conference on Knowledge Discovery and Data Mining, New York, NY, USA, 24–27 August 2014; ACM: New York, NY, USA, 2014; pp. 5–14. [Google Scholar]
- Hochmair, H.H.; Juhász, L.; Cvetojevic, S. Data Quality of Points of Interest in Selected Mapping and Social Media Platforms. In Proceedings of the LBS 2018: 14th International Conference on Location Based Services, Zurich, Switzerland, 15–17 January 2018; Springer: Cham, Switzerland, 2018; pp. 293–313. [Google Scholar]
- Kesete, Y.; Peng, J.; Gao, Y.; Shan, X.; Davidson, R.A.; Nozick, L.K.; Kruse, J. Modeling insurer-homeowner interactions in managing natural disaster risk. Risk Anal. 2014, 34, 1040–1055. [Google Scholar] [CrossRef]
- Sadler, J.; Goodall, J.; Morsy, M.; Spencer, K. Modeling urban coastal flood severity from crowd-sourced flood reports using Poisson regression and Random Forest. J. Hydrol. 2018, 559, 43–55. [Google Scholar] [CrossRef]
Figure 1.
Areas affected by Hurricane Harvey in Houston (a), and by Hurricane Matthew in Miami-Dade County (b), and North and South Carolina (c).
Figure 1.
Areas affected by Hurricane Harvey in Houston (a), and by Hurricane Matthew in Miami-Dade County (b), and North and South Carolina (c).

Figure 2.
Number of daily Twitter users and posted geo-tagged tweets in the analysis areas for Hurricane Harvey (Houston) (a), Hurricane Matthew (Miami-Dade) (b), and Hurricane Mathew (North/South Carolina) (c). Hurricane dates are highlighted in gray.
Figure 2.
Number of daily Twitter users and posted geo-tagged tweets in the analysis areas for Hurricane Harvey (Houston) (a), Hurricane Matthew (Miami-Dade) (b), and Hurricane Mathew (North/South Carolina) (c). Hurricane dates are highlighted in gray.


Figure 3.
Distribution of trip counts for different distance bands within the Houston affected area before, during, and after Hurricane Harvey.
Figure 3.
Distribution of trip counts for different distance bands within the Houston affected area before, during, and after Hurricane Harvey.

Figure 4.
Daily displacements (distance offsets) around Hurricane Harvey.

Figure 5.
Power law (blue line and blue labels) and truncated power-law (red line and red labels) distribution models for displacement data within the Houston affected area before (a), during (b), and after (c) Hurricane Harvey.
Figure 5.
Power law (blue line and blue labels) and truncated power-law (red line and red labels) distribution models for displacement data within the Houston affected area before (a), during (b), and after (c) Hurricane Harvey.

Figure 6.
Distribution of trip counts for different distance bands within the Miami-Dade affected area before, during, and after Hurricane Matthew.
Figure 6.
Distribution of trip counts for different distance bands within the Miami-Dade affected area before, during, and after Hurricane Matthew.

Figure 7.
Distribution of trip counts for different distance bands within North and South Carolina affected areas before, during, and after Hurricane Matthew.
Figure 7.
Distribution of trip counts for different distance bands within North and South Carolina affected areas before, during, and after Hurricane Matthew.

Figure 8.
MSD for users before, during, and after Hurricane Harvey in Houston (a), and Hurricane Matthew in Miami-Dade County (b) and North and South Carolina (c).
Figure 8.
MSD for users before, during, and after Hurricane Harvey in Houston (a), and Hurricane Matthew in Miami-Dade County (b) and North and South Carolina (c).

Figure 9.
Daily mean and median radius of gyration values around Hurricane Harvey.

Figure 10.
Daily precipitation maps for Hurricane Matthew between 5 October 2016 and 9 October 2016 for the Miami-Dade (a–c) and North/South Carolina (d,e) areas, and Hurricane Matthew for the Houston area (f) on 28 August 2017.
Figure 10.
Daily precipitation maps for Hurricane Matthew between 5 October 2016 and 9 October 2016 for the Miami-Dade (a–c) and North/South Carolina (d,e) areas, and Hurricane Matthew for the Houston area (f) on 28 August 2017.

Figure 11.
Daily number of tweets with hurricane related hashtags for Hurricane Harvey (Houston) (a), Hurricane Matthew (Miami-Dade) (b), and Hurricane Mathew (North/South Carolina) (c). Hurricane dates are highlighted in gray.
Figure 11.
Daily number of tweets with hurricane related hashtags for Hurricane Harvey (Houston) (a), Hurricane Matthew (Miami-Dade) (b), and Hurricane Mathew (North/South Carolina) (c). Hurricane dates are highlighted in gray.


Table 1.
Number of tweets with their associated user numbers used for displacement analysis (user filter applied), and radius of gyration and mean squared displacement (MSD) analysis (user filter not applied).
Table 1.
Number of tweets with their associated user numbers used for displacement analysis (user filter applied), and radius of gyration and mean squared displacement (MSD) analysis (user filter not applied).
| Hurricane | Period | User Filter Applied | User Filter Not Applied | ||
|---|---|---|---|---|---|
| # Users | # Tweets | # Users | # Tweets | ||
| Harvey (Houston) | 14 August 2017–19 September 2017 | 75 | 13,980 | 8601 | 34,294 |
| Matthew (Miami-Dade) | 22 September 2016–20 October 2016 | 69 | 13,555 | 11,407 | 55,122 |
| Matthew (N/S Carolina) | 24 September 2016–23 October 2016 | 49 | 4436 | 8582 | 29,432 |
Table 2.
Mean and median (km) displacements before, during, and after the hurricanes with significance levels for differences between distance medians.
Table 2.
Mean and median (km) displacements before, during, and after the hurricanes with significance levels for differences between distance medians.
| Period | Houston | Miami-Dade | North and South Carolina | ||||||
|---|---|---|---|---|---|---|---|---|---|
| Mean | Median | p-Value | Mean | Median | p-Value | Mean | Median | p-Value | |
| Before | 16 | 10 | 0.005 | 7 | 4 | 0.019 | 17 | 5 | 0.124 |
| During | 11 | 5 | - | 5 | 2 | - | 11 | 3 | - |
| After | 17 | 9 | 0.025 | 9 | 6 | <0.001 | 24 | 5 | 0.021 |
Table 3.
Mean and median (km) of the radius of gyration for users before, during, and after the hurricanes with significance levels for differences between medians.
Table 3.
Mean and median (km) of the radius of gyration for users before, during, and after the hurricanes with significance levels for differences between medians.
| Period | Houston | Miami-Dade | North and South Carolina | ||||||
|---|---|---|---|---|---|---|---|---|---|
| Mean | Median | p-Value | Mean | Median | p-Value | Mean | Median | p-Value | |
| Before | 11.1 | 8.6 | 0.015 | 5.9 | 4.7 | 0.064 | 10.2 | 2.9 | 0.045 |
| During | 6.64 | 1.9 | - | 3.9 | 3.6 | - | 2.2 | 1.3 | - |
| After | 12.6 | 11.3 | 0.005 | 4.0 | 3.1 | 0.281 | 16.9 | 3.2 | 0.093 |
Table 4.
Top ten Twitter hashtags before, during, and after the analyzed hurricanes. Hurricane related hashtags are underlined and corresponding hashtag counts shown in boldface.
Table 4.
Top ten Twitter hashtags before, during, and after the analyzed hurricanes. Hurricane related hashtags are underlined and corresponding hashtag counts shown in boldface.
| Hurricane/Study Area | Before | During | After | |||
|---|---|---|---|---|---|---|
| Hashtag | Freq. | Hashtag | Freq. | Hashtag | Freq. | |
| Harvey/Houston | ireallybreakmusic | 16 | Repost | 129 | GloryFitness | 28 |
| Repost | 16 | hurricaneharvey | 23 | ireallybreakmusic | 24 | |
| Mp3waxx | 14 | prayforhouston | 18 | Repost | 21 | |
| GloryFitness | 6 | houston | 9 | fitnessmotivation | 19 | |
| houston | 6 | houstonstrong | 8 | MP3Waxx | 19 | |
| realtor | 4 | texas | 7 | fitnessmodel | 18 | |
| Houston | 4 | hurricane | 7 | breakfast | 10 | |
| fitnessmodel | 4 | HurricaneHarvey | 5 | FollowTheSmell | 6 | |
| jessegreene | 4 | Hurricaneharvey | 4 | ClientMelissaE | 6 | |
| fitnessmotivation | 4 | prayfortexas | 4 | Houston | 5 | |
| Matthew/Miami-Dade County | southbeach | 9 | miamibeach | 14 | Take1TakeOver | 33 |
| miamibeach | 9 | miami | 11 | miami | 8 | |
| beachlife | 9 | beachlife | 10 | BarackObama | 5 | |
| southbeachlocal | 9 | southbeachlocal | 10 | TagsForLikes | 5 | |
| usa | 8 | southbeach | 10 | ingodwetrust | 5 | |
| tropical | 8 | beachvolleyball | 8 | weedvision | 5 | |
| beachvolleyball | 8 | tropical | 7 | daytrader | 5 | |
| palmtrees | 6 | nature_perfection | 6 | ironteam | 5 | |
| Miami | 6 | hurricanematthew | 6 | fuck925 | 5 | |
| fitness | 6 | matthew | 6 | StrongerTogether | 5 | |
| Matthew/North and South Carolina | nofilter | 4 | hurricanematthew | 21 | fccstudentministry | 4 |
| beachlife | 3 | HurricaneMatthew | 5 | tunarun2016 | 3 | |
| uncw | 3 | surfcity | 4 | wilmingtonnc | 3 | |
| sundaymorningservice | 3 | northcarolina | 4 | bleachmyfilm | 3 | |
| goodmorning | 3 | matthew | 4 | kurebeach | 2 | |
| knottsisland | 3 | surfcitync | 3 | TheMatrimony | 2 | |
| sunrise | 3 | OnePiece | 2 | wilmington | 2 | |
| Legend | 2 | charleston | 2 | outerbanks | 2 | |
| thankyou | 2 | h2ography | 2 | Chicago | 2 | |
| freedomthinkers | 2 | topsailisland | 2 | PoeticJustice | 2 | |
© 2019 by the authors. Licensee MDPI, Basel, Switzerland. This article is an open access article distributed under the terms and conditions of the Creative Commons Attribution (CC BY) license (http://creativecommons.org/licenses/by/4.0/).
Share and Cite
MDPI and ACS Style
Ahmouda, A.; Hochmair, H.H.; Cvetojevic, S. Using Twitter to Analyze the Effect of Hurricanes on Human Mobility Patterns. Urban Sci. 2019, 3, 87. https://0-doi-org.brum.beds.ac.uk/10.3390/urbansci3030087
AMA Style
Ahmouda A, Hochmair HH, Cvetojevic S. Using Twitter to Analyze the Effect of Hurricanes on Human Mobility Patterns. Urban Science. 2019; 3(3):87. https://0-doi-org.brum.beds.ac.uk/10.3390/urbansci3030087
Chicago/Turabian StyleAhmouda, Ahmed, Hartwig H. Hochmair, and Sreten Cvetojevic. 2019. "Using Twitter to Analyze the Effect of Hurricanes on Human Mobility Patterns" Urban Science 3, no. 3: 87. https://0-doi-org.brum.beds.ac.uk/10.3390/urbansci3030087