Using Multi-Sensory and Multi-Dimensional Immersive Virtual Reality in Participatory Planning


Department of Geography, Planning, and Sustainability, School of Earth and Environment, Rowan University, 201 Mullica Hill Road, Glassboro, NJ 08028, USA
*
Author to whom correspondence should be addressed.
Urban Sci. 2020, 4(3), 34; https://0-doi-org.brum.beds.ac.uk/10.3390/urbansci4030034
Submission received: 7 May 2020
/
Revised: 6 July 2020
/
Accepted: 13 July 2020
/
Published: 17 July 2020
(This article belongs to the Special Issue Technologies and Humanities for Smart Cities)
Abstract
:In the last two decades, urban planners have embraced digital technologies to complement traditional public participation processes; research on the impact of smarter digital instruments, such as immersive virtual reality (IVR), however, is scant. We recruited 40 focus group participants to explore various formats of spatial planning scenario simulations in Glassboro, NJ, USA. Our study finds that the level of participation, memory recalls of scenarios, and emotional responses to design proposals are higher with multi-sensory and multi-dimensional IVR simulations than with standard presentations such as 2D videos of 3D model simulations, coupled with verbal presentations. We also discuss the limitations of IVR technology to assist urban planning practitioners in evaluating its potential in their own participatory planning efforts.
1. Introduction
A range of urban planning practices in last two decades have embraced digital technologies (e.g., online surveys, blogs, social media, participatory GIS mapping, and Virtual Reality (VR)) to complement or enhance traditional public participation processes (e.g., surveys, focus groups, interviews, and meetings), and support different forms of e-governments and smart cities [1,2,3]. Smart digital instruments and 3D technologies, including Immersive Virtual Reality (IVR) and Augmented Reality (AR), can contribute to participatory spatial planning processes by simulating social interactions and complex environments [4,5]. Through participatory planning, the public can directly engage with decision-making and policy development processes. Since the late 20th century, urban planning in democratic societies has supported such public participation processes at varying levels, scales, and capacities [6,7]. Considered indispensable in the field of planning today, public participation and engagement are often required by governments and other entities [8,9]. Digital technologies offer planners opportunities to diversify and improve upon existing public participation paradigms; nevertheless, planners must critically evaluate the validity and legitimacy of these new processes [3,10].
Within this context, this paper seeks to understand the roles, benefits, and challenges of multi-sensory and multi-dimensional IVR technologies in participatory planning. Various forms of VR can be used as a useful tool in participatory spatial planning because it can advance our understanding [5,11,12,13], provide critical feedback [14], improve participation in planning events [15,16], enable people to experience a location without traveling there [17,18,19], and reach populations that are commonly disengaged in the planning process [20]. Research on the use of multi-sensory and multi-dimensional IVR, or 4D IVR, in planning, however, is limited.
In this study, we recruited four focus groups with 10 participants each to evaluate three digital presentations of a future planning scenario: a 2D video of a 3D simulation (no IVR), a 3D IVR simulation, and a multi-sensory 4D IVR simulation with auditory and olfactory cues. Three focus groups were assigned, respectively, to each of these three simulations. A fourth group experienced both a 2D video of a 3D simulation and a 4D IVR. The fictional planning scenario was based on a potential Arts and Entertainment District in the historic downtown of Glassboro, a small urban community in southern New Jersey, USA.
We start with a discussion on VR technology’s integration in the participatory planning process. We present our research questions and explain their rationale according to the existing literature. Next, we review the four phases of this study’s methodology: the development of a planning scenario, creation of IVR simulations, evaluation of these simulations using focus groups, and analysis of data and interpretation of results. A discussion of the ways in which 3D IVR and multi-sensory 4D IVR technology were useful, engaging, or challenging follows. Finally, we discuss the implications of our findings for urban planning professionals.
2. Integration of VR Technology in Participatory Planning Process
VR is defined as a way for humans to interact with computers and complex data [21]. A key component of VR is the degree to which the technology is immersive, engaging the mind and body of users through visuals, sound, and/or touch [22]. Studies have shown a variety of benefits associated with different forms of VR technology during the planning and design process, including: increased understanding of the project itself; additional opportunities for stakeholder feedback; increases in the volume, quality, and diversity of public participation; and the ability to offer an almost-real immersive environment by adding sensory stimuli to VR.
The utilization of VR has been demonstrated to improve the public’s understanding of projects in planning and related fields (e.g., architecture, urban design, and landscape architecture). This can be achieved by creating interdisciplinary 3D visual studies depicting future impacts (e.g., the effects of climate change) [16]. A study of eight urban public squares in Seoul, Korea, for example, demonstrated that IVR could overcome the limitations of existing studies, such as issues with viewing angles and visual distortions created by projecting 3D models onto 2D planes [23]. By mitigating such limitations, Portman et al. found that VR mutually benefits both stakeholders and planners in the form of better understanding and feedback, respectively [16]. In a study conducted in Ås, Norway, participants’ understanding of an architectural project was improved with VR presentation [11]. Other researchers, however, argue that such understanding may depend on the way in which participants are engaged with VR simulation. Based on a case study in Tokyo Bay Zone, Zhang et al. found that free user navigation in VR immediately after experiencing a scripted video was associated with higher levels of understanding relative to free navigation alone [13].
The addition of VR to the planning process in conjunction with Internet tools, GIS and smart city technologies allows for additional opportunities for public feedback. This can be explained by three research studies. Using a case study in Vilnius, Lithuania, Stauskis found that the use of VR and GIS data together could improve feedback access for all ages, but especially younger generations, reduce the amount of time residents need to get acquainted with a project, allow for greater transparency of the plans, and provide for a more efficient use of resources [20]. Boulos et al. also argued that a combination of VR and GIS technologies could provide more participatory and smarter urban planning [12]. Jamei et al. further explored these notions, considering VR as a form of information and communication technology (ICT) [5]. They argued that VR and ICT could assist urban planners in effectively visualizing big data, providing an interactive platform to further explore the potential for smart and sustainable cities. Communication with individuals who have diverse backgrounds is enhanced through VR, because this technology has the potential to break verbal and written communication barriers by completely immersing an individual in the design.
Integrating VR into the planning process has the potential to increase the overall quantity, quality, and diversity of participation. While the primary audience of most planning projects is middle or older age participants, VR attracts game-loving younger generations [16,20]. For example, through conducting three workshops in Austria, Schrom-Feiertag et al. found that VR and AR technologies were both easy to use and had high potential for reaching new target audiences [18]. In particular, web-based VR can improve participant access through eliminating the restrictions of traditional face-to-face meetings with a fixed place and time; this increased access has the effect of increasing participation from people with diverse backgrounds, experiences, and abilities [5,15,19].
Incorporating additional sensory stimuli to VR may create an almost-real immersive environment, fostering meaningful public participation. Jiang et al., for example, created an online VR simulation of Piazza Vittoria in Naples, Italy, and invited participants to examine urban sound environments [15]. Similarly, Sanchez et al. created a VR bridge crossing a highway in Ghent, Belgium, in order to determine how noise and visuals affected humans [14]. They concluded that while the visuals elicited more interaction with the participants than the sound dimensions, overall participants rated the experience of the VR environment as realistic and immersive. Maffei et al. recruited participants to compare the difference between experiencing a site in Naples, Italy, in a VR laboratory alongside an actual field visit, concluding that there was no major difference between the VR session and the field session because of the auditory stimuli used in VR [17]. These authors suggest that the virtual world can be used to draw conclusions about a physical site or place if the design is immersive.
While the strengths discussed above are noteworthy, it is also important to recognize the challenges of VR, including the time [12], cost [5,12], data availability and accuracy [5], and exclusion of older populations [18]. An additional limitation for web-based VR is a potential exclusion of participants without computers, who are unfamiliar with the technology, or have an inability to use a computer for long periods of time [19].
Based on this review, we conclude that the scholarship on IVR as a participatory planning tool is limited and still evolving. We have conducted this study for four primary reasons. First, most studies were small-scale with a limited number of participants (25–50) because of the nature of IVR technologies or laboratories and their engagement process (not applicable to web-based VR). More research, therefore, is needed—even if done at a similar scale to our study (40 participants)—to capture more data. Second, research on the application of multi-sensory 4D IVR in planning is rare. IVR simulations can discover ‘lost’ non-accessible spaces, simulate user behaviors, move from ‘conceptual’ to ‘concrete’ understanding, and facilitate emotional/all-encompassing viewing [16]. Multi-sensory stimuli can only increase these capabilities. The few examples we provided here, however, focused on only auditory stimuli. We have not found any VR-planning combination study that focused on olfactory stimuli. Third, most projects focused on only one specific site (e.g., a plaza, a street intersection, a station, or a building) and did not cover multiple city blocks. Finally, the weaknesses of these studies were rarely documented from the participants’ perspectives.
We addressed these gaps in the literature to understand the role of multi-sensory and multi-dimensional IVR technologies in participatory planning, as well as the difference between various forms or presentations of IVR as public participation tools, and acknowledge their strengths and limitations. Below, we present our four research questions and explain their rationale, supported by the existing literature.
Q1: Do multi-sensory and multi-dimensional IVR simulations increase public interaction? Research studies and real-world applications of IVR technologies in planning and public participation are limited. Additionally, only a handful of researchers are incorporating complex 4D multi-sensory variables of the environment, such as auditory and visual parameters, to create or enhance the IVR technology and applying them in the planning process [17,24]. Smell, for example, is one of the most primal and influential forms of environmental sensing [25,26], but there is little understanding of the role or benefit of olfactory cues in IVR-based participatory planning experience. Our aim is to learn if or how multi-sensory and multi-dimensional IVR simulations may increase people’s interactions with a proposed planning or design project.
Q2: What is the role of multi-sensory and multi-dimensional IVR simulations in shaping public memory recall of planning scenarios? Memory recall of the built environment using mental mapping—sketching a perceived description of a real environment—may relate geographical settings to people’s perceptions, mental constructs, or processes [27,28,29]. We have not seen any research on memory recall process of IVR simulations within an urban planning context.
Q3: What is the role of multi-sensory and multi-dimensional IVR simulations in shaping public emotional responses to design proposals? Understanding public emotions attached to existing built environment is important for the participatory planning process [30,31]; we do not, however, understand how public emotions can be attached to future planning scenarios and how IVR simulations can initiate or amplify such emotional responses.
Q4: What are the strengths and limitations of multi-sensory and multi-dimensional IVR simulation techniques? Most of the literature to date discusses the opportunities and challenges of various forms of IVR from a technological point of view [5,12]. Understanding or evaluating IVR strengths and limitations from participants’ perspectives is still underexplored. Our study attempts to fill these gaps in the literature.
3. Context and Methodology
3.1. Study Area
Founded in 1779 as a glass-manufacturing town, the Borough of Glassboro in the state of New Jersey is a small urban community in close proximity to the cities of Camden, NJ and Philadelphia, PA. The town is currently home to approximately 20,000 year-round residents, and another 18,000 university students—many living in residential areas during the academic year. As the university population grows, the surrounding areas in the Borough face new development and redevelopment pressures. Redevelopment plans in the historic downtown area are intermittently proposed; many such plans are out of compliance with the Borough’s outdated masterplan and often lack the support of residents and existing businesses.
Our study area was a three-block section of historic downtown Glassboro where a plan for a new Arts and Entertainment District was adopted in 2007 but never materialized. The study area is home to many local businesses and residents, and includes a public library, fire station, a historic Glass Museum, a university academic building, and a few publicly and privately owned vacant parcels. We selected this study area for the following reasons. An already established university-community partnership enabled collaboration and assistance from the Borough in recruiting study participants and hosting a large community event. The location of our Virtual Reality Center (VR Center) was a few miles from the study area, making it accessible for Glassboro-area participants. We also anticipated that the momentum to update the Borough’s 2004 master plan and revitalize the historic downtown would attract participants who care for the future of the community. The demographic characteristics of the Borough and the presence of a state university within the Borough offered us an opportunity to reach out to potential participants with diverse backgrounds and age groups, especially youth—a population group that is historically disenfranchised from planning [32]. Finally, due to recent digital civic engagement initiatives by the Borough, we anticipated that the Borough residents, as well as college students, would be ready to experiment with newer technology-based tools such as IVR in order to become a smart community.
3.2. Methodology and Data
Our study methodology was based on the following four phases of work, which included primary data collection and analysis process.
Phase 1: Developing a future fictional planning scenario—The project team partnered with the Borough of Glassboro to conduct a community design workshop and gather design ideas for a potential development scenario in the study area. A group of 46 attendees, including municipal officials, residents, business owners, and university students and faculty, discussed the opportunities, barriers, and key design considerations for a potential Arts and Entertainment District: (i) preservation of existing landmarks such as Angelo’s Diner and the Heritage Glass Museum; (ii) modification of existing features such as relocating the public library for better visibility and access, adding a third floor to existing two-story retail/mixed-use buildings, and implementing green infrastructure such as pocket parks, street trees, and gardens on existing underused green/open spaces; and (iii) innovation, such as a new movie theater, parking garage, and a landscaped pedestrian plaza with retail, dining, and entertainment options. Based on community feedback, two architects from the project team created a fictional planning scenario, including site plan and 3D visualization using Google Earth, SketchUp, and ArcGIS 3D Analyst software.
Phase 2: Setting up VR simulations—We partnered with Rowan University VR Center to create a VR version of the 3D models using Autodesk Maya and Google Earth software, and organize four focus group sessions. The VR Center has a CAVE lab, featuring a 7-foot-high by 40-foot-wide curved wall of eight adjoining screens and provides room for up to 20 people to explore VR simulations. After creating a basic VR simulation, the project team added human figures, different modes of transportation (e.g., cars, vans, buses, school buses, fire trucks, and bicycles), vegetation (e.g., trees, plants, and vegetable/flower beds), and various street furniture and placemaking features (e.g., lamp posts, street banners, street vendors, seating arrangements, tables, fountains, gazebos, murals, and sculptures). We collected these models from free online libraries, so the quality of models varied. We intentionally kept some physical or sensory design flaws to see if they evoked any reactions from participants. Our focus group experiments were predetermined, and the participants had no control over the path or speed of the exploration. We recorded a 7-min fly-through and walk-through simulation of the study area. This simulation was based on a written script explaining the design proposals and navigating the walking path (see Figure 1 and Figure 2).
Next, we added auditory and olfactory stimuli. One project team member recorded an audio story following the script; another member recorded a song while playing a guitar, a 30-s sound bite for an animated singer performing on the center stage of the pedestrian plaza. We also added ambient sounds including restaurant chatter in the open-air dining area, an ice cream truck jingle, a lawnmower, a dog barking, traffic sounds near the intersection and a movie reel near the theater. All sound bites were timed and attached to appropriate locations in the VR simulation. The auditory stimuli were connected to the CAVE lab’s surround sound system for an immersive sensory experience. Two distinct olfactory stimuli, freshly cut grass and buttered popcorn, were designed to release during the 4D IVR simulation, cued with visuals of an outdoor grassy area and movie theater, respectively. The olfactory cues were designed to be introduced via spray bottles, placed approximately eight feet high, out-of-sight from the focus group participants. We finalized three simulations for the focus group sessions: (i) a 7-min recorded 2D video of 3D simulation with oral presentation but no IVR (“2D video of 3D simulation”); (ii) a 7-min recorded 3D IVR simulation with audio story only (“3D IVR simulation”); and (iii) a 7-min recorded IVR simulation with additional auditory and olfactory stimuli (“Multi-sensory 4D IVR simulation”). Among these three, the first simulation—a 2D video of 3D simulation, along with oral presentation—is a commonly used community engagement tool in the USA for demonstrating proposed development scenarios [1,10]. We decided to compare this “standard” method with relatively uncommon 3D IVR and 4D IVR simulations.
Phase 3: Conducting focus group sessions—The project team, with the help of municipal officials, recruited participants via email invitations, website announcements and social media posts. We formed four focus groups with ten participants each and hosted four separate sessions during weekdays from 6 to 8 p.m. in the spring of 2018. Focus Groups 1, 2, and 3 experienced a 2D video of 3D simulation, a 3D IVR simulation, and a multi-sensory 4D IVR simulation, respectively. Focus Group 1 was a comparison group, which did not experience any IVR simulation and the findings from this group were compared with the findings from groups 2 and 3. Group 4 experienced both a 2D video of 3D simulation and a 4D IVR simulation. We allocated USD 30 gift cards for participants in groups 1 to 3, and USD 40 for group 4 as they attended two sessions. In order to make the focus groups inclusive, it was important for us not to exclude any participant unable to attend a specific session on a pre-assigned date. Participants, therefore, chose their groups based on personal convenience, and were not filtered or assigned into specific groups. Of the total 40 participants, 55% were female and 30% were non-white. The age of participants ranged from 21 to 69, but 60% people were within the range of 20 to 30. The diversity of participants was consistent with Glassboro’s demographic characteristics. Participants’ familiarity with the study area ranged from low (5%), moderate (52.5%), to high (42.5%). Their familiarity with VR technology also varied from low (5%), moderate (90%), to high (5%).
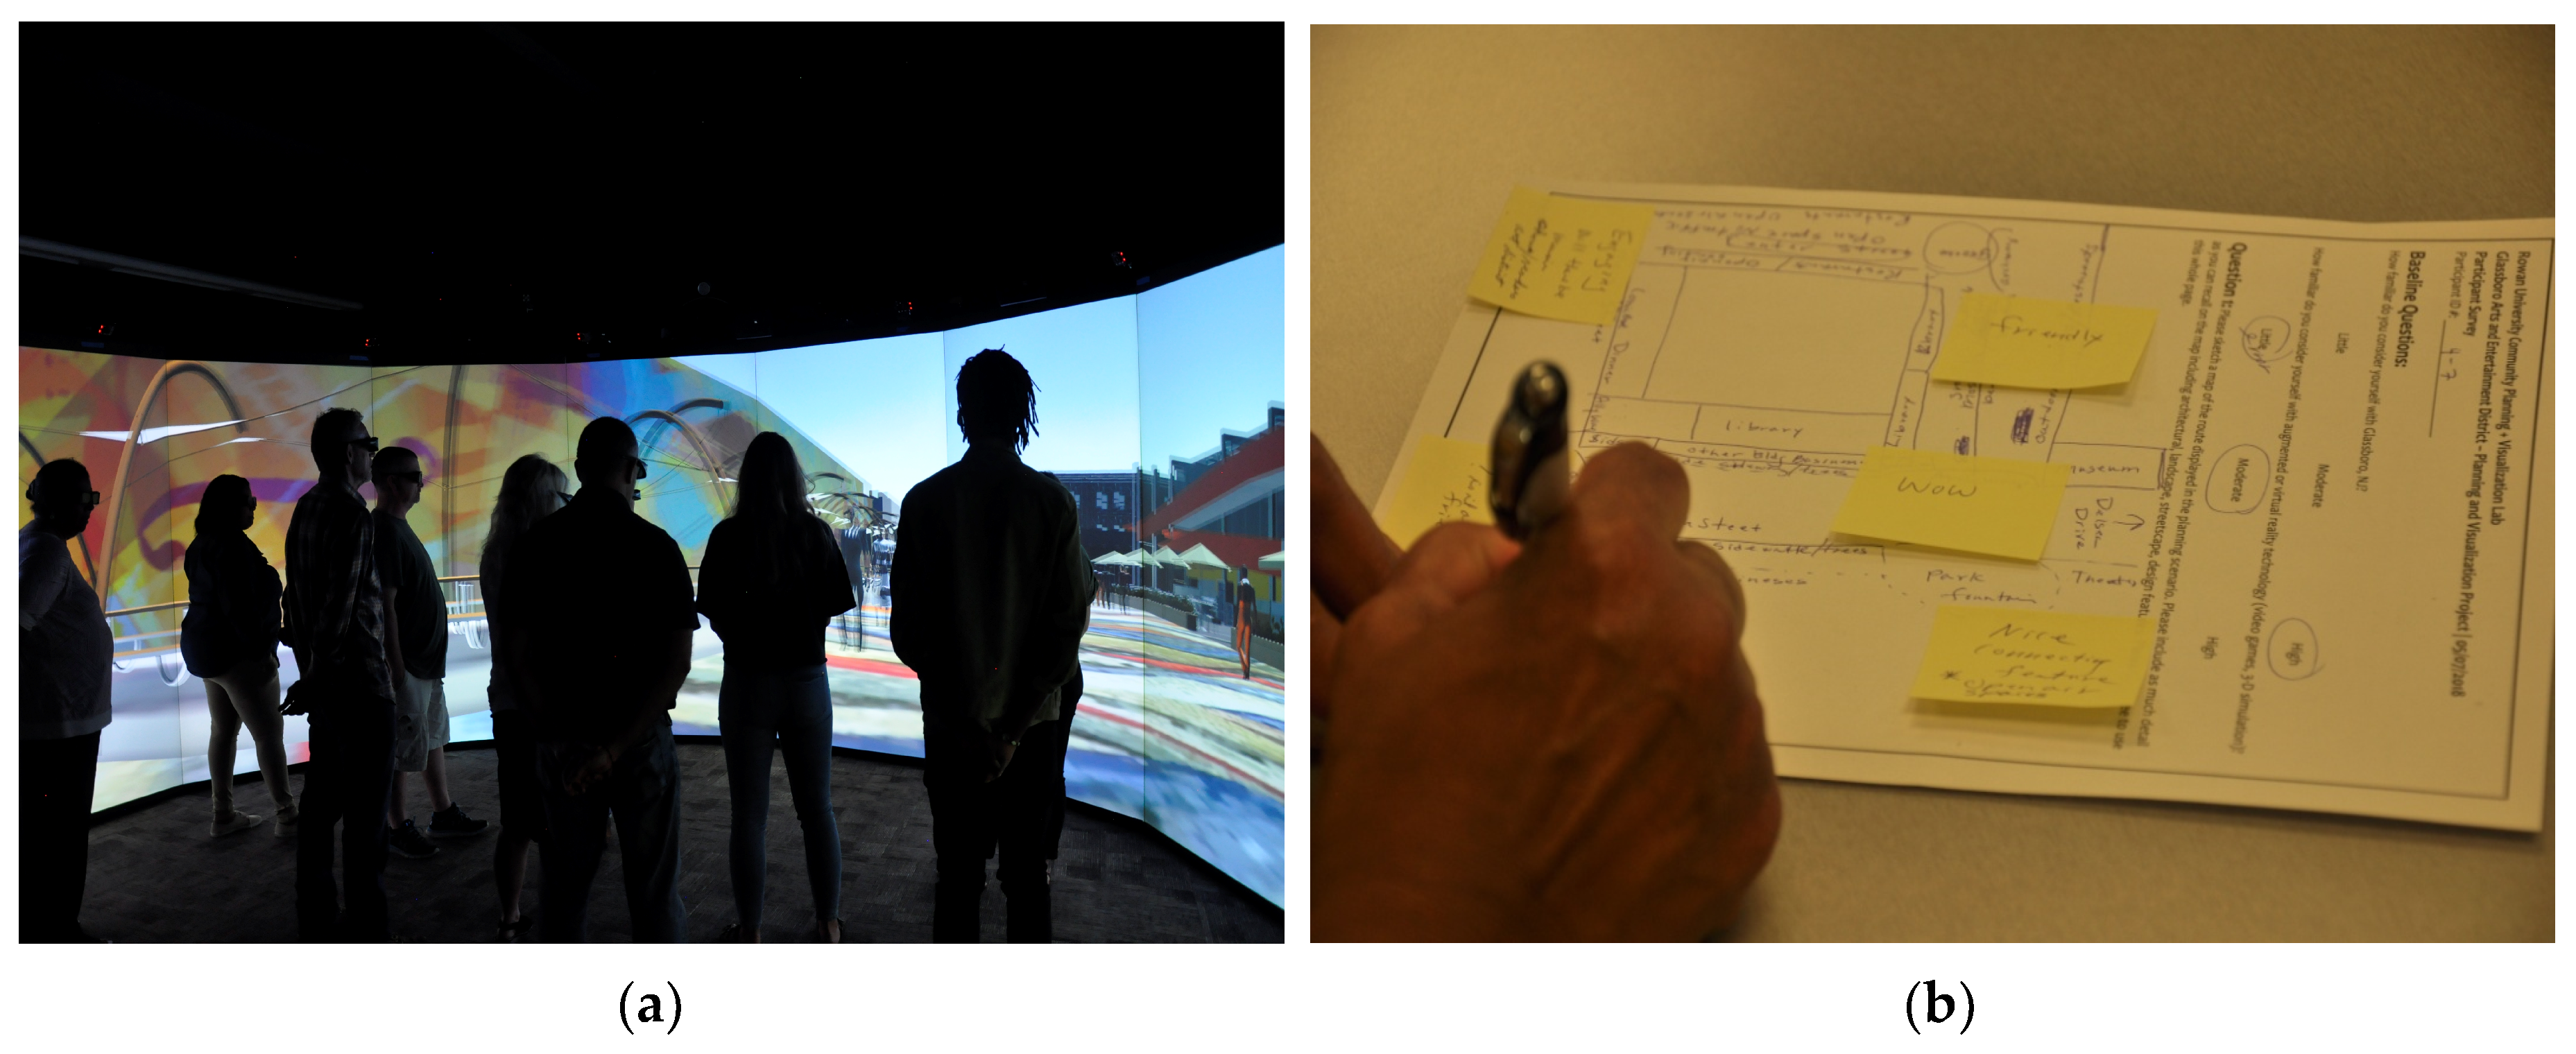
The session with Focus Group 1 included a verbal presentation (using PowerPoint) explaining the project and proposed design ideas; a Google Map of the study area for geographical context; a 2D video of 3D simulation of the proposed planning scenario; guided activities and discussions; and an open feedback forum. We followed the typical steps taken by many US local governments in public meetings to present and discuss new development proposals. The other two focus group sessions followed the same procedure but replaced the 2D video with 7-min IVR simulations in the CAVE lab (see Figure 3a). The activities and discussions in all sessions were designed to collect data to answer our four research questions. First, we asked participants to draw a mental map [28] on a piece of paper using mental recall of the planning scenario they experienced (see Figure 3b). Second, using sticky notes, participants documented the emotional responses they felt throughout the design simulation and adhered those notes to specific locations on their mental maps. Third, we asked participants to write questions—as many as they like—about the content and visualization techniques of the simulation, as well as the purpose/logistics of the project. Finally, we engaged participants in an open conversation to discuss some of their questions and understand their views on the strength and challenges of IVR simulations. Focus Group 4 participants, who experienced all types of simulations, answered additional questions to compare the types, as well as the effect of auditory and olfactory stimuli in the multi-sensory 4D IVR. Two project team members were in charge of taking detailed notes of all conversations and counting the number of times participants were engaged—either by answering questions, asking questions or offering comments.
Phase 4: Analyzing data and interpreting results—We performed content analysis and descriptive statistics to analyze all the data collected from focus groups (e.g., group discussion transcripts, written and verbal responses to our questions and prompts, mental maps drawn as sketches with notes, and emotions labeled on sticky notes). Using content analysis, communication artifacts were converted to coded categories based on a consistent and unambiguous rule of coding [32]. A reliability analysis was performed to test the tendency for different researchers to consistently recode the same data in the same way [33].
At the end of all focus group sessions, we compared notes taken by two team members for reliability check and created a single transcription document. We deleted comments or questions that were not related to this study or its methodology in any way (for example, a question about rest rooms in the VR Center or a comment about guest parking spaces outside the VR Center). Next, all comments and questions were coded into three categories: content, visualization, and purpose/logistics; emotional words were coded into two categories: positive and negative; and characteristics of IVR technology were coded into two categories: strength and limitations. A project team member performed coding after developing constructed rules and categories. Another member recoded the content by following those rules. After comparing the coding results, we calculated a percent reliability for each category by calculating the number of cases identically categorized by two coders for each category and dividing it by the total number of cases in the dataset. The mean percent reliability ranged from 97% to 99%, which was high enough to indicate the dependability of the categories that the original coder chose for the dataset. Finally, descriptive statistics were used to calculate and present the total numbers of comments discussed, questions asked, design elements recalled, or emotional responses offered by each participant in each focus group session. We aggregated individual level data at the group level and calculated percentage of changes between groups 1, 2, and 3 or between two sessions of group 4.
4. Results and Discussion
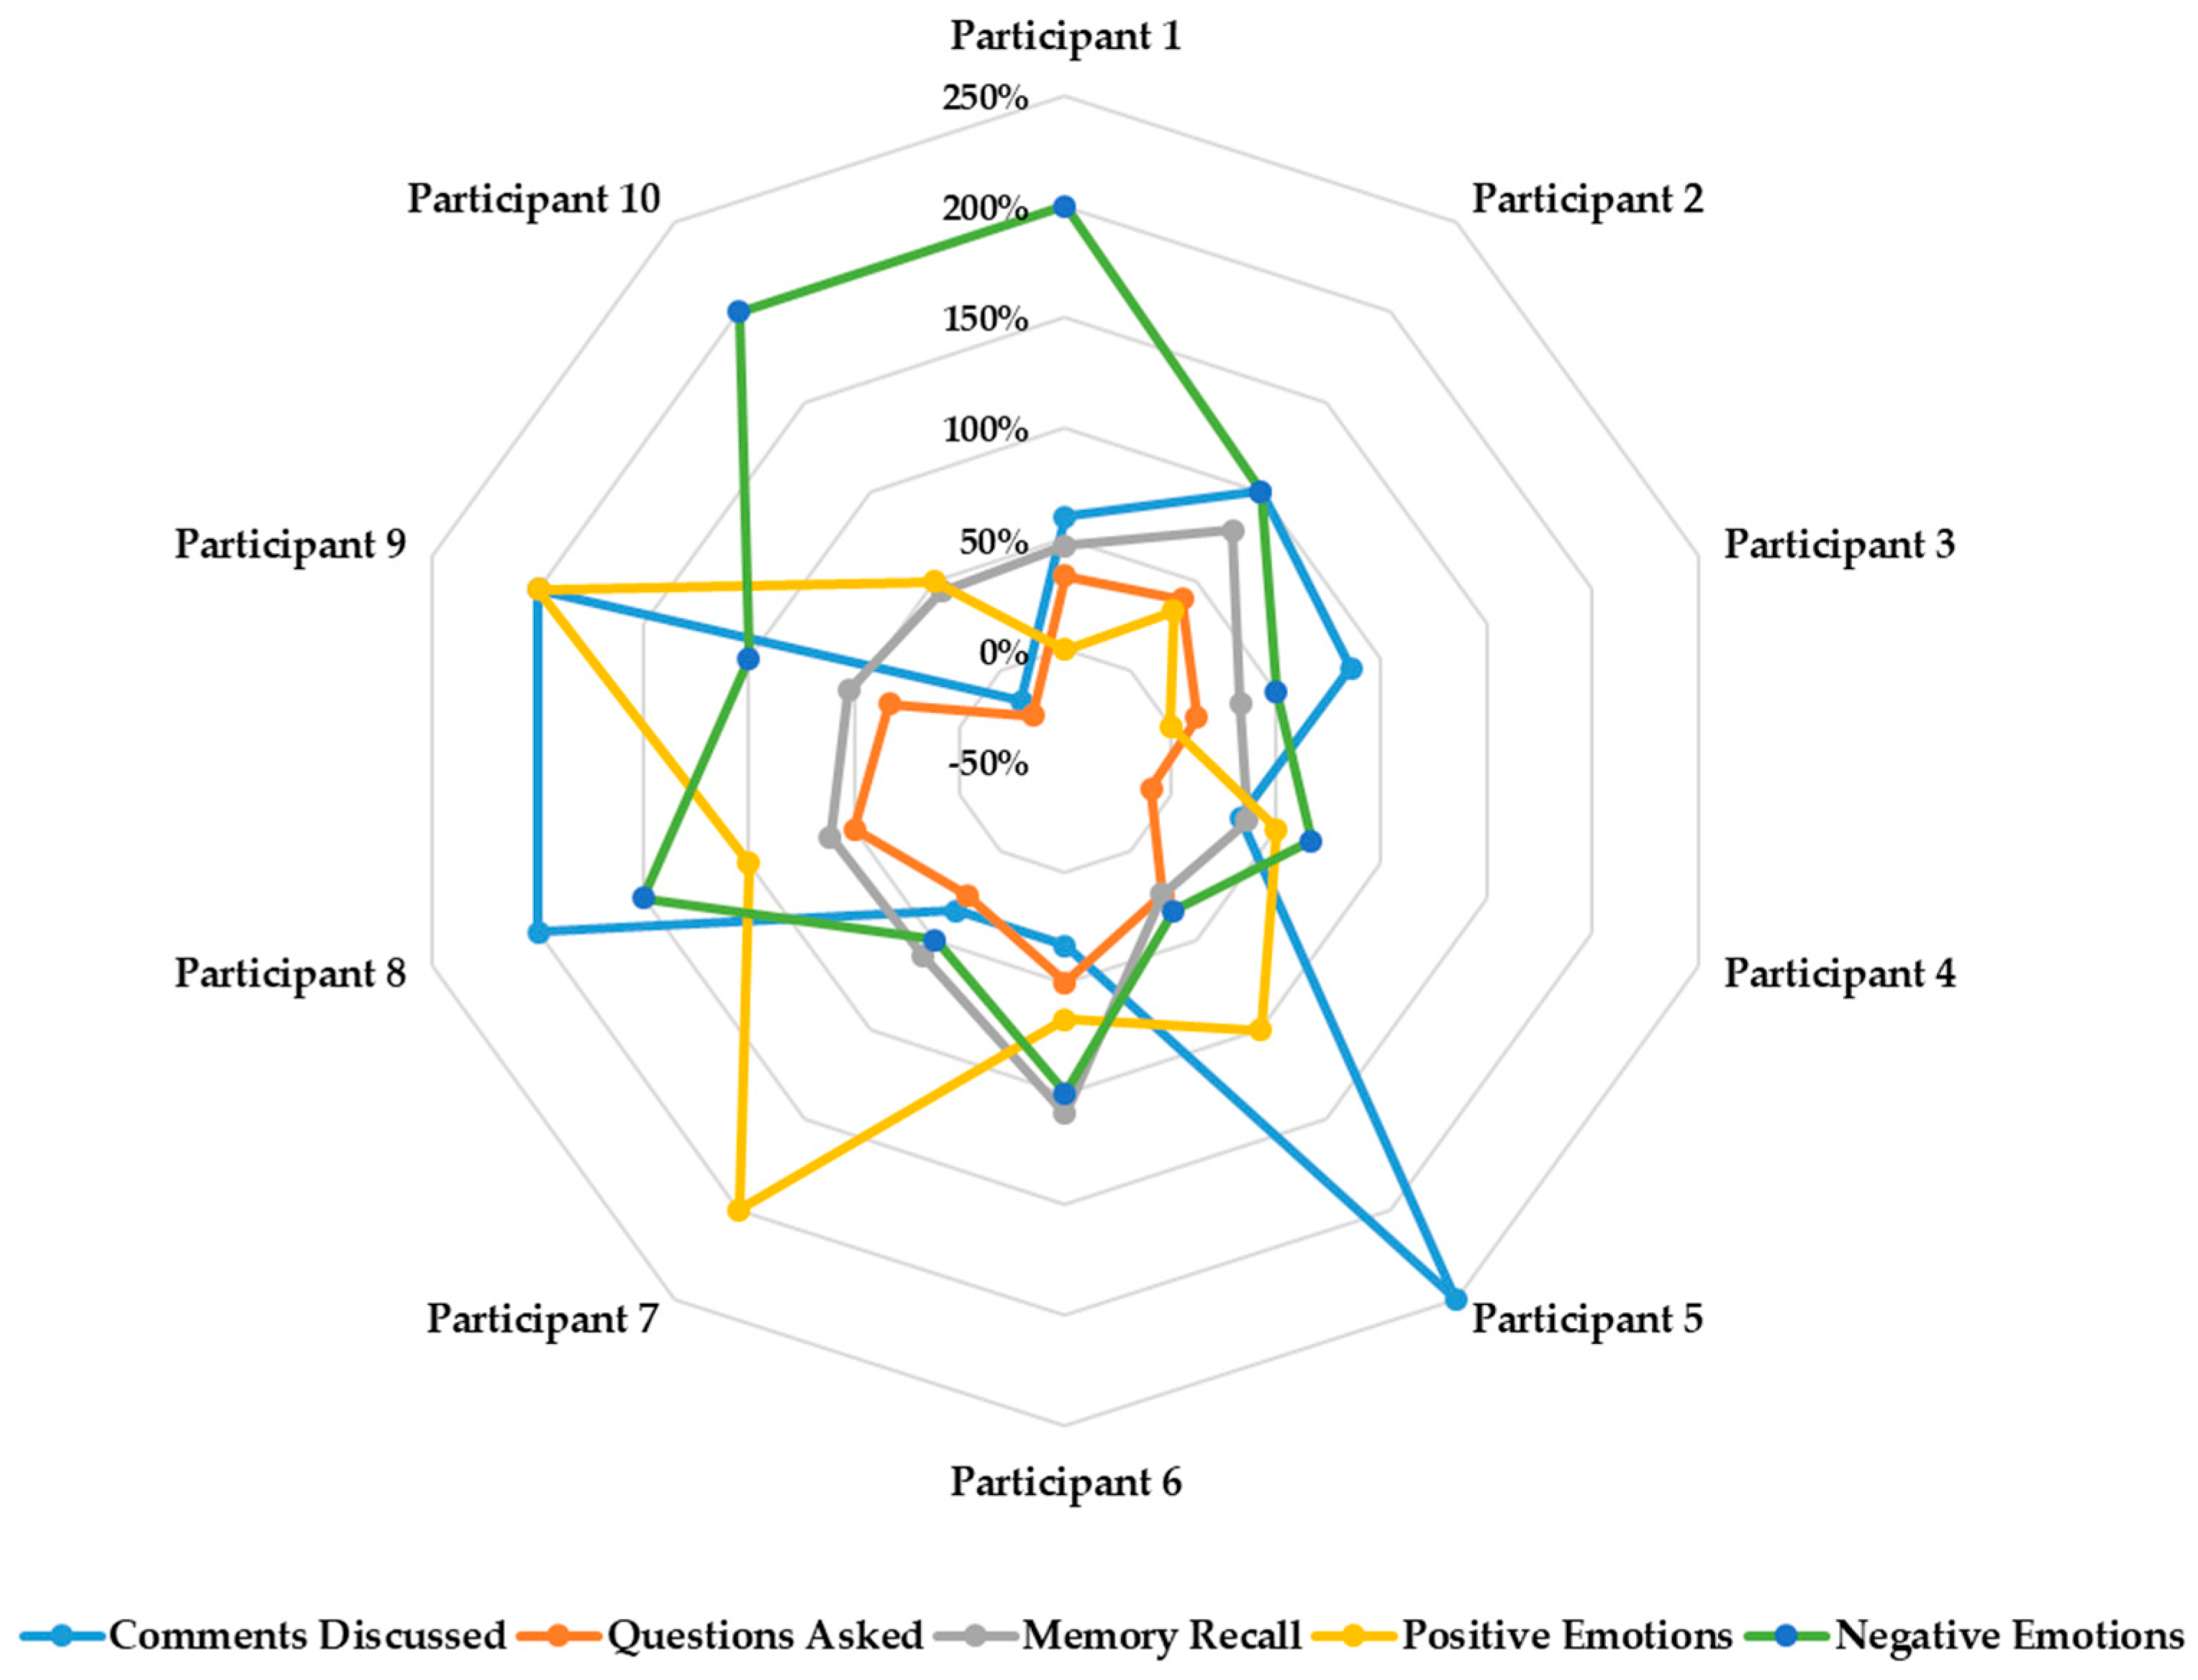
The results of our data analysis, presented in Table 1, show that the overall public interaction, memory recall of planning scenario, and emotional responses to design proposals increase with 3D IVR and multi-sensory 4D IVR simulations when compared with a 2D video of 3D simulation. In particular, ten participants from Focus Group 4, who attended two sessions exploring 2D video and 4D IVR simulation, respectively, shared more comments overall, asked more questions, had a higher number of memory recall, as well as positive/negative responses to the planning scenario in the second session (up to 250% increase, as shown in Figure 4).
4.1. Public Interaction Increased with Multi-Dimensional and Multi-Sensory IVR Simulations
To answer the first research question, we analyzed two sets of metrics: the number of comments during the open feedback forum, and the number of participant responses in the “additional questions” section of the forms distributed. As seen in Table 1 (Section 4.1), both numbers increased with each added layer of simulation.
After watching the 2D video of 3D simulation, Focus Group 1 participants made 17 comments, but Focus Group 2 commented 63 times (271% increase) after experiencing the 3D IVR. Finally, the 4D IVR prompted Focus Group 3 to make 77 comments, a 352% increase from a 2D video of 3D simulation, and a 22% increase from 3D IVR. We found similar results while calculating the number of questions that participants posed about the simulation content, visualization, and purpose or logistics. These numbers increased from a 2D video of 3D simulation to 3D IVR (55% increase) and from 3D IVR to 4D IVR (19% increase).
For Focus Group 4, there was a 67% increase in comments between a 2D video of 3D simulation (42 comments) and 4D IVR (70 comments). Similarly, participants asked more questions after the 4D IVR experience (a 17% increase from the 2D video of 3D simulation). According to Table 2, the pattern of individual-level data was consistent with group-level data. All participants, except two from group 4 (participants #4 and #10), offered more comments or asked more questions about the project, simulation, or technology after experiencing 4D IVR. The percentage of increase in counts ranged from −17% to 250%. The change was noticeably higher for participants #2 (100% increase), #5 (250% increase), and #8 and #9 (200% increase each).
We categorized all questions raised by participants—either written on survey forms or asked during discussion sessions—into three types: content, visualization, and purpose/logistics of the project. Here are three examples:
“There were a lot of outdoor seating and dining areas... would these areas work during cold weather?”(Content question);
“Why did height and gaze of camera path change?”(Visualization question);
“How long did the visualization take to make and how many people participated in making it?”(Purpose/logistics question).
An increased number of visualization or purpose/logistics questions, however, does not necessarily suggest that 4D IVR encouraged higher interaction with the proposed design. While content questions were directly related to the design scenario, questions about software, visualization techniques, technological shortcomings or logistics did not mean that participants interacted with the design proposal.
4.2. Memory Recall of Scenarios Increased with Multi-Dimensional and Multi-Sensory IVR Simulations
The second research question prompted us to measure the level of recall in participants’ mental maps by totaling the number of times that specific design elements from the scenario were recalled. The results in Table 1 (Section 4.2) indicates that the addition of IVR and sensory stimuli increased participants’ level of recall. Notably, we found a connection between level of recall and prior familiarity with the study area.
The level of recall in participants’ mental maps supported the finding that the 2D video clip visualization was the least effective in contributing to participants’ recall of the planning scenario. There was a 50% increase in memory recall of design proposals between Focus Group 1, who viewed the 2D video, and Focus Group 2, who experienced the 3D IVR. Both groups had moderate to high levels of familiarity with the study area, but Focus Group 2 recalled more details of the scenario.
There was a 30% increase in memory recall between Focus Group 1 and Focus Group 3, who experienced the 4D IVR. A decrease in recall, however, was noticed between groups 2 and 3, which is most likely explained by the relatively lower familiarity of the study area in Focus Group 3 participants. About 20% of group 3 participants had low familiarity with the study area, and the remaining 80% reported moderate familiarity, while groups 1, 2, and 4 reported zero participants with low familiarity. This is a potential limitation of the study, as the project team did not assign participants to focus groups, resulting in a higher percentage of participants with lower familiarity with the study area, and therefore lower recall, in Focus Group 3. Participant comments from Focus Group 3 also supported the claim that level of recall was related to familiarity with the study area.
“I rarely visited that part of the town... the VR wasn’t place-based enough.”
Focus Group 4 saw a 50% increase in level of recall between 2D video and 4D IVR simulations, which supported a positive connection between level of recall and the introduction of IVR and sensory stimuli. At an individual level, Table 3 shows a positive increase in responses from all ten participants, ranging from 24% to 109%. During the discussion session, these participants agreed that 4D IVR simulation allowed for easier recall. A participant wrote:
“[My] map [based on IVR] was from an aerial view from the movie theater, because that was the most memorable shot for me.”
We compared this participant’s maps from session one and session two to verify this comment. The first map included fewer details and only three large streets, two of which were labeled with street names. The second map showed no street names but included additional alleyways, buildings, and other physical design elements that were not in the first map. This may suggest that the participant was able to recall more details of the design proposal after being immersed in the 4D IVR format.
4.3. Emotional Responses to Design Proposals Increased with Multi-Dimensional and Multi-Sensory IVR Simulations
To answer the third research question, we analyzed the number of emotional responses, positive or negative (i.e., “happy,” “intrigued,” “disappointed”), from each focus group. Table 1 (Section 4.3) shows the total number of emotional responses increased from the 2D video to IVR simulations. However, 27% of these emotional responses were not about the proposed design scenario but related to the technical aspects of IVR simulations (e.g., the use of the software, the design of the walking path, the selection of 3D models representing people and plants, the use of olfactory cues, and the feeling associated with camera movement).
A 60% increase in emotional responses was noted between Focus Group 1 (47 distinct emotional responses), who watched the 2D video, and Focus Group 2 (75 distinct emotional responses), who experienced the 3D IVR. The increase rate was 21% from group 1 to group 3, who experienced 4D IVR. There was, however, a decrease of 24% from group 2 to group 3. As explained in Section 4.2, this decrease was likely due to the lower familiarity of the study area of group 3 participants, that may have resulted in fewer personal memories or less emotional attachment to existing sites. Within Focus Group 4, participants had more emotional responses (a 77% increase) to the 4D IVR simulation.
We noticed a similar trend when analyzing positive and negative emotions separately (see Table 1 Section 4.3). Across all focus groups, there were significantly more positive responses than negative. Positive emotional responses included words such as “comfortable,” “joy,” and “inviting;” negative responses included “disappointed,” “disoriented,” and “confused.” A participant in Focus Group 2, for example, wrote the following emotional response to the proposed public art on their mental map:
“Disappointed. I like art, but the town has way too much abstract art!”
Comparing 3D and 4D IVR simulations, negative emotions increased by 16% between groups 2 and 3, and positive emotions decreased by 38%. This increase in negative emotions was likely due to the effect of 4D IVR with sensory stimuli as participants of group 3 had the lowest familiarity with VR technology among all groups. A few participants noted feeling disoriented, distracted or even nausea in specific locations where sensory stimuli were introduced. Audio cues had this effect, especially in the outdoor dining area scene where loud restaurant chatter, musicians, and an ice cream truck sounds occurred, as did the olfactory cues. Some participants experienced the introduction of scent negatively, as indicated in the comment,
“I found it very distracting because I thought the person next to me had strong perfume.”
Other Focus Group 3 participants recognized the role olfactory cues played in creating positive perceptions with comments like,
“I think it was very effective ... the different smells and being able to see things in all directions was better.”
Focus Group 4 showed a 64% increase in positive emotions from the first session to the second (see Table 4). At an individual level, this increase in positive emotions was reported by eight out of ten participants, ranging from 33% to 200%. Specific design elements evoked consistent positive emotional responses across visualization methods, including excitement at the pedestrian plaza and dining area and appreciation for new green infrastructure. Such emotional responses included,
“Joyful to see open space”;
“Excited for pedestrian area”; and
“Happy at the sight of new shade trees!”
Participants perceived the addition of olfactory stimuli in a generally positive manner, as understood from the following two comments.
“My nose is still warm from the popcorn smell.”
“The subtle grassy scent along with lawn mower sound gave a good feeling about a well-maintained Town Center.”
Negative emotions, on the other hand, nearly doubled within Focus Group 4, again ranging from 33% to 200% (see Table 4). The 2D video in the first session evoked 17 negative comments, which were limited to design elements only. For example,
“Worried … the movie theater will bring more people who need to park [cars].”
The overall increase in negative emotions, from 17 to 33 comments (94% increase), in the second session, was partially related to the negative effect of motion sickness and/or dizziness/disorientation produced by IVR and sensory stimuli. Twenty-four negative emotions were related to design elements—a little higher than the number from session one. The additional nine negative emotions were specifically in reference to the technologies. Below are two examples.
“The traffic sounds were a bit distracting”.
“There was a lot going on that I couldn’t process because of the camera panning.”
4.4. Strengths and Limitations of Multi-Dimensional and Multi-Sensory IVR Simulations
According to the focus group content (e.g., questions participants asked or comments they made during open discussion sessions), participants generally expressed an overall preference for IVR technology as opposed to standard or traditional mediums of planning scenario presentations such as PowerPoint presentations and 2D video of 3D simulations. Many participants commented on the ability of IVR to better engage viewers with their surroundings because of the immersive environment. With multi-sensory 4D IVR, they are able to evoke stronger reactions and have an overall better understanding of a design proposal. Sample participants’ comments are included in Table 5.
Another strength of IVR technology is its ability to convey scale and facilitate navigability for its users in an immersive environment. Participants who interacted with the IVR formats often commented that they felt like “part of the scene”, and that the IVR technology communicated human scale more effectively than traditional methods like 2D video clips or blueprints. Participants commented on the advantage of experiencing the scenario at different angles and eye levels (e.g., street view, bird’s eye view, camera fly-in) in communicating scale. Most participants from Focus Group 1 who did not experience any IVR simulation had difficulty with scale and navigation.
A weakness of IVR technology as a tool for public participation is its ability to induce motion sickness, dizziness, or discomfort. A few participants in each focus group experiencing IVR noted this limitation. Uncomfortable camera angles and elevation changes, uneven camera speed, and technology glitches were cited as weaknesses of the method; these limitations, however, were due to the use of pre-recorded simulations.
Technical design flaws in the IVR simulations caused few participants to lack buy-in and evoked negative reactions from participants during focus group discussions. Visual design flaws included unrealistic people and vehicles, “walking through” solid objects, and sharp camera angles. Sensory stimuli design flaws included an uneven distribution of scents, uneven volume control, and unnatural sound clips.
The time and budgetary requirements needed to create IVR simulations may be considered limitations by local government agencies with limited resources for participatory tools. A few of our study participants asked questions and showed concerns about the budget, time, and labor needed for such experiments. Local government’s access to a functioning VR Center was also a concern.
4.5. Six Takeaways for Urban Planning Practice
Given the rapidly changing nature of IVR technologies, these results are time-sensitive; however, urban planning practitioners should nevertheless heed the lessons learned from this study. First, planners can use IVR simulations to engage diverse groups of participants, including young people who are historically disenfranchised from planning [34]. The idea of engaging youth through IVR projects was also supported by other researchers [16,20]. We anticipate that IVR projects may secure participation from other underrepresented groups such as people with limited or no verbal ability and other communication issues, or those who have little or no familiarity with the native language, because these projects can completely immerse individuals in the design [5]. Preliminary research findings suggest that the use of 3D technologies, including IVR, may lead to increased spatial orientation skills among users [35]. At the same time, planners may need to provide participants with alternatives to IVR simulation because it can cause dizziness and disorientation for some people, including those suffering from vestibular disabilities. Overreliance on IVR technology could deter participants who do not feel comfortable participating in this form of engagement.
Second, planners can address the issues of time and cost—two major barriers of conducting IVR-based public participation [5,12]—by partnering with universities with IVR expertise and resources. The IVR simulation part of our project was created with limited time and budget because of an existing university–municipality partnership, the involvement of a functioning VR Center, and the availability of multiple faculty/student volunteers. If such partnerships are not possible or feasible for a local government, they may consider web-based VR simulations with Google cardboard viewers—an alternative to expensive VR headsets—instead of CAVE labs.
Third, we found that participants generally understand a planning scenario better through IVR simulations compared to traditional presentation techniques, a finding that conforms with prior research [11,20]. The physical discomfort that a few participants faced while experiencing IVR simulations, however, created a barrier to fully understanding the design proposals. Therefore, we recommend that planners use IVR technologies to supplement, not replace, other existing public participation methods so that participants sensitive to IVR can choose other methods of their preference.
Fourth, planners may use VR projects to attract and engage people who cannot attend meetings or visit sites but can still have a thorough understanding of the project through web-based immersive simulations [5,17,18,19]. In our study, the focus group members with least familiarity with the study area experienced multi-sensory IVR simulations but still had a high level of participation compared with focus group members who experienced non-IVR presentation format but had a moderate level of familiarity with the study area.
Fifth, planners interested in creating multi-sensory IVR simulations should try to utilize realistic models. The people and vehicles used in our simulations were distracting to some participants who could not concentrate on the design proposals carefully. Some participants were not comfortable with our auditory and olfactory stimuli, and future projects should choose such props with more caution or deploy them in more nuanced ways (e.g., lower sound volume, less concentrated scents). Avoiding technical flaws is the key. Because participants pay more attention to details in an immersive environment, details that they can easily ignore in standard renderings or videos projecting on a flat screen are more pronounced in IVR simulations. The goal, however, should not be to create an objective environment—a complete replica of the real environment—but rather a perceived environment so that participants can focus on design elements important to the planning process.
Finally, planners may try to add multi-sensory stimuli in their IVR simulations because, as we have seen in our study, participants recall more memories associated with a design proposal and offer more emotional responses to proposed scenarios when they experience multi-sensory IVR. Planners, however, should choose sound bites and scents that are not overpowering or distracting, as suggested by a few participants in our study.
5. Concluding Remarks
In this paper, we have presented the results of a study exploring the role of multi-sensory and multi-dimensional IVR technologies in participatory planning. We engaged four focus groups to experiment with three presentation formats of a future planning scenario—a 2D video of 3D simulation, 3D IVR simulation, and multi-sensory 4D IVR simulation with auditory and olfactory cues. Our study finds that the level of public participation, memory recalls of planning scenarios and emotional responses to design proposals increase with IVR simulations when compared with standard 2D video presentation. We conclude that in this digital age of public engagement, multi-sensory 4D IVR technology offers urban planners and policy makers an opportunity to diversify or supplement standard public engagement processes. Planners, however, should recognize the strengths and limitations of IVR technology—as identified in this paper—and evaluate its validity and legitimacy before applying it in a planning process.
This paper not only helps us understand the role of IVR and its limitations in participatory planning, but also contributes to this emerging body of literature by incorporating multi-sensory elements (e.g., sight, sound, smell) to IVR technology. Modern multisensory IVR technologies can better predict the impact of future scenarios on communities and their complex environment and can enhance the public engagement process. Researchers have started experimenting with auditory stimuli but they need to respond to a growing demand to understand the social and spatial role of olfaction in urban environments, emerging out of a broader movement to design sustainable cities for the full human sensorium.
Our study had several limitations. We used a small sample size (40 participants) because of time and budget limitations, so there may be a concern about generalizability. We asked participants in each focus group about their pre-existing familiarity/knowledge of the study area, but we did not ask them to draw mental maps both pre- and post-test as a way of measuring the level of their pre-existing familiarity. This could help us better understand the connection between participants’ responses to memory recall tests and their prior familiarity of the study area. We used a pre-recorded simulation to ensure that all participants from four focus groups could explore the design proposals in the same way. The pre-recorded simulation also allowed us to inject multi-sensory cues to the scenes in a consistent manner. Few participants, however, faced issues with the pre-recorded walking speed, camera angles, and turns. Some of the models (e.g., people, vehicles) used were free and of medium to low quality, which was partially due to our budget constraints and partially intentional to generate questions or comments, and a few participants were distracted by those models. The study was conducted in a VR Center CAVE lab to offer participants a complete immersive experience, but this location-specific experiment was available to only those participants who were available on one of the pre-determined dates and could drive or carpool to the location. The study participants were diverse in age, race, and gender, although the selection was based on random responses to email or social media invitation/announcement on a first-come-first-serve basis. There was no special initiative to recruit underrepresented groups.
Future studies can address some of these limitations by increasing participant numbers and reaching out to immigrant, refugee, and other marginalized groups who have often limited their engagement [36,37]. How IVR simulations resonate with diverse social, cultural, and demographic groups remains unknown. A future study can also focus on completed planning or urban design projects that used IVR technology as a public participation tool; it would be interesting to study how public participation through IVR simulations contributed to the final design and development of real projects. Additionally, future studies may address these questions: Is IVR as a public participation tool more effective at the preliminary stage of a planning project or at the final phase when more details are available for better simulations? Can IVR simulations serve as an effective public participation tool to compare various “alternative” design scenarios? Finally, more research is needed to experiment with olfactory cues in IVR simulations and how people respond to them. The influential, yet understudied, dimension of olfaction in human decision-making can be relevant to the participatory planning process in smart cities.
Author Contributions
Conceptualization, M.M.; methodology, M.M. and J.K.; software, M.M.; formal analysis, M.M.; resources, M.M.; data curation, M.M. and J.K.; writing—original draft preparation, M.M.; writing—review and editing, M.M. and J.K.; visualization, M.M.; supervision, M.M.; project administration, M.M.; funding acquisition, M.M. All authors have read and agreed to the published version of the manuscript.
Funding
This research was partially funded by a Rowan University SEED grant awarded to M.M. in 2017–2018. Additional support for a research assistant was provided by Rowan University School of Earth and Environment in 2019.
Acknowledgments
We are thankful to our dear colleague Megan Bucknum for assisting us with focus group facilitation. We also acknowledge design and technical supports provided by Samain Sabrin, Cassie Shugart, Marie DiLeonardo, Giavanni Rizzo, and Devon Moulton, all former research assistants of Rowan University Community Planning + Visualization Lab. Special thanks to the students of Community Planning and Site Design course offered in Spring 2018 semester for generating initial design concepts for the planning scenario. We humbly acknowledge our partners Rowan University Virtual Reality Center and the Borough of Glassboro, NJ, for their support and involvement in this project. We also acknowledge professional planners Kyle Hearing and Jason Hachadorian for providing technical support. Last but not the least we thank our focus group members for actively participating in activities and engaging in discussions.
Conflicts of Interest
The authors declare no conflict of interest.
References
- Mandarano, L.; Meenar, M.; Steins, C. Building Social Capital in the Digital Age of Civic Engagement. J. Plan. Lit. 2010, 25, 123–135. [Google Scholar] [CrossRef]
- Afzalan, N.; Sanchez, T.; Evans-Cowley, J. Creating smarter cities: Considerations for selecting online participatory tools. Cities 2017, 67, 21–30. [Google Scholar] [CrossRef]
- Afzalan, N.; Muller, B. Online Participatory Technologies: Opportunities and Challenges for Enriching Participatory Planning. J. Am. Plan. Assoc. 2018, 84, 162–177. [Google Scholar] [CrossRef]
- Iachini, T.; Coello, Y.; Frassinetti, F.; Ruggiero, G. Body Space in Social Interactions: A Comparison of Reaching and Comfort Distance in Immersive Virtual Reality. PLoS ONE 2014, 9, e111511. [Google Scholar] [CrossRef] [Green Version]
- Jamei, E.; Mortimer, M.; Seyedmahmoudian, M.; Horan, B.; Stojcevski, A. Investigating the Role of Virtual Reality in Planning for Sustainable Smart Cities. Sustainability 2017, 9, 2006. [Google Scholar] [CrossRef] [Green Version]
- Alexander, E.R. The Planner-Prince: Interdependence, Rationalities and Post-communicative Practice. Plan. Theory Pr. 2001, 2, 311–324. [Google Scholar] [CrossRef]
- Healey, P. Collaborative Planning: Shaping Places in Fragmented Societies; Macmillan: London, UK, 1997; ISBN 0-333-49574-8. [Google Scholar]
- Haughton, G.; McManus, P. Participation in Postpolitical Times. J. Am. Plan. Assoc. 2019, 85, 321–334. [Google Scholar] [CrossRef]
- Meenar, M.; Howell, J.P.; Hachadorian, J. Economic, ecological, and equity dimensions of brownfield redevelopment plans for environmental justice communities in the USA. Local Environ. 2019, 24, 901–915. [Google Scholar] [CrossRef]
- Mandarano, L.; Meenar, M. E-Participation: Comparing Trends in Practice and the Classroom. Plan. Pr. Res. 2015, 30, 1–19. [Google Scholar] [CrossRef]
- Dannevig, T.; Thorvaldsen, J.A.; Hassan, R. Immersive Virtual Reality in Landscape Planning. In Proceedings of the Digitizing Architecture: Formalization and Content: 4th International Conference Proceedings of the Arab Society for Computer Aided Architectural Design, Manama, Bahrain, 11–12 May 2009; pp. 349–364. [Google Scholar]
- Boulos, M.N.K.; Lu, Z.; Guerrero, P.; Jennett, C.; Steed, A. From urban planning and emergency training to Pokémon Go: Applications of virtual reality GIS (VRGIS) and augmented reality GIS (ARGIS) in personal, public and environmental health. Int. J. Health Geogr. 2017, 16, 7. [Google Scholar] [CrossRef] [Green Version]
- Zhang, Y.; Shen, Z.; Liu, S. Virtual reality with the integrated automatic presentation scrip for improving concepts understanding of Urban Design—A case study in Tatsumi region of Tokyo Bay zone, Japan. Multimed. Tools Appl. 2018, 79, 3125–3144. [Google Scholar] [CrossRef]
- Sanchez, G.M.E.; Van Renterghem, T.; Sun, K.; De Coensel, B.; Botteldooren, D. Using Virtual Reality for assessing the role of noise in the audio-visual design of an urban public space. Landsc. Urban Plan. 2017, 167, 98–107. [Google Scholar] [CrossRef] [Green Version]
- Jiang, L.; Masullo, M.; Maffei, L.; Meng, F.; Vorländer, M. A demonstrator tool of web-based virtual reality for participatory evaluation of urban sound environment. Landsc. Urban Plan. 2018, 170, 276–282. [Google Scholar] [CrossRef]
- Portman, M.; Natapov, A.; Fisher-Gewirtzman, D. To go where no man has gone before: Virtual reality in architecture, landscape architecture and environmental planning. Comput. Environ. Urban Syst. 2015, 54, 376–384. [Google Scholar] [CrossRef]
- Maffei, L.; Masullo, M.; Pascale, A.; Ruggiero, G.; Romero, V.P.; Luigi, M.; Aniello, P.; Gennaro, R.; Virginia, P.R. Immersive virtual reality in community planning: Acoustic and visual congruence of simulated vs real world. Sustain. Cities Soc. 2016, 27, 338–345. [Google Scholar] [CrossRef]
- Schrom-Feiertag, H.; Lorenz, F.; Regal, G.; Settgast, V. Augmented and Virtual Reality Applied for Innovative, Inclusive and Efficient Participatory Planning. In Proceedings of the 7th Transport Research Arena, Vienna, Austria, 16–19 April 2018. [Google Scholar] [CrossRef]
- Fares, F.; Taha, D.S.; Sayad, Z.E.L. Achieving public participation in inaccessible areas using virtual reality a case study of Beit Hanoun—Gaza—Palestine. Alex. Eng. J. 2018, 57, 1821–1828. [Google Scholar] [CrossRef]
- Stauskis, G. Development of methods and practices of virtual reality as a tool for participatory urban planning: A case study of Vilnius City as an example for improving environmental, social and energy sustainability. Energy Sustain. Soc. 2014, 4, 7. [Google Scholar] [CrossRef] [Green Version]
- Aukstakalnis, S.; Blatner, D.; Roth, S. Silicon Mirage: The Art and Science of Virtual Reality; Peachpit Press: Berkeley, CA, USA, 1992; ISBN 978-0-938151-82-1. [Google Scholar]
- Isar, C. A Glance into Virtual Reality Development Using Unity. Inform. Econ. 2018, 22, 14–22. [Google Scholar] [CrossRef]
- Kim, J.; Kim, S.-N. Finding the Optimal D/H Ratio for an Enclosed Urban Square: Testing an Urban Design Principle Using Immersive Virtual Reality Simulation Techniques. Int. J. Environ. Res. Public Health 2019, 16, 865. [Google Scholar] [CrossRef] [Green Version]
- Ruotolo, F.; Senese, V.P.; Ruggiero, G.; Maffei, L.; Masullo, M.; Iachini, T. Individual reactions to a multisensory immersive virtual environment: The impact of a wind farm on individuals. Cogn. Process. 2012, 13, 319–323. [Google Scholar] [CrossRef]
- Henshaw, V. Urban Smellscapes: Understanding and Designing City Smell Environments; Routledge: London, UK, 2013; ISBN 9780415662062. [Google Scholar]
- Kitson, J.; Leiva, M.; Christman, Z.; Dalton, P. Evaluating Urban Odor with Field Olfactometry in Camden, NJ. Urban Sci. 2019, 3, 93. [Google Scholar] [CrossRef] [Green Version]
- Lynch, K. The Image of the City; MIT Press: Cambridge, MA, USA, 1960; Volume 11, ISBN 0-262-62001-4. [Google Scholar]
- Curtis, J.W. Transcribing from the Mind to the Map: Tracing the Evolution of a Concept. Geogr. Rev. 2016, 106, 338–359. [Google Scholar] [CrossRef]
- Meenar, M.; Afzalan, N.; Hajrasouliha, A. Analyzing Lynch’s City Imageability in the Digital Age. J. Plan. Educ. Res. 2019. [Google Scholar] [CrossRef]
- Pánek, J.; Benediktsson, K. Emotional mapping and its participatory potential: Opinions about cycling conditions in Reykjavík, Iceland. Cities 2017, 61, 65–73. [Google Scholar] [CrossRef]
- Meenar, M.; Flamm, B.; Keenan, K. Mapping the Emotional Experience of Travel to Understand Cycle-Transit User Behavior. Sustainability 2019, 11, 4743. [Google Scholar] [CrossRef] [Green Version]
- Krippendorff, K. Content Analysis: An Introduction to its Methodology, 2nd ed.; Sage Publications: Thousand Oaks, CA, USA, 2004. [Google Scholar]
- Krippendorff, K. Reliability in Content Analysis: Some Common Misconceptions and Recommendations. Hum. Commun. Res. 2004, 30, 411–433. [Google Scholar] [CrossRef]
- Botchwey, N.; Johnson, N.; O’Connell, L.K.; Kim, A.J. Including Youth in the Ladder of Citizen Participation. J. Am. Plan. Assoc. 2019, 85, 255–270. [Google Scholar] [CrossRef]
- Carbonell-Carrera, C.; Saorin, J.L.; Melian-Diaz, D.; Hess-Medler, S. Spatial Orientation Skill Performance with a Workshop Based on Green Infrastructure in Cities. ISPRS Int. J. Geo-Inf. 2020, 9, 216. [Google Scholar] [CrossRef] [Green Version]
- Allen, R.; Slotterback, C.S. Building immigrant engagement practice in urban planning: The case of Somali refugees in the Twin Cities. J. Urban Aff. 2017, 1–16. [Google Scholar] [CrossRef]
- Umemoto, K. Walking in another’s shoes: Epistemological challenges in participatory planning. J. Plan. Educ. Res. 2001, 21, 17–31. [Google Scholar] [CrossRef]
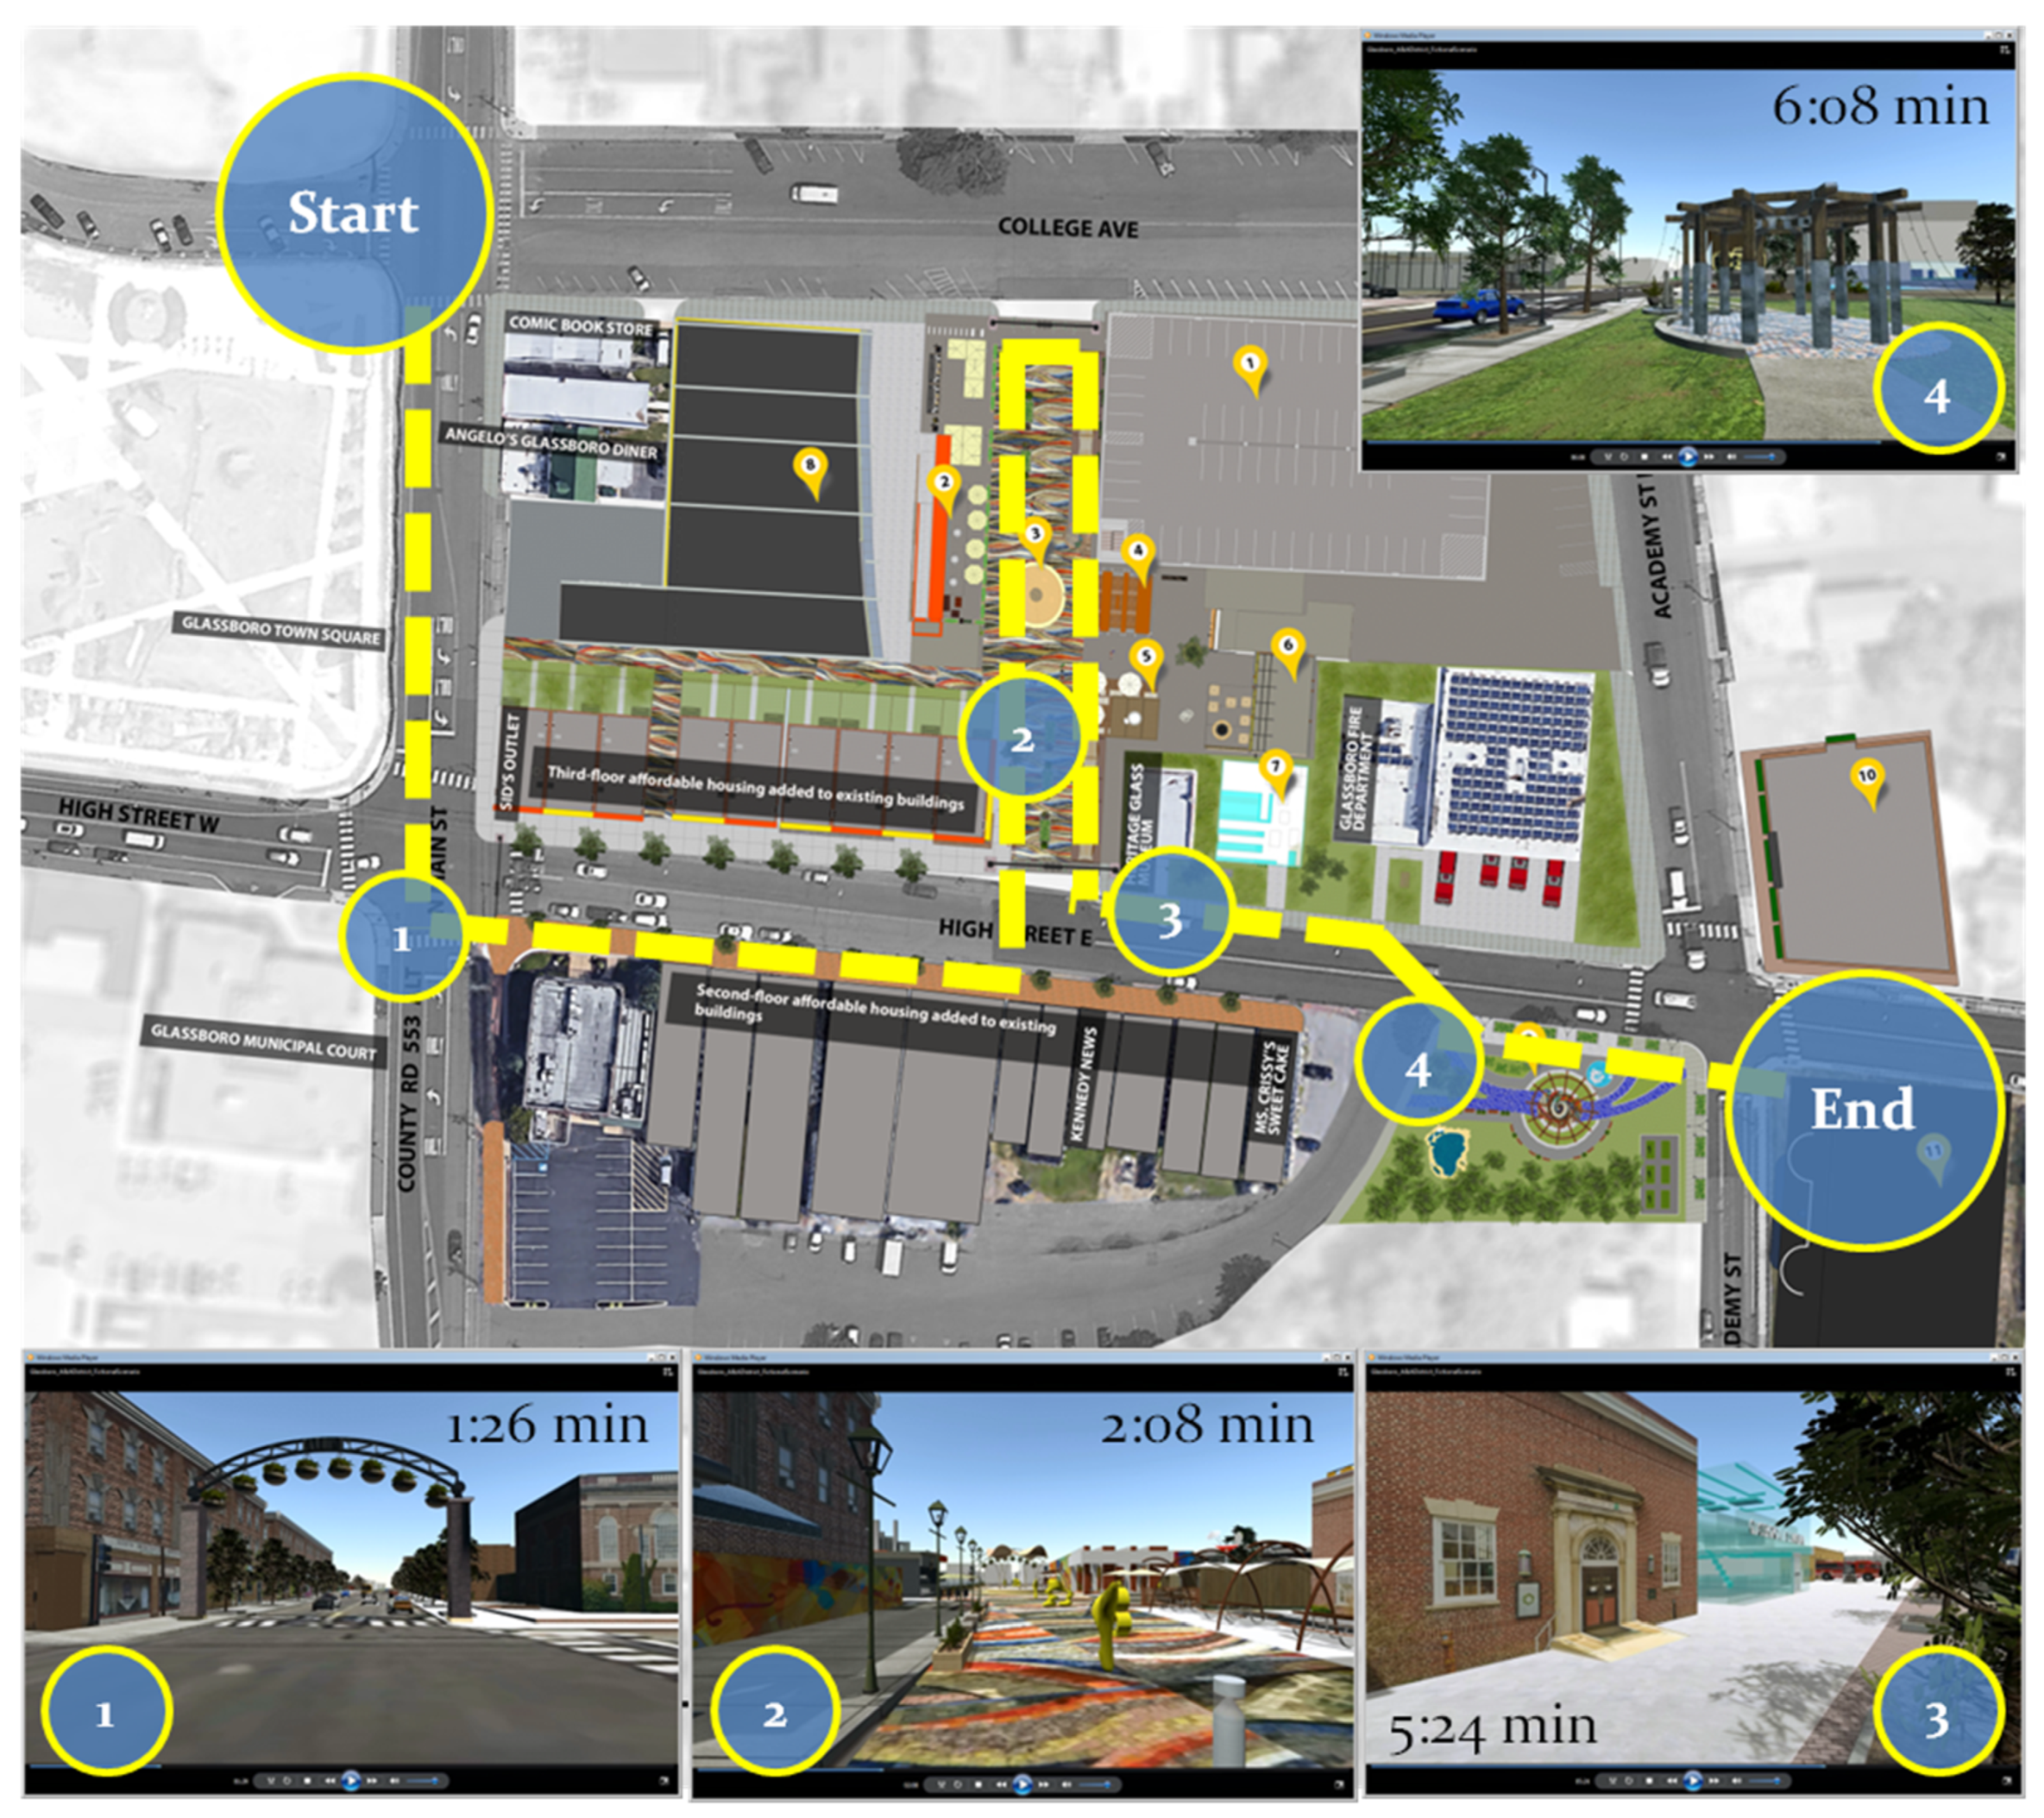
Figure 1.
The study area and guided walking path for IVR simulation. Examples of four places/turning points are represented as locations 1, 2, 3 and 4, along with their respective “eye-level” visuals. #1 is the entrance point of High Street—the main walking path of the simulated environment. #2 shows a pedestrian-friendly linear open space with potential vendors, performance stages, and seating arrangements. #3 offers a street-level view of the historic Heritage Glass Museum along with a proposed contemporary glass museum. Finally, #4 represents the entrance of a proposed pocket park (see more details in Figure 2).

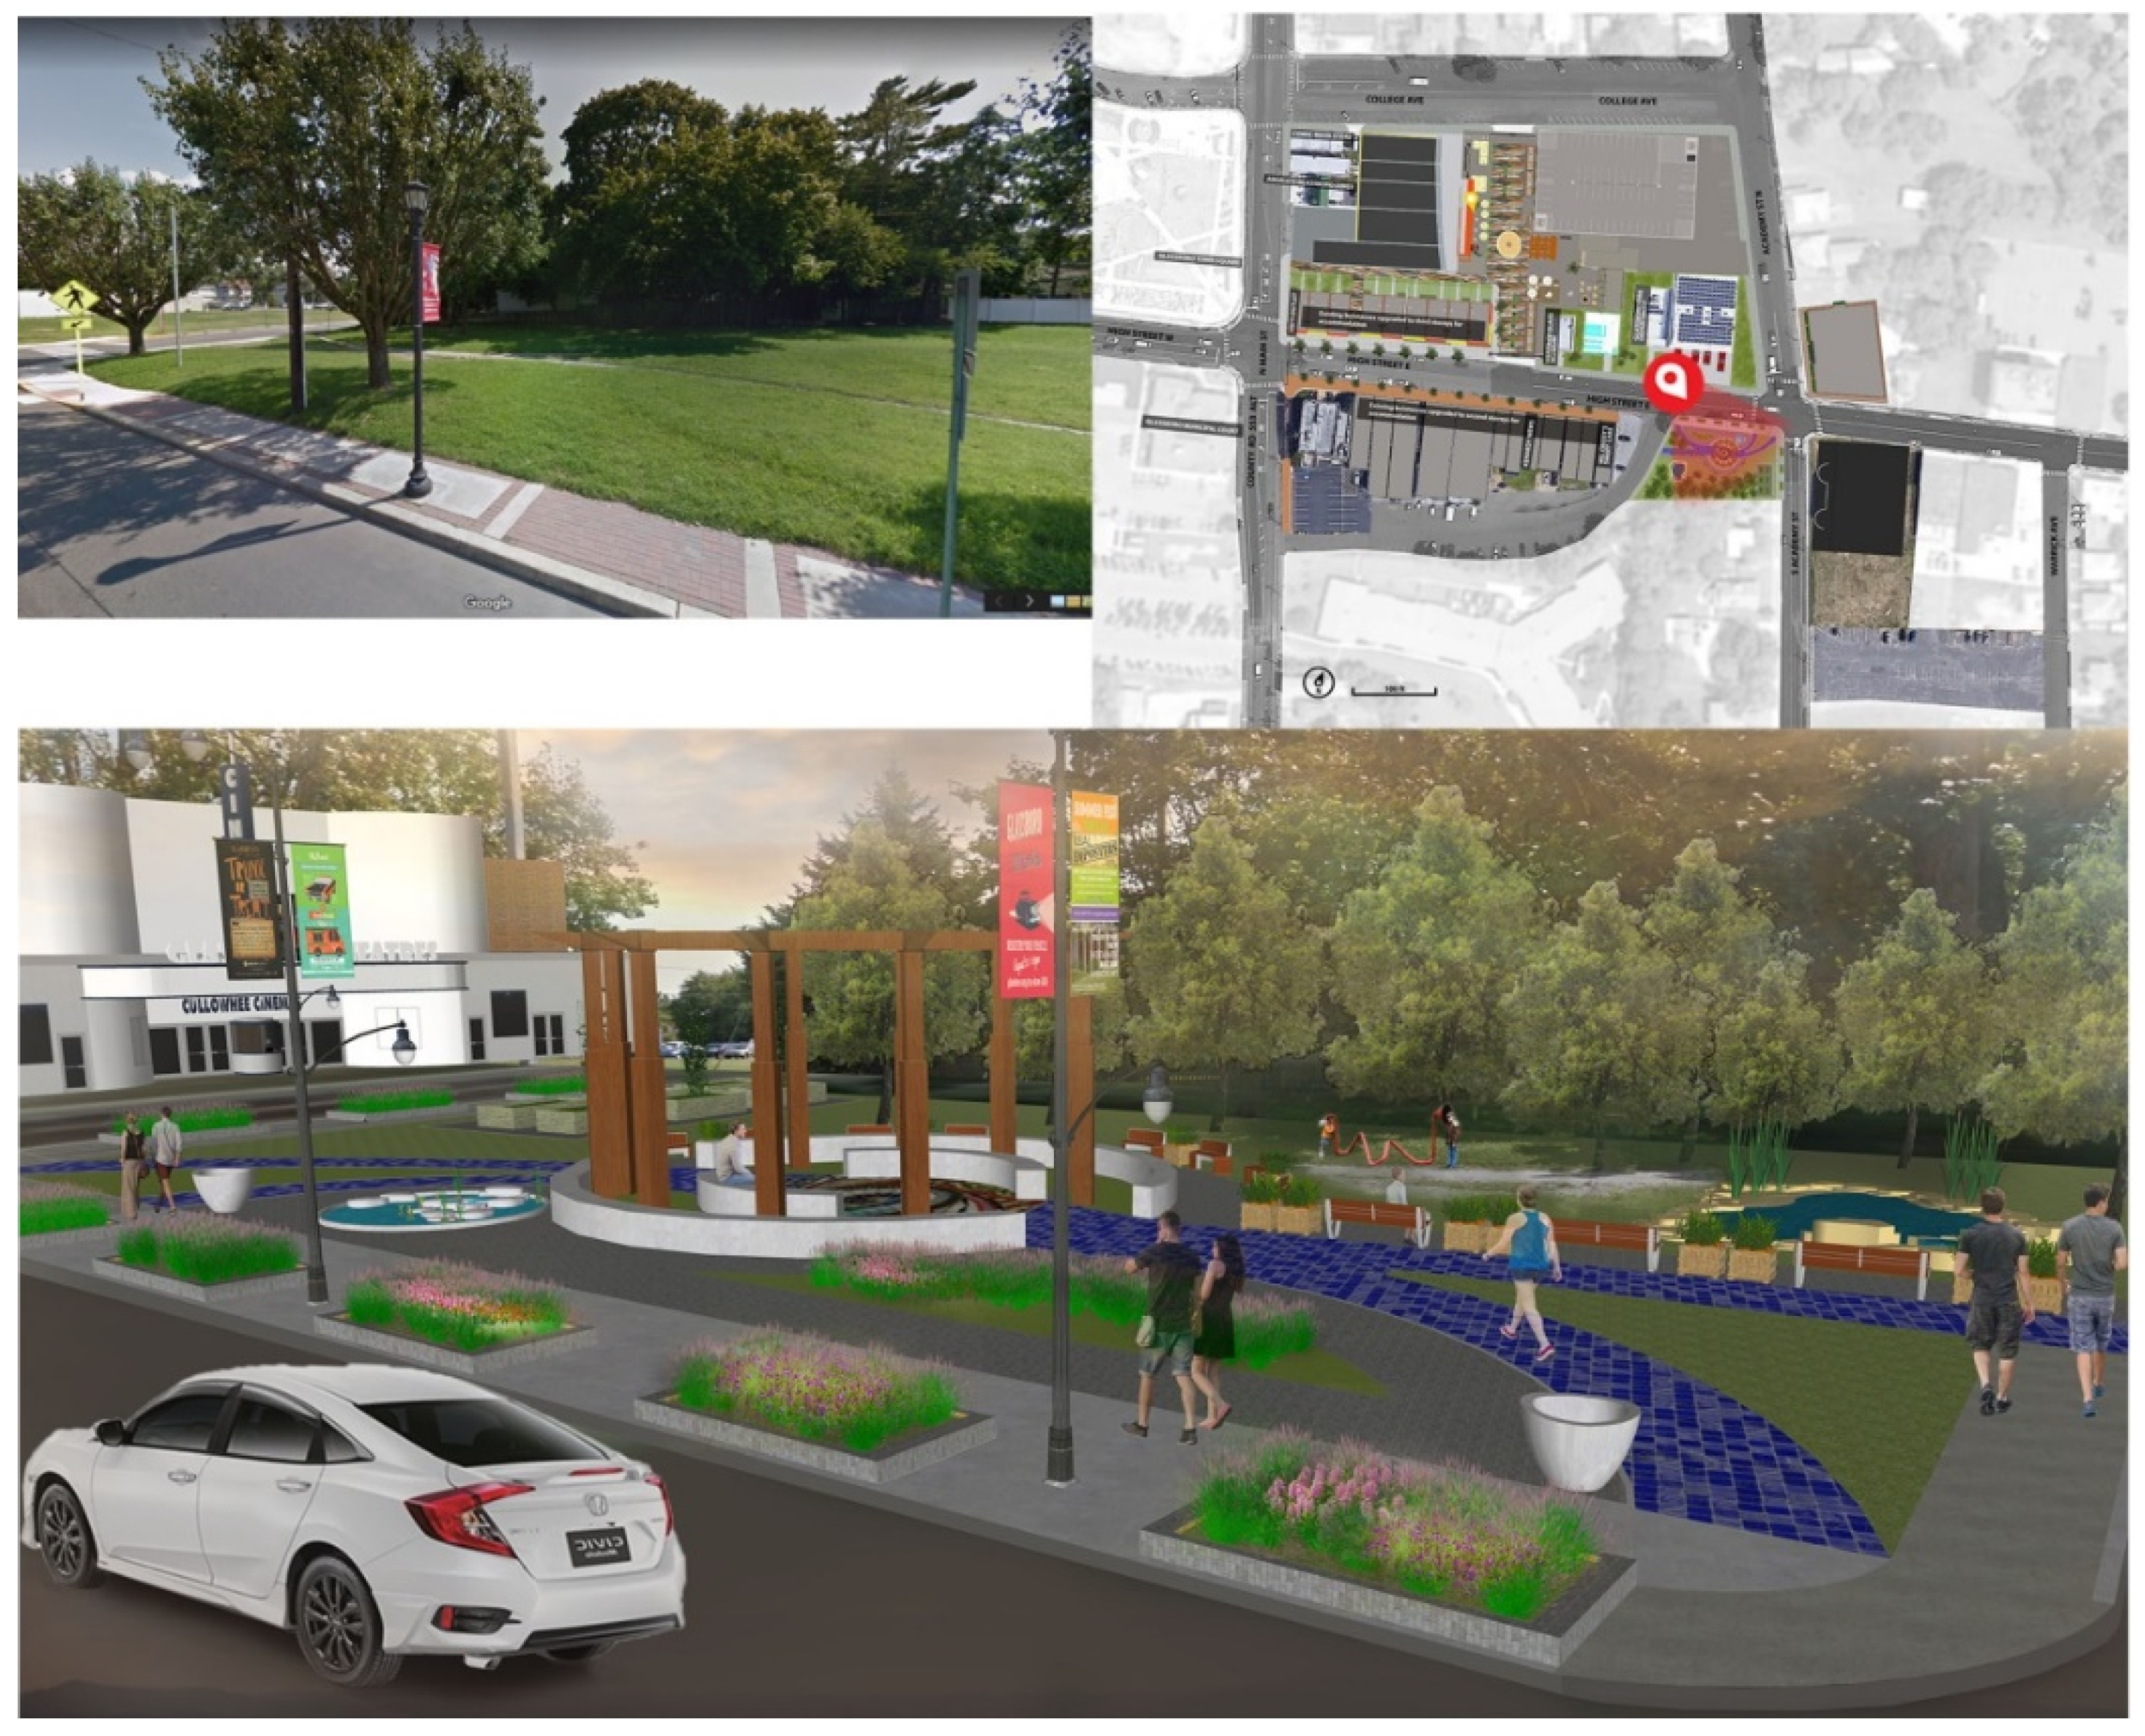
Figure 2.
Existing and future conditions of a pocket park.

Figure 3.
(a) Focus group participants experiencing an immersive virtual reality (IVR) simulation in the CAVE lab. (b) A participant working on a mental map.
Figure 3.
(a) Focus group participants experiencing an immersive virtual reality (IVR) simulation in the CAVE lab. (b) A participant working on a mental map.

Figure 4.
Percentage of change between two sessions among 10 members of Focus Group 4.


Table 1.
A compilation of data collected from four focus groups.
| Focus Group 1 | Focus Group 2 | Focus Group 3 | Focus Group 4 | ||
|---|---|---|---|---|---|
| First Session | Second Session | ||||
| 2D Video of 3D Simulation (No IVR) | 3D IVR Simulation | Multi-sensory 4D IVR Simulation | 2D Video of 3D Simulation (No IVR) | Multi-sensory 4D IVR Simulation | |
| (a) Public Interaction Through Comments and Questions (Section 4.1) | |||||
| Number of Comments Discussed | 17 | 63 | 77 | 42 | 70 |
| Number of Questions Asked | 31 | 48 | 57 | 48 | 56 |
| Content Questions | 24 | 28 | 32 | 35 | 31 |
| Visualization Questions | 4 | 13 | 16 | 4 | 14 |
| Purpose /Logistics Questions | 3 | 7 | 9 | 9 | 11 |
| (b) Memory Recall of Future Planning Scenario (Section 4.2) | |||||
| Number of Design Elements Recalled | 128 | 192 | 166 | 161 | 242 |
| (c) Emotional Responses to Future Planning Scenario (Section 4.3) | |||||
| Number of Emotional Responses Offered | 47 | 75 | 57 | 39 | 69 |
| Positive Emotions | 32 | 56 | 35 | 22 | 36 |
| Negative Emotions | 15 | 19 | 22 | 17 | 33 |
| Familiarity with Study Area | Moderate, 60% High, 40% | Moderate, 70% High, 30% | Low, 20% Moderate, 80% | High, 100% | |
| Familiarity with VR Technology | Moderate, 100% | Moderate, 80% High, 20% | Low, 20% Moderate, 80% | Moderate, 100% | |
Table 2.
Interaction records of comments or questions made by focus group 4 participants.
| First Session | Second Session | % Change | |
|---|---|---|---|
| 2D Video of 3D Simulation (No IVR) | Multi-sensory 4D IVR Simulation | ||
| # Comments Discussed | 42 (Total) | 70 (Total) | 67 |
| Participant 1 | 5 | 8 | 60 |
| Participant 2 | 4 | 8 | 100 |
| Participant 3 | 7 | 13 | 86 |
| Participant 4 | 9 | 12 | 33 |
| Participant 5 | 2 | 7 | 250 |
| Participant 6 | 3 | 4 | 33 |
| Participant 7 | 3 | 4 | 33 |
| Participant 8 | 1 | 3 | 200 |
| Participant 9 | 2 | 6 | 200 |
| Participant 10 | 6 | 5 | −17 |
| # Questions Asked | 48 (Total) | 56 (Total) | 17 |
| Participant 1 | 3 | 4 | 33 |
| Participant 2 | 5 | 7 | 40 |
| Participant 3 | 8 | 9 | 13 |
| Participant 4 | 11 | 10 | −9 |
| Participant 5 | 4 | 5 | 25 |
| Participant 6 | 2 | 3 | 50 |
| Participant 7 | 4 | 5 | 25 |
| Participant 8 | 4 | 6 | 50 |
| Participant 9 | 3 | 4 | 33 |
| Participant 10 | 4 | 3 | −25 |
Table 3.
Memory recall records on mental maps created by focus group 4 participants.
| First Session | Second Session | % Change | |
|---|---|---|---|
| 2D Video of 3D Simulation (No IVR) | Multi-sensory 4D IVR Simulation | ||
| # Design Elements Recalled | 161 (Total) | 242 (Total) | 50 |
| Participant 1 | 15 | 22 | 47 |
| Participant 2 | 14 | 25 | 79 |
| Participant 3 | 12 | 16 | 33 |
| Participant 4 | 22 | 30 | 36 |
| Participant 5 | 29 | 36 | 24 |
| Participant 6 | 11 | 23 | 109 |
| Participant 7 | 17 | 27 | 59 |
| Participant 8 | 13 | 21 | 62 |
| Participant 9 | 19 | 29 | 53 |
| Participant 10 | 9 | 13 | 44 |
Table 4.
Number of emotional responses offered by focus group 4 participants.
| First Session | Second Session | % Change | |
|---|---|---|---|
| 2D Video of 3D Simulation (No IVR) | Multi-sensory 4D IVR Simulation | ||
| Positive Emotions | 22 (Total) | 36 (Total) | 64 |
| Participant 1 | 2 | 2 | 0 |
| Participant 2 | 3 | 4 | 33 |
| Participant 3 | 3 | 3 | 0 |
| Participant 4 | 2 | 3 | 50 |
| Participant 5 | 3 | 6 | 100 |
| Participant 6 | 3 | 5 | 67 |
| Participant 7 | 1 | 3 | 200 |
| Participant 8 | 2 | 4 | 100 |
| Participant 9 | 1 | 3 | 200 |
| Participant 10 | 2 | 3 | 50 |
| Negative Emotions | 17 (Total) | 33 (Total) | 94 |
| Participant 1 | 1 | 3 | 200 |
| Participant 2 | 1 | 2 | 100 |
| Participant 3 | 2 | 3 | 50 |
| Participant 4 | 3 | 5 | 67 |
| Participant 5 | 3 | 4 | 33 |
| Participant 6 | 1 | 2 | 100 |
| Participant 7 | 2 | 3 | 50 |
| Participant 8 | 2 | 5 | 150 |
| Participant 9 | 1 | 2 | 100 |
| Participant 10 | 1 | 3 | 200 |
Table 5.
Strengths and limitations of IVR simulations.
| Category | Details | Sample Quotes |
|---|---|---|
| Strength | Elevated sensory experience and emotional response | “With [IVR], my buy-in as a human being is to absorb all of the sounds and smells.” “... Because I was able to walk through those areas, I was able to see things that I didn’t see in the [2D] video.” “It’s an experiential journey... a vision slowly unfolding in front of you is exciting to watch rather than a typical presentation.” |
| Better understanding of scale and navigability of design proposals | “[IVR] gave me a more accurate version of place and space.” “With [IVR], I was more aware of building locations and scale.” | |
| Limitations | Motion sickness and discomfort due to IVR technology | “The tempo, awkward camera angles, elevation changes and quick unrealistic turns got me a little dizzy, nauseous.” “It made me feel uncomfortable, like I was running into the things that were solid.” |
| Low buy-in due to visual and sensory design flaws | “The big distraction was the people with same cadence and similar expressions.” “The sound was disturbing and unnatural... It was like one sound clip, then another with higher volume, then an overpowering popcorn scent at the end.” | |
| Increased time and budget for public participation | “Many towns won’t be able to do [IVR] as they can’t afford the technology.” |
© 2020 by the authors. Licensee MDPI, Basel, Switzerland. This article is an open access article distributed under the terms and conditions of the Creative Commons Attribution (CC BY) license (http://creativecommons.org/licenses/by/4.0/).
Share and Cite
MDPI and ACS Style
Meenar, M.; Kitson, J. Using Multi-Sensory and Multi-Dimensional Immersive Virtual Reality in Participatory Planning. Urban Sci. 2020, 4, 34. https://0-doi-org.brum.beds.ac.uk/10.3390/urbansci4030034
AMA Style
Meenar M, Kitson J. Using Multi-Sensory and Multi-Dimensional Immersive Virtual Reality in Participatory Planning. Urban Science. 2020; 4(3):34. https://0-doi-org.brum.beds.ac.uk/10.3390/urbansci4030034
Chicago/Turabian StyleMeenar, Mahbubur, and Jennifer Kitson. 2020. "Using Multi-Sensory and Multi-Dimensional Immersive Virtual Reality in Participatory Planning" Urban Science 4, no. 3: 34. https://0-doi-org.brum.beds.ac.uk/10.3390/urbansci4030034