On the Reliable Generation of 3D City Models from Open Data
by
 , , and
Renoy Girindran
1, 
Doreen S Boyd
1,* ,
,
Julian Rosser
1,
Dhanya Vijayan
2 ,
,
Gavin Long
1 and
Darren Robinson
3 1
School of Geography, University of Nottingham, Nottingham NG7 2RD, UK
2
Leibniz Centre for Agricultural Landscape Research (ZALF), 15374 Müncheberg, Germany
3
School of Architecture, University of Sheffield, Sheffield S10 2TN, UK
*
Author to whom correspondence should be addressed.
Urban Sci. 2020, 4(4), 47; https://0-doi-org.brum.beds.ac.uk/10.3390/urbansci4040047
Submission received: 15 June 2020
/
Revised: 9 September 2020
/
Accepted: 27 September 2020
/
Published: 29 September 2020
Abstract
:A 3D model communicates more effectively than a 2D model, hence the applications of 3D city models are rapidly gaining significance in urban studies. However, presently, there is a dearth of free of cost, high-resolution 3D city models available for use. This paper offers potential solutions to this problem by providing a globally replicable methodology to generate low-cost 3D city models from open source 2D building data in conjunction with open satellite-based elevation datasets. Two geographically and morphologically different case studies were used to develop and test this methodology: the Chinese city of Shanghai and the city of Nottingham in the UK. The method is based principally on OpenStreetMap (OSM) and Advanced Land Observing Satellite World 3D digital surface model (AW3D DSM) data and use GMTED 2010 DTM data for undulating terrain. Further enhancement of the resultant 3D model, though not compulsory, uses higher resolution elevation models that are not always open source, but if available can be used (i.e., airborne LiDAR generated DTM). Further we test and develop methods to improve the accuracy of the generated 3D models, employing a small subset of high resolution data that are not open source but can be purchased with a minimal budgets. Given these scenarios of data availability are globally applicable and time-efficient for 3D building generation (where 2D building footprints are available), our proposed methodology has the potential to accelerate the production of 3D city models, and thus to facilitate their dependent applications (e.g., disaster management) wherever commercial 3D city models are unavailable.
1. Introduction
Three-dimensional city models have become an important resource for planning, development, and policymaking in urban areas [1,2,3,4,5]. A 3D city model is a digital model of an urban environment with a three-dimensional geometry of urban structures, as well as related objects belonging to urban areas [6]. Applications using 3D city models have increased in their scope and complexity [7], spanning from the analysis of electromagnetic propagation for telecommunications through environmental simulations analysing irradiation distribution [8,9] and noise propagation [10] to virtual or augmented reality applications [11,12]. This proliferation of applications is, in turn, driving an increasing demand for the creation and maintenance of reliable 3D city models. A standard approach to creating city models at a large scale automatically or semi-automatically is to apply stereo vision on aerial or satellite remote sensing imagery [3]. This, however, can be an expensive and/or time/labour-consuming process, particularly if high levels of accuracy in model outputs are required [13]. As a result, large-scale 3D city models are mostly available in countries with developed economies and/or those with national mapping agencies, while countries, including many that are transitioning their economies (and where this information is perhaps of most value), do not have the resources available to produce them [4]. An approach underpinned by suitable open data could fill this gap in capability.
Three-dimensional city models are characterized by their level of detail (LOD) [14]. The CityGML standard defines five levels of details (LOD) from LOD0 to LOD4. The coarsest level, LOD0, represents the lowest level of geometry as a 2.5D DTM (digital terrain model) with building footprints or roof edge polygons. It is used for regional and landscape applications. LOD1, is well-known as a block model. In LOD1, the building height would be extruded with flat roofs. It is used for city and region coverage. In LOD2, buildings have differentiated roof structures and thematically differentiated boundary surfaces based on LOD1 models. It is applicable for city districts. LOD3 will add specific roof and wall structure details, such as doors and windows, to LOD2 models and it denotes architectural models. This one is widely used for landmarks. LOD4 gives interior structures, like doors, stairs, etc., within the buildings [15,16,17]. An increase in the LOD of a model enables more applications, but it also increases data demands and their processing involves higher computational costs [14,18,19].
Many applications of 3D city models require only low level of details—LOD1 (e.g., vulnerability models, disaster mitigation, climate change and energy models). Here, we investigate the production of spatially reliable and globally replicable 3D city models using open-licensed data in order to support that category of user. This research forms part of a wider project, ‘Sustaining Urban Habitats: An interdisciplinary approach’, which aimed to explore ways of combining environmental and economic modelling with social and cultural ethnographic work. The focus of the project was on two contrasting cities: a growth city in China (Shanghai) and a relatively stable city in Europe (Nottingham). During the implementation of the wider project, the dearth of accurate 3D models for many cities globally, including Shanghai, was observed. The project had very little budget to acquire data and thus raised the challenge of how to produce a 3D city model from open data. This study did not aim to alternate commercial 3D city models with 3D city models from open data, instead, it focused on presenting a method that produces 3D city models from open data (only) to serve those regions that cannot acquire commercial data. Given that open datasets are usually characterized by low resolution, we present a method capable of producing the desired LOD 1 city model for anywhere.
Possibilities of extracting building heights from open digital surface models (DSM) and digital elevation models (DEM) have previously been attempted [20,21]. These include extraction of building heights from the Shuttle Radar Topographic Mission (SRTM), the Advanced Spaceborne Thermal Emission and Reflection Radiometer Digital Elevation Model (ASTER DEM), Advanced Land Observing Satellite ALOS World 3D (AW3D) DSM, and TerraSAR-X add-on for digital elevation measurements (TanDEM-X). However, using DSMs alone cannot provide exact building heights or shapes. Rather it will result in more generalized individual building heights and distorted shapes due to issues of mixed pixels [21]. Using 2D data of building footprints along with high resolution DSMs can be a possible solution to extract individual building heights without distorting the building shapes. The approach is predicated on the availability of open-source 2D spatial datasets, such as OpenStreetMap (OSM), albeit with varying degrees of completeness and reliability, to provide building footprint geometries. However, the third dimension is poorly represented in these datasets; less than 2.5% of the nodes in the OSM database carry an elevation attribute [22,23]. The recently available satellite-derived elevation datasets provide an opportunity for data fusion by incorporating the elevation data with open-licensed 2D building data to generate 3D models. Indeed Bagheri et al. generated LOD1 height values using multisensor and multimodal DEM fusion techniques—TanDEM-X DEM and Cartosat-1 DEM data were joined with OpenStreetMap building footprints [24]. This study confirmed that simple, prismatic building models can be reconstructed by combining OpenStreetMap building footprints with remote sensing-derived geodata. However, the assumption of a flat terrain at a constant height restricts globally applicability of this approach. Furthermore, Cartosat-1 data are not currently global in availability. Required, therefore, is a methodology that considers the terrain underlying the urban area of interest and uses datasets that are available worldwide.
In this paper, we used open DSM data as a foundation dataset and utility in a globally replicable methodology to generate 3D city models. Recently available elevation datasets such as the AW3D DSM (with a horizontal spatial resolution of approximately 30 m) by the Japanese Aerospace Exploration Agency (JAXA) have an open license (a higher resolution (approx. 5 m) DSM is also produced, but only as a commercial product [25]). Other common elevation-rich datasets include the ASTER DEM and that from the SRTM. Although these provide mainly terrain (a digital surface model includes all the natural and built features on the earth’s surface, whereas a digital terrain model is simply an elevation surface representing the bare earth referenced to a common vertical datum [26]) elevation values that are freely available under permissive data licenses [27]. We present a methodology that uses open data of 2D building footprints, along with DSM and DTM datasets, to generate 3D buildings in two geographically and morphologically diverse cities, namely the Huangpu district in Shanghai, China, which has a relatively flat topography, and Nottingham, United Kingdom, which has a more undulating terrain. Shanghai and Nottingham are inherently different from each other, not only in terms of physiography but also in terms of level of urbanization. While Shanghai is a rapidly urbanizing city, Nottingham is stabilized and saturated. Hence, these two cities provide end members to transfer the methods globally.
A secondary objective was to consider scenarios of data availability that could improve the overall accuracy of the open source 3D building model generated (which we call a foundation model). Here, we exploited that often higher resolution elevation data are available, though not always, or never, open source, and/or of limited spatial coverage. For instance, there are a number of examples where previously proprietary LiDAR datasets are now being opened, though often these are for cities in the global North [28], or it may be the case that projects to produce 3D city models have a limited budget. Further, here we used the ALOS DSM to generate building heights. AW3D-30 DSM is produced by resampling the 5 m ALOS DSM, resulting in accuracy reduction. Thus, it is not possible to use this low resolution DSM directly in the same way you would with a high resolution commercial dataset. From high resolution DSMs, roof heights or building heights could be easily measured. Whereas, in low resolution ALOS DSM, this is not possible. This study thus also explored the optimal approach to using the ALOS-30m DSM.
2. Materials and Methods
2.1. Study Area
The focus was on two cities of very different scale and character: Nottingham in the UK and Shanghai in China. These two cities also differ considerably with respect to data availability. The diverse topographical and urban morphologies of the two cities afforded a robust assessment of the methodology presented in this paper to produce 3D city models openly.
The city of Nottingham is located 206 km to the north of London, in the East Midlands region of the UK. The city has a total area of 75 km2 and accommodates a total population of 325,000 [29]. Nottingham is situated on an area of low hills along the lower valley of the River Trent and has an undulating topography. The average elevation of Nottingham is about 61 m [30]. Although the population of Nottingham City has recently grown (by 13% between 2000 and 2010 according to the Nottingham City Economic Review, 2011). Compared to Shanghai, the city is less agglomerated with greater proportions of small and medium sized buildings, and far fewer high-rise buildings. Shanghai is also almost two orders of magnitude larger than Nottingham. Four wards were selected from Nottingham that represent the spatial characteristics of the city.
Shanghai, located on the east tip of the Yangtze River Delta and on the east coast of China, is one of the most urbanized areas in China. Being one of the most dynamic cities in the world, it is a difficult city to understand, plan, and manage [31]. With a total area of 6340 km2, it is one of the fastest economically growing and most densely populated cities in East Asia. In 2014, it had a population of more than 24 million. The average elevation of the city varies between 3 to 5 m above mean sea level. At present, Shanghai has 16 districts and one county (Chongming) under its jurisdiction. In the first instance, our focus was on the Huangpu District, due to the complexity of the morphology and environs across this area. Huangpu covers an area of 20 km2 and is located in the city centre. It is comprised of a mixture of very tall buildings (more than 100 m), as well as very old and clustered buildings.
Unlike Nottingham, Shanghai is characterized by flat topography and the average elevation of the city’s terrain is four meters above mean sea level (msl). While Nottingham is less agglomerated, with greater numbers of medium and small sized buildings and far fewer high-rise buildings, Shanghai is occupied by a very dense and complex morphology with large numbers of medium and tall buildings. The availability of open data, including OSM, is very limited and non-uniform in coverage for Shanghai, particularly in comparison with Nottingham. Thus, Shanghai is an ideal case to be compared with Nottingham to gain insights on how our methodology may work across the spectrum of cities in their geographies and morphologies.
2.2. Data
A DSM affords the extraction a variety of features, including terrain, buildings, vegetation, and any other surface features [3]. Hence, the basic principle in obtaining the building heights from the AW3D DSM data was to remove the ground elevation from the DSM. For cities that have a flat terrain, the building heights can be generated by simply subtracting a mean ground elevation from DSM values. Whereas in the case of topographically varying city terrains, digital terrain models (DTM) can be used to obtain the ground elevation. DTMs are similar to DSMs, but exclude surface features. Thus, the datasets to be used with the OpenStreetMap data for Nottingham and Shanghai to produce globally replicable 3D city models were: (1) the open source ALOS DSM, which has a spatial resolution of 30 m and (2) the open source Global Multi-resolution Terrain Elevation (GMTED2010) dataset—the minimum value layer. Although this has a resolution of 225 m, it is used since it is a globally applicable dataset. In addition to the globally available ALOS DSM and GMTED2010 DTM datasets, we explored how additional datasets could enhance the quality of the 3D city models produced for both Nottingham and Shanghai under different scenarios of data availability. For the city of Nottingham, airborne LiDAR-generated DSM and DTM (2 m spatial resolution) were used and for Shanghai a commercial high-resolution DSM (AW3D Enhanced at 2 m spatial resolution) was procured and used. For validation of the 3D city models produced, the BHA MasterMap data set and the AW3D Enhanced were used for Nottingham and Shanghai, respectively. The composition and provenance of all datasets are described below and further details about their purpose is given in Table 1.
2.2.1. OpenStreetMap (OSM)
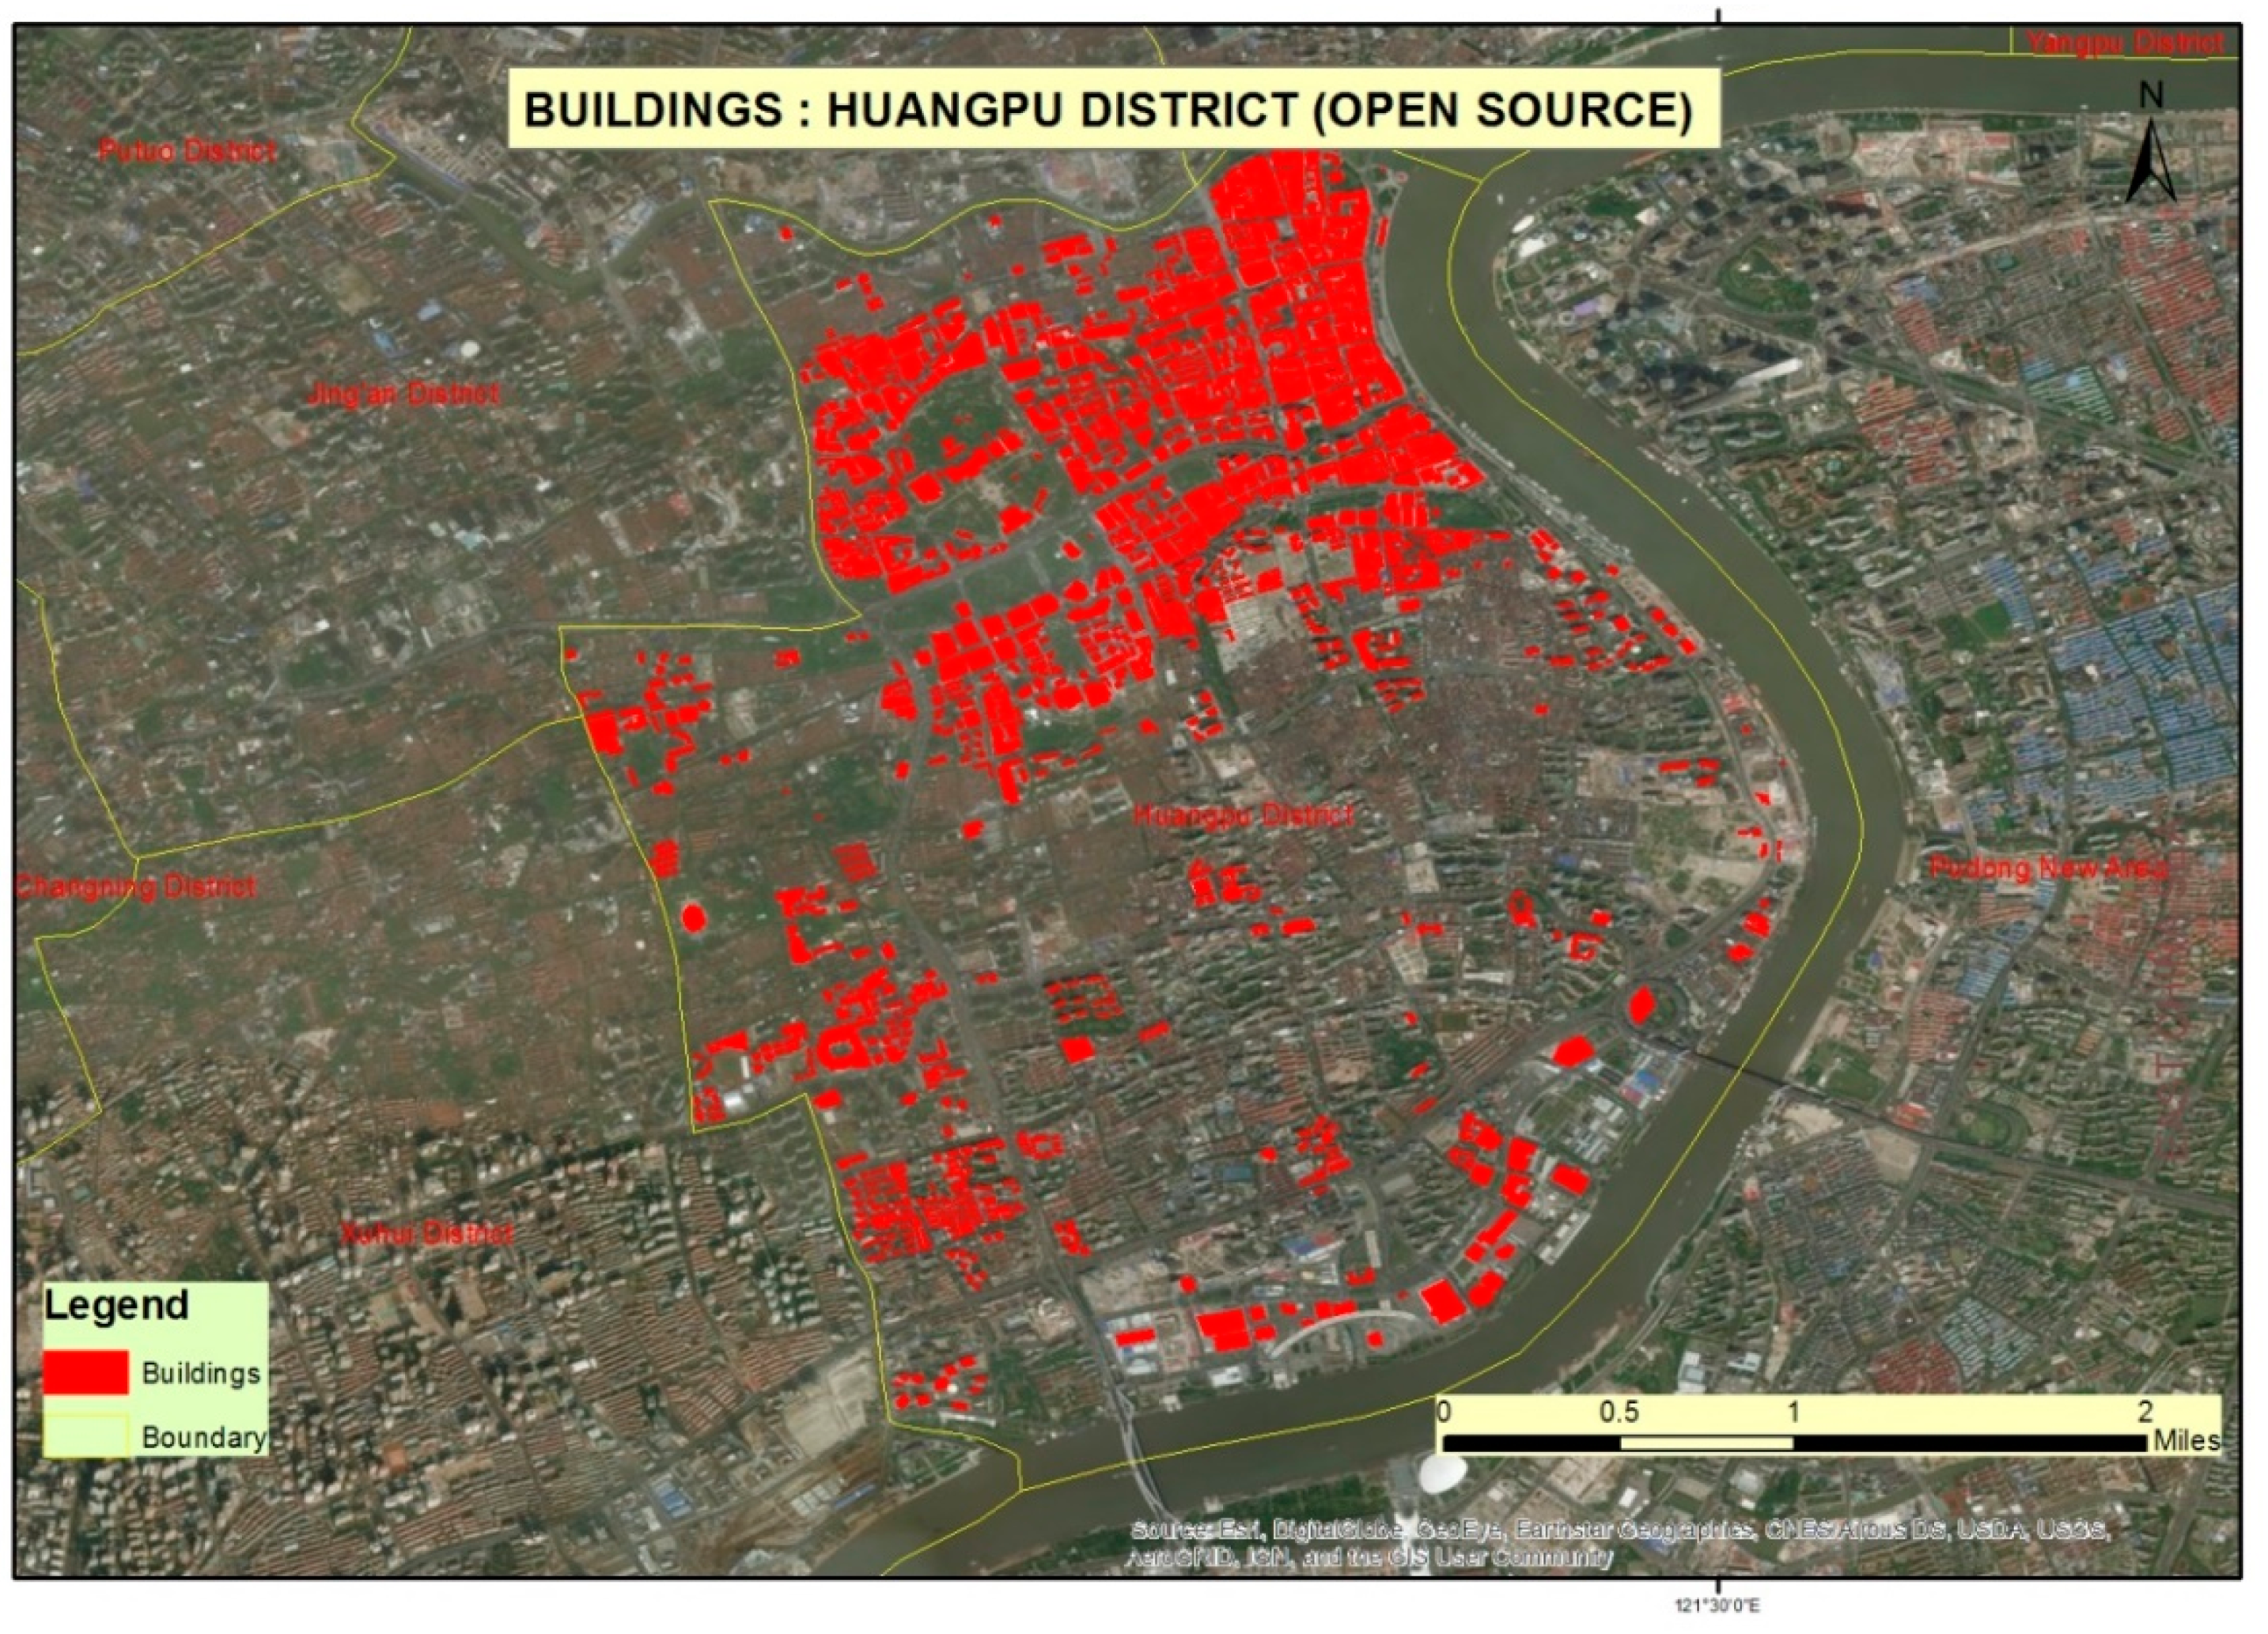
All the required 2D building footprints were gathered from the OSM database [32]. Open GIS data available for Shanghai, China were downloaded from the website mapzen.com, which relies on OSM for many of its products. OSM is a collaborative project to create free editable geographic data and a prominent example of volunteered geographic information [22]. The OSM building footprints (with relevant attribute information) were extracted for the Huangpu district—where the coverage is relatively dense (see Figure 1).
OSM data are available for Nottingham from a number of sources, and include similar data layers as for Shanghai. As with Shanghai, the OSM building layer data for Nottingham is of a higher density in the city centre, with sparser coverage for the residential suburbs. Building footprints vary in their complexity and accuracy compared to the detailed mapping available from the Ordnance Survey’s MasterMap dataset [33] (highest resolution digital mapping available for the UK). For some buildings, the OSM data are visually comparable to its MasterMap counterpart, although we note that in some instances, the OSM footprints have a simplified geometry and often do not include building subdivisions (e.g., between properties of terraced houses).
2.2.2. ALOS DSM (AW3D (at 30 m) and AW3D Enhanced (at 2 m))
The DSM produced by the Japanese Aerospace Exploration Agency (JAXA) is of relatively fine resolution, at about 0.15 arcsec or approx. 5 m [34,35,36]. JAXA used the archived data of the panchromatic remote-sensing instrument for stereo mapping (PRISM) onboard the ALOS to generate a DSM for the whole globe, known as “ALOS World 3D (AW3D)” [37]. The AW3D-30 global dataset, which has a 30 metre spatial resolution (1 arcsec), is a resampled version of the 5 m mesh version of the AW3D [25]. For this work, we used the latest AW3D-30 product, released in May 2017. For both Shanghai and Nottingham, 30 m ALOS DSM data are currently the most precise global scale open source elevation [36] dataset (free to the public since 2015). The AW3D Enhanced product (at 2 m resolution) was also procured, giving a sample covering 16 sq.km of the high resolution DSM at 2 m for our study area in Shanghai.
2.2.3. GMTED2010
GMTED2010 is the digital elevation (DEM) model product of The United States Geological Survey (USGS) and The National Geospatial Intelligence Agency (NGA) to replace the existing model, designed as Global 30 ArcSecond Elevation (GTOPO30), and has been available to the public since 2010 [38,39]. It is available in three resolutions, i.e., with horizontal spacing of 7.5 arc-second (about 250 m), 15 arc-second (about 500 m), and 30 arc-second (about 1 km), and its main data source is a SRTM version with 01” resolution restricted to the NGA and not available to the general public [40]. Other data sources include the Canadian Digital Elevation Data (CDED), SPOT 5 Reference 3D, NED for the continental USA and Alaska, GEODATA 9 Second Digital Elevation Model for Australia, DEMs for Antarctica and Greenland from laser altimetry (ICESat and GLAS data) and satellite radar (ERS-1 data) [38,40]. This study used the minimum band of GMTED2010 with 250 m resolution due to its global coverage.
2.2.4. Digital Terrain and Surface Models Derived from Airborne LiDAR Data for the UK
The UK Environment Agency’s LiDAR data archive contains accurate digital elevation data for over 70% of England [41]. For the city of Nottingham, LiDAR-derived DSM and DTM at 2 m resolution are openly available. For the present study, we used this dataset to extract the ground elevation value for the Nottingham study area in order to enhance the 3D city model produced.
2.2.5. OS Mastermap BHA
The building height attribute (BHA) dataset published in 2014 is an enhancement to the Ordnance Survey (OS) MasterMap Topography Layer. BHA data are not available for the whole country, but it covers major cities and towns of Great Britain. BHA provides a set of height attributes (ground level, base of roof, and the highest part of the roof) for topographic area features with a buildings theme within OS MasterMap Topography Layer. OS publish the data as a single CSV file containing over 20 million records [42,43]. For the present study, we used the BHA data for Nottingham for validation.
2.3. Methodology
The overall methodology adopted is illustrated in Figure 2. The workflow describes different steps to be taken that are dependent, first, on the terrain on which an urban area resides and, second, on whether there are any relevant additional datasets available The foundation workflow yields a 3D model output possible for all urban areas globally, with the possibility of enhancement of that 3D model should other higher resolution data be available (but are not a necessity). Further details are below.
2.3.1. Generating 3D Buildings from Open Data (Foundation Workflow)
The first stage in applying this methodology is to establish whether the urban area of interest (AOI) has a terrain that is flat or undulating (workflow chart step 1), since this determines whether additional data and processing steps are required, on a building-by-building basis, to identify the building heights. The 2D building polygon data and the AW3D-30 data (i.e., the DSM) subsequently need to be co-registered, ensuring that there is no shift between the datasets.
The methodology is developed to extract the optimal elevation results from the low-resolution AW3D-30 DSM. As stated above the AW3D-30 open dataset has a 30 m spatial resolution (1 arcsec), which is a resampled version of the 5 m mesh version of the AW3D [25], so already the elevation values are the average of many adjacent pixel values. In the case of an urban AOI with a flat terrain (i.e., Shanghai in our example case), the AW3D-30 DSM is joined to the 2D shapefile (workflow chart steps 2A to 6A). The ALOS3D-30 is in raster format and the linear interpolation method is used in to assign the elevation value from raster surface to the vertex of the polygon. This operation will assign a Z value to each vertex of the 2D building polygon. Out of these values, the maximum Z of the geometry is taken as the elevation value since this will reduce the effects of shift caused by different projection systems and to overcome the low resolution of AW3D-30 data. This is because if we calculate an average Z value it may also include ground elevations (i.e., due to height data relating to surfaces beyond the building footprint as AW3D-30 is a resampled version of many adjacent pixels), thereby reducing the overall height value; similarly, if we consider minimum Z there is a chance that this will give the ground elevation directly. It is worth noting that if the DSM was of higher resolution (e.g., 2 m resolution), we would have taken the average Z value within a polygon as the building height. After this process, the mean ground elevation of 4 m (this is the mean elevation of Shanghai) is removed from the AW3D-30 DSM data in order to obtain the building heights (workflow chart steps 7 to 10).
In the case of an undulating terrain (i.e., Nottingham in our example case), building roof heights were computed following the same steps as for Shanghai. However, to accommodate for the change in elevation of the terrain across the urban AOI an alternative workflow is necessary. In this case, to obtain the buildings’ ground elevation, the GMTED2010 (i.e., a DTM) is joined with the 2D building polygon using the same interpolate shape function and the minimum Z of the geometry is calculated and assigned to the attribute table of the 2D building polygon (flow chart step 2B to 6B). Here, the minimum Z is used to reduce the effect of shift in the process. If we use an average or maximum of Z, there is a chance that it may reflect the building height values (the converse of the previous case). Once these steps are complete, the height values of the individual buildings are calculated by subtracting the maximum elevation value obtained from the AW3D-30 DSM with the minimum elevation value obtained from the GMTED2010 DTM. The output generated is the estimated heights of individual buildings (workflow chart steps 7 to 10).
2.3.2. Technical Validation of Building Height (Foundation Workflow)
For Nottingham, our building heights were compared with the building height values provided by the OSGB MasterMap [33]. The computed heights of 15,000 buildings in Nottingham were compared with the corresponding building height attributes (BHA) [33] of the OSGB MasterMap for the city, using arithmetic differencing. Structured Query Languages (SQL) queries were then performed to count the instances of buildings for which height differences h were <1 m, 1 m < h ≤ 2 m, 2 m < h ≤ 5 m, and >5 m, together with the corresponding percentages. For Shanghai, a similar validation exercise was performed. However, for Shanghai, there is no openly available high resolution building height data. Therefore, to validate our results, we used the AW3D Enhanced product at 2 m spatial resolution. This product is stated to be derived from the Digital Globe WorldView satellites [44]. Building heights that are derived from AW3D-30 m could then be cross-checked with the heights derived from this 2 m DSM, and the resultant height values refined (flow chart step 11 and 12). In total, 2027 buildings were used in this validation.
2.3.3. 3D Foundation Model Enhancement
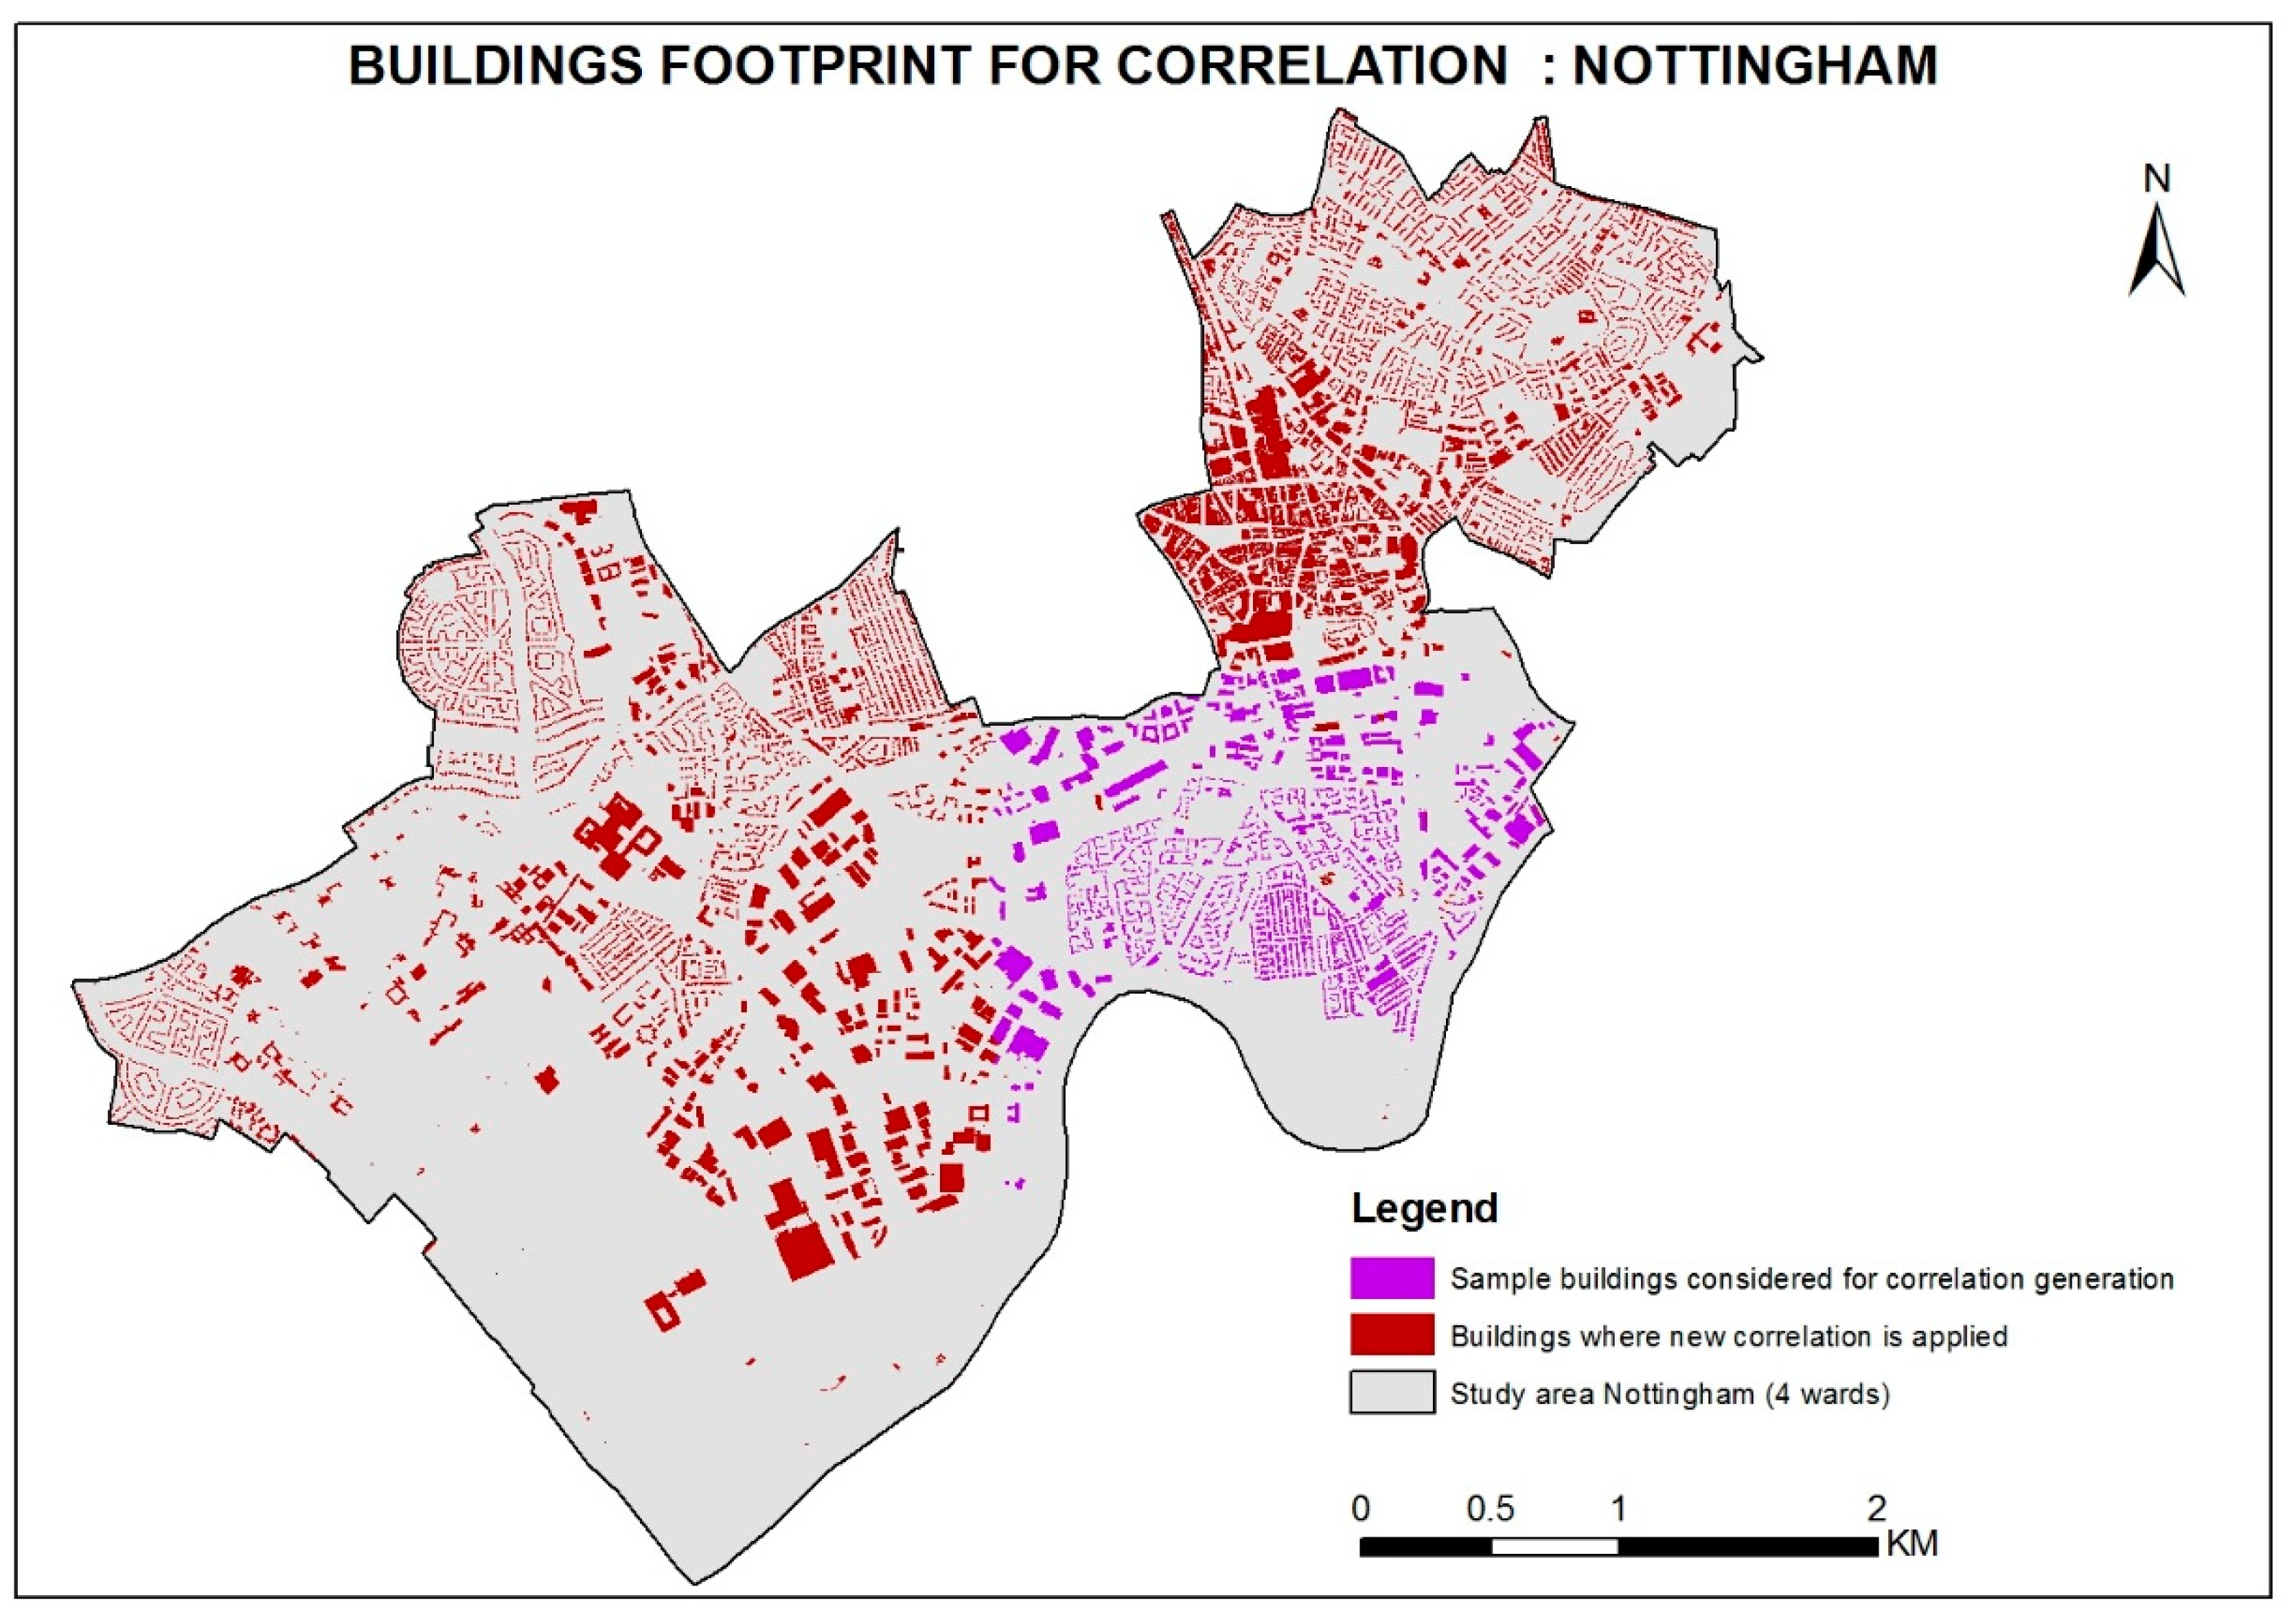
The foundation workflow (Section 2.2.1) produces a 3D city model that is globally replicable, however, it may be the case that higher resolution elevation data are available (open) or could be procured as per limited budgetary resources. These data could enhance the accuracy of 3D buildings in the model by computing the error factor for building heights. The error factor is the deviation of height values generated in the foundation work flow to the height of the corresponding building obtained from high resolution data for each of the cities. Once computed, these values can be used to correct the building heights in other similar areas. For enhancement, a high resolution dataset needs to be available for a representative sample area of the AOI (Figure 3).
We used consistent 1 m interval categories of maximum building height for the polygon concerned (e.g., an approximation of a ridge height for pitched roof houses). This interval selection helps in generating good correlation and is easy to apply to other similar area. For the Nottingham case, the maximum number of building heights observed within the range of 2 m to 8 m was calculated using the AW3D-30 dataset (flowchart step 13 to 15). So, regression equations with 1 m intervals were created for this range (e.g., seven unique categories of building height: 2 ≤ h ≤ 3 m, 3 m < h ≤ 4 m, …, and 7 m < h ≤ 8 m). These 1 m ranges were chosen because they provide improved correlation over other ranges. In order to obtain the regression equations both ALOS-derived heights and high resolution derived heights were exported to the excel scatter plot graphs created, from which a linear regression equation was derived (flowchart step 14). The regression equations derived from different ranges were then employed to correct building heights for all instances of that category that were found within the AW3D-30 dataset, both within and outside the high resolution sample area (flowchart step 16 to 18). The technical validation of the enhanced model was done in a similar way stated for validation of foundation model. This validation was done over exactly the same buildings using the same data that were considered for the validation of foundation model.
3. Results
3.1. Nottingham
After obtaining the foundation 3D model (Figure 4 shows a sample area) for Nottingham (i.e., AW3D-30 derived building heights), we compared these building heights with MasterMap BHA to assess the accuracy of this preliminary result. This revealed that 27.7% of all buildings fall within the accuracy level of +/−1 m elevation, and 51.45% and 84.47% within +/−2 m and +/−5 m, respectively. About 15.53% of buildings were above +/−5 m accuracy level. When we compared both sets of height values, it was observed that a higher level of height difference occurred in the case of taller buildings. The percentage of buildings falling under each error ranges are shown in Figure A1 Appendix A. The low- and medium-rise buildings showed relatively good correlation with the MasterMap BHA values.
In the application of the accuracy enhancement method by way of a sample of high-resolution elevation data, it was determined that the majority of building heights fall within the range of 2 m to 8 m (established using the AW3D-30 dataset). Hence, a regression equation with a 1 m interval was created for this range of 2 m to 8 m in order to enhance the accuracy of the foundation 3D model (Figure A2). This 1 m interval was chosen to obtain good correlation between two datasets of generated AW3D-30 height values and high resolution LiDAR data. The regression equations derived from these categories are given in Table 2 and these were applied to obtain an enhanced 3D city model.
3.1.1. Technical Validation of Enhanced 3D Model
Validation of the enhanced 3D model demonstrated that applying the regression equations to the foundation model had the impact of improving its accuracy across the board. The proportion of buildings in the model having an accuracy level of +/−1 m increased from 27.7% to 32.81% (Table 3), having an accuracy level of +/−2 m increased to 57.43% from 51.45, an accuracy level of +/−5 m increased to 88.46% from 84.47%, and buildings having an error value above +/−5 m were reduced from 15.73% to 11.54%. It was noticed that even after enhancement, there was no significant height value correlation increase in the case of taller buildings.
It is worth noting that, as stated in methodology, we considered maximum elevation value within a polygon as the AW3D-30 DSM height. Using the height generated via the minimum and average elevation value within was not as accurate.
3.1.2. Replacing GMTED 2010 Ground Elevation Data with High Resolution Ground Elevation Data
To understand how the GMTED 2010 DTM data impact on the quality of the foundation 3D model, the model was again constructed using high resolution LiDAR DTM as the ground elevation input along with the AW3D 30 m DSM. Validation using the MasterMap BHA values demonstrated that about 31.43% of total buildings achieved an accuracy within +/−1 m elevation and 60.14% were within +/−2 m (Table 4). Deviations for only 5.27% of all the buildings exceeded +/−5 m, but a significant proportion of the cases having this largest deviation were due to errors in the MasterMap BHA dataset or within AW3D-30 dataset (these errors were identified by cross-checking these individual sites with other datasets like Google Earth™, where open street views are available).
3.2. Shanghai
We considered only a sample of the 2027 OSM buildings of the Huangpu District of Shanghai to generate the 3D model, as well as to calculate a correlation coefficient. The modelled building heights from AW3D-30 DSM for Huangpu District have been compared with the commercial 2 m accuracy DSM that was procured for the study area. Unlike Nottingham, Huangpu, Shanghai has very tall buildings (Figure 5), hence the range of difference between the real height and generated 3D building heights were higher than for Nottingham. It was observed that about 33% of buildings fall within the error range of +/−2 m and about 30% of buildings within an error range of +/−2 m to +/−5 m (see Table A1). The regression equations used to enhance the accuracy of foundation model are given in Table 5.
Technical Validation of Enhanced 3D Model
It was observed from the validation results that the overall accuracy of the foundation 3D model has improved using the accuracy enhancement method. The difference in the percentage of buildings with different accuracy level ranges before and after applying accuracy enhancement methods are given in Table 6. Higher rates of accuracy enhancement were observed for the lower ranges (i.e., up for +/−1 and +/−2). Where the difference in values between the actual height and the generated height increased, there was an observed decrease in accuracy enhancement level. For example, after accuracy enhancement in the range of +/−5 m, the total percentage enhanced from 62.26% to 64.54% only and there was no accuracy increase for +/−10 m accuracy range (Table 6). In lower height deviations (1 or 2 m) level we obtained a good accuracy increase by correlation, but in higher deviation sections (5 or 10 m), the accuracy improvement was relatively lower or null.
Shanghai is characterized by high-rise buildings, hence the ranges considered for accuracy assessment were from +/−1 to more than +/−10 m. Whereas for Nottingham, the maximum range was +/−5 m, since the city is occupied by low-rise buildings. The proportion of buildings having an accuracy of +/−1 m was low (17.66%) in the case of Shanghai, which increased to 28.3% after accuracy enhancement. This contrasts with an accuracy of 27.7% for Nottingham, or 32.81% after accuracy enhancement. While 64.54% of buildings were found to be within the accuracy range of +/−5 m for Shanghai, this was much higher for Nottingham at 88.46% (after enhancement in both cases). Further, even after accuracy enhancement, 20% of all the buildings in Shanghai’s Huangpu District were found to have an error of +/−10 m in their modelled height.
4. Discussion
Three dimensional building models form useful data inputs for many analytical tasks, but their creation typically relies upon time-consuming editing, expensive proprietary datasets, or both. Here, we present a simple method of generating 3D buildings from open data that can be applied globally. The results presented in this paper show that AW3D-30 DSM data provide more accurate results in the case of low- and medium-rise buildings, and that errors can be improved through a calibrated enhancement process. Using OSM in combination with the medium-resolution AW3D-30 DSM, a set of building footprints with height information were created and their quality ascertained. We then evaluated enhancements to height accuracy through statistical analysis of a small sample area of high-resolution data (thus limiting expense where these data are not freely available).
The approach presented can be applied by any user that has 2D building footprint data and AW3D data and terrain information (i.e., from GMTED2010). AW3D-30 is the most suitable open DSM for building height generation, in comparison with ASTER, SRTM, and TanDEM-X [21]. However, while using AW3D-30 DSM there is a challenge of dealing with mixed pixels due to instances when buildings in the AW3D-5 digital building height range with a ground footprint of approximately 30 m or less were split into adjacent 30 m resolution pixels, each with a lower height than the original [21]. Thus one of the important advantages of using OSM together with AW3D-30 DSM is that it helps to avoid the issues of mixed pixels and provides more accurate individual building heights and shapes. To the authors’ knowledge, this is the first attempt at combining OSM data with AW3D data to generate 3D models. We built upon previous studies that fused OSM with satellite-derived elevation data [24], however in our study, we provided a method to generate 3D models for both flat and undulated terrain using open data, which makes it feasible to replicate globally with any kind of terrain. Our study also demonstrated ways to increase the accuracy of the generated 3D city models using a sample high resolution DSM and DTM data. Our work also demonstrated that the usage of high resolution DTM for ground elevation extraction can result in higher accuracy of building height values. This paper recommends the use of high-resolution digital terrain models (DTMs) wherever possible and in the absence of the same, GMTED 2010 data shall be used as ground elevation for undulating terrain and can use mean elevation value as ground elevation for flat terrains like Shanghai. The study also highlighted the need for a geospatial community to generate a global open access high-resolution DTM. The need for generating global high-resolution DEM in open access was also highlighted by Schumman and Bates, 2018 [45]. There are also initiatives like ‘Open Topography’, which facilitates community access to high-resolution topographic data [46]. These high-resolution data (metre to sub-metre scale) are derived from LiDAR and other technologies. This free access to high-accuracy terrain data further sheds light to the extensive potential of generating highly accurate 3D city models using open data.
The accuracy assessment of the two distinctive cities shows that the 3D model developed using this methodology will have higher accuracy in cities like Nottingham, where majority of the buildings are of a low rise and where growth is relatively saturated. Whereas in cities like Shanghai, where the percentage of very tall buildings is high, the accuracy will be reduced. In our study, for Nottingham, we could generate 27.7% of buildings with +/−1 m accuracy, 51.45% with +/−2 m accuracy, and 84.27% with +/−5 m. In Shanghai, the accuracy was much lower than that of Nottingham—the percentage of buildings within the accuracy levels of +/−1 m, +/−2 m, and +/−5 m were 17.66, 32.96, and 62.26 respectively. The accuracy reduction in Shanghai is explained by the increased number of tall buildings compared to city of Nottingham. It is significant to observe that the AW3D-30 DSM provides more accurate results for low- and medium-rise buildings, but exhibits relatively large errors in height for very tall buildings. This result echoes findings of Alganci et al. [36], but contradicts the finding of Misra et al. [21]. Accuracy assessments of different DSMs by Alganci et al. [36] revealed that the AW3D-30 DSM performed worse for high-rise buildings compared to SPOT DSM and PHR DSM, and that AW3D-30 DSM has a high accuracy level in residential areas. In contrast, Misra et al. [21] reported that AW3D-30 is most suitable for observing buildings taller than 9 m in height. However, this is in comparison with ASTER- and SRTM-based building heights, which are less suitable for extracting building height variation [21]. In our study we considered all buildings with height above 2 m and results showed good accuracy. Hence, using the presented method, even without any accuracy enhancement, will provide better accuracy in cities with low- and medium-rise buildings compared to cities with high-rise buildings. Once our accuracy enhancement method was applied (by way of a sample of high resolution elevation data), this improved the reliability of 3D models from open data (in Nottingham we demonstrated enhancements in the percentages of buildings within an accuracy level of +/−1 m from 27.7% to 32.81%, and for accuracy level of +/−2 m from 51.45% to 57.43%). However, this method is limited to the containment of only systematic errors; random errors are not accounted for.
Using OSM in combination with AW3D-30 DSM data has substantial potential for future scientific research due to the former’s ever-growing size and the latter’s global coverage [24,34,35,36,47]. Studies have reported that there has been a considerable increase in OSM building data in recent years. For example, from 2012 to 2017 alone there has been a 20 times increase in OSM building data in China [48]. Effective derivation of elevation values for OSM data will likely extend its utility [22]. However, the absence of a global completeness assessment may hamper the use of OSM for urban planning and development, unless it is resolved [49]. One of the major concerns in using OSM data is the quality. Most OSM data are provided by nonprofessionals and hence both the coverage and the quality of the data are questionable [50,51,52]. Despite this disadvantage, OSM is a good source of 2D building data, especially where free 2D building data are unavailable, as in China, where authorized building data are not freely available [48]. Studies have also revealed that the rate at which OSM is receiving contributions from users has been constantly increasing and is continuing to grow; complemented by collaborative mapping efforts amongst the OSM community to check and improve the quality of contributions [53].
AW3D-30 DSM also has considerable future potential, particularly for low- and middle-income countries, given its global coverage and open license. The JAXA released its first version AW3D-30 m DSM with a horizontal resolution of approx. 30 m mesh, free of charge in May 2015. This dataset was generated from the DSM dataset (5 m mesh version) of the precise global digital 3D map ALOS World 3D” (AW3D), which was the world’s first and the most precise 3D map covering all global land scales with a 5 m mesh [37]. Although the AW3D-30 DSM had a 30 m grid spacing, it could be deduced that this was due to the acquisition of strong signals from the original 5 m DSM, which was produced from the 2.5 m images [36]. In March 2017, version 1.1 was released, filling the void height values with existing DEMs in cloud and snow pixels between 60° north and 60° south. In April 2018, AW3D was upgraded to version two [54]. Continuous enhancements of AW3D-30 DSM are expected, improving its future utility.
Thus, one of the great advantages of our methodology is that 3D models can be generated from any 2D building data in combination with any DSM, which means not just using OSM and AW3D-30 DSM data. Wherever any 2D building data are available, the user will be able to generate the building elevation in combination with DSM data. Currently, only AW3D provides free DSM data. Even though ASTER DEM and SRTM provide elevation data, they are not surface models, hence those datasets are not usable to generate 3D building elevation. However, in the future there will likely be higher resolution DSMs. LiDAR DSM and ICESat-2 data are examples. Many countries are already providing accurate LiDAR DSM data. For example, LiDAR DSM data are already available for about 70% of England from the UK Environmental Agency [41]. ICESat-2 (ICE, CLOUD, and Land Elevation Satellite) is an ambitious mission from NASA, which will provide a global distribution of geodetic measurements of both the terrain surface and relative canopy heights and it will also survey urban areas [55]. Further, Global Ecosystem Dynamics Investigation (GEDI) LIDAR from NASA, with its dense track sampling and precise geolocation, forms the basis of an important dataset of ground control points to validate and calibrate global and regional DEMs and serves as a reference for surface elevation change [56]. Thus, we hope that when more accurate DSMs become available, it will enable the user to produce more accurate 3D models with better shape descriptions of buildings, especially roof modelling, thereby generating higher LODs using the defined methodology. Knowing the nature of the terrain in the modelling area is a factor in our method. For cases with flat terrain (e.g., Shanghai), the mean ground elevation is deducted from the DSM data to obtain the building height, whereas in cases of undulated terrain (e.g., Nottingham), terrain elevation can be obtained from multiple sources, such as contour topographic data or from satellite-based sources like GMTED2010 and LiDAR DTM.
The method presented in this paper affords the development of 3D models with LOD1 for any urban setting globally. High-resolution 3D datasets with higher LODs are, of course, possible but are very expensive to produce and many applications do not require very precise height datasets. Often, a model with LOD1 data is enough. Studies shows that LOD1 models provide a relatively high information content and usability compared to their geometric detail [57,58]. LOD1 model is the simplest volumetric 3D city model and fundamentally considered coarse and inferior to an LOD2. However, it may be more valuable than an LOD2 model for certain scenarios, especially when a finer footprint is more useful than the acquired roof shape [59]. Examples of such cases include: climate change and urban climate modelling, property registration, energy modelling [60], energy demand estimation [61,62], shadowing simulations [63,64], navigation, estimation of noise pollution [65], design of urban green spaces, crisis management, vulnerability assessments for disaster mitigation and management, simulating floods [66], for analysing wind comfort [67], global change assessments [68,69], and visualisation [70]. Computation of the net internal area of a building is another application area of LoD1 data, useful for energy estimations, real estate valuation, and population counts [71,72,73,74].
LoD requirements are task-specific and data volume-dependent [75,76,77,78]. Should LOD1 be appropriate, the method presented here will also allow users to generate data in a cost-effective manner. Indeed, studies have attempted to assess the possibilities of 3D model generation from the OSM data used here and have already identified the huge potential of OSM for fulfilling the requirements for CityGML LoD1 [79,80,81]. Further, free and open earth observation data (e.g., Landsat and Sentinel) offer great potential for large-area mapping of human settlements [68]. As our method relies on open datasets, we hope that it will be of great use in developing and low-income countries to generate 3D data at no cost and with minimal effort. Furthermore, as this method uses freely downloadable open source datasets, it helps to save time and effort. Usually, generating 3D data is very tedious and time consuming and also requires a through lengthy process of data procurement procedures. Many applications, like hazard and risk management or crisis management, require faster results and our data generation technique will be very handy in these circumstances.
As this study intended to develop LOD1 models, we did not consider topological errors. If the 2D topological relationships between the footprints are not taken into account, the resulting 3D city models will not necessarily be topologically consistent (i.e., primitives shared by 3D buildings will be duplicated and/or intersected and overlapped building parts etc.) [82,83,84]. Models with topological inaccuracies often cannot be accepted by downstream analytical applications that demand 2-manifold exterior shells [82,83]. However, our objective was to develop LOD1 3D city models, which do not require higher levels of accuracy. We removed all incomplete and irregular buildings after creating the 3D city model. However, we did not check for any minor errors, nor for topological accuracy. We used 2D polygons from OSM, hence, if there are any topological errors in this dataset then these errors will be reflected in our results. We recommend consideration of topology should higher accuracy in resultant models be required (i.e., LOD2+).
One of the main disadvantages observed related to using AW3D-30m data was that the accuracy limitation with high-rise buildings. As the accuracy of very tall buildings (more than 100 m) were found to be less in AW3D-30 DSM, building height data from websites like Skyscraper (which publishes the tall building information data from Council on Tall Buildings and Urban Habitat) can be used to replace the height values of these buildings, thereby increasing overall accuracy. Further, as the accuracy level reduces with the increasing percentage of tall buildings, it would be advantageous to know about the characteristics of a particular city before applying this methodology. Further, though we used AW3D-30 DSM data that were published in 2017, this dataset utilized the 2011 satellite data as base data. Hence, there could be accuracy difference for the buildings that were constructed after 2011. While using this method, it is also recommended to cross-check the results of building elevations with low height values for larger 2D footprints, as tall buildings may have a large low height podium. This can be done by visual interpretation from Google Earth satellite images. The original AW3D-30 DSM has some data-void regions and these values are filled with the values from adjacent pixels [44]. So, some accuracy difference could arise due to this procedure. Large digitization errors or shifts in the 2D building footprints can result in the misrepresentation of height information.
5. Conclusions
This paper demonstrated a globally replicable methodology to generate 3D buildings from open data. Generation of 3D buildings exclusively using open data was the highlight of this paper. This method is cost-effective, making it particularly attractive to users in low- and middle-income countries, where free 3D building data are not available. Further, this largely automated method requires minimal time to generate 3D city models, and also has flexibility for improvement in accuracy should higher resolution data be available. Given the use of relatively low resolution open data, this methodology will be of particular relevance to studies that do not require high resolution 3D models, such as for global environmental change studies, global climate change and urban climate modelling, disaster vulnerability models, and energy models. Real world simulations for 3D games may be another potential area of interest.
Finally, the methodology presented in this paper can, in the future, be employed in conjunction with alternative 2D input data, for example as quality checked OSM data become more abundant, and with more accurate height data, as upgrades to AW3D-30 are published, or other sources become available, such as those derived from LiDAR measurements.
Author Contributions
Conceptualization, R.G., D.S.B. and J.R.; methodology, R.G. and J.R.; software, R.G.; validation, R.G. and J.R.; formal analysis, R.G.; investigation, R.G. and D.S.B.; resources, D.S.B.; data curation, R.G. and G.L.; writing—original draft preparation, R.G., D.V. and D.S.B.; writing—review and editing, R.G., D.S.B., J.R., D.V., G.L. and D.R.; supervision, D.S.B. and J.R.; funding acquisition, D.S.B. and D.R. All authors have read and agreed to the published version of the manuscript.
Funding
This work was supported by a Leverhulme Trust Research Programme Grant [RP 2013-SL-015] to DR and DB and the UK Engineering and Physical Sciences Research Council [EP/S023577/1] to DB.
Acknowledgments
The authors acknowledge the Leverhulme Trust and the UK Engineering and Physical Sciences Research Council (EPSRC) for providing funding to allow this research to take place. Authors also acknowledge School of Geography, University of Nottingham for providing resources and facilities.
Conflicts of Interest
The authors declare no conflict of interest.
Appendix A
Figure A1.
Percentage of buildings under each range for foundation 3D model in Nottingham.


Table A1.
Percentage of buildings under each error range for foundation 3D model in Huangpu District, Shanghai.
Table A1.
Percentage of buildings under each error range for foundation 3D model in Huangpu District, Shanghai.
| Sl. No. | Height Difference in Meters | Percentage of Buildings under Each Range |
|---|---|---|
| 1 | ≤20 | 2 |
| 2 | −10 to −20 | 7 |
| 3 | −5 to −10 | 11 |
| 4 | −2 to −5 | 14 |
| 5 | ±2 | 15 |
| 6 | ±1 | 18 |
| 7 | 2–5 | 16 |
| 8 | 5 to 10 | 7 |
| 9 | 10 to 20 | 3 |
| 10 | >20 | 7 |
Figure A2.
Scatter plot showing correlation between AW3D-30 DSM- and LiDAR DSM-generated heights for different ranges.
Figure A2.
Scatter plot showing correlation between AW3D-30 DSM- and LiDAR DSM-generated heights for different ranges.

References
- Jones, R.R.; McCaffrey, K.J.W.; Clegg, P.; Wilson, R.W.; Holliman, N.S.; Holdsworth, R.E.; Imber, J.; Waggott, S. Integration of regional to outcrop digital data: 3D visualisation of multi-scale geological models. Comput. Geosci. 2009, 35, 4–18. [Google Scholar] [CrossRef]
- Oosterom, P.V. Research and development in 3D cadastres. Comput. Environ. Urban Syst. 2013, 40, 1–6. [Google Scholar] [CrossRef]
- Garouani, A.E.; Alobeid, A.; Garouani, S.E. Digital surface model based on aerial image stereo pairs for 3D building. Int. J. Sustain. Built Environ. 2014, 3, 119–126. [Google Scholar] [CrossRef] [Green Version]
- Albert, A.; Kaur, J.; Gonzalez, M.C. Using convolutional networks and satellite imagery to identify patterns in urban environments at a large scale. In Proceedings of the 23rd ACM SIGKDD International Conference on Knowledge Discovery and Data Mining, Halifax, NS, Canada, 13–17 August 2017; pp. 1357–1366. [Google Scholar]
- Liang, J.; Gong, J.; Liu, J.; Zou, Y.; Zhang, J.; Sun, J. Generating orthorectified multi-perspective 2.5D maps to facilitate web GIS-based visualization and exploitation of massive 3D city models. Int. J. Geo Inf. 2016, 5, 212. [Google Scholar] [CrossRef] [Green Version]
- Mittal, A. Applications of 3D City Modelling. Available online: https://skymapglobal.com/applications-of-3d-city-modelling/ (accessed on 26 June 2019).
- Buyukdemircioglu, M.; Kocaman, S.; Isikdag, U. Semi-automatic 3D city model generation from large-format aerial images. Int. J. Geo Inf. 2018, 7, 339. [Google Scholar] [CrossRef] [Green Version]
- Compagnon, R. Solar and daylight availability in the urban fabric. Energy Build. 2004, 36, 321–328. [Google Scholar] [CrossRef]
- Robinson, D. Urban morphology and indicators of radiation availability. Int. J. Sol. Energy 2006, 80, 1643–1648. [Google Scholar] [CrossRef]
- Kang, J. Sound propagation in street canyons: Comparison between diffusely and geometrically reflecting boundaries. J. Acoust. Soc. Am. 2000, 107, 1394–1404. [Google Scholar] [CrossRef]
- Mao, B.; Ban, Y. Online visualisation of a 3D city model using CityGML and X3DOM. Cartographica 2011, 46, 109–114. [Google Scholar] [CrossRef]
- Flamanc, D.; Maillet, G.; Jibrini, H. 3D city models: An operational approach using aerial images and cadastral maps. In Photogrammetric Image Analysis, Munich, Germany; Ebner, H., Heipke, C., Mayer, H., Pakzad, K., Eds.; ISPRS: Paris, France, 2003; pp. 53–58. [Google Scholar]
- Singh, S.P.; Jain, K.; Mandla, V.R. Virtual 3D city modeling: Techniques and applications. In Proceedings of the International Archives of the Photogrammetry, Remote Sensing and Spatial Information Sciences, XL-2/W2, ISPRS 8th 3DGeoInfo Conference & WG II/2 Workshop, Istanbul, Turkey, 27–29 November 2013. [Google Scholar]
- Ohori, K.A.; Ledoux, H.; Biljecki, F.; Stoter, J. Modeling a 3D city model and its levels of detail as a true 4D model. ISPRS Int. J. Geo Inf. 2015, 4, 1055–1075. [Google Scholar] [CrossRef] [Green Version]
- Wate, P.; Saran, S. Implementation of CityGML energy application domain extension (ADE) for integration of urban solar potential indicators using object-oriented modelling approach. Geocarto Int. 2015, 30, 1144–1162. [Google Scholar] [CrossRef]
- Groeger, G.; Kolbe, T.H.; Nagel, C.; Haefele, K.H. OGC City Geography Markup Language (CityGML) Encoding Standard v2.0. OGC Doc; Open Geospatial Consortium: Wayland, MA, USA, 2012. [Google Scholar]
- Groeger, G.; Kolbe, T.H.; Czerwinski, A.; Nagel, C. OpenGIS City Geography Markup Language (CityGML) Encoding Standard, v1.0.0, OGC Doc. No. 08-007r1; Open Geospatial Consortium: Wayland, MA, USA, 2008. [Google Scholar]
- Biljecki, F.; Ledoux, H.; Stoter, J.; Zhao, J. Formalisation of the level of detail in 3D city modeling. Comput. Environ. Urban Syst. 2014, 48, 1–45. [Google Scholar] [CrossRef] [Green Version]
- Zhao, J.; Zhu, Q.; Du, Z.; Feng, T.; Zhang, Y. Mathematical morphology-based generalization of complex 3D building models incorporating semantic relationships. ISPRS J. Photogramm. Remote Sens. 2012, 68, 95–111. [Google Scholar] [CrossRef]
- Wang, P.; Huang, C.; Tilton, J.C. Mapping three-dimensional urban structure by fusing landsat and global elevation data. arXiv 2018, arXiv:1807.04368v1. [Google Scholar]
- Misra, P.; Avtar, R. Comparison of digital building height models and SRTM digital surface models over Yangon City. Remote Sens. 2018, 10, 2008. [Google Scholar] [CrossRef] [Green Version]
- Knerr, T. Merging Elevation Raster Data and OpenStreetMap Vectors for 3D Rendering. Master’s Thesis, University of Passau, Passau, Germany, May 2013. Available online: http://tobias-knerr.de/publications/thesis/Master%20Thesis%20Knerr.pdf (accessed on 20 December 2018).
- Mehlhorn, K.; Sanders, P. Algorithms and Data Structures: The Basic Toolbox; Springer: Berlin/Heidelburg, Germany, 2007. [Google Scholar]
- Bagheri, H.; Schmitt, M.; Zhu, X. Fusion of multi-sensor-derived heights and OSM-derived building footprints for urban 3D reconstruction. ISPRS Int. J. Geo Inf. 2019, 8, 193. [Google Scholar] [CrossRef] [Green Version]
- Santillan, J.; Makinano, M. Vertical accuracy assessment of 30-m resolution ALOS, ASTER, and SRTM global DEMs over Northeastern Mindanao, Philippines. ISPRS Int. Arch. Photogramm. Remote Sens. Spat. Inf. Sci. 2016, 41, 149–156. [Google Scholar] [CrossRef]
- DEM, DSM & DTM Differences—A Look at Elevation Models in GIS. Available online: https://gisgeography.com/dem-dsm-dtm-differences/ (accessed on 19 January 2019).
- Gruen, A. Development and status of image matching in photogrammetry. Photogramm. Rec. 2012, 26, 36–57. [Google Scholar] [CrossRef]
- Top 6 Free LiDAR Data Sources. Available online: https://gisgeography.com/top-6-free-lidar-data-sources/ (accessed on 19 January 2019).
- ONS Mid-year Population Estimates. Available online: https://www.ons.gov.uk/peoplepopulationandcommunity/populationandmigration/populationestimates/datasets/populationestimatesforukenglandandwalesscotlandandnorthernireland (accessed on 5 January 2019).
- Elevation of Nottingham, UK Elevation Map, Topo, Contour. Available online: http://www.floodmap.net/Elevation/ElevationMap/?gi=2641170 (accessed on 5 January 2019).
- Morais, P. Centring space: The possibility of planning in urban community (shequ) construction in Shanghai. In Proceedings of the International Planning History Society Proceedings, 17th IPHS Conference, History-Urbanism-Resilience, Delft, The Netherlands, 17–21 July 2016; p. 151. [Google Scholar]
- OpenStreetMap Data Extracts. Available online: https://download.geofabrik.de/ (accessed on 26 June 2019).
- OS MasterMap Imagery Layer. Available online: https://www.ordnancesurvey.co.uk/business-and-government/products/imagery-layer.html (accessed on 26 June 2019).
- Tadono, T.; Ishida, H.; Oda, F.; Naito, S.; Minakawa, K.; Iwamoto, H. Precise global DEM generation by ALOS PRISM. Ann. Photogramm. Remote Sens. Spat. Inf. Sci. ISPRS 2014, 11, 71–76. [Google Scholar] [CrossRef] [Green Version]
- Tadono, T.; Nagai, H.; Ishida, H.; Oda, F.; Naito, S.; Minakawa, K.; Iwamoto, H. Generation of the 30 m-mesh global digital surface model by ALOS PRISM. Int. Arch. Photogram. Rem. Sens. Spat. Inf. Sci. ISPRS 2016, 41, 157–162. [Google Scholar]
- Alganci, U.; Besol, B.; Sertel, E. Accuracy assessment of different digital surface models. ISPRS Int. J. Geo-Inf. 2018, 7, 114. [Google Scholar] [CrossRef] [Green Version]
- ALOS Global Digital Surface Model ALOS World 3D-30 m (AW3D30). Available online: https://www.eorc.jaxa.jp/ALOS/en/aw3d30/index.htm (accessed on 19 January 2019).
- Grohmann, C.H. Comparative analysis of global digital elevation models and ultra-prominent mountain peaks. ISPRS Ann. Photogramm. Remote Sens. Spat. Inf. Sci. 2016, 3, 17–23. [Google Scholar] [CrossRef]
- Athmania, D.; Achour, H. External validation of the ASTER GDEM2, GMTED2010 and CGIAR-CSI- SRTM v4.1 free access digital elevation models (DEMs) in Tunisia and Algeria. Remote Sens. 2014, 6, 4600–4620. [Google Scholar] [CrossRef] [Green Version]
- Khalid, N.F.; Din, A.H.M.; Omar, K.M.; Khanan, M.F.A.; Omar, A.H.; Hamid, A.I.A.; Pa’suya, M.F. Open-source digital elevation model (DEMs) evaluation with GPS and LiDAR Data. Int. Arch. Photogramm. Remote Sens. Spat. Inf. Sci. 2016, 42, 299–306. [Google Scholar] [CrossRef] [Green Version]
- LIDAR Composite DTM-1 m. Available online: https://data.gov.uk/dataset/6a117171-5c59-4c7d-8e8b-8e7aefe8ee2e/lidar-composite-dtm-1m (accessed on 20 January 2019).
- Using OS MasterMap® Building Height Attribute (BHA) Alpha Release. Available online: https://0-digimap-edina-ac-uk.brum.beds.ac.uk/webhelp/digimapgis/bha/bha.htm (accessed on 26 June 2019).
- Ordnance Survey. OS MasterMap Topography Layer—Building Height Attribute v1.1. Available online: https://www.ordnancesurvey.co.uk/documents/building-height-attribute-getting-started-guide.pdf (accessed on 26 June 2019).
- AW3D Products, the Highest Precision DEM in 0.5m Resolution. Available online: https://www.aw3d.jp/en/products/enhanced/ (accessed on 19 January 2019).
- Schumann, G.J.-P.; Bates, P.D. The Need for a High-Accuracy, Open-Access Global DEM. Front. Earth Sci. 2018, 6, 225. [Google Scholar] [CrossRef]
- OpenTopography: High-Resolution Topography Data and Tools. Available online: https://opentopography.org/about (accessed on 26 June 2019).
- Takaku, J.; Tadono, T. High Resolution DSM Generation from ALOS PRISM—Status Updates on over Three Year Operations. In Proceedings of the IEEE International Geoscience and Remote Sensing Symposium, Cape Town, South Africa, 12–17 July 2009; Volume 3, pp. 769–772. [Google Scholar]
- Tian, Y.; Zhou, Q.; Fu, X.; Tian, Y.; Zhou, Q.; Fu, X. An analysis of the evolution, completeness and spatial patterns of OpenStreetMap building data in China. ISPRS Int. J. Geo Inf. 2019, 8, 35. [Google Scholar] [CrossRef] [Green Version]
- Barrington-Leigh, C.; Millard-Ball, A. The world’s user-generated road map is more than 80% complete. PLoS ONE 2017, 12, e0180698. [Google Scholar] [CrossRef] [Green Version]
- Haklay, M. How good is volunteered geographical information? A comparative study of OpenStreetMap and Ordnance Survey datasets abstract. Environ. Plan. B Plan. Des. 2010, 37, 682–703. [Google Scholar] [CrossRef] [Green Version]
- Senaratne, H.; Mobasheri, A.; Ali, A.L.; Capineri, C.; Haklay, M. A review of volunteered geographic information quality assessment methods. Int. J. Geogr. Inf. Sci. 2017, 31, 139–167. [Google Scholar] [CrossRef]
- Nasiri, A.; Abbaspour, R.A.; Chehreghan, A.; Jokar Arsanjani, J. Improving the quality of citizen contributed geodata through their historical contributions: The case of the road network in OpenStreetMap. ISPRS Int. J. Geo Inf. 2018, 7, 253. [Google Scholar] [CrossRef] [Green Version]
- Arsanjani, J.J.; Mooney, P.; Helbich, M.; Zipf, A. An exploration of future patterns of the contributions to OpenStreetMap and development of a contribution index. Trans. GIS 2015, 19, 896–914. [Google Scholar] [CrossRef]
- Takaku, J.; Tadono, T. Quality updates of ‘AW3D’ global DSM generated from ALOS PRISM. In Proceedings of the IEEE IGARSS2017, Fort Worth, TX, USA, 23–28 July 2017; pp. 5666–5669. [Google Scholar]
- Neuenschwander, A.; Popescu, S.; Nelson, R.; Harding, D.; Pitts, K.; Robbins, J.; Pederson, D.; Sheridan, R.; Neuenschwander, A. Ice, cloud, and land elevation satellite (ICESat-2) algorithm theoretical basis document (ATBD) for land—Vegetation along-track products (ATL08). In National Aeronautics and Space Administration. Goddard Space Flight Centre; NASA: Washington, DC, USA, 2018. [Google Scholar]
- GEDI Ecosystem Lidar. Available online: https://gedi.umd.edu/applications/topography-and-surface-deformation/ (accessed on 15 March 2019).
- Henn, A.; Römer, C.; Gröger, G.; Plümer, L. Automatic classification of building types in 3D city models. GeoInformatica 2012, 16, 281–306. [Google Scholar] [CrossRef]
- Hofierka, J.; Zlocha, M. A New 3-D Solar Radiation Model for 3-D City Models. Trans. GIS 2012, 16, 681–690. [Google Scholar] [CrossRef]
- Biljecki, F.; Ledoux, H.; Stoter, J. An improved LOD specification for 3D building models. Comput. Environ. Urban Syst. 2016, 59, 25–37. [Google Scholar] [CrossRef] [Green Version]
- Sousa, G.; Jones, B.M.; Mirzaei, P.A.; Robinson, D. An open-source simulation platform to support the formulation of housing stock decarbonisation strategies. Energy Build. 2018, 172, 459–477. [Google Scholar] [CrossRef]
- Strzalka, A.; Bogdahn, J.; Coors, V.; Eicker, U. 3D City modeling for urban scale heating energy demand forecasting. HVAC&R Res. 2011, 17, 526–539. [Google Scholar]
- Bahu, J.M.; Koch, A.; Kremers, E.; Murshed, S.M. Towards a 3D spatial urban energy modelling approach. ISPRS Ann. Photogramm. Remote Sens. Spat. Inf. Sci. 2013, 3, 33–41. [Google Scholar] [CrossRef] [Green Version]
- Alam, N.; Coors, V.; Zlatanova, S. Detecting shadow for direct radiation using CityGML models for photovoltaic potentiality analysis. In Urban and Regional Data Management; Ellul, C., Zlatanova, S., Rumor, M., Laurini, R., Eds.; CRC Press: London, UK, 2013; pp. 191–196. [Google Scholar]
- Li, Z.; Zhang, Z.; Davey, K. Estimating Geographical PV Potential Using LiDAR Data for Buildings in Downtown San Francisco. Trans. GIS 2015, 19, 930–963. [Google Scholar] [CrossRef]
- Stoter, J.; Vosselman, G.; Dahmen, C.; Oude Elberink, S.; Ledoux, H. CityGML Implementation Specifications for a Countrywide 3D Data Set: The Case of The Netherlands. Photogram. Eng. Remote Sens. 2014, 80, 13–21. [Google Scholar] [CrossRef]
- Varduhn, V.; Mundani, R.P.; Rank, E. Multi-resolution Models: Recent Progress in Coupling 3D Geometry to Environmental Numerical Simulation. In 3D Geoinformation Science; Springer International Publishing: New York, NY, USA, 2015; pp. 55–69. [Google Scholar]
- Amorim, J.H.; Valente, J.; Pimentel, C.; Miranda, A.I.; Borrego, C. Detailed modelling of the wind comfort in a city avenue at the pedestrian level. In Usage, Usability, and Utility of 3D City Models—European COST Action TU0801; Leduc, T., Moreau, G., Billen, R., Eds.; EDP Sciences: Nantes, France, 2012; pp. 1–6. [Google Scholar]
- Pesaresi, M.; Corbane, C.; Julea, A.; Florczyk, A.; Syrris, V.; Soille, P. Assessment of the added-value of Sentinel-2 for detecting built-up areas. Remote Sens. 2016, 8, 299. [Google Scholar] [CrossRef] [Green Version]
- Biljecki, F.; Stoter, J.; Ledoux, H.; Zlatanova, S.; Çöltekin, A. Applications of 3D City Models: State of the Art Review. ISPRS Int. J. Geo Inf. 2015, 4, 2842–2889. [Google Scholar] [CrossRef] [Green Version]
- Gesquière, G.; Manin, A. 3D Visualization of Urban Data Based on CityGML with WebGL. Int. J. 3D Inf. Mod. 2012, 1, 1–15. [Google Scholar] [CrossRef] [Green Version]
- Kaden, R.; Kolbe, T.H. Simulation-Based Total Energy Demand Estimation of Buildings using Semantic 3D City Models. Int. J. 3D Inf. Mod. 2014, 3, 35–53. [Google Scholar] [CrossRef]
- Nouvel, R.; Mastrucci, A.; Leopold, U.; Baume, O.; Coors, V.; Eicker, U. Combining GISbased statistical and engineering urban heat consumption models: Towards a new framework for multi-scale policy support. Energy Build. 2015, 107, 204–212. [Google Scholar] [CrossRef]
- Boeters, R.; Arroyo Ohori, K.; Biljecki, F.; Zlatanova, S. Automatically enhancing CityGML LOD2 models with a corresponding indoor geometry. Int. J Geo Inf. Sci. 2015, 29, 2248–2268. [Google Scholar] [CrossRef] [Green Version]
- Lwin, K.; Murayama, Y. A GIS Approach to Estimation of Building Population for Microspatial Analysis. Trans. GIS 2009, 13, 401–414. [Google Scholar] [CrossRef]
- Baig, S.U.; Abdul-Rahman, A. Generalization of buildings within the framework of CityGML. Geo Spat. Inf. Sci. 2013, 16, 247–255. [Google Scholar] [CrossRef] [Green Version]
- Labetski, A.; Ledoux, H.; Stoter, J. Generalising 3D Buildings from LoD2 to LoD1. In Proceedings of the GISRUK 2017 25th GIS Research UK Conference, Manchester, UK, 18–21 April 2017. [Google Scholar]
- Kolbe, T.H. Representing and exchanging 3D city models with CityGML. In 3D Geo-Information Sciences; Zlatanova, S., Lee, J., Eds.; Springer: Berlin/Heidelberg, Germany, 2009; pp. 15–31. [Google Scholar]
- Shi, L.; Foody, G.M.; Boyd, D.S.; Girindran, R.; Wang, L.; Du, Y.; Ling, F. Night-time lights are more strongly related to urban building volume than to urban area. Remote Sen. Lett. 2020, 11, 29–36. [Google Scholar] [CrossRef]
- Gröger, G.; Kolbe, T.H.; Czerwinski, A.; Nagel, C. OpenGIS® City Geography Markup Language (CityGML) Implementation Specification. 2008. Available online: http://www.opengeospatial.org/legal/ (accessed on 19 May 2019).
- Over, M.; Schilling, A.; Neubauer, S.; Zipf, A. Generating web-based 3D City Models from OpenStreetMap: The current situation in Germany. Comput. Environ. Urban Syst. 2010, 34, 496–507. [Google Scholar] [CrossRef]
- Fan, H.; Zipf, A. Modelling the world in 3D from VGI/ Crowdsourced data. In European Handbook of Crowdsourced Geographic Information; Capineri, C., Haklay, M., Huang, H., Antoniou, V., Kettunen, J., Ostermann, F., Purves, R., Eds.; Ubiquity Press: London, UK, 2016; pp. 435–446. [Google Scholar]
- Giovanella, A.; Bradley, P.E.; Wursthorn, S. Evaluation of Topological Consistency in CityGML. ISPRS Int. J. Geo Inf. 2019, 8, 278. [Google Scholar] [CrossRef] [Green Version]
- Ledoux, H.; Meijers, M. Topologically consistent 3D city models obtained by extrusion. Int. J. Geo Inf. Sci. 2011, 25, 557–574. [Google Scholar] [CrossRef] [Green Version]
- Zhao, J.; Ledoux, H.; Stoter, J. Automatic repair of CityGML LoD2 buildings using shrink-wrapping. ISPRS Ann. Photogramm. Remote Sens. Spat. Inf. Sci. 2013, 2, 309–317. [Google Scholar] [CrossRef] [Green Version]
Figure 1.
OpenStreetMap (OSM) building coverage, Huangpu District, Shanghai, China.

Figure 2.
Overall methodology. Blue boxes indicates important steps and pink colour indicates intermediate steps.
Figure 2.
Overall methodology. Blue boxes indicates important steps and pink colour indicates intermediate steps.

Figure 3.
Sample buildings considered for 3D generation and correlation, Nottingham, UK.

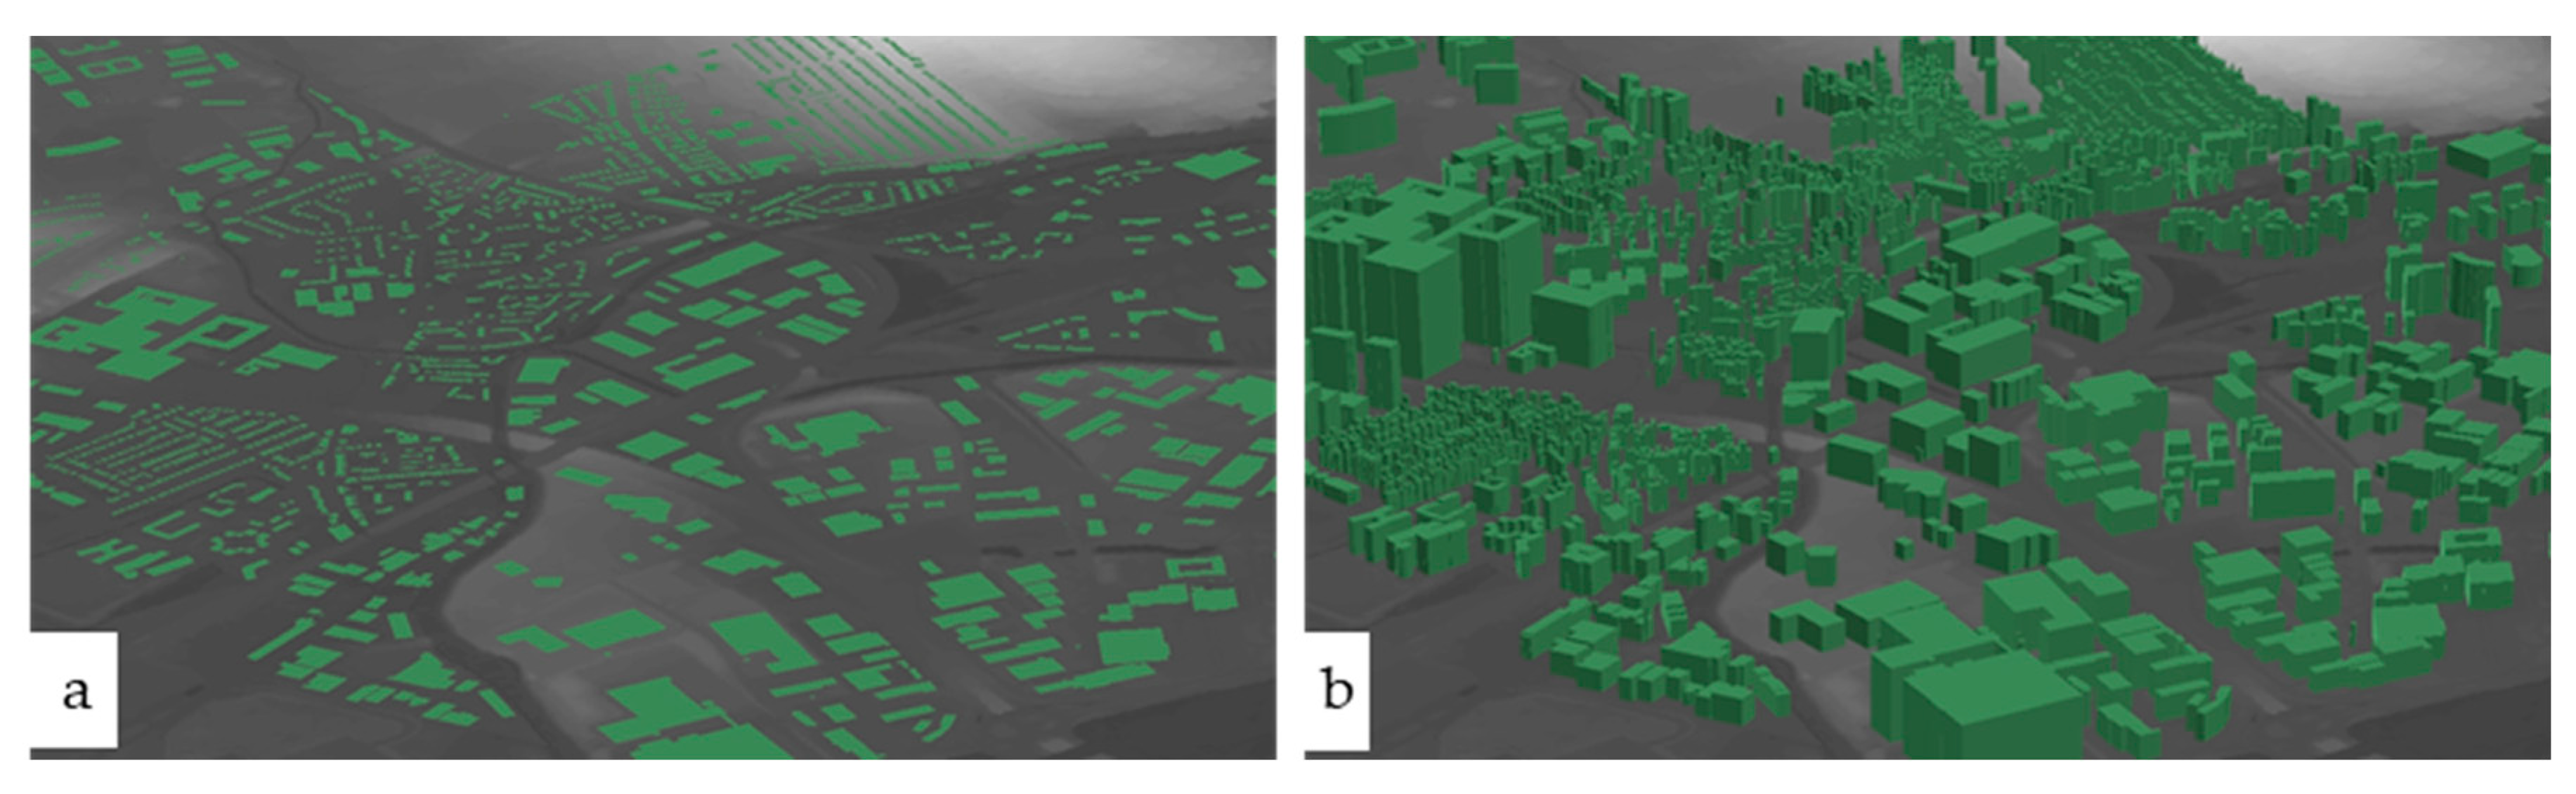
Figure 4.
(a) 2D building footprints for Nottingham, (b) foundation 3D model building footprints generated from AW3D-30 as DSM and GMTED2010 as DTM data.
Figure 4.
(a) 2D building footprints for Nottingham, (b) foundation 3D model building footprints generated from AW3D-30 as DSM and GMTED2010 as DTM data.

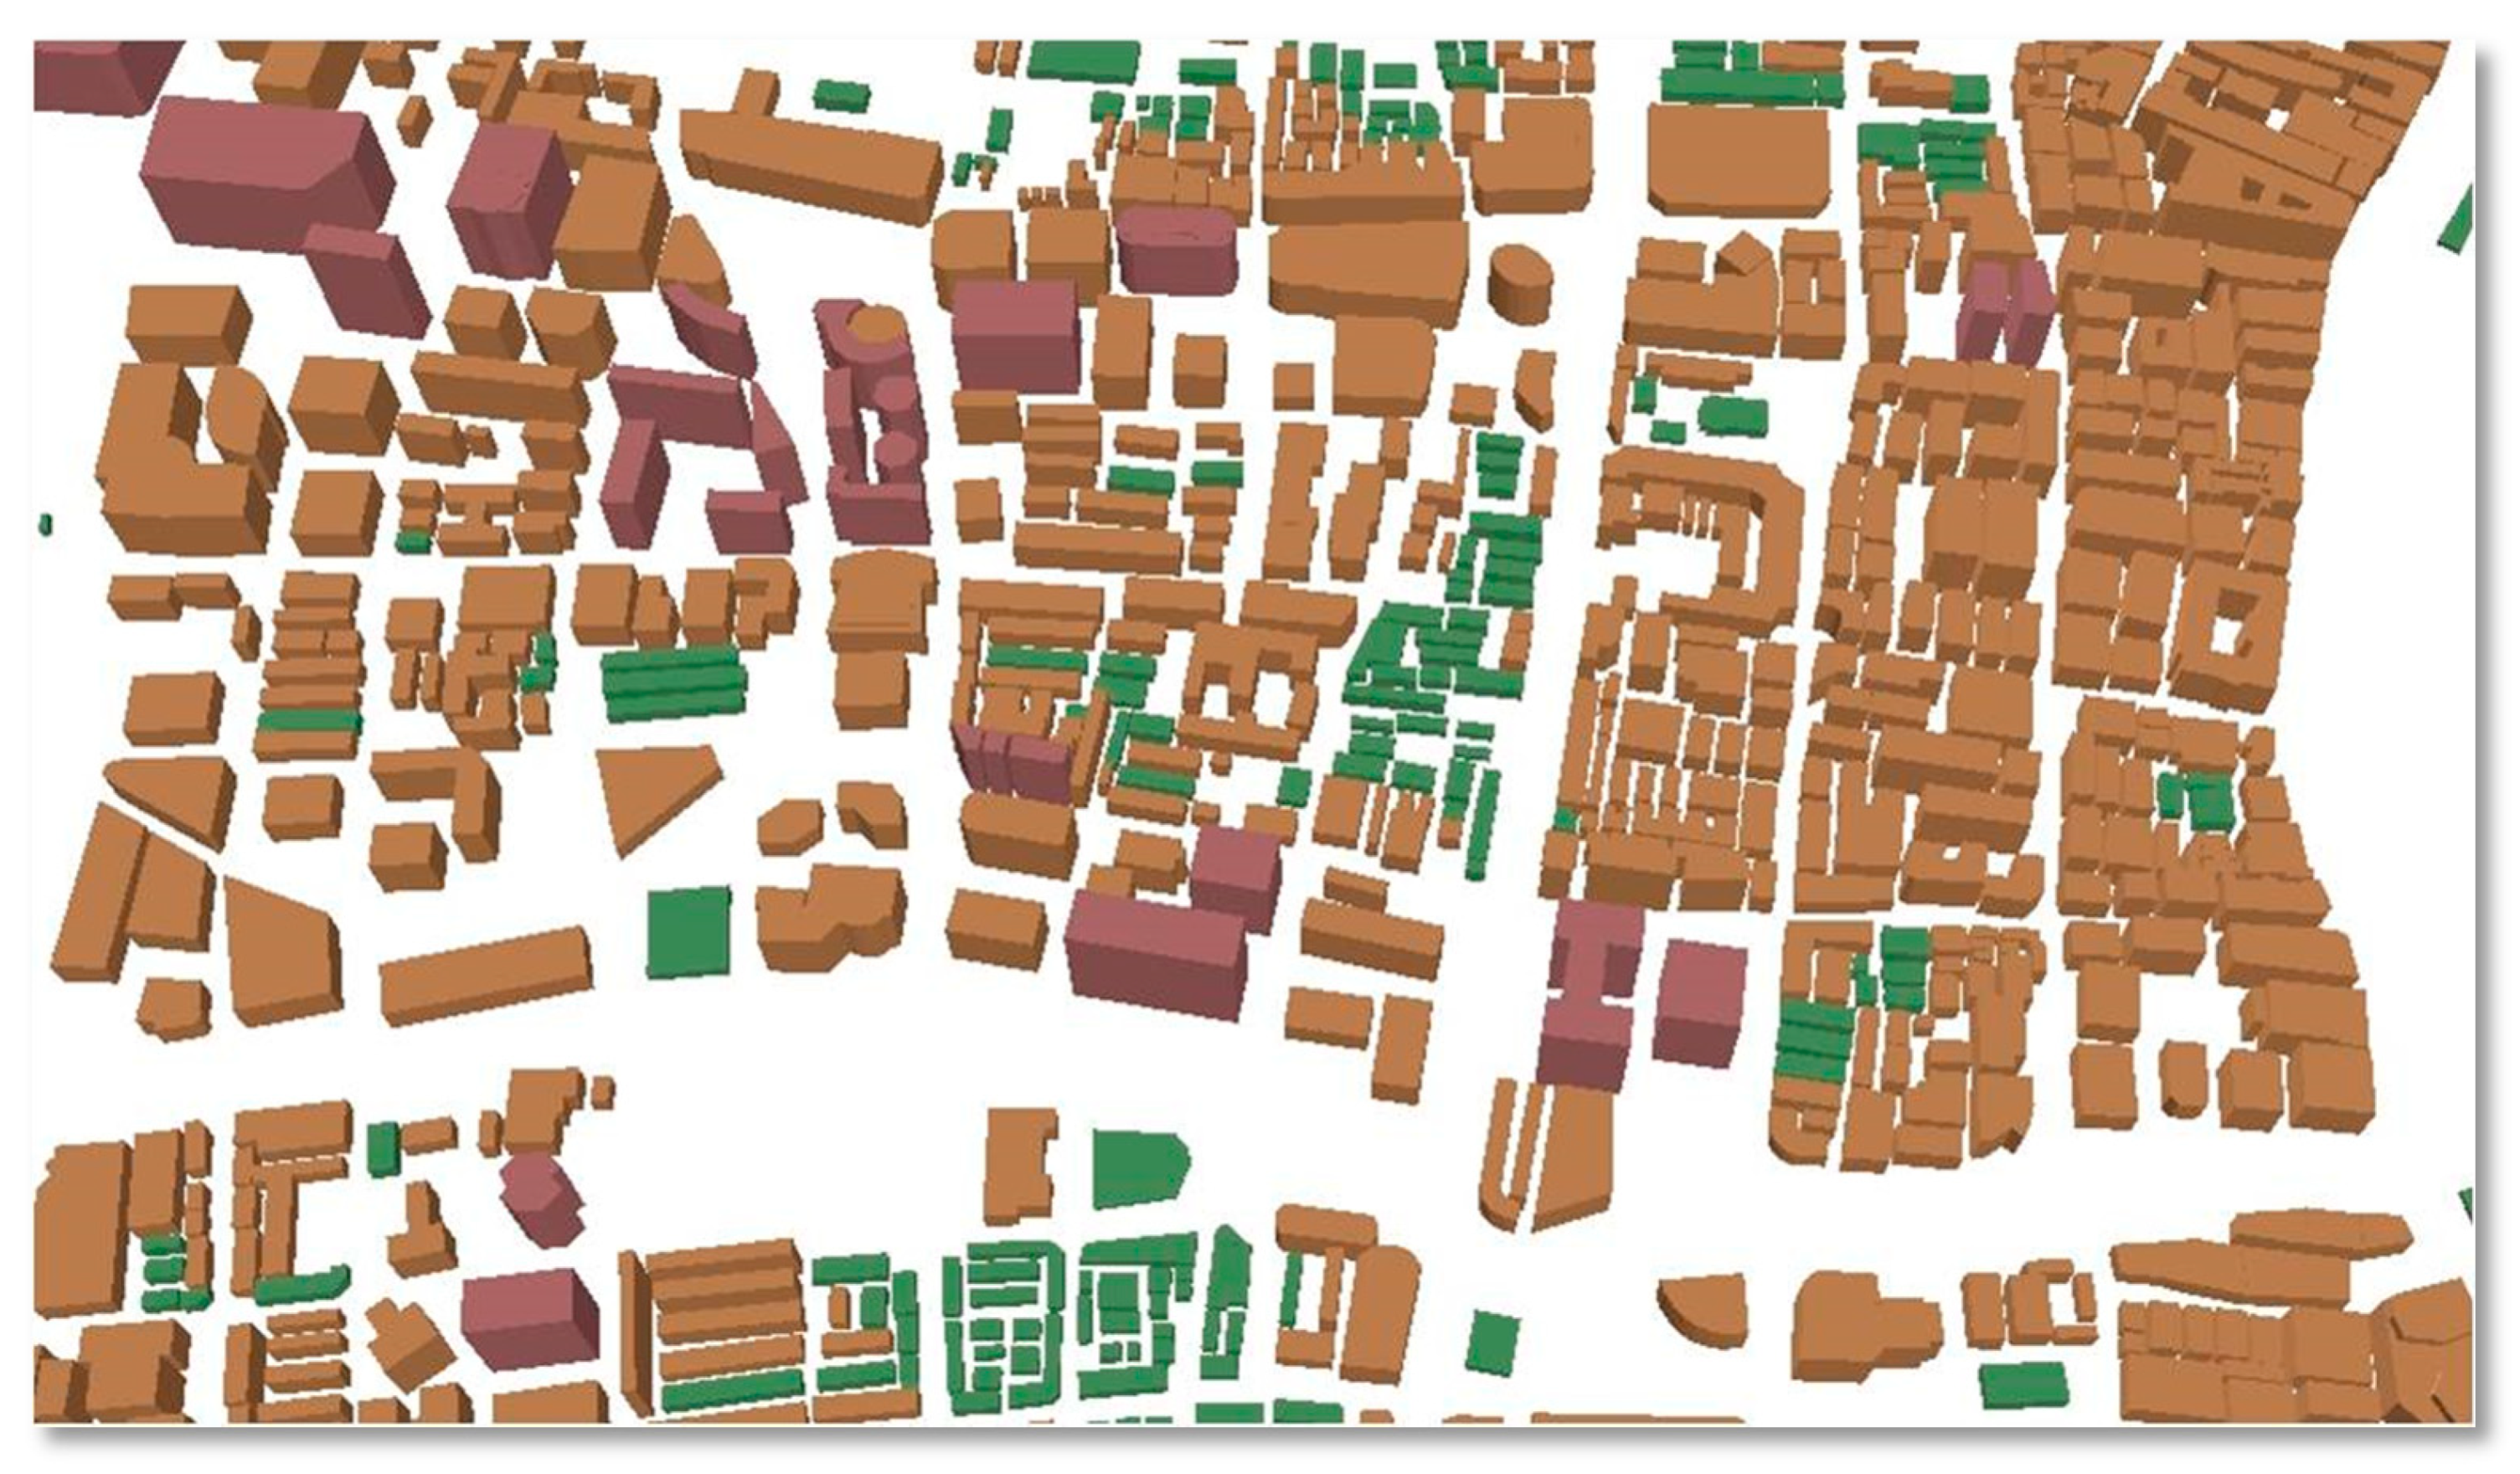
Figure 5.
Sample of foundation 3D model generated from AW3D-30 data and classified according to the elevations, Shanghai (green colour represents low-rise buildings, brown colour represents medium-rise buildings, dark brown represents high-rise buildings).
Figure 5.
Sample of foundation 3D model generated from AW3D-30 data and classified according to the elevations, Shanghai (green colour represents low-rise buildings, brown colour represents medium-rise buildings, dark brown represents high-rise buildings).

Table 1.
Data types and pertinent details.
| Sl. No. | Type of Data | Coverage and Accessibility | Purpose of Data Usage | Source of Data | Terms of Use/License |
|---|---|---|---|---|---|
| 1 | AW3D-30 DSM of 30 m resolution | Global, free data | Foundation model height generation | JAXA | Open data license |
| 2 | LiDAR DSM & DTM, resolution of 0.25–2 m and varies by location | UK, free data | Enhanced model regression value parameter creation | Environment Agency | Open data license |
| 3 | 2D building data for Huangpu, Shanghai (vector layer) | China, free data | Building foot print generation | OpenStreetMap | Open license |
| 4 | 2D building data for Nottingham (vector layer) | UK, free data | Building foot print generation | OpenStreetMap | Open license |
| 5 | Administrative boundary—Shanghai (vector layer) | China, free data | Case study area selection | OpenStreetMap | Open license |
| 6 | Administrative boundary—Nottingham (vector layer) | UK, free data | Case study area selection | UK data service download | Open license |
| 7 | Nottingham building data with height (vector layer) attributes | UK, restricted for UK research only, commercial | Validation | MasterMap and BHA attribute | EDINA Digimap educational institution license |
| 8 | AW3D-Enhanced 2 metre resolution DSM for Shanghai | Commercial | Validation | Purchased from Digital Globe | Commercial license |
| 9 | GMTED2010 of 7.5-arc-second (225–250 m) for Nottingham | Global, free data | Ground elevation value generation | USGS and NGA | Open data license |
Table 2.
Correlation values for different ranges and linear equation for accuracy enhancement (Nottingham).
Table 2.
Correlation values for different ranges and linear equation for accuracy enhancement (Nottingham).
| Sl. No. | Height of Buildings in Meters | Height Difference Range Used for Creating Equation in Meters | Linear Equation Used for Accuracy Increase |
|---|---|---|---|
| 1 | 2 to 3 | 1 to 2 | y = 0.984x − 1.358 |
| 2 | 3 to 4 | 0 to 2 | y = 0.936x − 0.554 |
| 3 | 4 to 5 | No equations required as the values already have good correlation | |
| 4 | 5 to 6 | −1.7 to 0.4 | y = 0.986x + 0.610 |
| 5 | 6 to 7 | −3.6 to 0 | y = 1.017x + 1.239 |
| 6 | 7 to 8 | −4.1 to −1.2 | y = 1.041x + 2.080 |
Table 3.
Validation results showing percentage of buildings within each interval before (foundation 3D model) and after accuracy enhancement (enhanced model), for Nottingham.
Table 3.
Validation results showing percentage of buildings within each interval before (foundation 3D model) and after accuracy enhancement (enhanced model), for Nottingham.
| Sl. No. | Height Extracting Method | Percentage of Buildings Having Accuracy of | Percentage of Buildings Having an Error More than +/−5 m | ||
|---|---|---|---|---|---|
| +/−1 m | +/−2 m | +/−5 m | |||
| 1 | Foundation 3D model developed using AW3D 30 m DSM and GMTED 2010 DTM | 27.7 | 51.45 | 84.27 | 15.73 |
| 2 | Enhanced 3D model via a sample of high resolution lidar (2 m) | 32.81 | 57.43 | 88.46 | 11.54 |
Table 4.
Validation results showing percentage of buildings under each interval when ground elevation was extracted using high resolution LiDAR DTM data (Nottingham).
Table 4.
Validation results showing percentage of buildings under each interval when ground elevation was extracted using high resolution LiDAR DTM data (Nottingham).
| Sl. No. | Height Extracting Method | Percentage of Buildings Having Accuracy of | Percentage of Buildings Having an Error More than +/−5 m | ||
|---|---|---|---|---|---|
| +/−1 m | +/−2 m | +/−5 m | |||
| 1 | Foundation 3D model developed using AW3D-30m DSM and 2 m LiDAR DTM | 31.43 | 60.14 | 94.73 | 5.27 |
Table 5.
Correlation values for different ranges and linear equations for accuracy enhancement (Huangpu District, Shanghai).
Table 5.
Correlation values for different ranges and linear equations for accuracy enhancement (Huangpu District, Shanghai).
| Sl. No. | Height Difference in Meters | Correlation Obtained/R2 Value for Huangpu, Shanghai | Linear Equation Used for Accuracy Increase |
|---|---|---|---|
| 1 | 5–6 | 0.997 | y = 1.001x − 0.071 |
| 2 | 6–7 | 0.985 | y = 1.006x − 0.314 |
| 3 | 7–8 | 0.989 | y = 0.978x − 2.880 |
| 4 | 8–9 | 0.989 | y = 0.997x + 3.362 |
| 5 | 11–12 | 0.988 | y = 0.975x − 6.329 |
| 6 | 14–15 | 0.990 | y = 0.999x + 7.160 |
| 7 | 16–17 | 0.961 | y = 0.953x − 12.33 |
| 8 | 18–19 | 0.971 | y = 1.005x + 13.602 |
| 9 | >20 | 0.222 | y = 0.256x + 5.020 |
Table 6.
Percentage of buildings under each level before (foundation 3D model) and after accuracy enhancement (enhanced model) for Huangpu District, Shanghai.
Table 6.
Percentage of buildings under each level before (foundation 3D model) and after accuracy enhancement (enhanced model) for Huangpu District, Shanghai.
| Sl. No. | Height Extracting Method | Percentage of Buildings Having Accuracy of | Percentage of Buildings Having an Error More than +/−10 m | |||
|---|---|---|---|---|---|---|
| +/−1 m | +/−2 m | +/−5 m | +/−10 m | |||
| 1 | Foundation 3D model developed using AW3D-30 DSM | 17.66 | 32.96 | 62.26 | 79.78 | 20.22 |
| 2 | Enhanced 3D model via a sample of high resolution commercial 2 m DSM (AW3D Enhanced) | 28.3 | 41.69 | 64.54 | 79.78 | 20.22 |
© 2020 by the authors. Licensee MDPI, Basel, Switzerland. This article is an open access article distributed under the terms and conditions of the Creative Commons Attribution (CC BY) license (http://creativecommons.org/licenses/by/4.0/).
Share and Cite
MDPI and ACS Style
Girindran, R.; Boyd, D.S.; Rosser, J.; Vijayan, D.; Long, G.; Robinson, D. On the Reliable Generation of 3D City Models from Open Data. Urban Sci. 2020, 4, 47. https://0-doi-org.brum.beds.ac.uk/10.3390/urbansci4040047
AMA Style
Girindran R, Boyd DS, Rosser J, Vijayan D, Long G, Robinson D. On the Reliable Generation of 3D City Models from Open Data. Urban Science. 2020; 4(4):47. https://0-doi-org.brum.beds.ac.uk/10.3390/urbansci4040047
Chicago/Turabian StyleGirindran, Renoy, Doreen S Boyd, Julian Rosser, Dhanya Vijayan, Gavin Long, and Darren Robinson. 2020. "On the Reliable Generation of 3D City Models from Open Data" Urban Science 4, no. 4: 47. https://0-doi-org.brum.beds.ac.uk/10.3390/urbansci4040047