Predicting the Likelihood of Using Car-Sharing in the Greater Cairo Metropolitan Area


1
Sustainable Mobility Management, Euref Campus, Technische Universität Berlin, 10623 Berlin, Germany
2
Mobility Research Cluster, Department of Work, Technology and Participation, Technische Universität Berlin, 10587 Berlin, Germany
*
Author to whom correspondence should be addressed.
Urban Sci. 2020, 4(4), 61; https://0-doi-org.brum.beds.ac.uk/10.3390/urbansci4040061
Submission received: 24 September 2020
/
Revised: 6 November 2020
/
Accepted: 9 November 2020
/
Published: 11 November 2020
Abstract
:This research investigates the influencing variables that affect the likelihood of choosing car-sharing if it launches in the Greater Cairo Metropolitan Area, Egypt. It adopts a binary logistic regression model to analyze the findings of an online stated preference survey. The results include 419 valid responses with different choice scenarios, which are based on the revealed preference of each respondent. The generated model shows statistical significance for age, car ownership, cost, and buffer time of the current mode of transport, travel time, and leisure trips. In addition, car-sharing experience, public transit, ride-hailing, walking, and biking also have significant effects. The highest-impact attributes are the car-sharing cost and access time, as the combination of setting the fare to 2 EGP per minute and limiting the access time of the shared vehicle to nearly 5 min achieved a likelihood of choosing car-sharing in nearly 77% of the responses.
1. Introduction
Over the past years, the sharing economy has accomplished a lot of success in various sectors, including the transportation field. The sharing transportation services provide mobility solutions through an online platform, such as ride-hailing, car-pooling, and car-sharing. Due to the fast evolution of this area, the terminologies of the several types of sharing business models in transportation could be confusing, as the definitions are sometimes used academically or professionally to describe different services and concepts. The focus of this study is car-sharing, which differs from ride-hailing or car-pooling. Therefore, it is very important to identify its definition to avoid any conceptual overlap.
Car-sharing, which is the main target of this research, is a term used for a business model where the user is not a passenger, but a driver who shares the car. It could be operated by companies or organizations that provide numerous vehicles for their members to share. It is a subscription-based service that provides its subscribers the access to use any car of its fleet of automobiles for short periods of time—hours or minutes—and get billed only for their usage according to time or traveled distance [1]. It simply provides the user with the benefits of a personal car without the burden of owning one [2]. The rate of reducing car ownership is one of the key factors in evaluating the sustainability of car-sharing services for many governments and institutions. Many studies across the world affirmed the positive effect of car-sharing on reducing the ownership of personal cars [3,4]. In 2016, the different car-sharing services reached all six continents, covering 2095 cities in 46 countries with nearly 15 million users and more than 157 thousand shared cars [5]. Unfortunately, car-sharing has had a low rate of expansion in the Middle East and Africa (MEA), and has not been introduced yet in Egypt.
The Greater Cairo Metropolitan Area (GCMA), the capital of Egypt, is one of the biggest megacities in the world and the home of one-quarter of the Egyptian inhabitants, with a population exceeding 24.5 million people according to the Central Agency for Public Mobilization and Statistics (CAPMAS) [6]. Greater Cairo consists of the three governorates of Cairo, Giza, and Qalyubia, which have all been expanding across the past decades through the development of new cities, such as New Cairo, Shorouk city, 6th of October city, and Obour city [7]. The average population density in the GCMA is high as nearly 19,400 inhabitants per square kilometer, and in some central districts, the density increases up to four times more [8,9]. High population density could be one of the factors leading to car-sharing success [10], as it implies that there is a bigger number of potential users within a close walking distance to the car-sharing vehicles.
Traffic congestion is a very major issue in Greater Cairo, which causes enormous and negative consequences for the economy, the quality of people’s lives, and the environment [7,11]. According to the Cairo Congestion Study in 2014, there are around 8 billion USD wasted per year in the GCMA due to congestion between direct costs, such as fuel consumption and time delay, and indirect costs, such as carbon emissions and other pollutants [11]. In recognition of this severe problem of mobility, the government has planned to rapidly enhance the transportation infrastructure of the GCMA and to enlarge the capacity of the roadway network for the purpose of decreasing traffic congestion. In 2019, Egypt scored 5.10 points in the Road Quality Index to be ranked 28th worldwide, jumping 90 places in the international rankings since 2014 [12]. However, this could also push people toward the use of private cars. Thus, it is important to make use of these infrastructures for the benefit of sustainable motorized transportation such as car-sharing.
The main objective of this study is to discover whether or not car-sharing would be successful if it launches in the GCMA. It is necessary to identify the main factors that would influence the likelihood of using this alternative mode in the future. Therefore, this study develops a binary logistic regression model to evaluate the data collected from an online stated preference (SP) survey that was especially designed and conducted for this research.
2. Literature Review
2.1. Car-Sharing Sustainability
In general, information and communications technology (ICT)-based mobility, like ride-hailing and car-sharing, are marketed as environmentally sustainable systems that mitigate traffic emissions by lowering the car dependency [10,13,14]. However, there are concerns that these applications could lead people to drift away from public transportation and non-motorized modes [14]. In the case of Cairo, Mostofi et al. (2020) found that ICT-based transportation apps have a positive effect on frequent public transit usage [14], which is encouraging in launching a new ICT-based mobility service, like car-sharing, in the city.
Reducing car ownership is one of the factors that promote car-sharing as a sustainable solution to counter the negative effects of private cars, especially on the environment [2]. Additionally, car-sharing has a big contribution to social sustainability, as it provides car access for those who cannot afford to own their own [15,16]. However, many studies claim that sustainability is not what drives car-sharing, as in the case of ZipCar in Boston [10,13]. This service could possibly reinforce car usage and replace other sustainable modes that the governments support, such as public transport, cycling, or walking. So, it is important to evaluate the overall effect of car-sharing on the different transportation modes.
To analyze this modal shift, Martin and Shaheen (2011) evaluated the responses of more than six thousand members of well-established car-sharing companies in North America [17]. The results indicate a slight reduction in public transportation share by only 1% of car-sharing customers. On the other hand, 12% and 10% of the users increased their walking and cycling trips, respectively, against only 9% and 4% that decreased theirs. Most importantly, 15% of members reduced their car travel for commuting trips, while only 4% increased theirs [17]. When all these modal shifts are combined, it was found that car-sharing encourages sustainable transport and mitigates congestion [17].
In 2016, Shaheen and Martin (2016) studied the data of car2go across five big cities in North America between the US and Canada and found that one car-sharing eliminates somewhere in the range of 7 to 11 private cars from the streets, reduces private cars by approximately 28 thousand, and decreases up to 146 million driving miles [18]. Another German study shows that only 18 months after car2go had launched in Ulm, around 5% of its members had shed one or more private cars due to the new free-floating car-sharing service, and 17% of non-car owners gave up the idea of buying one [19]. However, Schmidt (2018) believes that it is difficult to make people give up their private cars in a strong car-oriented city, but could not deny the positive effect on reducing car sales. He estimates that adding one free-floating car-sharing car on the streets reduces the rate of new car sales from 1.7 to 4.7 per year [20]. From reviewing all these studies, it is concluded that car-sharing is one of the keys toward sustainable mobility. It is one of the main tools for reducing the demand for private cars, mitigating traffic emissions, and reinforcing social equity.
2.2. Discrete Choice Analysis
In several transportation-related studies, different genres of discrete choice analysis have been used, such as the Probit model [21], Nested Logit model [22], Ordered Logit model [13,23], Multinomial Logit (MNL) model [22,24], and Binary Logit model [3,14,25,26]. With the help of stated preference (SP) surveys, these models aim to discover the attributes influencing the travelers’ choice of either an existing transportation system or a new recommended service, which helps to set the right parameters for a desired modal shift [27,28,29].
Ullah et al. (2019) used discrete choice models to discover the citizens’ acceptance of car-sharing services in the city of Peshawar, Pakistan, where this mobility system was not introduced at that time. The study evaluated the reasons that affect individual travel behaviors to switch to a new transportation mode. It adopted a Nested Logit and Multinomial Logit model to analyze the stated preference (SP) survey responses [22]. These types of discrete choice models are usually more complicated than a simple binary case, as the respondents are asked to choose from more than two transportation alternatives with numerous attributes. The conventional design of the SP survey develops hypothetical scenarios that represent two or several choices for the respondents to choose from [27,28,29]. A large number of alternatives may sometimes confuse the respondents, especially if they are unfamiliar with some of them, so it is preferable to reduce the alternatives’ number in an SP survey [30].
The binary discrete choice is used in the case of comparing two alternatives only [14,25]. Yoon et al. (2017) relied on developing straightforward binary logit models to investigate the variables that affect the car-sharing usage in Beijing, China. The study developed an SP pivoting design to build hypothetical SP scenarios that are based around the respondents’ original trips and their real mobility behavior. This method was supported by several previous research papers [24,25,26,31,32,33], as its way of creating the SP surveys provides a realistic comparison between the new system and the respondent’s original routine.
3. Materials and Methods
The methodology of this study adopted a binary discrete choice model that combines the revealed preference (RP) answers and the stated preference (SP) choices of a developed online survey. The binary discrete choice was chosen for the purpose of simplicity, as investigating the car-sharing potential to predict the likelihood of choosing the proposed service in comparison with the original transportation mode of the respondents is the main focus of this research.
3.1. Survey Design and Sample Size
An online survey was designed via Google Forms, which is a tool that has been used previously in many transportation studies, such as those of Efthymiou et al. (2013) and Ullah et al. (2019) [22,23]. Then, the survey was shared through social media platforms, such as LinkedIn and Facebook, on many public and private social groups and pages. The collected data were categorized as a non-probabilistic sample of convenience, which is considered appropriate by similar research studies [34]. Several Facebook groups were targeted to reach students, staff, and alumni from educational institutes like Cairo University and the German University in Cairo. Direct contact was also an important way, which was done via online messaging, emailing, and physically distributing pamphlets with a QR code for the questionnaire link in faculties, companies, coffee shops, and restaurants.
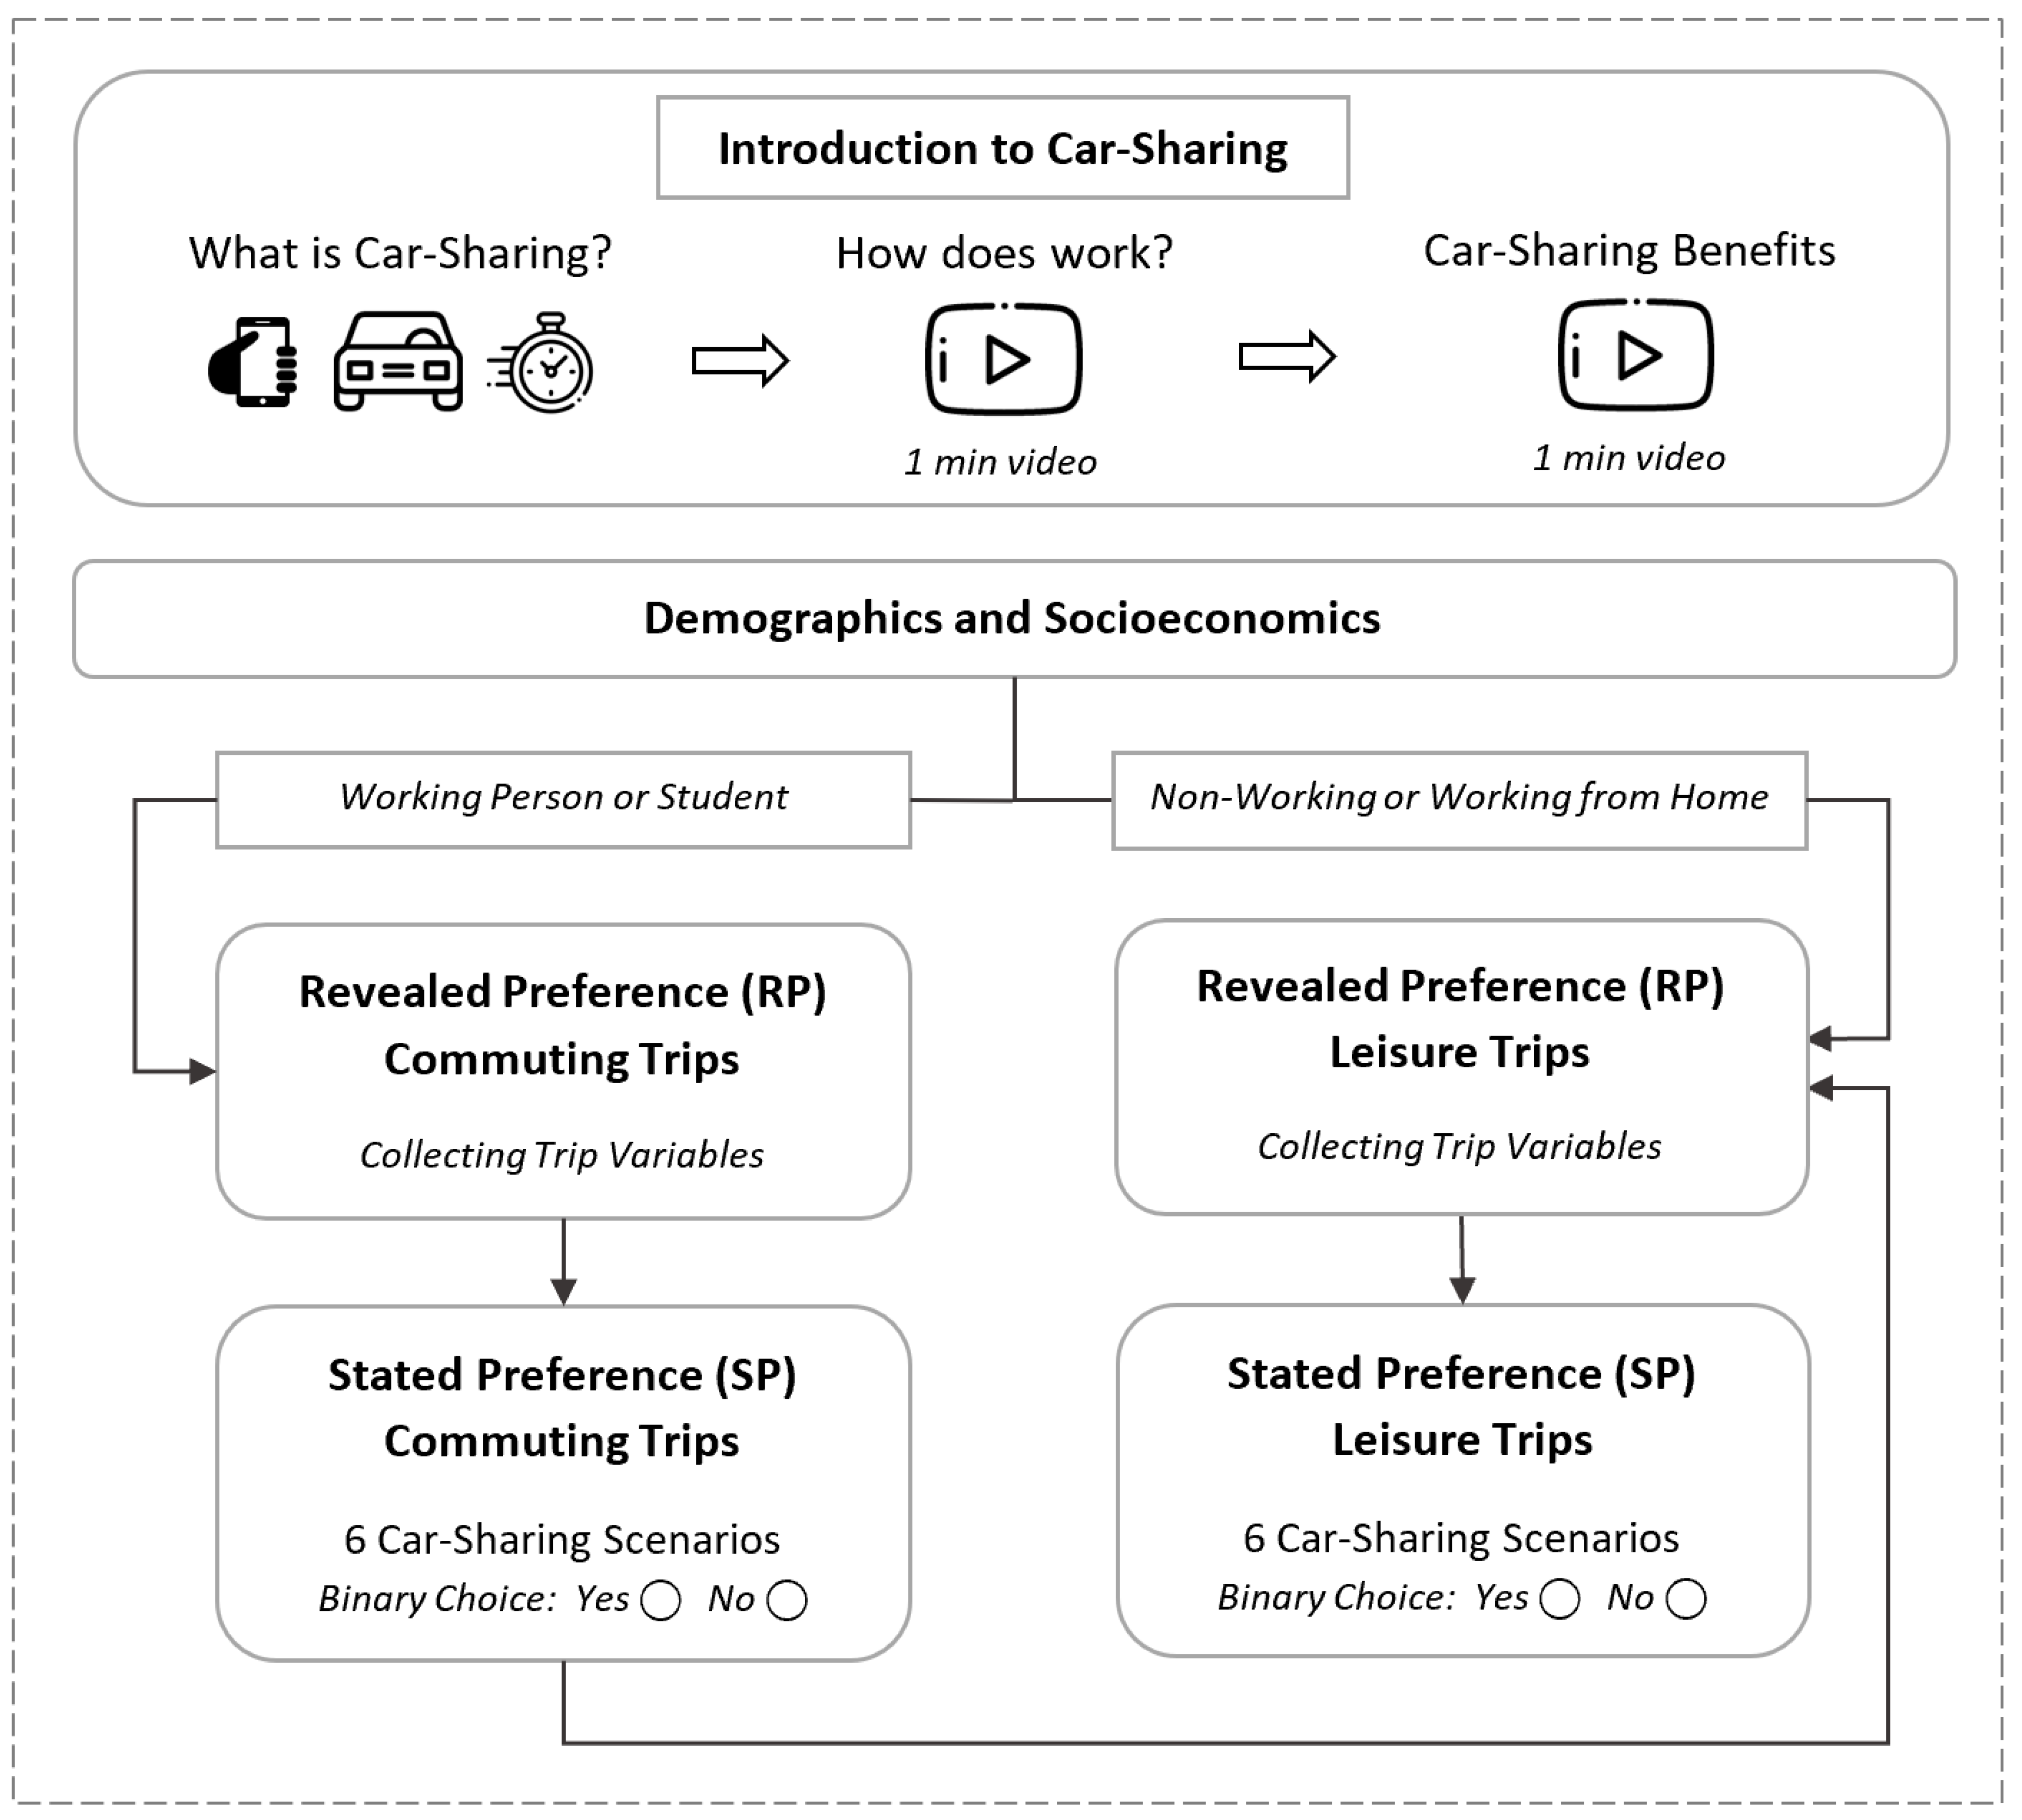
In addition to the survey’s questions, a small introduction to free-floating car-sharing was added, including two YouTube videos to briefly explain the concept of the service, how it works, and its benefits for the users. The questions start by collecting some important demographic data, followed by a revealed preference (RP) survey to show the mobility behavior of each individual and to collect the information about their actual trips. Last came the stated preference (SP) survey, which is the most important part, and which helps to predict the likelihood of future usage of car-sharing in the city. The concept of the survey design is demonstrated in Figure 1, and the English version of the survey content can be found in Appendix A.
Instead of creating unreal attributes for the several transportation modes running in the city, each respondent was asked if he/she would choose the car-sharing regarding his/her actual individual trips, of which attributes were collected in the RP questions. Thus, people stated their choice preferences for different hypothetical cases that are only related to the new service. Building the SP survey in this way creates choice cases based on every person’s real mobility behavior, and helps the respondent to compare the new transportation service to his/her familiar reference [24,25,26]. Limiting the hypothetical alternatives to one limited the number of possible scenarios that the respondents were required to evaluate, which gave the chance to build the SP survey with a full factorial design by limiting the number of attribute levels that were presented in the different choice scenarios. A full factorial design is when every possible scenario is created through every possible combination of the attribute’s levels [35,36].
In this SP survey, the full factorial design is focused only on three attributes (Table 1). There are two two-level attributes, which are the trip types and the approximate time needed to access the car-sharing vehicle, in addition to one three-level attribute, which is the travel cost per minute in Egyptian pounds (EGP). The cost levels were set to be realistic in comparison to similar car-sharing companies in the MEA region. Thus, the number of combination forms was 12 cases for each respondent. However, there were six cases of people who were asked only about their leisure trips because they did not commute daily to work or their education institutes, such as retired, unemployed, housewives, or even people who work from home.
A total of 4800 observations were collected from 419 respondents between 11 January and 6 February 2020. Then, these observations are analyzed using a binary logistic regression model to estimate the effects of different car-sharing attributes, users’ demographics, and socioeconomic characteristics on the decision to choose car-sharing.
While conducting a survey, one of the goals is to obtain a good representative sample size for a certain city population or a target group in order to have reliable results. To determine the minimum number of respondents, the following equations, Equations (1) and (2), from Levy and Lemeshow (2008) show that no matter how large the target group () is, the minimum sample size for a finite population will not exceed the sample size for an infinite population , which is equal to 384 when the statistical parameter () is 1.96 for a confidence level of 95%, the desired margin of error () is 5%, and the hypothesized population proportion ) is set as 0.5 to produce the maximum value [37].
3.2. Binary Logistic Regression (BLR)
A binary logistic regression (BLR) is only used when the response variable is dichotomous, such as with “yes” or “no”. This regression type predicts the likelihood of an observation’s outcome being equal to one out of only two values of a dependent variable, which is the car-sharing usage in this research, based on certain independent explanatory variables, which can be nominal, scale, or ordinal depending on the type of the data [38,39]. The nominal type is a categorical named variable that is defined to label the predictors with certain classifications without the involvement of any order or quantitative measures. The scale is a simple type of continuous numeric measurement, of which the scale is fixed between the predictor’s values. The ordinal type is also defined as a measurement predictor used to arrange the variables’ order, but the scale is not fixed between the predictor’s values. The mathematical difference between them cannot be calculated, but can be placed into order [40].
The logistic regression develops a model to calculate the possible odds and probability of an event depending on independent variables. These odds are predicted by the ratio of the probability of a certain event occurring against the probability of the opposite scenario. Even though odds and probabilities are sometimes used synonymously, it is important not to be mistaken between them because they are not the same. Probabilities are calculated as the ratio between the number of some specific outcomes versus the entire number of observations, and their values are defined between 0 to 1. However, odds are calculated as the ratio between two probabilities—as the probability of choosing a certain transportation mode versus the probability of choosing another one—and their value is defined from 0 to infinity. The binary logistic regression model is structured by the following equations, Equations (3) and (4), where is equal to the probability of a specific outcome, like choosing the car-sharing alternative, the constant value represents the reference measurement for all the predictors of the regression model, and is equal to the coefficient related to each independent variable .
For the logistic regression, it is suggested to have at least 10 events for every explanatory variable [39]. As there is a sample size of 4800 observations generated from the 419 respondents who answered the survey, it is possible to include as many predictors as needed.
4. Results and Discussion
4.1. Explanatory Variables
All explanatory variables generated from the survey were tested using a statistical software analysis to select the best combination for developing a significant binary logistic regression. Each group of variables explains certain characteristics, such as demographics, socioeconomics, and personal behavior. Some explanatory variables are related to trip attributes, such as the main mode of transport, travel time, travel cost, and buffer time. Additionally, there are variables related to the potential configurations of car-sharing, like the access time and the service cost.
4.1.1. Demographic and Socioeconomic Variables
Limiting the respondents to only internet users was associated with major distinctions in demographic and socioeconomic characteristics between the sample data and the total population statistics, which were calculated from the different CAPMAS reports [6,41,42,43]. These main comparisons are summarized in Table 2 and Table 3.
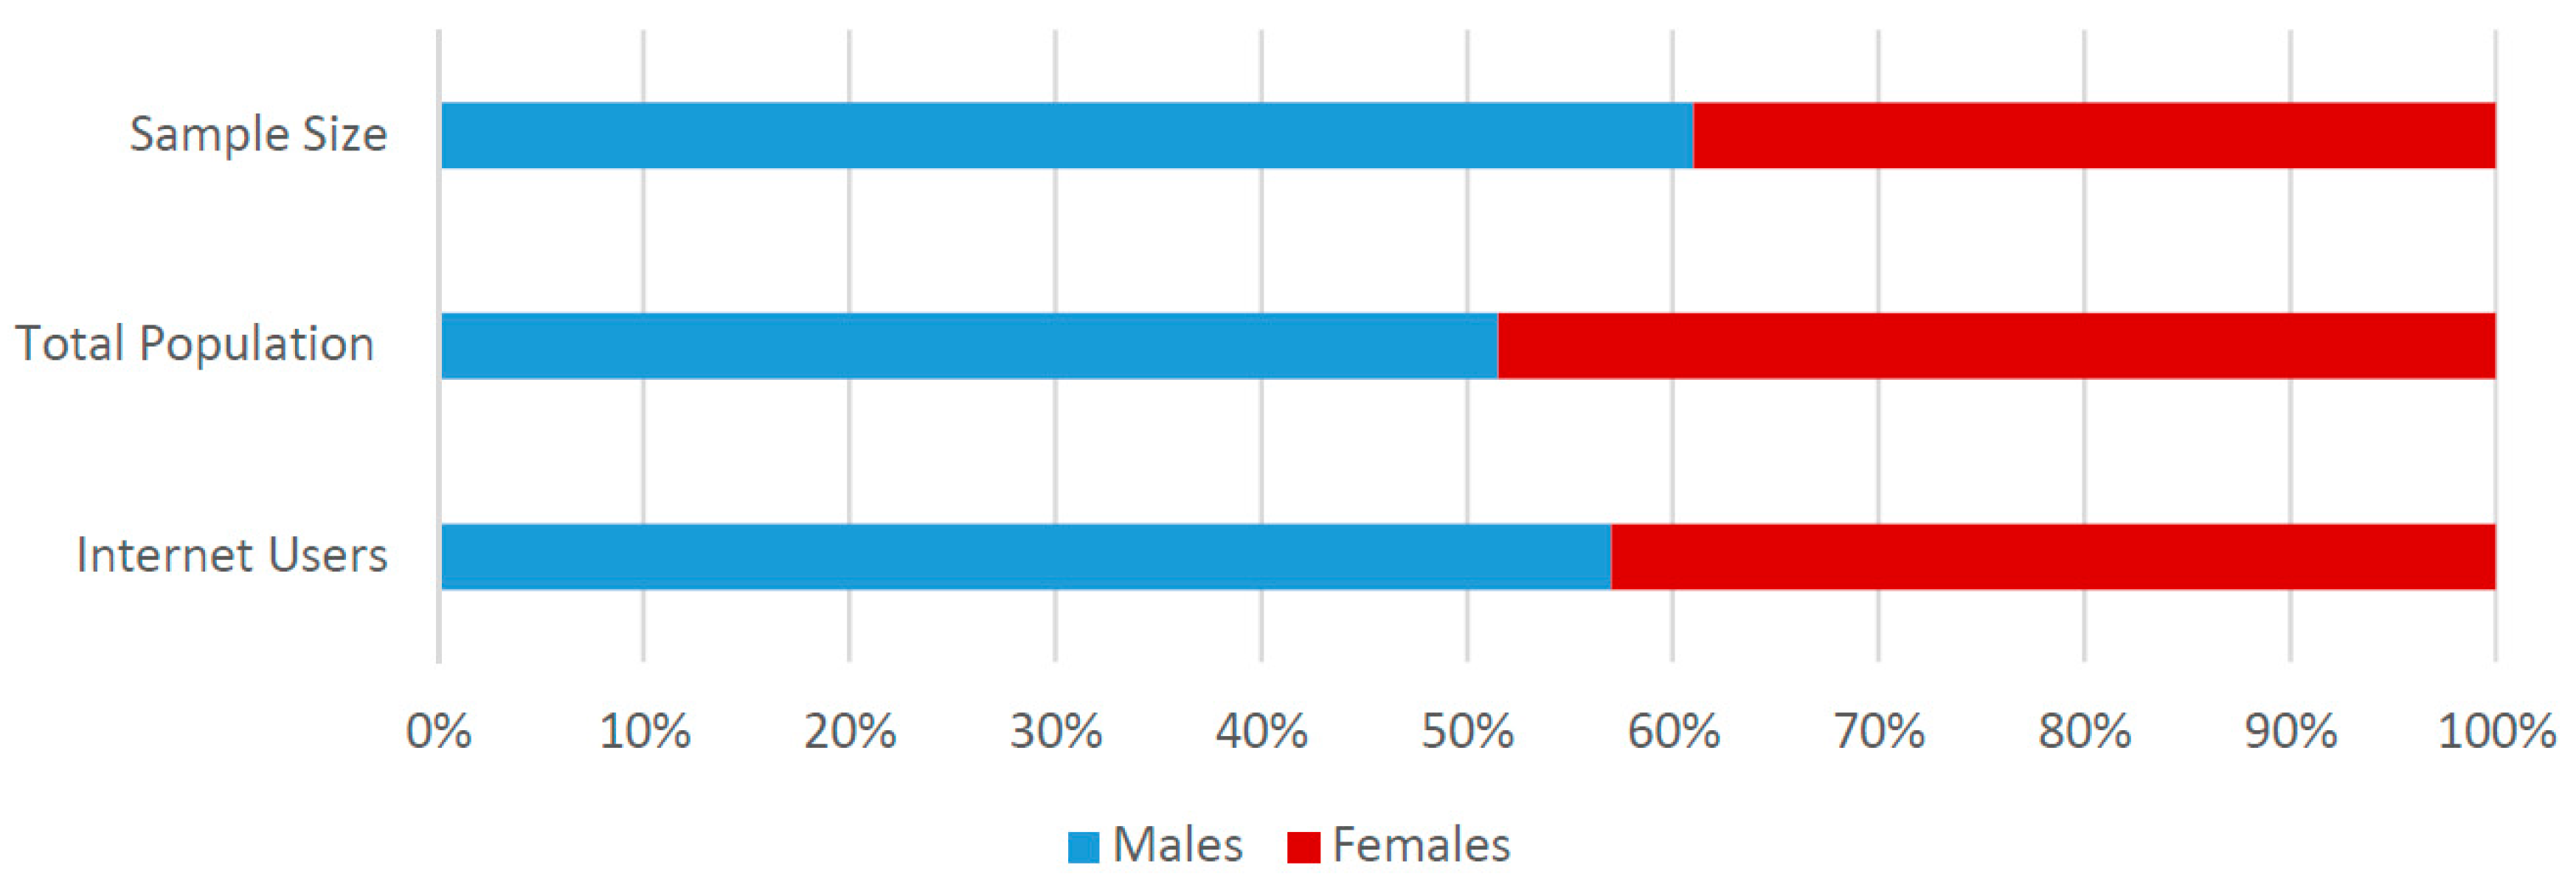
Table 4 lists the demographic and socioeconomic variables of the sample. The results do not show remarkable differences between males and females regarding their likelihood to choose car-sharing. The gender split of the respondents shows a lower representation for females with around 39%, compared to 61% of males. The gender distribution output does not reflect the population ratio in Egypt or Cairo, which indicates that males’ percentage is around 51% [6]. However, according to the Egyptian Ministry of Communication and Information Technology (MCIT; Figure 2), the demographic profile of internet users shows that 43% of internet users are females, while 57% are males [44]. This means that the survey has an acceptable gender distribution, as accessing the internet is indispensable for the targeted segment of car-sharing.
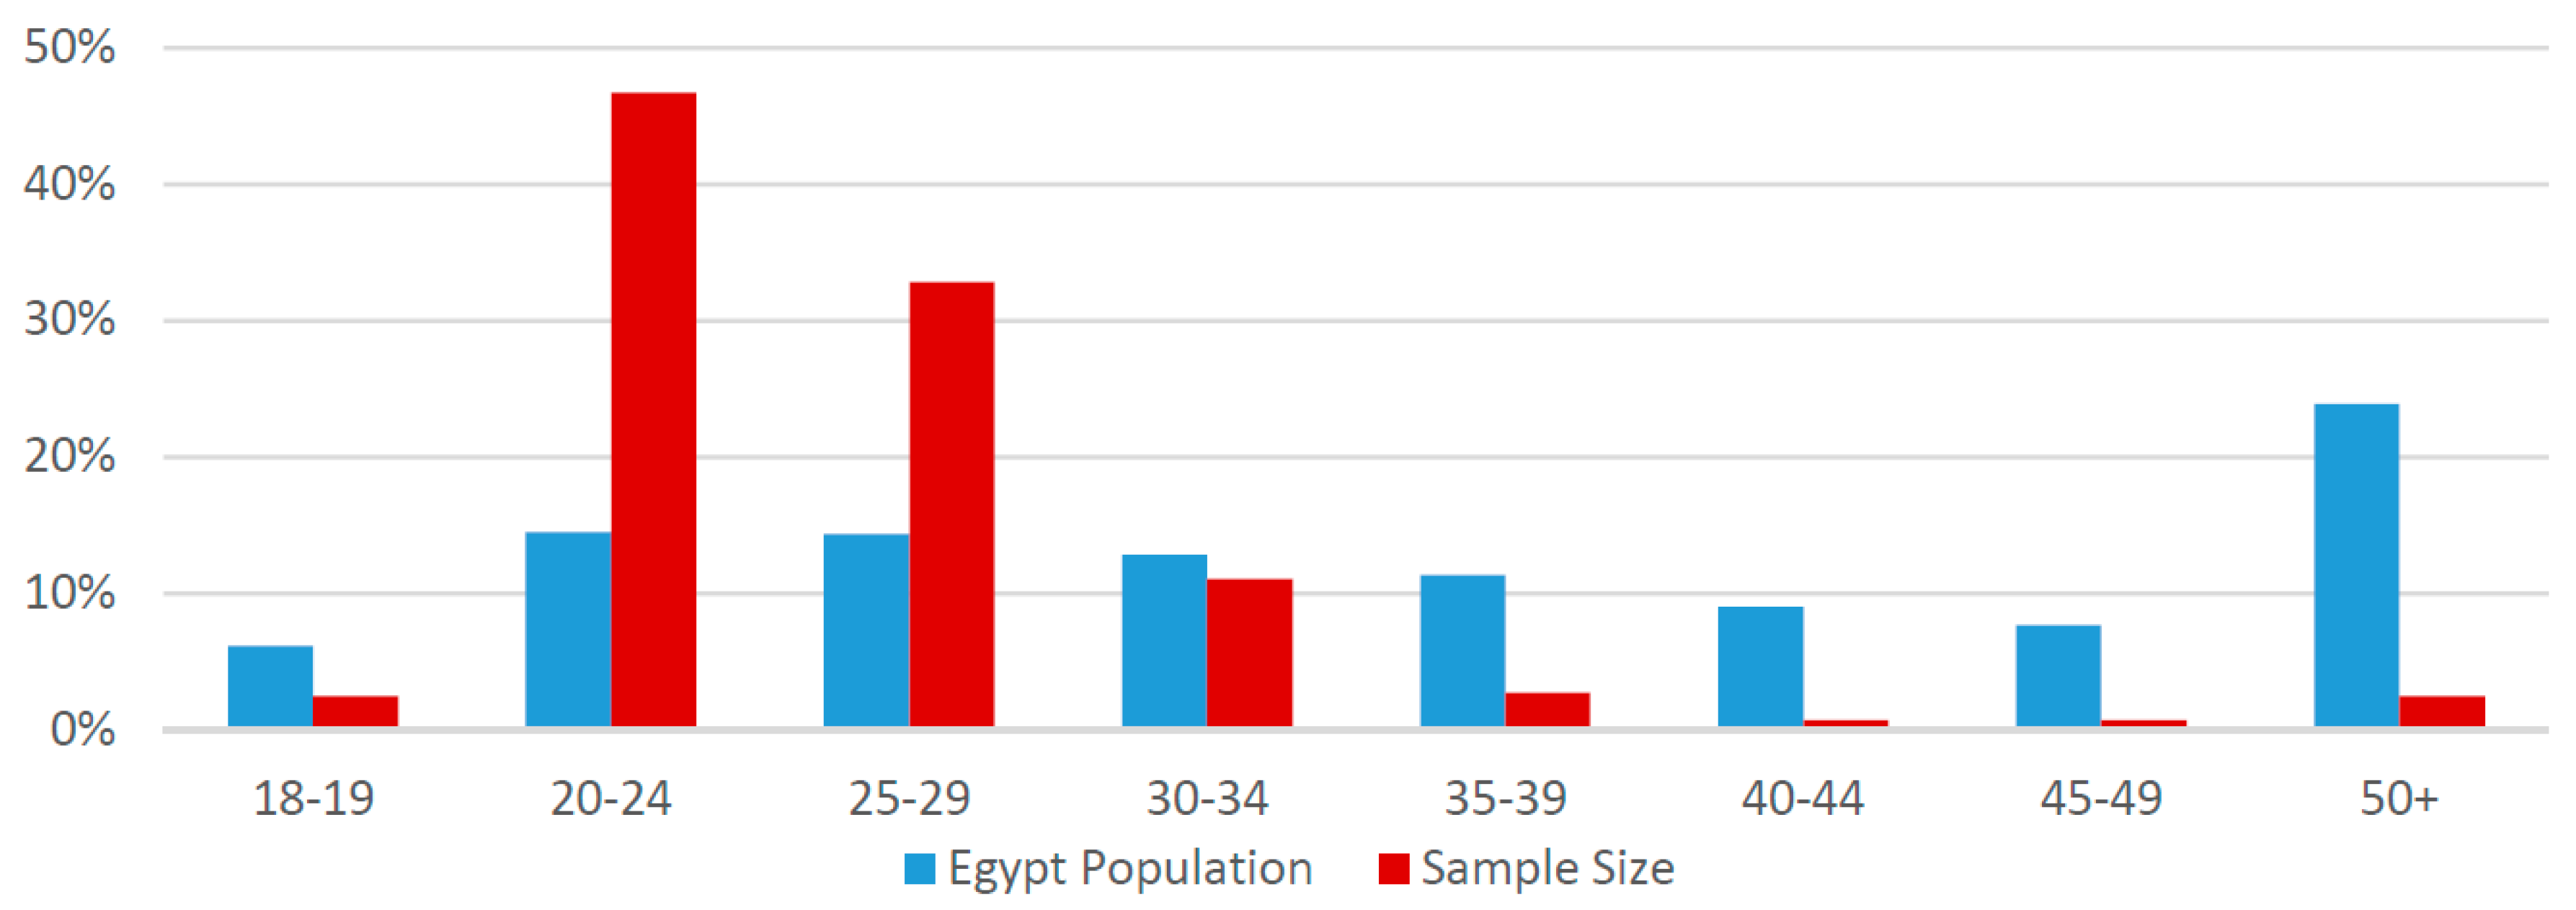
As shown in Figure 3, it is obvious that the young generation, who are in their twenties, were the most active group in answering the survey. The respondents between 20 and 29 years old are nearly 80% of the total sample, while people in their twenties are approximately 17.5% of the entire Egyptian population and 29% of the adults who are over 18 years old [6,43]. The older generations exceeding 35 years old are not well presented in the survey output, which could be focused on in future complementary research to further enhance the study. However, many studies stated that the targeted customers of car-sharing are the younger generations [21,23,28], which led Efthymiou et al. (2013) to limit their survey to target ages between 18 and 35 years old.
During standard life routine, only 1% of the respondents were working from home, as the COVID-19 pandemic did not reach Egypt at the time of collecting the survey data. The Egyptian ministry of health announced the first case of coronavirus on the 14th of February [45]. The majority of the respondents were employees, accounting for 54%, while about 39.4% of the internet users in the country are employees [44]. This difference is justified, as the percentage of internet users is calculated from the entire population, but the survey was only presented to adults.
According to CAPMAS, the average annual household (HH) income for Egyptian families in 2018 was 58,900 EGP, which is less than 5000 EGP per month [41]. It was found that nearly 82% of the respondents had a household income above this average, while more than 70% of the country’s household income is below the average. This means that the survey is more representative of the middle- and higher-income classes than the lower ones, which is also indicated by the car ownership.
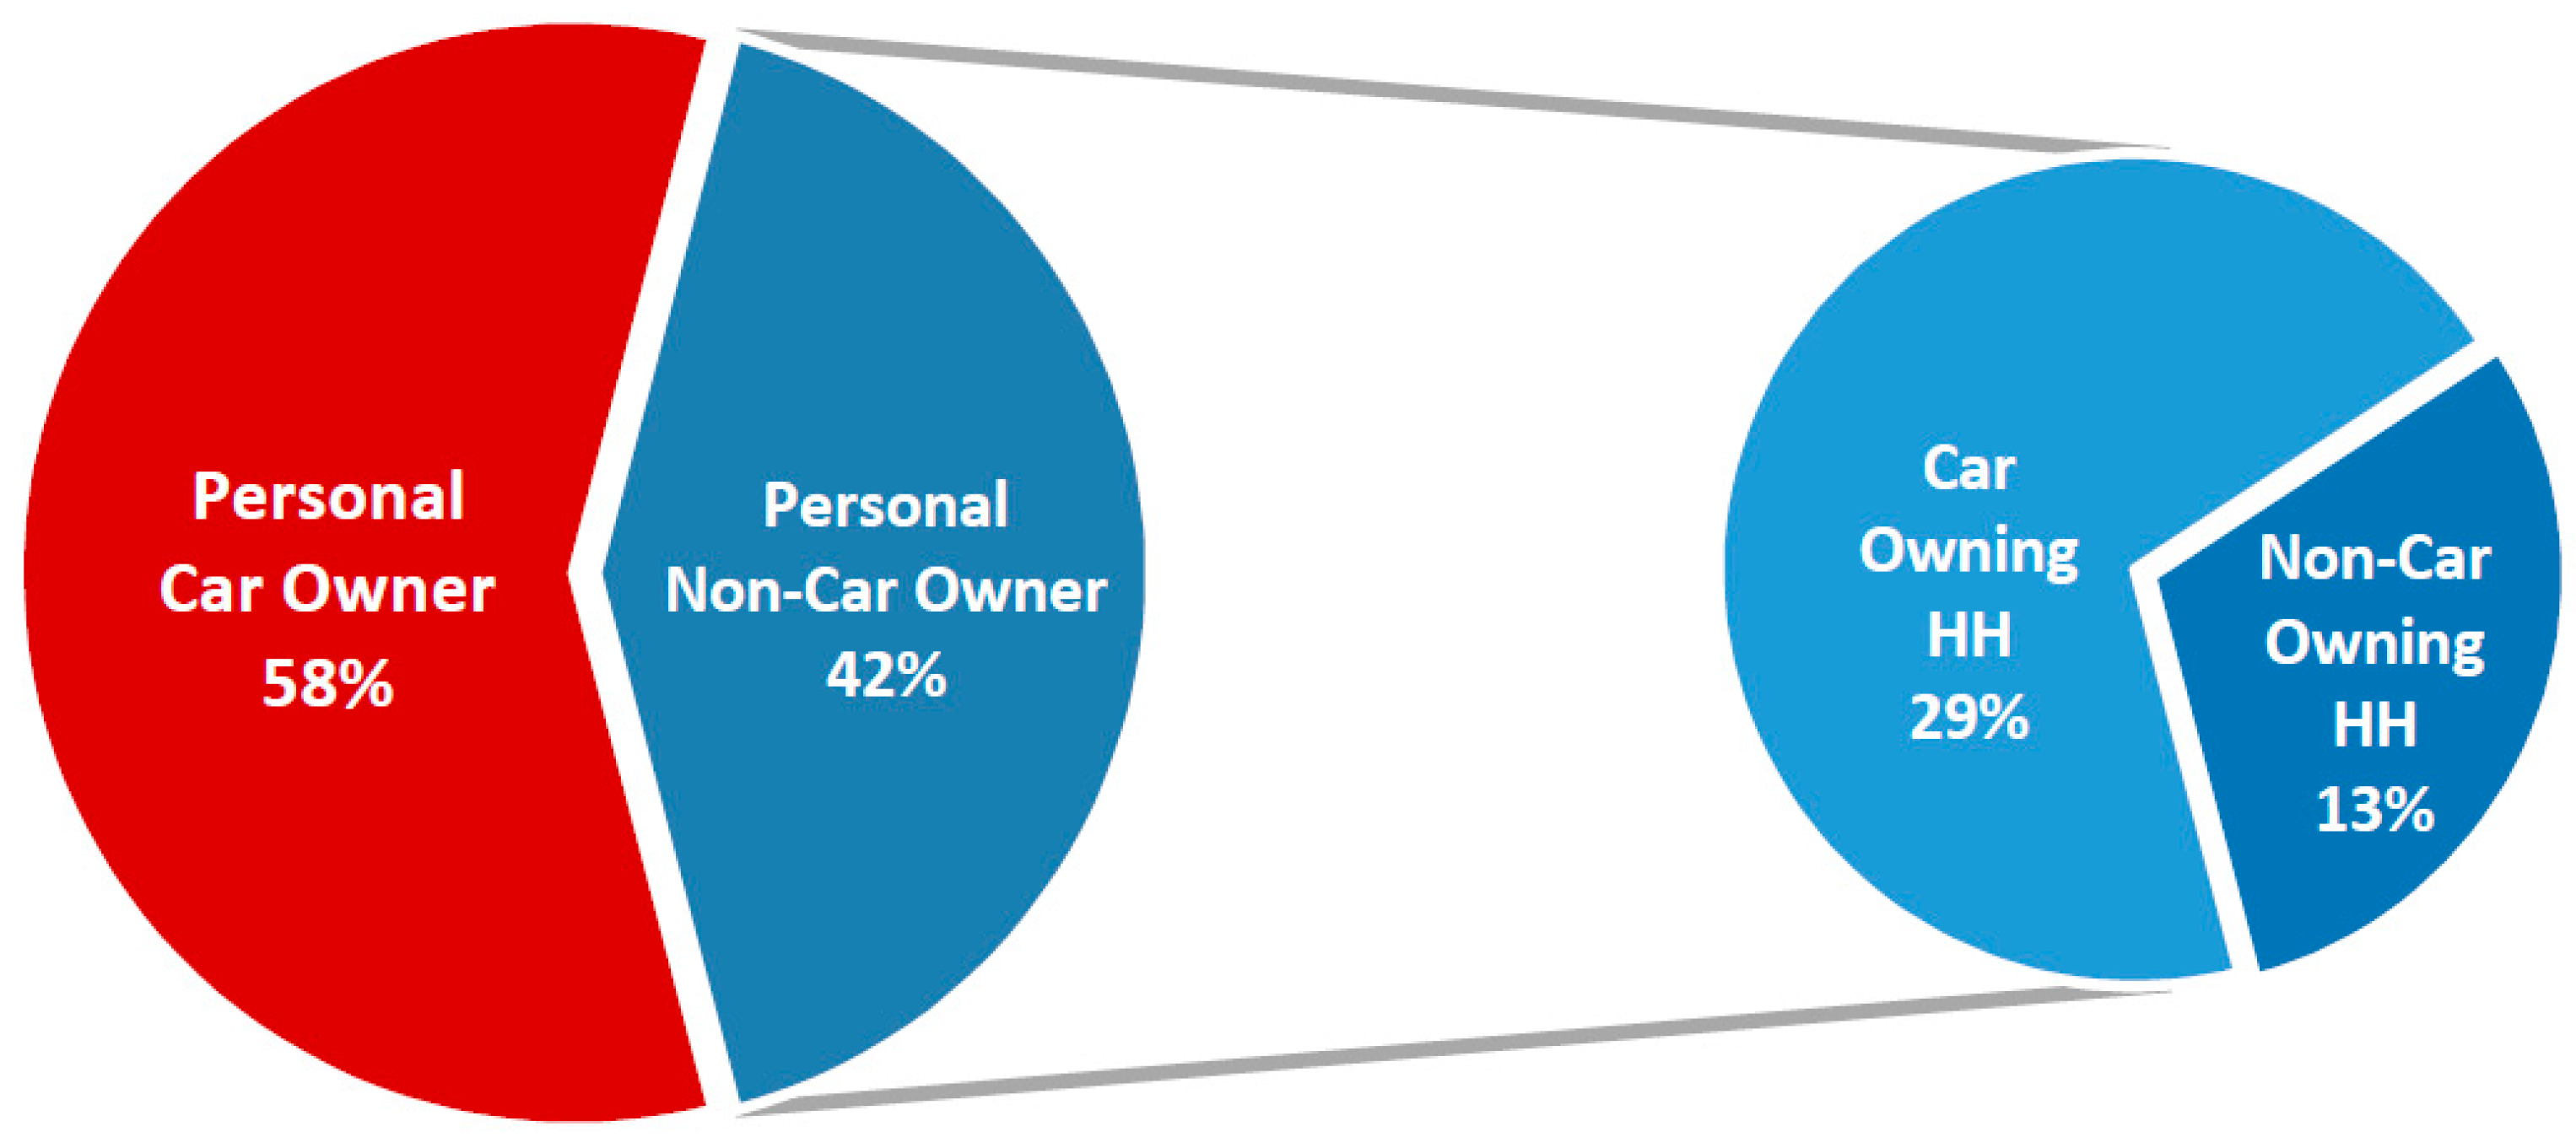
The number of cars per household varies from 0 to 6, as 13% do not have a car, 26% have access to one car, 30% have two cars, 21% have three cars, and 11% possess four or more cars. The average number of private cars per household was two cars for the entire sample. Only 18% of the respondents did not have a driving license, but this did not prevent them from choosing the car-sharing alternative. This means that either they could be willing to obtain a license or would consider using the car-sharing service as a passenger with a companion of their own. Additionally, people were asked if they personally owned a private vehicle, and the answers indicated that 58% of the sample were private car owners themselves (Figure 4) and were responsible for their yearly maintenance costs. This number is way above the car ownership percentage in the country.
The Egyptian private car ownership rate, shown in Table 3, is considered one of the lowest rates in the world, with only five cars per 100 inhabitants, and it is about double in the GCMA, with 11 cars per 100 inhabitants [42,43]. For example, this rate is lower than most of the European countries, where car ownership exceeds 60 cars per 100 inhabitants [46]. Taking into consideration that the underage ratio (<18 years old) in Egypt and the GCMA is nearly 40%, car density in Egypt is only around eight private cars per 100 adults, and the average number for the three governorates of the GCMA is approximately 17 private cars per 100 adults [42,43].
4.1.2. Trip Variables
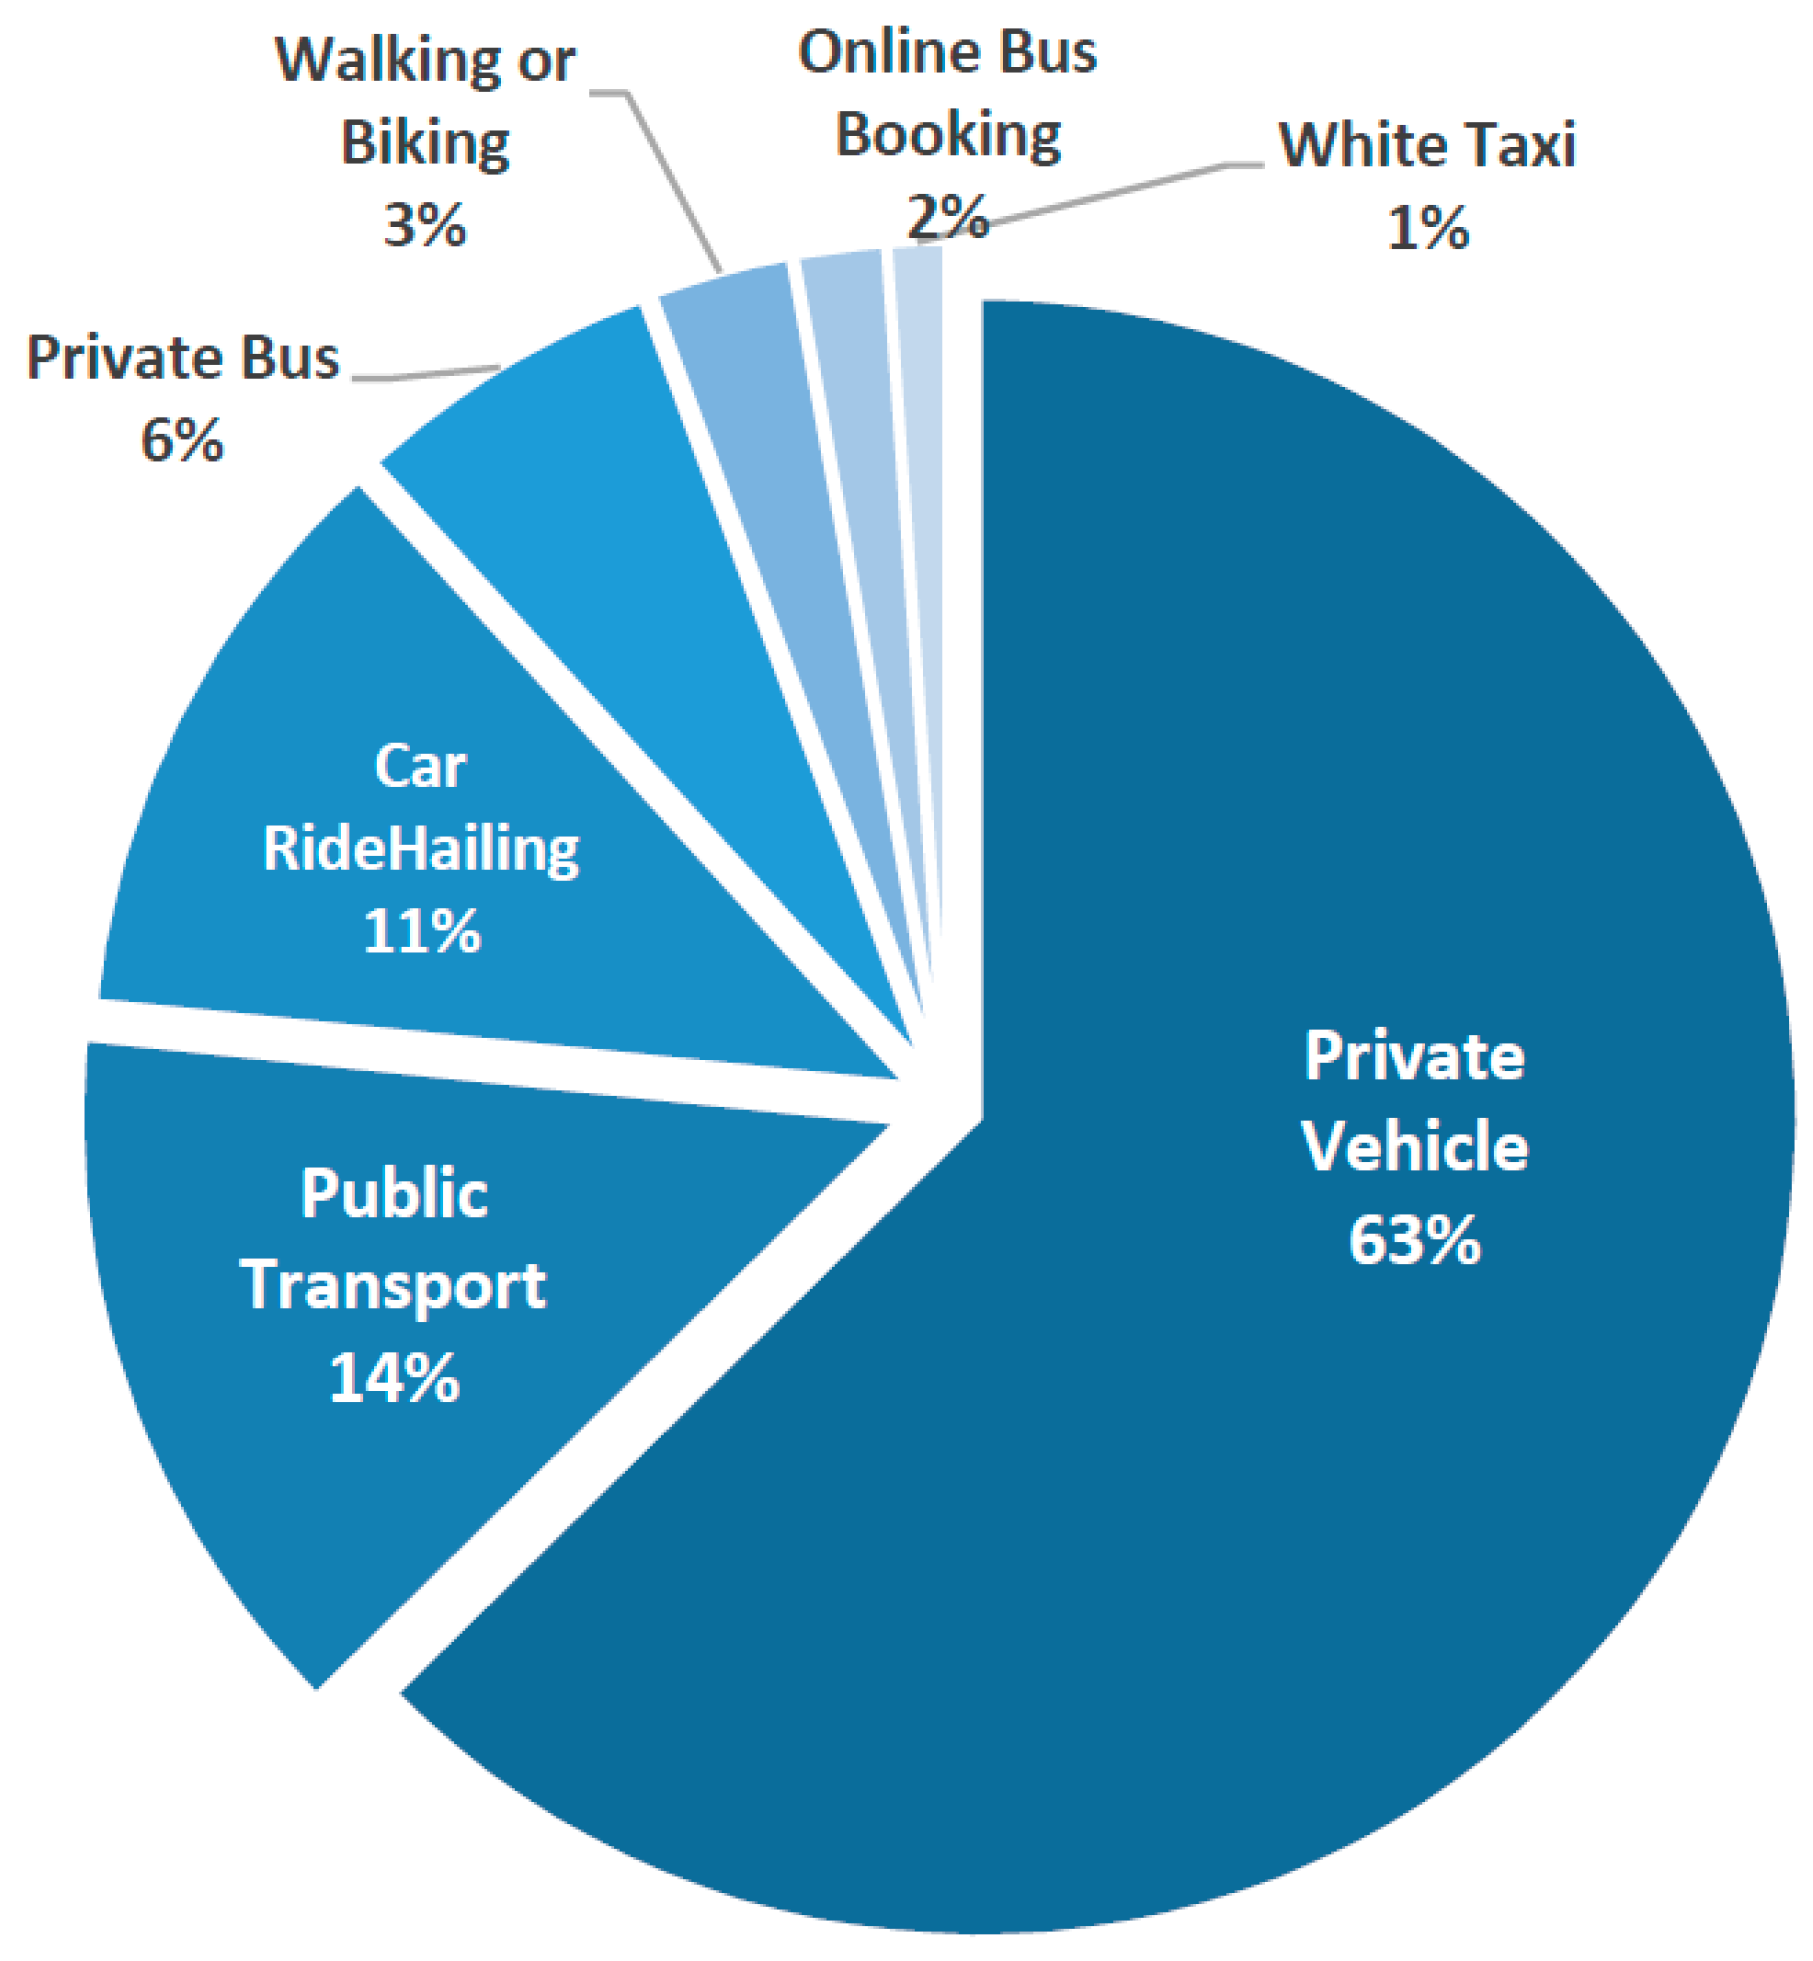
The stated preference choice is based on the trip characteristics uncovered by the respondents in the RP survey part, so each individual has unique scenarios. Table 5 presents the different trip variables of the sample. One of the most important variables that explain a trip is the main mode of transport. Figure 5 demonstrates the modal split of the sample observations, which shows that public transit has only a 14% share of total responses, while private vehicles are the most dominant with nearly 63%. It is worth mentioning the several differences in comparison to the real modal split in the GCMA. According to the Egyptian Ministry of Transport in 2014, public transit was absorbing 63% of all daily trips, while private cars contributed by a 21% share [47]. Therefore, the sample of this study is more representative of the private car users in Cairo.
Every transportation mode is related to certain attributes that fall under two categories—time and cost. Some of them are common for all modes, while others are special for only a certain type. The direct cost of a private vehicle is only represented by the parking cost, which is free in many areas around the GCMA. The costs of the other transportation modes are combined into one variable, which is the direct cost per trip. The trip duration is divided into two attributes, in-vehicle travel time and buffer time. In-vehicle travel is the time spent on the way to reach the respondent destination regardless of the transport mode, while the buffer time is the time wasted in reaching or accessing the transport mode, such as walking to the parking spot or the transit station or waiting for a taxi or a bus.
4.1.3. Car-Sharing Variables
Respondents’ familiarity with the new service is measured on three level of categories. The first level is defined as when the person heard of the car-sharing concept for the first time through the survey of this research, the second level is defined as when the person had heard about it before, and the third level is for the individuals who had used a car-sharing service when they were traveling abroad. It was found that 39% were newly introduced to the service, 53% had a background before answering the survey, and 8% had practical experience in a foreign country.
Of the total 4800 trip scenarios reported by the respondents, the likelihood of choosing car-sharing was 44% for the different attributes. However, this percentage varied significantly depending on the car-sharing attributes, such as service cost per minute and access time, as demonstrated in Figure 6. The combination of setting the fare to 2 EGP per minute and limiting the access time of the shared car to around 5 min increased the likelihood of choosing car-sharing to nearly 77%, while increasing the fare to 3 EGP per minute and doubling the access time to around 10 min dropped the likelihood to 18%. Defining different cost categories is necessary to define the willingness to pay regarding the new service and to identify the optimum accepted cost. In addition, the access time is a critical attribute that could push the user from or pull them toward the new service.
4.2. BLR Model
The developed BLR model focuses on the impact of the significant explanatory variables on the likelihood of choosing car-sharing if it launches in the GCMA. Therefore, the dependent variable is the preference of car-sharing use, which is a binary variable. The list of the 11 explanatory variables and their coefficients are mentioned in Table 6. The results present the significant covariates that built the finalized equation, their coefficients (B), which are in log-odds units, standard errors (S.E.), the p-values (Sig.), and the odds ratio—also known as the exponentiated coefficients (Exp(B))—which, in this case, is equal to the odds of choosing car-sharing divided by the odds of not choosing it. This was taken into consideration to build the model with the most significant covariates.
Table 7 presents the summary of the results of the statistical test. The Omnibus test of model coefficients shows a significance that is smaller than 0.0005, which indicates that the regression with the explanatory variables is an improvement over the baseline model without them. In addition, the Hosmer and Lemeshow test indicates that the p-value is approximately 0.06, which shows an acceptable goodness of fit. The pseudo-R2 values of Cox and Snell and of Nagelkerke are 0.192 and 0.258, respectively, which are considered reasonable values. They usually have lower values than the other types of R2 in multiple linear regressions, as they both explain the variation in the dependent variable in a different way [48]. By setting the cut value to 0.5, the overall correct percentage for the regression model is 70.9%. The percentage of the true “Yes” is 63.3%, while the percentage of the true “No” is 76.7%. This effectiveness assessment of the predicted output shows that the BLR model can be relied on.
4.2.1. Effects of Demographic and Socioeconomic Variables
Population age has a significant negative effect for every additional year the person is older, which indicates that younger people are more likely to use car-sharing. This effect is found to be in line with several previous studies that share the same effect of people’s age. Prieto et al. (2017) found that choosing car-sharing is driven to a certain extent by young generations. They suggested that young citizens are more likely to be attracted to the idea of sharing, as their perspective about mobility differs from that of the older mindsets [21]. They also pointed out that this young market segment is one of the drivers that encouraged some car manufacturers to invest in the car-sharing business to improve their brand loyalty. Other car-sharing studies, like those of Efthymiou et al. (2013) and Wang et al. (2012), also found negative coefficients for the age attributes in their regression models [23,28]. Moreover, this finding is in the same direction of another study in the field of the online ride-hailing in Cairo, which indicates that more younger people have adopted this ICT-based mobility mode than older people in Cairo [14,49].
As predicted, the effect of car ownership is negative with very high significance, which means that individuals who are personal car owners have a lower likelihood of choosing car-sharing for their trips. People who cannot afford to buy a new car or to maintain their own are a perfect target group for car-sharing services. So, the main target group that could benefit most from the service is non-car owners, who represent the majority of the adult population, as shown previously in Table 3. However, car maintenance, which is an ordinal numeric covariate from 0 to 7, inverts the effect of car ownership with a significantly positive coefficient. This means that the more the car owner pays for the annual maintenance, the more the effect of private car ownership is inverted. Even though the result showed that most of the car owners are not willing to give up their private vehicles, car-sharing could withhold the population from buying new ones. This is in line with the German study by Schmidt (2018) that estimates that adding one free-floating car-sharing car on the street reduces the rate of new car sales by 1.7 to 4.7 vehicles per year [20]. They showed that due to free-floating car-sharing, about 1.5% of the new car sales were eliminated inside cities. Other demographic covariates, such as gender, do not have a significant impact on car-sharing choice, which is similar to the findings of Yoon et al. (2017) [26]. In addition, Kortum et al. (2016) found that gender does not have a significant effect on the interest in car-sharing [50].
4.2.2. Effects of Trip Variables
The trip type output shows that leisure trips, such as for entertainment or shopping, have a negative effect on the likelihood of choosing car-sharing with high significance. So, people would more likely tend to use car-sharing while commuting to their work or university. This is in contrast to some studies, which found that car-sharing services are more likely used more for leisure purposes and non-routine trips than the daily commuting trips [51,52]. The respondent’s main mode of transportation has a very highly significant negative coefficient if it is public transportation or physical modes, like walking or biking. This reassures the concerns of those who think that car-sharing would replace the other sustainable mobility modes [49]. The reason for public transport’s negative coefficient is clear, as it is by far the most dominant means of transport [47], and a large segment of the population cannot afford another mode, as it is the cheapest mode of motorized transportation in the GCMA [53]. This is in the same direction as similar studies, like Mostofi et al. (2020), which mentioned there is no negative correlation between frequent use of public transport and ICT-based services, like ride-hailing, in Cairo [14]. In addition, walking or biking is usually used for short trips that do not need a motorized mode of transport. Ride-hailing offers different benefits from those of car-sharing, such as door-to-door trips and commuting as a passenger, which allow the traveler to make use of trip time for another activity, like reading. This could justify its significantly negative coefficient in the model.
The time spent inside the vehicle, regardless of which mode of transportation, also has a significantly negative coefficient for every additional minute. This effect was expected, as car-sharing fares were presented in the stated preference survey as cost per minute, so the more people are stuck in traffic, the more they would pay. This finding might differ if the fare system would be structured by mileage instead of time, which could be an interesting question for future research related to this study. On the other hand, people who spent more time to access their main mode of mobility tended to accept the idea of the extra time needed to access the car-sharing more. The buffer time, like walking to the bus station or waiting for a taxi, has a highly significant positive coefficient for every wasted minute. This means that the more wasted time there is for the current main mode of transport, the more this mode becomes less comfortable to its user, and he/she is open to the idea of choosing an alternative mode, like car-sharing.
4.2.3. Effects of Car-Sharing Variables
The model shows that all of the following car-sharing-related attributes have a very high significance. It was found that if the respondents have tried the car-sharing experience, they will be enthusiastic about using it in their city. Therefore, offering free rides for people to try a new service could be a good approach for marketing to attract customers as one of the company’s channels. The two main covariates related to the car-sharing service are the cost and access time. As predicted, the car-sharing cost has the most impact among variables, with the biggest negative coefficient for every 1 EGP increase and with very high significance. This means that the service provider should be careful while pricing the car-sharing, as only a few piasters could completely change the willingness to pay of the customers. It is not neglectable that the distance and the time spent to reach the car-sharing vehicle are discouraging elements for people who would use the service (Yoon et al., 2017) [26]. This is in line with this model’s output, which shows that the minutes needed to access the vehicle have a very highly significant negative effect.
5. Conclusions
The Greater Cairo Metropolitan Area (GCMA), as one of the largest megacities in the world, is suffering from high transportation demand, which is associated with severe traffic congestion and environmental challenges. Car-sharing could provide a sustainable solution, with the potential to decrease the number of private cars running on the streets and to complement the other modes of transport. This study reports the findings of an online stated preference (SP) survey conducted to predict the factors that affect the likelihood of choosing car-sharing if it launches in the GCMA. The responses were found to be more representative of the younger generations from middle- and higher-income classes. To analyze the SP survey data, a binary logistic regression model was adopted in the SPSS statistical software, which revealed some significant variables in the car-sharing choices.
The cost of the original main mode of transportation, such as the annual maintenance cost for private vehicles or direct trip costs of the other modes, has a significantly positive effect on the likelihood of choosing car-sharing. In addition, the buffer time wasted to access the original mode of transport, like walking or waiting, would encourage the people to switch to car-sharing. Additionally, people who previously used car-sharing services in a foreign country are more enthusiastic about using it in Cairo. On the other hand, the cost of the car-sharing fare and the time needed to reach and access a car has a significantly negative effect on the likelihood of choosing car-sharing, as well does the in-vehicle travel time. Attributes like age and car ownership also have a significantly negative coefficient in the model’s equation. In addition, it was found that car-sharing for leisure trips was less attractive than for commuting to work or universities in the GCMA. In addition, people who usually use public transit, ride-hailing, walking, or biking are less likely to choose car-sharing services.
These findings are the guidelines for potential investors to identify their target groups and set the service configuration to attract more users towards car-sharing. To optimize the service’s usage, it is recommended for the operators to target the commuting trips of the younger users. Covering business hubs and universities should have priority over the recreational places, as leisure trips have lower odds than commuting trips. Most importantly, the combination of the service cost and coverage is the main key to the company‘s success. Every increase in price an Egyptian pound and each additional minute needed to access the car reduce the odds exponentially. So, it is recommended to set the fare to 2 EGP per minute and to increase the coverage to limit the vehicle’s access time to approximately 5 min, which would achieve a greater number of customers. This combination increased the car-sharing choice to nearly 77% of the responses.
Finally, it is admissible to say that car-sharing has great potential to succeed in the Egyptian market, and it has wide acceptance and enthusiasm from the public. This study provides useful insights into evaluating the Egyptian market and identifying the possible market segments in the GCMA. It underscores how a new car-sharing service should set its fares, manage its vehicle fleet, and target potential customers. These insights could be useful for potential car-sharing providers to break into one of the largest markets in the Middle East and Africa.
For future research that could improve the richness of the results, it is suggested to evaluate more fare systems, such as paying per mile, and to introduce more business models, like station-based car-sharing, peer-to-peer platforms, and cooperative programs. These different business models could be included in developing a more sophisticated discrete choice model, such as a multinomial logit (MNL) model. This would provide a better understanding and flexibility for potential investors.
Author Contributions
Conceptualization, A.S. and H.M.; methodology, A.S.; software, A.S.; validation, H.M.; formal analysis, A.S.; investigation, A.S.; resources, A.S.; data curation, A.S.; writing—original draft preparation, A.S.; writing—review and editing, H.M.; visualization, A.S.; supervision, H.M.; project administration, H.M. All authors have read and agreed to the published version of the manuscript.
Funding
This research received no external funding.
Acknowledgments
We acknowledge support by the German Research Foundation and the Open Access Publication Fund of the Technische Universität Berlin.
Conflicts of Interest
The authors declare no conflict of interest.
Appendix A. English Version of the Survey Content
| Section | Survey Content |
| 1 | Introduction to (Car-Sharing) Pay-per-Minute Car Rental in Cairo |
| 2 | Personal Information |
| Q1. Age: _______ Q2. Gender: ○ Male ○ Female Q3. In which area do you live? _______ Q4. Is there a metro station near your home (up to 5 min walk)? ○ Yes ○ No | |
| 3 | Income Level |
| Q5. Which of these describes your household income per month? (EGP) ○ <1500 ○ 1501–2500 ○ 2501–5000 ○ 5001–10,000 ○ 10,001–25,000 ○ 25,001–50,000 ○ 50,000+ Q6. Which of these describes your personal expenses per month? (EGP) ○ <1500 ○ 1501–2500 ○ 2501–5000 ○ 5001–10,000 ○ 10,001–25,000 ○ 25,001–50,000 ○ 50,000+ | |
| 4 | Private Cars |
| Q7. How many cars does your household have? _______ Q8. Do you personally own a private car? ○ Yes ○No | |
| 5 | If No |
| Q9. Do you have a driving license? ○ Yes ○No | |
| 6 | If Yes |
| Q10. How much do you pay for your car maintenance per year? ○ <1500 ○ 1501–2500 ○ 2501–5000 ○ 5001–10,000 ○ 10,001–25,000 ○ 25,001–50,000 ○ 50,000+ Q11. How many times do you refill your gas tank per month? _______ | |
| 7 | Ride-Hailing |
| Q12. How much do you use services like Uber or Careem? ○ Never ○ Few times a year ○ Few times a month ○ Few times a week ○ Always Q13. If the services like Uber or Careem were not available, what would you have chosen instead? ○ Private car ○ Private motorbike ○ White taxi ○ Private bus: Work bus, university bus, etc. ○ Public transportation (metro, buses, microbuses, etc.) ○ Walking ○ Bicycle | |
| 8 | Occupation |
| Q14. Occupation: ○ Student ○ Employee ○ Entrepreneur ○ Working from home ○ Retired ○ Housewife ○ Unemployed | |
| 9 | Work/University |
| Q15. In which area is your work/university? _______ Q16. Is there a metro station near your work/university (up to 5 min walk)? ○ Yes ○ No Q17. What is the main mode you use to go to your work/university? ○ Private car ○ Private motorbike ○ White taxi ○ Uber/Careem/other taxi app ○ Swvl/Uber Bus/Careem Bus/other bus app ○ Private bus: work bus, university bus, etc. ○ Public transportation (metro, buses, microbuses, etc.) ○ Walking ○ Bicycle | |
| 10 | Private Mode: (If the respondent chose his/her private vehicle as the main mode) |
| Q18. How many minutes do you take on the road to reach your work/university? _______ Q19. How much do you pay for parking per day? _______ Q20. How many minutes do you walk to reach your parking spot? _______ | |
| 11 | Private Bus: (If the respondent chose the private bus as the main mode) |
| Q21. Is your subscription: ○ Annually ○ Monthly ○ Daily Q22. How much do you pay for it? _______ | |
| 12 | Cost of Your Chosen Mode (If the respondent did not choose a private mode) |
| Q23. How much do you pay per trip to work/university? _______ | |
| 13 | For Your Chosen Mode |
| Q24. How many minutes do you walk or wait for your transport mode to go to work/university? _______ Q25. How many minutes do you take inside the transport mode on the way to your work/university? _______ | |
| 14 | Work/University Trip |
| • For your trip to work/university: • If car-sharing started in Cairo and you could rent a car by minute, with free parking and free fuel: Q26. If you needed only around 5 min to access and rent the car, would you choose car-sharing if it would cost the following: i. 2 EGP/Minute ○ Yes ○ No ii. 2.5 EGP/Minute ○ Yes ○ No iii. 3 EGP/Minute ○ Yes ○ No Q27. Now you need around 10 min to access and rent the car. Would you choose car-sharing if it would costs the following: i. 2 EGP/Minute ○ Yes ○ No ii. 2.5 EGP/Minute ○ Yes ○ No iii. 3 EGP/Minute ○ Yes ○ No | |
| 15 | Entertainment or Shopping |
| Q28. What is the main mode you use to go for entertainment or shopping? ○ Private car ○ Private motorbike ○ White taxi ○ Uber/Careem/other taxi app ○ Private bus: work bus, university bus, etc. ○Public transportation (metro, buses, microbuses, etc.) ○ Walking ○ Bicycle Q29. How many times did you go for entertainment/shopping in the past 7 days? _______ Q30. In which area did you go out last time for entertainment or shopping? _______ Q31. Was there a metro station near your destination (up to 5 min walk)? ○ Yes ○ No | |
| 16 | Private Mode: (If the respondent chose his/her private vehicle as the main mode) |
| • For your last trip for entertainment or shopping Q32. How many minutes did you take on the road the last time to reach your entertainment or shopping destination? _______ Q33. How much did you pay for parking on this day? _______ Q34. How many minutes did you walk to reach your parking spot? _______ | |
| 17 | For Your Chosen Mode (If the respondent did not choose a private mode) |
| • For your last trip for entertainment or shopping Q35. How many minutes did you walk or wait for your transport mode last time to go for entertainment or shopping? _______ Q36. How much did you pay for your last trip to go for entertainment or shopping? _______ Q37. How many minutes did you take inside the transport mode on the way to your last trip to go for entertainment or shopping? _______ | |
| 18 | Entertainment or Shopping Trip |
| • For a trip like your last trip for entertainment or shopping: •If car-sharing started in Cairo and you could rent a car by minute, with free parking and free fuel: Q38. If you needed only around 5 min to access and rent the car, would you choose car-sharing if it would cost the following: i. 2 EGP/Minute ○ Yes ○ No ii. 2.5 EGP/Minute ○ Yes ○ No iii. 3 EGP/Minute ○ Yes ○ No Q39. Now you need around 10 min to access and rent the car. Would you choose car-sharing if it would cost the following: i. 2 EGP/Minute ○ Yes ○ No ii. 2.5 EGP/Minute ○ Yes ○ No iii. 3 EGP/Minute ○ Yes ○ No | |
| 19 | Last Section |
| Q40. Were you familiar with car-sharing? ○ This is the first time hearing about it ○ I’ve heard about it before ○ I’ve used it abroad Q41. If car-sharing is launching in Cairo, how much would you use it? ○ Never ○ Few times a year ○ Few times a month ○ Few times a week ○ Always | |
References
- Standing, C.; Standing, S.; Biermann, S. The implications of the sharing economy for transport. Transp. Rev. 2019, 39, 226–242. [Google Scholar] [CrossRef]
- Priya Uteng, T.; Julsrud, T.E.; George, C. The role of life events and context in type of car share uptake: Comparing users of peer-to-peer and cooperative programs in Oslo, Norway. Transp. Res. Part D Transp. Environ. 2019, 71, 186–206. [Google Scholar] [CrossRef]
- Giesel, F.; Nobis, C. The Impact of Carsharing on Car Ownership in German Cities. Transp. Res. Procedia 2016, 19, 215–224. [Google Scholar] [CrossRef] [Green Version]
- Martin, E.; Shaheen, S.; Lidicker, J. Carsharing’s impact on household vehicle holdings: Results from a north American shared-use vehicle survey. Transp. Res. Board 2010, 4411, 1–17. [Google Scholar]
- Shaheen, S.; Cohen, A.; Jaffee, M. Innovative Mobility: Carsharing Outlook–Worldwide Carsharing Growth. Available online: https://escholarship.org/uc/item/49j961wb (accessed on 2 March 2020).
- CAPMAS. Egypt in Figures, THE Egyptian Central Agency for Public Mobilization and Statistics, Cairo, Egypt, 2019. Available online: https://www.capmas.gov.eg/Pages/Publications.aspx?page_id=5104&Year=23445 (accessed on 2 July 2020).
- The World Bank Group. Cairo Traffic Congestion Study Final Report; No 18735; World Bank Other Operational Studies, The World Bank: Washington, DC, USA, 2013. [Google Scholar]
- City Population. EGYPT: Greater Cairo. Available online: https://www.citypopulation.de/php/egypt-greatercairo.php (accessed on 6 February 2020).
- UITP (International Association of Public Transport). Mena Transport Report 2016. Available online: http://www.mena.uitp.org/sites/default/files/MENA CTE_MENA Transport Report 2016.pdf (accessed on 2 March 2020).
- Hjorteset, M.A.; Böcker, L. Car sharing in Norwegian urban areas: Examining interest, intention and the decision to enrol. Transp. Res. Part D Transp. Environ. 2020, 84, 102322. [Google Scholar] [CrossRef]
- The World Bank Group. Cairo Traffic Congestion Study Executive Note; World Bank Other Operational Studies, The World Bank: Washington, DC, USA, 2014. [Google Scholar]
- The Global Economy. Roads Quality–COUNTRY Rankings. Available online: https://www.theglobaleconomy.com/rankings/roads_quality/ (accessed on 2 January 2020).
- Böcker, L.; Meelen, T. Sharing for people, planet or profit? Analysing motivations for intended sharing economy participation. Environ. Innov. Soc. Transit. 2017, 23, 28–39. [Google Scholar] [CrossRef] [Green Version]
- Mostofi, H.; Masoumi, H.; Dienel, H.-L. The Relationship between Regular Use of Ridesourcing and Frequency of Public Transport Use in the MENA Region (Tehran and Cairo). Sustainability 2020, 12, 8134. [Google Scholar] [CrossRef]
- Millard-Ball, A.; Gail, M.; Ter Schure, J. Car-Sharing: Where and How it Succeeds; National Academies Press: Danvers, MA, USA, 2005; ISBN 0309088380. [Google Scholar]
- Shaheen, S.; Cohen, A.; Randolph, M.; Farrar, E.; Davis, R.; Nichols, A. Carsharing. Available online: https://escholarship.org/uc/item/5rm2t387 (accessed on 2 March 2020).
- Martin, E.; Shaheen, S. The impact of carsharing on public transit and non-motorized travel: An exploration of North American carsharing survey data. Energies 2011, 4, 2094–2114. [Google Scholar] [CrossRef]
- Shaheen, S.; Martin, E. Impacts of car2go on Vehicle Ownership, Modal Shift, Vehicle Miles Traveled, and Greenhouse Gas Emissions. Innov. Mobil. 2016, 25. Available online: http://innovativemobility.org/wp-content/uploads/2016/07/Impactsofcar2go_FiveCities_2016.pdf%0Ahttp://www.tsrc.berkeley.edu (accessed on 2 March 2020).
- Firnkorn, J.; Müller, M. Selling Mobility instead of Cars: New Business Strategies of Automakers and the Impact on Private Vehicle Holding. Bus. Strateg. Environ. 2012, 21, 264–280. [Google Scholar] [CrossRef]
- Schmidt, P. The Effect of Car Sharing on Car Sales. SSRN Electron. J. 2018. [Google Scholar] [CrossRef]
- Prieto, M.; Baltas, G.; Stan, V. Car sharing adoption intention in urban areas: What are the key sociodemographic drivers? Transp. Res. Part A Policy Pract. 2017, 101, 218–227. [Google Scholar] [CrossRef]
- Ullah, I.; Liu, K.; Vanduy, T. Examining travelers’ acceptance towards car sharing systems-Peshawar City, Pakistan. Sustainability 2019, 11, 808. [Google Scholar] [CrossRef] [Green Version]
- Efthymiou, D.; Antoniou, C.; Waddell, P. Factors affecting the adoption of vehicle sharing systems by young drivers. Transp. Policy 2013, 29, 64–73. [Google Scholar] [CrossRef]
- Campbell, A.; Cherry, C.; Ryerson, M.; Jones, L. Better pen-and-paper surveys for transportation research in developing countries. Transp. Res. Rec. 2014, 2405, 42–48. [Google Scholar] [CrossRef]
- Morikawa, T.; Ben-akiva, M.; Mcfadden, D. Discrete choice models incorporating revealed preferences and psychometric data. Adv. Econom. 2002, 16, 29–55. [Google Scholar]
- Yoon, T.; Cherry, C.R.; Jones, L.R. One-way and round-trip carsharing: A stated preference experiment in Beijing. Transp. Res. Part D Transp. Environ. 2017, 53, 102–114. [Google Scholar] [CrossRef] [Green Version]
- Louviere, J.J.; Hensher, D.A. Using Discrete Choice Models with Experimental Design Data to Forecast Consumer Demand for a Unique Cultural Event. J. Consum. Res. 1983, 10, 348. [Google Scholar] [CrossRef]
- Wang, M.; Martin, E.; Shaheen, S. Carsharing in Shanghai, China. Transp. Res. Rec. 2012, 86–95. [Google Scholar] [CrossRef] [Green Version]
- Petrik, O.; De Abreu e Silva, J.; Moura, F. Stated preference surveys in transport demand modeling: Disengagement of respondents. Transp. Lett. 2016, 8, 13–25. [Google Scholar] [CrossRef]
- Wang, D.; Li, J.; Timmermans, H. Reducing respondent burden, information processing effort, and incomprehensibility in stated-preference surveys: Principles and properties of the pairwise design strategy. Transp. Res. Rec. 2001, 71–78. [Google Scholar] [CrossRef]
- Ben-Akiva, M.; Bradley, M.; Morikawa, T.; Benjamin, J.; Novak, T.; Oppewal, H.; Rao, V. Combining revealed and stated preferences data. Mark. Lett. 1994, 5, 335–349. [Google Scholar] [CrossRef]
- Train, K.; Wilson, W.W. Estimation on stated-preference experiments constructed from revealed-preference choices. Transp. Res. Part B Methodol. 2008, 42, 191–203. [Google Scholar] [CrossRef]
- Rose, J.M.; Bliemer, M.C.J.; Hensher, D.A.; Collins, A.T. Designing efficient stated choice experiments in the presence of reference alternatives. Transp. Res. Part B Methodol. 2008, 42, 395–406. [Google Scholar] [CrossRef]
- Mattia, G.; Guglielmetti Mugion, R.; Principato, L. Shared mobility as a driver for sustainable consumptions: The intention to re-use free-floating car sharing. J. Clean. Prod. 2019, 237, 117404. [Google Scholar] [CrossRef]
- Eboli, L.; Mazzulla, G. A stated preference experiment for measuring service quality in public transport. Transp. Plan. Technol. 2008, 31, 509–523. [Google Scholar] [CrossRef] [Green Version]
- Kroes, E.P.; Sheldon, R.J. Stated Preference Methods: An Introduction. J. Transp. Econ. Policy 1988, 22, 11–25. [Google Scholar]
- Levy, P.S.; Lemeshow, S. Sampling of Populations: Methods and Applications, 4th ed; Wiley: Hoboken, NJ, USA, 2008; ISBN 978-0-470-04007-2. [Google Scholar]
- Berger, D. Introduction to Binary Logistic Regression and Propensity Score Analysis. 2017. Available online: https://www.researchgate.net/publication/320505159_Introduction_to_Binary_Logistic_Regression_and_Propensity_Score_Analysis (accessed on 20 February 2020).
- Sperandei, S. Understanding logistic regression analysis. Biochem. Medica 2014, 24, 12–18. [Google Scholar] [CrossRef]
- Landau, S.; Everitt, B.S. A Handbook of Statistical Analyses Using SPSS; CRC Press LCC: Boca Raton, FL, USA, 2004; ISBN 9781420079333. [Google Scholar]
- CAPMAS. The Most Important Indicators of Income, Spending and Consumption Research 2018/1017, the Egyptian Central Agency for Public Mobilization and Statistics, Cairo, Egypt, 2019. Available online: https://www.capmas.gov.eg/Admin/Pages%20Files/2019123101612income1.pdf (accessed on 2 July 2020).
- CAPMAS. Bulletin of Licensed Vehicles Statistics, the Egyptian Central Agency for Public Mobilization and Statistics, Cairo, Egypt, 2017. Available online: https://censusinfo.capmas.gov.eg/Metadata-ar-v4.2/index.php/catalog/1495/download/4910 (accessed on 2 July 2020).
- CAPMAS. Egypt Census 2017, the Egyptian Central Agency for Public Mobilization and Statistics, Cairo, Egypt. Available online: https://www.capmas.gov.eg/Pages/Publications.aspx?page_id=7195&Year=23354 (accessed on 2 July 2020).
- MCIT (Ministry of Communications and Information Technology). Measuring the Digital Society in Egypt: Internet at a Glance, a Statistical Profile. Available online: http://www.mcit.gov.eg/Upcont/Documents/Publications_1272015000_Measuring_the_Digital_Society_in_Egypt_12_.pdf (accessed on 2 March 2020).
- Africanews. COVID-19: Egypt Confirms First Coronavirus Case in Africa. Available online: https://www.africanews.com/2020/02/14/covid-19-egypt-confirms-first-coronavirus-case-in-africa// (accessed on 19 October 2020).
- Eurostat. Passenger Cars in the EU. Available online: https://ec.europa.eu/eurostat/statistics-explained/index.php?title=Passenger_cars_in_the_EU&oldid=485664 (accessed on 2 March 2020).
- El-Dorghamy, A. Mainstreaming Electric Mobility in Egypt: Policy Brief; Friedrich Ebert Stiftung Egypt Office: Cairo, Egypt, 2018. [Google Scholar]
- Campo-Martínez, S.; Garau-Vadell, J.B.; Martínez-Ruiz, M.P. Factors influencing repeat visits to a destination: The influence of group composition. Tour. Manag. 2010, 31, 862–870. [Google Scholar] [CrossRef]
- Mostofi, H.; Masoumi, H.; Dienel, H.L. The association between regular use of ridesourcing and walking mode choice in Cairo and Tehran. Sustainability 2020, 12, 5623. [Google Scholar] [CrossRef]
- Kortum, K.; Schönduwe, R.; Stolte, B.; Bock, B. Free-Floating Carsharing: City-Specific Growth Rates and Success Factors. Transp. Res. Procedia 2016, 19, 328–340. [Google Scholar] [CrossRef]
- Sprei, F.; Habibi, S.; Englund, C.; Pettersson, S.; Voronov, A.; Wedlin, J. Free-floating car-sharing electrification and mode displacement: Travel time and usage patterns from 12 cities in Europe and the United States. Transp. Res. Part D Transp. Environ. 2019, 71, 127–140. [Google Scholar] [CrossRef]
- Becker, H.; Ciari, F.; Axhausen, K.W. Comparing car-sharing schemes in Switzerland: User groups and usage patterns. Transp. Res. Part A Policy Pract. 2017, 97, 17–29. [Google Scholar] [CrossRef] [Green Version]
- Sabry, S. How poverty is underestimated in Greater Cairo, Egypt. Environ. Urban. 2010, 22, 523–541. [Google Scholar] [CrossRef] [Green Version]
Figure 1.
Flow diagram of the survey concept design.

Figure 2.
Gender distributions for sample vs. total population vs. internet users.

Figure 3.
Age distributions of adults (18+) for the Egyptian population vs. the sample.

Figure 4.
Personal car ownership vs. household ownership.

Figure 5.
Modal split of the sample.

Figure 6.
Effects of car-sharing variables on respondents’ choices.


Table 1.
Levels of attributes.
| Levels | Trip Type | Car-Sharing Access Time | Car-Sharing Cost |
|---|---|---|---|
| 1 | Commuting Trips (Work or Education) | 5 min | 2 EGP/min |
| 2 | Leisure Trips | 10 min | 2.5 EGP/min |
| 3 | 3 EGP/min |
Table 2.
Sample vs. total population.
| Sample | Egyptian Population | |
|---|---|---|
| Males | 61% | 51.5% |
| Females | 39% | 48.5% |
| Adults’ age groups (18+) | ||
| 18–19 | 3% | 6% |
| 20–24 | 47% | 15% |
| 25–29 | 33% | 14% |
| 30–34 | 11% | 13% |
| 35–39 | 3% | 11% |
| 40–44 | 1% | 9% |
| 45–49 | 1% | 8% |
| 50+ | 3% | 24% |
| Above national average household (HH) income (58,900 EGP/year) | >82% | <30% |
Table 3.
Percentages of private car ownership.
| Egypt | Cairo Governorate | Giza Governorate | Qalyubia Governorate | GCMA | Sample | |
|---|---|---|---|---|---|---|
| Private Cars per Adult (18+) | 8% | 27% | 14% | 4% | 17% | 58% |
| Private Cars per Total Population | 5% | 19% | 8% | 2% | 11% | 58% |
Table 4.
Demographic and socioeconomic variables.
| Variables | Total Sample: N | Preference Choice of Car-Sharing | |
|---|---|---|---|
| No | Yes | ||
| 4800 (100%) | 2709 (56%) | 2091 (44%) | |
| Gender | |||
| Female | 1866 (39%) | 1035 (55%) | 831 (45%) |
| Male | 2934 (61%) | 1674 (57%) | 1260 (43%) |
| Age | |||
| 18–24 | 2364 (49%) | 1384 (59%) | 980 (41%) |
| 25–29 | 1578 (33%) | 826 (52%) | 752 (48%) |
| 30–34 | 534 (11%) | 297 (56%) | 237 (44%) |
| 35–39 | 132 (3%) | 82 (62%) | 50 (38%) |
| 40–44 | 36 (1%) | 13 (36%) | 23 (64%) |
| 45–49 | 36 (1%) | 28 (78%) | 8 (22%) |
| 50+ | 120 (3%) | 79 (66%) | 41 (34%) |
| Occupation | |||
| Student | 1872 (39%) | 1116 (60%) | 756 (40%) |
| Employee | 2592 (54%) | 1374 (53%) | 1218 (47%) |
| Entrepreneur | 156 (3%) | 119 (76%) | 37 (24%) |
| Working from Home | 36 (1%) | 17 (47%) | 19 (53%) |
| Housewife | 30 (1%) | 23 (77%) | 7 (23%) |
| Retired | 36 (1%) | 26 (72%) | 10 (28%) |
| Unemployed | 78 (2%) | 34 (44%) | 44 (56%) |
| HH Income (EGP/Month) | |||
| <1500 | 198 (4%) | 135 (68%) | 63 (32%) |
| 1501–2500 | 192 (4%) | 111 (58%) | 81 (42%) |
| 2501–5000 | 486 (10%) | 276 (57%) | 210 (43%) |
| 5001–10,000 | 1518 (32%) | 795 (52%) | 723 (48%) |
| 10,001–25,000 | 1182 (25%) | 691 (58%) | 491 (42%) |
| 25,001–50,000 | 786 (16%) | 458 (58%) | 328 (42%) |
| 50,000+ | 438 (9%) | 243 (55%) | 195 (45%) |
| Cars per HH | |||
| 0 | 606 (13%) | 317 (52%) | 289 (48%) |
| 1 | 1236 (26%) | 769 (62%) | 467 (38%) |
| 2 | 1422 (30%) | 850 (60%) | 572 (40%) |
| 3 | 990 (21%) | 439 (44%) | 551 (56%) |
| 4 | 390 (8%) | 227 (58%) | 163 (42%) |
| 5 | 108 (2%) | 83 (77%) | 25 (23%) |
| 6 | 48 (1%) | 24 (50%) | 24 (50%) |
| Driving License | 3936 (82%) | 2210 (56%) | 1726 (44%) |
| Car Ownership | 2790 (58%) | 1607 (58%) | 1183 (42%) |
| Car Maintenance (EGP/Year) | |||
| <1500 | 78 (2%) | 57 (73%) | 21 (27%) |
| 1501–2500 | 312 (7%) | 170 (54%) | 142 (46%) |
| 2501–5000 | 654 (14%) | 391 (60%) | 263 (40%) |
| 5001–10,000 | 1032 (22%) | 622 (60%) | 410 (40%) |
| 10,001–25,000 | 552 (12%) | 291 (53%) | 261 (47%) |
| 25,001–50,000 | 150 (3%) | 73 (49%) | 77 (51%) |
| 50,000+ | 12 (0%) | 3 (25%) | 9 (75%) |
Table 5.
Trip variables.
| Main Mode of Transportation | Total Sample: N | Preference Choice of Car-Sharing | Average In-Vehicle Time (min) | Average Buffer Time (min) | Average Direct Trip Cost (EGP) | Average Parking Cost (EGP) | |
|---|---|---|---|---|---|---|---|
| No | Yes | ||||||
| 4800 (100%) | 2709 (56%) | 2091 (44%) | |||||
| Private Vehicle | 3006 (63%) | 1714 (57%) | 1292 (43%) | 28 | 4 | 0 | 5 |
| Public Transport | 672 (14%) | 422 (63%) | 250 (37%) | 44 | 14 | 17 | 0 |
| Ride-Hailing | 558 (12%) | 281 (50%) | 277 (50%) | 28 | 7 | 50 | 0 |
| Private Bus | 294 (6%) | 135 (46%) | 159 (54%) | 46 | 9 | 5 | 0 |
| Walking or Biking | 132 (3%) | 90 (68%) | 42 (32%) | 0 | 0 | 0 | 0 |
| Online Bus-Booking | 84 (2%) | 37 (44%) | 47 (56%) | 48 | 9 | 33 | 0 |
| Taxi | 54 (1%) | 30 (56%) | 24 (44%) | 25 | 12 | 33 | 0 |
Table 6.
Binary logistic regression results.
| Explanatory Variables | Type | B | S.E. | Sig. | Exp(B) | |
|---|---|---|---|---|---|---|
| Age | Scale | −0.010 | 0.005 | 0.038 | * | 0.990 |
| Private Car Ownership | nominal | −0.528 | 0.162 | 0.001 | *** | 0.590 |
| Maintenance | Ordinal | 0.092 | 0.038 | 0.016 | * | 1.096 |
| Leisure Trips | nominal | −0.179 | 0.067 | 0.008 | ** | 0.836 |
| Public Transport | nominal | −0.720 | 0.119 | 0.000 | *** | 0.487 |
| Ride-Hailing | nominal | −0.326 | 0.154 | 0.034 | * | 0.722 |
| Walking or Biking | nominal | −0.709 | 0.220 | 0.001 | *** | 0.492 |
| In-Vehicle Travel Time | Scale | −0.005 | 0.002 | 0.003 | ** | 0.995 |
| Buffer Time | Scale | 0.016 | 0.006 | 0.005 | ** | 1.016 |
| Direct Trip Cost | Scale | 0.010 | 0.002 | 0.000 | *** | 1.010 |
| Used Car-Sharing Abroad | nominal | 0.941 | 0.125 | 0.000 | *** | 2.564 |
| Car-Sharing Cost Per Min | Scale | −2.232 | 0.085 | 0.000 | *** | 0.107 |
| Car-Sharing Access Time | Ordinal | −0.130 | 0.013 | 0.000 | *** | 0.878 |
| Constant | 6.748 | 0.292 | 0.000 | *** | 852.417 |
* Sig. ≤ 0.05; ** Sig. ≤ 0.01; *** Sig. ≤ 0.001.
Table 7.
Results of statistical tests.
| Statistical Tests | |
|---|---|
| Omnibus Tests of Model Coefficients | |
| Chi-square | 1024.275 |
| p-value | <0.0005 |
| −2 Log likelihood | 5550.149 |
| Cox and Snell R2 | 0.192 |
| Nagelkerke R2 | 0.258 |
| Hosmer and Lemeshow Test | |
| Chi-square | 15.028 |
| p-value | 0.06 |
| Overall Percentage of Correct Prediction | 70.9% |
Publisher’s Note: MDPI stays neutral with regard to jurisdictional claims in published maps and institutional affiliations. |
© 2020 by the authors. Licensee MDPI, Basel, Switzerland. This article is an open access article distributed under the terms and conditions of the Creative Commons Attribution (CC BY) license (http://creativecommons.org/licenses/by/4.0/).
Share and Cite
MDPI and ACS Style
Samaha, A.; Mostofi, H. Predicting the Likelihood of Using Car-Sharing in the Greater Cairo Metropolitan Area. Urban Sci. 2020, 4, 61. https://0-doi-org.brum.beds.ac.uk/10.3390/urbansci4040061
AMA Style
Samaha A, Mostofi H. Predicting the Likelihood of Using Car-Sharing in the Greater Cairo Metropolitan Area. Urban Science. 2020; 4(4):61. https://0-doi-org.brum.beds.ac.uk/10.3390/urbansci4040061
Chicago/Turabian StyleSamaha, Abdelrahman, and Hamid Mostofi. 2020. "Predicting the Likelihood of Using Car-Sharing in the Greater Cairo Metropolitan Area" Urban Science 4, no. 4: 61. https://0-doi-org.brum.beds.ac.uk/10.3390/urbansci4040061