Using Citizen Sensing to Identify Heat-Exposed Neighbourhoods


1
Department of Geography, Norwegian University of Science and Technology (NTNU), NO-7491 Trondheim, Norway
2
Deltares, 2600 MH Delft, The Netherlands
*
Author to whom correspondence should be addressed.
Urban Sci. 2021, 5(1), 14; https://0-doi-org.brum.beds.ac.uk/10.3390/urbansci5010014
Submission received: 28 December 2020
/
Revised: 20 January 2021
/
Accepted: 21 January 2021
/
Published: 26 January 2021
Abstract
:Rural areas cool off by night but built-up urban areas lack similar relief and may threaten vulnerable people’s health during heat waves. Temperature varies within a city due to the heterogenous nature of urban environments, but official measurement stations are unable to capture local variations, since they use few measurement stations typically set up outside of urban areas. Meteorological measurements may as such be at odds with citizen sensing, where absolute accuracy is sacrificed in pursuit of increased coverage. In this article, we use geographic information processing methodologies and generate 144 hourly apparent temperature surfaces for Rotterdam during a six-day heat wave that took place in July 2019 in The Netherlands. These surfaces are used to generate a humidex degree hours (HDH) composite map. The HDH metric integrates apparent temperature intensity with duration into one spatially explicit value and is used to identify geographical areas in Rotterdam where citizens may experience adverse health effects of prolonged heat exposure. Combining the HDH map with demographic data allows us to identify the most heat-exposed areas with the largest share of vulnerable population. These neighbourhoods may be the locations most in need of adaptation measures.
1. Introduction
1.1. Local Citizen Sensing
After the rise of Web 2.0 where “ordinary” citizens have been augmented into citizen sensors, that is, humans acting as sensors and sharing their observations and views using mobile devices [1], there has been a wide availability of geographical information voluntarily collected from a broad range of citizens, typically without formal training [2]. This technology has also enabled crowdsourcing, the delegation of professionals’ traditional tasks to the community at large [3,4]. Spatial crowdsourcing, citizen sensing and volunteered geographical information [5] are all similar terms relating to citizens acting as sensors to collect spatial information that are becoming available for the common good. Within meteorology, however, citizen sensing took place long before Web 2.0, thanks to the interest of amateurs [6]. Eden [6] stresses, however, that the term “amateur” does not imply that these observers are “unprofessional” or have “superficial knowledge”, but rather that the observations are made due to a passion for meteorology and for personal interest and not because it is their work. Since the turn of the millennium, automated weather stations have become commonplace in amateur observers’ gardens [7].
1.2. Quality of Citizen Sensing Data
The value of citizen sensing data may be limited by concerns associated with its quality and the degree to which the contributing data sources may be trusted [8]. Although crowdsourced atmospheric data lack the calibration, quality assurance and control of traditional data [9], traditional meteorological measurements are at odds with crowdsourced data collection where absolute accuracy is sacrificed in pursuit of increased coverage [10]. Indeed, classical observational networks are designed for detection of synoptic atmospheric conditions. The observational sensors are, therefore, typically set up outside of urban areas to ensure precise and representative observation, not influenced by the urban heat islands effects, and, thus, are rarely suitable for city-specific and intra-urban analysis [11]. Cost limitations often mean that these standard meteorological networks are not widely available in real-time or at the range of spatiotemporal scales required for urban heat island monitoring [12].
Automated weather stations are currently generally available primarily due to mass production of low cost and user-friendly weather stations as well as a huge interest from so-called amateur meteorologists to be able to store, analyse and share observations from their personal weather stations. There has also been extensive testing of the quality resulting from measurements done by automated personal weather stations, such as Netatmo. Meier, Fenner, Grassmann, Otto and Scherer [11] compared measurements from Netatmo sensors to a reference sensor for pre-defined temperature levels between 0 and 30 °C. They found that the Netatmo sensors fulfil the specified manufactured accuracy of ±0.3 °C except for the lowest temperature at 0 °C where a warm bias close to 0.5 K was detected.
This article is about using the automatic recordings of air temperature and humidity from Netatmo weather stations set up by ordinary people to investigate the heat wave in the Netherlands taking place between 22 and 27 July 2019. Using Rotterdam city as a case, the first research question we are pursuing is about quality assessment and bias compensation of Netatmo recordings:
RQ1: Comparing air temperature recordings from Netatmo sensors with official recordings, what quantity should we use to correct the recordings to compensate for the bias?
1.3. Heat Waves and Urban Areas
There is no universal definition of a heat wave [13], but The Royal Netherlands Meteorological Institute (KNMI) defines it as a minimum of five summer days (maximum temperature being 25 degrees Celsius or higher) of which a minimum of three are tropical (maximum temperature 30 degrees Celsius or higher). As global warming continues, the number of heat waves is expected to be more intense, more frequent and to last longer in Europe, more severe in the Mediterranean region and less severe in Northern Europe [13]. However, as the daytime surface heat island intensity of Rotterdam can be as large as 10 °C compared to surrounding non-urban areas [14] and as Dutch cities are densely populated, The Netherlands also have a high potential for adverse impacts of future heat waves [15].
Since 1901 until September 2019, The Netherlands have had 28 heat waves, 12 of them after 2000, and in 2019, maximum temperature for the first time even exceeded 40 degrees Celsius (https://www.knmi.nl/nederland-nu/klimatologie/lijsten/hittegolven). Figure 1a shows the development per decade in the number of heat waves in The Netherlands, whereas Figure 1b shows the accumulated number of days during the heat waves in that decade, as well as its number of tropical days.
Whereas Figure 1 demonstrates an alarming historical development, these graphs do not show the geography of heat wave impacts, enabling an identification of the most exposed locations. In general, urban areas are more exposed to rural areas, because of the heat island effect and higher levels of air pollution [16]. Heat waves are especially deadly in cities due to population density and urban surface characteristics. Rural areas cool off by night, but built-up urban areas lack similar relief and may threaten vulnerable people’s health [17]. However, there are also temperature variations within a city due to the heterogenous nature of urban environments such as the presence of trees and water bodies.
1.4. Exposure and Vulnerability
Hazard, exposure and vulnerability are three key concepts used by the IPCC and others when study risk related to climate change effects. A hazard is “the potential occurrence of a natural or human-induced physical event that may cause loss of life, injury, or other health impacts, as well as damage and loss to property, infrastructure, livelihoods, service provision, and environmental resources” [18]. A heat wave is a hazard [19] “that may cause loss of life, injury, or other health impacts” [18]. Exposure is defined as “the presence of people; livelihoods; environmental services and resources; infrastructure; or economic, social, or cultural assets in places that could be adversely affected” [18]. Being in a place where one is exposed to extreme heat can overwhelm a person’s ability to thermoregulate, resulting in physiologic heat stress, which may lead to death [20]. Finally, vulnerability is defined as “the propensity or predisposition to be adversely affected” [18]. Old age is an example of the predisposition that influence a group of people’s capacities to anticipate, cope with, resist and recover from a heat wave [21].
A commonly used metric to assess health issues related to heat waves, especially in the non-spatial epidemiology literature [22], is apparent temperature (AT), which is a function of temperature and humidity. At a 20% humidity level, the actual and perceived temperature is equal, but as humidity increases, so does apparent temperature. The human body cools down by perspiration, and heat is removed from the body by evaporation of that sweat. However, high levels of humidity reduce the human body’s capacity to evaporate and, thus, one gets a perception of being overheated. It is recognised that maps of apparent temperature are a useful source of information on heat exposure, but more difficult to map than air or surface temperature [22].
The formula for apparent temperature (AT) is as follows [23]:
where Tair is the air temperature (°C) taken from the Netatmo recordings and adjusted by the influence of relative humidity expressed as h:
where h is an increment added to air temperature to represent the effect of humidity on thermal sensation [23]. Equation (2) incorporates the term e that represents vapour pressure and is calculated as follows:
where Tdp is the dew-point temperature in Kelvin units.
Netatmo sensors do not measure dew-point temperatures, but these can be calculated based on relative humidity, which is recorded. The relationship between dew-point temperature (Tdp) and relative humidity (RH) is given by the Arden Buck equation [24]:
where a = 2/234.5, , c = −257.14 × β, , and β = lnRH + .
For the work presented by this article, we construct hourly apparent temperature maps during a heat wave period and combine these into a cumulative humidex degree hours (HDH) surface raster. The HDH composite raster describe spatiotemporal heat exposure for a typical extreme heat alert day [23]. The term “humidex” is short for humidity and index, an index developed by the Canadian meteorologists Masterton and Richardson [25]. Humidex reflects human felt hot and humid weather by an average person. Using the cumulative humidex hours surface raster in combination with demographic data on the neighbouring level, we investigate whether heat-exposed areas co-locate with areas with a high share of vulnerable population groups by pursuing the second research question:
RQ2: Based on Netatmo-generated apparent temperature surfaces, where are the most heat-exposed neighbourhoods and do these co-locate with neighbourhoods with a high share of vulnerable population groups?
2. Materials and Methods
2.1. Study Area
The city of Rotterdam (51°55′21″ N, 4°28′45.01″ E) is the second largest city of The Netherlands, with 630,000 citizens from 170 nationalities, and is situated about 40 km inland on the “New Meuse” River (Nieuwe Maas), one of the channels in the North Sea delta formed by the rivers Rhine and Meuse. Rotterdam is part of The Hague Metropolitan Area, which is a consortium of 23 municipalities. The city centre is located on the northern bank of the Nieuwe Maas, although recent urban development has extended the centre to parts of southern Rotterdam known as De Kop van Zuid (“the Head of South”, i.e., the northern part of southern Rotterdam). From its inland core, Rotterdam reaches the North Sea by a swathe of predominantly harbour area. For this study, we only use Netatmo recordings from Rotterdam’s city area, which is approximately 250 km2 (see Figure 2).
Rotterdam has a temperate climate influenced by the North Sea, with southwest wind direction, similar to all coastal areas in Netherlands, which maintains moderate temperatures throughout the year. Located near to the coast, its climate is slightly milder than locations further inland. Winters are cool with occasional cold days, while the summers are mild to warm. Temperatures above 30 °C are not rare during summer. Heat waves with temperatures above 30 °C occur and may happen more frequently in the future, mainly in the city centre, due to the urban heat island effect and the urban land use categories found in the city centre [26].
2.2. Data Management and Quality Assessment
Whereas the Netatmo sensors are numerous in Rotterdam, there is only one KNMI climate station situated near Rotterdam airport (see Figure 2). Data from the Netatmo sensors in Rotterdam, therefore, have the potential to increase the spatial resolution of weather observations. With a higher density of weather observations comes the opportunity to be better able to forecast phenomena such as heat waves being sensitive to the small-scale heterogeneous urban environment.
To check the accuracy of Netatmo recordings for Rotterdam in the period from 22 to 27 July, we compare them with observation from the one KNMI weather station operating within the study frame area (the weather station Rotterdam 06344 (http://projects.knmi.nl/klimatologie/metadata/rotterdam.html)). KNMI records temperatures for every hour, and we, therefore, have 144 hourly observations from midnight 21 July until midnight 27 July. A Netatmo sensor can record temperatures up to every 5 minutes. We sliced the Netatmo readings into hourly intervals, calculated descriptive statistics and excluded any observations that were more than three standard deviations from the mean of the hourly observations, similarly as Chapman, Bell and Bell [10]. Using the 144-point features of hourly Netatmo readings, we used spatial interpolation (ordinary Kriging) to generate temperature surfaces. For each of the resulting 144 hourly temperature surfaces, we extracted the interpolated temperature values at the location for the KNMI point to build a series of hourly temperature values. We joined this series with the official KNMI recordings and illustrate how these two sets of values correspond throughout the six days. In addition to the visual comparison, we also calculated the root-mean-square deviation (RMSD) to quantify the fit between paired series of data values.
2.3. Exposure and Vulnerability Mapping
For the heat exposure mapping, we calibrated the Netatmo recorded air temperatures with the quantified bias and used these together with Netatmo recorded relative humidity values to calculate dew-point temperatures. Further, we used the air temperatures and dew-point temperatures to calculate apparent temperature values for the locations of the Netatmo weather stations. Finally, we generated humidex degree hours (HDH), as it integrates apparent temperature intensity with duration into one spatial explicit value and used HDH to identify geographical areas in Rotterdam where citizens may experience adverse health effects of prolonged heat exposure.
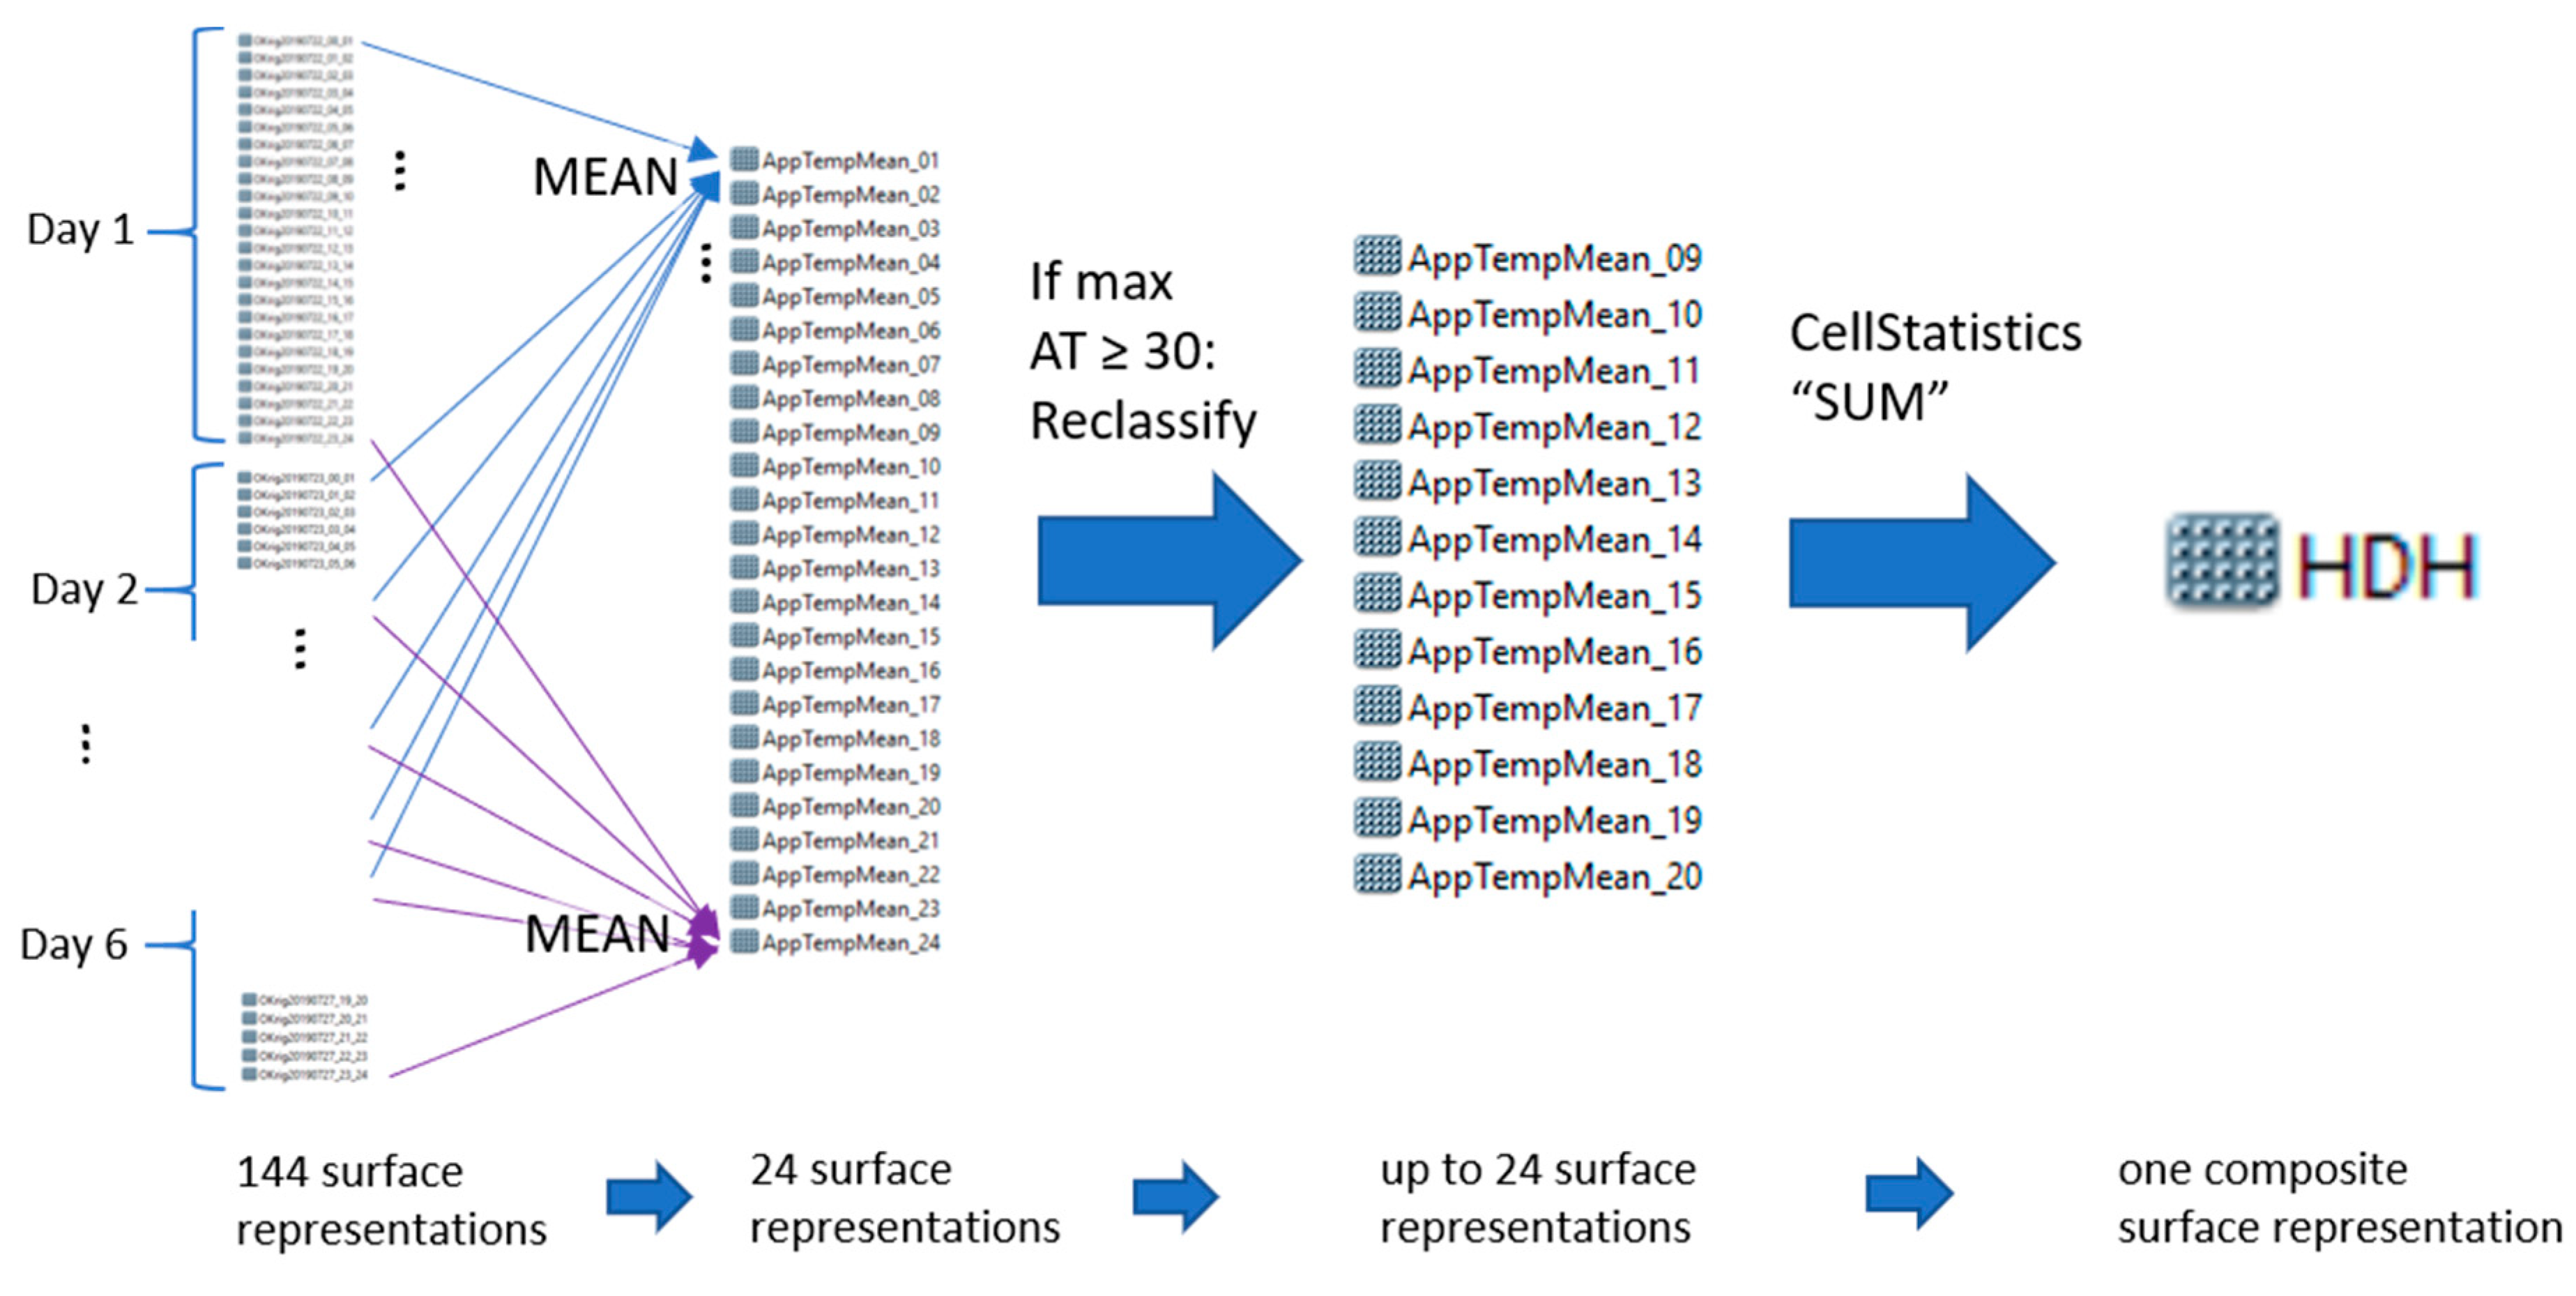
The workflow we used to produce the composite HDH raster surface is shown in Figure 3. Using ordinary Kriging, we generated 144 hourly apparent temperature surfaces, one for each hour during the six-day-long heat wave. Other length of heat waves would generate a different number of apparent temperature surfaces. A ten-day-long heat wave, for instance, would have generated 240 hourly apparent temperature surfaces. Following Kershaw and Millward [23], who also studied a six-day-long heat wave but in Toronto, we averaged the six measurements for each of the hours in a 24 h cycle resulting in 24 surface representations of apparent temperature. For a shorter or longer heat wave, there would still be 24 surface representations at this stage of the process. To generate a humidex degree hours (HDH) map, we reclassified those of the 24-h apparent temperature surface representations that had maximum apparent temperature equal or above 30 degrees, which were true for 12 of the rasters. Since 30 degrees is recognised as the temperature value when mortality experiences a sharp rise [27], an apparent temperature of 30 was assigned a value of 1, an apparent temperature of 31 was given a value of 2, and so forth. Apparent temperature below 30 was given the value 0. Cell values for these 12 rasters were summed to produce a cumulative humidex degree hours surface raster, “describing spatiotemporal heat exposure for a typical extreme heat alert day” [23].
We used the percentage of the population being 65 years or older to represent a vulnerable group particularly exposed to heat. Demographic data are available at the neighbourhood level, which is the lowest enumerative unit used by Statistics Netherlands (Centraal Bureau voor de Statistiek, CBS). We used the data that were collected for 2018. There are 302 neighbourhoods that are entirely or partly within our study area. The percentage of elderly population (65 years or older) ranges from 2 to 82% with a mean at 18.7% and standard deviation at 9.8%. Using the neighbourhood level as data containers, we used zonal statistics and calculated a mean value for HDH for each of the 302 units. That allowed us to identify the neighbourhood areas that has both high HDH values and had a high percentage of elderly in the neighbourhood.
3. Results
3.1. Accuracy Assessment of Netatmo Recordings
Figure 4 illustrates the correspondence between 144 temperatures registered by KNMI’s weather station (blue lines) and 144 estimated values extracted from temperature surfaces at the location for the KNMI weather station (red lines). KNMI’s lowest temperature observation is 15.1 (23 July, 4 h), whereas its maximum temperature is 37.2 (25 July, 16 h). From the Netatmo-generated temperature surfaces, the minimum and maximum temperatures extracted at the location for the KNMI station are 17.5 (23 July, 4 h) and 37.8 (25 July, 17 h), respectively. The temperature graphs in Figure 4 suggest that Netatmo recordings have a warm bias for most temperatures measured in Rotterdam. A comparison of the mean temperature values for the observed and estimated values, at the location for the KNMI station, confirm a warm bias of 1.6 degrees. The temperature graphs in Figure 4 further suggest that Netatmo recordings are slightly higher than the KNMI recordings (especially during night-time), and that Netatmo recordings are “delayed” compared to KNMI observations. Although the location of the point where values are extracted (the location for the KNMI weather station is not in a built-up environment), the fact that Netatmo sensors are mostly set up in an urban fabric land use category influences the interpolated temperature surfaces. Build up areas heat up during the day but cool down slower than other environments [17]. Otherwise, the two curves are congruent and have a very high correlation coefficient (Pearson’s R = 0.94).
The mean difference between the 144 KNMI recordings and the extracted values from the 144 Netatmo-generated air temperature surfaces at the location for the KNMI station is a positive bias of 1.6. In order to identify the quantity to calibrate, we ran one test without calibration and five tests, adjusting the Netatmo air temperature recordings with different levels of adjustment where Netatmo air temperature recordings are subtracted by −0.5, −1.0, −1.5, −2.0 and −2.5 °C. Thereafter, using formula 4, we calculated six sets of 144 dew-point temperatures based on Netatmo air temperature recordings with no or five levels of adjustment. As a reference, we used 144 dew-point temperatures recorded by the KNMI station. Table 1 shows the effect on RMSD (the closer to 0 the better the fit) on the dew-point temperatures.
For RQ2, as there are thresholds used for when apparent temperature values may become harmful for human health, these values should be calibrated. We adjusted the Netatmo air temperature recordings with the calibration yielding the lowest value for RMSD, that is, with −1.5 °C.
3.2. Heat Hazard and Vulnerable Population
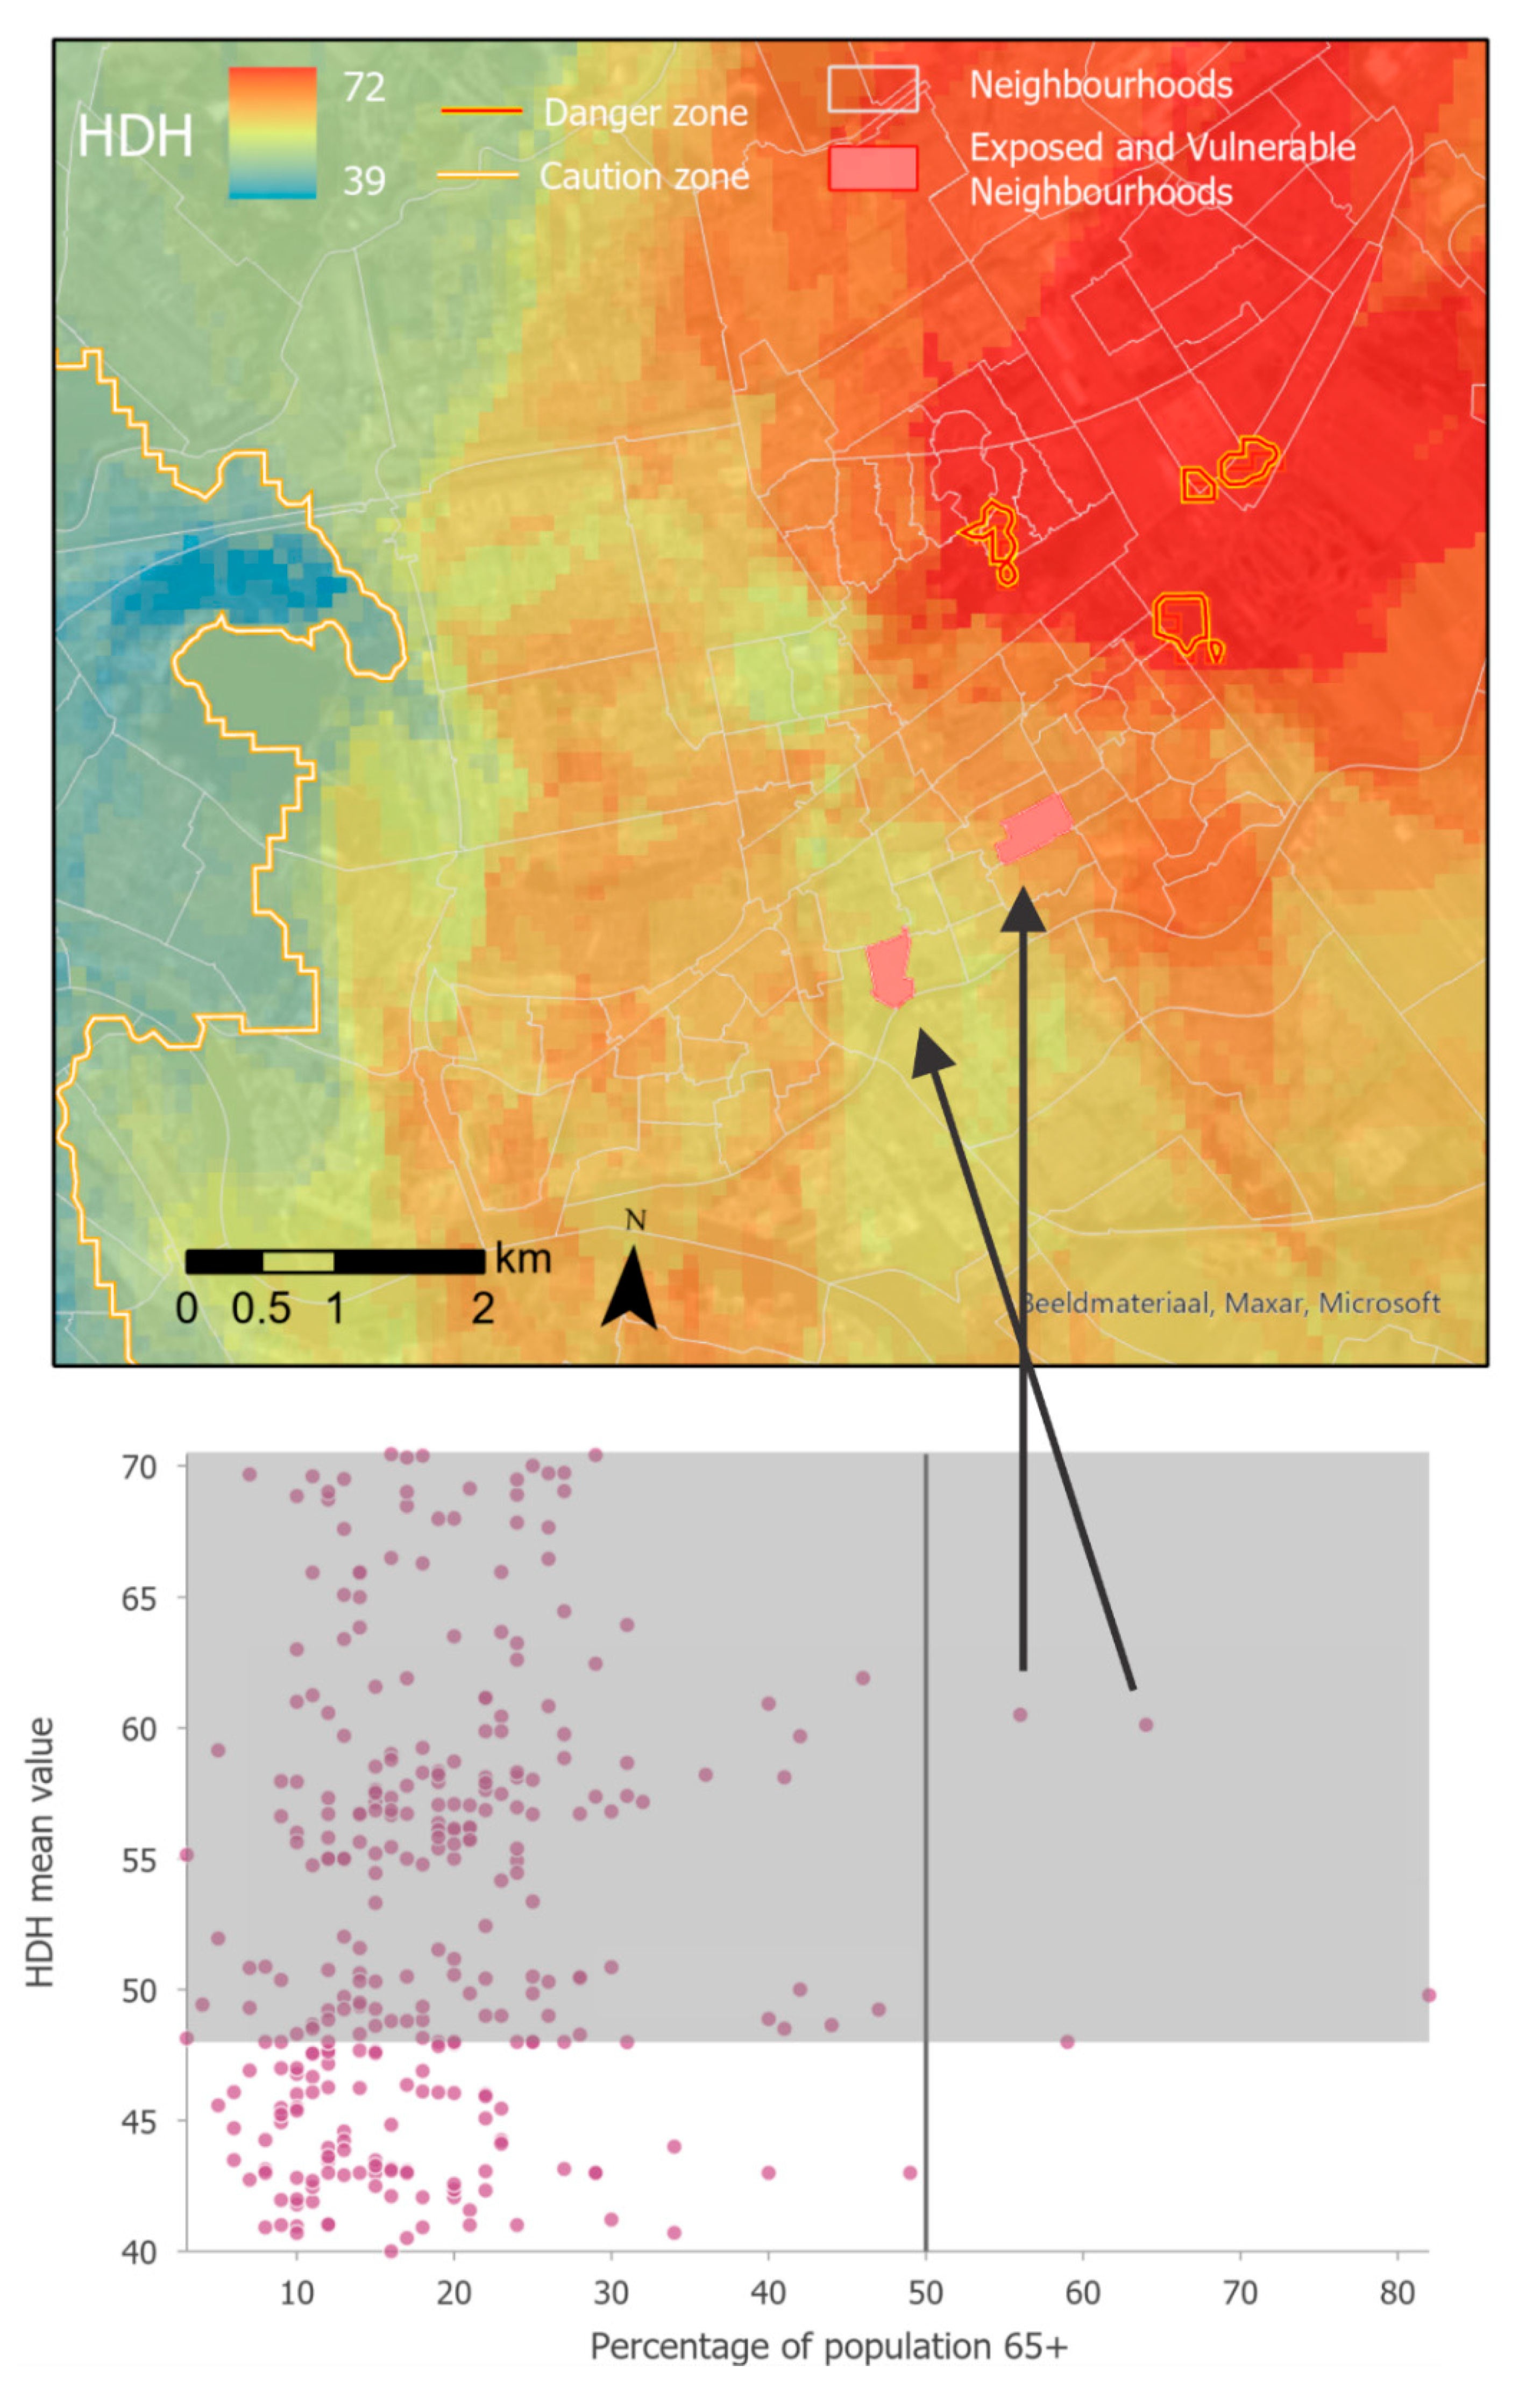
As shown in the map in Figure 5, the values in the humidex degree hours raster surface range from 39 to 72. Applying the same humidex degree hours thresholds used for Toronto [23], a large part of the Rotterdam sample area falls into the caution zone (values above 48), whereas some patches in the north-eastern part of Rotterdam fall into the danger zone (values above 72).
The diagram in Figure 6 shows a scatter diagram of percentages of the total population in the neighbourhood (first axis) and average values of HDH within the neighbourhoods (second axis). Each neighbourhood is represented by a dot. As seen from the diagram, there are numerous neighbourhoods that have values above the threshold value for HDH caution zone (marked with a grey shade), but these have mainly low percentages of the elderly population. Neighbourhoods to the right of the vertical black line have a majority (>50%) of its population in the age group 65+. There are two neighbourhoods that stand out with both high HDH and a high share of the 65+ population. The location of these is highlighted on the map.
4. Discussion
Gathering automatic temperature data from amateur weather stations to estimate the magnitude of urban heat islands in urban areas in The Netherlands has been done already, e.g., [15,28]. These studies conclude that automatic observations from weather amateurs can be of sufficient quality for atmospheric research. We have used recordings from Netatmo automated weather station to generate the humidex degree hours (HDH) metric for Rotterdam city. We do not perform atmospheric research but rather research on climate change adaptation and how to increase urban resilience to heat stress. Nevertheless, the quality of crowdsourced data needs to be assessed, as such data have not been collected under the same strict control schemes commonly required for scientific data collection. Common errors from Netatmo recordings include set up of outdoor modules inside or in a sunlit location, or other user-specific installation errors [11]. Because of these errors and the fact that Netatmo weather stations are mainly set up in built-up areas, the recordings typically come with a warm bias [10]. We quantified the warm bias between spatially interpolated Netatmo data and KNMI’s weather station at Rotterdam airport to be +1.5 °C, which is a similar quantity as found for London [10], but less than found for Amsterdam [29]. de Vos et al. [29] compared temperatures from official measurement stations with Netatmo personal weather stations. They found good agreements of the measurements to the reference, with 2–3 °C higher temperatures from Netatmo stations and believe this to be caused by the unknown setup of the Netatmo station, which is likely be exposed to direct sunlight or close to walls, making it sensitive to radiation errors. For the apparent temperatures used to calculate the HDH metric, we adjusted all Netatmo recorded air temperatures with a factor −1.5 °C before further data processing.
Central to strategic climate change adaptation is to know where the most exposed and vulnerable places are [30]. An increase in frequency, duration and intensity of heat waves have already been observed [31], and it is, therefore, necessary to know where the most heat-exposed areas within a city are, and whether these are temporally persistent. The humidex degree hours (HDH) metric provide such information, as it integrates apparent temperature intensity with duration into one spatial explicit value. Kershaw and Millward [23] developed the index to identify geographical areas in Toronto where citizens may experience adverse health effects of prolonged heat exposure. We have followed their approach for a six-day heat wave event in Rotterdam in summer 2019. For each hour of the day, we took the mean of the six corresponding rasters and found that among the 24 hourly rasters for a typical day during a heat wave, 12 of these were above the threshold of 30 degrees (from 9 in the morning to 20 in the evening). From these 12 rasters, we constructed an HDH raster as well as representations for “cautious” and “dangerous” areas using Kershaw and Millward’s suggested HDH thresholds (i.e., 48 and 72) (see Figure 5).
As shown in Figure 5, both the Erasmus bridge (HDH = 40) and the Euromast (HDH = 40) are in the parts with lower levels of HDH, which may not be surprising given their close location to the Nieuwe Maas river. It is more surprising that Rotterdam Central station also has a relative low value on the HDH index (HDH = 43). However, this may be due to the urban geometry of this part of Rotterdam being characterised by large open spaces that enhance air ventilation and high-rise buildings whose shadows reduce solar insolation [32]. Cautious areas are found in the northwest corner and in the eastern part of the study area. The land use categories in the northwest corner are “pastures” (northern part) and, for the most part, “discontinuous urban fabric” and “industrial or commercial units” (southern part). All the Netatmo sensors except one are set up in the southern built-up area. We know from previous research where land surface temperatures are recorded from satellite imagery that agricultural areas heat up less than urban built-up areas [33,34]. However, we do not find this, as more than 83% of the Netatmo weather stations in our Rotterdam sample are set up in the CORINE land use category, “discontinuous urban fabric” (the CORINE land use class “discontinuous urban fabric” is used “when urban structures and transport networks associated with vegetated areas and bare surfaces are present and occupy significant surfaces in a discontinuous spatial pattern. The impermeable features like buildings, roads and artificially surfaced areas range from 30 to 80 % land coverage” [34].) and only 1% in “pastures”. Consequently, the interpolated values for the eastern pasture areas are heavily influenced by the recording from the southern urban areas. [35]
Using bicycle traverse meteorological measurements, Heusinkveld et al. found that the part of the transect south of lake Kralingen had the lowest UHI [26]. We find that the place with the lowest HDH value is just north of lake Kralingen. Whereas Heusinkveld et al. found that the areas in Rotterdam with highest UHI values are in the Centre—Harbour area; we find that the areas with the highest HDH values are in the north-eastern part (where Heusinkveld et al. also found high values—but not the highest). We found only a few small areas towards the north-eastern corner of the study area that are in an area denoted as “dangerous”. These are characterized with densely built area (area A and B) but also the southern outskirts of a park (Park Hitland, area C). Although existing at a high spatial resolution, Netatmo stations are not uniformly spread among land use categories. Instead, they are dominantly found where people live or work, and temperature values for land use categories such as parks and forest are, therefore, probably estimated to be higher than they should be if there were recordings from weather stations located in these land use categories. This may explain why the area C in Figure 5 is within the area denoted as “dangerous”.
These “cautious” and “dangerous” zones could be used to identify the most heat-exposed areas within a city but become more valuable when linked to vulnerable areas, here defined as a high share of elderly population. The identification of neighbourhoods that are both among the most exposed and vulnerable in a city can be useful in making heat-resilient cities. For the Rotterdam case, these are the ones located in the upper, right corner of the scatter plot shown in Figure 6. As the scatter plot and the map are linked windows that visualize the same data, urban planners will know where these exposed and vulnerable neighbourhoods are and could design measures that may make these places more resilient towards heat exposure. Such planning could include both land use and urban material.
Urban materials such as concrete, stone, metal and asphalt are impermeable surfaces and, therefore, documented as the main cause of the urban heat island effect [36]. Built-up areas typically have materials with a lower albedo, which means they absorb a large part of the incoming sunlight. Heat is stored during daytime and, while rural areas cool off by night, urban areas lack similar relief. As a result, thermal human comfort, productivity and public health become worse compared to the surrounding countryside, especially during warm summer days [37].
Related to land use planning, urban heat exposure can be moderated by increasing the relative amount of land cover categories that have a cooling effect on air temperature and by optimizing their configuration [38]. An effective mitigation would be to introduce and increase blue-green infrastructures. The blue infrastructure includes lakes, water reservoirs, rivers, wetlands, swamps, water engineering facilities, rain gardens, etc., while the green infrastructure includes forests, arable fields, non-urbanized areas, grasslands, woodlands, lawns, parks, private gardens, sports facilities, green roofs, green walls and other facilities [39].
Water bodies can lower air temperature in their surroundings by up to 2 °C [40], and this cooling effect has been shown to be felt up to until 35 meters away with a reduced level of temperature of 1–2 °C [36,41]. From our sample, we also found that recordings near water were cooler, but the differences were smaller and non-significant. We calculated the distances from our sample of Netatmo weather stations (n = 193) to the nearest water bodies, using the water feature from Open Street Map. The mean temperature for the full sample was 22.99 °C; for the sample closer to water than 35 meters, it was 22.78 °C; for the sample more than 35 meters away from water, it was 23.04 °C.
The kind of land cover category that is present in the immediate vicinity of the water bodies is also important. It is recommended to reduce the share of impermeable surfaces and to increase the share of greenery in the surroundings of water bodies [42]. Vegetation has been confirmed as having an observed mitigation impact on ambient temperature, and increases in vegetated area translate to cooler surface and ambient temperatures at the local scale, although the strength of this relationship is constrained by factors such as the type of vegetation, leaf area index and the position of a tree in relation to a build structure [43]. Nevertheless, urban trees play a significant role in temperature mitigation by intercepting incoming solar radiation, directly shading surfaces and reducing ambient temperatures through evapotranspiration [43].
As The Netherlands and much of the rest of Europe will experience more heat stress in the future combined with an urbanization trend, future research directions are likely to include other means to increase urban resilience towards heat stress. As a response to increased urban resilience, Amsterdam city has developed a web tool that guides the inhabitants and visitors on where the less heat-exposed places are (see, for instance, https://maps.amsterdam.nl/koeleplekken/). Local newspapers may have articles on “cool ways to beat the heat wave” (https://www.sentinelandenterprise.com/2019/07/18/five-cool-ways-to-beat-the-heat-wave/), where they have advices on where their readers could go during a heat wave. Tourists, new immigrants and others may, however, not know where to go to cool down. Inhabitants and visitors of Paris can use the app Extrema Paris to find about 800 places where they could escape the heat (https://www.apc-paris.com/actualite/extrema-paris-decouvrez-lapplication-qui-localise-lieux-fraicheur-a-paris). A similar but generic approach is also done by Opach et al. [44] who aim to develop a route planner supporting pedestrian navigation in hazard-exposed urban areas, including heat-exposed areas.
5. Conclusions
In this study, we have assessed and investigated the use of Netatmo recordings of temperatures during the heat wave taking place from 22 July to 27 July 2019, using Rotterdam city area as a case. We have extracted values from 144 temperature surfaces generated from Netatmo recordings using spatial interpolation (ordinary Kriging). The values are extracted from the location where there is an official meteorological station. The official temperature for each of the 144 h are then compared with the 144 estimated values, and the two curves show a generally good fit and a high correlation but with a warm bias. We have further replicated the calculation of the humidex degree hours (HDH) metric. As an approach to identify the most heat-prone neighbourhoods, we do consider the use of Netatmo recordings and the calculation of HDH metrics as a useful approach to identify hazard-exposed neighbourhoods having the highest percentage of vulnerable population groups. This could be useful information for those who plan adaptation measures to make the urban population more resilient to heat waves. Examples of adaptation measures could be the use of green roofs and the use of lighter-coloured surfaces in urban areas, which reflect more sunlight and absorb less heat. Heat-exposed urban areas with high proportion of vulnerable people (such as elderly) should be prioritized, and our study has demonstrated how a screening can be done that identify neighbourhoods for where such adaptation measures would be most needed.
Author Contributions
Conceptualization, J.K.R. and M.J.M.; methodology, J.K.R.; software, J.K.R.; validation, J.K.R.; formal analysis, J.K.R.; investigation, J.K.R.; resources, J.K.R. and M.J.M.; data curation, J.K.R.; Writing—Original draft preparation, J.K.R.; Writing—Review and editing, J.K.R. and M.J.M.; visualization, J.K.R.; supervision, J.K.R.; project administration, J.K.R.; funding acquisition, J.K.R. and M.J.M. All authors have read and agreed to the published version of the manuscript.
Funding
This research is part of the project ‘Citizen Sensing–Urban Climate Resilience through Participatory Risk Management Systems’. Citizen Sensing is part of ERA4CS, an ERA-NET initiated by JPI Climate, and funded by FORMAS (Sweden), FCT (Portugal), RCN (Norway, Grant 274192), NWO (The Netherlands, Grant 438.17.805) with co-funding by the European Union (Grant 690462).
Institutional Review Board Statement
Not applicable.
Informed Consent Statement
Not applicable.
Data Availability Statement
The processing was done using ArcGIS version 10.8. Input data, resulting dataset as well as python scripts documenting the work progress are available from the Norwegian centre for research data (available from here: doi:10.18712/NSD-NSD2929-V1).
Acknowledgments
The authors are thankful for those citizens in Rotterdam sharing the recordings to their Netatmo weather station, the assistance from Tomasz Opach for downloading Netatmo recordings and Gerben Koers for making demographic data by neighbourhoods available for Rotterdam. We are also grateful for usual feedback on an earlier version of this article from our colleagues in the CitisenSensing project. Finally, we are grateful for the comments and suggestions provided by the three reviewers.
Conflicts of Interest
The authors declare no conflict of interest.
References
- Sheth, A. Citizen Sensing, Social Signals, and Enriching Human Experience. IEEE Internet Comput. 2009, 13, 87–92. [Google Scholar] [CrossRef] [Green Version]
- Brunsdon, C.; Comber, L. Using crowd-sourced information to analyse changes in the onset of the North American Spring. In Geocomputation. A Practical Primer; Brunsdon, C., Singleton, A., Eds.; Sage: London, UK, 2015; pp. 267–280. [Google Scholar]
- Crooks, A.; Croitoru, A.; Stefanidis, A.; Radzikowski, J. #Earthquake: Twitter as a Distributed Sensor System. Trans. GIS 2013, 17, 124–147. [Google Scholar]
- Goodchild, M.F.; Glennon, J.A. Crowdsourcing geographic information for disaster response: A research frontier. Int. J. Digit. Earth 2010, 3, 231–241. [Google Scholar] [CrossRef]
- Goodchild, M.F. Citizens as Voluntary Sensors: Spatial Data Infrastructure in the World of Web 2.0. Int. J. Spat. Data Infrastruct. Res. 2007, 2, 24–32. [Google Scholar]
- Eden, P. Traditional weather observing in the UK: An historical overview. Weather 2009, 64, 239–245. [Google Scholar] [CrossRef]
- Bell, S.; Cornford, D.; Bastin, L. The state of automated amateur weather observations. Weather 2013, 68, 36–41. [Google Scholar] [CrossRef]
- Foody, G.M.; See, L.; Fritz, S.; Van der Velde, M.; Perger, C.; Schill, C.; Boyd, D.S. Assessing the Accuracy of Volunteered Geographic Information arising from Multiple Contributors to an Internet Based Collaborative Project. Trans. GIS 2013, 17, 847–860. [Google Scholar] [CrossRef] [Green Version]
- Muller, C.L.; Chapman, L.; Johnston, S.; Kidd, C.; Illingworth, S.; Foody, G.; Overeem, A.; Leigh, R.R. Crowdsourcing for climate and atmospheric sciences: Current status and future potential. Int. J. Climatol. 2015, 35, 3185–3203. [Google Scholar] [CrossRef] [Green Version]
- Chapman, L.; Bell, C.; Bell, S. Can the crowdsourcing data paradigm take atmospheric science to a new level? A case study of the urban heat island of London quantified using Netatmo weather stations. Int. J. Climatol. 2017, 37, 3597–3605. [Google Scholar] [CrossRef]
- Meier, F.; Fenner, D.; Grassmann, T.; Otto, M.; Scherer, D. Crowdsourcing air temperature from citizen weather stations for urban climate research. Urban. Climate 2017, 19, 170–191. [Google Scholar] [CrossRef]
- Tomlinson, C.J.; Chapman, L.; Thornes, J.E.; Baker, C.J. Including the urban heat island in spatial heat health risk assessment strategies: A case study for Birmingham, UK. Int. J. Health Geogr. 2011, 10, 42. [Google Scholar] [CrossRef] [PubMed] [Green Version]
- Meehl, G.A.; Tebaldi, C. More Intense, More Frequent, and Longer Lasting Heat Waves in the 21st Century. Science 2004, 305, 994–997. [Google Scholar] [CrossRef] [PubMed] [Green Version]
- Klok, L.; Zwart, S.; Verhagen, H.; Mauri, E. The surface heat island of Rotterdam and its relationship with urban surface characteristics. Resour. Conserv. Recycl. 2012, 64, 23–29. [Google Scholar] [CrossRef]
- Steeneveld, G.J.; Koopmans, S.; Heusinkveld, B.G.; van Hove, L.W.A.; Holtslag, A.A.M. Quantifying urban heat island effects and human comfort for cities of variable size and urban morphology in the Netherlands. J. Geophys. Res. Atmos. 2011, 116. [Google Scholar] [CrossRef]
- Harlan, S.L.; Ruddell, D.M. Climate change and health in cities: Impacts of heat and air pollution and potential co-benefits from mitigation and adaptation. Curr. Opin. Environ. Sustain. 2011, 3, 126–134. [Google Scholar] [CrossRef]
- Dousset, B.; Gourmelon, F.; Laaidi, K.; Zeghnoun, A.; Giraudet, E.; Bretin, P.; Mauri, E.; Vandentorren, S. Satellite monitoring of summer heat waves in the Paris metropolitan area. Int. J. Climatol. 2011, 31, 313–323. [Google Scholar] [CrossRef]
- IPCC. Glossary of terms. In Managing the Risks of Extreme Events and Disasters to Advance Climate Change Adaptation; Field, C.B., Barros, V., Stocker, T.F., Qin, D., Dokken, Ø., Ebi, K.L., Mastrandrea, M.D., Mach, K.J., Plattner, G.-K., Allen, S.K., et al., Eds.; Cambridge University Press: Cambridge, UK, 2012. [Google Scholar]
- Baldwin, J.W.; Dessy, J.B.; Vecchi, G.A.; Oppenheimer, M. Temporally Compound Heat Wave Events and Global Warming: An Emerging Hazard. Earth’s Future 2019, 7, 411–427. [Google Scholar] [CrossRef] [Green Version]
- Reid, C.E.; O’Neill, M.S.; Gronlund, C.J.; Brines, S.J.; Brown, D.G.; Diez-Roux, A.V.; Schwartz, J. Mapping Community Determinants of Heat Vulnerability. Environ. Health Perspect. 2009, 117, 1730–1736. [Google Scholar] [CrossRef]
- Oudin Åström, D.; Bertil, F.; Joacim, R. Heat wave impact on morbidity and mortality in the elderly population: A review of recent studies. Maturitas 2011, 69, 99–105. [Google Scholar] [CrossRef]
- Ho, H.C.; Knudby, A.; Xu, Y.; Hodul, M.; Aminipouri, M. A comparison of urban heat islands mapped using skin temperature, air temperature, and apparent temperature (Humidex), for the greater Vancouver area. Sci. Total Environ. 2016, 544, 929–938. [Google Scholar] [CrossRef]
- Kershaw, S.E.; Millward, A.A. A spatio-temporal index for heat vulnerability assessment. Environ. Monit. Assess. 2012, 184, 7329–7342. [Google Scholar] [CrossRef] [PubMed]
- Buck, A.L. New Equations for Computing Vapor Pressure and Enhancement Factor. J. Appl. Meteorol. 1981, 20, 1527–1532. [Google Scholar] [CrossRef] [Green Version]
- Masterton, J.M.; Richardson, F.A. Humidex: A Method of Quantifying Human Discomfort Due to Excessive Heat and Humidity; Environment Canada: Downsview, ON, Canada, 1979.
- Heusinkveld, B.G.; Steeneveld, G.J.; van Hove, L.W.A.; Jacobs, C.M.J.; Holtslag, A.A.M. Spatial variability of the Rotterdam urban heat island as influenced by urban land use. J. Geophys. Res. Atmos. 2014, 119, 677–692. [Google Scholar] [CrossRef]
- Tobías, A.; de Olalla, P.G.; Linares, C.; Bleda, M.J.; Caylà, J.A.; Díaz, J. Short-term effects of extreme hot summer temperatures on total daily mortality in Barcelona, Spain. Int. J. Biometeorol. 2010, 54, 115–117. [Google Scholar] [CrossRef] [PubMed]
- Wolters, D.; Brandsma, T. Estimating the Urban Heat Island in Residential Areas in the Netherlands Using Observations by Weather Amateurs. J. Appl. Meteorol. Climatol. 2012, 51, 711–721. [Google Scholar] [CrossRef]
- De Vos, L.W.; Droste, A.M.; Zander, M.J.; Overeem, A.; Leijnse, H.; Heusinkveld, B.G.; Steeneveld, G.J.; Uijlenhoet, R. Hydrometeorological Monitoring Using Opportunistic Sensing Networks in the Amsterdam Metropolitan Area. Bull. Am. Meteorol. Soc. 2020, 101, E167–E185. [Google Scholar] [CrossRef]
- Rød, J.K.; Opach, T.; Neset, T.-S. Three core activities toward a relevant integrated vulnerability assessment: Validate, visualize, and negotiate. J. Risk Res. 2015, 18, 877–895. [Google Scholar] [CrossRef] [Green Version]
- Perkins, S.E.; Alexander, L.V.; Nairn, J.R. Increasing frequency, intensity and duration of observed global heatwaves and warm spells. Geophys. Res. Lett. 2012, 39. [Google Scholar] [CrossRef]
- Chun, B.; Guhathakurta, S. Daytime and nighttime urban heat islands statistical models for Atlanta. Environ. Plan. B: Urban. Anal. City Sci. 2015, 44, 308–327. [Google Scholar] [CrossRef]
- Stathopoulou, M.; Cartalis, C.; Keramitsoglou, I. Mapping micro-urban heat islands using NOAA/AVHRR images and CORINE Land Cover: An application to coastal cities of Greece. Int. J. Remote Sens. 2004, 25, 2301–2316. [Google Scholar] [CrossRef]
- Singh, P.; Kikon, N.; Verma, P. Impact of land use change and urbanization on urban heat island in Lucknow city, Central India. A remote sensing based estimate. Sustain. Cities Soc. 2017, 32, 100–114. [Google Scholar] [CrossRef]
- Kosztra, B.; Büttner, G.; Hazeu, G.; Arnold, S. Updated CLC Illustrated Nomenclature Guidelines; European Environment Agency: Vienna, Austria, 2019.
- Deilami, K.; Kamruzzaman, M.; Liu, Y. Urban heat island effect: A systematic review of spatio-temporal factors, data, methods, and mitigation measures. Int. J. Appl. Earth Obs. Geoinf. 2018, 67, 30–42. [Google Scholar] [CrossRef]
- Attema, J.J.; Heusinkveld, B.G.; Ronda, R.J.; Steeneveld, G.J.; Holtslag, A.A.M. Summer in the City: Forecasting and Mapping Human Thermal Comfort in Urban Areas. In Proceedings of the 2015 IEEE 11th International Conference on e-Science, Munich, Germany, 31 August–4 September 2015; pp. 243–248. [Google Scholar] [CrossRef]
- Jaganmohan, M.; Knapp, S.; Buchmann, C.M.; Schwarz, N. The Bigger, the Better? The Influence of Urban Green Space Design on Cooling Effects for Residential Areas. J. Environ. Qual. 2016, 45, 134–145. [Google Scholar] [CrossRef] [PubMed]
- Antoszewski, P.; Świerk, D.; Krzyżaniak, M. Statistical Review of Quality Parameters of Blue-Green Infrastructure Elements Important in Mitigating the Effect of the Urban Heat Island in the Temperate Climate (C) Zone. Int. J. Environ. Res. Public Health 2020, 17, 7093. [Google Scholar] [CrossRef] [PubMed]
- Tominaga, Y.; Sato, Y.; Sadohara, S. CFD simulations of the effect of evaporative cooling from water bodies in a micro-scale urban environment: Validation and application studies. Sustain. Cities Soc. 2015, 19, 259–270. [Google Scholar] [CrossRef]
- Manteghi, G.; Bin Limit, H.; Remaz, D. Water bodies an urban microclimate: A review. Mod. Appl. Sci. 2015, 9, 1–12. [Google Scholar] [CrossRef] [Green Version]
- Hathway, E.A.; Sharples, S. The interaction of rivers and urban form in mitigating the Urban Heat Island effect: A UK case study. Build. Environ. 2012, 58, 14–22. [Google Scholar] [CrossRef] [Green Version]
- Greene, C.S.; Kedron, P.J. Beyond fractional coverage: A multilevel approach to analyzing the impact of urban tree canopy structure on surface urban heat islands. Appl. Geogr. 2018, 95, 45–53. [Google Scholar] [CrossRef]
- Opach, T.; Navarra, C.; Rød, J.K.; Neset, T.-S. Towards a Route Planner Supporting Pedestrian Navigation in Hazard Exposed Urban Areas. In Proceedings of the 17th International Conference on Information Systems for Crisis Response and Management, ISCRAM 2020, Blacksburg, VA, USA, 24–27 May 2020; Virginia Tech: Blacksburg, VA, USA, 2020; pp. 517–528. [Google Scholar]
Figure 1.
Heatwaves in The Netherlands since 1901. (a) Number of heat waves in The Netherlands per decade, (b) the number of days during heat waves as well as the number of tropical days (source: https://www.knmi.nl/nederland-nu/klimatologie/lijsten/hittegolven).
Figure 1.
Heatwaves in The Netherlands since 1901. (a) Number of heat waves in The Netherlands per decade, (b) the number of days during heat waves as well as the number of tropical days (source: https://www.knmi.nl/nederland-nu/klimatologie/lijsten/hittegolven).

Figure 2.
The study area is the urban part of Rotterdam. (a) The Netherlands and the location of the study area. (b) Study area (Rotterdam city), The Royal Netherlands Meteorological Institute (KNMI) weather station and 193 Netatmo sensors.
Figure 2.
The study area is the urban part of Rotterdam. (a) The Netherlands and the location of the study area. (b) Study area (Rotterdam city), The Royal Netherlands Meteorological Institute (KNMI) weather station and 193 Netatmo sensors.

Figure 3.
Workflow for production of composite raster surface representing humidex degree hours (HDH).
Figure 3.
Workflow for production of composite raster surface representing humidex degree hours (HDH).

Figure 4.
Comparing official KNMI recordings with interpolated temperature values from surfaces generated from Netatmo recordings.
Figure 4.
Comparing official KNMI recordings with interpolated temperature values from surfaces generated from Netatmo recordings.

Figure 5.
Humidex degree hour (HDH) map. HDH for a “typical” extreme heat alert day. A large part of the Rotterdam study area has HDH values higher than 48 (the caution area), and some small patches in the northeast corner have HDH values higher than 72 (the danger area). An HDH value of 72 corresponds to 12 consecutive hours, or half of the day, with an apparent temperature value of 35 °C.

Figure 6.
Two neighbourhoods with both high humidex degree hours (HDH) values and a high share of vulnerable population.
Figure 6.
Two neighbourhoods with both high humidex degree hours (HDH) values and a high share of vulnerable population.


Table 1.
The effect of root-mean-square deviation (RMSD) while comparing observed and estimated dew-point temperatures without adjustment and with five levels of adjustments.
Table 1.
The effect of root-mean-square deviation (RMSD) while comparing observed and estimated dew-point temperatures without adjustment and with five levels of adjustments.
| No Calibration | −0.5 | −1.0 | −1.5 | −2.0 | −2.5 | |
|---|---|---|---|---|---|---|
| RMSD | 1.76 | 1.41 | 1.15 | 1.05 | 1.16 | 1.43 |
Publisher’s Note: MDPI stays neutral with regard to jurisdictional claims in published maps and institutional affiliations. |
© 2021 by the authors. Licensee MDPI, Basel, Switzerland. This article is an open access article distributed under the terms and conditions of the Creative Commons Attribution (CC BY) license (http://creativecommons.org/licenses/by/4.0/).
Share and Cite
MDPI and ACS Style
Rød, J.K.; Maarse, M.J. Using Citizen Sensing to Identify Heat-Exposed Neighbourhoods. Urban Sci. 2021, 5, 14. https://0-doi-org.brum.beds.ac.uk/10.3390/urbansci5010014
AMA Style
Rød JK, Maarse MJ. Using Citizen Sensing to Identify Heat-Exposed Neighbourhoods. Urban Science. 2021; 5(1):14. https://0-doi-org.brum.beds.ac.uk/10.3390/urbansci5010014
Chicago/Turabian StyleRød, Jan Ketil, and Maaike J. Maarse. 2021. "Using Citizen Sensing to Identify Heat-Exposed Neighbourhoods" Urban Science 5, no. 1: 14. https://0-doi-org.brum.beds.ac.uk/10.3390/urbansci5010014