Urban Form Resilience: A Comparative Analysis of Traditional, Semi-Planned, and Planned Neighborhoods in Shiraz, Iran


Abstract
:1. Introduction
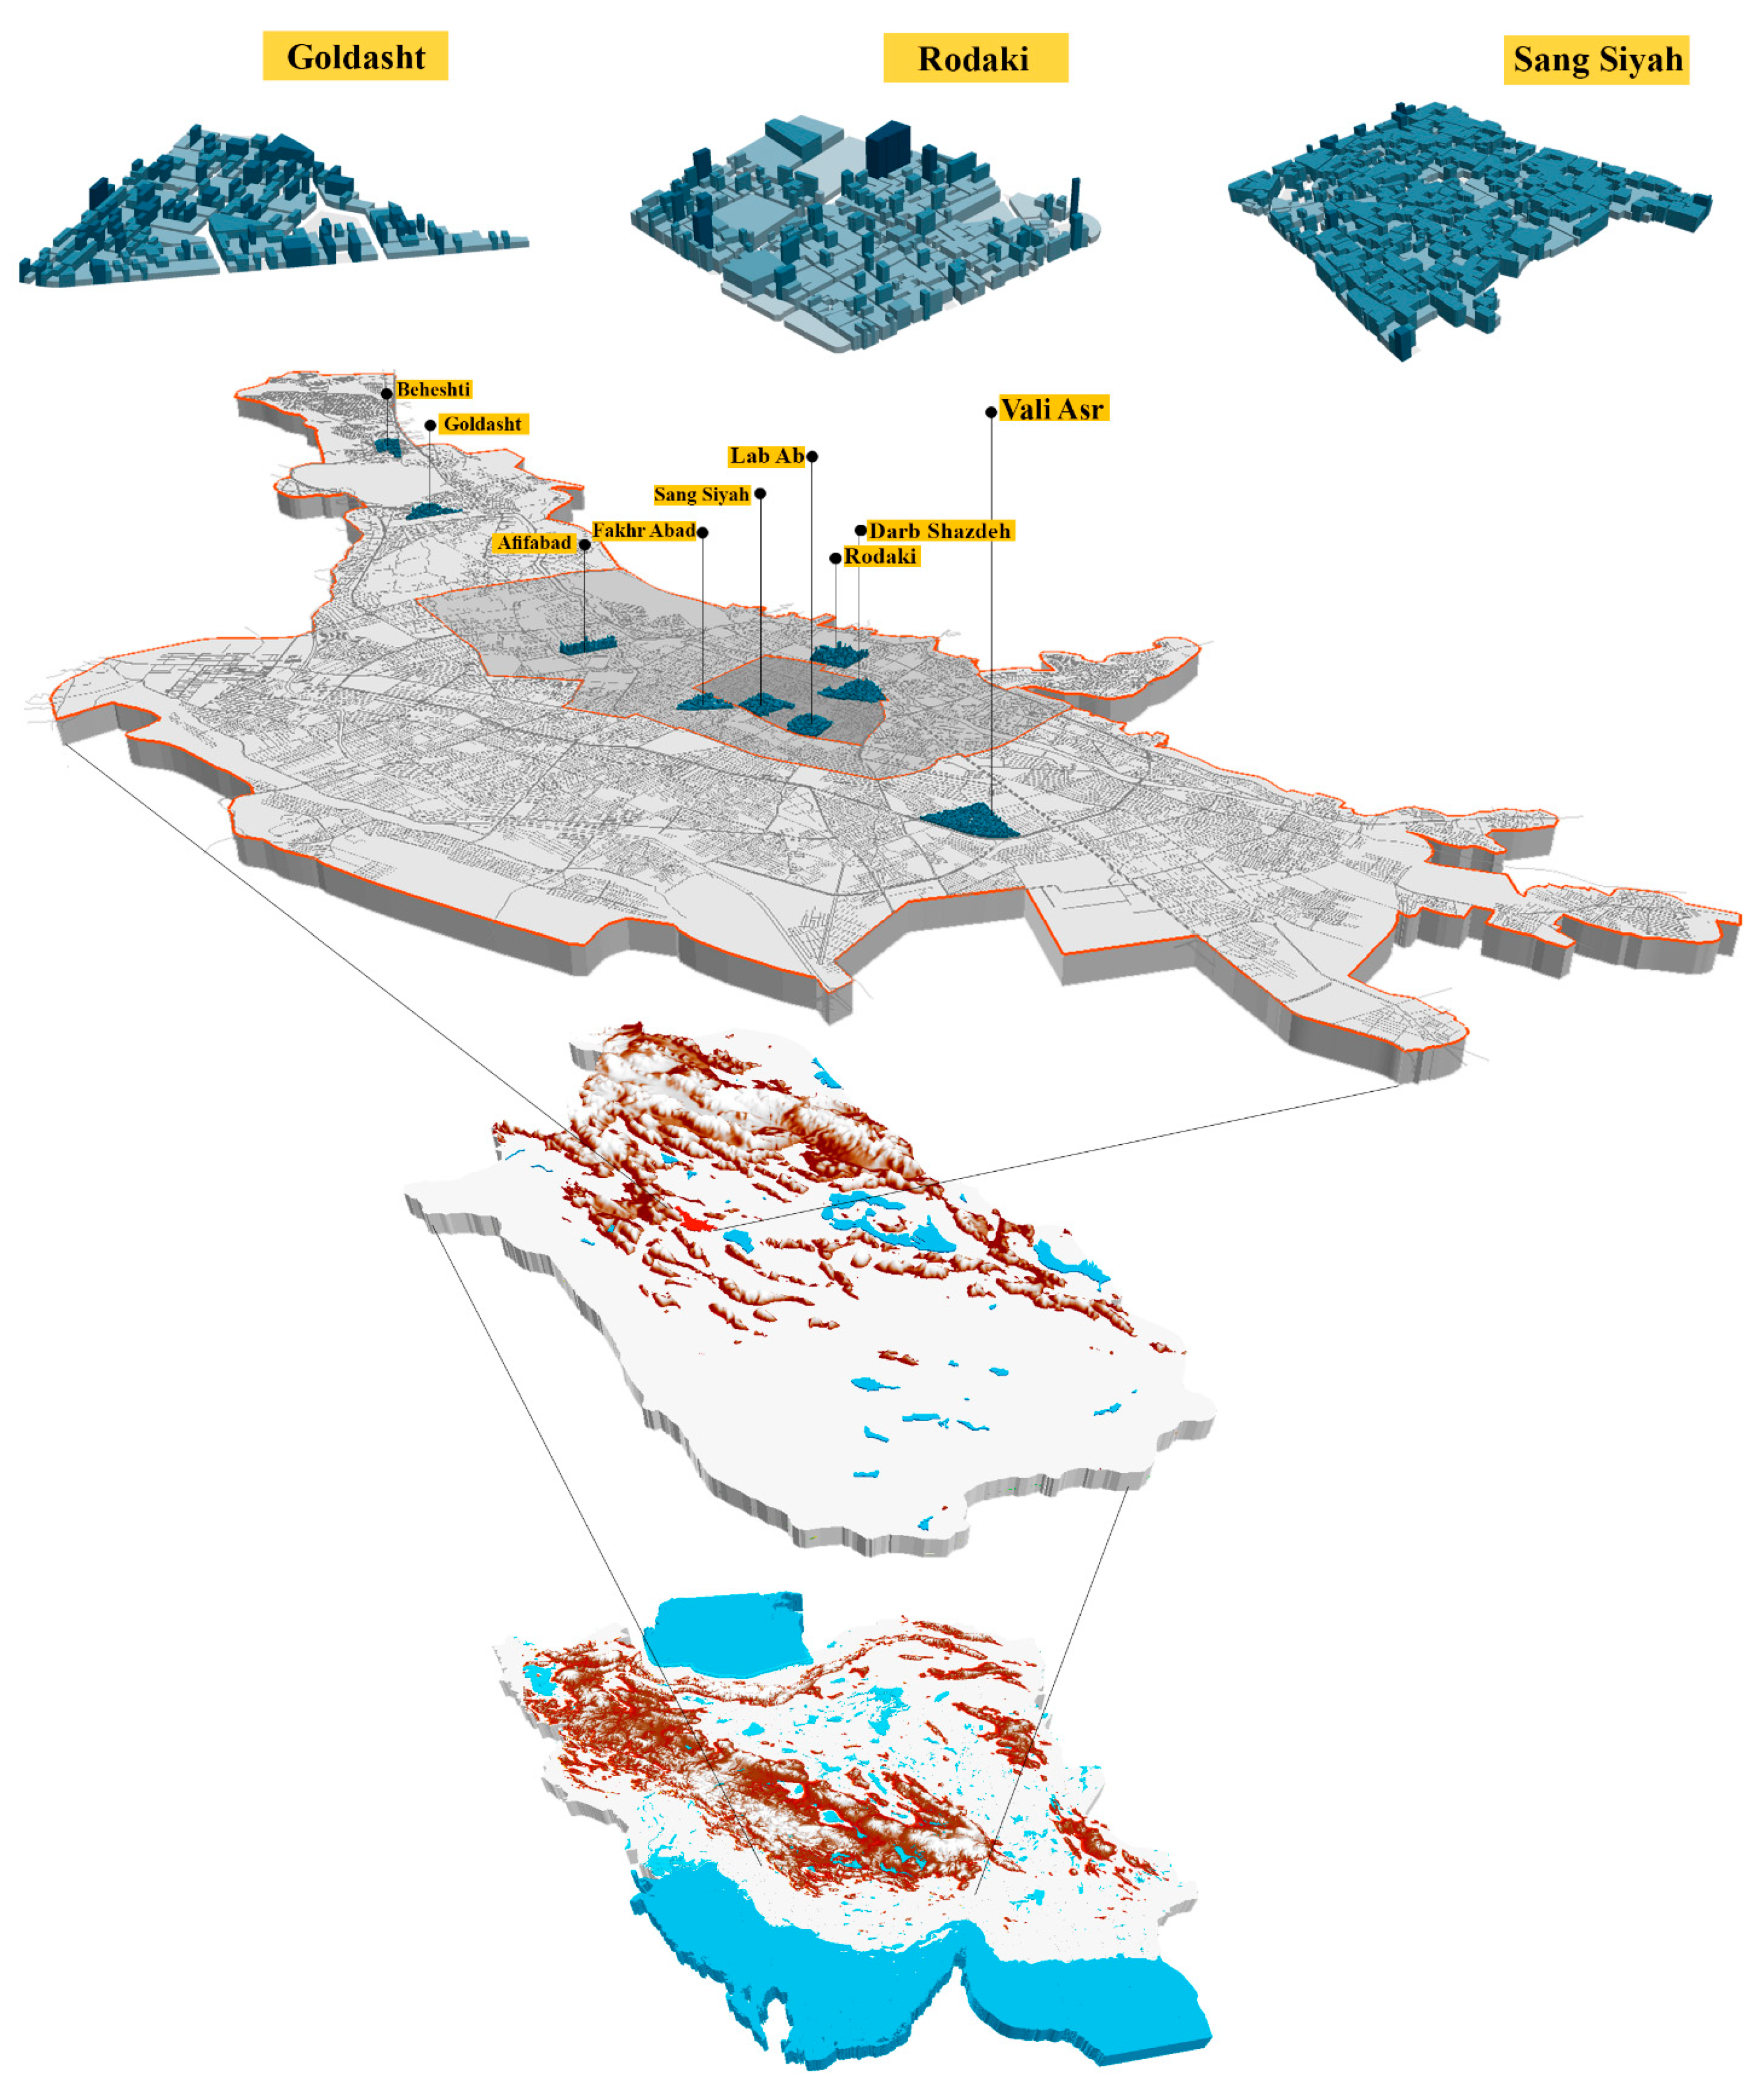
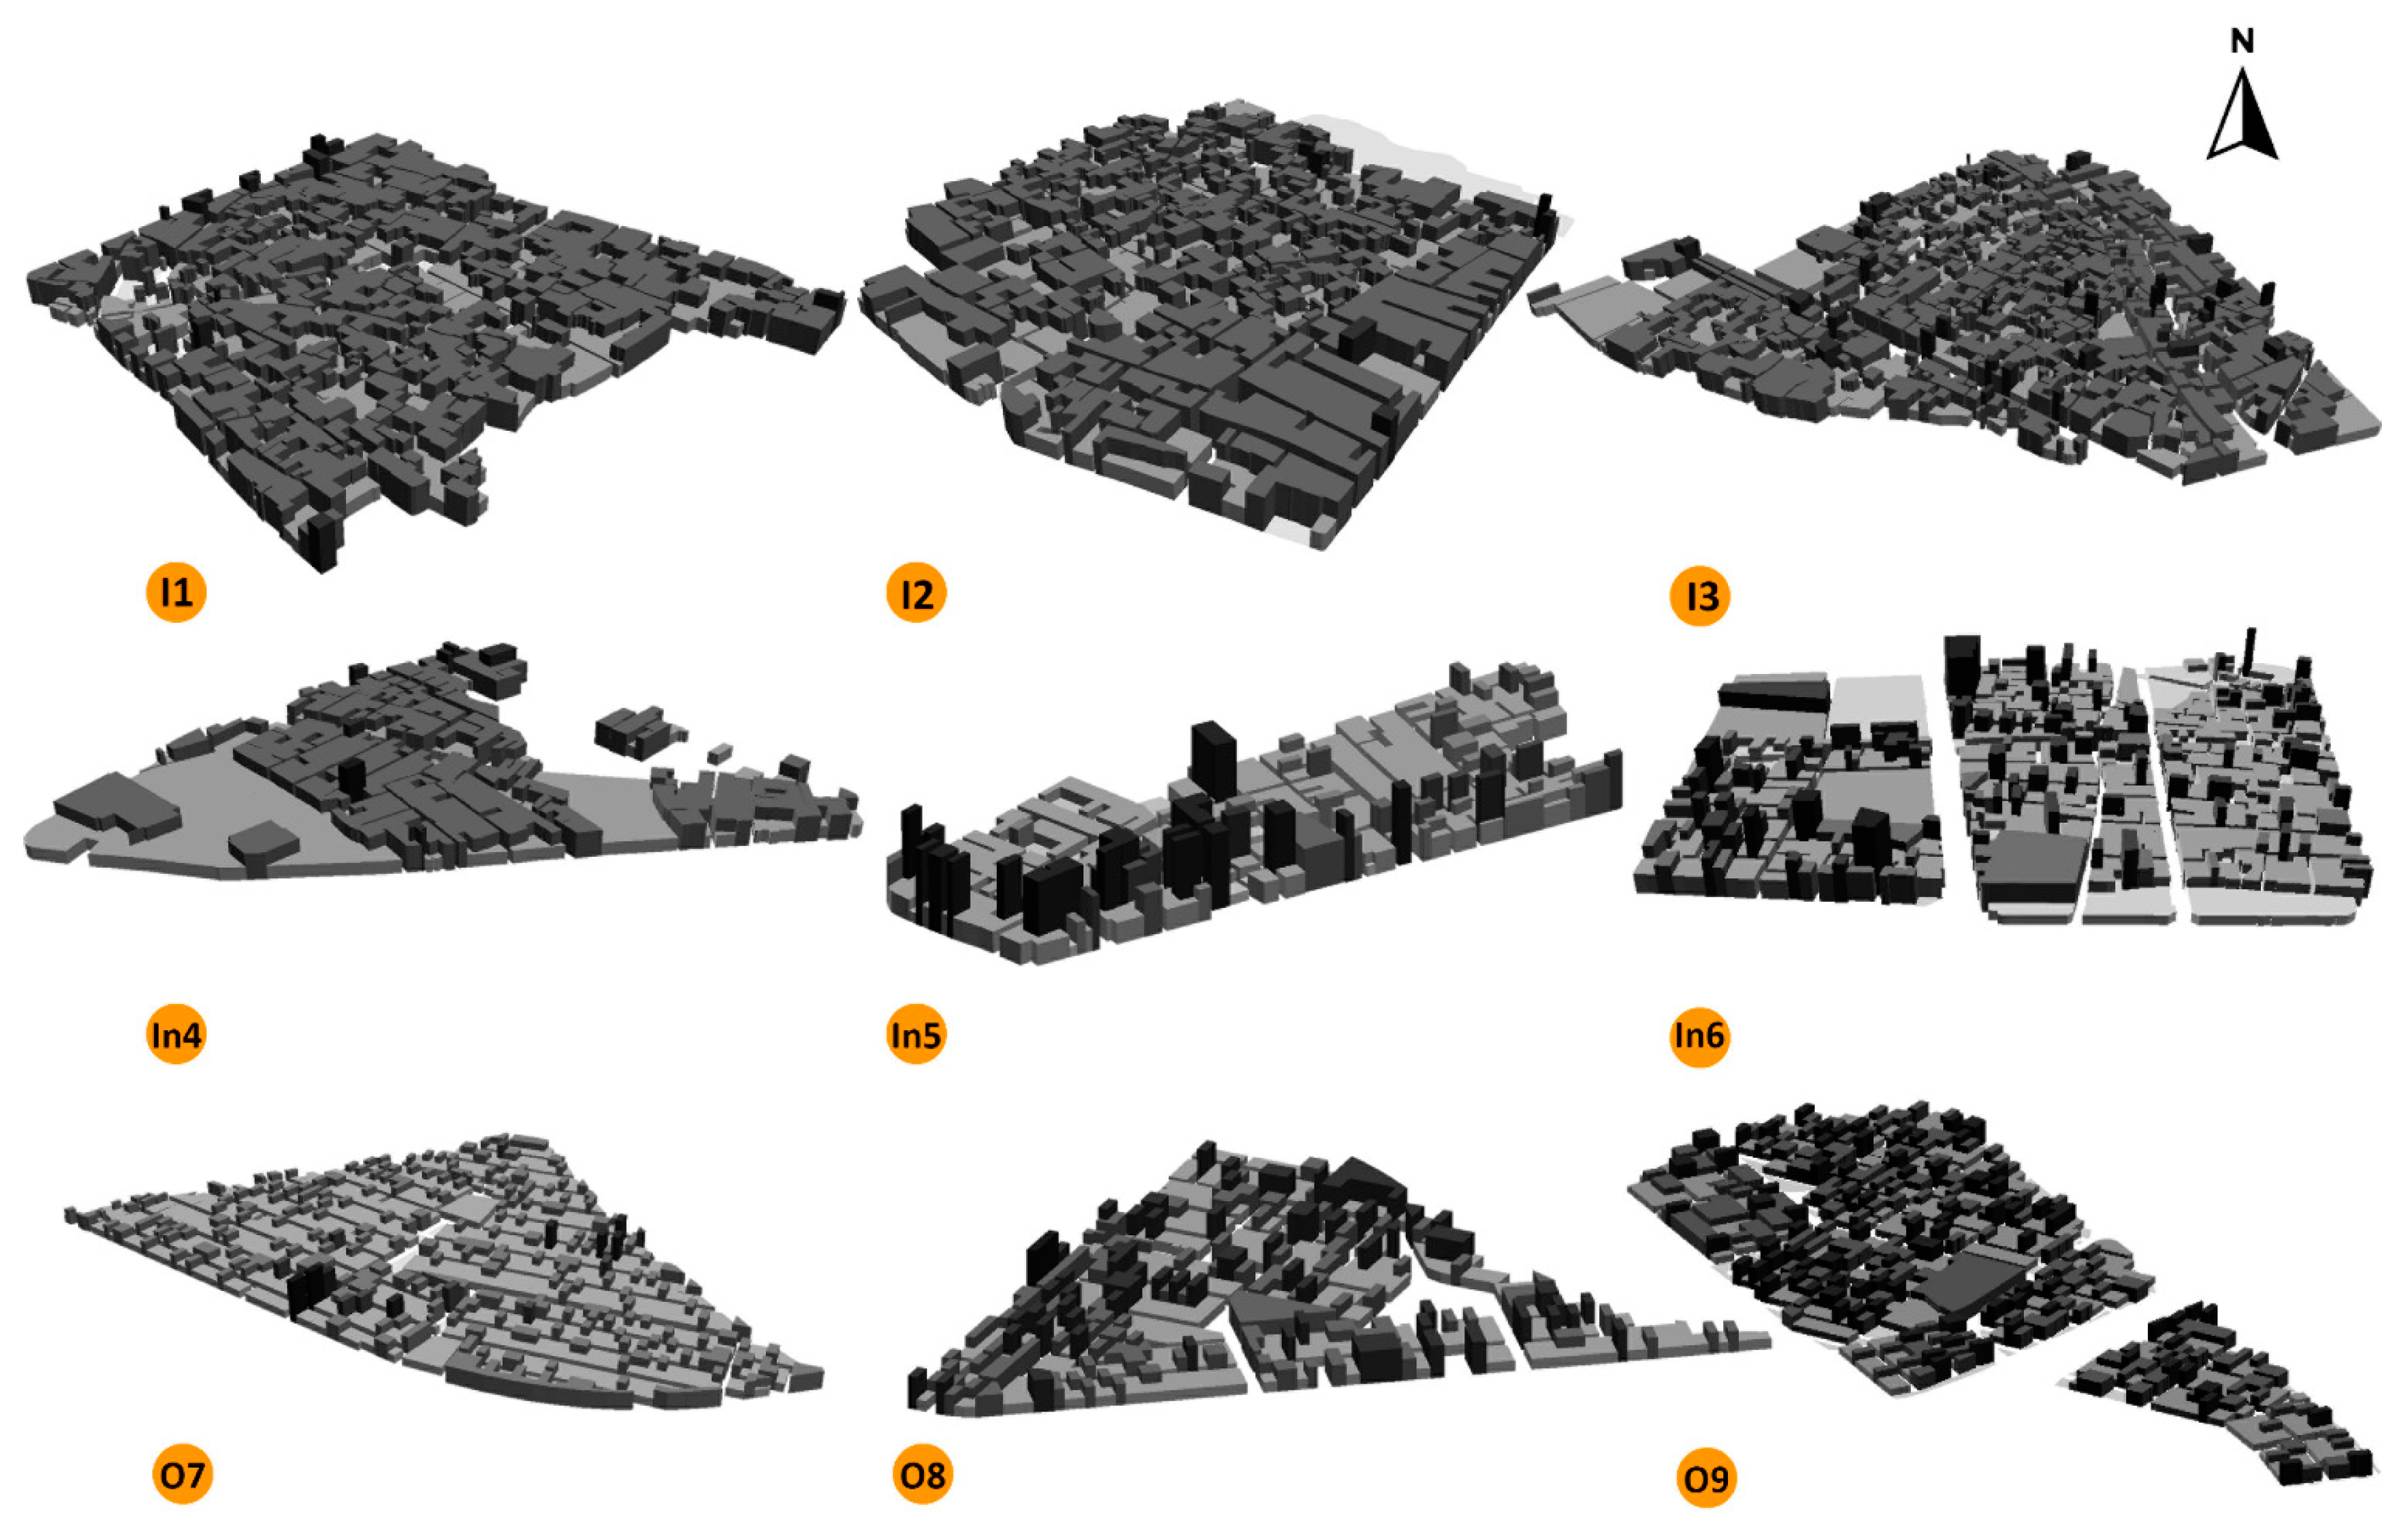
2. The Case Study Area and Selected Neighborhoods
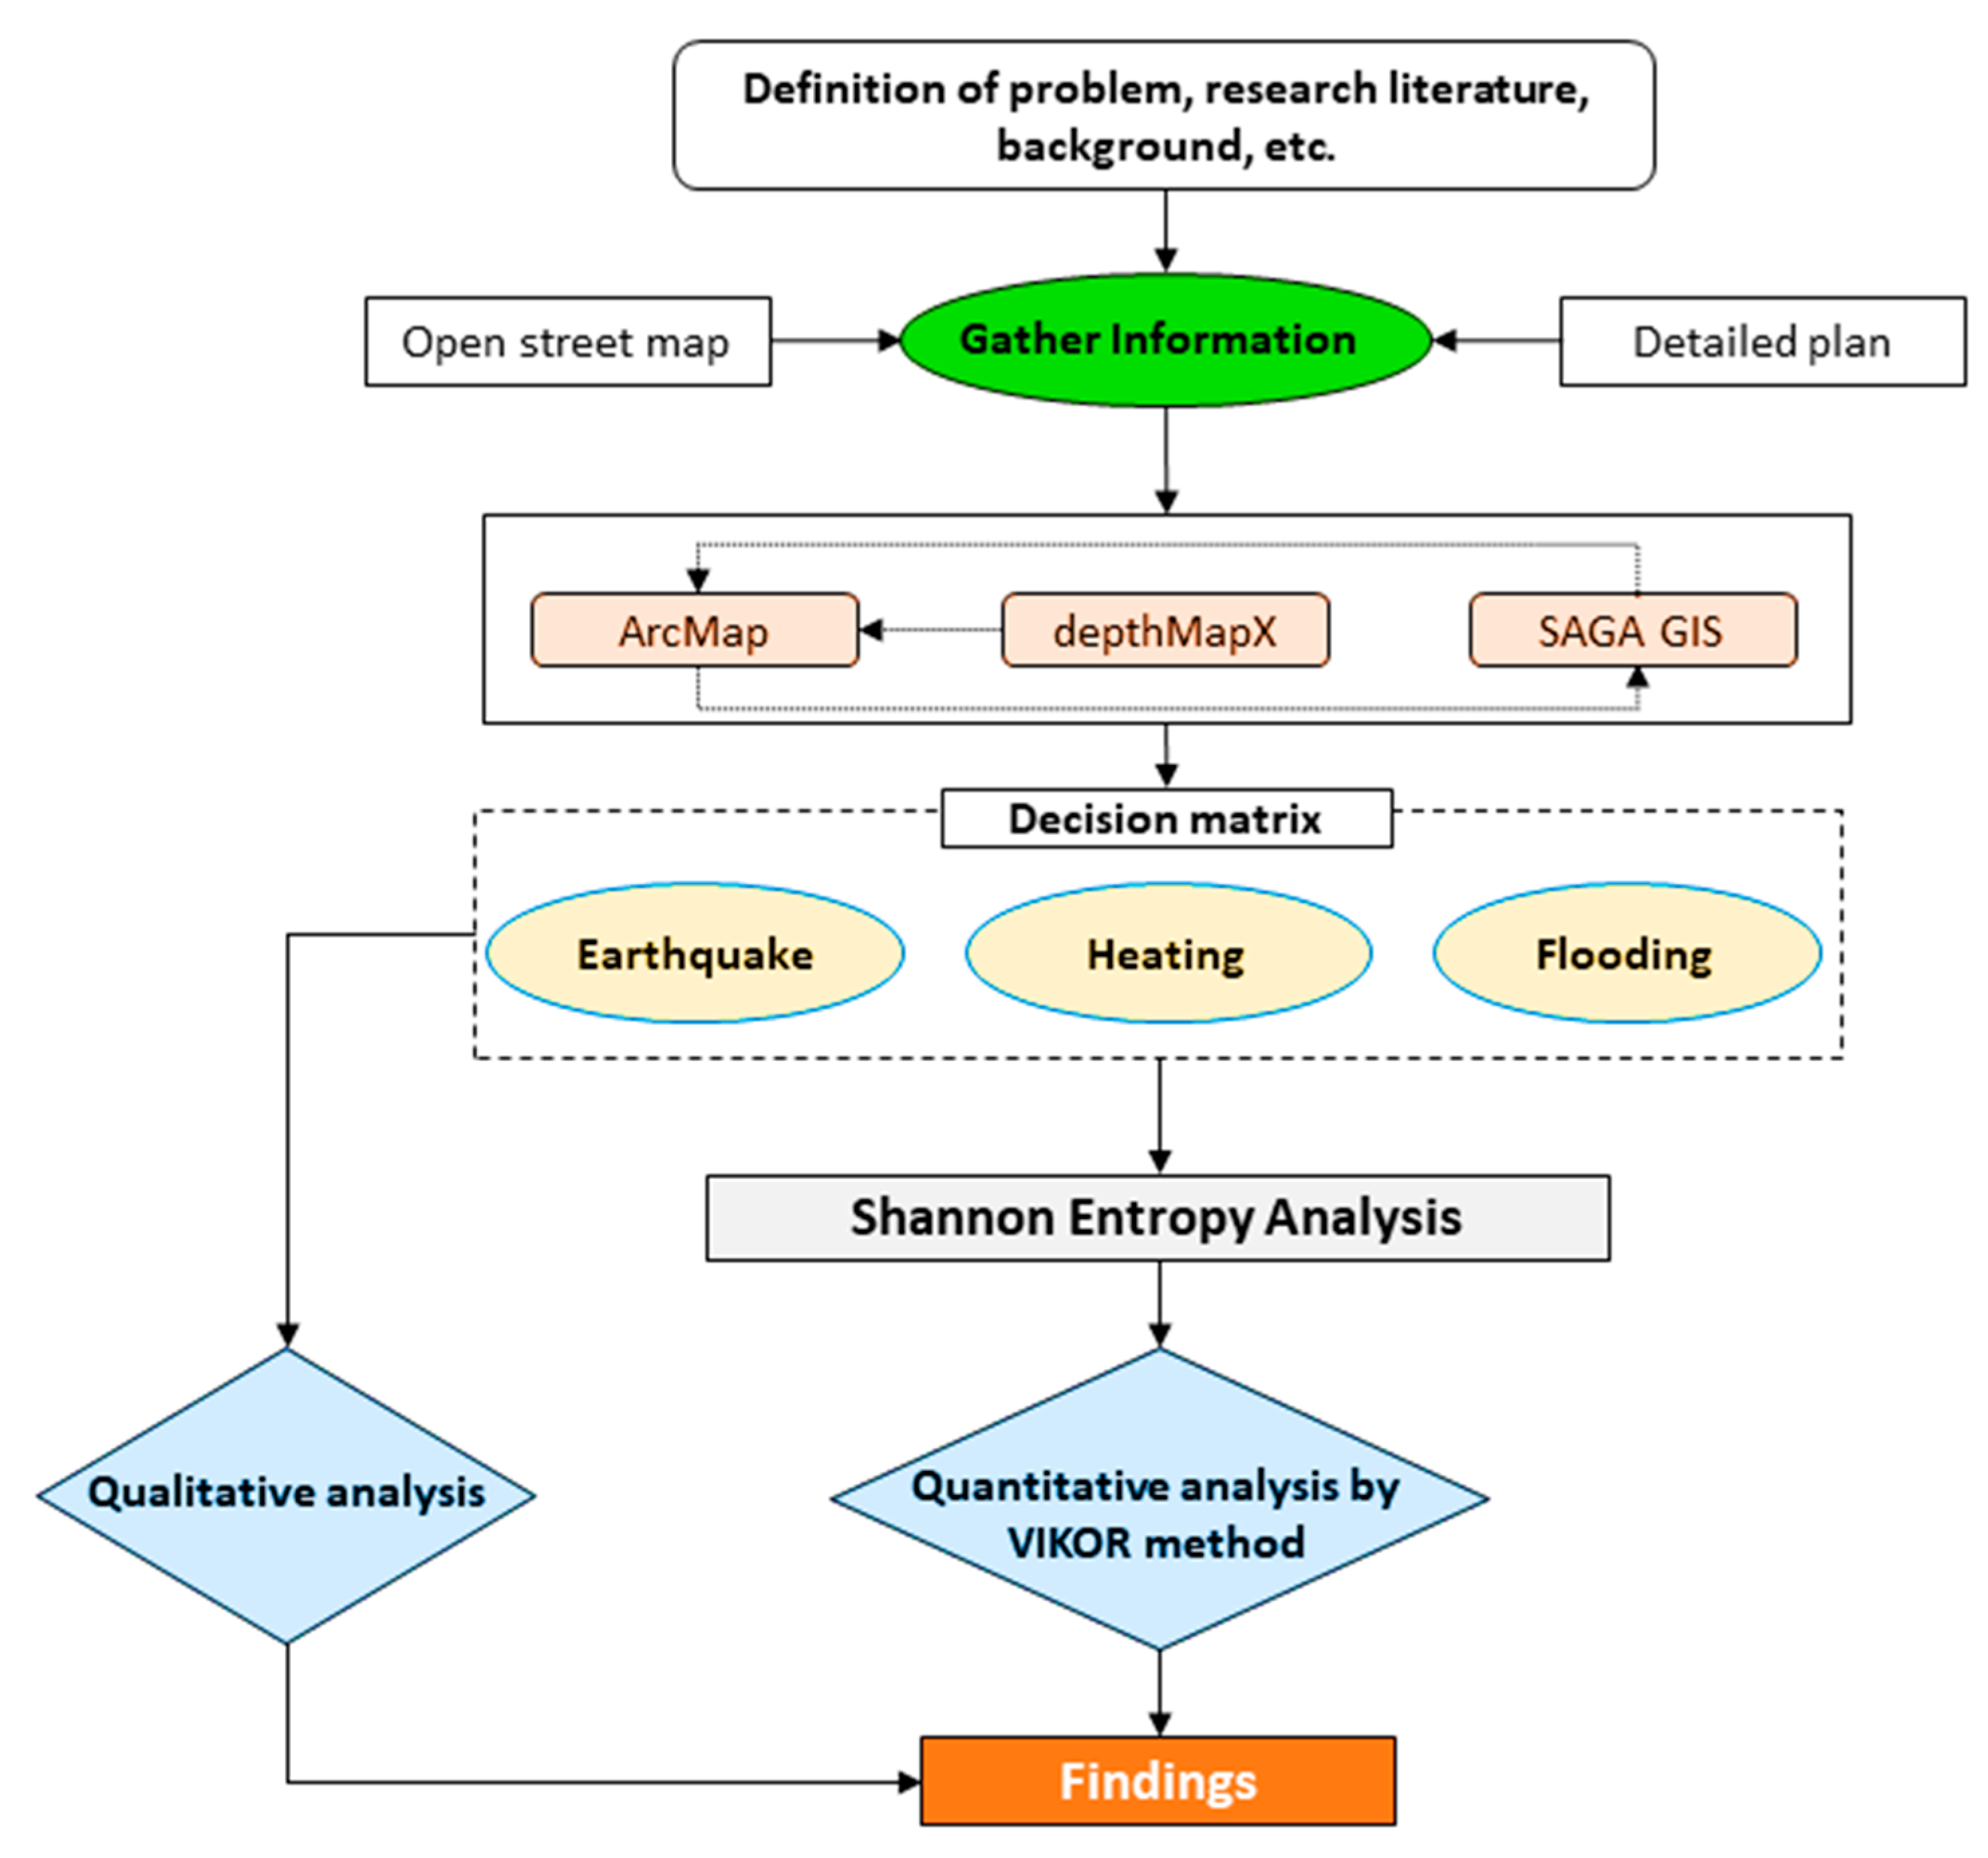
3. Materials and Methods
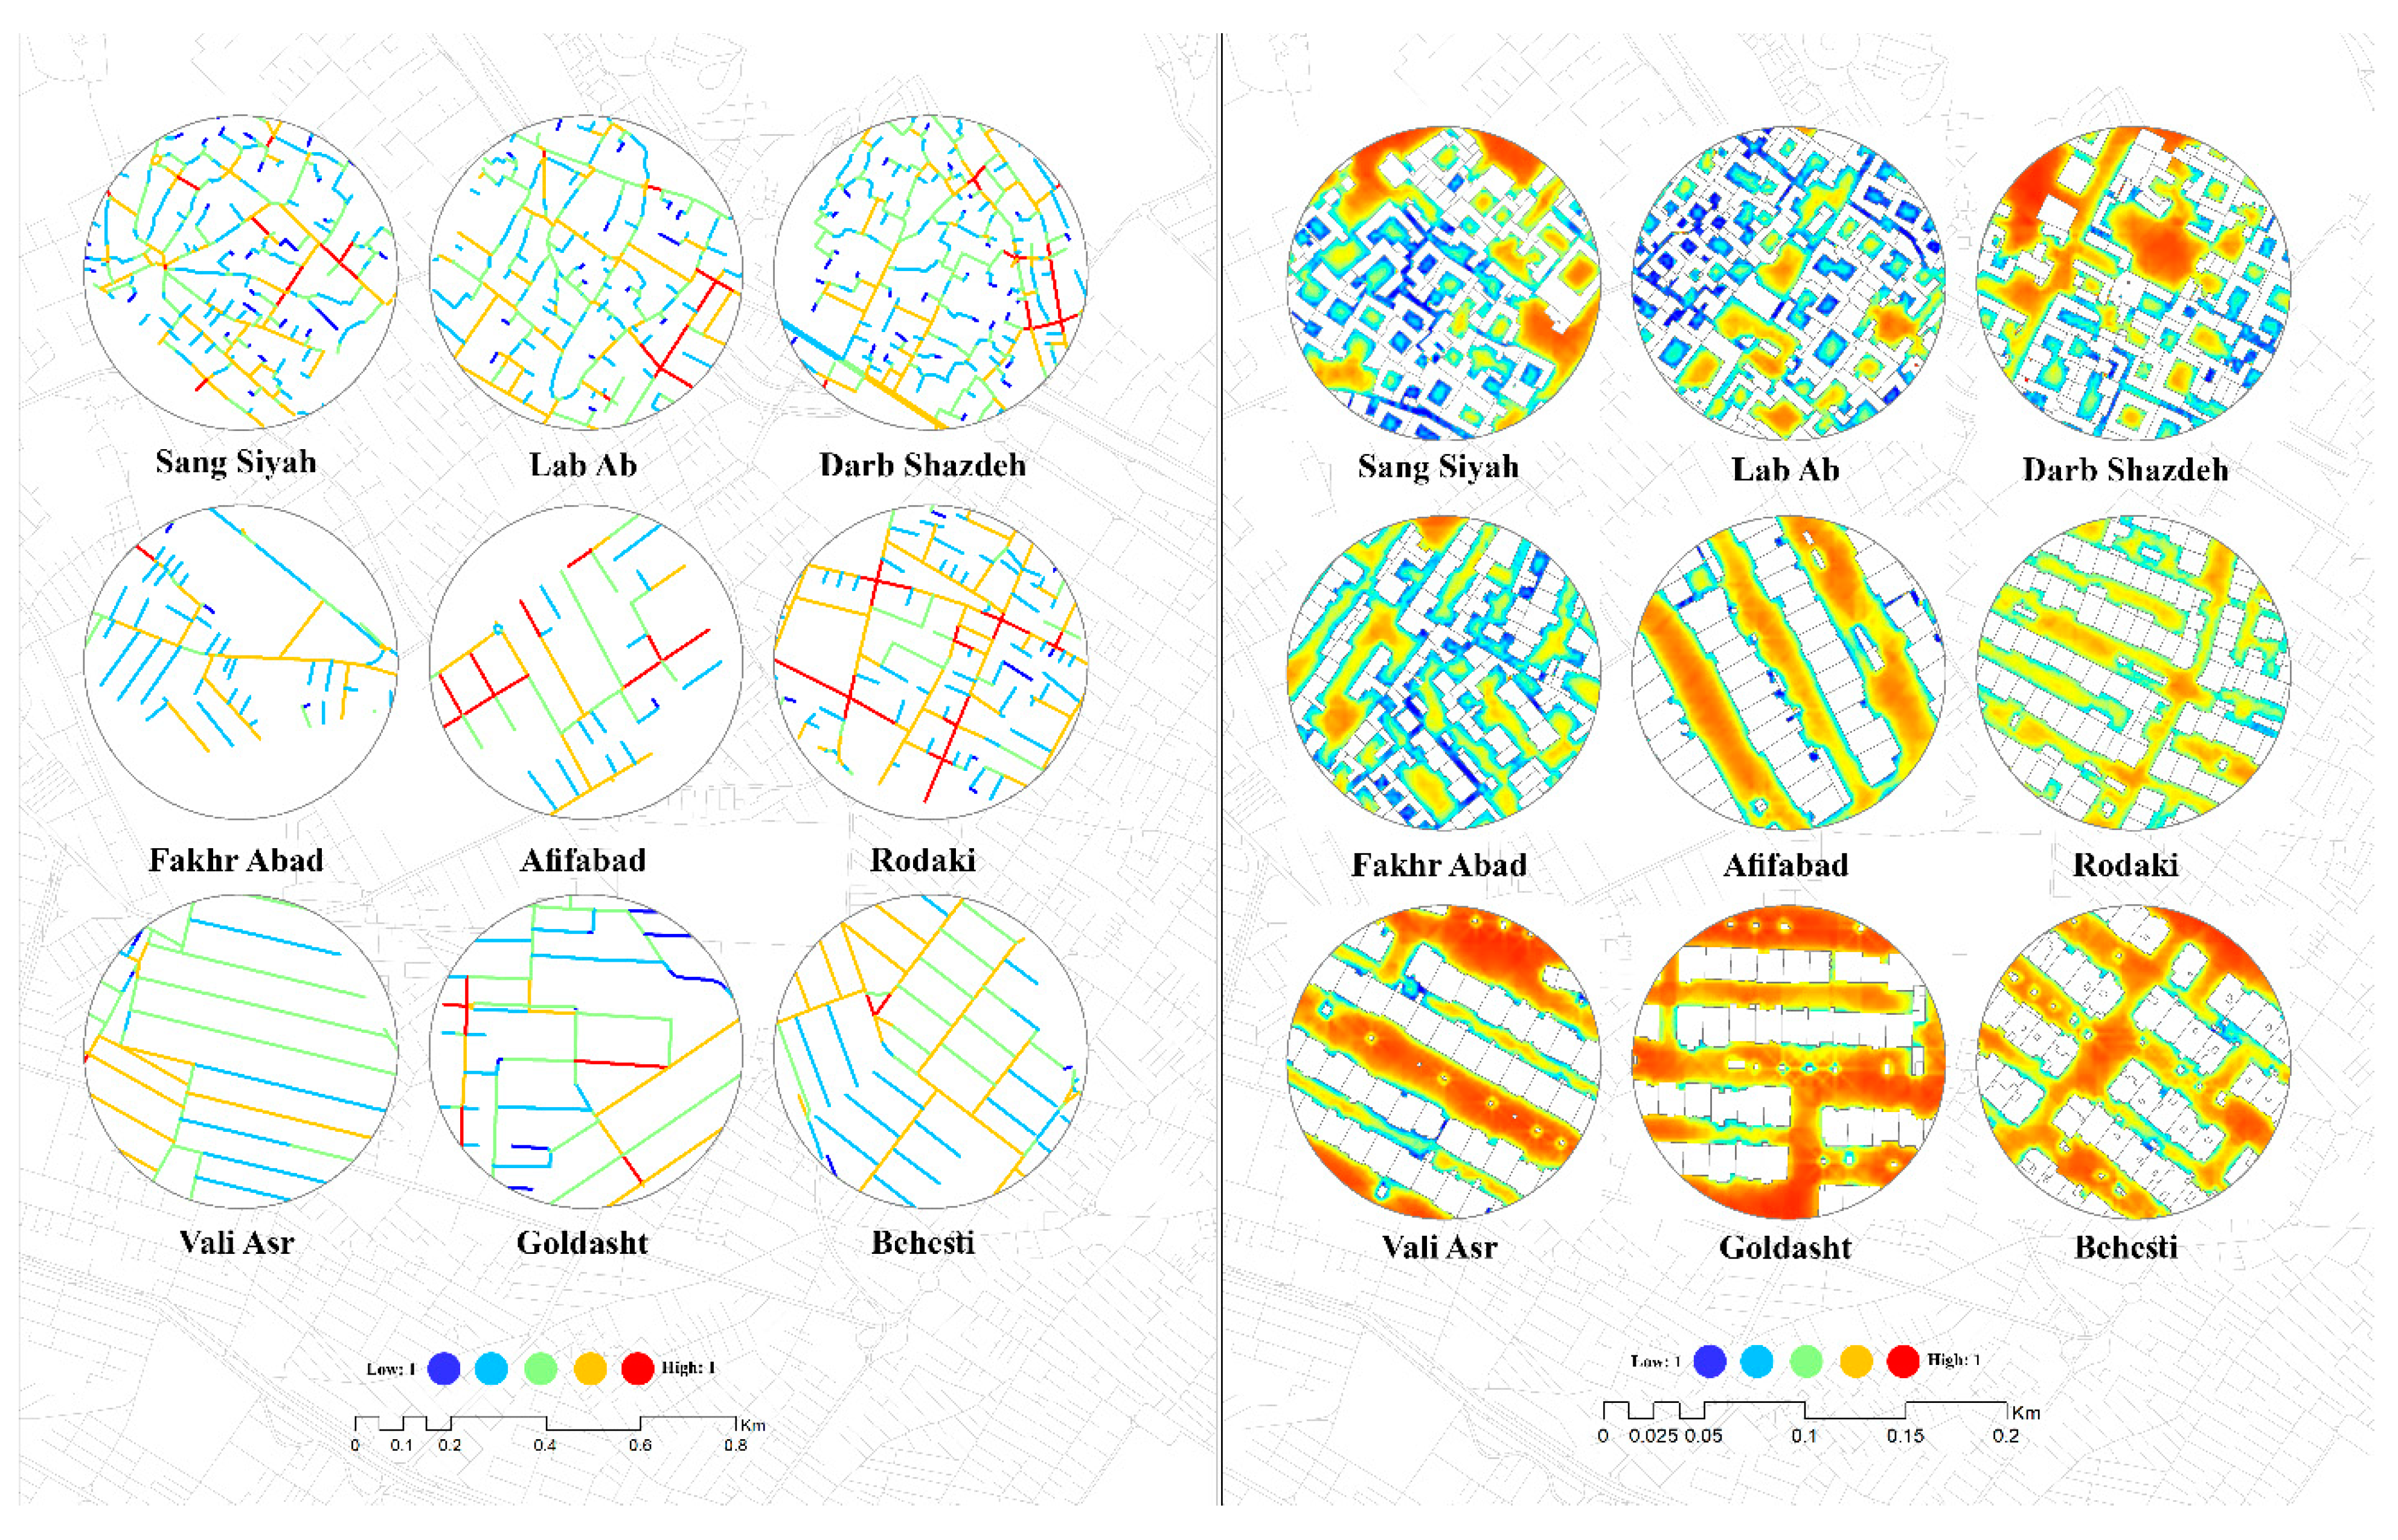
3.1. Urban Form Indicators and Their Association with Resilience
3.2. Data Collection and Modeling
- Establish the decision matrix on the basis of resilience indicators;
- Identify the relative weights of the indicators and developing a normalized weight matrix using the Shannon entropy method;
- Determine the best and worst values for all the criteria as follows: , where is the value of the i-th criterion for the alternative j;
- Compute the values of maximum utility (Sj) and minimum regret (Rj) using the following formulae:where wi represents the indicator weights calculated using the Shannon entropy method;
- Lastly, compute the values of VIKOR index (Qj, j = 1, 2, …, j) using the following formula:where and is introduced as the weight of the strategy of “the majority of criteria” (or “the maximum group utility”); here, .
4. Results
5. Discussions
5.1. Performance against Seismic Risks
5.2. Performance against Heat Risks
5.3. Performance against Flood Risks
6. Conclusions
Author Contributions
Funding
Data Availability Statement
Conflicts of Interest
References
- Sharifi, A.; Yamagata, Y. Resilience-Oriented Urban Planning. In Resilience-Oriented Urban Planning: Theoretical and Empirical Insights; Yamagata, Y., Sharifi, A., Eds.; Springer International Publishing: Cham, Switzerland, 2018; pp. 3–27. [Google Scholar] [CrossRef]
- TNA. Disaster Resilience: A National Imperative; National Academies Press: Cambridge, MA, USA, 2012. [Google Scholar]
- Klein, R.; Huq, S.; Denton, F.; Downing, T.; Richels, R.; Robinson, J.; Toth, F.; Parry, M.L.; Canziani, O.F.; Palutikof, J.P.; et al. Interrelationships between Adaptation and Mitigation. Climate Change 2007: Impacts, Adaptation and Vulnerability. Contribution of Working Group II to the Fourth Assessment Report of the Intergovernmental Panel on Climate Change; Cambridge University Press: Cambridge, UK, 2007; pp. 745–777. [Google Scholar]
- CRED, U. The Human Cost of Weather-Related Disasters, 1995–2015; United Nations: Geneva, Switzerland, 2015. [Google Scholar]
- Cho, M.-R. Urban resilience through progressive governance: The case of the ‘One Less Nuclear Power Plant’ policy, Seoul, Korea. Urban Stud. 2020, 57, 1434–1451. [Google Scholar] [CrossRef]
- Serre, D.; Heinzlef, C. Assessing and mapping urban resilience to floods with respect to cascading effects through critical infrastructure networks. Int. J. Disaster Risk Reduct. 2018, 30, 235–243. [Google Scholar] [CrossRef]
- Kim, D.; Lim, U. Urban Resilience in Climate Change Adaptation: A Conceptual Framework. Sustainability 2016, 8, 405. [Google Scholar] [CrossRef] [Green Version]
- Sharifi, A.; Yamagata, Y. Principles and criteria for assessing urban energy resilience: A literature review. Renew. Sustain. Energy Rev. 2016, 60, 1654–1677. [Google Scholar] [CrossRef] [Green Version]
- Ziervogel, G.; Pelling, M.; Cartwright, A.; Chu, E.; Deshpande, T.; Harris, L.; Hyams, K.; Kaunda, J.; Klaus, B.; Michael, K.; et al. Inserting rights and justice into urban resilience: A focus on everyday risk. Environ. Urban. 2017, 29, 123–138. [Google Scholar] [CrossRef] [Green Version]
- Benito del Pozo, P.; López-González, A. Urban resilience and the alternative economy: A methodological approach applied to northern spain. Geogr. Rev. 2019, 110, 1–19. [Google Scholar] [CrossRef]
- Alizadeh, H.; Sharifi, A. Assessing Resilience of Urban Critical Infrastructure Networks: A Case Study of Ahvaz, Iran. Sustainability 2020, 12, 3691. [Google Scholar] [CrossRef]
- Bush, J.; Doyon, A. Building urban resilience with nature-based solutions: How can urban planning contribute? Cities 2019, 95, 102483. [Google Scholar] [CrossRef]
- Oliveira, V.T. Teaching Urban Morphology. In The Urban Book Series, 1st ed.; Springer International Publishing: Cham, Switzerland, 2018; p. 1. [Google Scholar] [CrossRef]
- Sharifi, A. Resilient urban forms: A macro-scale analysis. Cities 2019, 85, 1–14. [Google Scholar] [CrossRef]
- León, J.; Castro, S.; Mokrani, C.; Gubler, A. Tsunami evacuation analysis in the urban built environment: A multi-scale perspective through two modeling approaches in Viña del Mar, Chile. Coast. Eng. J. 2020, 62, 1–16. [Google Scholar] [CrossRef]
- Hachem-Vermette, C.; Singh, K. Mixed-use neighborhoods layout patterns: Impact on solar access and resilience. Sustain. Cities Soc. 2019, 51, 101771. [Google Scholar] [CrossRef]
- Xu, L.; Cui, S.; Tang, J.; Nguyen, M.; Liu, J.; Zhao, Y. Assessing the adaptive capacity of urban form to climate stress: A case study on an urban heat island. Env. Res. Lett. 2019, 14, 044013. [Google Scholar] [CrossRef]
- Arian, M.; Noroozpour, H. Seismic Activity and Fractal Geometry of Kareh Bas Fault System in Zagros, South of Iran. Open J. Geol. 2015, 05, 9. [Google Scholar] [CrossRef] [Green Version]
- Sabet Sarvestani, M.; Ibrahim, A.L.; Kanaroglou, P. Three decades of urban growth in the city of Shiraz, Iran: A remote sensing and geographic information systems application. Cities 2011, 28, 320–329. [Google Scholar] [CrossRef]
- Sharifi, A. Urban form resilience: A meso-scale analysis. Cities 2019, 93, 238–252. [Google Scholar] [CrossRef]
- Azhdari, A.; Soltani, A.; Alidadi, M. Urban morphology and landscape structure effect on land surface temperature: Evidence from Shiraz, a semi-arid city. Sustain. Cities Soc. 2018, 41, 853–864. [Google Scholar] [CrossRef]
- Guo, G.; Zhou, X.; Wu, Z.; Xiao, R.; Chen, Y. Characterizing the impact of urban morphology heterogeneity on land surface temperature in Guangzhou, China. Env. Model. Softw. 2016, 84, 427–439. [Google Scholar] [CrossRef]
- León, J.; March, A. An urban form response to disaster vulnerability: Improving tsunami evacuation in Iquique, Chile. Environ. Plan. B Plan. Des. 2016, 43, 826–847. [Google Scholar] [CrossRef]
- Ali, J.M.; Marsh, S.H.; Smith, M.J. A comparison between London and Baghdad surface urban heat islands and possible engineering mitigation solutions. Sustain. Cities Soc. 2017, 29, 159–168. [Google Scholar] [CrossRef] [Green Version]
- Lemonsu, A.; Viguié, V.; Daniel, M.; Masson, V. Vulnerability to heat waves: Impact of urban expansion scenarios on urban heat island and heat stress in Paris (France). Urban Clim. 2015, 14, 586–605. [Google Scholar] [CrossRef]
- Yin, C.; Yuan, M.; Lu, Y.; Huang, Y.; Liu, Y. Effects of urban form on the urban heat island effect based on spatial regression model. Sci. Total Environ. 2018, 634, 696–704. [Google Scholar] [CrossRef] [PubMed]
- Fahed, J.; Kinab, E.; Ginestet, S.; Adolphe, L. Impact of urban heat island mitigation measures on microclimate and pedestrian comfort in a dense urban district of Lebanon. Sustain. Cities Soc. 2020, 61, 102375. [Google Scholar] [CrossRef]
- Elmer, F.; Hoymann, J.; Düthmann, D.; Vorogushyn, S.; Kreibich, H. Drivers of flood risk change in residential areas. Nat. Hazards Earth Syst. Sci. 2012, 12, 1641–1657. [Google Scholar] [CrossRef] [Green Version]
- Mei, C.; Liu, J.; Wang, H.; Yang, Z.; Ding, X.; Shao, W. Integrated assessments of green infrastructure for flood mitigation to support robust decision-making for sponge city construction in an urbanized watershed. Sci. Total Environ. 2018, 639, 1394–1407. [Google Scholar] [CrossRef]
- Mavoa, S.; Eagleson, S.; Badland, H.M.; Gunn, L.; Boulange, C.; Stewart, J.; Giles-Corti, B. Identifying appropriate land-use mix measures for use in a national walkability index. J. Transp. Land Use 2018, 11. [Google Scholar] [CrossRef]
- D’Acci, L. The Mathematics of Urban Morphology; Springer: Berlin/Heidelberg, Germany, 2019. [Google Scholar]
- Özbil, A.; Yeşiltepe, D.; Argın, G. Home and school environmental correlates of childhood BMI. J. Transp. Health 2020, 16, 100823. [Google Scholar] [CrossRef]
- Ostwald, M.J. The Mathematics of Spatial Configuration: Revisiting, Revising and Critiquing Justified Plan Graph Theory. Nexus Netw. J. 2011, 13, 445–470. [Google Scholar] [CrossRef] [Green Version]
- Bruwier, M.; Mustafa, A.; Aliaga, D.G.; Archambeau, P.; Erpicum, S.; Nishida, G.; Zhang, X.; Pirotton, M.; Teller, J.; Dewals, B. Influence of urban pattern on inundation flow in floodplains of lowland rivers. Sci. Total Environ. 2018, 622, 446–458. [Google Scholar] [CrossRef] [Green Version]
- ISCPA. Set of Rules, Regulations and Approvals of ISCPA (Iran’s Supreme Council for Planning and Architecture); Universty of Tehran Press: Tehran, Iran, 2016. (In Farsi) [Google Scholar]
- Feliciotti, A.; Romice, O.; Porta, S. Design for change: Five proxies for resilience in the urban form. Open House Int. 2016, 41, 23–30. [Google Scholar] [CrossRef]
- Aguilar, J.R. Resilient Cities: An Analysis of Resilient Urban Form. Unpublished Master’s Thesis, Georgia Institute of Technology, Atlanta, GA, USA, 2014. [Google Scholar]
- Allan, P.; Bryant, M.; Wirsching, C.; Garcia, D.; Teresa Rodriguez, M. The Influence of Urban Morphology on the Resilience of Cities Following an Earthquake. J. Urban Des. 2013, 18, 242–262. [Google Scholar] [CrossRef]
- Koren, D.; Rus, K. The Potential of Open Space for Enhancing Urban Seismic Resilience: A literature Review. Sustainability 2019, 11, 5942. [Google Scholar] [CrossRef] [Green Version]
- Chen, Y.-J.; Matsuoka, R.H.; Liang, T.-M. Urban form, building characteristics, and residential electricity consumption: A case study in Tainan City. Environ. Plan B Urban Anal. City Sci. 2018, 45, 933–952. [Google Scholar] [CrossRef]
- Van Long, N.; Cheng, Y.; Le, T.D.N. Flood-resilient urban design based on the indigenous landscape in the city of Can Tho, Vietnam. Urban Ecosyst. 2020, 23, 675–687. [Google Scholar] [CrossRef]
- Vaz Monteiro, M.; Doick, K.J.; Handley, P.; Peace, A. The impact of greenspace size on the extent of local nocturnal air temperature cooling in London. Urban Urban Gree 2016, 16, 160–169. [Google Scholar] [CrossRef]
- Ren, Z.; He, X.; Zheng, H.; Zhang, D.; Yu, X.; Shen, G.; Guo, R. Estimation of the Relationship between Urban Park Characteristics and Park Cool Island Intensity by Remote Sensing Data and Field Measurement. Forests 2013, 4, 868–886. [Google Scholar] [CrossRef] [Green Version]
- Sharifi, A.; Murayama, A. Changes in the traditional urban form and the social sustainability of contemporary cities: A case study of Iranian cities. Habitat Int. 2013, 38, 126–134. [Google Scholar] [CrossRef]
- Sharifi, A. Resilient urban forms: A review of literature on streets and street networks. Build Env. 2019, 147, 171–187. [Google Scholar] [CrossRef]
- Brody, S.; Kim, H.; Gunn, J. Examining the Impacts of Development Patterns on Flooding on the Gulf of Mexico Coast. Urban Stud. 2013, 50, 789–806. [Google Scholar] [CrossRef]
- Erdem, U.; Cubukcu, K.M.; Sharifi, A. An analysis of urban form factors driving Urban Heat Island: The case of Izmir. Env. Dev. Sustain. 2020. [Google Scholar] [CrossRef]
- Teklenburg, J.A.F.; Timmermans, H.J.P.; van Wagenberg, A.F. Space Syntax: Standardised Integration Measures and Some Simulations. Environ. Plan. B Plan. Des. 1993, 20, 347–357. [Google Scholar] [CrossRef] [Green Version]
- Opricovic, S.; Tzeng, G.-H. Compromise solution by MCDM methods: A comparative analysis of VIKOR and TOPSIS. Eur. J. Oper. Res. 2004, 156, 445–455. [Google Scholar] [CrossRef]
- Opricovic, S.; Tzeng, G.-H. Extended VIKOR method in comparison with outranking methods. Eur. J. Oper. Res. 2007, 178, 514–529. [Google Scholar] [CrossRef]
- Cutter, S.L. Resilience to What? Resilience for Whom? Geogr. J. 2016, 182, 110–113. [Google Scholar] [CrossRef]
- Feng, K.; Wang, N.; Li, Q.; Lin, P. Measuring and enhancing resilience of building portfolios considering the functional interdependence among community sectors. Struct. Saf. 2017, 66, 118–126. [Google Scholar] [CrossRef]


| Type | Neighborhood Name | Neighborhood Size (ha) | Population | Population Density (Person/ha) | Population Male | Population Female | Household |
|---|---|---|---|---|---|---|---|
| I1 | Sang Siyah | 33 | 3763 | 114 | 1969 | 1788 | 1233 |
| I2 | Lab Ab | 37.7 | 5466 | 145 | 2856 | 2609 | 1740 |
| I3 | Darb Shazdeh | 50.83 | 6541 | 129 | 3375 | 3150 | 1638 |
| In4 | Fakhr Abad | 29.6 | 1951 | 66 | 933 | 1017 | 680 |
| In5 | Afifabad | 30.46 | 3326 | 109 | 1584 | 1741 | 1169 |
| In6 | Rodaki | 48.68 | 5704 | 117 | 2712 | 2990 | 1882 |
| O7 | Vali Asr | 69.21 | 7872 | 114 | 3909 | 3958 | 2518 |
| O8 | Goldasht | 44.08 | 4069 | 92 | 1974 | 2091 | 1333 |
| O9 | Beheshti | 51.16 | 4781 | 93 | 2328 | 2452 | 1538 |
| Indicator | Earthquake | Extreme Heat | Flooding | Description |
|---|---|---|---|---|
| Density | − | − | − | Gross population density (population/area (H)) |
| Lot size | + | − | − | Area |
| Lot shape | − | − | − | Perimeter/area ratio (regular or simple is better than complex) |
| Block size | + | − | − | Area |
| Block shape | − | − | − | Perimeter/area ratio |
| Size of open space | + | + | + | Area |
| Shape of open space | NA | − | NA | Perimeter/area ratio |
| Access to open space | + | + | + | Average network distance of households to open space |
| Fraction of green space | + | + | + | Total area of green space/total area |
| Fraction of paved space | NA | − | − | Total area of paved space/total area |
| Land-use mix | + | + | + | where LUM is the land-use mix score, pi is the proportion of land use i, and n is the number of land-use categories [30] |
| Building structure | + | NA | NA | The total area of reinforced buildings divided by the total area of buildings |
| Street connectivity | + | + | + | Connectivity refers to the number of the lines directly connected with a given line. where K is the number of the lines without intermediaries [31] |
| Street integration (R3[i]) | + | + | + | where refers to the shortest path between line i and line k [31] |
| Betweenness centrality | − | − | − | Betweenness value for a segment x in a graph of n segments can be defined as follows: such that , where σ (i, x, j) = 1 if the shortest path from i to j passes through x, and 0 otherwise [32] |
| Street depth (R3) | − | NA | − | Mean depth (MD) is calculated by dividing the total depth (TD) by the number of turns from one axial line to another line minus one (that is, without itself) where TD is the sum of the number of connections between a particular node and every other node in the set [33] |
| Street width | + | + | + | Average street width |
| Sky view factor | + | − | NA | The sky view factor (SVF) is calculated using the aspect ratio considering all the streets of the urban block as street canyons |
| Sang Siyah | Lab Ab | Darb Shazdeh | Fakhr Abad | Afifabad | Rodaki | Vali Asr | Goldasht | Beheshti | |
|---|---|---|---|---|---|---|---|---|---|
| Density (people per hectare) | 104 | 145 | 108 | 66 | 109 | 117 | 114 | 92 | 93 |
| Lot size (sq. m) | 198.0 | 207.1 | 225.2 | 344.3 | 408.9 | 326.3 | 356.1 | 489.2 | 381.6 |
| Lot shape (ratio) | 0.375 | 0.383 | 0.420 | 0.344 | 0.251 | 0.319 | 0.237 | 0.220 | 0.284 |
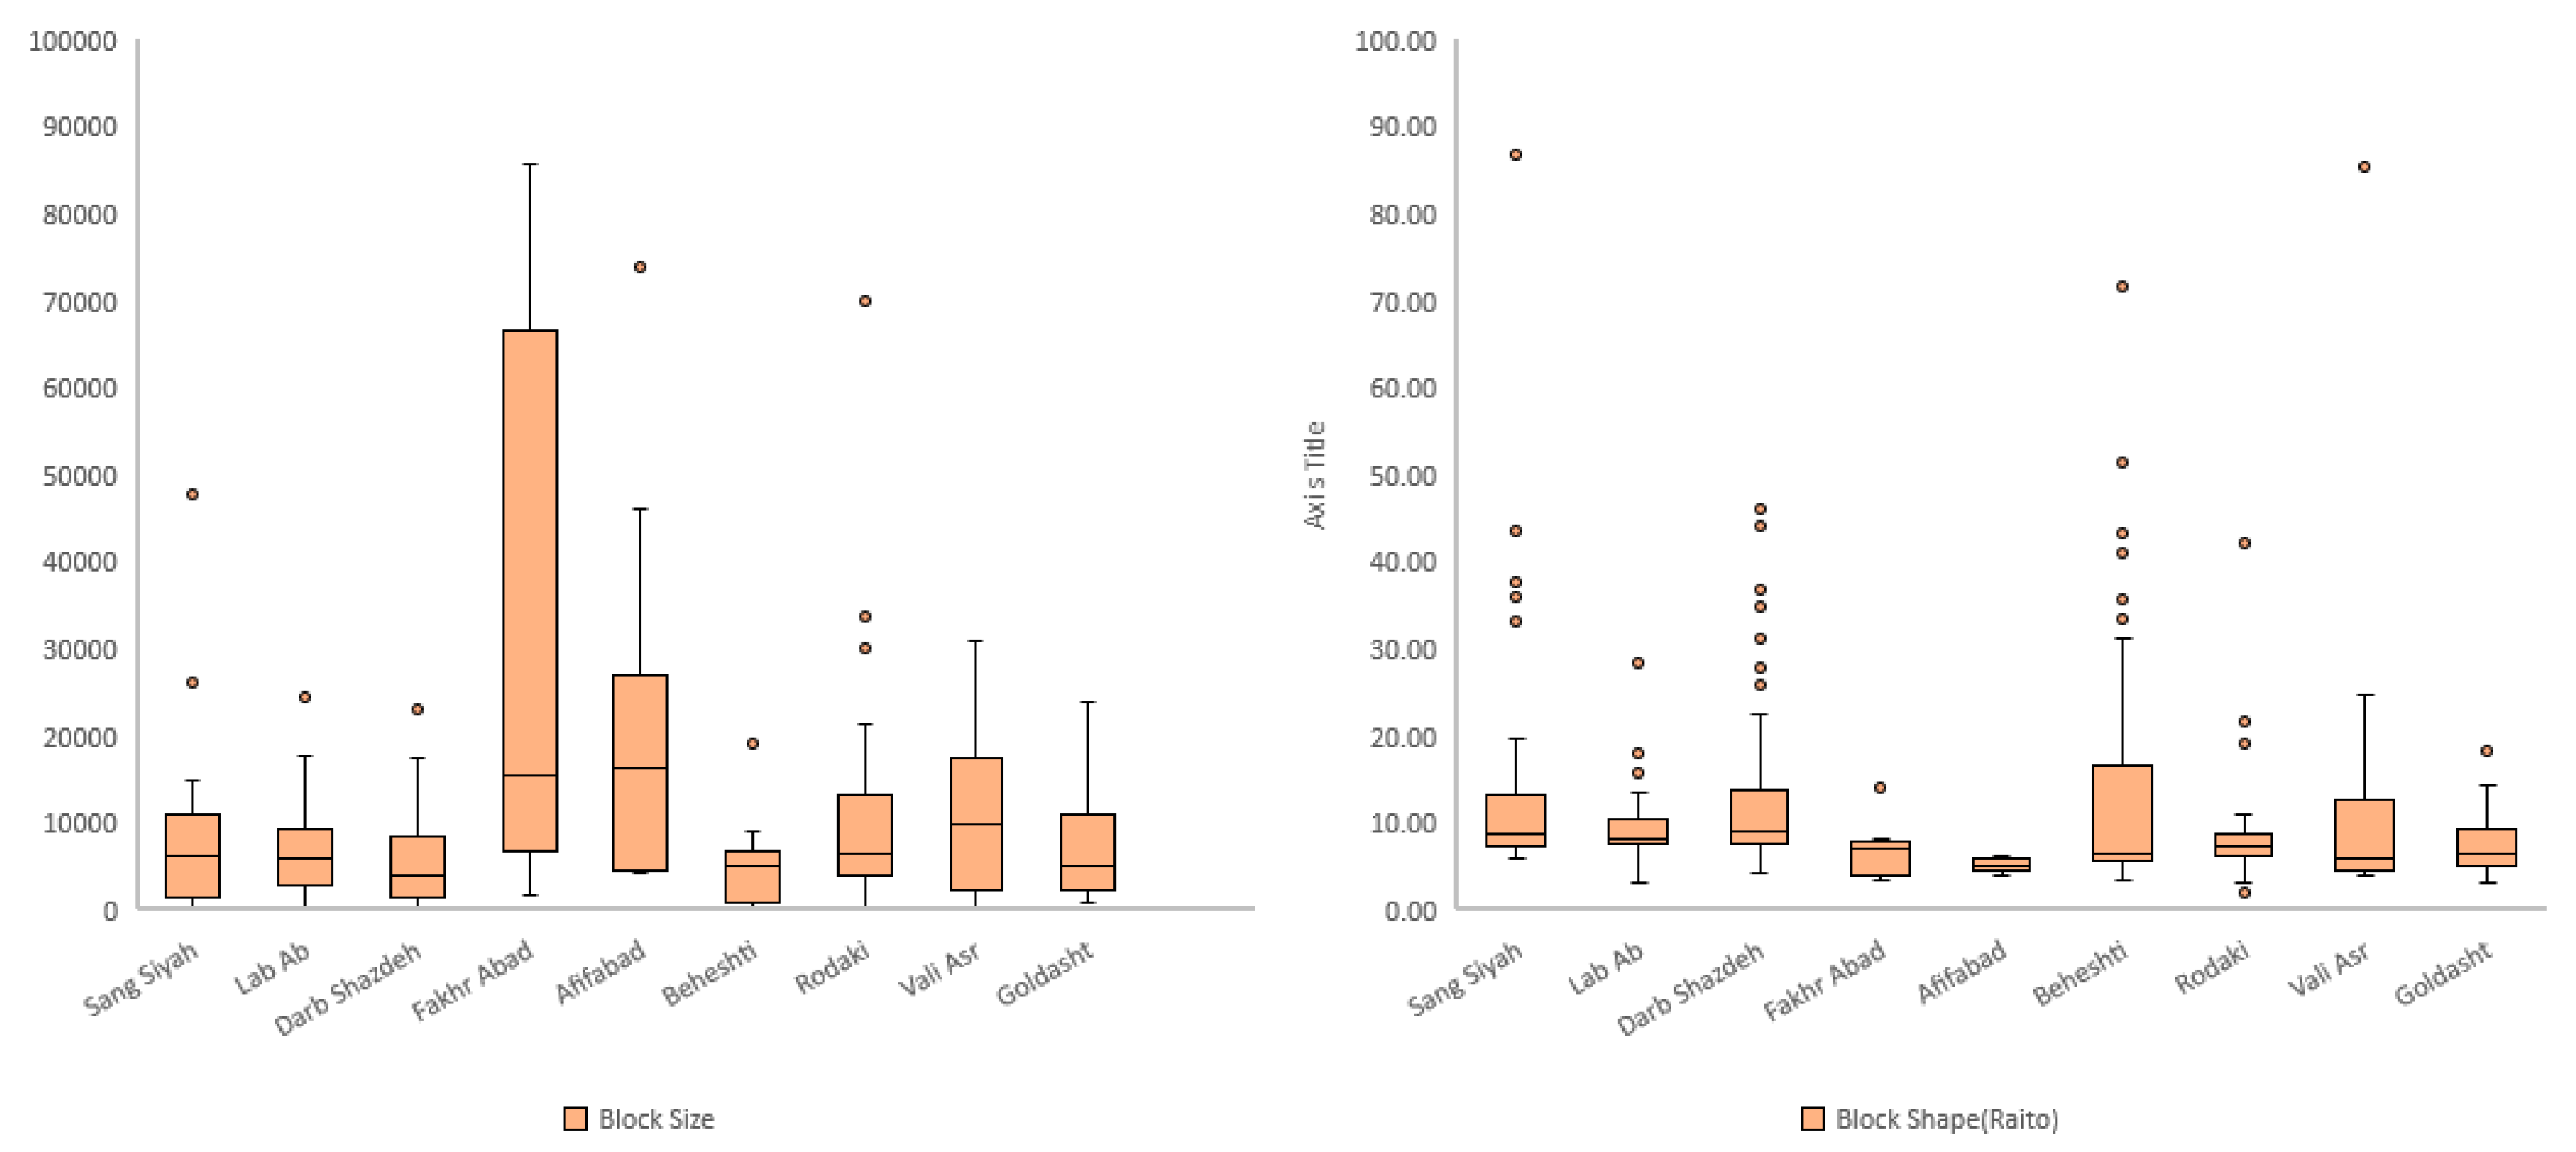
| Block size (sq. m) | 7587 | 7102 | 5949 | 30,102 | 21,747 | 10,729 | 10,782 | 7361 | 4367 |
| Block shape (ratio) | 7.636 | 7.470 | 8.012 | 4.404 | 4.892 | 5.895 | 5.256 | 5.316 | 6.573 |
| Size of open space (sq. m) | 312 | 270 | 309 | 330 | 449 | 296 | 555 | 1651 | 484 |
| Shape of open space (ratio) | 0.336 | 0.343 | 0.337 | 0.284 | 0.204 | 0.268 | 0.258 | 0.191 | 0.538 |
| Access to open space (m) | 64 | 76 | 51 | 103 | 223 | 118 | 103 | 161 | 46 |
| Fraction of green space (%) | 1.644 | 0.350 | 0.555 | 19.433 | 8.165 | 0.174 | 0.165 | 6.120 | 6.386 |
| Fraction of paved space (%) | 12.3 | 13.4 | 18.6 | 11.7 | 13.9 | 20.7 | 22.8 | 22.9 | 22.3 |
| Land-use mix (ratio) | 0.361 | 0.458 | 0.525 | 0.645 | 0.297 | 0.628 | 0.209 | 0.318 | 0.239 |
| Resilient building structure (%) | 9.797 | 18.639 | 11.863 | 26.462 | 96.308 | 66.737 | 93.818 | 92.883 | 98.700 |
| Street connectivity (No.) | 2.751 | 2.801 | 2.794 | 2.993 | 3.181 | 3.203 | 3.775 | 3.568 | 3.146 |
| Street integration (ratio) | 1.198 | 1.223 | 1.213 | 1.299 | 1.368 | 1.382 | 1.614 | 1.523 | 1.370 |
| Betweenness centrality | 52,637 | 65,100 | 70,700 | 18,636 | 16,573 | 40,630 | 76,685 | 19,862 | 29,631 |
| Street depth (ratio) | 2.171 | 2.180 | 2.186 | 2.206 | 2.201 | 2.244 | 2.312 | 2.280 | 2.246 |
| Street width (m) | 8.60 | 8.15 | 8.94 | 15.00 | 10.82 | 10.61 | 15.05 | 12.40 | 11.30 |
| Sky view factor (ratio) | 0.674 | 0.716 | 0.706 | 0.811 | 0.755 | 0.733 | 0.848 | 0.856 | 0.822 |
| Indicator | Earthquake | Heat | Flooding |
|---|---|---|---|
| Density | 0.005 | 0.004 | 0.006 |
| Lot size | 0.065 | 0.055 | 0.070 |
| Lot shape | 0.255 | 0.217 | 0.273 |
| Block size | 0.070 | 0.059 | 0.074 |
| Block shape | 0.006 | 0.005 | 0.006 |
| Size of open space | 0.201 | 0.171 | 0.215 |
| Shape of open space | - | 0.203 | - |
| Access to open space | 0.034 | 0.029 | 0.037 |
| Fraction of green space | 0.197 | 0.168 | 0.210 |
| Fraction of paved space | - | 0.008 | 0.010 |
| Land-use mix | 0.020 | 0.017 | 0.021 |
| Resilient building structure | 0.070 | - | - |
| Street connectivity | 0.002 | 0.002 | 0.002 |
| Street integration | 0.002 | 0.002 | 0.002 |
| Betweenness centrality | 0.048 | 0.041 | 0.051 |
| Street width | 0.018 | 0.015 | 0.019 |
| Street depth | 0.004 | - | 0.004 |
| Sky view factor | 0.004 | 0.004 | - |
| Stressor | Earthquake | Heat | Flooding | ||||||||||
|---|---|---|---|---|---|---|---|---|---|---|---|---|---|
| Neighborhoods | Si | Ri | Qi | R | Si | Ri | Qi | R | Si | Ri | Qi | R | |
| I1 | Sang Siyah | 0.627 | 0.182 | 0.493 | 7 | 0.44 | 0.16 | 0.45 | 4 | 0.58 | 0.19 | 0.51 | 4 |
| I2 | Lab Ab | 0.618 | 0.195 | 0.539 | 8 | 0.48 | 0.17 | 0.54 | 7 | 0.69 | 0.21 | 0.69 | 7 |
| I3 | Darb Shazdeh | 0.882 | 0.255 | 1 | 9 | 0.67 | 0.22 | 1 | 9 | 0.62 | 0.21 | 0.61 | 6 |
| In4 | Fakhr Abad | 0.368 | 0.198 | 0.355 | 2 | 0.33 | 0.17 | 0.4 | 2 | 0.6 | 0.27 | 0.84 | 9 |
| In5 | Afifabad | 0.456 | 0.201 | 0.436 | 4 | 0.36 | 0.17 | 0.45 | 3 | 0.5 | 0.21 | 0.5 | 3 |
| In6 | Rodaki | 0.540 | 0.197 | 0.485 | 6 | 0.46 | 0.17 | 0.53 | 6 | 0.74 | 0.21 | 0.76 | 8 |
| O7 | Vali Asr | 0.532 | 0.197 | 0.479 | 5 | 0.42 | 0.17 | 0.49 | 5 | 0.55 | 0.21 | 0.54 | 5 |
| O8 | Goldasht | 0.248 | 0.136 | 0 | 1 | 0.19 | 0.12 | 0 | 1 | 0.53 | 0.21 | 0.5 | 2 |
| O9 | Beheshti | 0.539 | 0.180 | 0.415 | 3 | 0.63 | 0.2 | 0.88 | 8 | 0.32 | 0.14 | 0 | 1 |
| Ranking Color Ramp | 1
 9 9
| ||||||||||||
Publisher’s Note: MDPI stays neutral with regard to jurisdictional claims in published maps and institutional affiliations. |
© 2021 by the authors. Licensee MDPI, Basel, Switzerland. This article is an open access article distributed under the terms and conditions of the Creative Commons Attribution (CC BY) license (http://creativecommons.org/licenses/by/4.0/).
Share and Cite
Sharifi, A.; Roosta, M.; Javadpoor, M. Urban Form Resilience: A Comparative Analysis of Traditional, Semi-Planned, and Planned Neighborhoods in Shiraz, Iran. Urban Sci. 2021, 5, 18. https://0-doi-org.brum.beds.ac.uk/10.3390/urbansci5010018
Sharifi A, Roosta M, Javadpoor M. Urban Form Resilience: A Comparative Analysis of Traditional, Semi-Planned, and Planned Neighborhoods in Shiraz, Iran. Urban Science. 2021; 5(1):18. https://0-doi-org.brum.beds.ac.uk/10.3390/urbansci5010018
Chicago/Turabian StyleSharifi, Ayyoob, Maryam Roosta, and Masoud Javadpoor. 2021. "Urban Form Resilience: A Comparative Analysis of Traditional, Semi-Planned, and Planned Neighborhoods in Shiraz, Iran" Urban Science 5, no. 1: 18. https://0-doi-org.brum.beds.ac.uk/10.3390/urbansci5010018